Join the Crusade…. NEXUS - Nigel Southway · Morton Metal-craft, Inter-City Products, ......
89
6/3/2015 1 CONSULTING SERVICE NEXUS “Helping Organizations Find that lever for change and improvement” Join the Crusade…. Attack Waste Capture Productivity Gain Profit Win back Jobs www.nigelsouthway.com NIGEL SOUTHWAY (1992) LEAN THINKING www.nigelsouthway.com 45 years Broad Business and Manufacturing Experience British Engineering Student Apprenticeship… ….Aerospace/Electronics (1966) Manufacturing Engineer ….BSc EEE C-Eng (1972) Aerospace Programs : Concorde and Communication Satellites and the Space Shuttle Arm MOTOROLA …. Director Manufacturing Eng. / Lean and Six Sigma Implementation (1980, s) Co - Founder of CTM Inc. and Founder of NEXUS Consulting Services (1990) AUTHOR: CYCLE TIME MANAGEMENT… Fast Track to Productivity Improvement (1992) Consult on LEAN thinking to many organizations in different industry sectors on a global basis. Automotive, Aerospace, Avionics, High-tech and consumer Electronics, Pharmaceuticals, Food, Beverage. Consumer Products and Appliances, Steel, Fabrication, Mining, Resource extraction equipment, Construction, Off-road equipment, Service Distribution and retail and support to Financial Industries, Assist many Global Sourcing programs and Joint Ventures (2004 onward) Society Manufacturing Engineers … SME Chair 2012/13 Toronto LEAN Certification advisor for SME/AME/ASQ Lecturing at Sheridan on Quality Management/LEAN/Sustainable Supply Chain Management Advocate for the Take Back Manufacturing Forum / Canadian Reshoring initiative. ….. www.sme-tbm.org
-
Upload
hoangduong -
Category
Documents
-
view
216 -
download
0
Transcript of Join the Crusade…. NEXUS - Nigel Southway · Morton Metal-craft, Inter-City Products, ......
6/3/2015
1
CONSULTING SERVICE
NEX
US
“Helping Organizations Find that lever for change and improvement”
Join the Crusade….
Attack Waste
Capture Productivity
Gain Profit
Win back Jobs
www.nigelsouthway.com
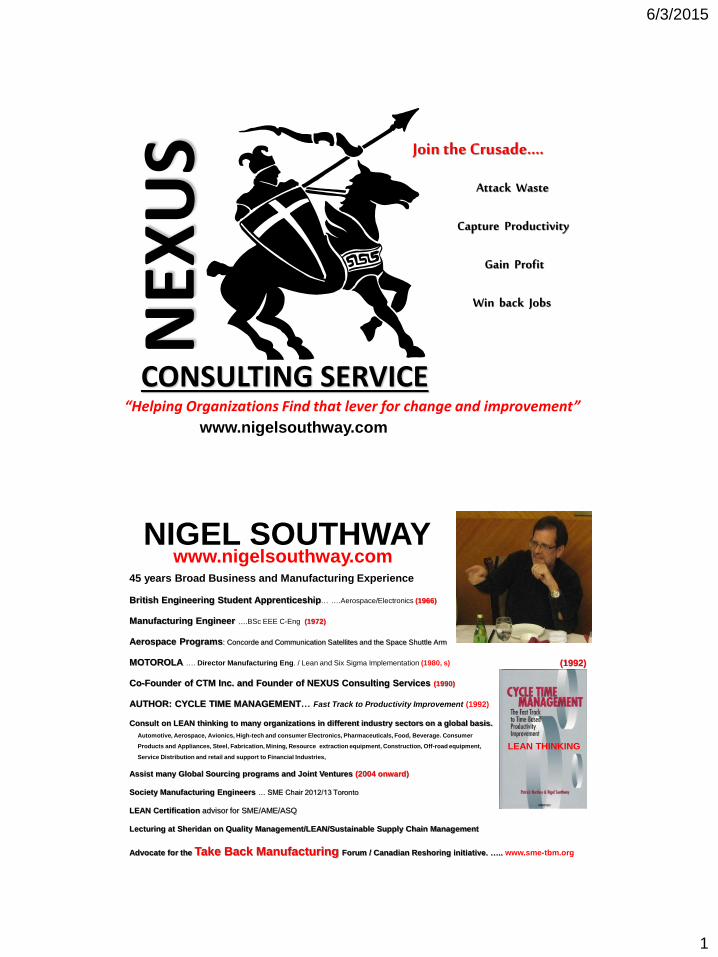
NIGEL SOUTHWAY
(1992)
LEAN THINKING
www.nigelsouthway.com45 years Broad Business and Manufacturing Experience
British Engineering Student Apprenticeship… ….Aerospace/Electronics (1966)
Manufacturing Engineer ….BSc EEE C-Eng (1972)
Aerospace Programs: Concorde and Communication Satellites and the Space Shuttle Arm
MOTOROLA …. Director Manufacturing Eng. / Lean and Six Sigma Implementation (1980, s)
Co-Founder of CTM Inc. and Founder of NEXUS Consulting Services (1990)
AUTHOR: CYCLE TIME MANAGEMENT… Fast Track to Productivity Improvement (1992)
Consult on LEAN thinking to many organizations in different industry sectors on a global basis.
Automotive, Aerospace, Avionics, High-tech and consumer Electronics, Pharmaceuticals, Food, Beverage. Consumer
Products and Appliances, Steel, Fabrication, Mining, Resource extraction equipment, Construction, Off-road equipment,
Service Distribution and retail and support to Financial Industries,
Assist many Global Sourcing programs and Joint Ventures (2004 onward)
Society Manufacturing Engineers … SME Chair 2012/13 Toronto
LEAN Certification advisor for SME/AME/ASQ
Lecturing at Sheridan on Quality Management/LEAN/Sustainable Supply Chain Management
Advocate for the Take Back Manufacturing Forum / Canadian Reshoring initiative. ….. www.sme-tbm.org
6/3/2015
2
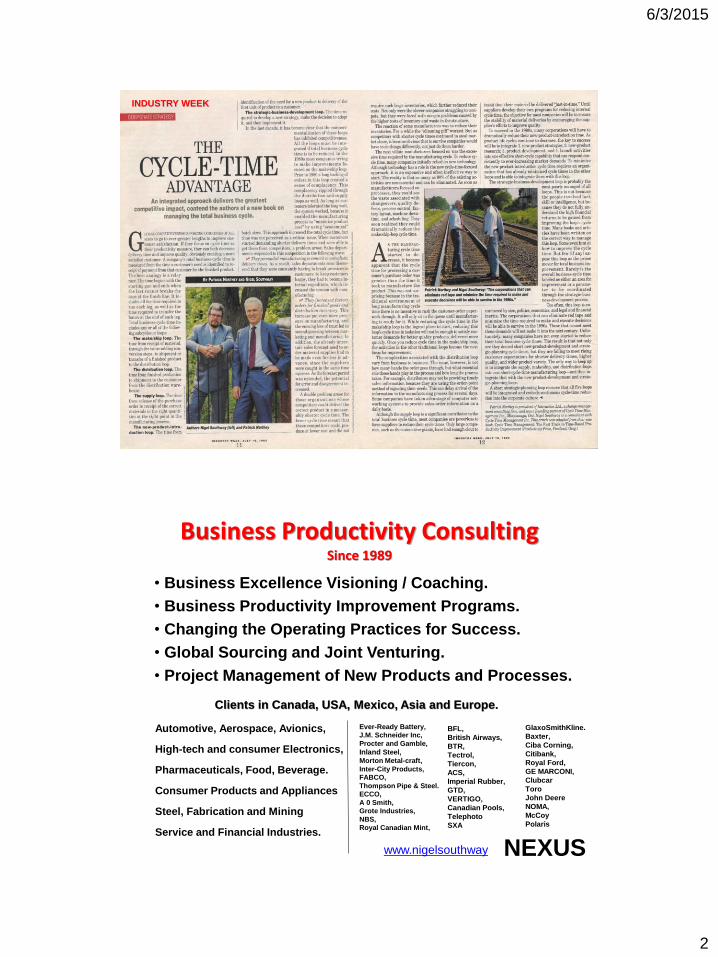
INDUSTRY WEEK
Business Productivity Consulting Since 1989
Automotive, Aerospace, Avionics,
High-tech and consumer Electronics,
Pharmaceuticals, Food, Beverage.
Consumer Products and Appliances
Steel, Fabrication and Mining
Service and Financial Industries.
Ever-Ready Battery,
J.M. Schneider Inc,
Procter and Gamble,
Inland Steel,
Morton Metal-craft,
Inter-City Products,
FABCO,
Thompson Pipe & Steel.
ECCO,
A 0 Smith,
Grote Industries,
NBS,
Royal Canadian Mint,
• Business Excellence Visioning / Coaching.
• Business Productivity Improvement Programs.
• Changing the Operating Practices for Success.
• Global Sourcing and Joint Venturing.
• Project Management of New Products and Processes.
BFL,
British Airways,
BTR,
Tectrol,
Tiercon,
ACS,
Imperial Rubber,
GTD,
VERTIGO,
Canadian Pools,
Telephoto
SXA
Clients in Canada, USA, Mexico, Asia and Europe.
www.nigelsouthway NEXUS
GlaxoSmithKline.
Baxter,
Ciba Corning,
Citibank,
Royal Ford,
GE MARCONI,
Clubcar
Toro
John Deere
NOMA,
McCoy
Polaris
6/3/2015
3
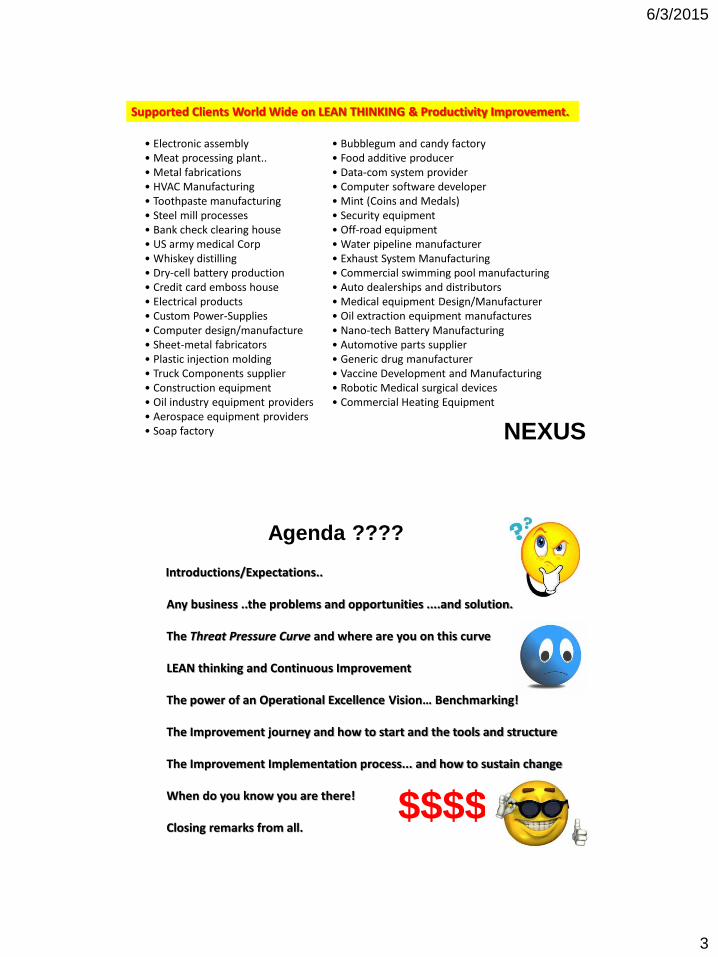
Supported Clients World Wide on LEAN THINKING & Productivity Improvement.
• Electronic assembly• Meat processing plant..• Metal fabrications• HVAC Manufacturing• Toothpaste manufacturing• Steel mill processes• Bank check clearing house• US army medical Corp• Whiskey distilling• Dry-cell battery production• Credit card emboss house• Electrical products• Custom Power-Supplies• Computer design/manufacture• Sheet-metal fabricators• Plastic injection molding• Truck Components supplier• Construction equipment• Oil industry equipment providers• Aerospace equipment providers• Soap factory
• Bubblegum and candy factory• Food additive producer• Data-com system provider• Computer software developer• Mint (Coins and Medals) • Security equipment• Off-road equipment• Water pipeline manufacturer• Exhaust System Manufacturing• Commercial swimming pool manufacturing• Auto dealerships and distributors• Medical equipment Design/Manufacturer• Oil extraction equipment manufactures• Nano-tech Battery Manufacturing• Automotive parts supplier• Generic drug manufacturer• Vaccine Development and Manufacturing• Robotic Medical surgical devices• Commercial Heating Equipment
NEXUS
Introductions/Expectations..
Any business ..the problems and opportunities ....and solution.
The Threat Pressure Curve and where are you on this curve
LEAN thinking and Continuous Improvement
The power of an Operational Excellence Vision… Benchmarking!
The Improvement journey and how to start and the tools and structure
The Improvement Implementation process... and how to sustain change
When do you know you are there!
Closing remarks from all.
Agenda ????
$$$$
6/3/2015
4
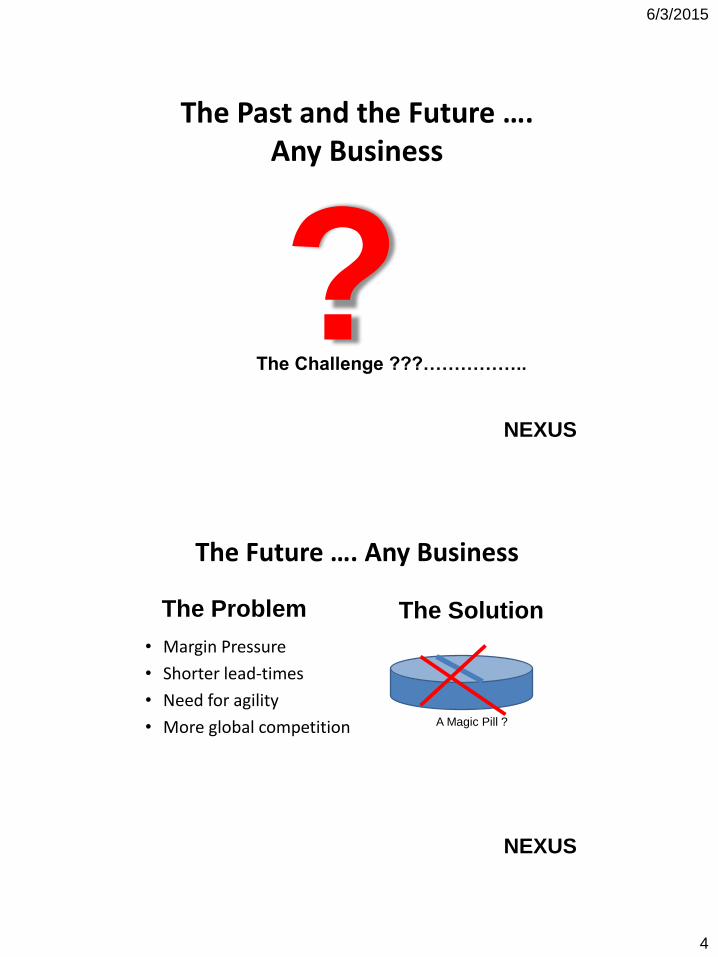
The Past and the Future …. Any Business
?NEXUS
The Challenge ???……………..
The Future …. Any Business
• Margin Pressure
• Shorter lead-times
• Need for agility
• More global competition
The Problem The Solution
A Magic Pill ?
NEXUS
6/3/2015
5
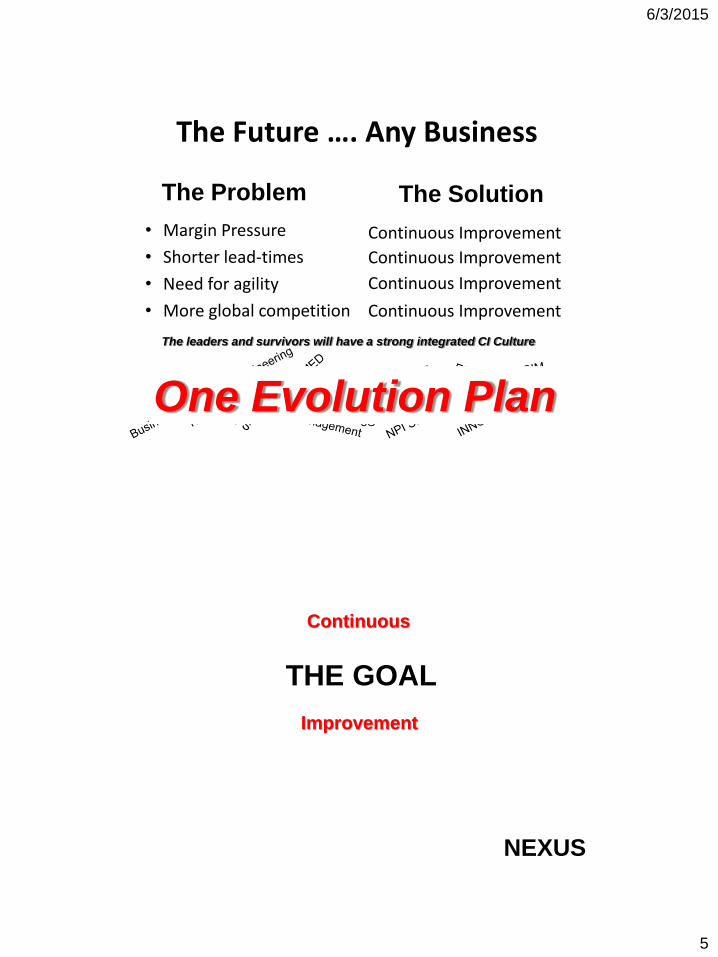
The Future …. Any Business
• Margin Pressure
• Shorter lead-times
• Need for agility
• More global competition
The Problem The Solution
Continuous Improvement
Continuous Improvement
Continuous Improvement
Continuous Improvement
The leaders and survivors will have a strong integrated CI Culture
5S
One Evolution Plan
NEXUS
Continuous
Improvement
THE GOAL
6/3/2015
6
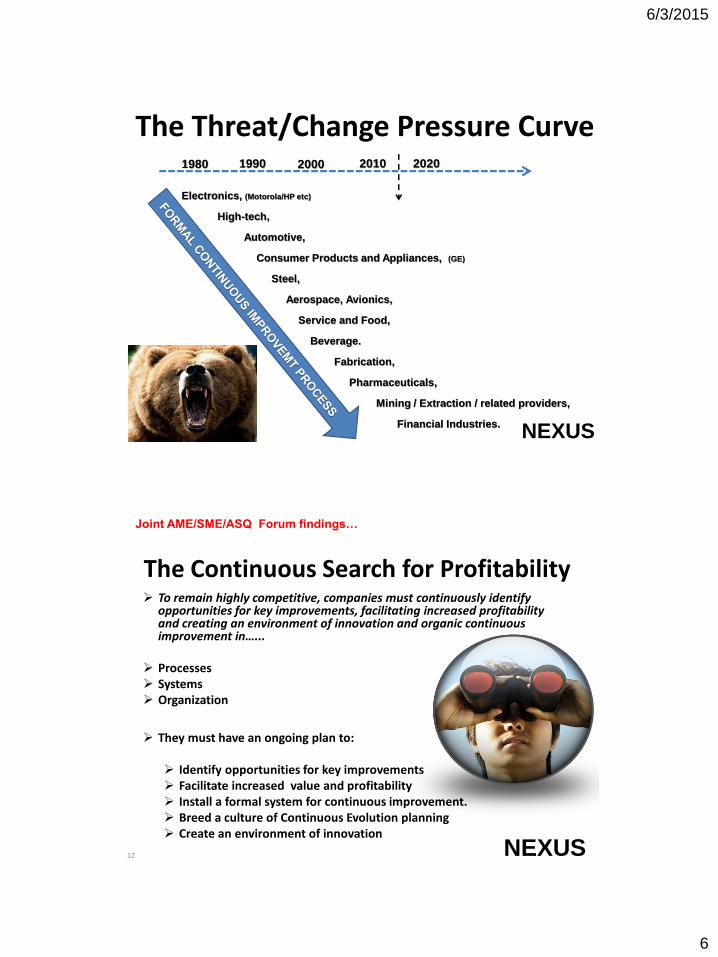
The Threat/Change Pressure Curve
Electronics, (Motorola/HP etc)
High-tech,
Automotive,
Consumer Products and Appliances, (GE)
Steel,
Aerospace, Avionics,
Service and Food,
Beverage.
Fabrication,
Pharmaceuticals,
Mining / Extraction / related providers,
Financial Industries.
1980 20201990 2000 2010
NEXUS
The Continuous Search for Profitability To remain highly competitive, companies must continuously identify
opportunities for key improvements, facilitating increased profitability and creating an environment of innovation and organic continuous improvement in…...
Processes Systems Organization
They must have an ongoing plan to:
Identify opportunities for key improvements Facilitate increased value and profitability Install a formal system for continuous improvement. Breed a culture of Continuous Evolution planning Create an environment of innovation
12 NEXUS
Joint AME/SME/ASQ Forum findings…
6/3/2015
7
13
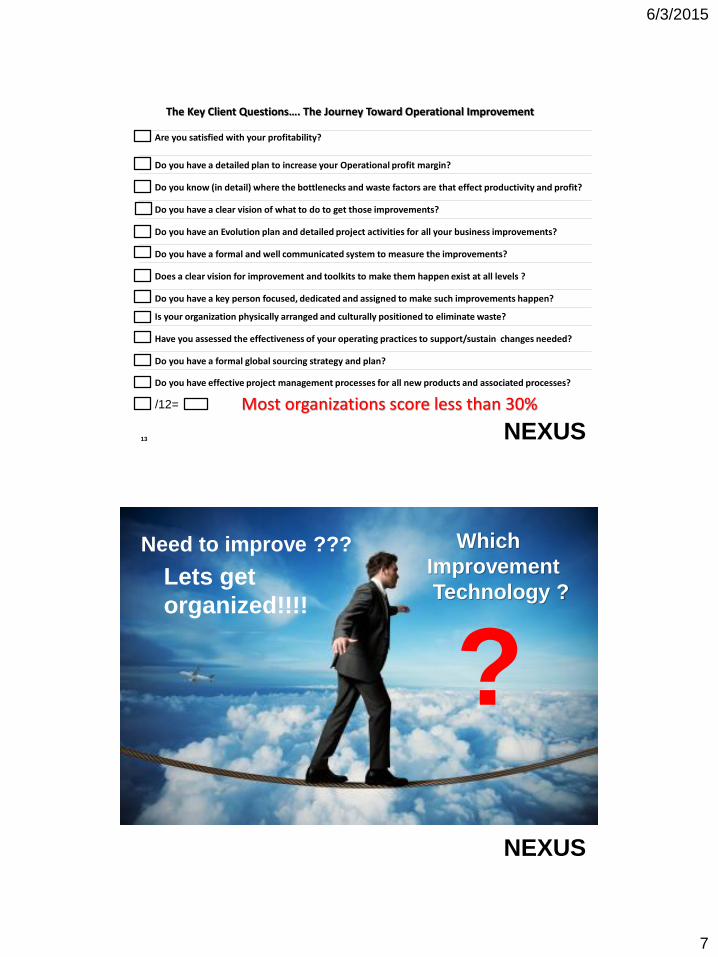
The Key Client Questions…. The Journey Toward Operational Improvement
Are you satisfied with your profitability?
Do you have a detailed plan to increase your Operational profit margin?
Do you know (in detail) where the bottlenecks and waste factors are that effect productivity and profit?
Do you have a clear vision of what to do to get those improvements?
Do you have an Evolution plan and detailed project activities for all your business improvements?
Do you have a formal and well communicated system to measure the improvements?
Does a clear vision for improvement and toolkits to make them happen exist at all levels ?
Do you have a key person focused, dedicated and assigned to make such improvements happen?
Is your organization physically arranged and culturally positioned to eliminate waste?
Have you assessed the effectiveness of your operating practices to support/sustain changes needed?
Do you have a formal global sourcing strategy and plan?
Do you have effective project management processes for all new products and associated processes?
Most organizations score less than 30%
NEXUS
/12=
NEXUS
Need to improve ??? Which
Improvement
Technology ?
?Lets get
organized!!!!
6/3/2015
8
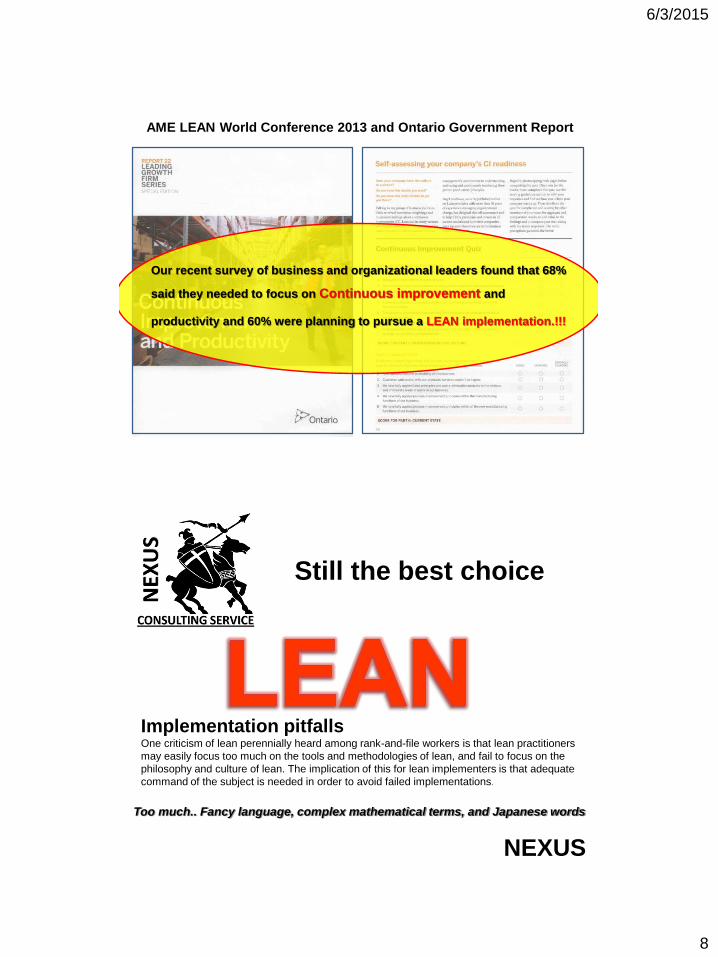
AME LEAN World Conference 2013 and Ontario Government Report
Our recent survey of business and organizational leaders found that 68%
said they needed to focus on Continuous improvement and
productivity and 60% were planning to pursue a LEAN implementation.!!!
NEXUS
Still the best choice
Implementation pitfalls One criticism of lean perennially heard among rank-and-file workers is that lean practitioners
may easily focus too much on the tools and methodologies of lean, and fail to focus on the
philosophy and culture of lean. The implication of this for lean implementers is that adequate
command of the subject is needed in order to avoid failed implementations.
Too much.. Fancy language, complex mathematical terms, and Japanese words
6/3/2015
9
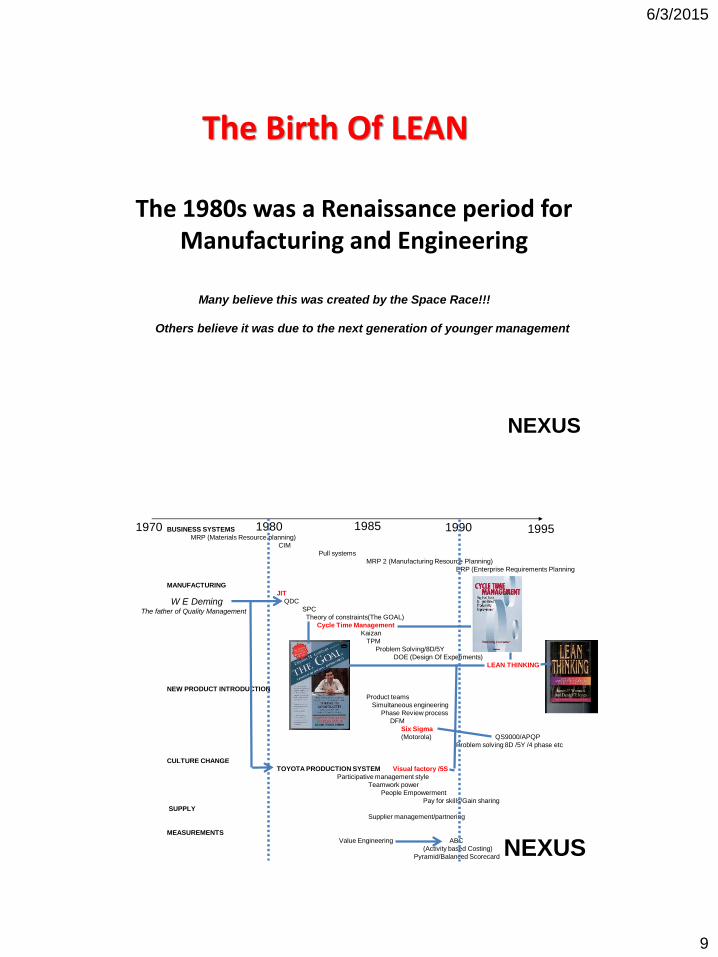
The 1980s was a Renaissance period for Manufacturing and Engineering
Many believe this was created by the Space Race!!!
Others believe it was due to the next generation of younger management
NEXUS
The Birth Of LEAN
BUSINESS SYSTEMS
MRP (Materials Resource planning)
CIM
Pull systems
MRP 2 (Manufacturing Resource Planning)
ERP (Enterprise Requirements Planning
MANUFACTURING
JIT
QDC
SPC
Theory of constraints(The GOAL)
Cycle Time Management
Kaizan
TPM
Problem Solving/8D/5Y
DOE (Design Of Experiments)
LEAN THINKING
NEW PRODUCT INTRODUCTION
Product teams
Simultaneous engineering
Phase Review process
DFM
Six Sigma
(Motorola) QS9000/APQP
Problem solving 8D /5Y /4 phase etc
CULTURE CHANGE
TOYOTA PRODUCTION SYSTEM Visual factory /5S
Participative management style
Teamwork power
People Empowerment
Pay for skills/Gain sharing
SUPPLY
Supplier management/partnering
MEASUREMENTS
Value Engineering ABC
(Activity based Costing)
Pyramid/Balanced Scorecard
1970 19951980 1985 1990
W E Deming
NEXUS
The father of Quality Management
6/3/2015
10
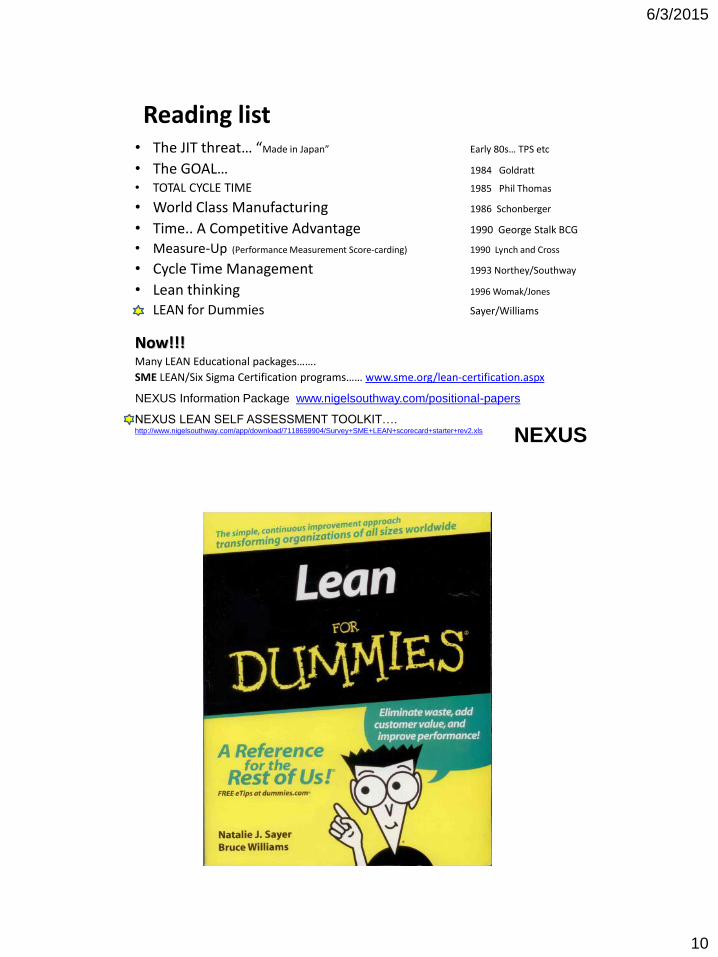
• The JIT threat… “Made in Japan” Early 80s… TPS etc
• The GOAL… 1984 Goldratt
• TOTAL CYCLE TIME 1985 Phil Thomas
• World Class Manufacturing 1986 Schonberger
• Time.. A Competitive Advantage 1990 George Stalk BCG
• Measure-Up (Performance Measurement Score-carding) 1990 Lynch and Cross
• Cycle Time Management 1993 Northey/Southway
• Lean thinking 1996 Womak/Jones
• LEAN for Dummies Sayer/Williams
Now!!!Many LEAN Educational packages…….
SME LEAN/Six Sigma Certification programs…… www.sme.org/lean-certification.aspx
Reading list
NEXUS Information Package www.nigelsouthway.com/positional-papers
NEXUSNEXUS LEAN SELF ASSESSMENT TOOLKIT…. http://www.nigelsouthway.com/app/download/7118659904/Survey+SME+LEAN+scorecard+starter+rev2.xls
6/3/2015
11
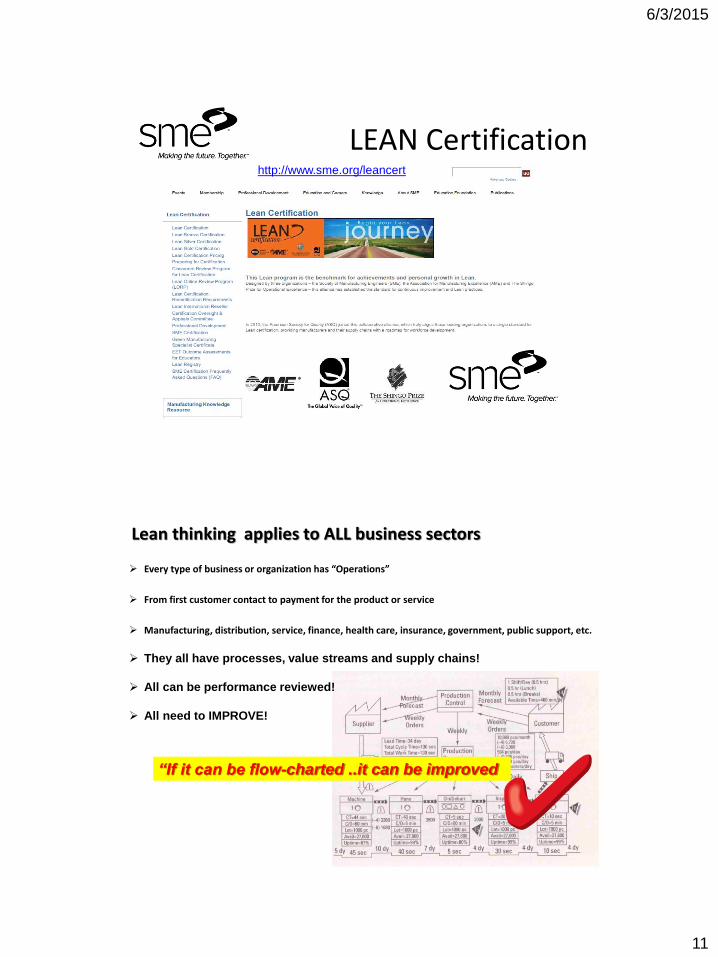
LEAN Certificationhttp://www.sme.org/leancert
“If it can be flow-charted ..it can be improved
Lean thinking applies to ALL business sectors
Every type of business or organization has “Operations”
From first customer contact to payment for the product or service
Manufacturing, distribution, service, finance, health care, insurance, government, public support, etc.
They all have processes, value streams and supply chains!
All can be performance reviewed!
All need to IMPROVE!
6/3/2015
12
NEXUS
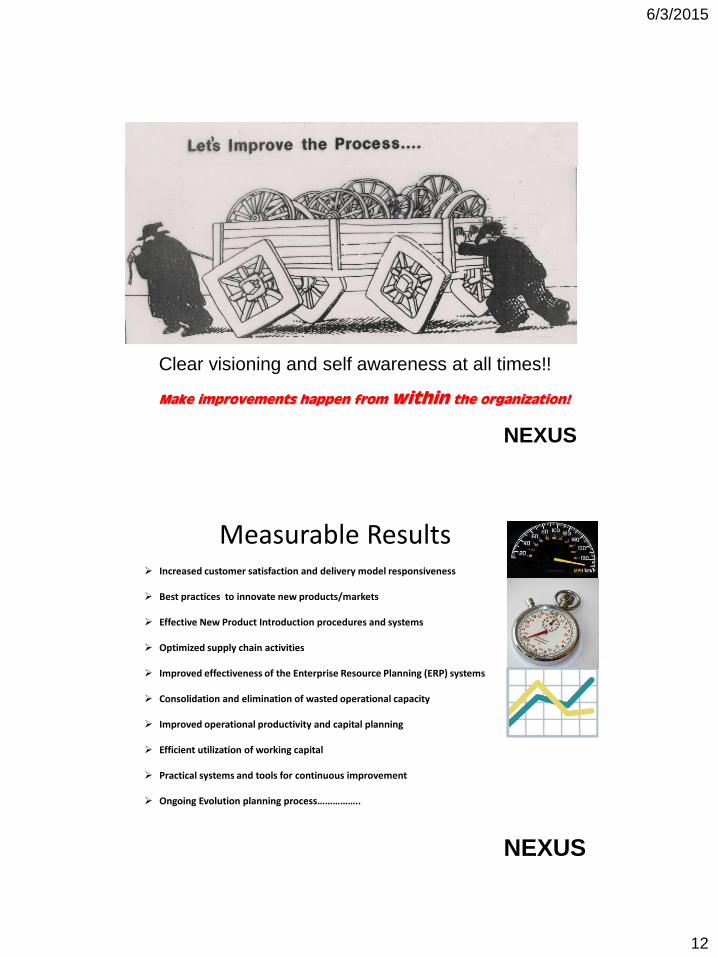
Clear visioning and self awareness at all times!!
Make improvements happen from within the organization!
Measurable Results Increased customer satisfaction and delivery model responsiveness
Best practices to innovate new products/markets
Effective New Product Introduction procedures and systems
Optimized supply chain activities
Improved effectiveness of the Enterprise Resource Planning (ERP) systems
Consolidation and elimination of wasted operational capacity
Improved operational productivity and capital planning
Efficient utilization of working capital
Practical systems and tools for continuous improvement
Ongoing Evolution planning process……………..
NEXUS
6/3/2015
13
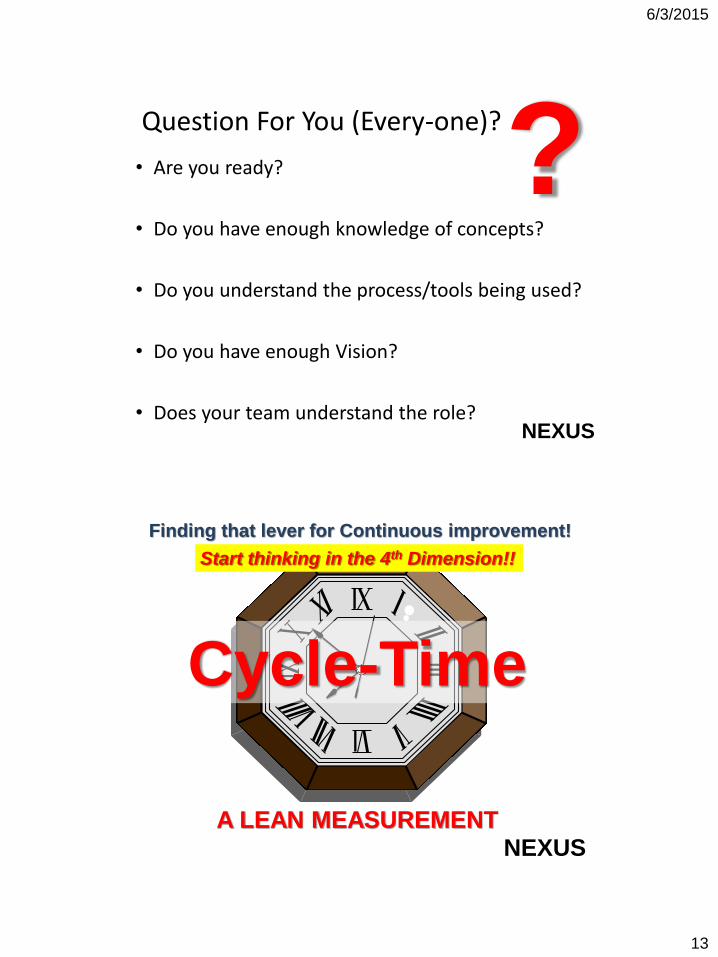
Question For You (Every-one)?
• Are you ready?
• Do you have enough knowledge of concepts?
• Do you understand the process/tools being used?
• Do you have enough Vision?
• Does your team understand the role?
?
NEXUS
NEXUS
Cycle-Time
Finding that lever for Continuous improvement!
A LEAN MEASUREMENT
Start thinking in the 4th Dimension!!
6/3/2015
14
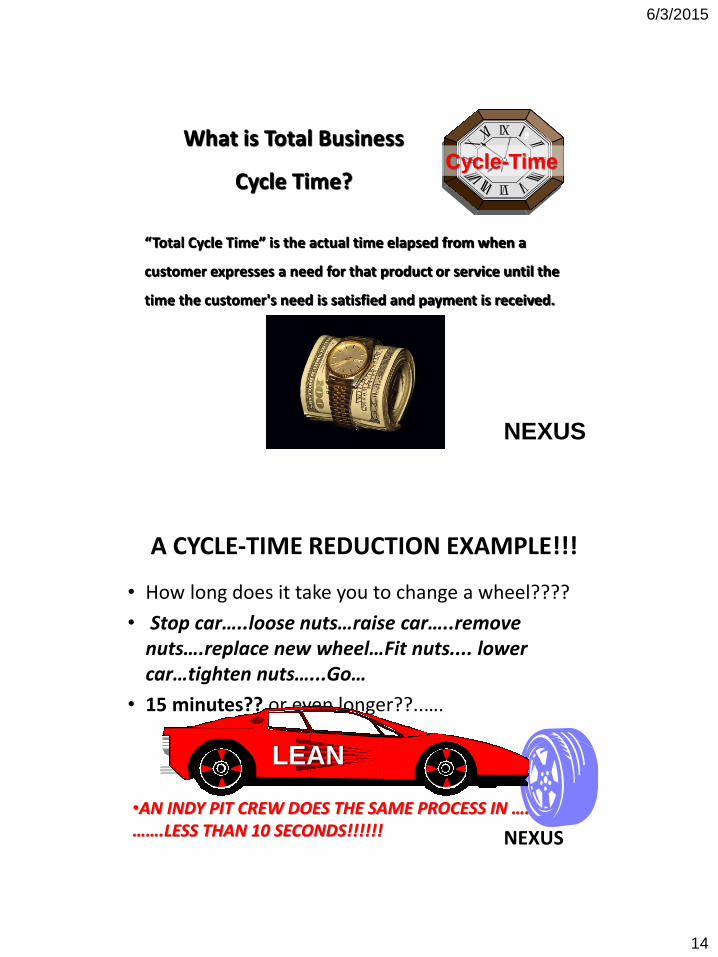
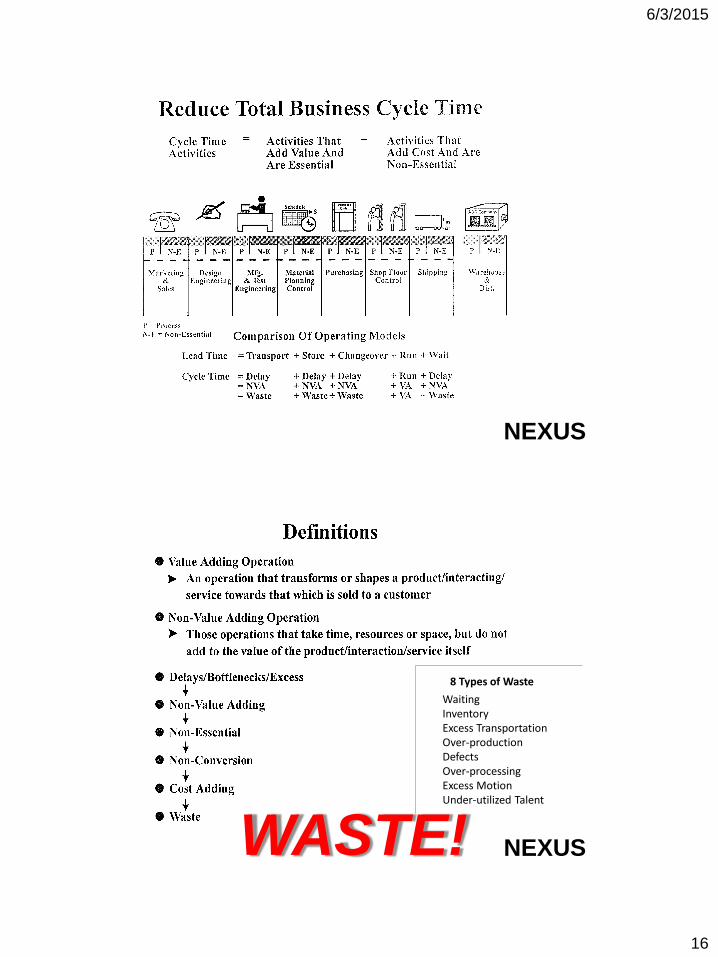
What is Total Business
Cycle Time?
“Total Cycle Time” is the actual time elapsed from when a
customer expresses a need for that product or service until the
time the customer's need is satisfied and payment is received.
NEXUS
Cycle-Time
A CYCLE-TIME REDUCTION EXAMPLE!!!
• How long does it take you to change a wheel????
• Stop car…..loose nuts…raise car…..remove nuts….replace new wheel…Fit nuts.... lower car…tighten nuts…...Go…
• 15 minutes?? or even longer??..….
NEXUS
•AN INDY PIT CREW DOES THE SAME PROCESS IN …..…….LESS THAN 10 SECONDS!!!!!!
LEAN
6/3/2015
15
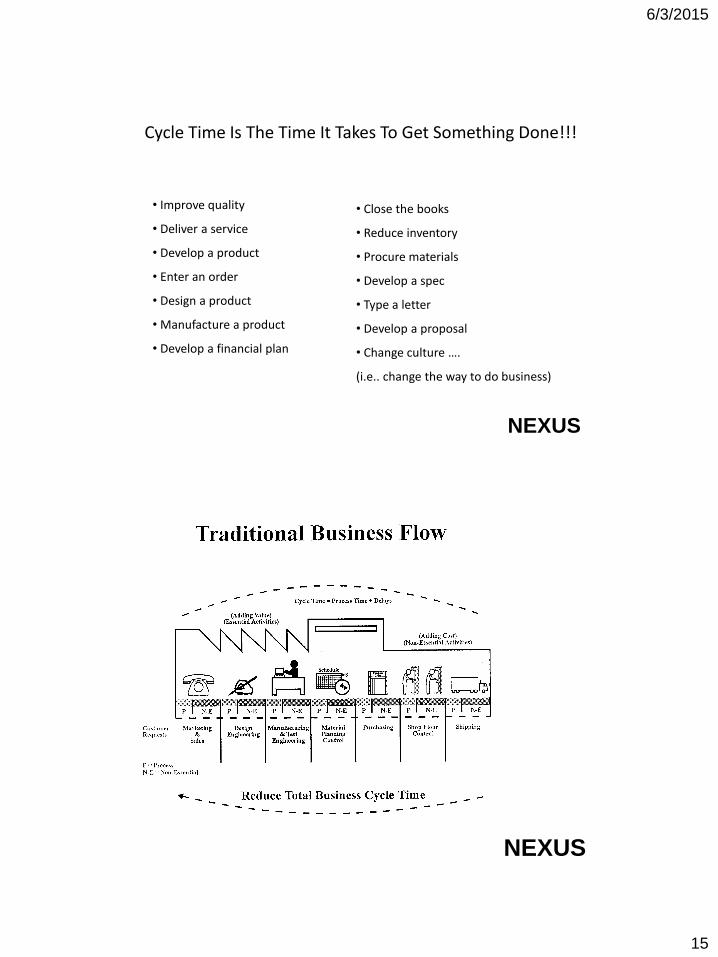
Cycle Time Is The Time It Takes To Get Something Done!!!
• Improve quality
• Deliver a service
• Develop a product
• Enter an order
• Design a product
• Manufacture a product
• Develop a financial plan
• Close the books
• Reduce inventory
• Procure materials
• Develop a spec
• Type a letter
• Develop a proposal
• Change culture ….
(i.e.. change the way to do business)
NEXUS
NEXUS
6/3/2015
16
NEXUS
WaitingInventoryExcess TransportationOver-productionDefectsOver-processingExcess MotionUnder-utilized Talent
8 Types of Waste
NEXUSWASTE!
6/3/2015
17
WaitingInventoryExcess TransportationOver-productionDefectsOver-processingExcess MotionUnder-utilized Talent
8 Types of Waste
NEXUS
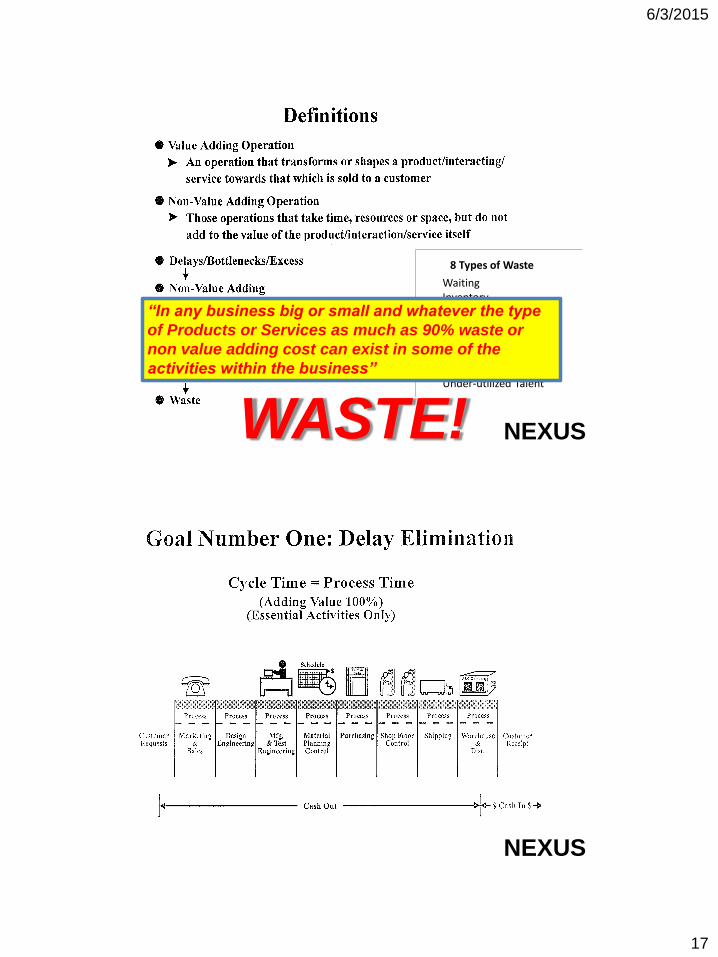
“In any business big or small and whatever the type
of Products or Services as much as 90% waste or
non value adding cost can exist in some of the
activities within the business”
WASTE!
NEXUS
6/3/2015
18
Discovery
Invention
Research
Development
Launch
Commercialization
INNOVATION
NEW PRODUCT INTRODUCTION
$$$$
MarketersResearchers
Product TeamsProduction/Distribution
Happy
Customer
Academia
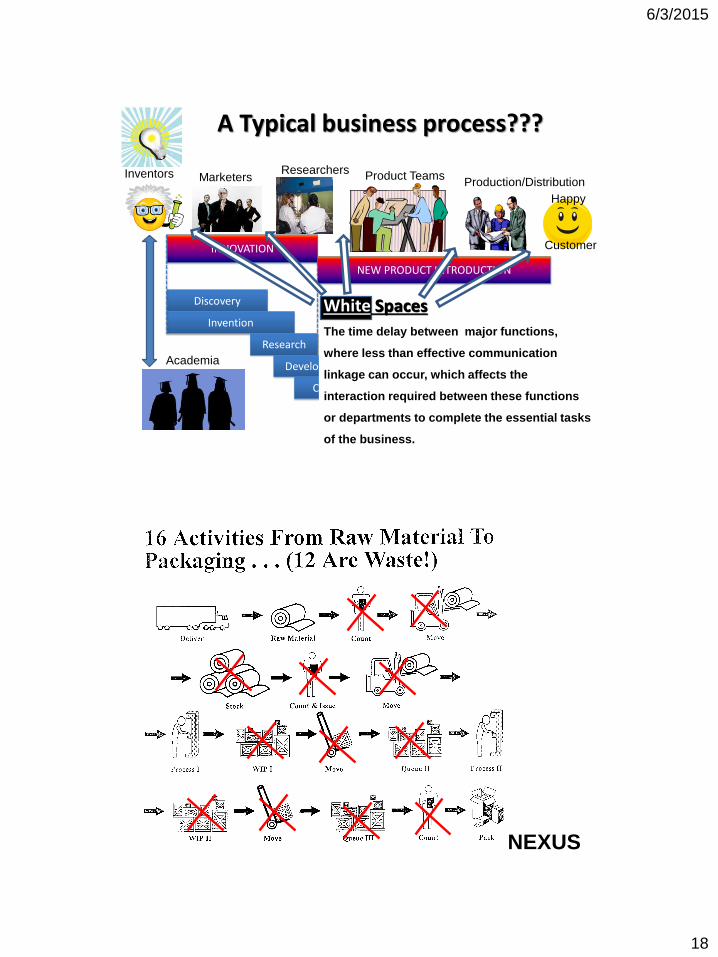
A Typical business process???
Inventors
White Spaces
The time delay between major functions,
where less than effective communication
linkage can occur, which affects the
interaction required between these functions
or departments to complete the essential tasks
of the business.
NEXUS
6/3/2015
19
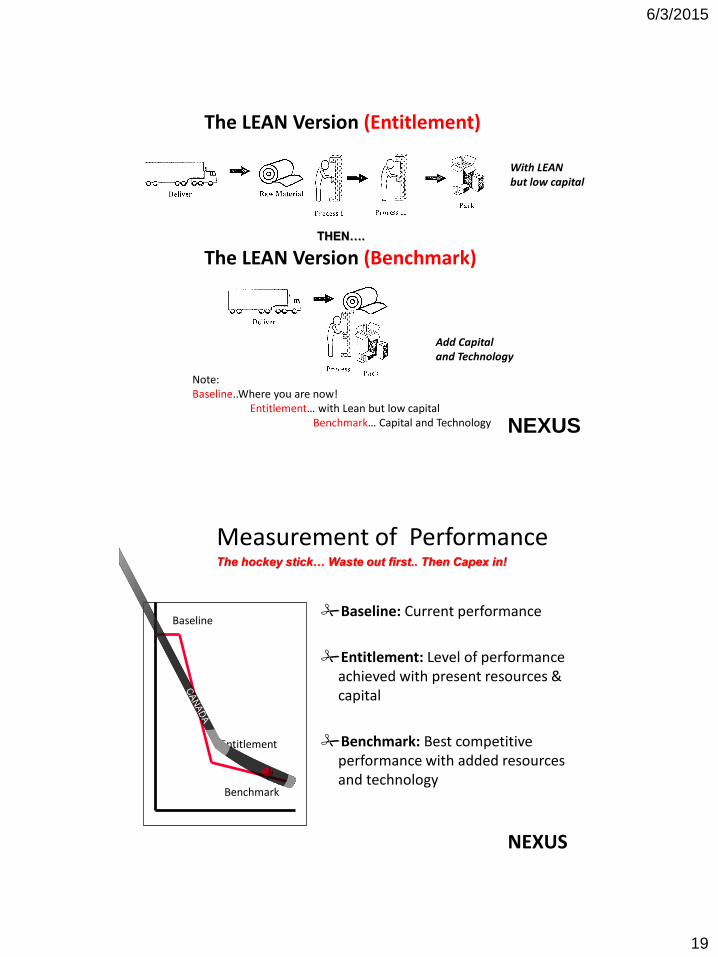
The LEAN Version (Entitlement)
The LEAN Version (Benchmark)
Note:Baseline..Where you are now!
Entitlement… with Lean but low capitalBenchmark… Capital and Technology NEXUS
With LEAN but low capital
Add Capital and Technology
THEN….
Measurement of Performance
Entitlement
Baseline
Benchmark
Baseline: Current performance
Entitlement: Level of performance achieved with present resources & capital
Benchmark: Best competitive performance with added resources and technology
NEXUS
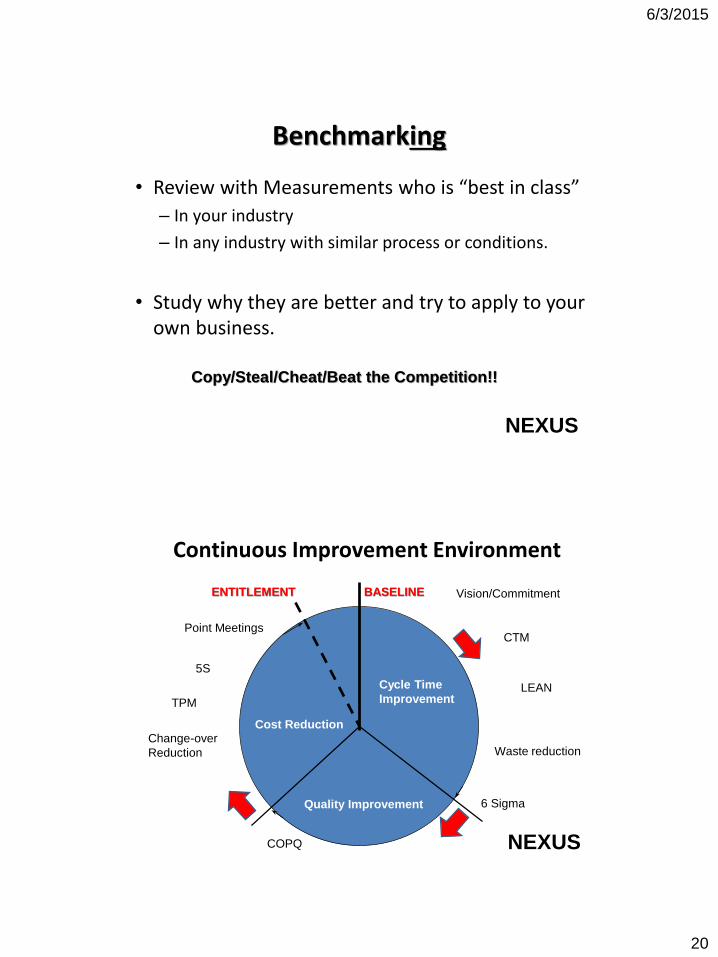
The hockey stick… Waste out first.. Then Capex in!
6/3/2015
20
Benchmarking
• Review with Measurements who is “best in class”
– In your industry
– In any industry with similar process or conditions.
• Study why they are better and try to apply to your own business.
NEXUS
Copy/Steal/Cheat/Beat the Competition!!
Continuous Improvement Environment
ENTITLEMENT BASELINE
Cycle Time
Improvement
Quality Improvement
Cost Reduction
NEXUS
Vision/Commitment
CTM
LEAN
Waste reduction
6 Sigma
TPM
Change-over
Reduction
5S
Point Meetings
COPQ
6/3/2015
21
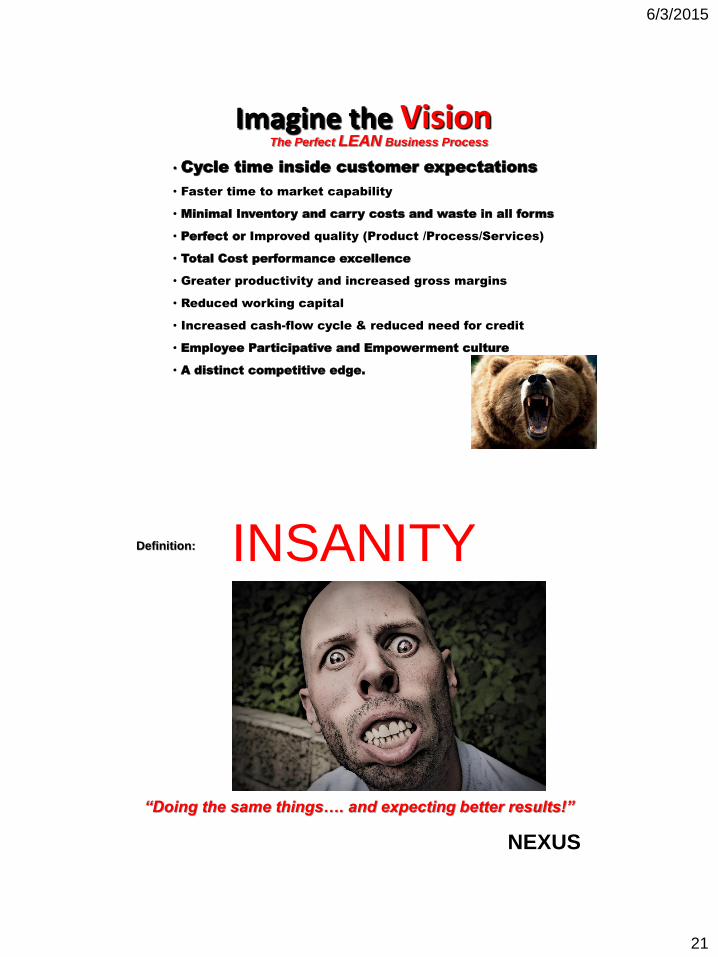
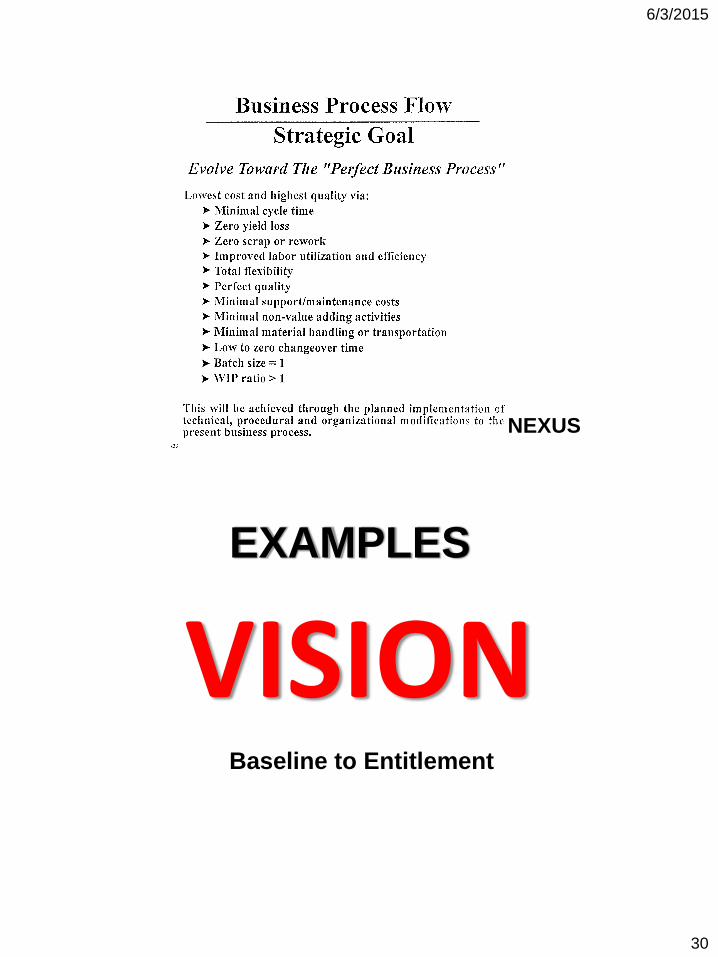
Imagine the Vision• Cycle time inside customer expectations
• Faster time to market capability
• Minimal Inventory and carry costs and waste in all forms
• Perfect or Improved quality (Product /Process/Services)
• Total Cost performance excellence
• Greater productivity and increased gross margins
• Reduced working capital
• Increased cash-flow cycle & reduced need for credit
• Employee Participative and Empowerment culture
• A distinct competitive edge.
NEXUS
The Perfect LEAN Business Process
NEXUS
INSANITY
“Doing the same things…. and expecting better results!”
Definition:
6/3/2015
22
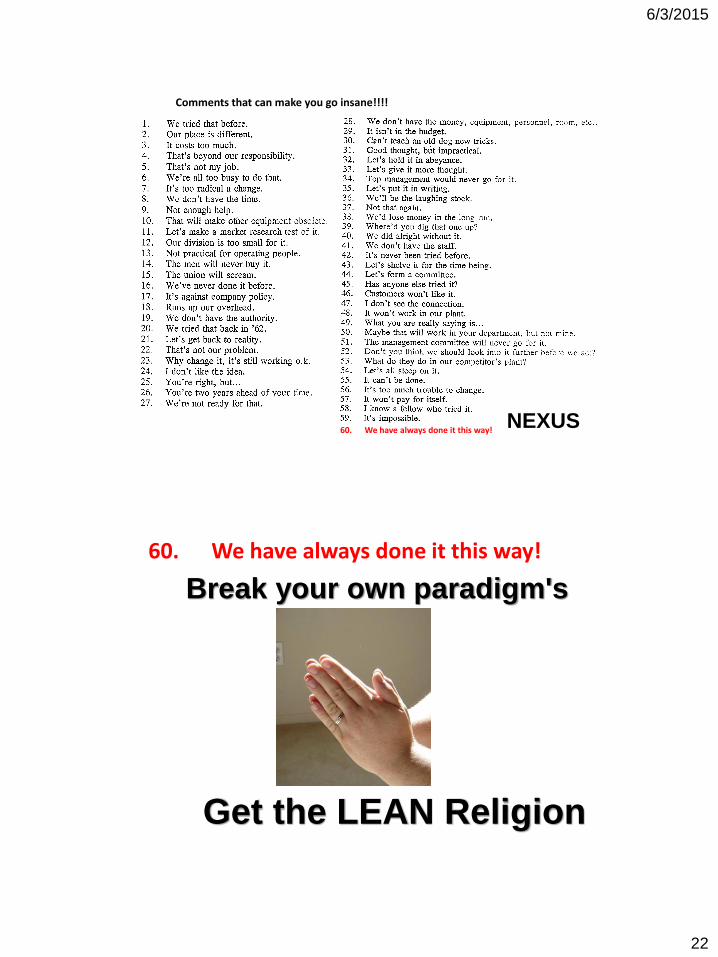
Comments that can make you go insane!!!!
60. We have always done it this way!NEXUS
Break your own paradigm's
60. We have always done it this way!
Get the LEAN Religion
6/3/2015
23
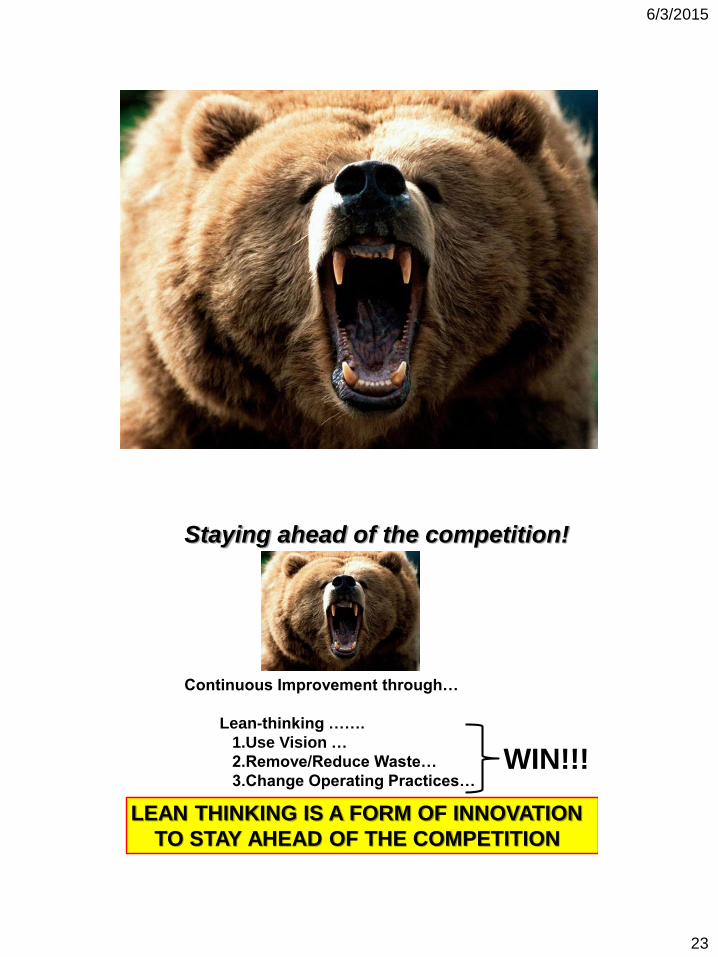
Staying ahead of the competition!
Continuous Improvement through…
Lean-thinking …….
1.Use Vision …
2.Remove/Reduce Waste…
3.Change Operating Practices…
LEAN THINKING IS A FORM OF INNOVATION
TO STAY AHEAD OF THE COMPETITION
WIN!!!

6/3/2015
24
NEXUS
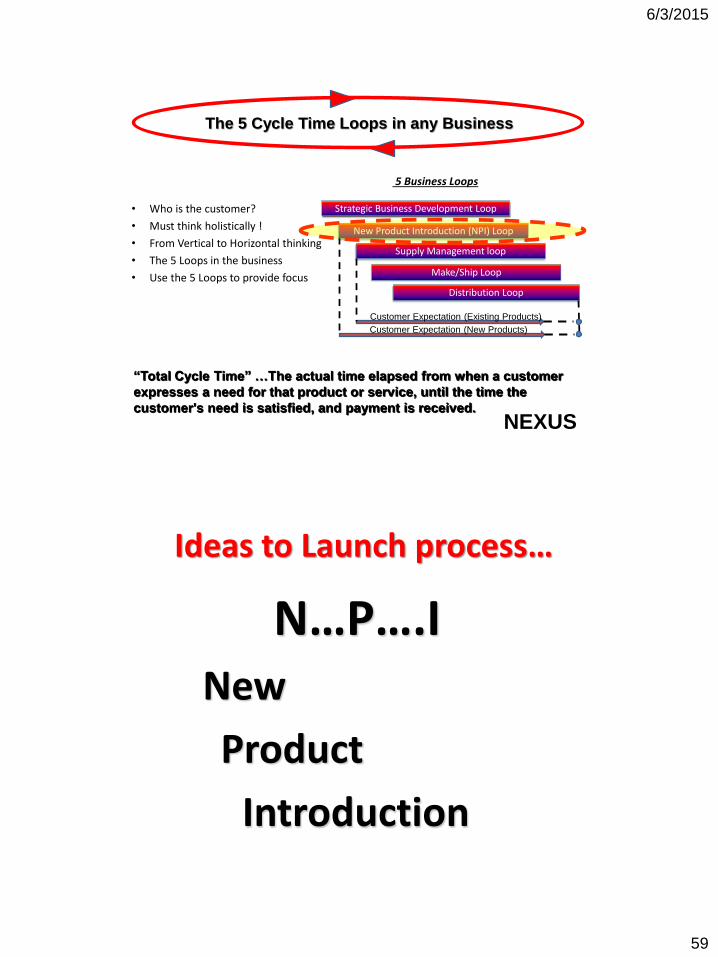
“Total Cycle Time” …The actual time elapsed from when a customer
expresses a need for that product or service, until the time the
customer's need is satisfied, and payment is received.
Strategic Business Development Loop
New Product Introduction (NPI) Loop
Supply Management loop
Make/Ship Loop
Distribution Loop
The 5 Cycle Time Loops in any Business
Customer Expectation (Existing Products)
Customer Expectation (New Products)
NEXUS
“Total Cycle Time” …The actual time elapsed from when a customer
expresses a need for that product or service, until the time the
customer's need is satisfied, and payment is received.
The 5 Cycle Time Loops in any Business
Strategic Business Development Loop
New Product Introduction (NPI) Loop
Supply Management loop
Make/Ship Loop
Distribution Loop
Customer Expectation (Existing Products)
Customer Expectation (New Products)
• Who is the customer?
• Must think holistically !
• From Vertical to Horizontal thinking
• The 5 Loops in the business
• Use the 5 Loops to provide focus
5 Business Loops

6/3/2015
25
NEXUS
“Total Cycle Time” …The actual time elapsed from when a customer
expresses a need for that product or service, until the time the
customer's need is satisfied, and payment is received.
The 5 Cycle Time Loops in any Business
Strategic Business Development Loop
New Product Introduction (NPI) Loop
Supply Management loop
Make/Ship Loop
Distribution Loop
Customer Expectation (Existing Products)
Customer Expectation (New Products)
5 Business Loops
3TIERSSTRATEGY
IMPROVEMENT
PRACTICES
1
2
3
3 TIER APPROACH TO CHANGE
TIER 1 Strategic process change
TIER 2 Change/Improvements
TIER 3 Operating Practice Changes
NEXUSDetails of 3 TIERs at www.nigelsouthway.com/positional papers
6/3/2015
26
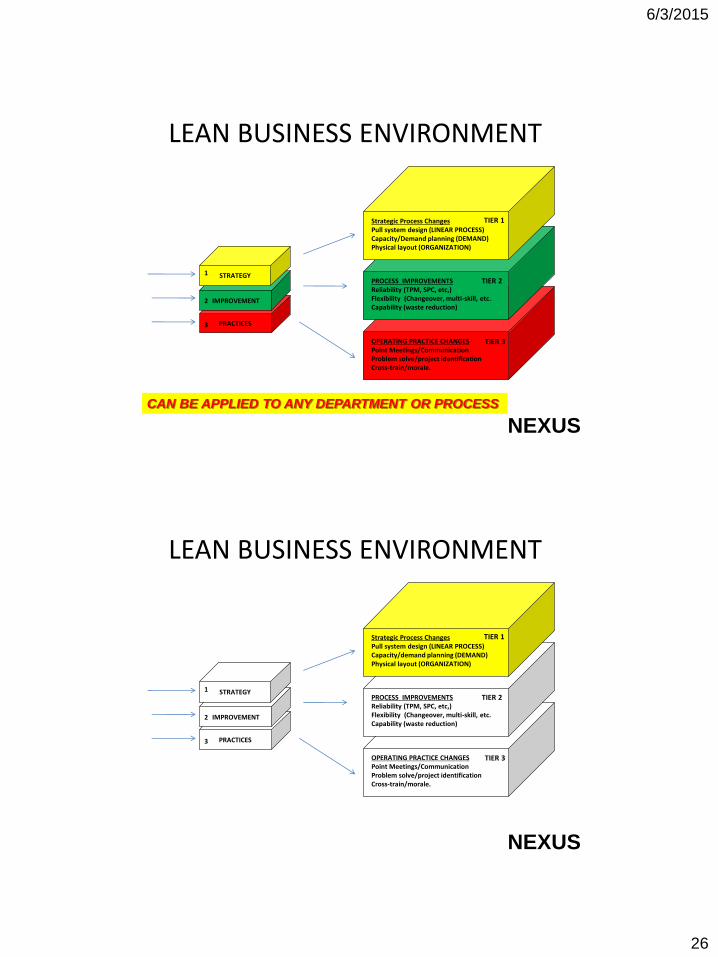
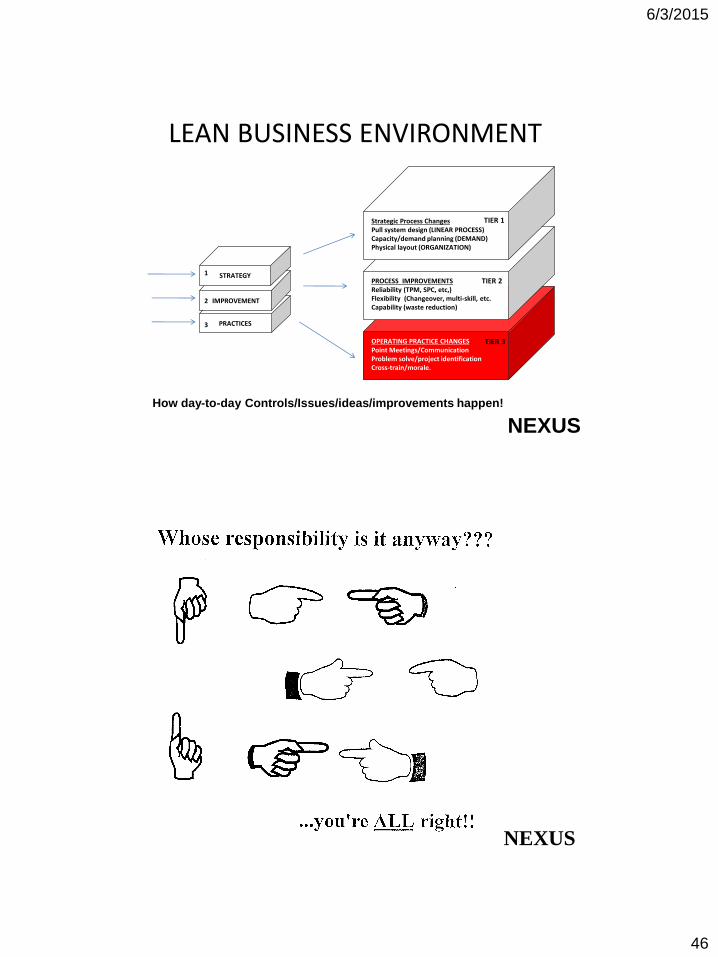
OPERATING PRACTICE CHANGESPoint Meetings/Communication Problem solve/project identification Cross-train/morale.
PROCESS IMPROVEMENTSReliability (TPM, SPC, etc,)Flexibility (Changeover, multi-skill, etc. Capability (waste reduction)
Strategic Process ChangesPull system design (LINEAR PROCESS)Capacity/Demand planning (DEMAND)Physical layout (ORGANIZATION)
TIER 1
TIER 3
TIER 2 STRATEGY
IMPROVEMENT
PRACTICES
1
2
3
LEAN BUSINESS ENVIRONMENT
NEXUSCAN BE APPLIED TO ANY DEPARTMENT OR PROCESS
OPERATING PRACTICE CHANGESPoint Meetings/Communication Problem solve/project identification Cross-train/morale.
PROCESS IMPROVEMENTSReliability (TPM, SPC, etc,)Flexibility (Changeover, multi-skill, etc. Capability (waste reduction)
Strategic Process ChangesPull system design (LINEAR PROCESS)Capacity/demand planning (DEMAND)Physical layout (ORGANIZATION)
TIER 1
TIER 3
TIER 2 STRATEGY
IMPROVEMENT
PRACTICES
1
2
3
LEAN BUSINESS ENVIRONMENT
NEXUS
6/3/2015
27
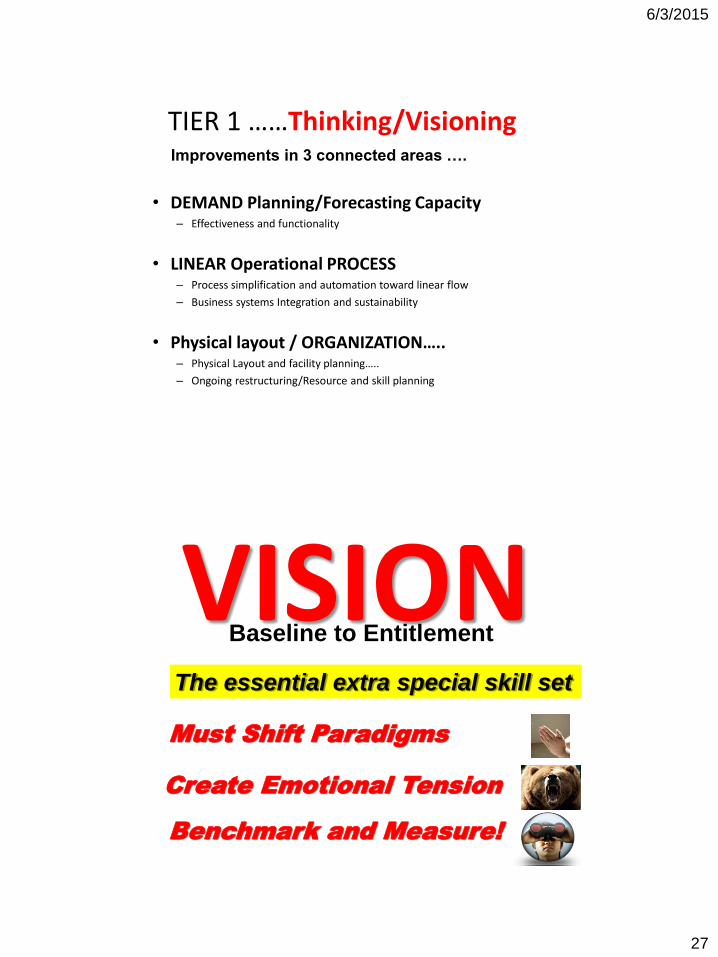
TIER 1 ……Thinking/Visioning
• DEMAND Planning/Forecasting Capacity– Effectiveness and functionality
• LINEAR Operational PROCESS– Process simplification and automation toward linear flow
– Business systems Integration and sustainability
• Physical layout / ORGANIZATION….. – Physical Layout and facility planning…..
– Ongoing restructuring/Resource and skill planning
Improvements in 3 connected areas ….
VISIONBaseline to Entitlement
The essential extra special skill set
Must Shift Paradigms
Create Emotional Tension
Benchmark and Measure!
6/3/2015
28
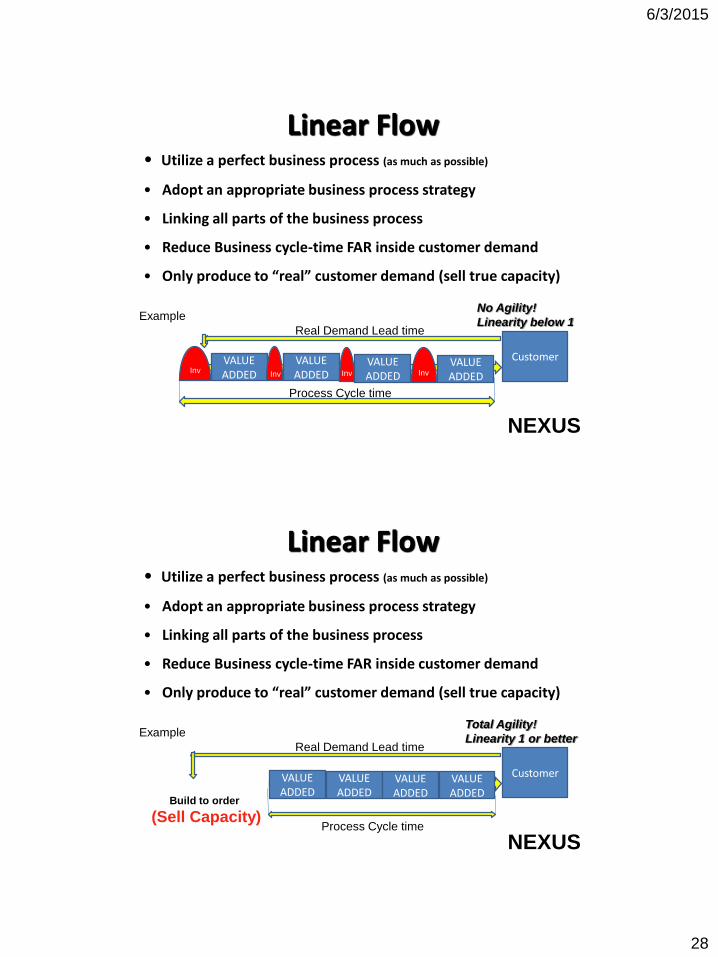
Linear Flow• Utilize a perfect business process (as much as possible)
• Adopt an appropriate business process strategy
• Linking all parts of the business process
• Reduce Business cycle-time FAR inside customer demand
• Only produce to “real” customer demand (sell true capacity)
NEXUS
VALUE ADDED
VALUE ADDED
VALUE ADDED
VALUE ADDED
Customer
Real Demand Lead time
Process Cycle time
Example
Inv InvInv Inv
No Agility!
Linearity below 1
Linear Flow• Utilize a perfect business process (as much as possible)
• Adopt an appropriate business process strategy
• Linking all parts of the business process
• Reduce Business cycle-time FAR inside customer demand
• Only produce to “real” customer demand (sell true capacity)
NEXUS
VALUE ADDED
VALUE ADDED
VALUE ADDED
VALUE ADDED
Customer
Real Demand Lead time
Process Cycle time
Example
Build to order
(Sell Capacity)
Total Agility!
Linearity 1 or better
6/3/2015
29
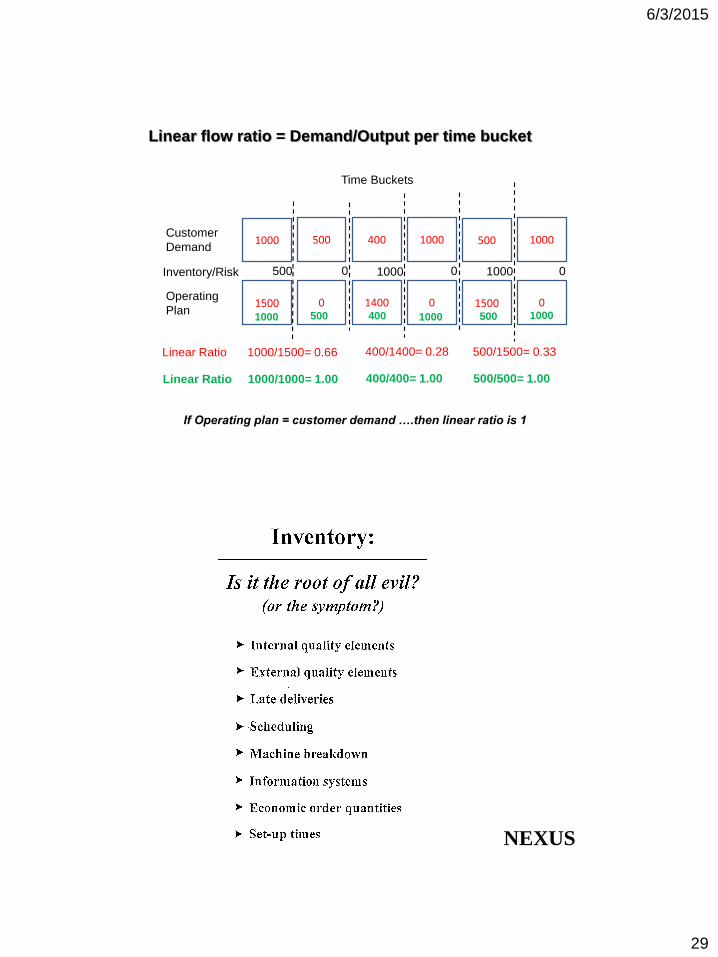
Linear flow ratio = Demand/Output per time bucket
1000 500 500400 1000 1000
1500 0 15001400 0 0
Customer
Demand
Operating
Plan
Linear Ratio 1000/1500= 0.66 400/1400= 0.28 500/1500= 0.33
Time Buckets
If Operating plan = customer demand ….then linear ratio is 1
Inventory/Risk 500 0 1000 0 1000 0
1000 500 400 1000 500 1000
Linear Ratio 1000/1000= 1.00 400/400= 1.00 500/500= 1.00
NEXUS
6/3/2015
30
NEXUS
VISIONBaseline to Entitlement
EXAMPLES
6/3/2015
31
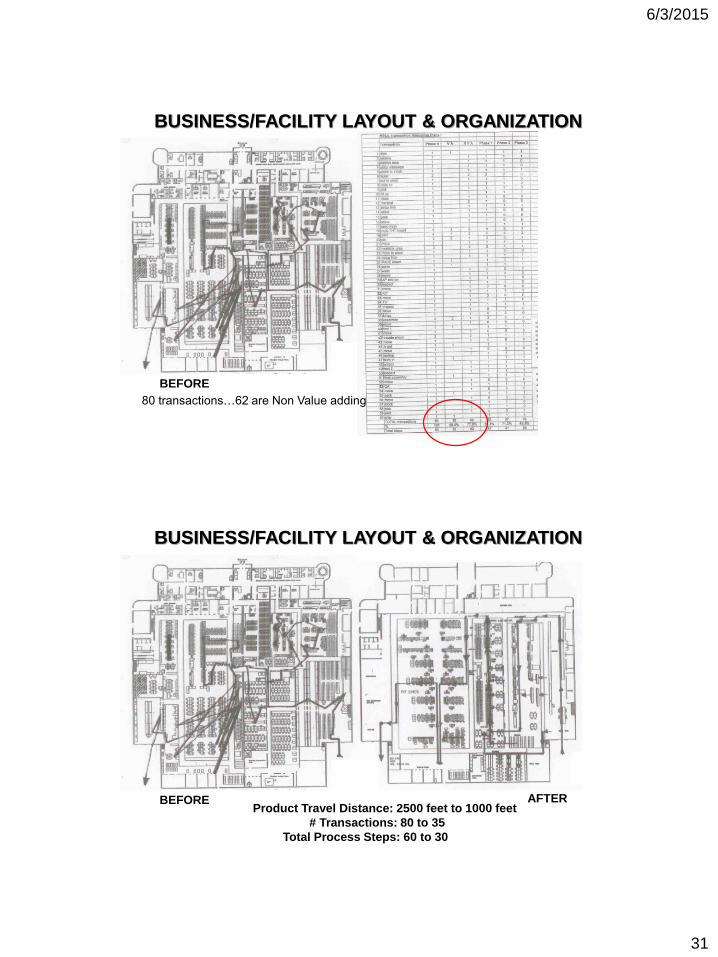
BUSINESS/FACILITY LAYOUT & ORGANIZATION
BEFORE
80 transactions…62 are Non Value adding
BUSINESS/FACILITY LAYOUT & ORGANIZATION
Product Travel Distance: 2500 feet to 1000 feet
# Transactions: 80 to 35
Total Process Steps: 60 to 30
BEFORE AFTER
6/3/2015
32
NEXUS
NEXUS
6/3/2015
33
NEXUS
NEXUS
6/3/2015
34
NEXUS
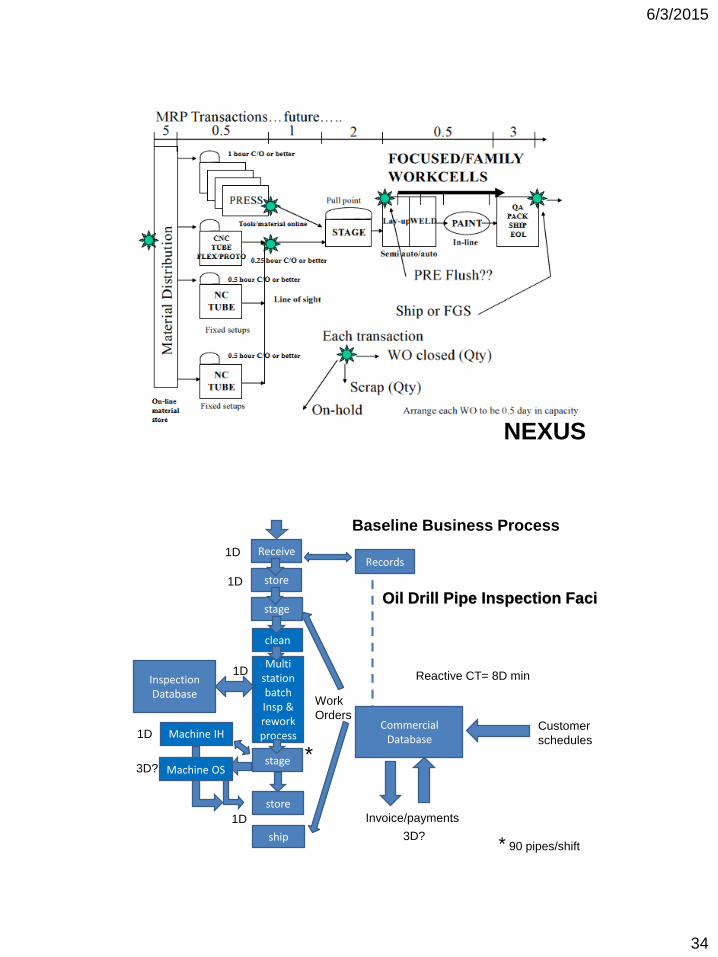
Baseline Business Process
Receive
stage
store
clean
Multi station batch Insp &reworkprocess
stage
Machine IH
store
Inspection Database
CommercialDatabase
Records
Customer
schedules
Work
Orders
Invoice/payments
ship
Machine OS
* 90 pipes/shift
*
1D
1D
1D
1D
3D?
1D
Reactive CT= 8D min
3D?
Oil Drill Pipe Inspection Facility
6/3/2015
35
Receive
stage
store
clean
Multi station batch Insp &reworkprocess
stage
Machine IH
store
Inspection Database
CommercialDatabase
Records
Customer
schedules
Work
Orders
Invoice/payments
ship
Machine OS
* 90 pipes/shift
*
Baseline Business Process
Stage
Auto pipe clean
Semi-Automated Physical inspectionCMM Laser probe
Re face stations
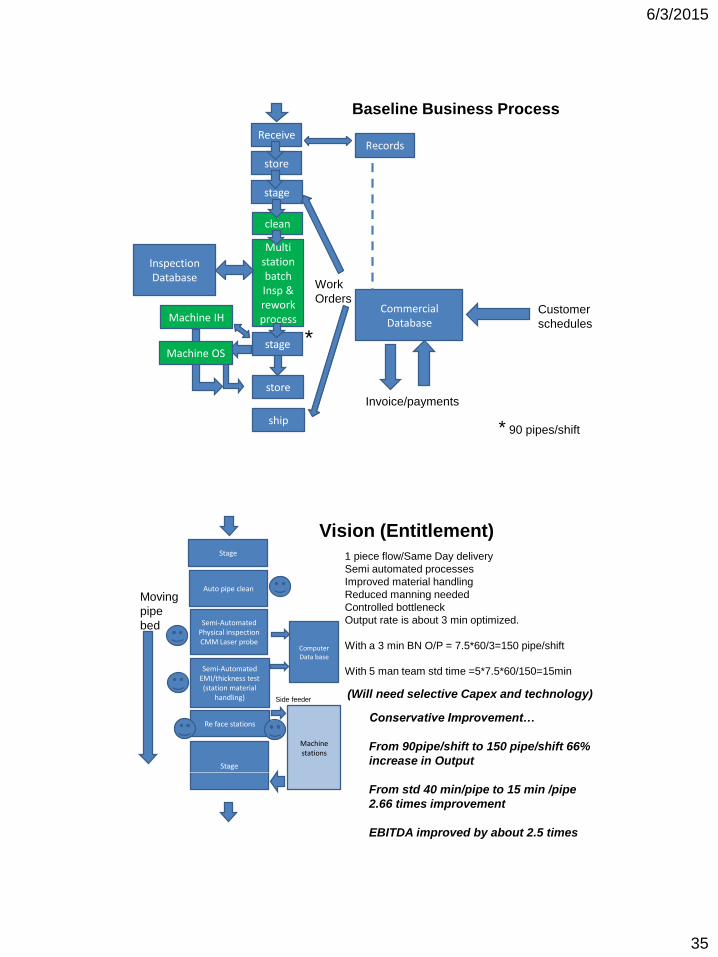
Vision (Entitlement)
Semi-Automated EMI/thickness test (station material
handling)
Machinestations
Moving
pipe
bed
Stage
1 piece flow/Same Day delivery
Semi automated processes
Improved material handling
Reduced manning needed
Controlled bottleneck
Output rate is about 3 min optimized.
With a 3 min BN O/P = 7.5*60/3=150 pipe/shift
With 5 man team std time =5*7.5*60/150=15min
Computer Data base
Side feeder
Conservative Improvement…
From 90pipe/shift to 150 pipe/shift 66%
increase in Output
From std 40 min/pipe to 15 min /pipe
2.66 times improvement
EBITDA improved by about 2.5 times
(Will need selective Capex and technology)
6/3/2015
36
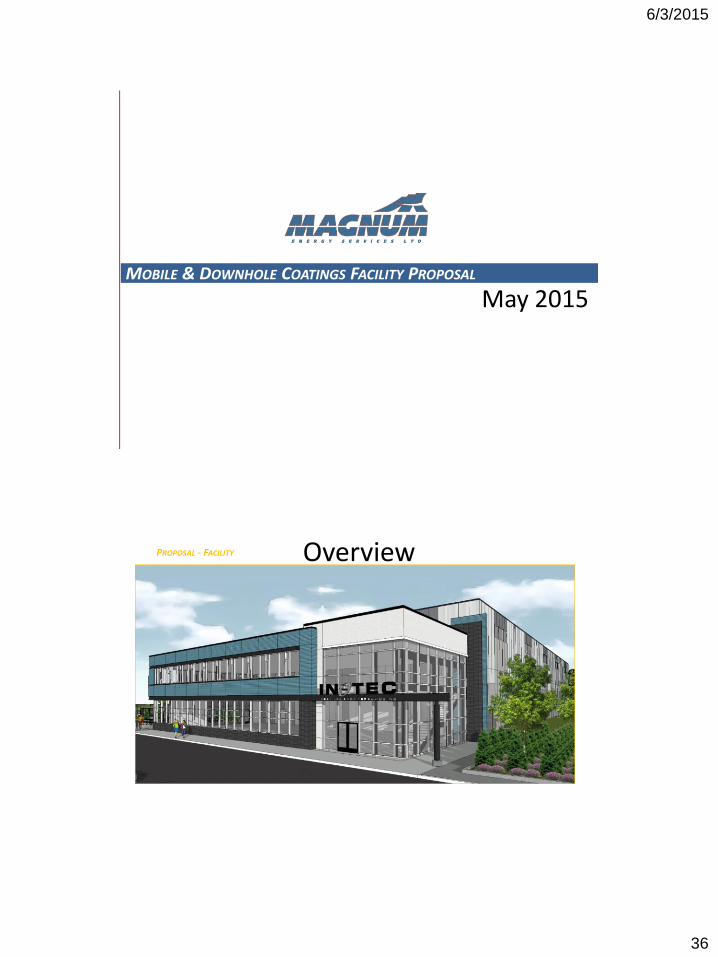
May 2015MOBILE & DOWNHOLE COATINGS FACILITY PROPOSAL
OverviewPROPOSAL - FACILITY
Proposed – to be negotiated
6/3/2015
37
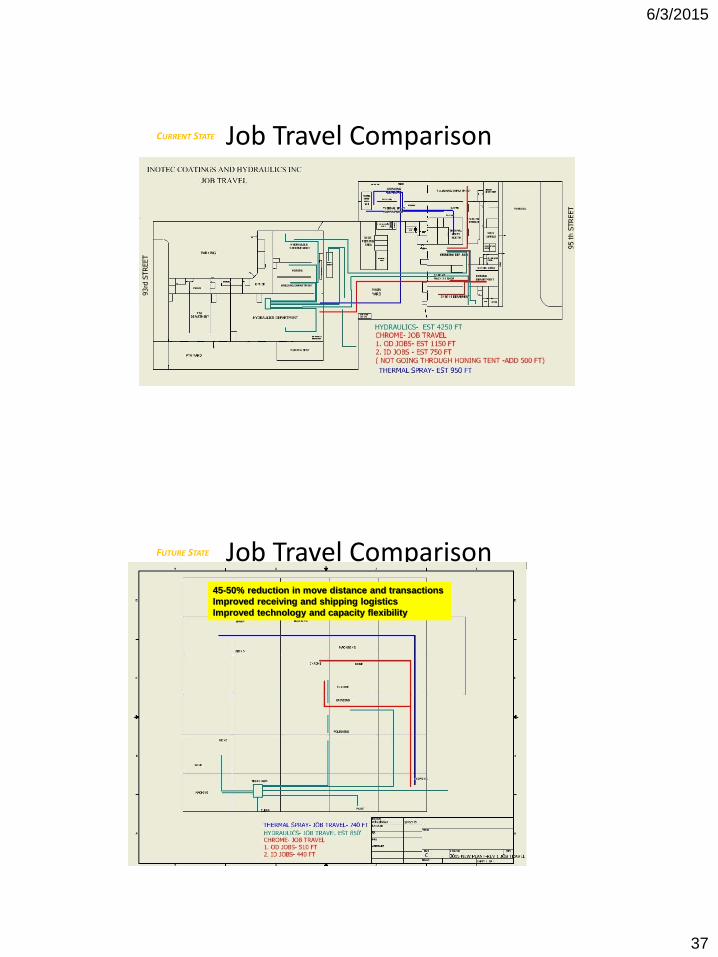
Job Travel ComparisonCURRENT STATE
Job Travel ComparisonFUTURE STATE
45-50% reduction in move distance and transactions
Improved receiving and shipping logistics
Improved technology and capacity flexibility
6/3/2015
38
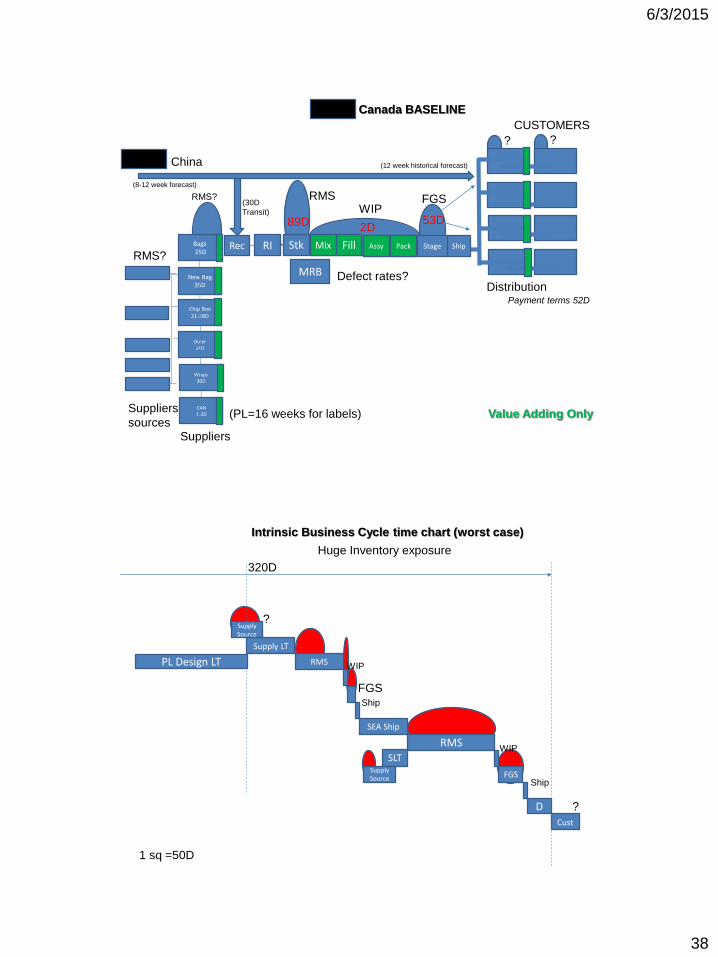
RAPID Canada BASELINE
Distribution
CUSTOMERS
FGS
? ?
MRB
Mix Fill PackAssy ShipStkRIRec Stage
Defect rates?
RMSRMS?
WIP
RAPID China
Outer14D
Chip Box 21-28D
New Bag 35D
Suppliers
Suppliers
sources
Bags25DRMS?
Wraps30D
CAN1-2D
(30D
Transit)
(PL=16 weeks for labels)
(8-12 week forecast)
(12 week historical forecast)
Payment terms 52D
53D89D 2D
Mix Fill PackAssy
Value Adding Only
Cust
1 sq =50D
D
FGS
RMSSLT
WIP
Ship
?
SEA Ship
Ship
FGS
WIPRMS
Supply LT
Supply Source
?
PL Design LT
Intrinsic Business Cycle time chart (worst case)
Huge Inventory exposure
Supply Source
320D
6/3/2015
39
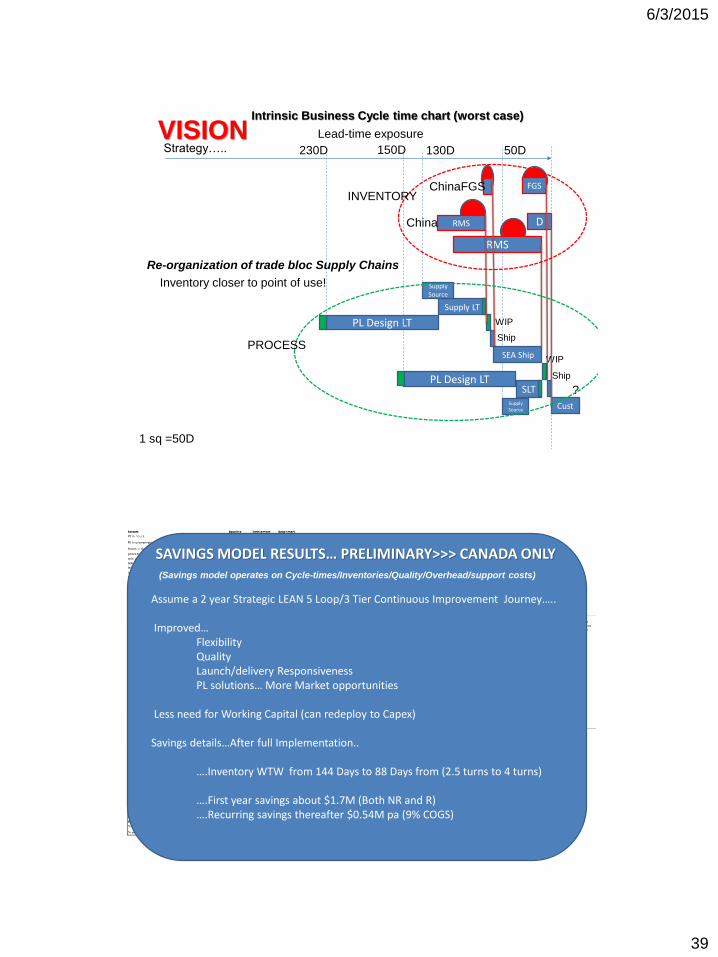
Cust
1 sq =50D
D
FGS
RMS
SLT
WIP
Ship
?
SEA Ship
Ship
FGS
WIP
RMS
Supply LT
Supply Source
PL Design LT
Intrinsic Business Cycle time chart (worst case)
Lead-time exposure
China
China
130D
Supply Source
50D
PL Design LT
150D230D
INVENTORY
PROCESS
VISIONStrategy…..
Re-organization of trade bloc Supply Chains
Inventory closer to point of use!
SAVINGS MODEL RESULTS… PRELIMINARY>>> CANADA ONLY
Assume a 2 year Strategic LEAN 5 Loop/3 Tier Continuous Improvement Journey…..
Improved…FlexibilityQualityLaunch/delivery ResponsivenessPL solutions… More Market opportunities
Less need for Working Capital (can redeploy to Capex)
Savings details…After full Implementation..
….Inventory WTW from 144 Days to 88 Days from (2.5 turns to 4 turns)
….First year savings about $1.7M (Both NR and R)….Recurring savings thereafter $0.54M pa (9% COGS)
(Savings model operates on Cycle-times/Inventories/Quality/Overhead/support costs)
6/3/2015
40
6/3/2015
41
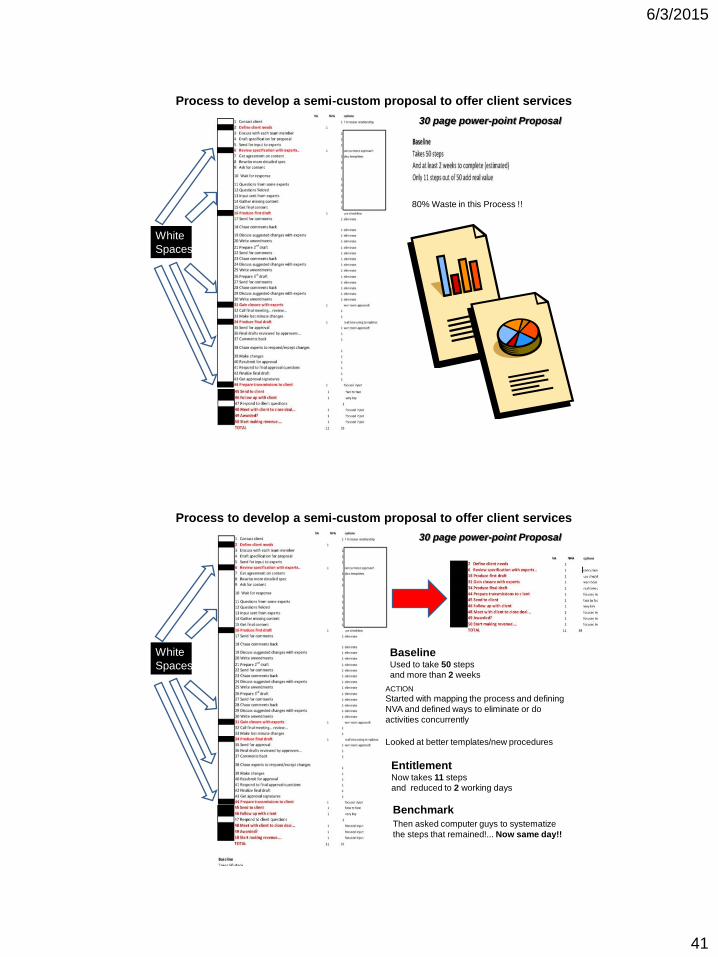
White
Spaces
80% Waste in this Process !!
Process to develop a semi-custom proposal to offer client services
30 page power-point Proposal
White
Spaces
Process to develop a semi-custom proposal to offer client services
ACTION
Started with mapping the process and defining
NVA and defined ways to eliminate or do
activities concurrently
Looked at better templates/new procedures
EntitlementNow takes 11 steps
and reduced to 2 working days
BaselineUsed to take 50 steps
and more than 2 weeks
Then asked computer guys to systematize
the steps that remained!... Now same day!!
Benchmark
30 page power-point Proposal

6/3/2015
42
OPERATING PRACTICE CHANGESPoint Meetings/Communication Problem solve/project identification Cross-train/morale.
PROCESS IMPROVEMENTSReliability (TPM, SPC, etc,)Flexibility (Changeover, multi-skill, etc. Capability (waste reduction)
Strategic Process ChangesPull system design (LINEAR PROCESS)Capacity/demand planning (DEMAND)Physical layout (ORGANIZATION)
TIER 1
TIER 3
TIER 2 STRATEGY
IMPROVEMENT
PRACTICES
1
2
3
LEAN BUSINESS ENVIRONMENT
NEXUS
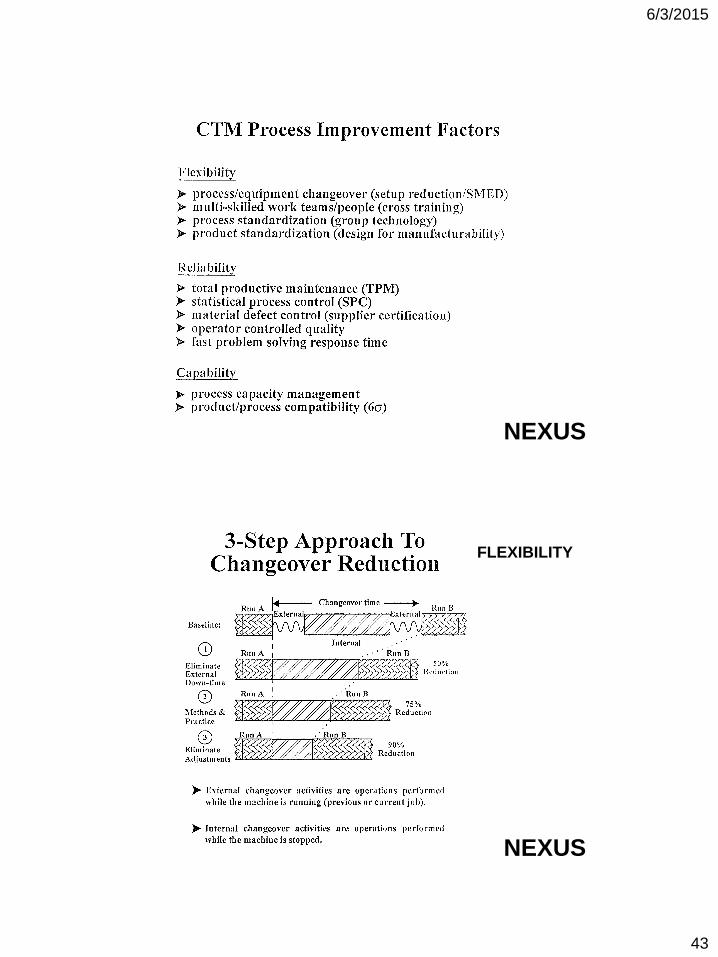
Reliability Flexibility Capability
Typical Process Step
(Performance Model)
Repair Rework
Non-Utilization (Wait) Time
Changeover/Time
Preventative Maintenance PM
Breakdown (Equipment/Process)
Flexibility
Reliability
Capability
Internal
Customer/s
Cycle Time
100%
Capacity
Internal
Supplier/s
Capacity
0%
Scrap Rejects
NEXUS
Value-Added Process TimeCan be only 10% of Total Capacity!!!
6/3/2015
43
NEXUS
NEXUS
FLEXIBILITY
6/3/2015
44
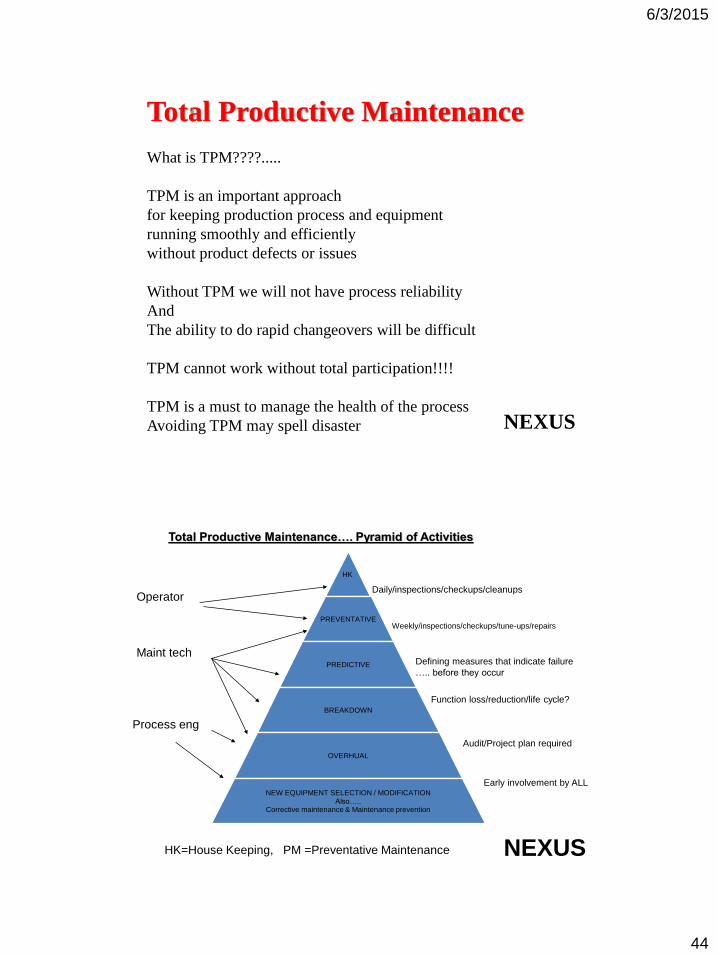
Total Productive Maintenance
What is TPM????.....
TPM is an important approach
for keeping production process and equipment
running smoothly and efficiently
without product defects or issues
Without TPM we will not have process reliability
And
The ability to do rapid changeovers will be difficult
TPM cannot work without total participation!!!!
TPM is a must to manage the health of the process
Avoiding TPM may spell disaster NEXUS
HK
PREVENTATIVE
PREDICTIVE
BREAKDOWN
OVERHUAL
NEW EQUIPMENT SELECTION / MODIFICATIONAlso…..
Corrective maintenance & Maintenance prevention
Total Productive Maintenance…. Pyramid of Activities
Defining measures that indicate failure
….. before they occur
OperatorDaily/inspections/checkups/cleanups
Weekly/inspections/checkups/tune-ups/repairs
Maint tech
Process eng
Function loss/reduction/life cycle?
Audit/Project plan required
Early involvement by ALL
HK=House Keeping, PM =Preventative Maintenance NEXUS
6/3/2015
45
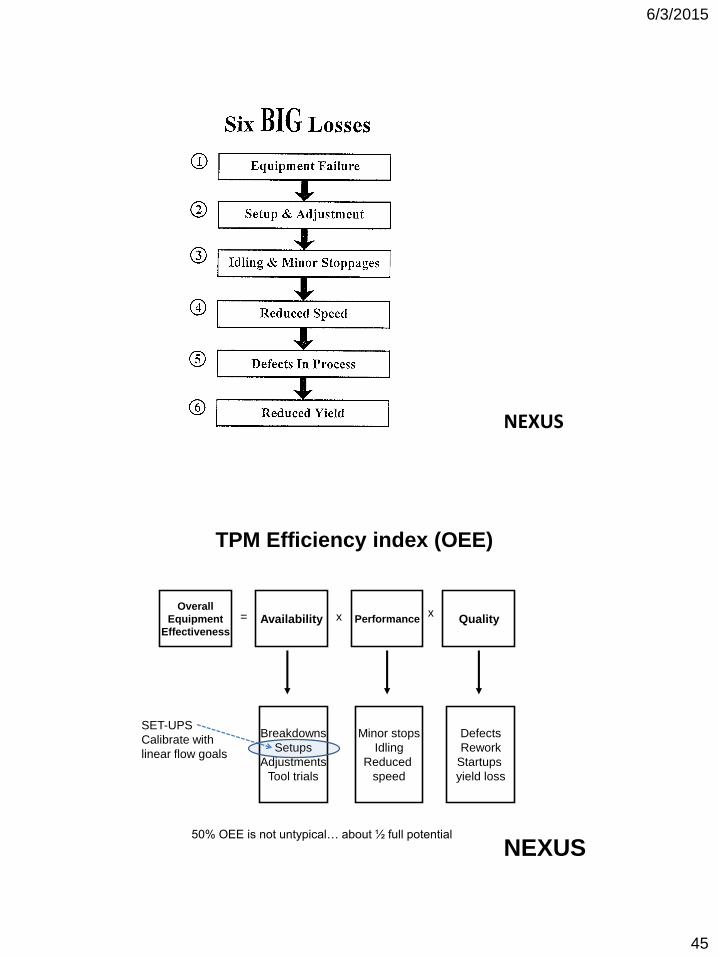
NEXUS
Overall
Equipment
Effectiveness
TPM Efficiency index (OEE)
Availability Performance Quality= x x
Breakdowns
Setups
Adjustments
Tool trials
Minor stops
Idling
Reduced
speed
Defects
Rework
Startups
yield loss
50% OEE is not untypical… about ½ full potential
NEXUS
SET-UPS
Calibrate with
linear flow goals
6/3/2015
46
OPERATING PRACTICE CHANGESPoint Meetings/Communication Problem solve/project identification Cross-train/morale.
PROCESS IMPROVEMENTSReliability (TPM, SPC, etc,)Flexibility (Changeover, multi-skill, etc. Capability (waste reduction)
Strategic Process ChangesPull system design (LINEAR PROCESS)Capacity/demand planning (DEMAND)Physical layout (ORGANIZATION)
TIER 1
TIER 3
TIER 2 STRATEGY
IMPROVEMENT
PRACTICES
1
2
3
LEAN BUSINESS ENVIRONMENT
NEXUS
How day-to-day Controls/Issues/ideas/improvements happen!
NEXUS
6/3/2015
47
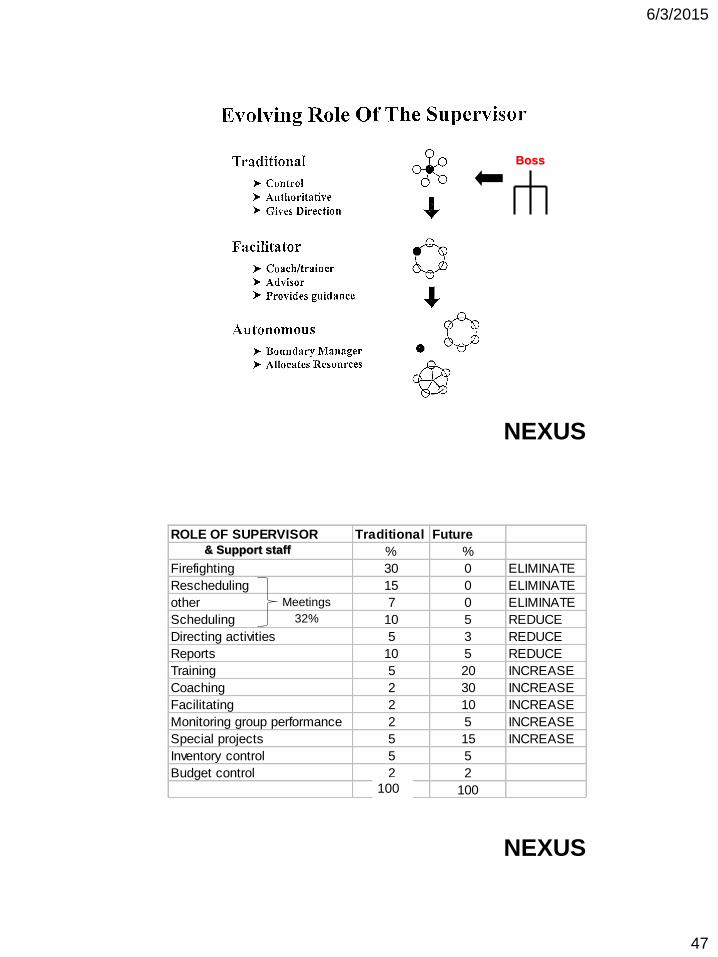
Boss
NEXUS
ROLE OF SUPERVISOR Traditional Future
% %
Firefighting 30 0 ELIMINATE
Rescheduling 15 0 ELIMINATE
other 7 0 ELIMINATE
Scheduling 10 5 REDUCE
Directing activities 5 3 REDUCE
Reports 10 5 REDUCE
Training 5 20 INCREASE
Coaching 2 30 INCREASE
Facilitating 2 10 INCREASE
Monitoring group performance 2 5 INCREASE
Special projects 5 15 INCREASE
Inventory control 5 5
Budget control 2 2
48 100
NEXUS
100
Meetings
32%
& Support staff
6/3/2015
48
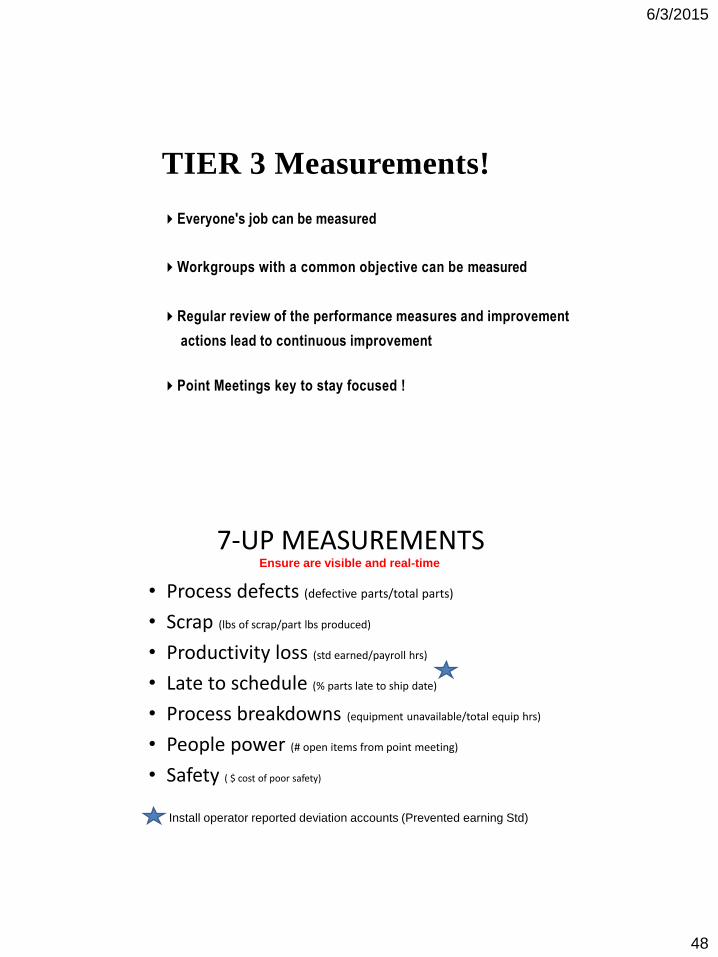
TIER 3 Measurements!
Everyone's job can be measured
Workgroups with a common objective can be measured
Regular review of the performance measures and improvement
actions lead to continuous improvement
Point Meetings key to stay focused !
7-UP MEASUREMENTS
• Process defects (defective parts/total parts)
• Scrap (lbs of scrap/part lbs produced)
• Productivity loss (std earned/payroll hrs)
• Late to schedule (% parts late to ship date)
• Process breakdowns (equipment unavailable/total equip hrs)
• People power (# open items from point meeting)
• Safety ( $ cost of poor safety)
Install operator reported deviation accounts (Prevented earning Std)
Ensure are visible and real-time
6/3/2015
49
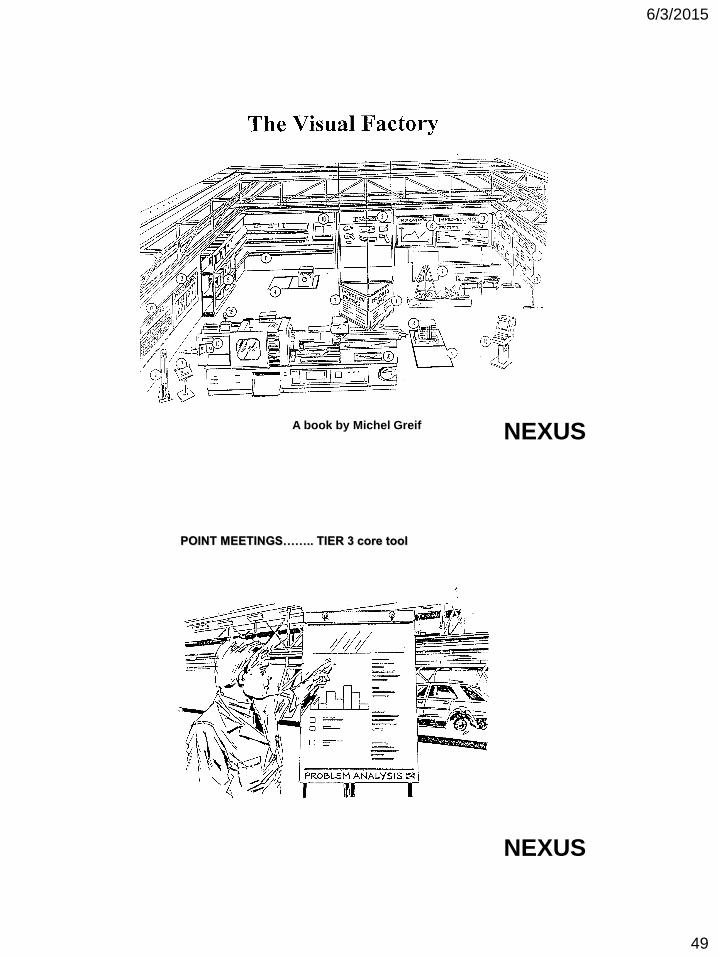
NEXUSA book by Michel Greif
POINT MEETINGS…….. TIER 3 core tool
NEXUS
6/3/2015
50
NEXUS
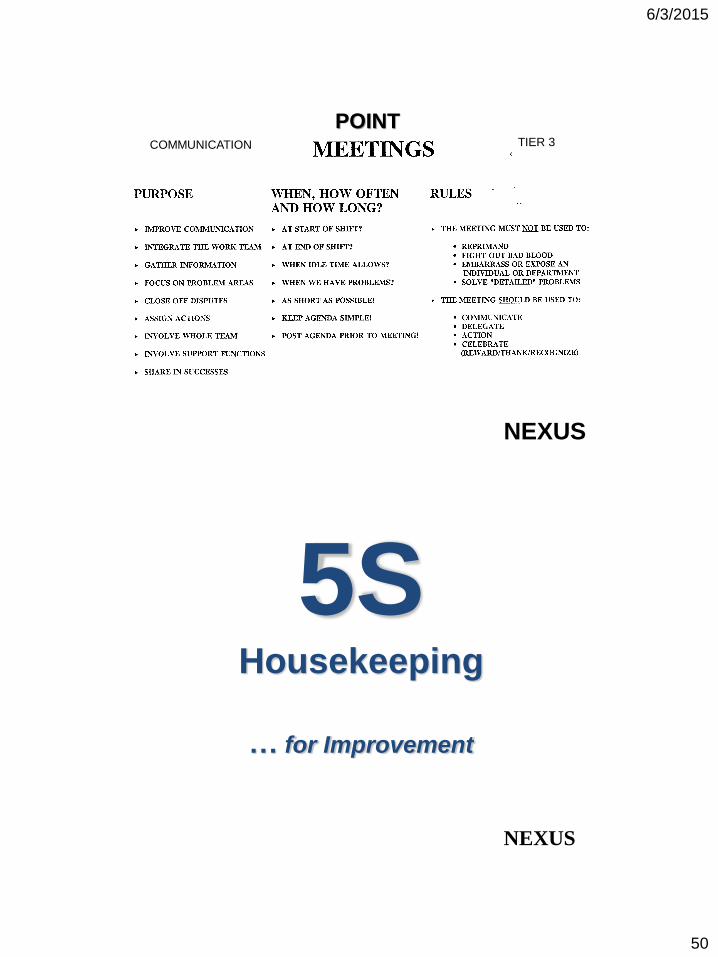
POINTCOMMUNICATION TIER 3
5SHousekeeping
… for Improvement
NEXUS
6/3/2015
51
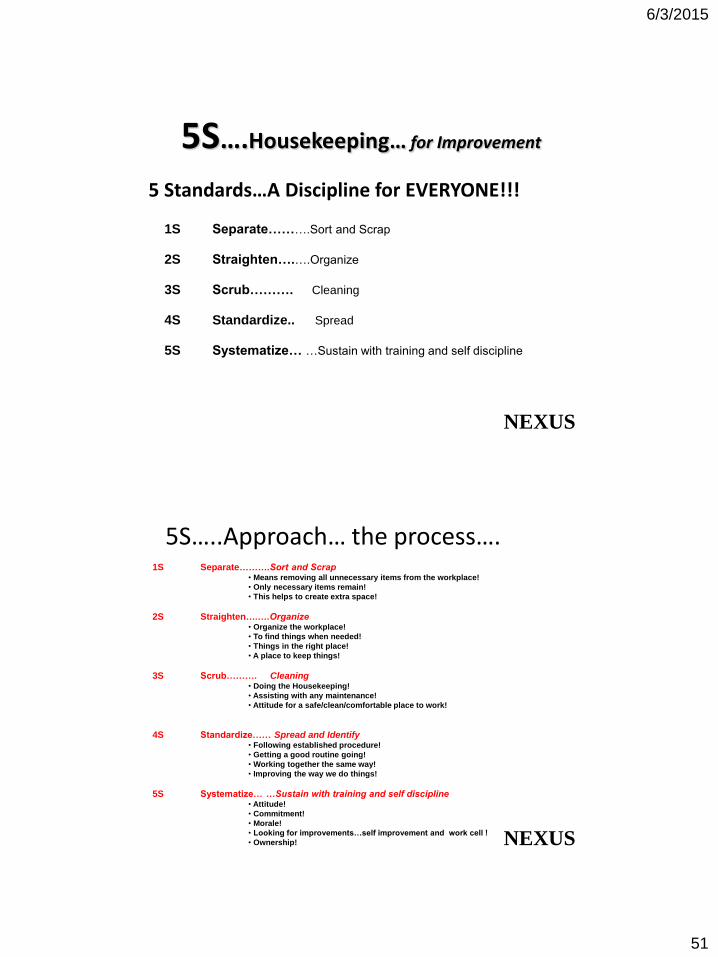
5S….Housekeeping… for Improvement
5 Standards…A Discipline for EVERYONE!!!
1S Separate……….Sort and Scrap
2S Straighten….….Organize
3S Scrub………. Cleaning
4S Standardize.. Spread
5S Systematize… …Sustain with training and self discipline
NEXUS
5S…..Approach… the process….1S Separate……….Sort and Scrap
• Means removing all unnecessary items from the workplace!
• Only necessary items remain!
• This helps to create extra space!
2S Straighten….….Organize• Organize the workplace!
• To find things when needed!
• Things in the right place!
• A place to keep things!
3S Scrub………. Cleaning• Doing the Housekeeping!
• Assisting with any maintenance!
• Attitude for a safe/clean/comfortable place to work!
4S Standardize…… Spread and Identify• Following established procedure!
• Getting a good routine going!
• Working together the same way!
• Improving the way we do things!
5S Systematize… …Sustain with training and self discipline• Attitude!
• Commitment!
• Morale!
• Looking for improvements…self improvement and work cell !
• Ownership! NEXUS
6/3/2015
52
NEXUS
NEXUS
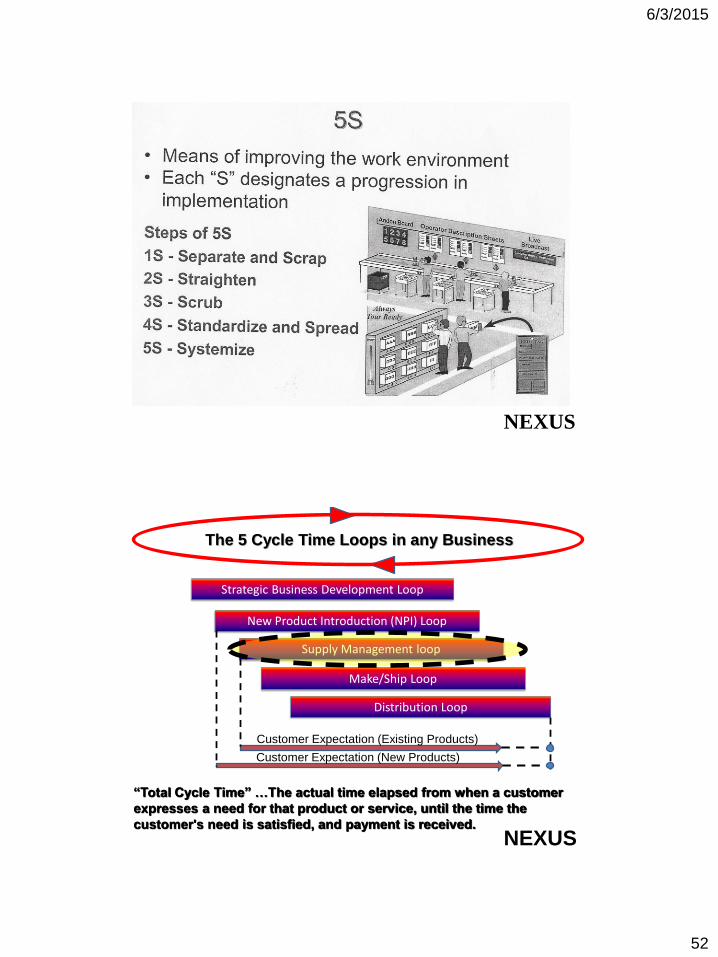
“Total Cycle Time” …The actual time elapsed from when a customer
expresses a need for that product or service, until the time the
customer's need is satisfied, and payment is received.
Strategic Business Development Loop
New Product Introduction (NPI) Loop
Supply Management loop
Make/Ship Loop
Distribution Loop
The 5 Cycle Time Loops in any Business
Customer Expectation (Existing Products)
Customer Expectation (New Products)

6/3/2015
53
SUPPLY
STRATEGY
NEXUS
Rationalize
Shorten
Partner
Ongoing…..
NEXUS
Supplier Certification
Supplier Partnering
(single source)
Supply base Rationalization
Close to point of Use / Customer
6/3/2015
54
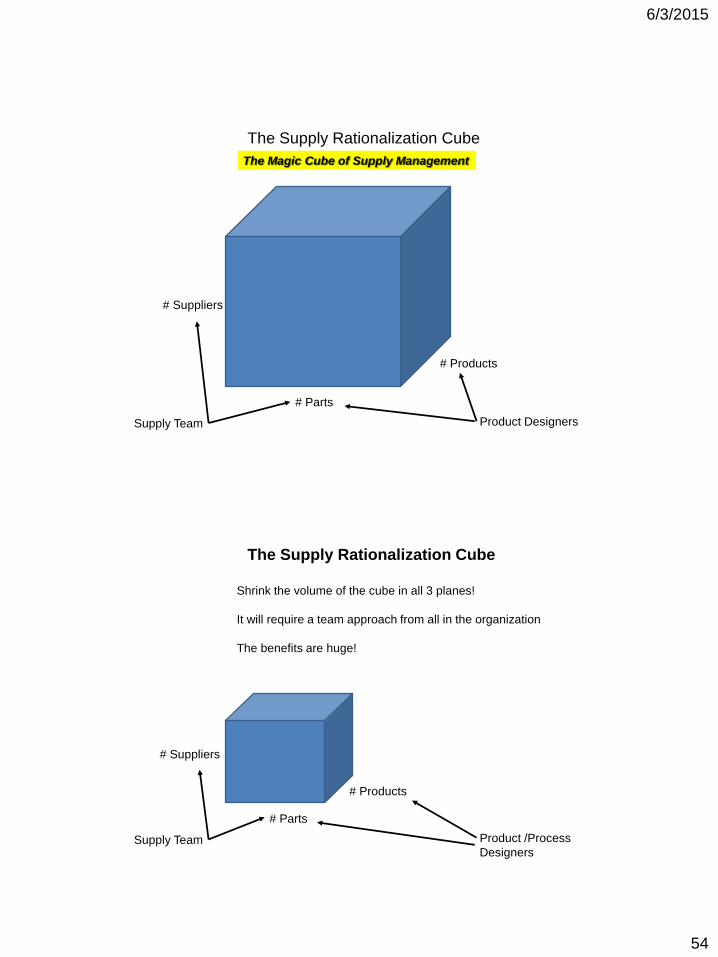
The Supply Rationalization Cube
# Suppliers
# Parts
# Products
Product DesignersSupply Team
The Magic Cube of Supply Management
The Supply Rationalization Cube
# Suppliers
# Parts
# Products
Product /Process
DesignersSupply Team
Shrink the volume of the cube in all 3 planes!
It will require a team approach from all in the organization
The benefits are huge!
6/3/2015
55
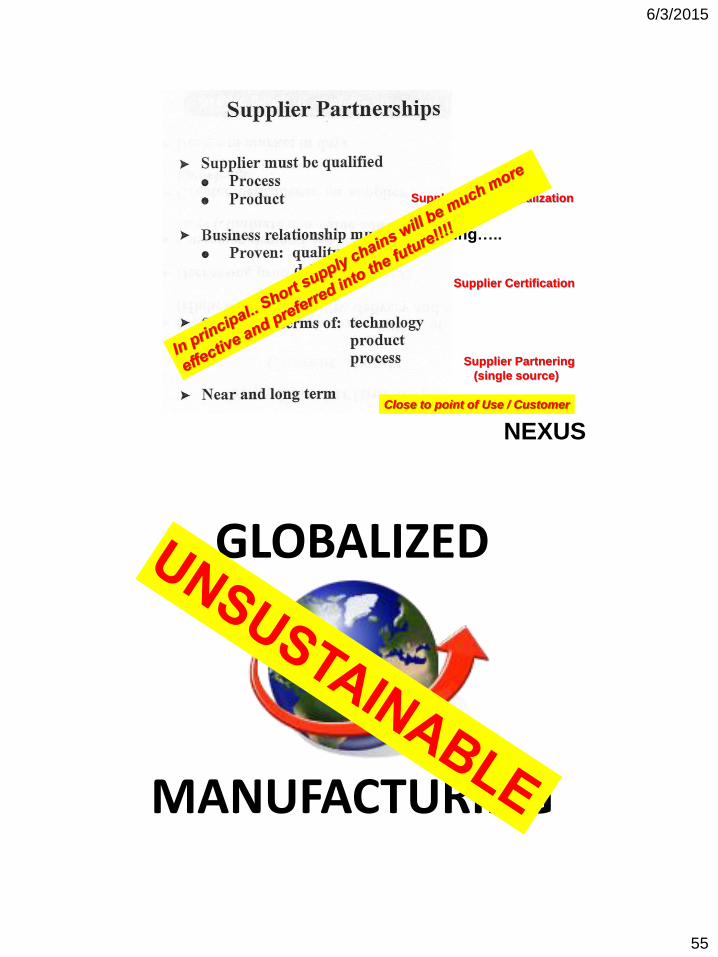
Ongoing…..
NEXUS
Supplier Certification
Supplier Partnering
(single source)
Supply base Rationalization
Close to point of Use / Customer
GLOBALIZED
MANUFACTURING
6/3/2015
56
LO
CA
L
BE
ST
OF
F-S
HO
RE
WO
RS
T O
FF
-SH
OR
E
?
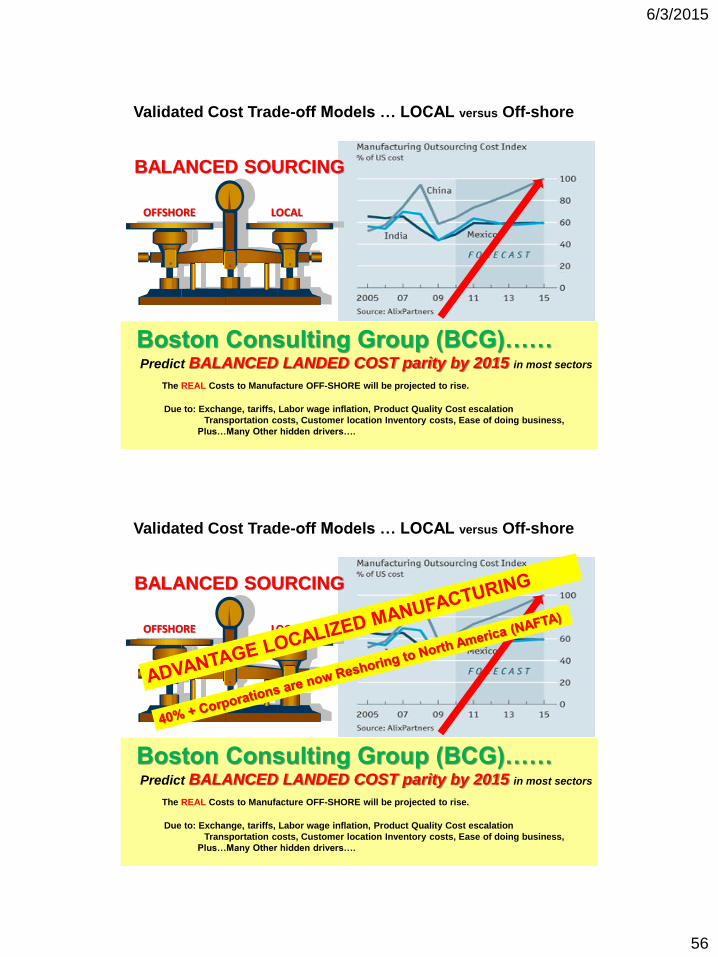
Boston Consulting Group (BCG)……Predict BALANCED LANDED COST parity by 2015 in most sectors
The REAL Costs to Manufacture OFF-SHORE will be projected to rise.
Due to: Exchange, tariffs, Labor wage inflation, Product Quality Cost escalation
Transportation costs, Customer location Inventory costs, Ease of doing business,
Plus…Many Other hidden drivers….
OFFSHORE LOCAL
BALANCED SOURCING
Validated Cost Trade-off Models … LOCAL versus Off-shore
LO
CA
L
BE
ST
OF
F-S
HO
RE
WO
RS
T O
FF
-SH
OR
E
?
Boston Consulting Group (BCG)……Predict BALANCED LANDED COST parity by 2015 in most sectors
The REAL Costs to Manufacture OFF-SHORE will be projected to rise.
Due to: Exchange, tariffs, Labor wage inflation, Product Quality Cost escalation
Transportation costs, Customer location Inventory costs, Ease of doing business,
Plus…Many Other hidden drivers….
OFFSHORE LOCAL
BALANCED SOURCING
Validated Cost Trade-off Models … LOCAL versus Off-shore
6/3/2015
57
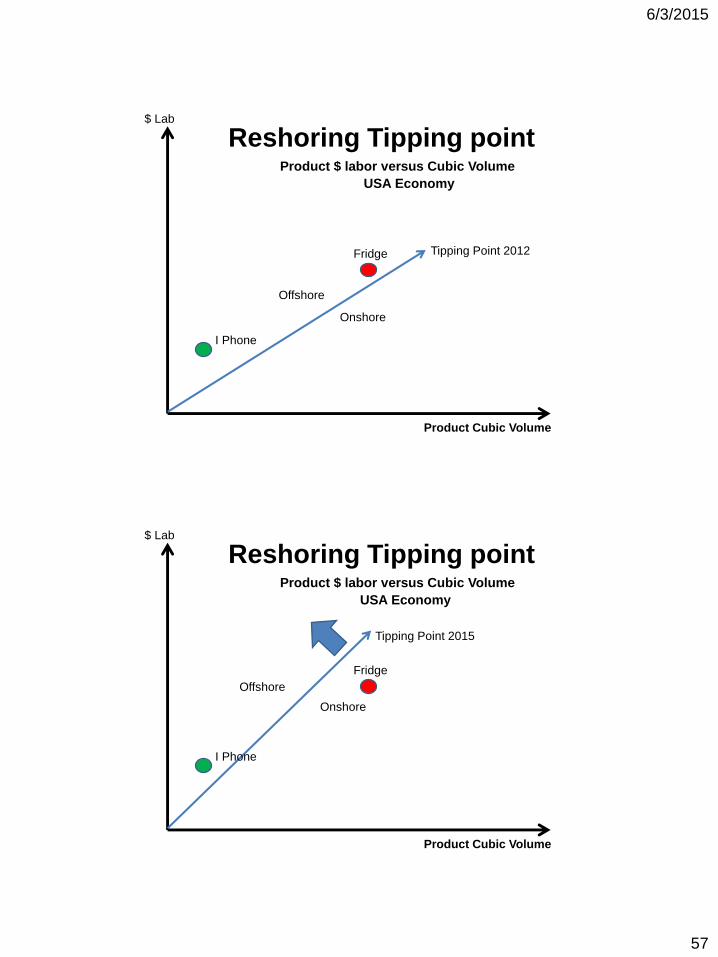
Reshoring Tipping pointProduct $ labor versus Cubic Volume
USA Economy
$ Lab
Product Cubic Volume
Offshore
Onshore
Tipping Point 2012
I Phone
Fridge
Reshoring Tipping pointProduct $ labor versus Cubic Volume
USA Economy
$ Lab
Product Cubic Volume
Offshore
Onshore
Tipping Point 2015
I Phone
Fridge
6/3/2015
58
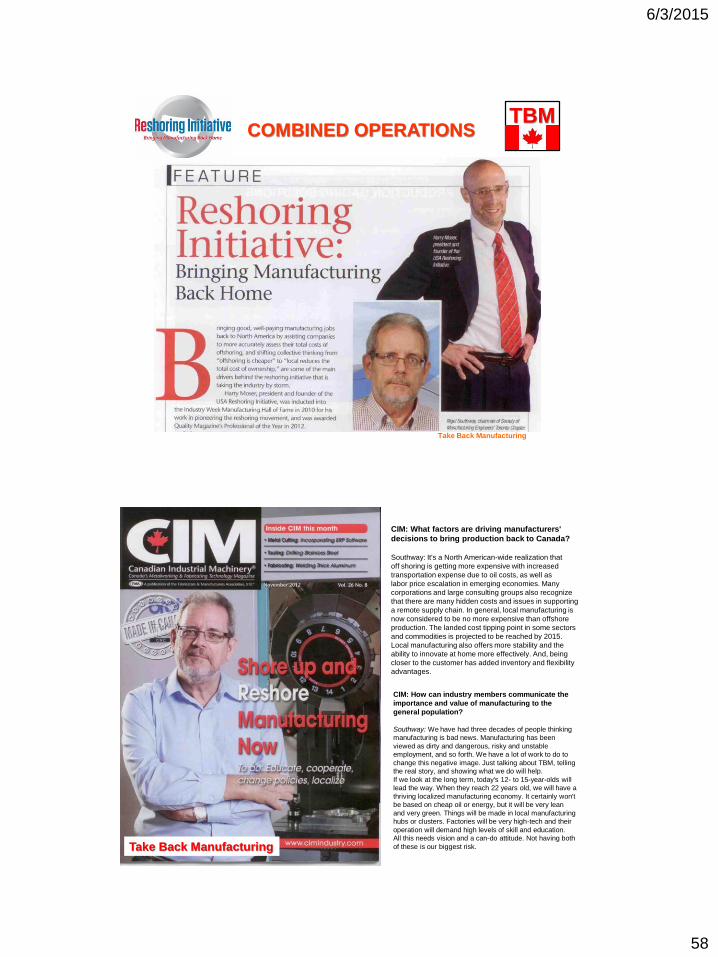
COMBINED OPERATIONS
Take Back Manufacturing
TBM
CIM: What factors are driving manufacturers'
decisions to bring production back to Canada?
Southway: It's a North American-wide realization that
off shoring is getting more expensive with increased
transportation expense due to oil costs, as well as
labor price escalation in emerging economies. Many
corporations and large consulting groups also recognize
that there are many hidden costs and issues in supporting
a remote supply chain. In general, local manufacturing is
now considered to be no more expensive than offshore
production. The landed cost tipping point in some sectors
and commodities is projected to be reached by 2015.
Local manufacturing also offers more stability and the
ability to innovate at home more effectively. And, being
closer to the customer has added inventory and flexibility
advantages.
CIM: How can industry members communicate the
importance and value of manufacturing to the
general population?
Southway: We have had three decades of people thinking
manufacturing is bad news. Manufacturing has been
viewed as dirty and dangerous, risky and unstable
employment, and so forth. We have a lot of work to do to
change this negative image. Just talking about TBM, telling
the real story, and showing what we do will help.
If we look at the long term, today's 12- to 15-year-olds will
lead the way. When they reach 22 years old, we will have a
thriving localized manufacturing economy. It certainly won't
be based on cheap oil or energy, but it will be very lean
and very green. Things will be made in local manufacturing
hubs or clusters. Factories will be very high-tech and their
operation will demand high levels of skill and education.
All this needs vision and a can-do attitude. Not having both
of these is our biggest risk.Take Back Manufacturing
6/3/2015
59
NEXUS
“Total Cycle Time” …The actual time elapsed from when a customer
expresses a need for that product or service, until the time the
customer's need is satisfied, and payment is received.
The 5 Cycle Time Loops in any Business
Strategic Business Development Loop
New Product Introduction (NPI) Loop
Supply Management loop
Make/Ship Loop
Distribution Loop
Customer Expectation (Existing Products)
Customer Expectation (New Products)
• Who is the customer?
• Must think holistically !
• From Vertical to Horizontal thinking
• The 5 Loops in the business
• Use the 5 Loops to provide focus
5 Business Loops
Ideas to Launch process…
N…P….INew
Product
Introduction
6/3/2015
60
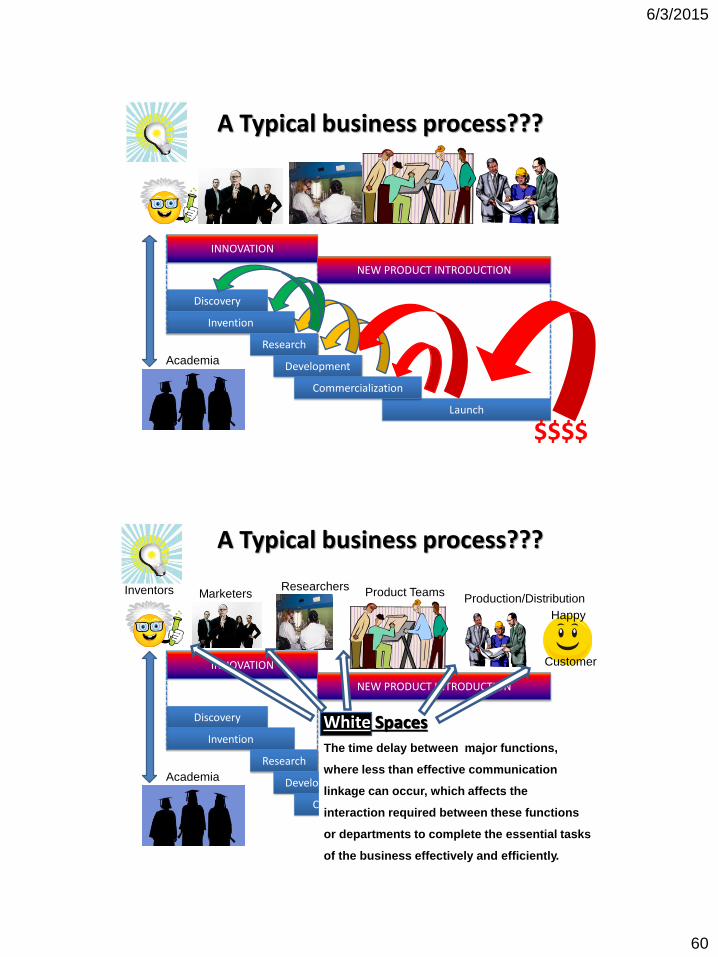
Discovery
Invention
Research
Development
Launch
Commercialization
INNOVATION
NEW PRODUCT INTRODUCTION
$$$$
Academia
A Typical business process???
Discovery
Invention
Research
Development
Launch
Commercialization
INNOVATION
NEW PRODUCT INTRODUCTION
$$$$
MarketersResearchers
Product TeamsProduction/Distribution
Happy
Customer
Academia
A Typical business process???
Inventors
White Spaces
The time delay between major functions,
where less than effective communication
linkage can occur, which affects the
interaction required between these functions
or departments to complete the essential tasks
of the business effectively and efficiently.
6/3/2015
61
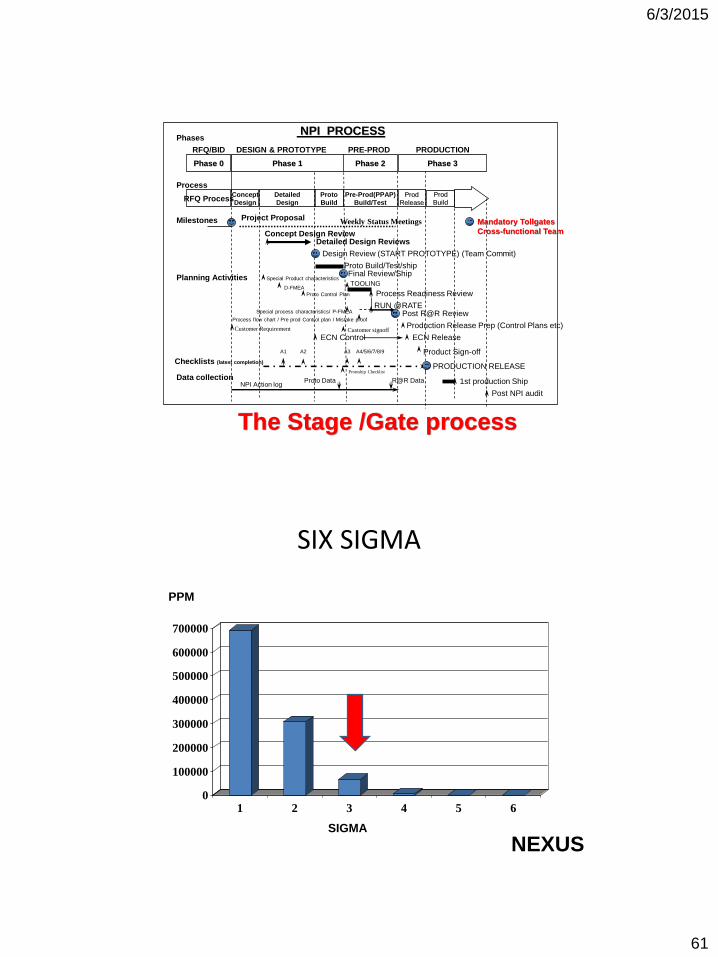
NPI PROCESS
Proto
Build
Prod
BuildProd
Release
Pre-Prod(PPAP)
Build/Test
Concept
Design
Detailed
DesignRFQ Process
Phase 0
Process
Phases
Phase 1 Phase 2 Phase 3
Milestones Project Proposal
Concept Design ReviewDetailed Design Reviews
Final Review/Ship
1st production Ship
Process Readiness Review
Special Product characteristics
D-FMEA
Proto Control Plan
Product Sign-off
ECN Release
Design Review (START PROTOTYPE) (Team Commit)
Post NPI audit
Weekly Status Meetings
Proto Build/Test/ship
TOOLING
Post R@R ReviewRUN @RATE
Production Release Prep (Control Plans etc)
PRODUCTION RELEASE
Planning Activities
A2
Checklists (latest completion)
A1 A3 A4/5/6/7/8/9
Data collection
Special process characteristics/ P-FMEA
Process flow chart / Pre prod Control plan / Mistake proof
Proto DataNPI Action log
R@R Data
RFQ/BID DESIGN & PROTOTYPE PRODUCTIONPRE-PROD
ECN Control
Mandatory Tollgates
Cross-functional Team
Customer Requirement Customer signoff
Protoship Checklist
The Stage /Gate process
SIX SIGMA
PPM
SIGMA
0
100000
200000
300000
400000
500000
600000
700000
1 2 3 4 5 6
NEXUS
6/3/2015
62
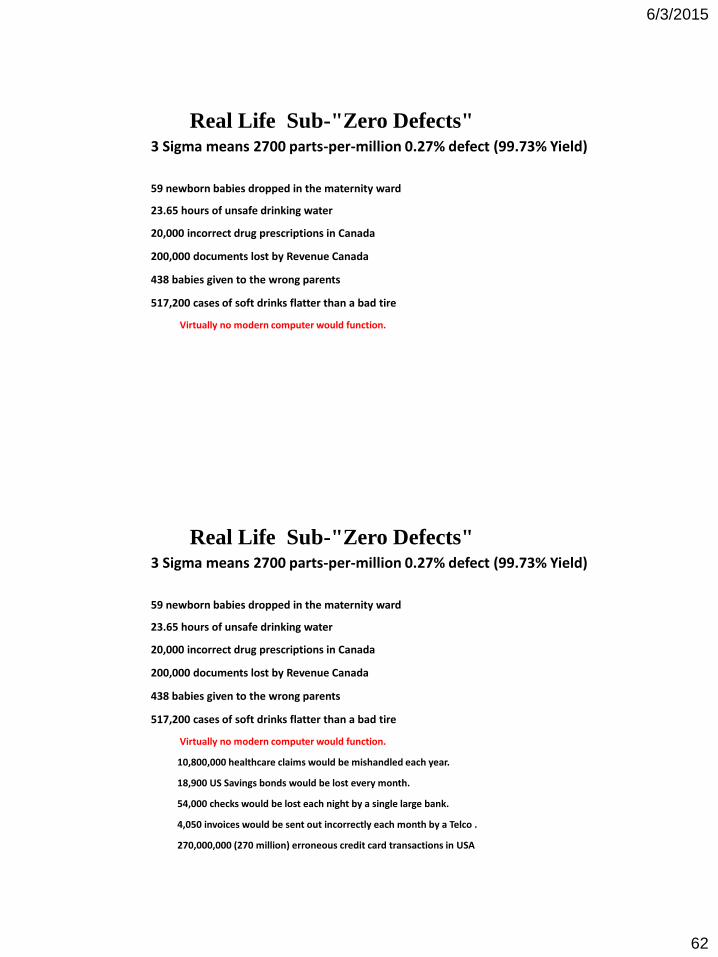
3 Sigma means 2700 parts-per-million 0.27% defect (99.73% Yield)
59 newborn babies dropped in the maternity ward
23.65 hours of unsafe drinking water
20,000 incorrect drug prescriptions in Canada
200,000 documents lost by Revenue Canada
438 babies given to the wrong parents
517,200 cases of soft drinks flatter than a bad tire
Virtually no modern computer would function.
10,800,000 healthcare claims would be mishandled each year.
18,900 US Savings bonds would be lost every month.
54,000 checks would be lost each night by a single large bank.
4,050 invoices would be sent out incorrectly each month by a Telco .
270,000,000 (270 million) erroneous credit card transactions in USA
NEXUS
Real Life Sub-"Zero Defects"
6/3/2015
63
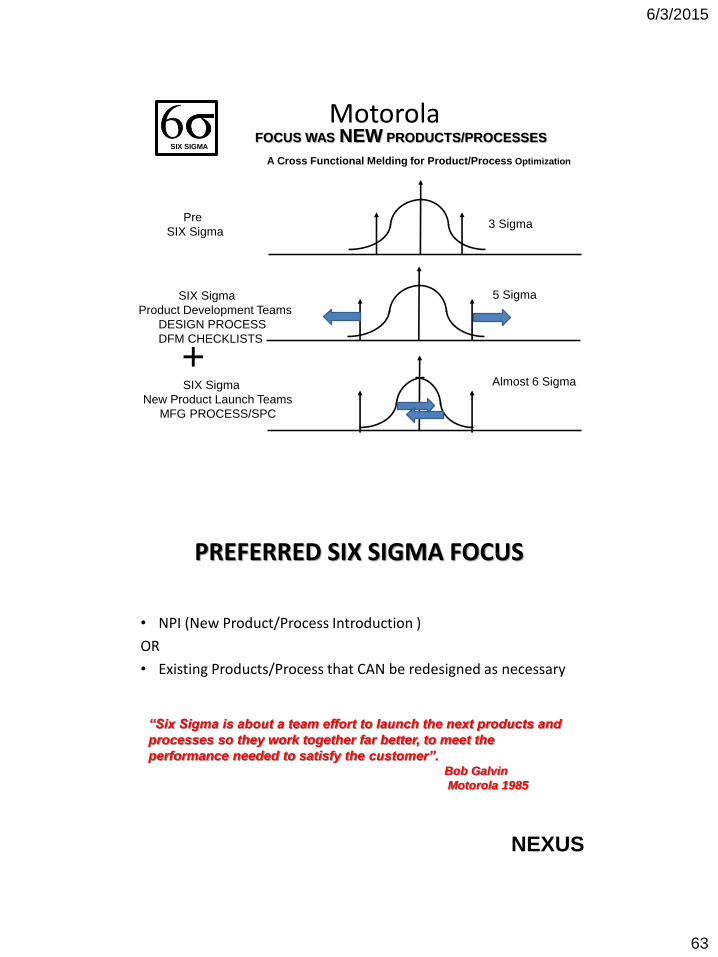
Motorola
3 Sigma
SIX Sigma
Product Development Teams
DESIGN PROCESS
DFM CHECKLISTS
Pre
SIX Sigma
SIX SIGMA
5 Sigma
Almost 6 SigmaSIX Sigma
New Product Launch Teams
MFG PROCESS/SPC
FOCUS WAS NEW PRODUCTS/PROCESSES
A Cross Functional Melding for Product/Process Optimization
+
PREFERRED SIX SIGMA FOCUS
• NPI (New Product/Process Introduction )
OR
• Existing Products/Process that CAN be redesigned as necessary
NEXUS
“Six Sigma is about a team effort to launch the next products and
processes so they work together far better, to meet the
performance needed to satisfy the customer”.Bob Galvin
Motorola 1985
6/3/2015
64
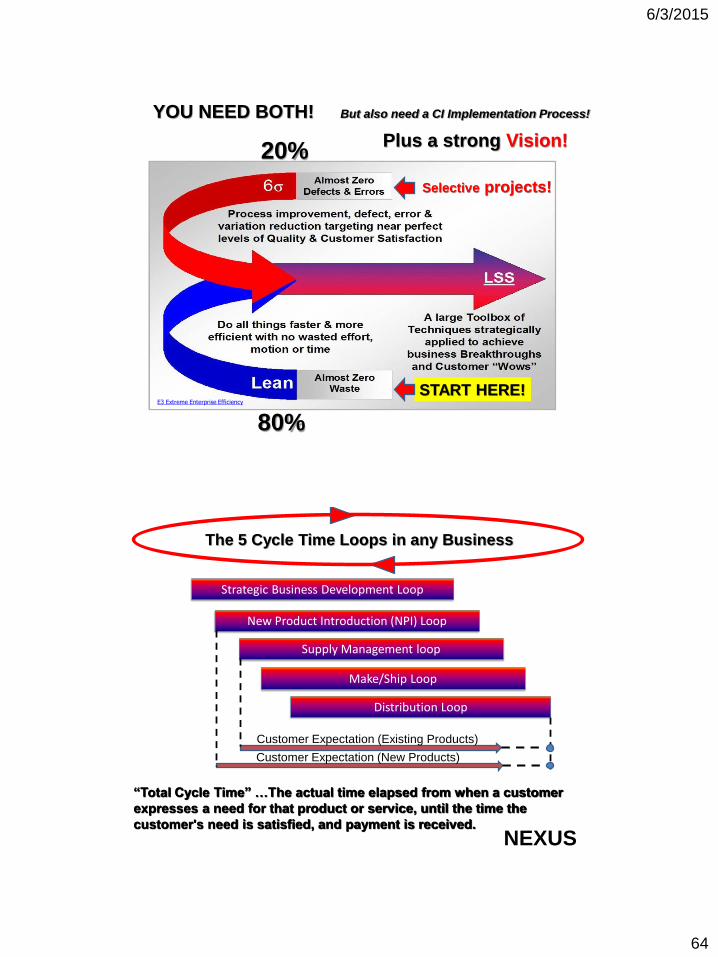
YOU NEED BOTH!
80%
20%
But also need a CI Implementation Process!
START HERE!
Selective projects!
Plus a strong Vision!
E3 Extreme Enterprise Efficiency
NEXUS
“Total Cycle Time” …The actual time elapsed from when a customer
expresses a need for that product or service, until the time the
customer's need is satisfied, and payment is received.
Strategic Business Development Loop
New Product Introduction (NPI) Loop
Supply Management loop
Make/Ship Loop
Distribution Loop
The 5 Cycle Time Loops in any Business
Customer Expectation (Existing Products)
Customer Expectation (New Products)
6/3/2015
65
Continuous Improvement (LEAN)
IMPLEMENTATION
NEXUS
What does LEAN Implementation mean?.....
• A change in business thinking & practices
• It is not a technology you can buy turn-key
• You need an implementation framework
• You need support for education and training
• You need commitment, vision and coordination
130 NEXUS
A little bit of Threat helps!
6/3/2015
66
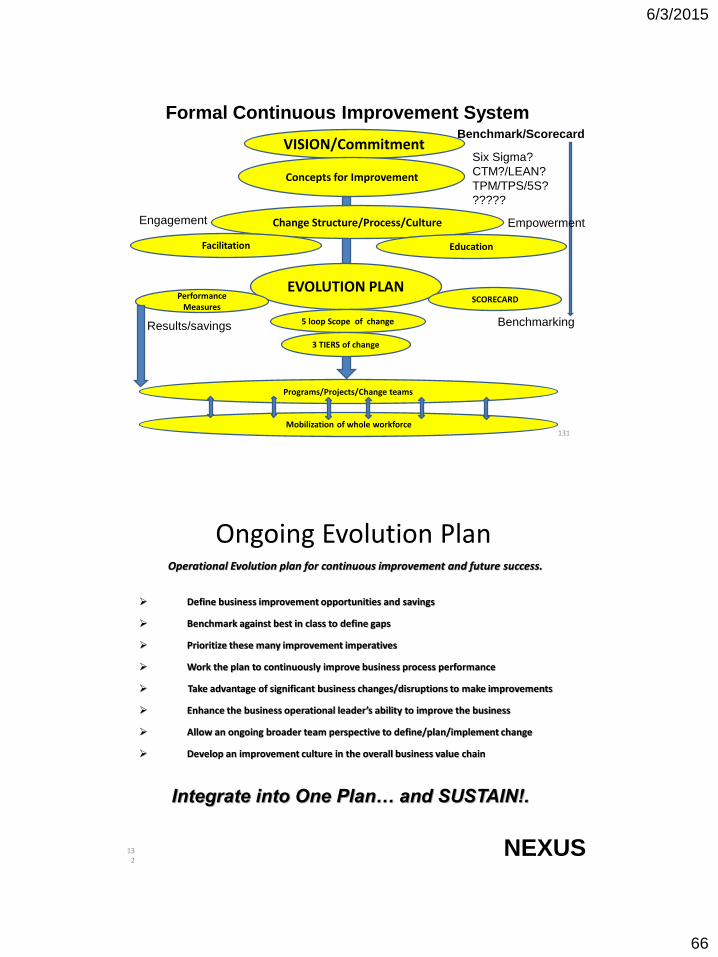
131
VISION/Commitment
Formal Continuous Improvement System
Concepts for Improvement
Change Structure/Process/Culture
Facilitation Education
EVOLUTION PLAN
5 loop Scope of change
3 TIERS of change
SCORECARDPerformance Measures
Programs/Projects/Change teams
Mobilization of whole workforce
Six Sigma?
CTM?/LEAN?
TPM/TPS/5S?
?????
BenchmarkingResults/savings
Engagement
Benchmark/Scorecard
Empowerment
Ongoing Evolution Plan Operational Evolution plan for continuous improvement and future success.
Define business improvement opportunities and savings
Benchmark against best in class to define gaps
Prioritize these many improvement imperatives
Work the plan to continuously improve business process performance
Take advantage of significant business changes/disruptions to make improvements
Enhance the business operational leader’s ability to improve the business
Allow an ongoing broader team perspective to define/plan/implement change
Develop an improvement culture in the overall business value chain
132
NEXUS
Integrate into One Plan… and SUSTAIN!.

6/3/2015
67
Continuous Improvement (LEAN)
IMPLEMENTATION
NEXUS
Benchmarking…. Are you ready?
Benchmark your LEAN journey
THE SCORE CARD
LEAN
CERTIFICATION
Available to SME
Chapter Members
6/3/2015
68
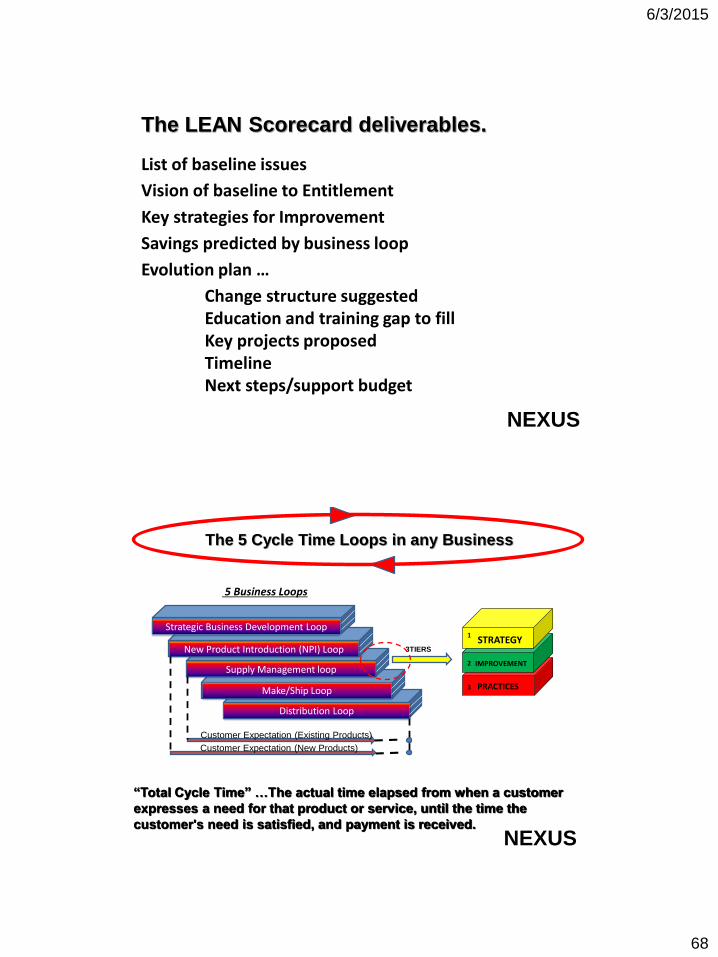
The LEAN Scorecard deliverables.
List of baseline issues
Vision of baseline to Entitlement
Key strategies for Improvement
Savings predicted by business loop
Evolution plan …
Change structure suggestedEducation and training gap to fill Key projects proposedTimelineNext steps/support budget
NEXUS
NEXUS
“Total Cycle Time” …The actual time elapsed from when a customer
expresses a need for that product or service, until the time the
customer's need is satisfied, and payment is received.
The 5 Cycle Time Loops in any Business
Strategic Business Development Loop
New Product Introduction (NPI) Loop
Supply Management loop
Make/Ship Loop
Distribution Loop
Customer Expectation (Existing Products)
Customer Expectation (New Products)
5 Business Loops
3TIERSSTRATEGY
IMPROVEMENT
PRACTICES
1
2
3
6/3/2015
69
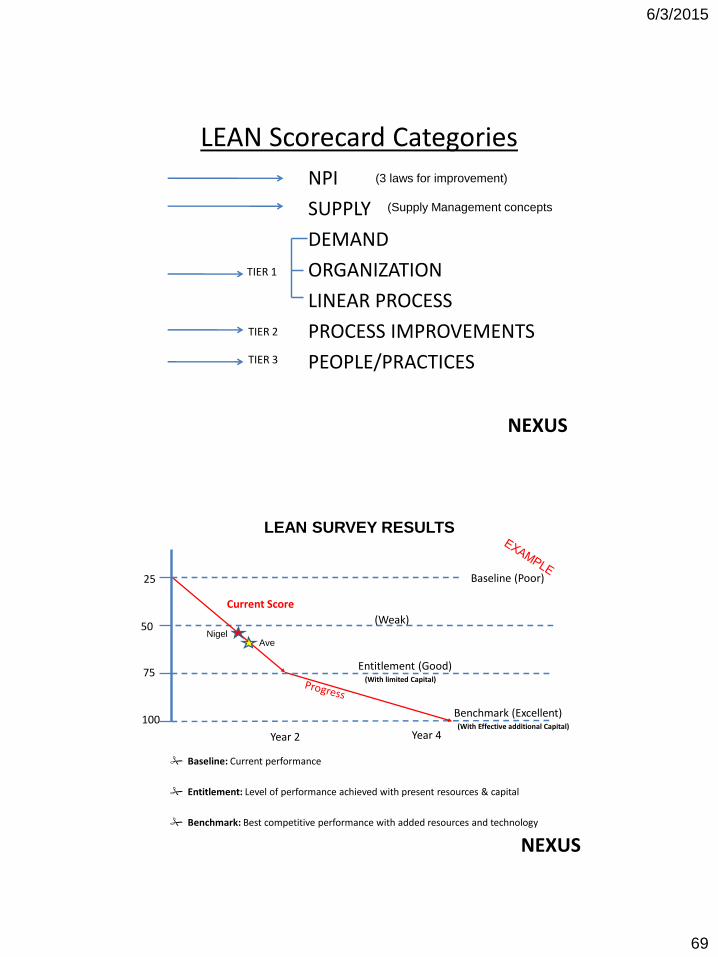
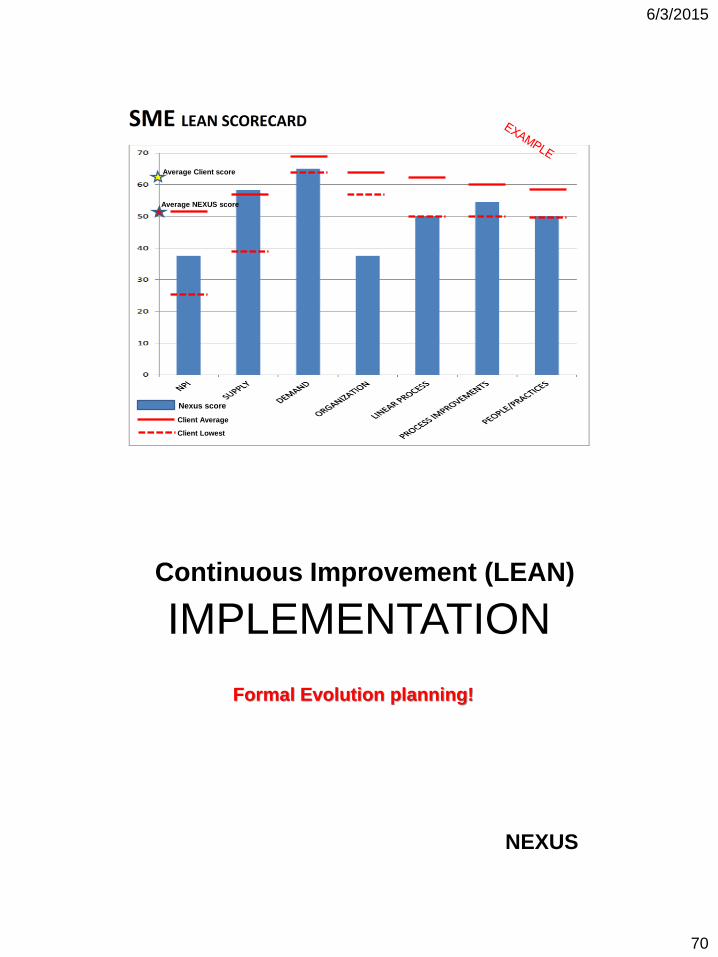
LEAN Scorecard Categories
NPI
SUPPLY
DEMAND
ORGANIZATION
LINEAR PROCESS
PROCESS IMPROVEMENTS
PEOPLE/PRACTICES
TIER 1
TIER 2
TIER 3
NEXUS
(3 laws for improvement)
(Supply Management concepts
LEAN SURVEY RESULTS
25
75
50
Entitlement (Good)
Baseline (Poor)
(Weak)
Benchmark (Excellent)
(With limited Capital)
(With Effective additional Capital)
Current Score
Year 2 Year 4
NEXUS
100
Baseline: Current performance
Entitlement: Level of performance achieved with present resources & capital
Benchmark: Best competitive performance with added resources and technology
AveNigel
6/3/2015
70
Average Client score
Average NEXUS score
Nexus score
Client Average
Client Lowest
Continuous Improvement (LEAN)
IMPLEMENTATION
NEXUS
Formal Evolution planning!

6/3/2015
71
141
VISION/Commitment
Formal Continuous Improvement System
Concepts for Improvement
Change Structure/Process/Culture
Facilitation Education
EVOLUTION PLAN
5 loop Scope of change
3 TIERS of change
SCORECARDPerformance Measures
Programs/Projects/Change teams
Mobilization of whole workforce
Six Sigma?
CTM?/LEAN?
TPM/TPS/5S?
?????
BenchmarkingResults/savings
Engagement
Benchmark/Scorecard
Empowerment
VISIONBaseline to Entitlement
The essential extra special skill set
Must Shift Paradigms
Create Emotional Tension
Manage and Measure!
6/3/2015
72
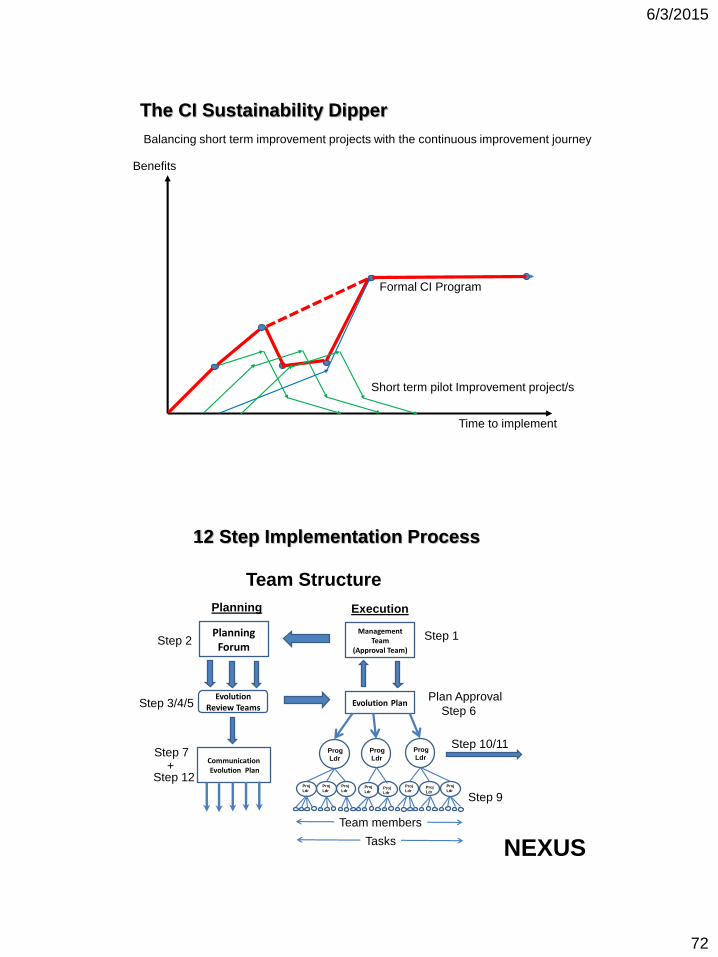
Balancing short term improvement projects with the continuous improvement journey
The CI Sustainability Dipper
Formal CI Program
Time to implement
Benefits
Short term pilot Improvement project/s
PlanningForum
Management Team
(Approval Team)
Evolution Review Teams
Evolution Plan
Communication Evolution Plan
Planning Execution
Proj
Ldr
Prog
Ldr
Prog
Ldr
Prog
Ldr
Proj
Ldr
Proj
LdrProj
LdrProj
Ldr
Proj
LdrProj
Ldr
Proj
Ldr
12 Step Implementation Process
Step 2
Step 3/4/5
Step 1
Step 7
Step 12+
Plan Approval
Step 6
Team members
Tasks
Step 10/11
Step 9
Team Structure
NEXUS
6/3/2015
73
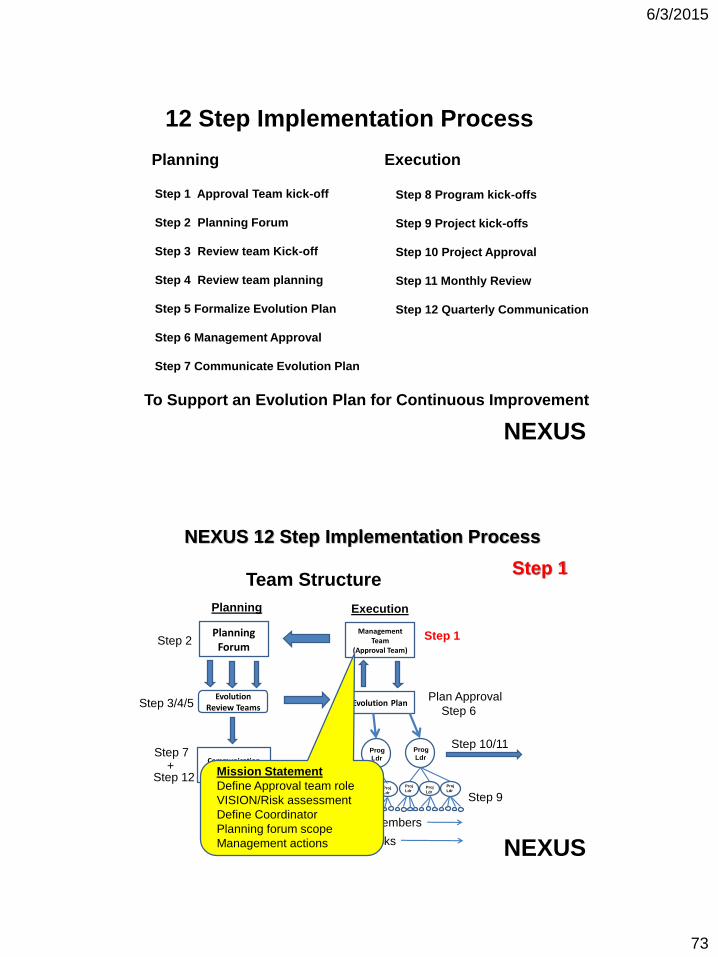
Step 1 Approval Team kick-off
Step 2 Planning Forum
Step 3 Review team Kick-off
Step 4 Review team planning
Step 5 Formalize Evolution Plan
Step 6 Management Approval
Step 7 Communicate Evolution Plan
Step 8 Program kick-offs
Step 9 Project kick-offs
Step 10 Project Approval
Step 11 Monthly Review
Step 12 Quarterly Communication
12 Step Implementation Process
Planning Execution
To Support an Evolution Plan for Continuous Improvement
NEXUS
PlanningForum
Management Team
(Approval Team)
Evolution Review Teams
Evolution Plan
Communication Evolution Plan
Planning Execution
Proj
Ldr
Prog
Ldr
Prog
Ldr
Prog
Ldr
Proj
Ldr
Proj
LdrProj
LdrProj
Ldr
Proj
LdrProj
Ldr
Proj
Ldr
NEXUS 12 Step Implementation Process
Step 2
Step 3/4/5
Step 1
Step 7
Step 12+
Plan Approval
Step 6
Team members
Tasks
Step 10/11
Step 9
Team Structure
Mission Statement
Define Approval team role
VISION/Risk assessment
Define Coordinator
Planning forum scope
Management actions
Step 1
NEXUS
6/3/2015
74
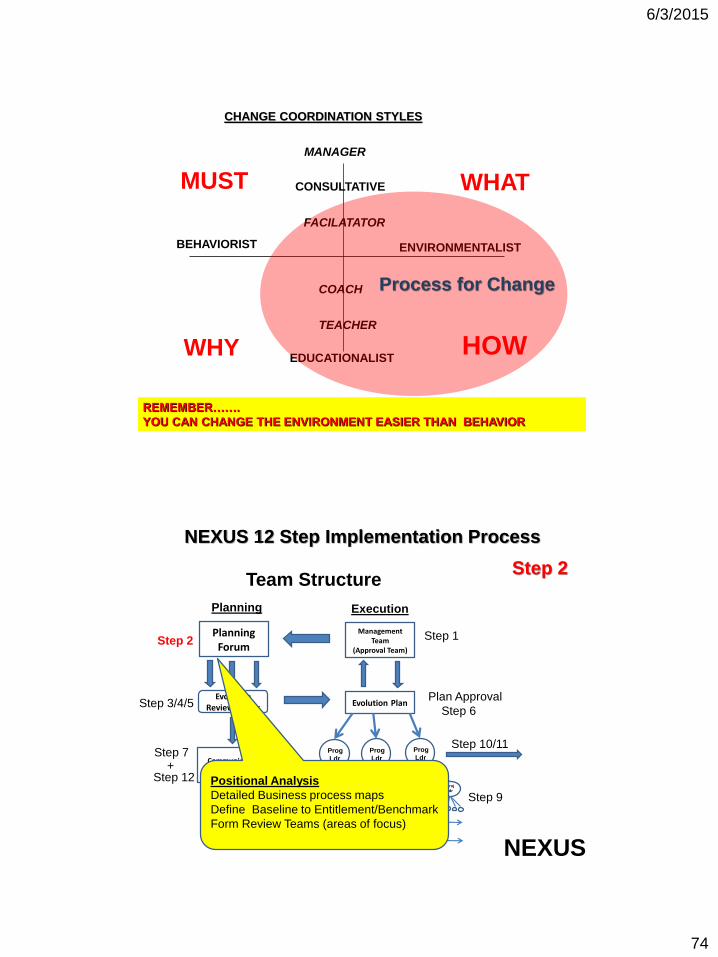
BEHAVIORIST
FACILATATOR
COACH
CONSULTATIVE
MANAGER
EDUCATIONALIST
ENVIRONMENTALIST
CHANGE COORDINATION STYLES
TEACHER
HOWWHY
WHATMUST
REMEMBER…….
YOU CAN CHANGE THE ENVIRONMENT EASIER THAN BEHAVIOR
Process for Change
PlanningForum
Management Team
(Approval Team)
Evolution Review Teams
Evolution Plan
Communication Evolution Plan
Planning Execution
Proj
Ldr
Prog
Ldr
Prog
Ldr
Prog
Ldr
Proj
Ldr
Proj
LdrProj
LdrProj
Ldr
Proj
LdrProj
Ldr
Proj
Ldr
NEXUS 12 Step Implementation Process
Step 2
Step 3/4/5
Step 1
Step 7
Step 12+
Plan Approval
Step 6
Team members
Tasks
Step 10/11
Step 9
Team Structure
Positional Analysis
Detailed Business process maps
Define Baseline to Entitlement/Benchmark
Form Review Teams (areas of focus)
Step 2
NEXUS
6/3/2015
75
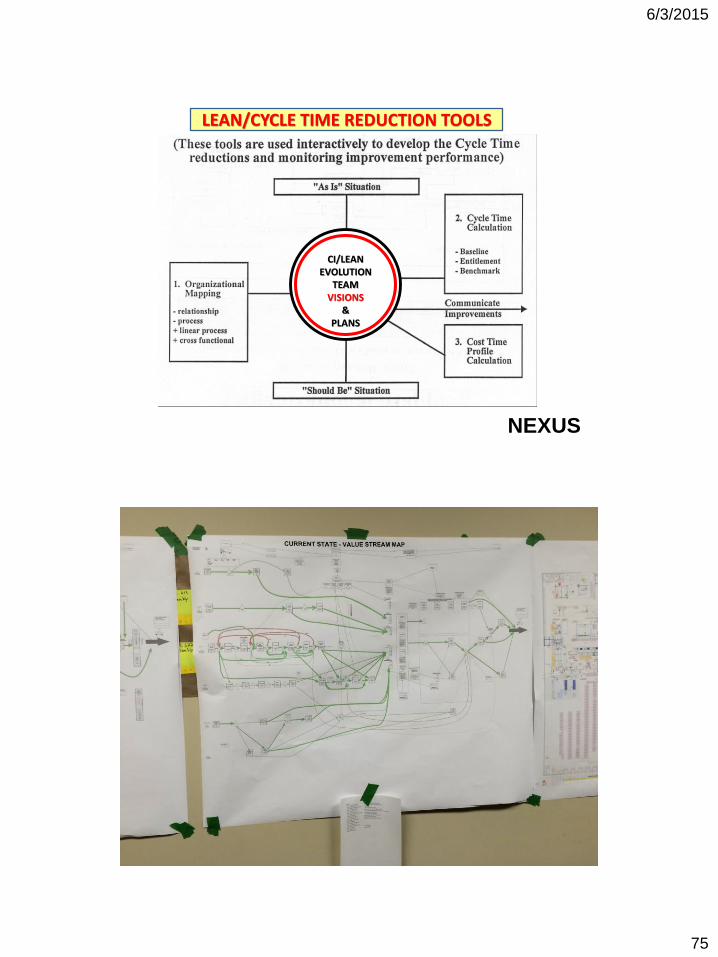
NEXUS
LEAN/CYCLE TIME REDUCTION TOOLS
CI/LEANEVOLUTION
TEAMVISIONS
&PLANS
150
6/3/2015
76
151
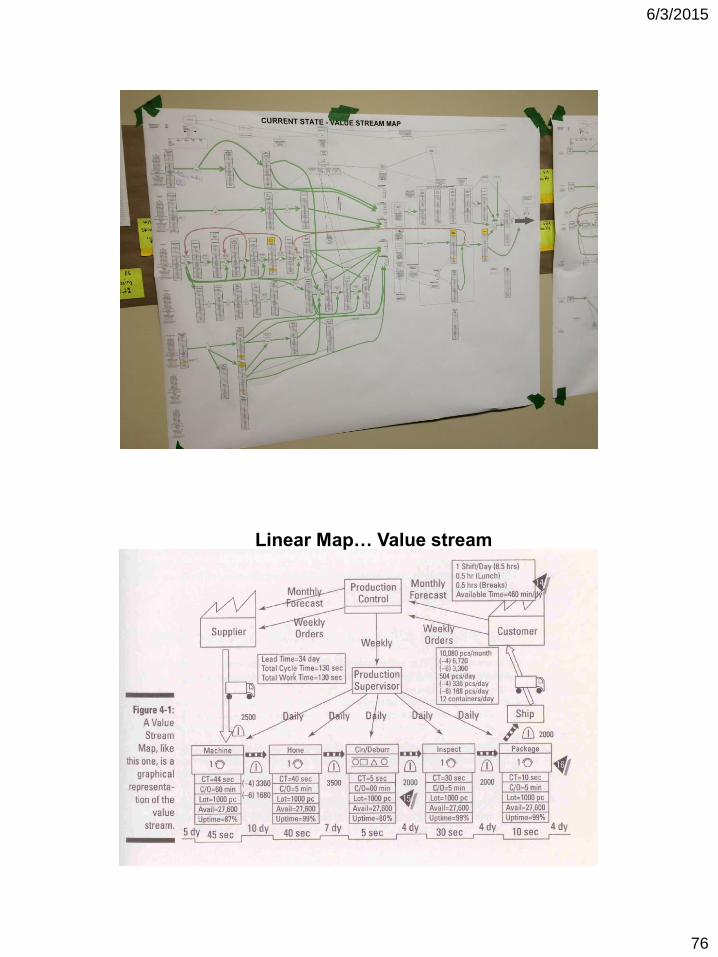
Linear Map… Value stream
6/3/2015
77
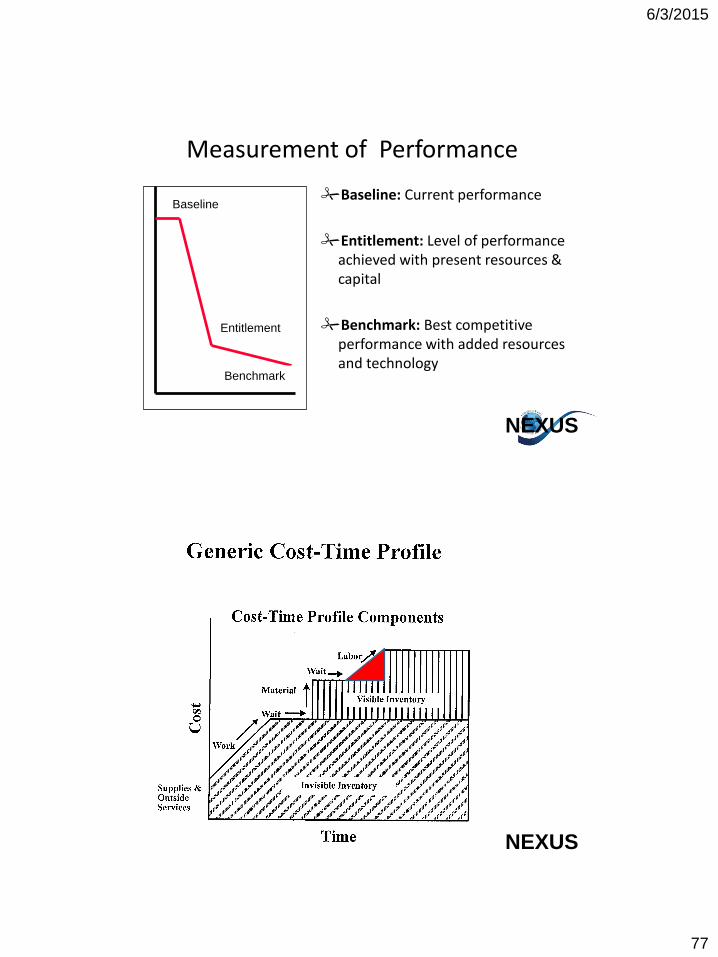
Measurement of Performance
Entitlement
Baseline
Benchmark
Baseline: Current performance
Entitlement: Level of performance achieved with present resources & capital
Benchmark: Best competitive performance with added resources and technology
NEXUS
NEXUS
6/3/2015
78
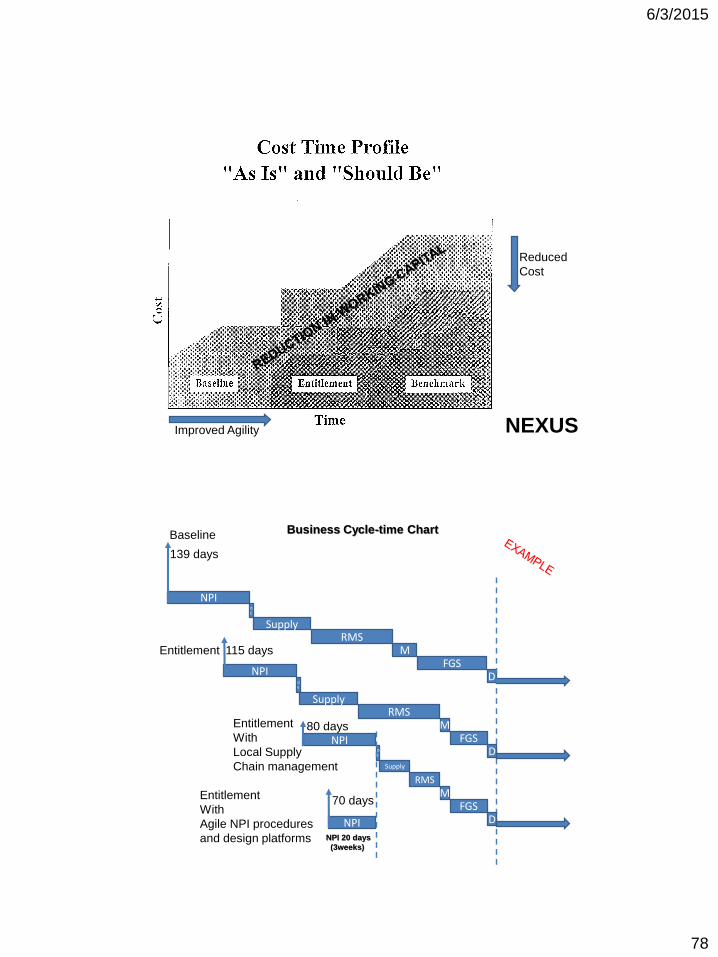
NEXUS
Reduced
Cost
Improved Agility
OE
NPI
Supply RMS
M
DFGS
Business Cycle-time Chart
OE
NPI
Supply RMS
M
DFGS
139 days
115 days
OE
NPI
Supply
RMS
M
DFGS
80 days
Baseline
Entitlement
Entitlement
With
Local Supply
Chain management
NPI
70 days
NPI 20 days
(3weeks)
Entitlement
With
Agile NPI procedures
and design platforms
6/3/2015
79
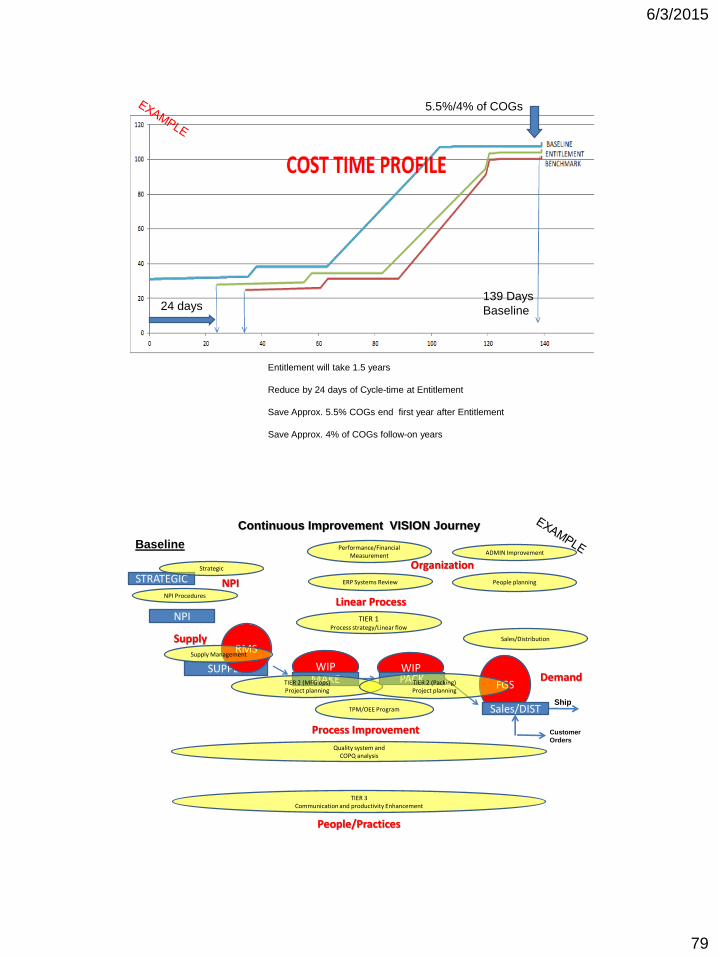
Entitlement will take 1.5 years
Reduce by 24 days of Cycle-time at Entitlement
Save Approx. 5.5% COGs end first year after Entitlement
Save Approx. 4% of COGs follow-on years
24 days
5.5%/4% of COGs
139 Days
Baseline
SUPPLY
FGS
WIP
STRATEGIC
NPI
Sales/DIST
PACKWIP
MAKE
RMS
Customer
Orders
Ship
Continuous Improvement VISION Journey
Baseline
TIER 1 Process strategy/Linear flow
TIER 2 (MFG ops)Project planning
Performance/Financial Measurement
TIER 3 Communication and productivity Enhancement
NPI Procedures
TPM/OEE Program
Supply Management
Quality system and COPQ analysis
ERP Systems Review
TIER 2 (Packing)Project planning
Sales/Distribution
ADMIN Improvement
People planning
Strategic
NPI
Supply
Demand
Organization
Linear Process
Process Improvement
People/Practices
6/3/2015
80
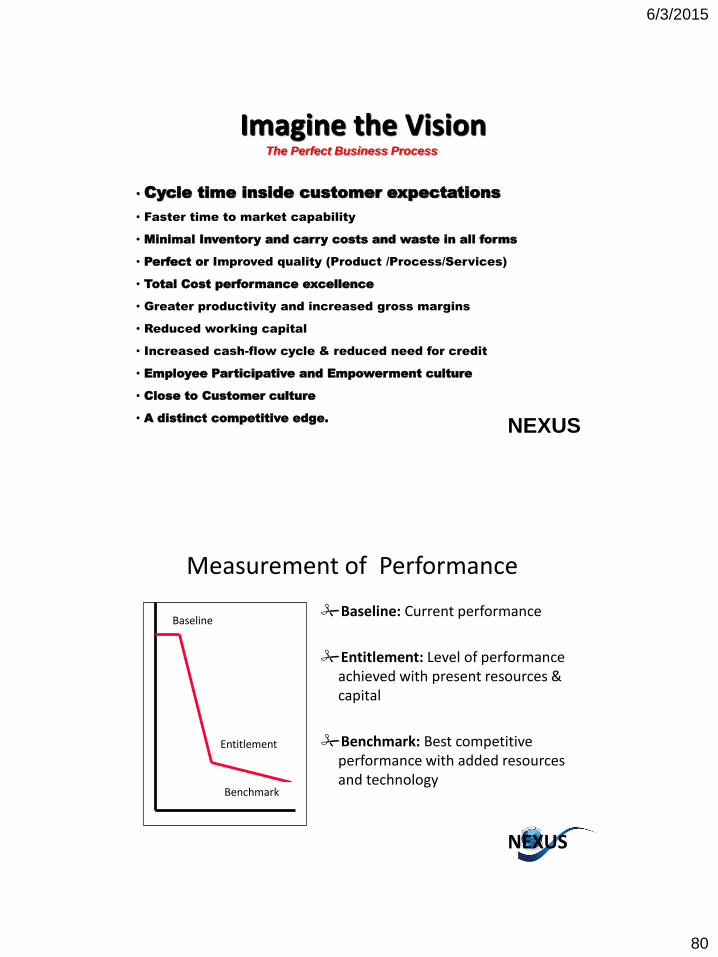
Imagine the Vision
• Cycle time inside customer expectations
• Faster time to market capability
• Minimal Inventory and carry costs and waste in all forms
• Perfect or Improved quality (Product /Process/Services)
• Total Cost performance excellence
• Greater productivity and increased gross margins
• Reduced working capital
• Increased cash-flow cycle & reduced need for credit
• Employee Participative and Empowerment culture
• Close to Customer culture
• A distinct competitive edge.
NEXUS
The Perfect Business Process
Measurement of Performance
Entitlement
Baseline
Benchmark
Baseline: Current performance
Entitlement: Level of performance achieved with present resources & capital
Benchmark: Best competitive performance with added resources and technology
NEXUS
6/3/2015
81
PlanningForum
Management Team
(Approval Team)
Evolution Review Teams
Evolution Plan
Communication Evolution Plan
Planning Execution
Proj
Ldr
Prog
Ldr
Prog
Ldr
Prog
Ldr
Proj
Ldr
Proj
LdrProj
LdrProj
Ldr
Proj
LdrProj
Ldr
Proj
Ldr
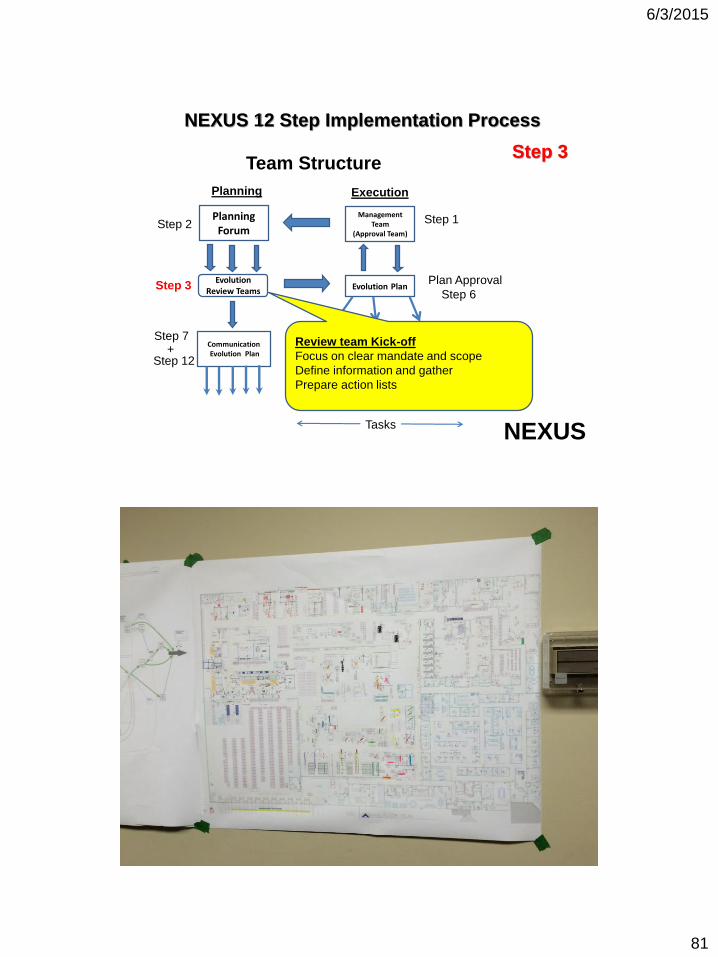
NEXUS 12 Step Implementation Process
Step 2
Step 3
Step 1
Step 7
Step 12+
Plan Approval
Step 6
Team members
Tasks
Step 10/11
Step 9
Team Structure
Review team Kick-off
Focus on clear mandate and scope
Define information and gather
Prepare action lists
Step 3
NEXUS
162
6/3/2015
82
163
PlanningForum
Management Team
(Approval Team)
Evolution Review Teams
Evolution Plan
Communication Evolution Plan
Planning Execution
Proj
Ldr
Prog
Ldr
Prog
Ldr
Prog
Ldr
Proj
Ldr
Proj
LdrProj
LdrProj
Ldr
Proj
LdrProj
Ldr
Proj
Ldr
NEXUS 12 Step Implementation Process
Step 2
Step 4
Step 1
Step 7
Step 12+
Plan Approval
Step 6
Team members
Tasks
Step 10/11
Step 9
Team Structure
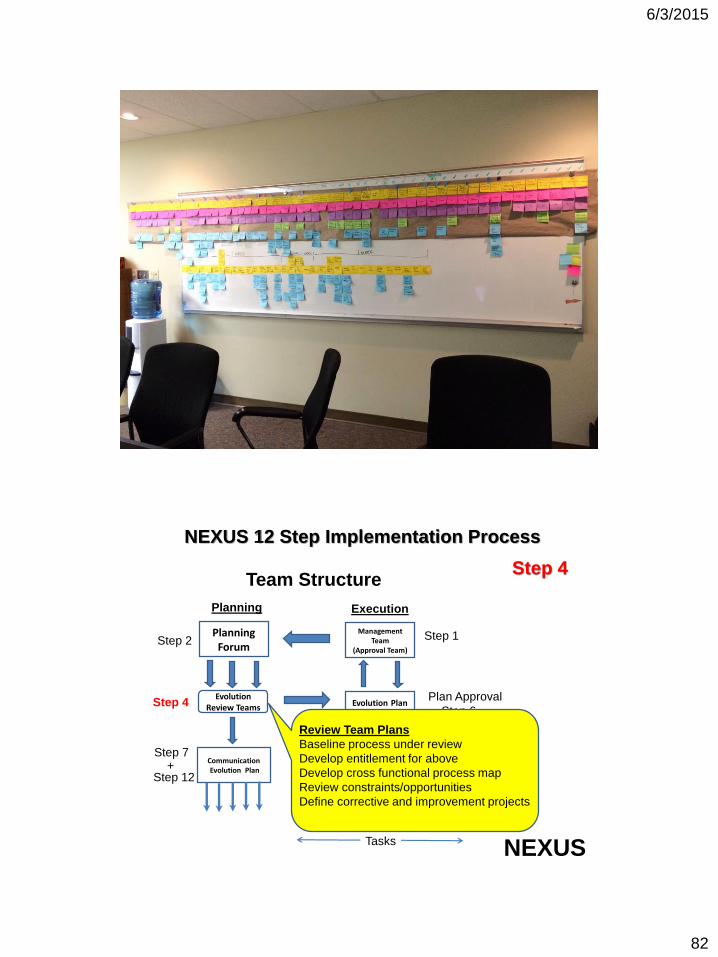
Review Team Plans
Baseline process under review
Develop entitlement for above
Develop cross functional process map
Review constraints/opportunities
Define corrective and improvement projects
Step 4
NEXUS
6/3/2015
83
PlanningForum
Management Team
(Approval Team)
Evolution Review Teams
Evolution Plan
Communication Evolution Plan
Planning Execution
Proj
Ldr
Prog
Ldr
Prog
Ldr
Prog
Ldr
Proj
Ldr
Proj
LdrProj
LdrProj
Ldr
Proj
LdrProj
Ldr
Proj
Ldr
NEXUS 12 Step Implementation Process
Step 2
Step 5
Step 1
Step 7
Step 12+
Plan Approval
Step 6
Team members
Tasks
Step 10/11
Step 9
Team Structure
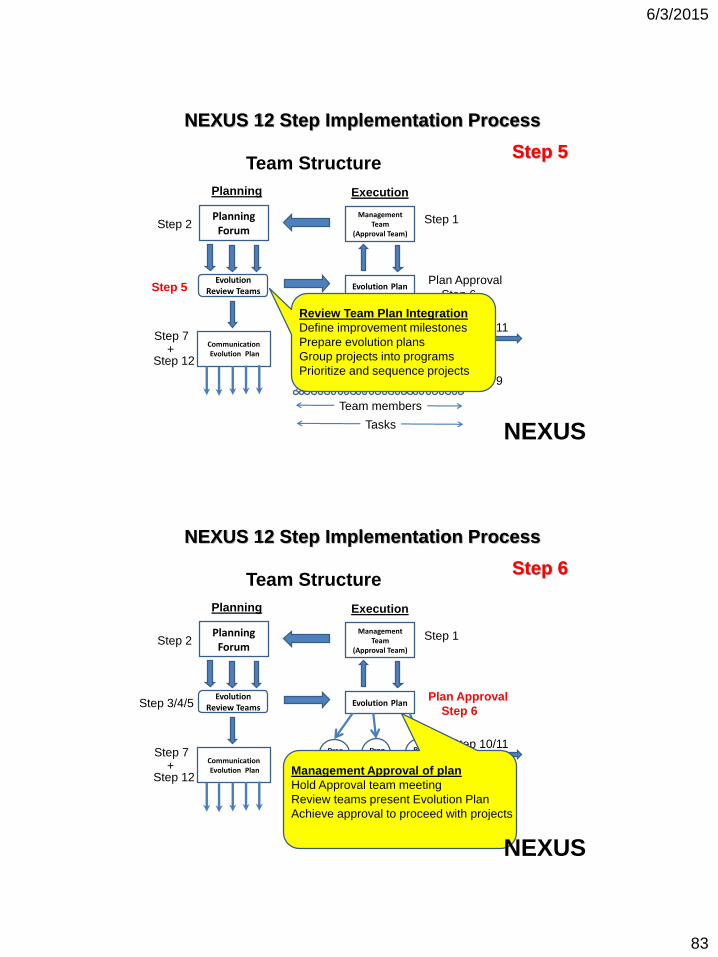
Review Team Plan Integration
Define improvement milestones
Prepare evolution plans
Group projects into programs
Prioritize and sequence projects
Step 5
NEXUS
PlanningForum
Management Team
(Approval Team)
Evolution Review Teams
Evolution Plan
Communication Evolution Plan
Planning Execution
Proj
Ldr
Prog
Ldr
Prog
Ldr
Prog
Ldr
Proj
Ldr
Proj
LdrProj
LdrProj
Ldr
Proj
LdrProj
Ldr
Proj
Ldr
NEXUS 12 Step Implementation Process
Step 2
Step 3/4/5
Step 1
Step 7
Step 12+
Plan Approval
Step 6
Team members
Tasks
Step 10/11
Step 9
Team Structure
Management Approval of plan
Hold Approval team meeting
Review teams present Evolution Plan
Achieve approval to proceed with projects
Step 6
NEXUS
6/3/2015
84
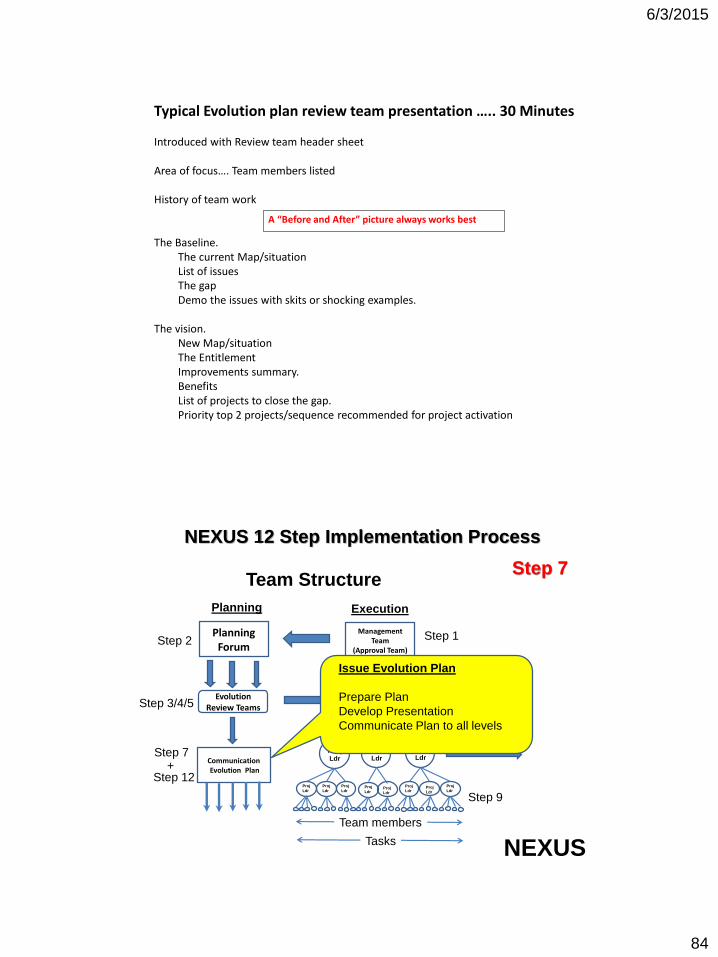
Typical Evolution plan review team presentation ….. 30 Minutes
Introduced with Review team header sheet
Area of focus…. Team members listed
History of team work
The Baseline.The current Map/situationList of issuesThe gapDemo the issues with skits or shocking examples.
The vision.New Map/situationThe EntitlementImprovements summary.BenefitsList of projects to close the gap.Priority top 2 projects/sequence recommended for project activation
A “Before and After” picture always works best
PlanningForum
Management Team
(Approval Team)
Evolution Review Teams
Evolution Plan
Communication Evolution Plan
Planning Execution
Proj
Ldr
Prog
Ldr
Prog
Ldr
Prog
Ldr
Proj
Ldr
Proj
LdrProj
LdrProj
Ldr
Proj
LdrProj
Ldr
Proj
Ldr
NEXUS 12 Step Implementation Process
Step 2
Step 3/4/5
Step 1
Step 7
Step 12+
Plan Approval
Step 6
Team members
Tasks
Step 10/11
Step 9
Team Structure
Issue Evolution Plan
Prepare Plan
Develop Presentation
Communicate Plan to all levels
Step 7
NEXUS
6/3/2015
85
Management Team
(Approval Team)
Evolution Plan
Execution
Proj
Ldr
Prog
Ldr
Proj
Ldr
Proj
Ldr
12 Step Implementation Process
Step12Ongoing
Communication
Program
Kick-off
Project Activated
Project
Kick-offSet project
goals
Project
Organiza
tion
Feasibility
PhasePlanning
Phase
Implement
PhaseFollow-up
Phase
Audit
Report
Audit
Audit
Team
Evolution Review
(Monthly)
Project ApprovaIMeeting
Step 10
Step 11
INACTIVE COMPLETEACTIVE
Step 8 Step 9
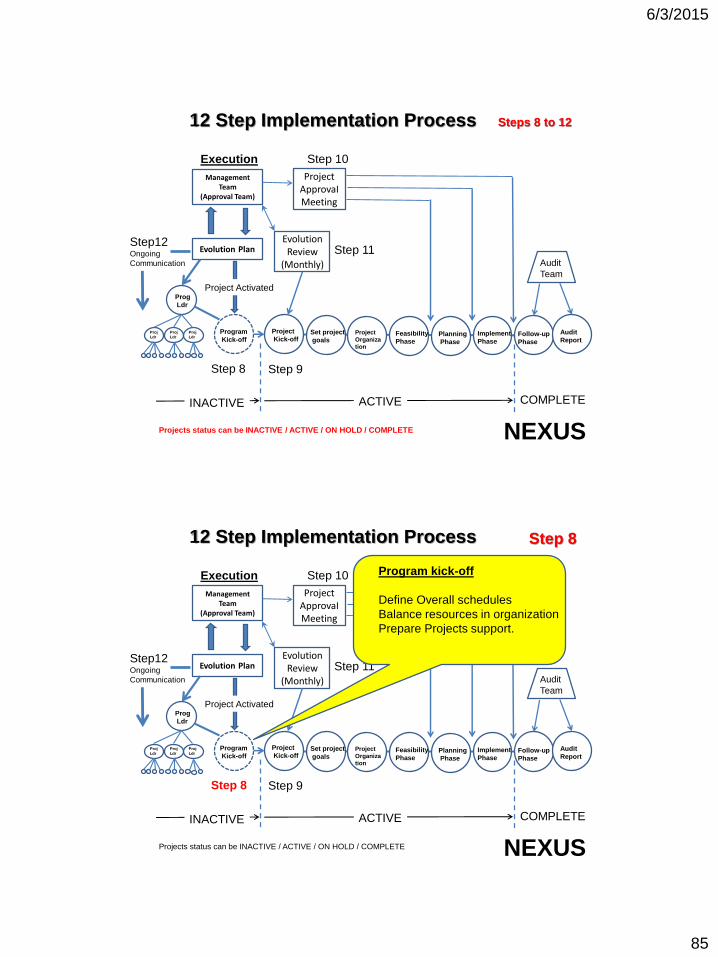
Projects status can be INACTIVE / ACTIVE / ON HOLD / COMPLETE
Steps 8 to 12
NEXUS
Management Team
(Approval Team)
Evolution Plan
Execution
Proj
Ldr
Prog
Ldr
Proj
Ldr
Proj
Ldr
12 Step Implementation Process
Step12Ongoing
Communication
Program
Kick-off
Project Activated
Project
Kick-offSet project
goals
Project
Organiza
tion
Feasibility
PhasePlanning
Phase
Implement
PhaseFollow-up
Phase
Audit
Report
Audit
Audit
Team
Evolution Review
(Monthly)
Project ApprovaIMeeting
Step 10
Step 11
INACTIVE COMPLETEACTIVE
Step 8 Step 9
Projects status can be INACTIVE / ACTIVE / ON HOLD / COMPLETE
Program kick-off
Define Overall schedules
Balance resources in organization
Prepare Projects support.
Step 8
NEXUS
6/3/2015
86
Management Team
(Approval Team)
Evolution Plan
Execution
Proj
Ldr
Prog
Ldr
Proj
Ldr
Proj
Ldr
12 Step Implementation Process
Step12Ongoing
Communication
Program
Kick-off
Project Activated
Project
Kick-offSet project
goals
Project
Organiza
tion
Feasibility
PhasePlanning
Phase
Implement
PhaseFollow-up
Phase
Audit
Report
Audit
Audit
Team
Evolution Review
(Monthly)
Project ApprovaIMeeting
Step 10
Step 11
INACTIVE COMPLETEACTIVE
Step 8 Step 9
Projects status can be INACTIVE / ACTIVE / ON HOLD / COMPLETE
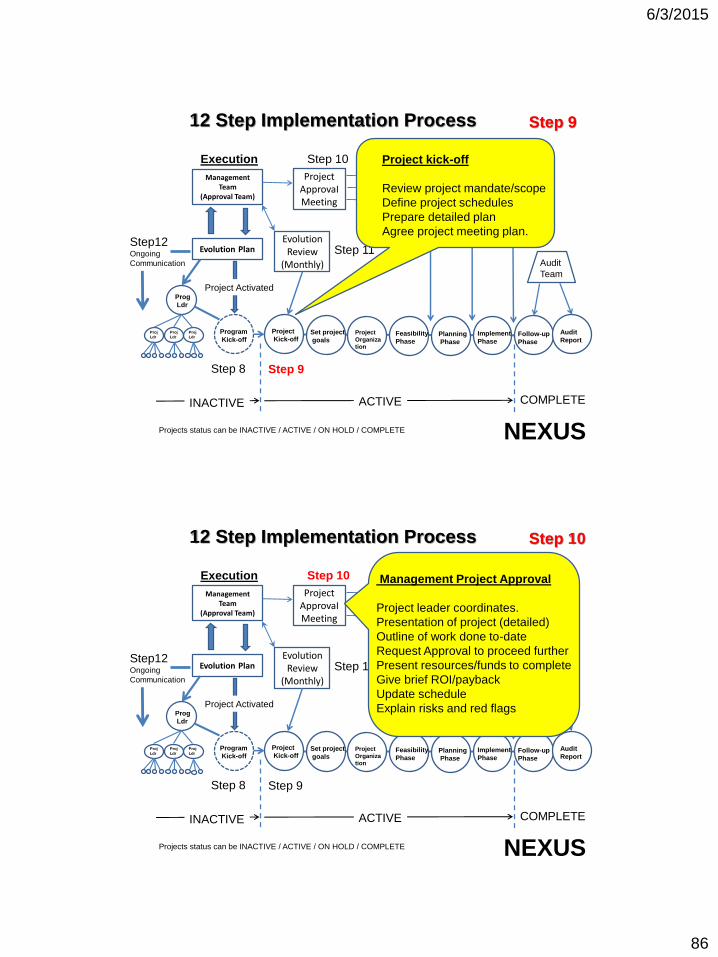
Project kick-off
Review project mandate/scope
Define project schedules
Prepare detailed plan
Agree project meeting plan.
Step 9
NEXUS
Management Team
(Approval Team)
Evolution Plan
Execution
Proj
Ldr
Prog
Ldr
Proj
Ldr
Proj
Ldr
12 Step Implementation Process
Step12Ongoing
Communication
Program
Kick-off
Project Activated
Project
Kick-offSet project
goals
Project
Organiza
tion
Feasibility
PhasePlanning
Phase
Implement
PhaseFollow-up
Phase
Audit
Report
Audit
Audit
Team
Evolution Review
(Monthly)
Project ApprovaIMeeting
Step 10
Step 11
INACTIVE COMPLETEACTIVE
Step 8 Step 9
Projects status can be INACTIVE / ACTIVE / ON HOLD / COMPLETE
Management Project Approval
Project leader coordinates.
Presentation of project (detailed)
Outline of work done to-date
Request Approval to proceed further
Present resources/funds to complete
Give brief ROI/payback
Update schedule
Explain risks and red flags
Step 10
NEXUS
6/3/2015
87
Management Team
(Approval Team)
Evolution Plan
Execution
Proj
Ldr
Prog
Ldr
Proj
Ldr
Proj
Ldr
12 Step Implementation Process
Step12Ongoing
Communication
Program
Kick-off
Project Activated
Project
Kick-offSet project
goals
Project
Organiza
tion
Feasibility
PhasePlanning
Phase
Implement
PhaseFollow-up
Phase
Audit
Report
Audit
Audit
Team
Evolution Review
(Monthly)
Project ApprovaIMeeting
Step 10
Step 11
INACTIVE COMPLETEACTIVE
Step 8 Step 9
Projects status can be INACTIVE / ACTIVE / ON HOLD / COMPLETE
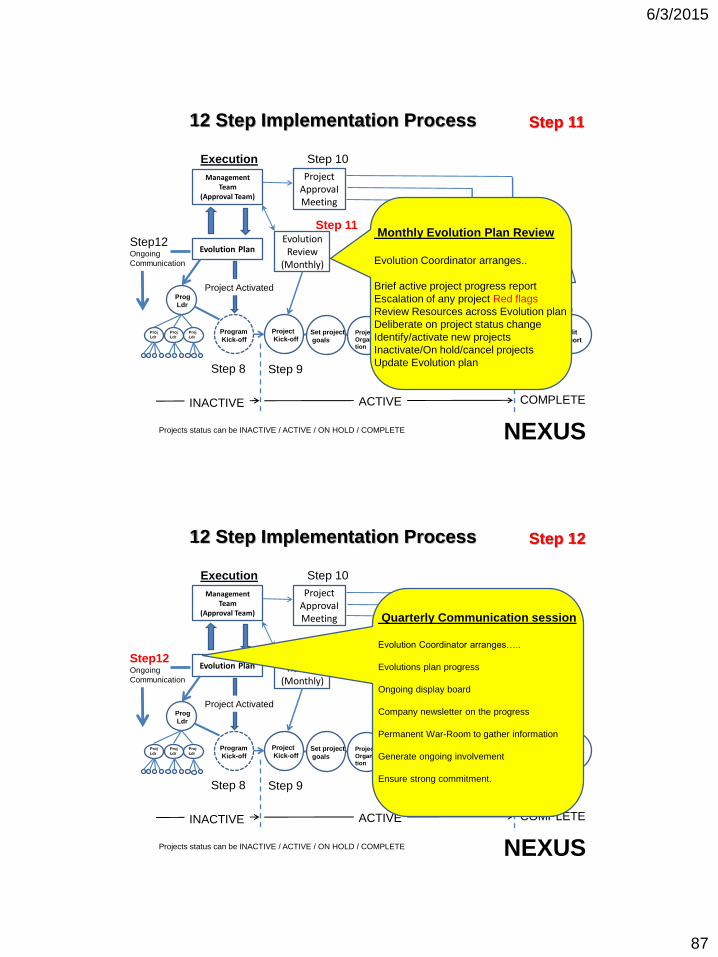
Monthly Evolution Plan Review
Evolution Coordinator arranges..
Brief active project progress report
Escalation of any project Red flags
Review Resources across Evolution plan
Deliberate on project status change
Identify/activate new projects
Inactivate/On hold/cancel projects
Update Evolution plan
Step 11
NEXUS
Management Team
(Approval Team)
Evolution Plan
Execution
Proj
Ldr
Prog
Ldr
Proj
Ldr
Proj
Ldr
12 Step Implementation Process
Step12Ongoing
Communication
Program
Kick-off
Project Activated
Project
Kick-offSet project
goals
Project
Organiza
tion
Feasibility
PhasePlanning
Phase
Implement
PhaseFollow-up
Phase
Audit
Report
Audit
Audit
Team
Evolution Review
(Monthly)
Project ApprovaIMeeting
Step 10
Step 11
INACTIVE COMPLETEACTIVE
Step 8 Step 9
Projects status can be INACTIVE / ACTIVE / ON HOLD / COMPLETE
Quarterly Communication session
Evolution Coordinator arranges…..
Evolutions plan progress
Ongoing display board
Company newsletter on the progress
Permanent War-Room to gather information
Generate ongoing involvement
Ensure strong commitment.
Step 12
NEXUS
6/3/2015
88
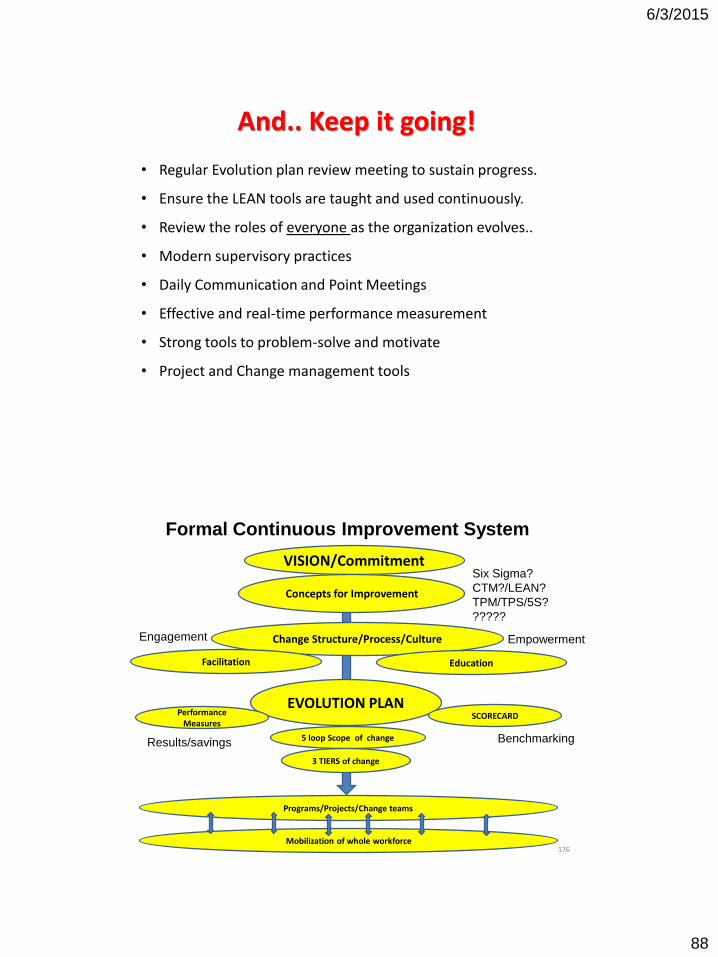
And.. Keep it going!
• Regular Evolution plan review meeting to sustain progress.
• Ensure the LEAN tools are taught and used continuously.
• Review the roles of everyone as the organization evolves..
• Modern supervisory practices
• Daily Communication and Point Meetings
• Effective and real-time performance measurement
• Strong tools to problem-solve and motivate
• Project and Change management tools
176
VISION/Commitment
Formal Continuous Improvement System
Concepts for Improvement
Change Structure/Process/Culture
Facilitation Education
EVOLUTION PLAN
5 loop Scope of change
3 TIERS of change
SCORECARDPerformance Measures
Programs/Projects/Change teams
Mobilization of whole workforce
Six Sigma?
CTM?/LEAN?
TPM/TPS/5S?
?????
BenchmarkingResults/savings
EmpowermentEngagement
6/3/2015
89
177
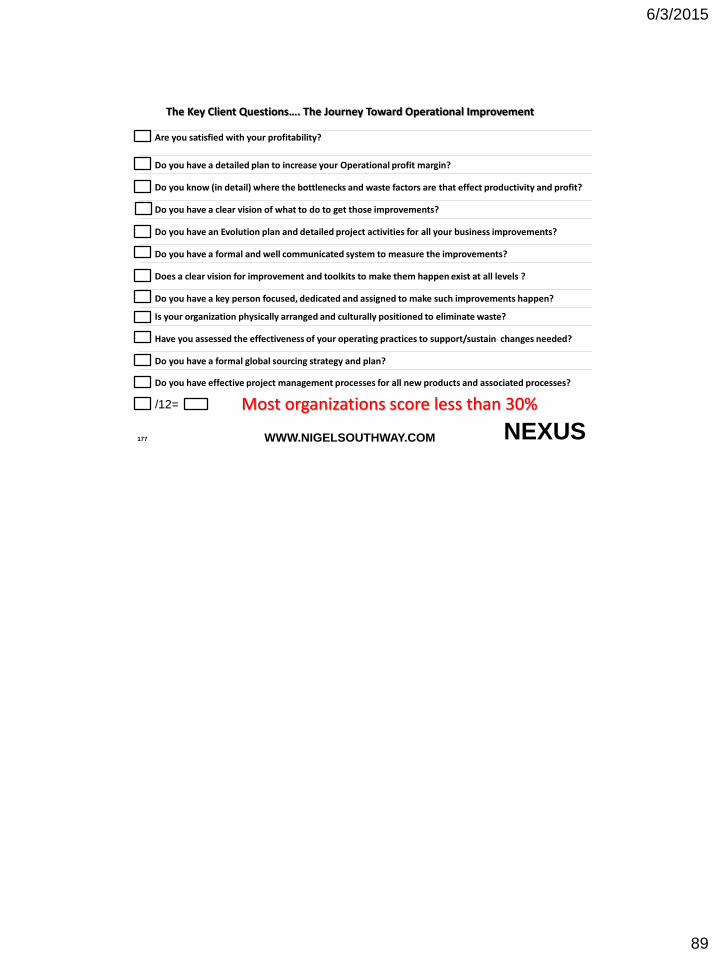
The Key Client Questions…. The Journey Toward Operational Improvement
Are you satisfied with your profitability?
Do you have a detailed plan to increase your Operational profit margin?
Do you know (in detail) where the bottlenecks and waste factors are that effect productivity and profit?
Do you have a clear vision of what to do to get those improvements?
Do you have an Evolution plan and detailed project activities for all your business improvements?
Do you have a formal and well communicated system to measure the improvements?
Does a clear vision for improvement and toolkits to make them happen exist at all levels ?
Do you have a key person focused, dedicated and assigned to make such improvements happen?
Is your organization physically arranged and culturally positioned to eliminate waste?
Have you assessed the effectiveness of your operating practices to support/sustain changes needed?
Do you have a formal global sourcing strategy and plan?
Do you have effective project management processes for all new products and associated processes?
Most organizations score less than 30%
NEXUS
/12=
WWW.NIGELSOUTHWAY.COM