Johor Health Journal Volume 11 -...
65
Johor Health Journal Official Journal of Johor State Health Department Volume 11 2014 Contents Content Editorial Board Notice to Contributors Return of Unused Medications from Wards to Inpatient Pharmacy at Sultanah Aminah Hospital, JohorBahru, Johor Lim M.T.,Md.SaidS.N. The Impact of 5S Implementation in Reducing Drug Filling Time in an Out-patient Pharmacy at Simpang Renggam Health Clinic, Johor, Malaysia Ong B.Y., Kerk Y.H., Wong P.G., Lim Y.H., Wong S.W. Non Tuberculous Mycobacteria (NTM) Recovery Rate by Johor Bah- ru Public Health Laboratory from 2011 to 2013 Misbaha J., Norazlina A.,Badrul H.A.S. Kajian Pasaran Upah Jahitan Pakaian Seragam Untuk Anggota Ke- menterian Kesihatan, Johor Bahru Loh K.H., Teoh C.A., Awang K., Manan M.A., Yap C.S., Mokesing M., Mohd Said N., Mahmod Nor Z. Correlation of Sonographic Imaging Using BI-RADS and Histo- pathological Findings of Breast Lesions- A Series of 14 cases Abdullah H., Nordin N.D., Foo C.Y. Dosing Error of Paracetamol and Antihistamine Prescribed for Chil- dren Aged 12 Years Old and Below in a Health Clinic Tang S.C., Pan H.C. & Ting C.S. Malnutrition Status among Hemodialysis Patients in Hemodialysis Unit, Hospital Pakar Sultanah Fatimah (HPSF) Isnin L., Khamisan F., Mokhy M.S., Rosli S.R., & Mahmood N.M. High Versus Low Risk Ulcer And Modifiable Risk Factors – Predic- tors Of 30 days Rebleeding In Non-Variceal Upper Gastrointestinal Bleeding Tan C. L. H., Heah H. T., Arulanantham S. Dengue Infections and Circulating Serotypes in Johor, Malaysia Mohd Ghazali AN, Hod R, Shahani M, Che Mat Din S, Amin F, Ismail N, Mohd Salleh Z Perforated gastro-intestinal stromal tumor (GIST) in Meckel’s di- verticulum. What’s next after a resection? Tan J.H., Md Sikin S., Arulanantha S., Jamalludin N.S., Khalid N. i ii iv 1 7 12 17 22 27 32 38 42 52 i
Transcript of Johor Health Journal Volume 11 -...

1Jurnal Kesihatan Johor, Vol. 11, 2014
Johor Health JournalOfficial Journal of Johor State Health Department
Volume 11
2014
ContentsContent
Editorial Board
Notice to Contributors
Return of Unused Medications from Wards to Inpatient Pharmacy at Sultanah Aminah Hospital, JohorBahru, JohorLim M.T.,Md.SaidS.N.
The Impact of 5S Implementation in Reducing Drug Filling Time in an Out-patient Pharmacy at Simpang Renggam Health Clinic, Johor, MalaysiaOng B.Y., Kerk Y.H., Wong P.G., Lim Y.H., Wong S.W.
Non Tuberculous Mycobacteria (NTM) Recovery Rate by Johor Bah-ru Public Health Laboratory from 2011 to 2013Misbaha J., Norazlina A.,Badrul H.A.S.
Kajian Pasaran Upah Jahitan Pakaian Seragam Untuk Anggota Ke-menterian Kesihatan, Johor BahruLoh K.H., Teoh C.A., Awang K., Manan M.A., Yap C.S., Mokesing M., Mohd Said N., Mahmod Nor Z.
Correlation of Sonographic Imaging Using BI-RADS and Histo-pathological Findings of Breast Lesions- A Series of 14 casesAbdullah H., Nordin N.D., Foo C.Y.
Dosing Error of Paracetamol and Antihistamine Prescribed for Chil-dren Aged 12 Years Old and Below in a Health ClinicTang S.C., Pan H.C. & Ting C.S.
Malnutrition Status among Hemodialysis Patients in Hemodialysis Unit, Hospital Pakar Sultanah Fatimah (HPSF) Isnin L., Khamisan F., Mokhy M.S., Rosli S.R., & Mahmood N.M.
High Versus Low Risk Ulcer And Modifiable Risk Factors – Predic-tors Of 30 days Rebleeding In Non-Variceal Upper Gastrointestinal BleedingTan C. L. H., Heah H. T., Arulanantham S.
Dengue Infections and Circulating Serotypes in Johor, MalaysiaMohd Ghazali AN, Hod R, Shahani M, Che Mat Din S, Amin F, Ismail N, Mohd Salleh Z
Perforated gastro-intestinal stromal tumor (GIST) in Meckel’s di-verticulum. What’s next after a resection?Tan J.H., Md Sikin S., Arulanantha S., Jamalludin N.S., Khalid N.
i
ii
iv
1
7
12
17
22
27
32
38
42
52
i

2Jurnal Kesihatan Johor, Vol. 11, 2014
Johor Health JournalOfficial Journal of Johor State Health Department
EDITORIAL BOARD
PRINCIPAL ADVISER
YB DATO’ DR. MOHD KHAIRI BIN YAKUBDIRECTOR OF HEALTH JOHOR,
JOHOR STATE HEALTH DEPARTMENTTEL: 07-2245188 FAX: 07-2232603
EMAIL: [email protected]
ADVISER
MRS. ROSIDAH MD DINSTATE DEPUTY OF HEALTH ( PHARMACY ) JOHOR,
JOHOR STATE HEALTH DEPARTMENTTEL: 07-2355120 FAX: 07-2355130
EMAIL: [email protected]
CHIEF EDITOR
DR. BADRUL HISHAM BIN ABDUL SAMADDISTRICT HEALTH OFFICER
DISTRICT HEALTH OFFICE JOHOR BAHRUTEL: 07-2224711 FAX: 07-2236549
EMAIL:[email protected]
EDITORS
DR. SURIATI BT HASIMFAMILY MEDICINE SPECIALIST
DISTRICT HEALTH OFFICE MERSINGTEL: 07-7991836 FAX: 07-7994145
EMAIL: [email protected]
MRS. MASLIZA BT ARIPPRINCIPAL ASSISTANT DIRECTOR (ENFORCEMENT PHARMACY)
JOHOR STATE HEALTH DEPARTMENTTEL: 07-2355120 FAX: 07-2355130
EMAIL: [email protected]
MRS. LEE CHING YANPRINCIPAL ASSISTANT DIRECTOR
(TRADITIONAL & COMPLEMENTARY MEDICINE) TEL: 07-2381787 FAX: 07-2384787
EMAIL:[email protected]
SECRETARY
MR. ALI BIN ISMAILSENIOR PRINCIPAL ASSISTANT DIRECTOR (PHARMACY)
JOHOR STATE HEALTH DEPARTMENTTEL: 07-2355120 FAX: 07-2355130
EMAIL: [email protected]
MEMBERS
MRS. SURAYA HANI BT SHARONPRINCIPAL ASSISTANT DIRECTOR (PHARMACY)
JOHOR STATE HEALTH DEPARTMENTTEL: 07-2355120 FAX: 07-2355130
EMAIL: [email protected]
MRS. KEK SIOK LINGASSISTANT DIRECTOR (PHARMACY) JOHOR STATE HEALTH DEPARTMENT
TEL: 07-2355120 FAX: 07-2355130EMAIL: [email protected]
ii

3Jurnal Kesihatan Johor, Vol. 11, 2014
Johor Health JournalOfficial Journal of Johor State Health Department
REVIEWER BOARD
DR. MARIA LEE HOOI SEAN
HEAD OF UNIT (CLINICAL RESEARCH CENTRE JOHOR)
HOSPITAL SULTANAH AMINAH
DR. AKASHAH BIN ABDULLAH
SENIOR PRINCIPAL ASSISTANT DIRECTOR
(PUBLIC HEALTH)
JOHOR STATE HEALTH DEPARTMENT
DR. ANDREW GUNN
SENIOR CONSULTANT, HEAD OF UNIT
(GENERAL SURGERY)
HOSPITAL SULTANAH AMINAH
DR. NOORHAIDA BT UJANG
DISTRICT HEALTH OFFICER
DISTRICT HEALTH OFFICE BATU PAHAT
DR. HJH KHATIJAH BT ABU BAKAR
RADIOLOGIST CONSULTANT, HEAD OF UNIT
(RADIOLOGY)
HOSPITAL SULTANAH AMINAH
DR. SHEILA RANI RAMALINGAM
SENIOR PRINCIPAL ASSISTANT DIRECTOR
(ORAL HEALTH)
JOHOR STATE HEALTH DEPARTMENT
DR. LINAYANTI BT ROSLI
EPIDEMIOLOGIST
DISTRICT HEALTH OFFICE KLUANG
DR. SITI NORLINA BT MD SAID
CHIEF PHARMACIST
HOSPITAL SULTANAH AMINAH
DR. HABIBAH BT YACOB@YA’AKUB
DISTRICT DENTAL OFFICER
DISTRICT DENTAL OFFICE MUAR
MRS. KAMALIAH BT MAT SAMAN
CHIEF PHARMACIST
HOSPITAL PAKAR SULTANAH FATIMAH
MRS. HJH SALHA BT MOHD NOR
HEAD OF UNIT
(DIETETIC & FOOD SERVICES)
HOSPITAL SULTANAH AMINAH
iii

4Jurnal Kesihatan Johor, Vol. 11, 2014
NOTICE TO CONTRIBUTORS
The Jurnal Kesihatan Johor welcomes original papers and research notes on all aspects of health. Articles for publication must be contributed solely to the Jurnal Kesihatan Johor and the authors are solely responsible for the views and statements expressed in their contributions. Neither the Editorial Committee nor the Publishers will accept responsibility.
All contributors shall comply to guidelines issued by the National Institutes of Health, on con-duct of medical research in the Ministry of Health (MOH) Malaysia as follows:
1. All research must obtain the approval of the MOH in accordance with prescribed procedures
2. All research conducted in the MOH must be registered online in the National Medical Research Register (www.nmrr.gov.my)
3. Research that involves human subjects have to obtain prior approval from the Medical Research Ethics Committee (MREC), MOH.
4. All publications resulting from the MOH research must obtain prior approval from the Director- General of Health
5.Anydisseminationorcommunicationofresearchfindingsviawritten,advertised, presented or to the media must obtain prior approval from the Director-General of Health
Details of the above guidelines can be downloaded or viewed at https://www.nmrr.gov.my/doc/01_NIH_Guidelines_for_Conducting_Research_in_MOH_v2_2_03March2008.pdf
To avoid delays in publication, authors are advised to adhere closely to the instructions given below:
1. Type and Font Size
Authors must use default font Verdana 11 points typed single-spaced on one side of A4 paper with wide margins throughout (including in the abstract, tables, legends and references).
2. Acronyms
Forthefirstmention,writeinfullfollowedbytheabbreviationsinabracketeg.WorldHealthOrganisation (WHO). For subsequent mention, use only the abbreviations in the text.
3. Notation of Dates
Write notation of dates in full sentence as follows: 2 July 2003 or 23 July 2003 but not 2/7/2003 or 23.7.2003 or 02 July 2003 or 23 Jul 2003
4. Footnotes and Superscripts
Wordsorspecificterminologiesshouldbedefinedorexplainedusingthesuperscriptnotation.Thedefinitionorexplanationshouldbegivenasfootnoteatthebottomofthesamepage.
The superscript must be in Arabic numerals which are 1, 2, 3.
iv

5Jurnal Kesihatan Johor, Vol. 11, 2014
5. Tables, Figures, Graphs, Maps and Pictures
Tables,figures,graphs,mapsandpicturesshouldbeinsertedinaccordancetothetext(notinseparatefilesfromthetext).PicturesmustbesentinJPEGformat.Inthepreparationoftables,only horizontal lines (Academic Form) are allowed. Omit the vertical and internal horizontal lines.
Example of Academic Form of table (according to SPSS)
Table 1: The Distribution of Cases and Control Pairs According to Age, Gender, and Race
Characteristics Cases Controls Total % Total %
Age 15 - 29 30 - 44 45 - 59≥60
41739102
2.510.524.163.0
41739102
2.510.524.163.0
Gender Male Female
11943
73.526.5
11943
73.526.5
Race Malay Chinese Indians
82755
50.646.33.1
82755
50.646.33.1
UseArabicnumerals(1,2,3etc.)followedbyacolon(:)whennumberingthetablesandfig-ures. Use Title Case for all headings except for prepositions (by, of, for etc). Do not use the full stop at the end of the headings.
Titleofthetableshouldbeplacedabovethetablewhereastitleofthefigureshouldbeplacedbelowthefigure.
Examples:
Table 2: Amount of Rainfall (mm) Recorded at Johor Meteorological Stations
StationRainfall reading (mm) by dates
December 2006 January 2007 16th 17th 18th 19th 20th 11th 12th 13th 14th
SenaiBatu PahatKluangMersing
46.4 94.6 128.0 236.0 40.0 264.0 213.0 9.0 19.0 0.8 10.8 93.4 71.6 2.0 121.0 94.0 9.0 0.4 0.0 53.2 126.8 266.0 18.0 171.0 222.0 42.0 16.0 0.8 1.8 7.4 133.6 6.0 64.0 134.0 237.0 167.0
Average 12.0 40.1 88.9 176.8 16.5 155.0 165.8 74.3 50.6
Source: The Research Division, Meteorological Department, the Ministry of Science, Technology and In-novation, Malaysia
v
6Jurnal Kesihatan Johor, Vol. 11, 2014
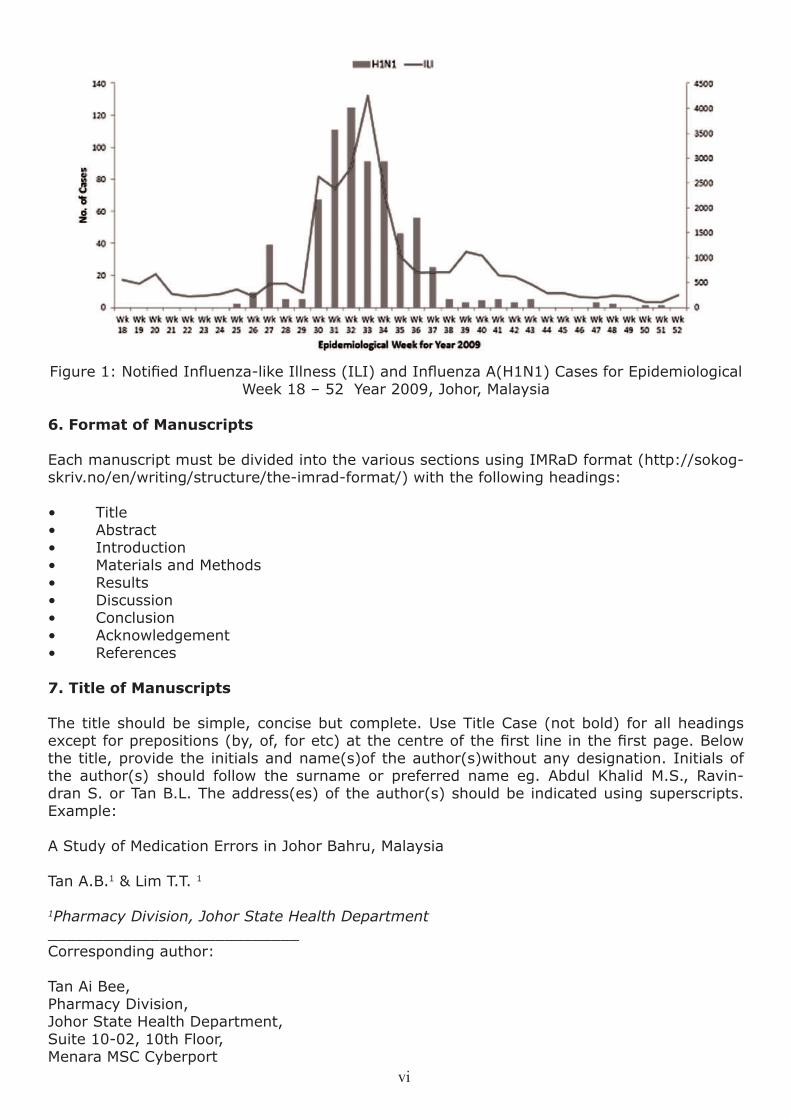
Figure1:NotifiedInfluenza-likeIllness(ILI)andInfluenzaA(H1N1)CasesforEpidemiologicalWeek 18 – 52 Year 2009, Johor, Malaysia
6. Format of Manuscripts
Each manuscript must be divided into the various sections using IMRaD format (http://sokog-skriv.no/en/writing/structure/the-imrad-format/) with the following headings:
• Title• Abstract• Introduction• MaterialsandMethods• Results• Discussion• Conclusion• Acknowledgement• References
7. Title of Manuscripts
The title should be simple, concise but complete. Use Title Case (not bold) for all headings exceptforprepositions(by,of,foretc)atthecentreofthefirstlineinthefirstpage.Belowthe title, provide the initials and name(s)of the author(s)without any designation. Initials of the author(s) should follow the surname or preferred name eg. Abdul Khalid M.S., Ravin-dran S. or Tan B.L. The address(es) of the author(s) should be indicated using superscripts.Example:
A Study of Medication Errors in Johor Bahru, Malaysia
Tan A.B.1 & Lim T.T. 1
1Pharmacy Division, Johor State Health Department___________________________Corresponding author:
Tan Ai Bee,Pharmacy Division,Johor State Health Department,Suite 10-02, 10th Floor, Menara MSC Cyberport
vi

7Jurnal Kesihatan Johor, Vol. 11, 2014
5, Jalan Bukit Meldrum80300 Johor BahruPhone:+607-2272800 ext. 124Fax: +607-2236146Email: [email protected]
Authorship should comply to the recommendation by International Committee for Medical Journal Editors(http://www.icmje.org/ethical_1author.html)whichisdefinedinthefollowingstatement:
“Authorship credit should be based on: 1) substantial contributions to concep-tion and design, acquisition of data, or analysis and interpretation of data; 2) draft-ing the article or revising it critically for important intellectual content; and 3) fi-nal approval of the version to be published. Authors should meet conditions 1, 2, and 3.”
8. Abstract
An abstract of not more than 300 words should be provided immediately after the title. Below the abstract, provide and identify 3 to 10 keywords or short phrases that will assist indexers in cross-indexing your article. Use terms from all the medical subject headings (MESH) listed in MEDLINE.
The abstract should be written using IMRAD format subheadings in bold: Introduction, Meth-ods, Results & Conclusion, which describe the background and objective of the study and pro-cedures used including the selection of subjects, data collection and analysis as well as important findingsandconclusions.Itshouldbeinone (1) paragraph and should not be enclosed in a box.
The abstract should be placed below the main title. Write the heading “Abstract” without bold or italic.
Example:
Abstract
Introduction: There has been pressing need to increase elective operating time/ list to con-tain complaints of long waiting time for surgery, possibly due to increased patient load not met by proportionate increase in manpower and infrastructure expansion. This study aimed to determine actual waiting time for elective surgeries (WTES) in Hospital Sultanah Aminah Johor Bahru (HSAJB), in comparison to Ministry Of Health (MOH) hospitals, and the effect of manpower, OT time and workload factors which are commonly believed to be the cause of long wait.Methods: A retrospective national audit was conducted to determine the actual WTES (i.e. booking date to operation date) for surgeries done in 2007. One surgical procedure was identifiedastheindicatorsurgerytorepresentelectivesurgeriesofeachsurgicaldiscipline.Thedata from HSAJB was compared to this national data as well as the standard. The correlation of WTES and the factors were examined. Results: 701 cases from 10 disciplines were sampled, of which 457 (65.2%) analyzed. Overall median and 90th centile WTES of HSAJB was 18.6 and 34.7weeks(wks) respectively.This issignificantly longer than thenationalWTES(8.9and30.6wks respectively), p=0.001. 2.9% of HSAJB cases waited more than a year before surgery. In HSAJB, Paediatric had the longest WTES (90th centile, 60.6wks) and Plastic Surgery had the least (16.0wks). 86% of herniotomies were done after 6 months, and 3.9% within 3 months. The odds of waiting more than 3 months among Paediatric Surgical patients is 19.4 times(CI 9.1-41.5) of non-paediatric, and that of 6 months is 36.6 (CI 23.5-56.9) times. Weak correla-tion found between WTES and OT time availability, manpower or workload. Conclusion: WTES in HSAJB was longer than the national WTES. Correlation of OT time availability, manpower and workload on WTES was weak. Manipulation of these factors may not be adequate to solve the problem of long waiting time.
Keywords: waiting time, elective surgery, public hospital
vii

8Jurnal Kesihatan Johor, Vol. 11, 2014
9. Introduction
The introduction must provide the background of the research and summarise the rationale and importanceofthestudy.Itshouldstatethegeneralandspecificobjectivesoftheresearchorthe research hypothesis. Avoid reviewing the subject extensively and do not provide any data or conclusion of the study.
10. Materials and Methods
This section should start with a statement like this: “This research is registered on the Malay-sian National Medical Research Register (ID NMRR-10-1323-7843 S4 R2) and approved by the Medical Research Ethical Committee of Ministry of Health Malaysia”.
This section should contain only information that is already available when the research plan or protocol is formulated. All information obtained when the research is being carried out should be reported in the Results section.
Describe the selection criteria of your subjects or samples clearly and describe the population from which the sample is derived from. Methods used, equipment (manufacturer’s name and addresses in parenthesis) and procedures must be given in detail to enable other research-ers to reproduce the results. Give references to established methods used including statistical methods or provide a brief description of methods that have been published but are not well known.Describeneworsubstantiallymodifiedmethodsandgivereasonsforusingthemandevaluate their limitations.
Identify precisely all drugs and chemicals used, including generic names, dosages and the route of administration. Do not use patients’ names, initials or registration numbers. Include thenumberofobservationandstatisticalsignificanceofthefindingswhereappropriate.
11. Results
Presentyourresultsinalogicalsequence.Researchfindingsshouldbegivenintexts,tablesandillustrationswithprioritygiventothemainorthemostimportantfinding.Avoidrepeatingin the text of all the data presented in the tables or illustrations. Instead, emphasise or sum-mariseonlyimportantfindings.
Tables and Illustrations
Limittheuseoftablesandillustrations(eg.figures)tothoserequiredtoexplainandsupportmainfindings.Providetheabsolutenumberfromwhichderivativedatasuchaspercentagesare obtained together with the statistical methods used in the analysis. Use graphs as an al-ternative to tables. Avoid repeating the same data in graphs and tables.
All tables, illustrations and diagrams should be fully labeled so that each is comprehensible without reference to the text. All measurements should be reported in metric system. The con-tents of all tables should be carefully checked to ensure all totals and subtotals are tally.
All illustrations and diagrams should be referred to as “Figure” and numbered consecutively. Thesizeofthefigureshouldnotbemorethanhalfapage.Wheneverpossible,pleaseincludeall data used for the construction of graphs in order to ensure clarity or reproduction.
12. Discussion
This section should highlight the new and important aspects of the study and the conclusion(s) that can be derived from them. Avoid repeating in detail the data or areas that have been touched under the ‘Introduction’ or ‘Results’ sections. Include in the discussion, the implications ofthefindingsandtheirlimitationsandrelatethefindingstootherrelevantstudies.Authorsmay refer to CONSORT statement in reporting clinical trial as in the following website, http://
viii

9Jurnal Kesihatan Johor, Vol. 11, 2014
www.consort-statement.org/consort-statement/20-22---discussion
13. Conclusion
Theconclusionmadeshouldberelatedtotheobjective(s)ofthestudy.Avoidunqualifiedstate-mentsandconclusionthatarenotcompletelysupportedbyyourresearchfindingsespeciallystatementsoneconomicbenefitsandcostsunlessthemanuscriptcontainseconomicdatathathave been analysed. Avoid claiming priority and alluding to work that has not been completed. State new hypotheses when warranted, clearly label them as such. Recommendation(s), where appropriate, may be included.
14. Acknowledgement
This section should start with a statement like this: “The author(s) would like to thank the Director General of Health Malaysia for permission to publish this paper.” This requirement is stated in the MOH circular with reference number: (18)dlm KKM/NIHSEC/100-1/1/1which can be viewed at https://www.nmrr.gov.my/ doc/circulars/SuratPekelilingKPKBil_1_2013.pdf)
15. References
The references should follow the Vancouver citation style as below:
Personal Author(s)
Osler AG. Complement: mechanism and functions. Englewood Cliffs: Prentice-Hall, 1976.
Corporate Author
American Medical Association Department of Drugs. AMA drugs evaluation (3rd ed.) Littleton: Publishing Sciences Group, 1977.
Editor, Compiler, Chairman as author
Rhodes, AJ, Van Rooyen CE (comps). Textbook of virology: For students and practitioners of medicine and other health sciences (5th ed). Baltimore Williams & Wilkins, 1968.Chapter in Book
Gilstrap LC 3rd, Cunningham FG, VanDorsten JP, editors. Operative obstetrics. 2nd ed. New York: McGraw-Hill; 2002.
Weinstein L, Swartz MN. Pathogenic properties of invading micro-organisms, In: Sodeman WA Jr, Sodeman WA (eds). Pathogenic physiology: mechanisms of disease. Philadelphia: WB Saunders, 1974: 157-72.
Agency Publication
National Centre for Health Statistics. Acute conditions: incidence and associated disability, Unit-ed States, July 1968 – June 1969. Rockville, Me: National Centre for Health Statistics, 1972. (Vital and health statistics). Series 10: data from the National Survey, No 69).(DHEW Publica-tion No [HSM] 72-1036).
Proceedings
Christensen 5, Oppacher F. An analysis ofKoza’s computational effort statistic for genetic pro-gramming. In: Foster JA, Lutton E, Miller J, Ryan C, Tettamanzi AG, editors. Genetic program-ming. EuroGP 2002: Proceedings of the 5th European Conference on Genetic Programming; 2002 Apr 3-5; Kinsdale, Ireland. Berlin; Springer; 2002. p 182-91.
ix

10Jurnal Kesihatan Johor, Vol. 11, 2014
Websites
Abood S. Quality improvement initiative in nursing homes; the ANA acts in an advisory role. Am J Nurs [serial on the Internet]. 2002 Jun [cited 2002 Aug 12]. 102(6);[about 3 p]. Avail-able from:http://www. nursin gworl d. oal/AIN /2002/j une/Wa watch. htm
Foley KM, Gelband H, editor. Improving palliative care for cancer [monograph on the internet]. Washington: National Academy Press; 2001 [cited 2002 Jul 9], Available from: http://www.nap.ednibooks./0309074029/htird/
Cancer-Pain.org [homepage on the Internet]. New York: Association of Cancer Online Resourc-es, Inc.; c2000-01 [updated 2002 May 16; cited 2002 Jul 9]. Available from: http://www.cancer-vin.or2i.
Other Articles
Newspaper Article
Shaffer RA. Advances in chemistry are starting to unlock the mysteries of the brain: discoveries could help cure alcoholism and insomnia, explain mental illness. Wall Street journal 1977; Aug 12: 1 (col 1), 10 (col 1).
Magazine Article
Roucehe B. Annals of Medicine: the Santa Claus culture. The New Yorkers 1971, Sep 4: 66-81
16. Case Reports
Papersoncasereports(onetofivecases)mustfollowtheserules:• Maximumof1,000words• Maximumofthreefigures/tables• Maximumoffivereferencesquoted• Havingauniquelessoninthediagnosis,pathologyormanagementofthecaseismorevaluablethanmerefindingofarareentity.Beingabletoreporttheoutcomeandlength of survival of a rare problem is more valuable than merely describing what treatment was rendered at the time of diagnosis.
17. Submission
Manuscript(s) may be submitted in English or Bahasa Malaysia. For the manuscript written in BahasaMalaysia,itmusthaveprecisetranslationofscientificormedicaltermsused,accompa-nied by an abstract in English.
All manuscripts to be submitted in softcopy using Microsoft Word Version 2007 to:
Chief EditorJurnal Kesihatan johor
OfficeoftheJohorDeputyDirectorofHealth(Pharmacy)Johor State Health Department
D/A Hospital Permai LamaJalan Persiaran Permai,
81200 Johor Bahru
Email: [email protected]
x

1Jurnal Kesihatan Johor, Vol. 11, 2014
1
Volume 11
2014Return of Unused Medications
from Wards to Inpatient Pharmacyat Sultanah Aminah Hospital, Johor Bahru, Johor
Lim M.T. 1, Md. Said S.N.1
1 Pharmacy Department, Sultanah Aminah Hospital, Johor Bahru, Johor
Corresponding author:
Lim Ming TsueyPharmacy Department,Sultanah Aminah Hospital Johor Bahru, Jalan Persiaran Abu Bakar Sultan,80100 Johor BahruPhone: +607-2257000 ext 2282Fax: +607-2233619Email: [email protected]
Abstract
Introduction: Unused medications left in the ward may lead to undesirable medicine wastage. This study determined the percent-age of unused medication return and identi-fied the reasons for their return.Methods: A cross-sectional study was carried out in the orthopaedic and surgical wards for two months. These wards demonstrated higher drug consumption by patients than in other wards. Returned unused medications placed in allocated boxes from orthopaedic and sur-gical wards were collected once a week and recorded by the researcher and verified bythe staff nurse. Daily information on quan-tity, cost and types of medications being is-sued out to orthopaedic and surgical wards were obtained from the in-patient pharmacy for the study. Results: Medications returned from orthopaedic and surgical wards based on quantity were 3.2 percent (628) and 4.5 percent (604) of a total 19,305 and 13,589 items respectively. Injectable medications represented the highest share of the total quantity and cost of unused medications. The percentage of non-reusable discarded medi-cations was less than 0.1 % of the total cost of medication supplied. The respective cost of usable returns from the orthopaedic and sur-gical wards over two months were 4.0 percent (RM2,558.66) and 5.0 percent (RM4,458.43) of total cost of medications supplied. The main reasons for drug returns were discharged and
deceased patients before completing their intended medications. Conclusion: There is significantcontributionfromunavoidableuti-lizable drug returns. There is need for proper management via routine monitoring and early intervention by pharmacists at the medication use process, and also recognizing processes which are prone to errors. This will help mini-mise availability of unused medications or re-turns and subsequently reduce undesirable medicine wastage.
Keywords: unused medication, returns, med-icine wastage, pharmacy, wards
Introduction
Medications are supplied to patients in wards in Hospital Sultanah Aminah Johor Bahru (HSAJB) via one of the drug distribution sys-tems: Unit Dose System (UDS), Unit of Use System (UOU) or Floor Stock System. In HSAJB, the UDS distribution system may dif-ferasitdependsonthespecificneedsofthelocal hospital or organization. However, this hospital adheres to the basic distinctive ele-ments of UDS: dispensed medications are in a ready-to-administer form; medications are contained in a single unit package; and are supplied for the required number of doses to be used within 24-hours. They are placed in patient’s individual labelled drawer in a medication trolley according to the time slot schedule for drug administration1. For injec-tion medications, the amount for use is suf-ficient for 24 hours only. Numerous studiesconcerning UDS have been published over the past years supporting the fact that UDS, in comparison to other drug distribution sys-tems reduces medication error and decreases the total cost of medication-related activities 2-6 such as adverse drug reactions, untreated indication or medication use without indica-tion or improper drug selection. In HSAJB, UOU will be gradually replaced by UDS and is expected to be fully implemented by 2016.

2Jurnal Kesihatan Johor, Vol. 11, 2014
There have been unused medications returned from wards using either the drug distribution systems- UDS or UOU to the inpatient phar-macy. Existing medications not administered to patients are still being kept or found in wards during periodical ward check. The re-turns or unused medication in wards could occuratanyofthefivestagesofmedicationuse process: prescribing; transcribing and documenting; dispensing; administering and monitoring. For example, in the ordering or prescribing stage, a wrong medication, dose or route can be ordered particularly for pa-tients with known allergies. Other types of er-rors committed at this stage include orders for contraindicated medications and inappropri-ate doses. Medication returns can be gener-ated during transcribing, dispensing or deliv-ery stages which include failure to deliver the right medications for the patient or incorrectly fillingtheorder.Thenextpossibilityisatthemedication administration stage where nurs-es are primarily involved. For example, fac-tors such as distraction, interruptions as well as lack of communication result in omission doses or missed doses to patients. It is impor-tant to ensure that unused drugs are returned to the pharmacy department immediately as any unused medications left in the wards may pose a potential source of medication errors7 and unwanted medicine wastage. Medicine wastage is a big problem to healthcare delivery systems. Not much is documented regarding medicine wastage in hospital setting. Stud-ies on medicines wastage done in developed countries are mainly on medicines returns to pharmacies which represent only a small pro-portion of the overall medicines wastage. For example, only 23% in USA and 22% in New Zealand of unused medicines were returned to pharmacies8. ObjectivesThe objectives of this study are to quantify the amount of returned unused medication, identify contributing factors and most likely reasons for their returns from wards. Materials and Methods
MethodThis study is registered on the Malaysian Na-tional Medical Research (ID NMRR-13-766-15922) and approved by the Medical Research Ethical Committee of Ministry of Health Ma-laysia. This was a cross sectional study con-ducted from 1st April 2013 to 31st May 2013 on unused medications from the orthopaedic
wards (West 2 Orthopaedic and West 3 Or-thopaedic) and surgical wards (East 2 Surgi-cal and West 4 Surgical) at Sultanah Aminah Hospital, Johor Bahru. These four wards were selected because the patients in these wards consumed more medications than patients at other wards. The main steps involved nurses of four selected wards who were briefed on how to establish the reasons for unused medica-tions occurrences before placing them into the allocated empty boxes to be returned to the pharmacy. The boxes were labelled according to the number of possible reasons determined namely; 1) patient discharged/deceased 2)change in treatment regimen 3) change or discontinued medication and 4) change in dosage form. In addition, a book was also provided to nurses in each ward to record why a particular medication was not administered to the patient as prescribed. The quantity and cost of those returned medications which met the conditions suitable for reuse were calcu-lated and recorded before returning to phar-macy stocks. (According to one of the policies and procedures in the drug distribution and control distribution by American Society of Hospital Pharmacists, only those medications returned in unopened sealed packages may be reissued or enter into pharmacy stock 9 )The returned medications which were *suit-able for reuse and returned to pharmacy stocks were in the following conditions:
1) In an original or dispensed container/ vial/ampoule where no dose was withdrawn. 2) Preserved in a refrigerator where the cold chain was not compromised.* Loose tablets or capsules which were not in blister packs were considered unsuitable for reuse.
The percent of returned medications in term of quantity or cost was calculated as shown below:
Percent of returned medication ( in term of quantity )= total quantity of medications returned X
100 %total quantity of medications supplied
Percent of returned medication ( in term of cost)
= cost of returned medications X 100 %total cost of medications supplied

3Jurnal Kesihatan Johor, Vol. 11, 2014
Table 1: Drugs Supplied and Returned from Orthopaedic Wards
Dosage Form
Supplied Return Discarded Medications*
Quantity Cost Quantity Cost Quantity Cost n RM n (%) RM (%) n (%) RM (%)
Injections
TabletCapsule
Miscella-neous
12,943 59,929.52 336 (1.7) 2,440.24(3.8) 0 (0.0) 0 (0.0) 6,237 3,880.41 292 (1.5) 124.59 (0.2) 78 (0.4) 6.17 (<0.1)
125 314.05 0 (0) 0.00 (0.0) 0 (0.0) 0 (0.0)
Total 19,305 64,124.08 628 (3.2) 2,564.83 (4.0) 78 (0.4) 6.17 (<0.1)
Note: * Loose tablet/capsules which are not in blister packs are considered unsuitable for reuse
Data CollectionUnused medications were collected on every Wednesday from 1st April 2013 to 31st May 2013 from the respective wards in allocated boxes. This event was recorded by the re-searcher and verified by the staff nurse onduty. At the same time, the researcher also collected data on the quantity and type of medications which were issued out to both orthopaedic and surgical wards daily.
Data AnalysisThe data collected was analyzed and evalu-ated using Microsoft Excel Spreadsheet Pro-gram. The total cost (in Malaysian Ringgit) and percentage of unused medication returns and their corresponding reasons for returns from each ward were determined. The medi-cation cost was based on latest drug prices fromapprovedcontractortenderfiguresbe-tween the supplier and government.
Results
Over a period of two months, the total cost of unused medications collected from orthopae-dic and surgical wards was RM2,564.83 and RM4,458.43 respectively which worked out to
be 4% and 5% of the total cost of medica-tions supplied respectively ( see Tables 1 & 2) . Cost of injectable medications represented the highest share of total cost of the supplied and returned unused medications. A percent-age of oral medications which were not in blis-ter packs were considered unsuitable for re-use and discarded in orthopaedic wards. This made up less than 0.4 % and 0.1 % in terms of quantity and cost respectively. The oral medications in a single unit package found in the surgical wards were deemed reusable. Therefore, costs of reusable returned medi-cations from both orthopaedic and surgical wards were at RM2,558.66 and RM4,458.43 respectively over a period of two months.
The reasons for medications being returned unused resulting in high returns in orthopae-dic wards are shown in Figure 1, mainly due to patients being discharged or patients hav-ing passed away (90.5%) before consuming the medications. This is followed by changed treatment regime at 4.7%. Similarly, surgi-cal wards also showed similar findings at94.2%, followed by a change of dosage form at 2.8%.

4Jurnal Kesihatan Johor, Vol. 11, 2014
Table 2: Drugs Supplied and Returned from Surgical Wards
Dosage Form
Supplied Return Discarded Medications*
Quantity Cost Quantity Cost Quantity Cost n RM n (%) RM (%) n (%) RM (%)
Injections
TabletCapsule
Miscella-neous
11,311 88,009.45 553 (4.1) 4,438.00 (4.9) 0 (0.0) 0 (0.0) 2,278 1,049.45 51 (0.4) 20.43 (0.1) 0 (0.0) 0 (0.0)
0 0.00 0 (0.0) 0.00 (0.0) 0 (0.0) 0 (0.0)
Total 13,589 89,058.90 604 (4.5) 4,458.43 (5.0) 0 (0.0) 0 (0.0)Note: ∆ Loose tablets/capsule in single unit package which are reusable
Figure 1: Breakdown of Reasons for Unused Medication Returns from Orthopaedic AndSurgical Wards
Discussion
Results showed that the amount of medi-cations returned from surgical wards were higher than orthopaedic wards: 4.0 percent (RM2,558.66) and 5.0 percent (RM4,458.43) of the total cost of medications supplied for orthopaedic and surgical wards respectively. These usable returns which were salvaged were from the oral medications which were still in single unit packages or original blis-ter packs and those injectable medications in original vials or ampoules where no doses were withdrawn. There was no or zero wast-age of oral medication returns from surgical wards as the returns were either in single unit packages or original blister packs which were suitable for reuse or enter into pharma-
cy stock. However, those loose oral medica-tions which were not in single unit packages from orthopaedic wards were disposed which resulted in wastage of RM 6.17 as shown in Table 1 and Table 2.At Sultanah Aminah Johor Bahru Hospital, rea-sons for unused medication return from the wards are deceased or discharged patients, altered treatment regimen and dosage form and drug discontinuation or change before completing their intended doses. The reason for unused medication returns was highest for patient discharged or deceased amount-ing to 90.5 per cent and 94.2 per cent for or-thopaedic and surgical wards respectively. In a Swedish study, similar reasons for unused medication return to pharmacies such as de-ceased patient, therapy changes or there was

5Jurnal Kesihatan Johor, Vol. 11, 2014
no need for the medicine anymore were also identified10. Another study by Braund R. and hercolleaguesonidentificationofreasonsformedication returns in New Zealand reported that the main reason indicated for medication returns was change in treatment 11.It becomes worrisome when unused medi-cation returns mainly comprise the inject-able type since errors involving injectable medications have a higher potential for caus-ing severe harm or having adverse effects to patients as compared to medications ad-ministered through other routes. Studies of deaths caused by medication errors reported to FDA from 1993 to 1998 revealed that in-jectable medications were most often prob-lematic, making it the second most common type of error being administering the wrong medications to a patient 12. Both pharmacists and nurses have to ensure any unused medi-cationsproducedatanyofthefivestagesofmedication use process must be returned to the pharmacy immediately especially those medications with similar names or packaging, that are not commonly used or prescribed or prone to misreading of medication names that look similar which is one of the common causes for medication errors. In addition, American Society of Hospital Pharmacists (ASHP) also recommended that all discontinued or unused medication should be returned to pharmacy immediately on discontinuation or at patient discharge so as to prevent medication errors 7. It was reported that prescribing/ordering stages often initiates a series of errors result-ing in patients receiving the wrong dose or medication. The percentage of medication er-rors attributed to the ordering or prescribing stage ranges from 3 to 79 percent 13-14. An-other possible medication error route is at the medication administration stage where nurses are primarily involved in both dispensing and preparation of medications. For example, fac-tors such as distraction, interruption as well as lack of communication, can result in com-mission, omission doses or missed doses in patient. In one of the surveys conducted by Rogers and colleagues, it was found that the likelihood of a medication error tripled if the nurse worked more than 12.5 hours provid-ing direct patient care 15. About 58 percent of actual errors and 56 percent of near misses were associated with medication administra-tion. A review of incident reports done by Wolf and colleagues found that the major contrib-uting factors to medication errors were inex-periencestaff,followedbyinsufficientstaffing16 and also with those nurses working rotating
shifts 17.
LimitationThis study did not investigate further the stat-ed reasons for the returns by the nurses. The returns could have resulted from medication errors such as missed, omission, wrong time or improper dose errors and also due to ward characteristics of the wards concerned which should be looked into. This study also did not investigate the extent and type of medication errors arise from unused medication in the wards.
Conclusion
This study indicates that the generation of un-used medication returns in certain situations are unavoidable or not preventable to certain degreeespeciallyunfinishedmedicationorigi-nating from discharged or deceased patients which was the main indicated reason for the returns. The returns due to other reasons which was around 10 percent and worked out to be around 0.5% of the total cost of medi-cations. The usable returns ranged from 4 to 5 percent and discarded returns were less than 0.1 percent of total cost of medication supplied. There is need for a better control system to minimize unwanted or undesirable wastage. For medication returns leading to medication error where the source of error lies with the personnel involved, the commit-ment of the doctor who wrote the prescrip-tion, pharmacist who dispensed it and the nurse who received the medication and ad-ministeredittopatientsbecomesignificantlyvaluable in keeping patients safe. Staff re-training especially on education strategies to improve medication safety and avert unnec-essary medication errors by recognizing the error prone processes should be considered. Frequent periodic audit on the availability of unused medications by both pharmacists and nurses in the wards must be carried out to help in this area. Acknowledgements
The authors would like to thank the Di-rector-General of Health, Malaysia for his permission to publish this article. The author is very grateful to all those who have con-tributed in the successful completion of this study. Also would like to thank the staff in Or-thopaedic and Surgical wards for their coop-eration.

6Jurnal Kesihatan Johor, Vol. 11, 2014
American Society of Hospital Pharmacists. ASHP statement on unit dose drug distribu-tion. Am J Hosp Pharm 1989; 46:2346.
Shultz SM, White SJ, Latiolais CJ. Medica-tion errors reduced by unit dose.Hospitals. 1973; 47:107-112.
Means BJ, Derewicz HJ, Lamy PP. Medi-cation errors in multidose and computer- based unit dose drug distribution system. Am J Hosp Pharm. 1975; 83:186-191.
Dean BS, Allan EL, Barber ND, Barker KN. Comparison of medication errors in an American and British hospital. Am J Health Syst Pharm. 1995; 52:2543-2549.
Hynniman CE, Conrad WF, Urch WA, Rud-nick BR, Parker PF. A comparison of medi-cation errors under the University of Ken-tucky unit dose system and traditional drug distribution system in four hospitals. Am J Hosp Pharm. 1970;27:803-814.
Taxis K, Dean B, Barber N. Hospital drug distribution systems in UK andGermany- a study of medication errors. Pharm World Sci. 1998; 21:25-31.
American Society of Hospital Pharmacists. ASHP guidelines on preventing medica-tion errors in hospitals. Am J Hosp Pharm. 1993;50:305-14.
Braund R. Peake BM, Shieffelbien L. Dis-posal practices for unused medicines in New Zealand. Environment International Journal. 2009;35(6):952-5.
American Society of Hospital Pharmacists. ASHP technical assistance bulletin on hos-pital drug distribution and control. Am J Hosp Pharm. 1980; 37:1097-1103.
1.
2.
3.
4.
5.
6.
7.
8.
9.
References Ekedahl AB. Reasons why medicines are returned to Swedish pharmacies unused. Pharm Worls Sci. 2006; 28(6):352-8.
Braund R, Chuah F, Glibert R, Gn G, Soh A,TanLY,etal. Identificationof reasonsfor medication returns. NA Fam Physician. 2008; 35: 248-252.
Phillips J, Beam S, Brinker A, et al. Retro-spective analysis of mortalities associated with medication errors. Am J Health Syst Pharm. 2001; 58:1835-41.
Kaushal R, Bates D. Computerized physi-cian order entry (CPOE) and clinical deci-sion support systems (CDSSs). In: Shoja-nia K, Duncan B, McDonald K, et al., eds. Making health care safer: a critical analy-sis of patient safety practices. Rockville, MD: AHRQ; 2001. p. 59-69.
Raju TN, Kecskes S, Thorton JP, et al. Medication errors in neonatal and paediat-ric intensive care units. Lancet. 1989; 2: 374-6.
Rogers AE, Hwang WT, Scott LD, et al. The working hours of hospital staff nurs-es and patient safety. Health Aff. 2004; 23(4):202-12.
Wolf ZR, Hicks R, Serembus JF. Character-istic of medication errors made by students during administration phase: a descriptive study. J Prof Nurs. 2006;22(1): 39-51.
O’Shea E. Factors contributing to medica-tion errors: a literature review. J Clin Nurs. 1999;8 : 496-504.
10.
11.
12.
13.
14.
15.
16.
17.

7Jurnal Kesihatan Johor, Vol. 11, 2014
2
Volume 11
2014
The Impact of 5S Implementationin Reducing Drug Filling Timein an Out-patient Pharmacy
at Simpang Renggam Health Clinic, Johor, Malaysia
Ong B.Y.1, Kerk Y.H.1, Wong P.G.2, Lim Y.H.3, Wong S.W.4
1 Department of Pharmacy, Mengkibol Health Clinic2 Department of Pharmacy, Simpang Renggam Health Clinic
3 Department of Pharmacy, Paloh Health Clinic4 Department of Pharmacy, Layang-Layang Health Clinic
Corresponding author:
Ong Bee Yean,Pharmacy Department,Mengkibol Health Clinic,Jalan Mengkibol,86000 Kluang, JohorPhone: +607-7765343Fax: +07-07-7765754Email: [email protected]
Abstract
Introduction:5ScomesfromfiveJapanesewords Seiri (sort), Seiton (set in order), Seiso (shine), Seiketsu (standardize), and Shitsuke (sustain). It helps to improve the physical environment of a workplace and Total Qual-ity Management process. 5S has been prac-ticed in the Ministry of Health Malaysia many years ago. However, this practice is not ac-tively implemented in all the health facilities partly because there is insufficient evidenceto show its positive impact on organizational performance. This study aims to identify the effectiveness of 5S in improving the drug dis-pensingprocessparticularlyduringdrugfill-ing.Thecomparisonofdrugfillingtimebeforeand after 5S implementation was studied.Methods: This cross-sectional and interven-tional study was carried out in the Out-patient Pharmacy at Simpang Renggam Health Clinic (SRHC). A total of 15 prescriptions that con-sisted of 4 items of drugs were designed and filledbyfourassessors.Atotalof60sampleswere collected. The time required to com-pleteaprescriptionfillingtaskwasrecordedbefore and after the implementation of 5S. Extra time taken to get the correct drugs
wasalsorecordedforthosewronglyfilledorunfilleddrugs.Results: There was a signif-icant difference in drug filling time with 5S(M=63.28, SD=34.34) and without 5S inter-vention (M=78.10, SD=42.04); t(59)=3.074, p<0.05.Withthepracticeof5S,thedrugfill-ing time was reduced from a range of (28.06s - 210.23s) to (19.06s - 156.80s). Conclu-sion: 5S was found to be effective in reduc-ingdrugfillingtimeandimprovingtheoveralldrug dispensing process at SRHC.
Keywords:5S,dispensingprocess,drugfillingtime, organizational performance
Introduction
Time, money and expertise are resources that are indispensable to productivity, perfor-mance,efficiency,successandgrowthofanyhealth institution [1]. In order to ensure qual-ity service, waiting and treatment time are high in our Ministry of Health’s list of priorities and consideration. Many patients seek private healthcare and rather pay for what they ex-pect/perceive as fast, efficient and superiorservices. For the most part, patients generally want to avoid heavy congestion and long wait-ing times evident at most public healthcare fa-cilities [2].In a study carried out at the University of Southern California, it was shown that the overall satisfaction of patients with pharma-ceutical services was closely related to their satisfaction with waiting time [3]. Excessive waiting time may eventually result in loss of patronage in a competitive health care sys-tem and lead to poor patient compliance when patientsdonotrefilltheirprescriptionsinthepharmacy [4]. One of the important elements inimprovingefficiencyinthehealthcareser-

8Jurnal Kesihatan Johor, Vol. 11, 2014
vices ismanagingthepatientflow.It repre-sents the ability of healthcare system to serve patientsquicklyandefficientlythroughoutthetreatment period [2]. In this context, the man-agement of the outpatient pharmacy depart-ment should strongly emphasise on a brilliant medication delivery system to ensure provi-sion of excellent services. Various studies have shown that the practice of 5S is an effective tool to improve organiza-tional performance [5,6,7].5ScomesfromfiveJapanese words - Seiri (sort), Seiton (set in order), Seiso (shine), Seiketsu (standardize) and Shitsuke (sustain). This system helps to organizeaworkplace forefficiencyandopti-mize quality and productivity via monitoring an organized environment [6]. Most Japanese companies claimed that 5S had improved their physical environment and their think-ing processes as well. However, Warwood and Knowles [8] stated that the implementation of 5S tended to depend on the stage of 5S pro-gram and commitment from the staff.In Malaysia, the Standards and Industrial Research Institute of Malaysia (SIRIM) has played an effective role to encourage the uti-lization 5S concept among Malaysian indus-tries [9]. However, this practice is not actively implemented in all the health facilities partly because of insufficient evidence to show itspositive impact on the local organizational performance. Since most of the waiting time in the pharmacy can be accounted by delay in processing components of the dispensing pro-ceduressuchasprescriptionscreening,filling,labeling and dispensing, this study aims to identify the effectiveness of 5S in improving the drug dispensing process particularly dur-ingdrugfilling.Thecomparisonofdrugfillingtime before and after the 5S implementation was studied.
Materials and Methods
This research is registered on the Malaysian National Medical Research Register (ID NMRR-14-10-19329). Ethical approval was not appli-cable in this research as there was no human intervention involved.This was a cross-sectional and interventional study that was carried out in the Out-patient Pharmacy at Simpang Renggam Health Clinic (SRHC) from July to December 2013. A pre-study survey was done to estimate the time spentinprescriptionscreening,fillinganddis-pensing. The survey showed that more than 70%ofthetimewasspentinthedrugfillingprocess especially during peak hours.
This study was conducted in two phases in which time measurement was taken before and after the implementation of 5S program. A total of 15 prescriptions were designed. There were four items of drugs in each prescription which consisted of all the categories of drugs listed in the Drug Formulary of SRHC except psychotropic drugs. One pharmacist and three assistant pharmacists were randomly selected toperformthedrugfillingprocess.Staffswithless than one year of working experience were excluded in this study. Allthe15prescriptionswererepeatedlyfilledby every assessor. Data were collected by ob-serving the time required to complete a pre-scriptionfillingtask.Themeasurementoftimebegan when assessors received the prescrip-tions and ended when all the drug items in eachprescriptionwerecompletelyfilled.Timewas recorded in seconds(s) by using stop clocks which were synchronized at the begin-ningofthestudy.Aftercompletionofdrugfill-ingprocess,allthefilleditemswerecheckedforanywronglyfilledorunfilleddrugs.Theas-sessors who made the errors were then asked tore-fillthecorrectdrugs.Extratimetakentofillthecorrectdrugsfromthepharmacycoun-ter was recorded. Post-interventional data was collected four months later when 5S was fully implemented. The procedures of recording the drugfillingtimewererepeatedlikeinthepre-interventional study. Analyses were conducted using Statistical Package for Social Sciences (SPSS) version 16.0. The data was normally distributed. Thus, Paired-sample T-test was used to analyse pre and post data. The null hypothesis of this study wasthattherewasnosignificantdifferenceinthe drug filling time before and after imple-mentation of 5S.
Results
A total of 60 samples was collected and analy-sed for pre and post 5S implementation re-spectively. Figure 1 shows that before the implementation of 5S, it took the assessors about28.06to210.23secondstofillthedrugitems in a prescription whereas after applying the system, the time range for the assessors to respond to the prescription drug request reduced to a range of 19.06s to 156.80s.

9Jurnal Kesihatan Johor, Vol. 11, 2014
In Paired-sample T-test analysis, the time taken to fill each prescription was reducedin post-5S study (M=63.28s, SD=34.34s) as compared to pre-5S study (M=78.10s, SD=42.04s). At 95% confidence intervallevel, time reduction after 5S implementation ranged from 5.17s to 24.46s. Taking p=0.05 as the arbitrary significant level, a p valueof0.003showedthattherewasasignificantdifference between drug filling time beforeand after implementation of 5S practice. Therefore, null hypothesis of this study was rejected.
Discussion
The findings of this study revealed thatincorporation of 5S into pharmacy practice was an effective way to improve the drug fillingprocessandorganizationalperformancelevel. The results of this study strongly agreed with previous studies conducted at different companies with different kind of products and services. The findings fromtheir studies also indicated that 5S was an useful quality management tool that caused improvement in the performance level in any of the organizations regardless of the types of products and services provided [5,6,10,11].5S creates a suitable and safety working environment for the health care workers by sorting out unwanted items, reorganizing the space and arranging everything in a work area forthemostefficientandeffectiveretrievalandreturning to its proper place [5,12]. This further helps to improve the productivity by reducing the amount of time wasted in searching through the unnecessary items and moving
Figure 1: Distribution of Drug Filling Time Before and After 5S Implementation
through a poorly organized workplace. In the Out-patient Pharmacy at SRHC, everything intheworkareawasproperlyidentifiedandlabelled after 5S was applied. Colour coding was used to label all the medicines according to their pharmacological classifications asto shorten the drug searching time. Besides that, those look-alike and sound-alike drugs were rearranged far from each other on the drug shelves as to avoid drug filling errors.This is critically important when the United States Pharmacopeia’s data reporting program (MEDMARX) reported that more than 1400 commonly used drugs were involved in errors linked to drug names that look alike or sound alike [13]. With the adoption of 5S, the daily follow-up tidiness in the pharmacy area is necessary to sustain a good working environment. It is believed that the workers may perform better in their jobs when the working environment is clean and conducive. Other than that, standardization which is practiced in the 5S concept created a consistent approach in which tasks and procedures are done. This is achieved by developing a work structure that will support the new practices and modify the current standards to make the process simpler and easier [5]. Standard procedures are crucial for new workers to execute their jobs smoothly and thus reducing medication errors and dispensing time. When everyone follows the standard procedures, the time taken for the whole dispensing process can be improved further.It ismostdifficulttosustainthe5Sconceptin a pharmacy setting. It is human nature to resist change and men have the tendency to

10Jurnal Kesihatan Johor, Vol. 11, 2014
Ndukwe HC, Fola T, Sariem NC. Factors in-fluencingwaiting time inoutpatientphar-macy of Lagos University Teaching Hospital. International Research Journal of Pharma-cy. 2011; 2(10):22-26.
Najmuddin AF, Ibrahim IM, Ismail SR. A simulation approach: improving patient waiting time for multiphase patient flowof Obstetrics and Gynecology Department (O&G Department) in local specialist cen-tre. WSEAS Transactions on Mathematics. 2010; 9(10):778-790.
AlexCetal.Identificationoffactorslead-ing to excessive waiting times in an am-bulatory pharmacy. Hosp Pharm. 1999; 34:707-712.
Margaret OA, Wilson OE. Patients’ response to waiting time in an out-patient pharmacy in Nigeria. Tropical Journal of Pharmaceuti-cal Research. 2003; 2(2):207-214.
Onyeji LI, Edoga MO, Umar S, Aneke EU. Enhancing productivity and safety in an
1.
2.
3.
4.
5.
return to their comfort zones of conventional ways and methods. Thus, a 5S audit can be a crucial tool to ensure accurate deployment of this practice in an organization [14]. In this context, internal or external audits are done regularly to identify the potential level of quality improvement in a real situation. It also helps to ensure that 5S is properly applied in the organization. However, there are other obstacles in the implementation of5Sprogram.Themostsignificantbarriersidentified are related to the lack of supportfrom the top management, lack of awareness andinsufficienttrainingamongthestaffs.Poor communication and support from the top management will influence results inmanaging resources such as time, budget and materials. The reasons given by them are the amount of time and money that would be required to implement the proposed activities in the 5S. In order to make the top management aware of the effectiveness of 5S, some performance indicators relating to the costsinvolved,profitsandworkqualityofthisapproach should be shown. As an example, we can compare the quality of production by a machine before and after the implementation of 5S activity. As mentioned in the study of Arash and Norzima [6], a private heavy machinery service provider in construction fields had achieved 50% improvementin their organizational performance after implementation of 5S. The overall performance before 5S implementation was 2.08 which had risen to 4.20 after implementing the system. In terms of time saving, another study was done by Prasetyawan [15] who had shown that therewasasignificantdifferenceinthetoolssearching time before and after the application of 5S practice in a paint oven workshop in Semarang.As suggested by Ho [14], training was the key of success for implementing the 5S. Since all employees participated in 5S activities, they were not able to standardise the activities without proper training. Thus, the first stepwas to train internal facilitator whose function was to organize and led other staffs in 5S activities. This was followed by organizing 5S awareness course for all the staffs. Without these efforts, no significant results from5Sprogram could be expected [16]. Besides that, thorough education and team based activities in 5S may lead to the development of self-directed employees and further improve pride and ownership in a work place, therefore, enhancing work performance. This study only investigated the time spent in
thedrugfillingprocesswith theassumptionthat other components in the dispensing procedurewentsmoothlywithoutinfluencingthe patients’ waiting time at pharmacy. As a recommendation, the time taken for the overall dispensing process is a major area to be explored in the effectiveness of 5S implementation in a pharmacy setting.
Conclusion
In conclusion, 5S implementation at the Out-patient Pharmacy at SHRC was effective and hadpositiveandsignificantimpactinreducingdrug filling time. The challenge ahead is toconvince the respective health facilities to fully implement this practice in their settings. Continuous assessment, staff training and continual support from the top management are crucial to ensure effective execution and practice of a 5S system.
Acknowledgement
The authors would like to thank the Director of Health Malaysia for permission to publish this paper. Deepest appreciation and gratitude are also dedicated to all the assessors for their valuable contribution in this study.
References

11Jurnal Kesihatan Johor, Vol. 11, 2014
engineering system using 5S: sinter plant store of ASCL as a case study. Journal of Engineering and Applied Sciences. 2008; 3(11): 884-892.
Arash G, Norzima Z. The impact of 5S implementation on industrial organiza-tions’ performance. International Journal of Business and Management Invention. 2013; 2(3):43-49.
Khanna VK. 5”S” and TQM status in Indian organizations. TQM J. 2009; 21:486-501.
Warwood SJ, Knowles G. An investigation into Japanese 5-S practice in UK industry. TQM Mag. 2004, 16:374-353.
Ho SK, Cicmil S, Fung CK. The Japanese 5-S practice and TQM training. Training Qual. 1995; 3:19-24.
Abd Rahman MN, Khamis NK, Mohd Zain R, Md Deros B, Wan Mahmood WH. Imple-mentation of 5S practices in the manufac-turing companies: a case study. Am J Appl Sci. 2010; 7(8): 1182-1189.
Gheorghe D. The “5S” strategy for contin-uous improvement of the manufacturing processes in autocar exhaust. Manage-ment & Marketing. 2008; 3(4):115-120.
6.
7.
8.
9.
10.
11.
Bahagian Amalan Perkembangan Farma-si, Kementerian Kesihatan Malaysia. Garis panduan amalan 5S di fasilti farmasi KKM. Malaysia: Kementerian Kesihatan Malay-sia; 2010.
United States Pharmacopeia [Internet]. U.S. Pharmacopeia 8th annual MEDMARX report indicates look-alike/sound-alike drugs lead to thousands of medication er-rors nationwide. U.S. Pharmacopeia 2008 Jan [cited 2013 Dec 30]. Available from: http://www.usp.org/aboutUSP/media/newsCenter.html?article=105435.
Ho SKM. The 5S auditing. Manage Audit J. 1999; 14:294-301.
PrasetyawanDW.Analisiseffisiensiwaktupencarian alat sebelum dan sesudah pen-erapan program 5S (Seiri, Seiton, Seiso, Seiketsu, Shitsuke) pada Bengkel Kenteng dan Cat Oven “X” di Semarang. Under-graduate thesis, Diponegoro University. 2009.
5S and Visual Control [Internet]. Manufac-turing Engineering Inc.; 2007 [cited 2013 Dec 30]. Available from: http://www.mf-geng.com/5S.htm.
12.
13.
14.
15.
16.

12Jurnal Kesihatan Johor, Vol. 11, 2014
Corresponding author:
Misbaha JilaniDisease Section,Johor Public Health Laboratory,Jalan Persiaran Tanjung, Tampoi,81200 Johor Bahru, JohorPhone: +607-238 7162Fax: +067-238 7215Email: [email protected]
Abstract
Introduction: Worldwide, there is an in-creasing trend of patients with pulmonary diseases caused by Non Tuberculous Myco-bacteria (NTM). The objective of this study is to collect and present available data to de-termine NTM recovery rate on sputum speci-mens received from Johor periphery health clinics over a 2-year period. Methods: We retrospectively reviewed the records of my-cobacterial cultures of sputum specimens at Johor Bahru Public Health Laboratory from 2011 to 2013. Results: The overall annual rate of NTM isolation from requested speci-mens increased from 7% in 2011 to 10% in 2013, while M. tuberculosis complex isolation remained stable, being 13% in both 2011 and 2012 and increased to 14% in 2013. Taking all positive culture specimens only, the an-nual number of NTM isolates increased from 39 (36.1%) in 2011 to 411 (42.8%) in 2013. During the study period, the most frequently isolated NTM group were Runyon Group IV (93.9%). Conclusion: The recovery rate of NTM from sputum specimens at Johor Bahru Public Health Laboratory has been increas-ing steadily from 36.1% in 2011 to 42.8% in 2013.
Keywords: Non Tuberculous Mycobacteria; Mycobacterium tuberculosis complex; Runyon Group; Public Health Laboratory
Introduction
Mycobacteria other than M. tuberculosis com-plex and M.leprosy are known as Non-Tuber-culous Mycobacteria (NTM) and also known by various acronyms e.g. atypical TB, Myco-bacteria Other Than Tubercle (MOTT), envi-ronmental mycobacteria and environmental tuberculosis.1 Currently, there are more than 125 members of the genus Mycobacterium, which are diverse in pathogenicity, in vivo adaptation, virulence, response to drugs and growth condition.2 A comprehensive list of all validated NTM species has been updated where the latest species found in 2013 was Mycobacterium yongonense which a slow-growing non-chromogenic species closely re-lated to Mycobacterium intracellulare.3
In Malaysia, TB remains a serious pub-lic health problem. In countries with a high TB prevalence, patients with acid-fast bacilli (AFB)-positive sputum based on direct micro-scopic examination are considered as sputum smear positive (SS+) for pulmonary TB (PTB) and treated with anti-tuberculous drugs. This may lead to false diagnoses thus institution of unnecessary treatment to patients with NTM.4,5,6 Information on the frequency of the disease is useful even though NTMs do not seem to be very transmissible from person to person, especially because the Malaysia population is aging and more persons may suffer from chronic disease and possible immunosuppres-sion and therefore be at risk for NTM disease. Risk groups for pulmonary NTM disease in-clude patients with COPD, bronchiectasis, previous TB, and those using corticosteroids
3
Volume 11
2014
Non Tuberculous Mycobacteria (NTM)Recovery Rate by Johor Bahru Public Health Laboratory
from 2011 to 2013
Misbaha J1, Norazlina A1,Badrul H.A.S.2
1Tuberculosis Unit, Disease Section, Johor Bahru Public Health Laboratory, Johor,Malaysia
2Communicable Disease Control Unit, Public Health Division, Johor State HealthDepartment

13Jurnal Kesihatan Johor, Vol. 11, 2014
7 or undergoing organ transplant. 8Aspecificrisk groups for pulmonary NTM disease with M.abscessusarecysticfibrosispatients.9
Often the clinical significance of isolation ofNTM from non-sterile specimens such as spu-tum is uncertain, and the clinical, radiogra-phy and microbiology criteria of the American Thoracic Society (ATS) are applied to come to a conclusion about the necessity of treat-ment. 17Aretrospectivereviewofpatientfilesin the Netherlands led to the conclusion that theclinicalrelevancedifferedsignificantlybyNTM species. 10 For instance, in most cases where M. szulgai was isolated, treatment was needed. In contrast, isolation of M. gordonae was hardly ever clinically relevant. NTM isolation in Johor has increased, and it is crucial to differentiate between PTB and NTM lung disease.5,11,12 The objective of this study is to collect and present available data to determine the NTM recovery rate from sputum specimens over a 3-year period in Johor Bahru Public Health Laboratory.
Materials and Methods
This research is registered on the Malaysian National Medical Research Register (ID NM-RR-14-334-19446).
Study SubjectsWe retrospectively reviewed records from the Tuberculosis Unit, Johor Public Health Labo-ratory during the 3-year period from 2011 to 2013. Johor Public Health Laboratory is a secondary referral laboratory in Johor Bahru, Johor. Samples of all suspected PTB cases at the periphery were received from health clin-ics throughout Johor.
Table 1: Recovery Rate of Mycobacterial Isolates of Mycobacterium tuberculosis complex and NTM, Johor Bahru Public Health Laboratory, 2011-2013
2011 2012 2013No. of requested specimensPositive culture specimens, nM. tuberculosis complex (%)NTM
545108
69 (63.9%)39 (36.1%)
3677792
459 (57.9%)333 (42.1%)
3941961
550 (57.2%)411 (42.8%)
Sputum Specimen ProcessingSputum specimens were stained using the Ziehl-Neelsen method according to the guidelines provided by the Ministry of Health, Malaysia.13Apositivesmearwasdefinedascontaining>1AFBper100high-powerfields.Sputum specimens were decontaminated us-ing 4% natrium hydroxide (NaOH) method. Solid media for mycobacterial culture were used. The processed specimens were then in-oculated onto Ogawa and Lowenstein Jensen solid media (ThermoScientific Microbiology,Malaysia). Subsequently, all positive isolates were sent to Tuberculosis Reference Labora-tory at the National Public Health Laboratory in Sungai Buloh, Selangor for Runyon Group identification.
Results
Annual Numbers of Mycobacterial IsolatesFrom 2011 to 2013, the number of samples requested for mycobacterial culture increased steadily from 545 in 2011 to 3941 in 2013. During this period, 1861 sputum specimens from 7371 patients were mycobacteria-posi-tive. These included 1078 (58%) M. tubercu-losis complex and 783(42%) NTM isolates.There was a change in the recovery rates of both M. tuberculosis complex and NTM among the requested specimens (Table 1). The over-all annual rate of NTM isolation from request-ed specimens increased from 7% in 2011 to 10% in 2013, while M. tuberculosis complex isolation remained stable, being 13% in both 2011 and 2012 and increased to 14% in 2013. Taking all positive culture specimens only, the annual number of NTM isolates increased from 39 (36.1%) in 2011 to 411 (42.8%) in 2013.
Types of NTM Group During the study period, the most frequent-ly isolated NTM group was Runyon Group IV
(93.9%) followed by Runyon Group II (3.4%), Runyon Group 1 (2.4%), and untypable group (0.3%).(Table 2)

14Jurnal Kesihatan Johor, Vol. 11, 2014
Referring to Figure 1, positivity rate of NTM isolates increases as age group of patients rises.
Discussion
The recovery rate of NTM among requested specimens and the annual number of NTM isolates increased steadily over a 3-year pe-riod at Johor primary care level particularly after2012.Thisfindingisconsistentwithanincreasing incidence and prevalence of NTM lung disease worldwide.12,13,14,15
There are several explanations for the in-creased recovery of NTM broadly divided into environmental sources and host factor. It is generally accepted that environmental sourc-es, especially municipal water systems, are the reservoir for most human infections caused by NTM. Aerosolised water exposure within mod-ern populations (e.g., showers, hot tubs, etc.) could be an important reservoir for NTM lung disease.16 NTM are inhaled as aerosol droplets so they may be cultured if sputum samples are obtained right after environmental expo-sures. This probably contribute to most of the
single NTM isolates found.17
Our findings show that the most frequent-ly isolated NTM group was Runyon Group IV (93.9%) followed by Runyon Group II (3.4%), Runyon Group 1 (2.4%), and untypable group (0.3%).Nofurtherspeciesidentificationwasperformed by the National Public Health Lab-oratory. According to reviewed data from 14 countries, the International Union against Tu-berculosis and Lung Disease (IUATLD) found that M.avium complex (MAC) was the most frequent species isolated in all these countries, which included China, India and Korea. While M. fortuitum was the most frequently encoun-tered species in Belgium (2.1%), the Czech Republic (17.5%), Denmark (5.3%), Finland (6.7%), France (6.5%), Germany (12.2%), Italy (2.5%), Italy (2.5%), Portugal (16.5%), Spain (10.8%), Switzerland (17.5%), Tur-key (33.9%) and the United Kingdom (6.0%). There is no evidence of human-to-human transmission of NTM. Most infections were found to be acquired either from water (treat-ed or untreated) or soil. MAC and M. fortuitum are frequently isolated from the drinking wa-ter distribution systems and swimming pools
Table 1: Runyoun Group isolates, 2011-2013
Year Runyoun Group IV IV II I Unknown
201120122013Total
36326373
735 (93.9%)
0118
19 (3.4%)
2619
27 (2.4%)
101
2 (0.3%)
Figure 1: Age Group of Patients with Positive NTM Isolates
*Number of patients with unknown age:20

15Jurnal Kesihatan Johor, Vol. 11, 2014
NTM Booklet, NTM Info & Research, Florida USA, 2013.
Krishnamoorthy Gopinath and Sarman Sing: Non-Tuberculous Mycobacteria in TB_Endemic Countries: Are we neglecting the danger? April 2010, Vol. 4 Issue 4 PLoS Neglected Tropical Disease.
List of Prokaryotic names with Standing
1.
2.
3.
in both developing and developed countries.18
Ourfindingswarrantustofurtherinvestigatethe potential source(s) of NTM in health clinic setting.The effect of age on the clinical presentation of tuberculosis has been studied in several researches where tuberculosis appears to be more common in older patient.19-23 Given that some host factors such as old age and chronic obstructive pulmonary disease are risk factors of NTM lung disease 24,25 the increasing num-ber of aging population and the prevalence of chronic obstructive pulmonary disease may also contribute to the increase of NTM isolates in Johor. There is also great variability in age and sex characteristics for NTM in other stud-ies conducted elsewhere.26
Our study has several limitations. First, it was a retrospective survey at a single public health laboratory as we serve as the culture centre for district health clinics in Johor. Thus, our data could be biased by the demographic and clinical characteristics of the patients visiting ourhealthclinics.Second,theclinicalsignifi-cance of the isolated NTM was not evaluat-ed. Third, this study analysed the number of culture-positive mycobacterial isolates rather than the number of patients with positive my-cobacterial culture. Therefore, our data do not permit us to estimate the true change of dis-ease prevalence in patients during the study period.
Conclusion
In conclusion, the recovery rate of NTM from sputum specimens at Johor Bahru Public Health Laboratory has been increasing steadi-ly from 36.1% in 2011 to 42.8% in 2013. Acknowledgement
The author(s) would like to thank the Director General of Health Malaysia for permission to publish this paper.
References
in Nomenclature - Genus Mycobacterium http://www.bacterio.cict.fr/m/mycobac-terium.html accessed on March, 25th 2013.
Van Crevel R, de Lange WC, Vanderpuye NA, van Soolingen D, Hoogkamp-Korstanje JA, van Deuren KM, et al. The impact of nontuberculous mycobacteria on manage-ment of presumed pulmonary tuberculosis. Infection 2001; 29:59-63.
Jeon K, Koh WJ, Kwon OJ, Suh GY, Chung MP, Kim H, et al. Recovery rate of NTM from AFB smear-positive sputum speci-mens at a medical centre in South Korea. Int J Tuberc Lung Dis 2005; 9:1046-51.
Maiga M, Siddiqui S, Diallo S, Diarra B, Traore B, Shea YR, et al. Failure to recog-nize nontuberculous mycobacteria leads to misdiagnosis of chronic pulmonary tu-berculosis. PLoS One2012; 7:e36902.
Andrejak C, Nielsen R, Thomsen VO, Du-haut P, Sorensen HT, Thomsen RW: Chronic respiratory disease, inhaled corticosteroids and risk of non-tuberculous mycobacteri-osis. Thorax 2012, 68(3):256-262.
Padoveze MC, Fortaleza CM, Freire MP, Brandao de Assis D, Madalosso G, Pellini AC, Cesar ML, Pisani Neto V, Beltramelli MM, Chimara E, et al.: Outbreak of sur-gical infection caused by non-tuberculous mycobacteria in breast implants in Brazil.J Hosp Infect 2007, 67(2):161-167.
Petrini B: Mycobacterium abscessus: an emerging rapid-growing potential patho-gen. APMIS 2006, 114(5):319-328.
Van Ingen J: Nontuberculosis Mycobac-teria; from gene sequence to clinical rel-evance. Thesis. Nijmegen: Univerity of Ni-jmegen; 2009
Park YS, Lee CH, Lee SM, Yang SC, Yoo CG, Kim YW, et al. Rapid increase of non-tuberculous mycobacterial lung dis-eases at a tertiary referral hospital in South Ko-rea. Int J Tuberc Lung Dis 2010; 14:1069-71.
Yoo JW, Jo KW, Kim MN, Lee SD, Kim WS, Kim DS, et al. Increasing trend of isolation of non-tuberculous mycobacteria in a ter-tiary university hospital in South Korea.
4.
5.
6.
7.
8.
9.
10.
11.
12.
16Jurnal Kesihatan Johor, Vol. 11, 2014
Tuberc Respir Dis 2012;72:409-15
Laboratory Technical Manual: Direct Spu-tum Smear Microscopy for Acid Fast Ba-cilli.Ministry of Health Malaysia, 2011.
Koh WJ, Kwon OJ, Jeon K, Kim TS, Lee KS, ParkYK,etal.Clinicalsignificanceofnon-tuberculous mycobacteria isolated from respiratory specimens in Korea. Chest 2006;129:341-8
Lee SK, Lee EJ, Kim SK, Chang J, Jeong SH, Kang YA. Changing epidemiology of nontuberculous mycobacterial lung dis-ease in South Korea. Scand J Infect Dis 2012; 44:733-8.
Kendall BA, Winthrop KL. Update on the epidemiology of pulmonary nontubercu-lous mycobacterial infections. Semin Re-spir Crit Care Med 2013; 34:87-94.
Catanzaro A. Diagnosis, differentiating colonization, infection, and disease. Clin Chest Medicine 2002;23:599-601
GriffithDE,AksamitTet.al(2007)Anoffi-cial ATS/IDSA statement, diagnosis, treat-ment and prevention of non tuberculous mycobacterial disease. Am J Respiratory Critical Care Med 175: 367-416.
Davies PD. Tuberculosis in the elderly. Epidemiology and optimal management. Drugs Aging.1996; 8(6):436–44.
Nagami P, Yoshikawa TT. Aging and tuber-culosis. Gerontology. 1984; 30(5):308–15.
13.
14.
15.
16.
17.
18.
19.
20.
Stead WW. Special problems in tubercu-losis. Tuberculosis in the elderly and in residents of nursing homes, correctional facilities, long-term care hospitals, mental hospitals, shelters for the homeless, and jails. Clin Chest Med. 1989; 10(3):397–405.
Stead WW. Tuberculosis among elder-ly persons, as observed among nursing home residents. Int J Tuberc Lung Dis. 1998; 2(9) 1:S64–70.
Yoshikawa TT. Tuberculosis in aging adults. J Am Geriatr Soc. 1992; 40(2):178–87.
Kim RD, Greenberg DE, Ehrmantraut ME, Guide SV, Ding L, Shea Y, et al. Pulmonary nontuberculous mycobacterial disease: prospective study of a distinct preexist-ing syndrome. Am J Respir Crit Care Med 2008;178:1066-74
Andrejak C, Nielsen R, Thomsen VO, Duhaut P, Sorensen HT, Thomsen RW. Chronic respiratory disease, inhaled cor-tico-steroids and risk of non-tuberculous mycobacteriosis. Thorax 2013;68:256-62 Mehdi Mirsaeidi et. al Non-tuberculous my-cobacterial disease is common in patients withnon-cysticfibrosisbronchiectasis.In-ternational Journal of Infectious Diseases. 17. (2013) e1000-e1004
21.
22.
23.
24.
25.
26.

17Jurnal Kesihatan Johor, Vol. 11, 2014
_______________________Corresponding author:
Dr Loh Kim Hong,Pejabat Pergigian Jalan Abdul Samad80100 Johor Bahru, Johor.Phone: 07-2228015Fax: 07-2246014Email: [email protected]
Abstract
Introduction: The aim of this study is to look at the rate of sweing uniform for health staff in different sewing shops in the Johor Bahru District. From this study, we can have the ap-propriate rate for the uniform. The result of the study can be used in the District of Johor Bah-ru. Metodology: Study was perform through interview at selected sewing shops at Johor Bahru District area. All the interviewers are selected from all 6 health districts and all of them are trained for the study. Results: From the 51 sewing shops interviewed, 20 (39.2%) from west zone, 17 (33.3%) from east zone, and 14 (27.5%) from middle zone. From the study, the minumun and maximum rate for the sewing uniform were low at east zone in Johor Bahru area and the hihgest was at west zone. Conclusion: This study can identify the normal rate to sewing uniform for health staff. The rate different from rate given and normal rate were between 43% and 92%.
Key words: Rate of sewing, sewing shop, nor-mal rate, uniform, interview
Abstrak
Pengenalan: Kajian upah jahitan pakaian se-ragam ini dapat mengenal pasti kadar pasa-ran yang berpatutan dan menyeragamkan tuntutan upah jahitan. Hasil kajian ini boleh digunapakai oleh semua warga KKM yang layak menuntut upah jahitan di Daerah Johor Bahru. Metodologi: Kajian telah dijalankan se-cara temuduga di kedai-kedai jahit yang telah dikenalpasti di sekitar Daerah Johor Bahru. Wakil dari enam (6) PTJ di Johor Bahru te-lah dilatih sebagai penemuduga. Hasil Kajian: Dari 51 kedai jahit ini, sebanyak 20 (39.2%) di Zon Barat, 17 (33.3%) di Zon Timur dan 14 (27.5%) di Zon Tengah. Melihat kepada kadar minima dan maksima, kadar pasaran upah jahitan yang paling rendah didapati di Zon Timur dan yang paling tinggi di Zon Ba-rat di Johor Bahru. Kesimpulan: Kajian upah jahitan pakaian seragam telah mengenalpasti harga pasaran untuk setiap rekabentuk ge-neric anggota KKM di Daerah Johor Bahru. Perbezaan diantara kadar bantuan dan harga pasaran adalah sebanyak 43% hingga 92%.
Pengenalan
Peraturan berkaitan kemudahan Pakaian Se-ragam adalah diperuntukkan di bawah Pekelil-ing Perkhidmatan Bilangan 7 Tahun 1990 dan Surat Pekeliling Perkhidmatan Bilangan 5 Ta-hun 1995 yang menetapkan pegawai yang layak dibekalkan dengan tiga (3) pasang pak-aian seragam setahun.1,2 Ketua Agensi adalah bertanggungjawab menyediakan garis pand-uan dalaman (sekiranya perlu) di agensi bagi kadar perolehan bekalan kain dan upah jahit
4
Volume 11
2014
Kajian Pasaran Upah JahitanPakaian Seragam
Untuk anggota Kementerian Kesihatan, Johor Bahru
Loh K.H.1, Teoh C.A.1, Awang K.1, Manan M.A.2, Yap C.S.3, Mokesing M.4, Mohd Said N.5, Mahmod Nor Z.6
1Pejabat Pergigian Jalan Abdul Samad2Hospital Sultan Ismail
3Hospital Sultanah Aminah4Makmal Kesihatan Awam
5Hospital Permai6Pejabat Kesihatan Jalan Abdul Samad

18Jurnal Kesihatan Johor, Vol. 11, 2014
yang sesuai sebagai satu bentuk kawalan dan untuk mengelakkan pembaziran. Pekeliling Perbendaharaan Bil. 6 Tahun 2011 (Peraturan Dan Kadar Bekalan Pakaian Seragam)menya-takan agensi mendapatkan kain berkualiti mengikut prosedur perolehan yang berkuat kuasa dan mengagihkan kepada pegawai su-paya pegawai menguruskan sendiri jahitan pakaian berkenaan dan seterusnya pegawai akan membuat tuntutan bayaran balik ba-yaran upah jahit yang disokong dengan resit atas kadar maksimum yang ditetapkan3.Berpandu kepada Surat Pekeliling KKM Bil.4/2011 (Peraturan dan kadar elaun ja-hit pakaian seragam bagi penjawat awam di KKM), sungguhpun kadar maksimum yang dinyatakan dipersetujui, setiap Ketua PTJ hen-daklah mengingatkan penjawat awam yang berkenaan supaya memperolehi perkhidma-tan jahitan pakaian seragam pada harga yang berpatutan dan munasabah, dan berdasar-kan kadar pasaran.4 Tuntutan bayaran balik upah jahit yang dibuat juga hendaklah bagi bayaran upah jahit sebenar yang telah diba-yar oleh mereka bagi perkhidmatan tersebut dengan mengemukakan resit asal.Walaubagaimanapun, kebanyakan anggota KKM telah membuat tuntutan maksimum mengikut kategori masing-masing. Ketidak-seragaman dalam pelaksanaan dan tafsir-an pekeliling/surat pekeliling tersebut telah menimbulkan perasaan ketidakpuasan di ka-langan anggota. Pengauditan Audit Negara yang dijalankan di beberapa PTJ bawah KKM dari Jun hingga Sep-tember 2012 telah mendapati tuntutan upah jahitan yang meragukan.5 Semakan Audit mendapati sebanyak 1,104 anggota di sepu-luh PTJ yang dilawati mengemukakan salinan resit yang meragukan. Didapati perbezaan yang ketara antara tuntutan yang dikemu-kakan oleh anggota dengan kadar upah jahit yang dikenakan oleh kedai jahit di kawasan berhampiran PTJ terlibat. Anggaran nilai per-bezaan tuntutan, misalnya, bagi baju lengan panjang dan seluar panjang adalah antara RM344,325 hingga RM398,765 di sepuluh PTJ itu. Daerah Johor Bahru merupakan daer-ah yang paling besar di Negeri Johor dari segi tenaga kerja KKM. Anggaran warga KKM di enam PTJ dan Ibu Pejabat Jabatan Kesihatan Negeri Johor yang bertempat di Johor Bahru dianggarkan lebih daripada 9200 orang. Ini adalah lebih kurang 40% daripada seluruh warga KKM Negeri Johor. Kajian upah jahitan pakaian seragam ini dapat mengenal pasti kadar pasaran yang berpatutan dan menyer-agamkan tuntutan upah jahitan. Hasil kajian
ini boleh digunapakai oleh semua warga KKM yang layak menuntut upah jahitan di Daerah Johor Bahru.
Metodologi
Objektif kajian ini adalah untuk mengenalpasti harga pasaran upah jahitan pakaian seragam anggota KKM di Daerah Johor Bahru.Kajian telah dijalankan secara temuduga di kedai-kedai jahit yang telah dikenalpasti di sekitar Daerah Johor Bahru. Wakil dari enam (6) PTJ di Johor Bahru telah dilatih sebagai penemuduga. Mereka dibahagikan kepada tiga kumpulan dan ditugaskan secara rawak kepada tiga zon di Johor Bahru, iaitu Zon Ten-gah, Barat dan Timur. (Jadual 1) Sempadan zon adalah secara arbritrari dan mengikut Sistem Zoning di Pejabat Kesihatan Pergigian Daerah Johor Bahru.6 Pemilihan sampel kedai jahit adalah berpandu kepada kriteria kedai yang dipilih iaitu kedai jahit yang berada di Daerah Johor Bahru, tu-kang jahit yang beroperasi dari kedai dise-babkan harga modal adalah lebih tinggi dan ia boleh melunaskan resit rasmi. Kedai yang di tidak dipilih adalah tukang jahit yang berop-erasi di rumah, kedai jahit di lain daerah dan kedai jahit yang memberi kebenaran untuk mengambil bahagian dalam temuduga telah dimasukkan dalam sampel kajian.Rekabentukdanspesifikasisecaragenerikbagipakaian seragam yang meliputi semua kate-gori anggota KKM telah disediakan dan setiap penemuduga dibekalkan satu set rekabentuk/spesifikasiitu.Sesilatihandalammenjalankantemuduga telah diadakan sebelum kajian ber-mula. Kebenaran secara lisan daripada pemi-lik kedai tukang jahit atau tukang jahit untuk menyertai temuduga telah diperolehi sebelum temuduga dijalankan. Kemasukan data dan analisis telah mengguna-kan SPSS. Harga pasaran dianalisa mengikut purata, mod, kadar minimum dan maksimum.
Hasil Kajian
Kajian telah dijalankan selama dua minggu dari 13 hingga 26 Januari 2014. Seramai 6 penemuduga telah terlibat dalam kajian ini dan sebanyak 51 kedai jahitan di daerah Johor Bahru telah bersetuju mengambil bahagian dalam kajian. Dari 51 kedai jahit ini, se-banyak 20 (39.2%) di Zon Barat, 17 (33.3%) di Zon Timur dan 14 (27.5%) di Zon Tengah. (Jadual 2)

19Jurnal Kesihatan Johor, Vol. 11, 2014
Hasil upah jahitan mengikut zon dipaparkan di Jadual 3. Melihat kepada kadar minima dan maksima, kadar pasaran upah jahitan yang paling rendah didapati di Zon Timur dan yang paling tinggi di Zon Barat di Johor Bahru. Begitu juga dengan kadar purata. Dari mod pula, kadar mod yang paling tinggi didapati di Zon Timur. Pada keseluruhannya, harga upah jahitan mengikut Mod adalah RM70 untuk kot makmal dan PAP (Perempuan), RM120 untuk pakaian seragam Jururawat Lelaki dan Perem-puan, RM150 untuk Jururawat Perempuan dan Juruteknologi (Lelaki) dan RM135 untuk PAP (Lelaki)/Pemandu dan Juruteknologi (Perem-puan)
Perbincangan
Dengan gabungan tenaga dari enam (6) PTJ di Johor Bahru, kajian ini telah dijalankan dengan lebih menjimatkan masa dan tena-ga. Kajian ini juga lebih menyeluruh sebab dapat meliputi sampel yang lebih besar dan kawasan yang lebih luas. Pemilihan kadar pasaran upah jahit dapat dibuat secara ob-jektif dengan pengagihan penemuduga se-cara rawak. Kerjasama daripada semua kedai jahit sangat menggalakkan dengan pelaksan-aan kajian yang lebih sistematik, teratur dan professional.Sebelum kajian ini selesai, Pekeliling Perkhid-matan Bilangan 1 Tahun 2014 (Bantuan Upah Jahit)7 telah dikeluarkan dan berkuat kuasa
Jadual 1: Pengagihan Penemuduga Mengikut Zon
Zon Penemuduga PTJZon Tengah
Zon Barat
Zon TImur
Penemuduga A Hospital Sultanah Aminah Penemuduga B Makmal Kesihatan Awam
Penemuduga C Pejabat Kesihatan Daerah Johor BahruPenemuduga D Pejabat Kesihatan Pergigian Daerah Johor Bahru
Penemuduga E Hospital Sultan IsmailPenemuduga F Hospital Permai
Zon Kekerapan PeratusTengah 14 27.5Timur 17 33.3Barat 20 39.2Jumlah 51 100.0
Jadual 2: Bilangan Kedai Jahit Yang Bersetuju Menjalani Ujian
mulai 1 April 2014. Pekeliling ini menyatakan bagi menangani isu tuntutan bayaran balik upah jahit yang disokong dengan resit, Kera-jaan bersetuju supaya tuntutan bayaran balik yang disokong dengan resit digantikan den-gan Bantuan Upah Jahit.Perbandingan hasil dari kajian ini, dengan ka-dar Bantuan Upah Jahit mendapati perbezaan yang ketara seperti di Jadual 4. Anggota KKM akan menerima Bantuan Upah Jahit RM30 (43%) hingga RM110 (92%) lebih dari harga pasaran di Daerah Johor Bahru untuk setiap pasang pakaian seragam.

20Jurnal Kesihatan Johor, Vol. 11, 2014
Jadual 3: Maklumat Upah Jahitan Untuk Pakaian Seragam di Daerah Johor Bahru
Jum
lah
Bar
at
Tim
ur
Tengah
Purata 71.2 152.3 150.0 149.0 152.3 156.2 150.0 110.7Median 70.0 140.0 145.0 140.0 140.0 150.0 140.0 92.5Mod 70.0 120.0 140.0 120.0 120.0 120.0 140.0 90.0Minima 60.0 120.0 80.0 80.0 120.0 120.0 100.0 60.0Maksima 85.0 230.0 230.0 230.0 230.0 230.0 230.0 230.0
Purata 65.5 119.7 114.6 114.6 91.0 87.7 118.1 71.5Median 67.5 120.0 120.0 120.0 80.0 80.0 120.0 70.0Mod 70.0 150.0 120.0 120.0 150.0 135.0 135.0 50.0Minima 28.0 56.0 56.0 56.0 28.0 28.0 28.0 50.0Maksima 130.0 170.0 170.0 170.0 150.0 150.0 170.0 120.0
Purata 77.4 148.7 145.5 136.6 151.3 154.2 141.3 78.2Median 70.0 140.0 140.0 120.0 140.0 150.0 130.0 60.0Mod 70.0 132.5 145.0 113.3 150.0 150.0 100.0 50.0Minima 45.0 100.0 75.0 80.0 100.0 100.0 100.0 40.0Maksima 180.0 320.0 320.0 320.0 320.0 320.0 320.0 320.0
Purata 71.9 140.4 136.3 132.6 133.2 134.5 136.3 86.5Median 70.0 140.0 140.0 120.0 130.0 135.0 130.0 70.0Mod 70.0 120.0 150.0 120.0 150.0 135.0 135.0 70.0Minima 28.0 56.0 56.0 56.0 28.0 28.0 28.0 40.0Maksima 180.0 320.0 320.0 320.0 320.0 320.0 320.0 320.0
Jururawat Perempuan1 – Dengan seluarJururawat Perempuan2 – Dengan kain
Kot
Mak
mal
Juru
raw
atLe
laki
Juru
raw
atPe
rem
puan
1
Juru
raw
atPe
rem
puan
2
Juru
tekn
olo
gi
(Lel
aki)
Juru
tekn
olo
gi
(Per
empuan
)
Pem
ban
tu
Am
Pej
abat
/
Pem
andu
Pem
ban
tu
Am
Pej
abat
/
Pem
andu
Zon
Jadual 4: Perbandingan Kadar Bantuan (pada 1 April 2014) Dengan Hasil Kajian
Bil. Jenis Pakaian Kadar Bantuan Kadar dari Perbezaan Sepasang Hasil Kajian RM (%)1 Kot Makmal 100 70 30 (43%)2 Pembantu Am Pejabat 120 70 50 (71%) (Perempuan) 3 Jururawat Lelaki 230 120 110 (92%)4 Jururawat Perempuan 230 120 110 (92%) (dengan kain)5 Juruteknologi Perempuan 230 135 95 (70%)6 Pembantu Am Pejabat 230 135 95 (70%) / Pemandu7 Jururawat Perempuan 230 150 80 (53%) (dengan seluar)8 Juruteknologi (Lelaki) 230 150 80 (53%)

21Jurnal Kesihatan Johor, Vol. 11, 2014
Kesimpulan
Kajian upah jahitan pakaian seragam telah mengenalpasti harga pasaran untuk setiap rekabentuk generic anggota KKM di Daerah Johor Bahru. Perbezaan diantara kadar ban-tuan dan harga pasaran adalah sebanyak 43% hingga 92%. Dengan pengeluaran Pekeliling Perkhidmatan Bilangan 1 Tahun 2014, hasil kajian tidak sempat dilaksanakan. Walauba-gaimanapun, diharap harga pasaran yang diperolehi secara sistematik dan objektif da-pat memberi kesedaran kepada anggota dan pihak pengurusan KKM tentang perbezaan yang ketara ini.
Penghargaan
Pasukan kajian ingin merakamkan penghar-gaan kepada Ketua Pengarah Kesihatan dan Pengarah Kanan Kesihatan Pergigian atas ke-lulusan untuk menerbit hasil kajian ini. Peng-hargaan kepada semua Ketua PTJ KKM di Daerah Johor Bahru yang telah memberi ker-jasama semasa kajian ini dijalankan. Seting-gi-tinggi terima kasih kepada semua tukang jahit yang telah mengambil bahagian dalam temuduga. Penghargaan juga kepada Kemen-terian Kesihatan di atas NMRR ID: NMRR-14-306-20461.
Rujukan
Gambarajah 1: Perbandingan Kadar Bantuan Upah Jahit (pada 1 April 2014) dengan Hasil Kajian
Pekeliling Perkhidmatan Bilangan 7 Tahun 1990
Surat Pekeliling Perkhidmatan Bilangan 5 Tahun 1995
Pekeliling Perbendaharaan Bil. 6 Tahun 2011 (Peraturan Dan Kadar Bekalan Paka-ian Seragam)
Surat Pekeliling KKM Bil.4/2011 (Peraturan dan kadar elaun jahit pakaian seragam bagi penjawat awam di KKM)
Laporan Ketua Audit Negara 2012 Siri 2 - Persekutuan
KH Loh, Norsimah S, Rosnah N. Zoning System in Johor Bahru District – A Strate-gic Management Approach. Compendium of Abstracts 2011. Research Projects and Pub-lications of Oral Health Personnel Ministry of Health Malaysia. Oral Health Division Minis-try of Health Malaysia September 2012
Pekeliling Perkhidmatan Bilangan 1 Tahun 2014 (Bantuan Upah Jahit)
1
2.
3.
4.
5.
6.
7.
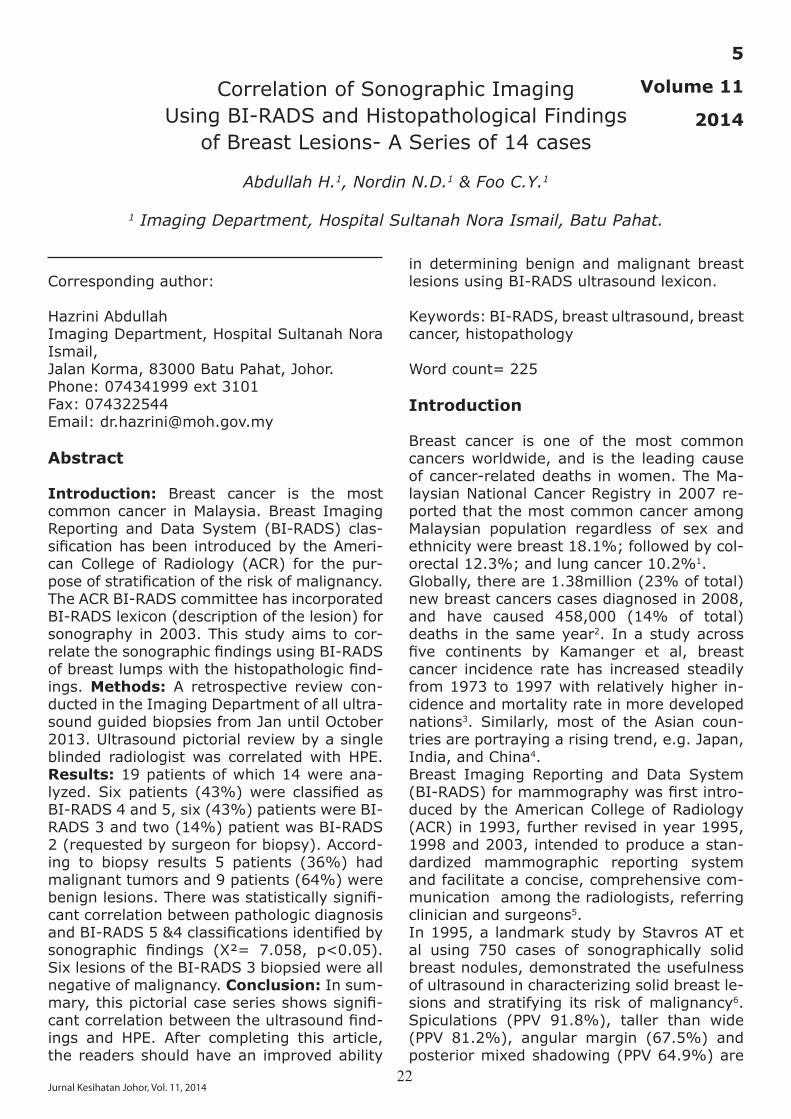
22Jurnal Kesihatan Johor, Vol. 11, 2014
Corresponding author:
Hazrini AbdullahImaging Department, Hospital Sultanah Nora Ismail, Jalan Korma, 83000 Batu Pahat, Johor.Phone: 074341999 ext 3101Fax: 074322544Email: [email protected]
Abstract
Introduction: Breast cancer is the most common cancer in Malaysia. Breast Imaging Reporting and Data System (BI-RADS) clas-sificationhasbeen introducedbytheAmeri-can College of Radiology (ACR) for the pur-poseofstratificationoftheriskofmalignancy.The ACR BI-RADS committee has incorporated BI-RADS lexicon (description of the lesion) for sonography in 2003. This study aims to cor-relatethesonographicfindingsusingBI-RADSofbreastlumpswiththehistopathologicfind-ings. Methods: A retrospective review con-ducted in the Imaging Department of all ultra-sound guided biopsies from Jan until October 2013. Ultrasound pictorial review by a single blinded radiologist was correlated with HPE.Results: 19 patients of which 14 were ana-lyzed.Sixpatients (43%)wereclassifiedasBI-RADS 4 and 5, six (43%) patients were BI-RADS 3 and two (14%) patient was BI-RADS 2 (requested by surgeon for biopsy). Accord-ing to biopsy results 5 patients (36%) had malignant tumors and 9 patients (64%) were benignlesions.Therewasstatisticallysignifi-cant correlation between pathologic diagnosis andBI-RADS5&4classificationsidentifiedbysonographic findings (X²= 7.058, p<0.05).Six lesions of the BI-RADS 3 biopsied were all negative of malignancy. Conclusion: In sum-mary,thispictorialcaseseriesshowssignifi-cantcorrelationbetweentheultrasoundfind-ings and HPE. After completing this article, the readers should have an improved ability
in determining benign and malignant breast lesions using BI-RADS ultrasound lexicon.
Keywords: BI-RADS, breast ultrasound, breast cancer, histopathology
Word count= 225
Introduction
Breast cancer is one of the most common cancers worldwide, and is the leading cause of cancer-related deaths in women. The Ma-laysian National Cancer Registry in 2007 re-ported that the most common cancer among Malaysian population regardless of sex and ethnicity were breast 18.1%; followed by col-orectal 12.3%; and lung cancer 10.2%1. Globally, there are 1.38million (23% of total) new breast cancers cases diagnosed in 2008, and have caused 458,000 (14% of total) deaths in the same year2. In a study across five continents by Kamanger et al, breastcancer incidence rate has increased steadily from 1973 to 1997 with relatively higher in-cidence and mortality rate in more developed nations3. Similarly, most of the Asian coun-tries are portraying a rising trend, e.g. Japan, India, and China4. Breast Imaging Reporting and Data System (BI-RADS)formammographywasfirstintro-duced by the American College of Radiology (ACR) in 1993, further revised in year 1995, 1998 and 2003, intended to produce a stan-dardized mammographic reporting system and facilitate a concise, comprehensive com-munication among the radiologists, referring clinician and surgeons5. In 1995, a landmark study by Stavros AT et al using 750 cases of sonographically solid breast nodules, demonstrated the usefulness of ultrasound in characterizing solid breast le-sions and stratifying its risk of malignancy6. Spiculations (PPV 91.8%), taller than wide (PPV 81.2%), angular margin (67.5%) and posterior mixed shadowing (PPV 64.9%) are
5
Volume 11
2014
Correlation of Sonographic ImagingUsing BI-RADS and Histopathological Findings
of Breast Lesions- A Series of 14 cases
Abdullah H.1, Nordin N.D.1 & Foo C.Y.1
1 Imaging Department, Hospital Sultanah Nora Ismail, Batu Pahat.

23Jurnal Kesihatan Johor, Vol. 11, 2014
features with highest predictive value for ma-lignancy6.The ACR BI-RADS committee has incorporat-ed BI-RADS lexicon (description of the lesion) for sonography in 20035. There are six BI-RADS Ultrasound descriptors, namely shape, margin, orientation of mass to skin (height to width ratio of more than one), lesion bound-ary (sharp/ halo), echo pattern and posterior acoustic features. The most important mor-phological features in assessment of breast solid lesion are the shape and margin, for which the terminology used in breast ultra-sonography and mammography are similar as far as possible to avoid confusion. Shapes are classifiedasoval,roundorirregular.Whereasmarginareclassifiedaswellcircumscribedorill-defined(angular,microlobulationandspic-ulated). Features which are unique to sonog-raphy only include orientation of the mass, echo pattern and posterior acoustic shadow-ing. The combined finding of the lesionwilleventually be classified into seven BI-RADScategories7 with recommendation of manage-ment.Through this paper, by demonstrating the correlation between the ultrasound morpho-logical features and HPE result, we hope that sonography can be used to accurately classify solid lesions as benign, allowing imaging fol-low-up rather than biopsy; hence resulting in improved care, reduction of patient discom-fort and anxiety as well as reduction of hospi-talfinancialburden.
Materials and Method
This review is registered on the Malaysian National Medical Research Register (NMRR-14-1072-20531). The retrospective pictorial review is done in the Hospital Sultanah Nora Ismail, Batu Pahat, Johor. Between January until October 2013, ultrasound images of 19 patients who were underwent ultrasound-guided biopsy were explored. The sonographic features of shape, internal echo, boundary, height to width ratio, margin and posterior mixed shadowing were listed. The images interpretations were made by one radiologist (with 3 years experience) accord-ing to the sonographic features listed above. The radiologist is blinded to the HPE results. Then final BI-RADS classification applied toeach cases and correlation made with the HPE findings.The lesion was categorized based on BI-RADS, which are precisely tied to breast cancer risk. BI-RADS5isreservedforfindingsthatalmost
invariably represent breast cancer; BI-RADS 4 is given to suspicious lesion of which biopsy is recommended; BI-RADS 3 is assigned to probably benign finding and initial short-in-terval follow-up is recommended; BI-RADS 2 categoryisforbenignfindingsandBI-RADS1isfornegativefindings5.Overall,sixpatients(43%)were classified as BI-RADS4 and 5,six (43%) patients were BI-RADS 3 and two (14%) patient was BI-RADS 2. The sono-graphic-histologic correlation is then made.
Results
The study population consisted of 19 patients (age range: 22-71, median age of 45). Five patients were excluded because one histo-pathologic (HPE) result was absent, two were inadequate samples and two were lymph nodes. Of the remaining 14 patients, six pa-tients (43%) were classified as BI-RADS 4and 5, six (43%) patients were BI-RADS 3 and two (14%) patient were BI-RADS 2 (re-quested by surgeon for biopsy). According to biopsy results 5 patients (36%) had malignant tumors and 9 patients (64%) were benign le-sions(table1).Therewasstatisticallysignifi-cant correlation according to Chi-Square test, between histological diagnosis and BI-RADS 5 &4classificationsidentifiedbyultrasonogra-phyfindings(p<0.05).Six lesions of the BI-RADS 3 were biopsied. Noneof thepatient classifiedasBI-RADS3had malignant biopsy result. Two patients with BI-RADS 2 lesions were biopsied due to sur-geons’ demand both showed no malignancy.
Table1:AssociationofBI-RADSClassificationand Histological Findings.
BI-RADS BI-RADS p 4/5 3/2 value*Malignant 5 0 0.0035HPEBenign 1 8HPE
*Chi- square= 7.058 (with Yates correction)
Figure 1: BI-RADS 3 lesion- Oval, heteroge-

24Jurnal Kesihatan Johor, Vol. 11, 2014
Figure 5: BI-RADS 2 lesion- Oval, homogenous hypoechoeic internal echoes with well circum-scribed margin. Edge shadows and height to width ratio is less than 1.
HPE:fibroepithelial lesionconsistentwithfi-broadenoma
Figure 6: BI-RADS 4 lesion- Rounded, het-erogenous hypoechoeic with spiculated mar-gin. Mixed posterior shadows and height to width ratio is more than 1. HPE: Recurrent invasive carcinoma
Figure 7: BI-RADS 3 lesion- Oval, heterog-enous hypoechoeic with echogenic septae within and well circumscribed margin. No posterior shadows and height to width ratio is less than 1.
HPE: Lactational change
nous isoechoeic internal echoes with well cir-cumscribed margin. Mixed posterior shadows but height to width ratio is less than 1. No significantsurroundingtissuesfindings.
HPE:Chronicinflammation
Figure 2: BI-RADS 3 lesion- Oval, heterog-enous hypoechoeic with echogenic foci within and well circumscribed margin. Posterior en-hancement and height to width ratio is less than 1. No significant surrounding tissuesfindings.
HPE: Mucinous lesion with mild atypia
Figure 3: BI-RADS 4 lesion- Rounded, het-erogenous hypoechoeic with lobulated well circumscribed margin. Mixed posterior shad-ows and height to width ratio is more than 1.
HPE: Fibroepithelial neoplasm. No malignant cells
Figure 4: BI-RADS 4 lesion- Irregular, het-erogenous hypoechoeic with lobulated mar-gin. Edge shadows and height to width ratio is less than 1.
HPE: Ductal Carcinoma in situ with microinva-sion

25Jurnal Kesihatan Johor, Vol. 11, 2014
Figure 8: BI-RADS 3 lesion- Rounded, homog-enous isoechoeic lesion. Well circumscribed margin. No posterior shadows and height to width ratio is more than 1.
HPE: No malignancy
Figure 9: BI-RADS 3 lesion- Oval, heterog-enous hypoechoeic with echogenic septae within and well circumscribed margin. No posterior shadows and height to width ratio is less than 1.
HPE: Tubular adenoma
Figure 11: BI-RADS 2 lesion- Oval, homog-
enous hypoechoeic internal echoes with well circumscribed margin. No posterior shadows and height to width ratio is less than 1.
HPE: No malignancy
Figure 12: BI-RADS 3 lesion- Oval, heterog-enous hypoechoeic with echogenic septae within and well circumscribed margin. No posterior shadows and height to width ratio is less than 1.
HPE: Focal usual ductal hyperplasia
Figure 13: BI-RADS 5 lesion- Irregular, het-erogenous hypoechoeic lesion with spiculated margin. Mixed posterior shadows and height to width ratio is more than 1.
HPE: Invasive ductal carcinoma
Figure 14: BI-RADS 5 lesion- Irregular, het-erogenous hypoechoeic lesion with spiculated margin. Mixed posterior shadows and height to width ratio is more than 1.
HPE: Invasive ductal carcinoma
Discussion
There is rising awareness on breast cancer with the aim to suppress morbidity and mor-tality. The advancement of medical imaging improves early detection, accurate diagnosis and therefore appropriate intervention. To date, mammography is the ‘gold standard’ imaging modality to screen breast cancer 8. It isthebestmodalitytodetectmicrocalcifica-tions in breast tissue, which could be the sole manifestation of an early breast malignancy. However, in a mammographically dense breast where the diagnostic sensitivity is reduced, ultrasound remains as a relevant modality in the assessment of breast lesions. BI-RADSultrasoundclassification introducedby the ACR in 2003 has been widely used. Proper and consistent use of the BI-RADS ultrasound lexicon has many advantages. Namely to facilitate the communication be-tweentheradiologistandsurgeononfinalas-sessment categories with management rec-ommendations, data-tracking for self-audits and for evaluation the patient outcomes. It

26Jurnal Kesihatan Johor, Vol. 11, 2014
allows more standardize ‘language’ between the radiologist andsurgeons in stratificationof the breast lumps to the likelihood of malig-nancy. Lesions with BI-RADS category 3 may be managed with short term follow ups. Both lesions with BI-RADS category 4 and 5 are considered suspicious and confirmationwithtissue diagnosis should be obtained. There-fore differentiation between these two cate-gories may not be necessary.This retrospective pictorial case series of our department database are used to correlate between sonographic features and histopatho-logical result of breast lesions. Overall result is comparable with other studies6,7, whereby the keyfindingshows,therewasstatisticallysig-nificantcorrelationbetweenpathologicdiag-nosis and BI-RADS Category 5 and Category 4identifiedbyultrasoundfindings(p<0.05);while lesions of BI-RADS Category 3 were all negative of malignancy.The implication of this case series is that; ra-diologist may reduce the biopsy performed in the patient with BI-RADS 3 breast lesions by discussing with the surgeons. This is espe-cially so in those patients with non palpable breast lumps and have no other risk factors for breast carcinoma. It may help to reduce financial burden to the hospital and reduceanxiety to the patients.The limitation of the study due to small sample size was partly contributed by short duration. For future research, a descriptive study on radiologic-pathologic concordance with bigger sample size can be performed. Nevertheless, it is hoped that the local radiologist as well asthesurgeonwillbemoreconfidentintheclassificationofBI-RADS3diagnosis-assur-ing that these are 98% likely to be a benign lesion. As recommended by the ACR; these patientswillsuffice6-monthfollowupultra-sound.
Conclusion
In summary, this pictorial case series shows significant correlation between the sono-graphicfindingsandthecorrespondinghisto-pathology results of breast lesions.
Acknowledgement
The authors would like to thank the Director General of Health Malaysia for permission to publish this paper. The authors also would like to thank Dr Sarina Salim and staff in the Im-aging department of Hospital Sultanah Nora Ismail in assisting in the data collection.
DisclaimerThis article is purely for educational purpose of medical community.
References:
National Cancer Registry Report 2007.
Ferley J, Shin HR, Bray F, Forman D, Mathers C, Parkin DM. GLOBOCAN 2008; Cancer In-cidence and Mortality Worldwide: IARC Can-cerbase No.10 [Internet]. Lyon (France): IARC; 2010. Available from http://globo-can.iarc.fr.
Farin Kamangar, Graca M. Dores, William F. Anderson. Patterns of Cancer Incidence, Mortality and Prevalence Across Five Conti-nents:DefiningPrioritiesToReduceCancerDisparities In Different Geographic Regions Of The World. J Clin Oncol 2008 May 10; 24: 2137-2150.
International Agency for Cancer Research (IARC). CANCERMONDIAL. Available from: http://www-dep.iarc.fr/.
Elizabeth S.Bumside, Edward A.Sickles, Lawrence W.Bassett, Daniel L.Rubin, Carol H.Lee, Debra M.Ikeda. The ACR BI-RADS Experience: Learning From History. J Am Coll Radiol. 2009 Dec; 6(12): 861-862.
Stavros AT, Thickman D, Rapp CL, Dennis MA, Parker SH, Sisney GA. Solid Breast Nodules: Use of Sonography to Distinguish Benign and Malignant Lesions. Radiology 1995; 196: 123-34.
Sughra Raza, Allison L. Goldkamp, Sona A.Chikarmane, Robyn L. Birdwell. US of Breast Masses Categorised as BI-RADS 3,4 and5:PictorialReviewofFactorsInfluenc-ing Clinical Management. RSNA, 2010.
S. Prasad N, D. Houserkova. The Role of Various Modalities in Breast Imaging. Biomed Pap Med FAc Univ Palacky Olomouc Czech Repub. 2007, 151(2):209-218.
American College Radiology 2003. Avail-able from: http://posterng.netkey.at/esr/viewing/index.php?module=viewing_poster&task=viewsection&pi=122436&ti=401823&searchkey=#poster2
1.
2.
3.
4.
5.
6.
7.
8.
9.

27Jurnal Kesihatan Johor, Vol. 11, 2014
Corresponding author:
Tang Sin CheeKlinik Kesihatan Renggam,86300 RenggamPhone: +607-7535255Email: [email protected]
Abstract
Introduction: Approximately 15% of children were dispensed a medication with a potential dosing error. Paracetamol and drugs with an-tihistamine action are among the most com-monly prescribed medicines in pediatrics. The aim of this study is to serve as a background study to study the magnitude of dosing error of paracetamol and antihistamine used among pediatrics in Klinik Kesihatan Jalan Mengkibol (KKJM). Methods: This is a cross sectional study using secondary data from prescrip-tions. The inclusion criteria were prescrip-tions of paracetamol and/or antihistamine for children aged 12 years old and below. Pre-scriptions with incomplete information, such as age and body weight of patient for dose calculation were ineligible. Dosing errors were determined by referring to the Protocol “Rec-ommended Pediatric Dosage for Paracetamol and Antihistamine” developed by Pharmacy Department of KKJM. Results: 20.9% of pre-scriptions have paracetamol and/or antihis-tamine dosing error. Comparing across cat-egories, 87.8% of nurses, 77.9% of MO and 37.1% of MA did not make any dosing error.Conclusion: There is a need to strengthen effort and interventions amongst pharmacists and medical educators on the importance of prescribing proper dosage of paracetamol and antihistamine for children aged 12 years old and below.
Keywords: paracetamol, antihistamine, chil-dren
Introduction
Prevention of medication errors has been rec-ognized as a priority in health care systems worldwide [1]. Pharmacists play an essential role in improving drug usage and preventing prescribing errors, which is one type of medi-cation errors [2]. Prescribing errors place pedi-atric patients at an increased risk for adverse drug reactions [3]. Approximately 15% of chil-dren were dispensed a medication with a po-tential dosing error [4]. Accurate prescribing requires an accurate weight, and the choice of an appropriate medication preparation and concentration[4]. Paracetamol and drugs with antihistamine action are among the most commonly prescribed medicines in pediat-rics [5, 6]. For paracetamol, age-based dosing guidelines can lead to inappropriate dosing [5]. Underweight and overweight children are at risk of inappropriate paracetamol administra-tion based on BNFC age-based dosing instruc-tions [5]. Meanwhile, the dosage of antihista-mine will always depend on the product, as well as the age and size of the children who is going to ingest the medications [6].Children have a three-fold greater risk of ex-periencing adverse drug reactions than adults and are more likely to be harmed as their small size makes children more vulnerable to dosing errors [4]. Indeed, over-dosage can have seri-ous and even fatal consequences, especially in young children and medically compromised children [4]. Problem of under-dosage is a con-cern also [4]. Therefore, there is a need for calculation of individualized doses based on the patient’s age, weight (mg/kg), body sur-face area (mg/m2), and clinical condition [3]. The aim of this study is to serve as a back-ground study to study the magnitude of dosing errors of paracetamol and antihistamine used among children aged 12 years old and below in Klinik Kesihatan Jalan Mengkibol (KKJM).
6
Volume 11
2014
Dosing Error of Paracetamol andAntihistamine Prescribed for Children
Aged 12 Years Old and Below in a Health Clinic
Tang S.C.1, Pan H.C.2 & Ting C.S.2
1Pharmacy Department, Klinik Kesihatan Renggam2Pharmacy Department, Klinik Kesihatan Jalan Mengkibol

28Jurnal Kesihatan Johor, Vol. 11, 2014
Thespecificobjectivesare: •Tocalculatetheprevalenceofdosing error of paracetamol and antihistamine prescribed for children aged 12 years old and below •Toidentifythecategoriesofprescriber who involved in the dosing error.
Materials and Methods
This research is registered on the Malaysian National Medical Research Register (ID NM-RR-14-2-19010) and does not involve human subject. This study was conducted from 18 July 2011 to 26 August 2011 for 30 working days in the Pharmacy Department of KKJM. This is a cross sectional study using second-ary data from prescriptions. The inclusion cri-teria were prescriptions of paracetamol and/or antihistamine for children aged 12 years old and below. Prescriptions with incomplete information, such as age and body weight of patient for dose calculation were ineligible. Antihistamine is defined as an agent thatcounteracts the action of histamine; usually used for agent blocking H1 receptors (H1 re-ceptor antagonists) and to treat allergic reac-tions and as components of cough and cold preparations [7]. Antihistamines in KKJM that available for children are Diphenhydramine, Chlorpheniramine, Promethazine, and Tripro-lidine with Pseudoephedrine.Screening was done by 3 trained pharmacists with the reference of Protocol “Recommended Pediatric Dosage for Paracetamol and Antihis-tamine” (Appendix). The protocol was devel-oped by Pharmacy Department of KKJM by referring to different guidelines and reference books, and was approved by Head of Phar-macyDepartmentandaseniorMedicalOffi-cerofKKJM.Dosingerrorisdefinedaseitherunder-dosage or over-dosage for the medica-tion prescribed.
Each prescription was described by a series of characteristics, which were analyzed as pos-sible explanatory variables for the prevalence of dosing error in paracetamol and/or antihis-tamine prescribing: •Typeofmedicationsprescribed: paracetamol, anti-histamine, and both paracetamol and antihistamine •Typeofdosingerrors:errorin paracetamol only, error in antihistamine only, and errors in both paracetamol and antihistamine •Categoryofprescribers:medicalofficer(MO),medicalassistant(MA) and nurseData were analyzed by using SPSS 17.0 sta-tistical software and Microsoft Office Excel2007.
Results
A total of 962 prescriptions were collected but there were only 671 prescriptions were included in the study as another 291 prescrip-tions had incomplete information. Of these 671 prescriptions, 381 were prescribed with paracetamol only, 92 with antihistamine only, and 198 contain both paracetamol and anti-histamine. 20.9% of prescriptions have par-acetamol and/or antihistamine dosing errors. Out of the 671 prescriptions, 536 prescrip-tions have no dosing error while there were 140 dosing errors detected from another 135 prescriptions, these include 86 paracetamol dosing errors and 54 antihistamine dosing er-rors (See Table 1 and 2).Comparing across categories, 87.8% of nurs-es, 77.9% of MO and 37.1% of MA did not make any dosing error. The dosing error was the highest among medical assistants, fol-lowedbymedicalofficerswhichwerealmosttwice as much as the nurses (See Table 2).
Table 1: Number of Dosing Errors
Type of Medications Total Prescriptionsin Prescription
Number of Dosing Errors Total %
Paracetamol Only 381 Paracetamol 579 86 14.9Paracetamol & Antihistamine 198 Antihistamine 290 54 18.6Antihistamine Only 92Total 671 140

29Jurnal Kesihatan Johor, Vol. 11, 2014
Table 2: Number of Prescriptions with Dosing Errors by Different Category of Prescribers
Category of Pre-scribers
Type of Medica-tions in Prescrip-
tion
Type of Dosing Errors TotalPrescriptionsNo Er-
rorError in
Paraceta-mol Only
Error inAntihista-mine Only
Errors in Paraceta-mol & An-tihistamine
MedicalOfficer
MedicalAssistant
Nurse
Paracetamol OnlyAntihistamine
OnlyParacetamol &Antihistamine
Paracetamol OnlyAntihistamine
OnlyParacetamol &Antihistamine
Paracetamol OnlyAntihistamine
OnlyParacetamol &Antihistamine
9252134
472
24032
17031
104
2701
01513
0123
033
003
002
000
10967181
51911
26766
357
35
279
Total 536(79.9%)
81(12.1%)
49(7.3%)
5(0.7%)
671
Error 22.1%
Error 62.9%
Error 12.2%
Discussion
Out of 962 prescriptions with paracetamol and/or antihistamine prescribed for children aged 12 years old and below, there were 291 prescriptions without age and/or body weight for the purpose of dosage calculation. This in-dicates a need amongst prescribers in health clinic to emphasize the necessity of writing the age and body weight in prescriptions for chil-dren aged 12 years old and below. Patient’s age or current weight or mg/kg/day dosing are recommended elements of a prescription, so that calculation can be independently dou-ble checked [3].14.9% prescriptions of paracetamol were de-tected with paracetamol dosing error while 18.6% prescriptions of antihistamine have dosing error in antihistamine, which is similar to a previous study with a prevalence of 15%. Age-based paracetamol dosing guidelines can lead to inappropriate dosing in underweight and overweight children. Meanwhile, overdose of antihistamine could be harmful. Antihista-mines may depress or stimulate the central nervous system (CNS). Used therapeutically,
CNS depression is most commonly seen pre-senting as drowsiness or dizziness. Stimula-tion can result in insomnia, nervousness, and restlessness with increasing doses. In antihis-tamine overdose, the CNS stimulatory effects of the drug predominate in children, which can cause excitement, tremors, hyperactivity, hallucinations, and with higher dosage, tonic-clonic convulsions. Death from antihistamine ingestion in children is usually the result of uncontrolled seizures that progress to coma and cardio-respiratory arrest [8].There were 62.9% of prescriptions written by MA had dosing errors. Moreover, more than 50% antihistamine dosing errors were detect-ed among the prescriptions with antihistamine from MA and nurses. So, these categories of prescribers also need to be paid attention to, especially for the antihistamine prescribing.Some efforts needed to be done to reduce dosing error, for example hold a Continuous Professional Education, distribute the Protocol “Recommended Pediatric Dosage for Parac-etamol and Antihistamine” to promote body-weight-based paracetamol dosing prescrib-ing, body-weight-based and/or age exclusion
No error 77.9%
No error 37.1%
No error 87.8%
30Jurnal Kesihatan Johor, Vol. 11, 2014
Chen YF et al. Prescribing errors and other problems reported by community pharma-cists. Therapeutics and Clinical Risk Man-agement. 2005:1(4) 333– 342.
Guideline on Medication Error Reporting. Malaysia: Ministry of Health; 2009.
Levine SR et al. Guidelines for preventing medication errors in pediatrics. J Pediatr Pharmacol Ther 2001; 6:427-43.
Lee BH. Minimizing Prescription Writing Errors: Computerized Prescription Order Entry. Presented at SPA Annual Meeting, 2006.
Eyers S, Fingleton J, Eastwood A, Perrin K, Beasley R. British National Formulary for Children: the risk of inappropriate parac-etamol prescribing. Arch Dis Child Arch Dis Child. 2012 Mar; 97(3):279-82.
Cuvillo AD, Sastre J, et al. Use of antihista-mines in pediatrics. J Investing Allergol Clin Immunol. 2007; 17(2):28-40.
Dorland’s Pocket Medical Dictionary, 27th ed. Elsevier; 2005.
Fleisher GR, Ludwig S. Textbook of Pediatric Emergency Medicine. Lippincott Williams & Wilkins; 2010. p1188.
1.
2.
3.
4.
5.
6.
7.
8.
of antihistamine prescribing.Several limitations exist in this study. The study was conducted over a relatively short period, andmaynot truly reflect the actualsituationofKKJMespeciallyinInfluenzasea-son. Sample size for all the categories was not evenly distributed with the least prescrip-tions from MA because nowadays most of the patients are seen by MO while nurses are pre-scribing medications for pregnant women and children in Mother and Child Clinic. Besides, there were about 30.2% incomplete prescrip-tions without writing age and/or body weight. These prescriptions can influence the resultof this study if they were taken into consider-ation. So, the pharmacy staffs have to make sure that the prescriptions they received were complete with age and body weight.The next step after this study is to plan for in-terventions to decrease the incidences of dos-ing error in paracetamol and antihistamines prescribing, and subsequently to carry out a post intervention study.
Conclusion
The results of the study show a significantnumber of dosing errors in paracetamol and antihistamine prescribing. This indicates a need for pharmacists and medical educators to further emphasize the importance of pre-scribing proper dosage of paracetamol and antihistamine for children aged 12 years old and below.
References

31Jurnal Kesihatan Johor, Vol. 11, 2014
APPENDIX
RECOMMENDED PEDIATRIC DOSAGE FOR PARACETAMOL AND ANTIHISTAMINE
DRUGS AGE GROUP DOSAGE INDICATIONS
Syr. Par-acetamol 120mg/5ml
Term infants >10 days
Oral: 10-15mg/kg/dose TDSRectal: 15mg/kg/dose TDS
Treatment of mild to moderate pain; anti-pyretic (fever)
Infants & Children Oral: 10-15mg/kg/dose EVERY 6-8 hrs Rectal: 10-20mg/kg/dose EVERY 6-8 hrs
Syr.Diphenhy-dramine 7mg/5ml
Child < 2 yrs old contra-indicated Symptomatic relief of allergy symptoms caused by histamine release which include nasal allergies and al-lergic dermatosis; an-titussive; prevention of motion sickness
2-6 years old 5ml TDS
7-12 years old 10ml TDS
Syr.Chlorphe-niramine 2mg/5mlTab.Chlorphe-niramine 4mg
Child < 2 yrs old contra-indicatedSymptomatic relief of allergic reactions, ie: allergy rhinitis, urti-caria
2-5 yrs old 1mg TDS
6-12 yrs old 2mg or 1/2tab TDS
Syr. Promet-hazine 1mg/ml
Child < 2 yrs old contra-indicated
Symptomatic treat-ment of various allergic conditions and motion sickness; sedative; antiemetic
2-5 yrs old 0.1-0.5mg/kg/dose TDS Max: 15mg/day
6-12 yrs old 0.1-0.5mg/kg/dose TDS Max: 25mg/day
*Child > 2 yrs old use with extreme caution with lowest effective dose
Syr. Triprolidine 1.25mg + Pseudoephed-rine 30mg in 5 mlTab. Triproli-dine 2.5mg + Pseudoephed-rine 60mg(Actifed)
Child < 2 yrs old contra-indicated
For temporary relief of nasal and sinus congestion, sneezing and rhinorrhea asso-ciated with the com-mon cold and allergic rhinitis
2-6 yrs old 2.5ml/dose BD or TDS
6-12 yrs old 5ml/dose or 1/2 tab BD or TDS
Safetyandefficacyfortheuseofcoughandcoldproductsinchildrenlessthan2yearsoldislimited. Serious side effects including death have been reported.

32Jurnal Kesihatan Johor, Vol. 11, 2014
Corresponding author:
Lina IsninPegawai DietetikJabatan Dietetik & SajianHospital Pakar Sultanah Fatimah84000 Muar, Johor Phone : 06 956 4183Fax : 06 954 8779Email : [email protected]
Abstract
Introduction: Malnutrition is a common problem among end stage renal disease (ESRD) patients. Several methods or indi-cators are used to asssess nutritional status such as Subjective Global Assessment (SGA). SGA is an easy, simple, reliable and inexpen-sive method for nutrition status assessment. The aim of this study is to assess nutritional status among hemodialysis (HD) patients. This study also aims to assess correlation be-tween anthropometric, biochemistry and diet intake data with SGA. Methods: A total of 46 patients (27 males, 19 females, mean age 54.32 ranging from 22 to 85 years) HD pa-tients who have been receiving dialysis treat-ment for more than 6 months and willing to take part in the study were selected. Patients interviewed using questionnaire form which includes socioeconomic and demographic data. The biochemical data is taken from the patient’s medical record, whereas 24 hours diet recall for pre and post dialysis is taken via interview. Nutritional status was assessed byusingModifiedSGAforrenalpatients.Re-sults: HD patients are 91.3% mildly malnour-ished and 8.7% moderately malnourished. However, there is strong negative correlation coefficient betweenmalnutrition status withdry weight (r=-0.4310, p=0.0030), height (r=-0.0240, p =0.8750), BMI (r=-0.4990,
p=0.0001) and Mid Upper Arm Circumference (r=-0.4710, p=0.0010). Only creatinine pre HD (r=-0.3840, p=0.0090), for biochemistry datahadsignificantcorrelationwithmalnutri-tion status. Conclusion: Results has shown that HD patients at HPSF are mildly malnour-ished. In the future, we suggested more comparativestudiestoconfirmthevalidityofmalnutrition scoring to evaluate dialysis pa-tients.
Key Words: malnutrition, hemodialysis (HD), Nutritional status, Subjective Global Assess-ment (SGA), Hospital Pakar Sultanah Fati-mah
Introduction
Malnutrition is a common problem among end stage renal disease (ESRD)1. World Health Or-ganisationdefinedmalnutritionas`badnour-ishment’ categorized by inadequate or excess intake of protein, energy, and micronutrients such as vitamins, and frequent infections and disorders that result2. ESRD patients on long term dialysis may develop protein-energy malnutrition and are associated with mortality and morbidity3. Even though nutritional status improves after dialysis, malnutrition problem still occurs in 23-73% of ESRD patients4. In Malaysia, the number of ESRD patients who required dialysis has increased by nearly 2.5 fold over the past 10 years5.Nutritional status is an important factor which can effect mortality and morbidity in ESRD1,9,14. Several methods or indicators are used to assess nutritional status such as Subjective Global Assessment (SGA), skinfold thickness, anthropometric measurement, diet recall and biochemical parameter6. The more accurate methods are Dual Energy X-ray Ab-sorptiometry (DEXA), bioelectrical imped-ance and total body protein7. However, these methods are expensive, cumbersome, rarely available, and impractical for routine use8. The SGA was designed to circumvent many
7
Volume 11
2014
Malnutrition Statusamong Hemodialysis Patients in Hemodialysis Unit,
Hospital Pakar Sultanah Fatimah (HPSF)
Isnin L.1, Khamisan F.1, Mokhy M.S.1, Rosli S.R.1, & Mahmood N.M.1
1Jabatan Dietetik & Sajian, Hospital Pakar Sultanah Fatimah, Muar

33Jurnal Kesihatan Johor, Vol. 11, 2014
of these problems, but its semi-quantitative scale consisting of only three discrete levels restricts its reliability and precision9. However Kidney Disease Outcomes Quality Initiative (KDOQI), 2000 suggest to use SGA to access nutritional status due to its easy, simple, reli-able and inexpensive application11.According to 19th Reports of the Malaysian Dialysis and Transplant Registry, there are de-creasing trend in severely malnourished pa-tients5. The mortality rate has decreases as the body mass increased10. Previous studies had measured nutrient intake (predialysis se-rum urea, creatinine, cholesterol) or muscle mass (predialysis serum albumin and creati-nine) have relationship between survival rates among hemodialysis (HD) patients10.The general objective in this study was to assess nutritional status among HD patients in HD Unit, Hospital Pakar Sultanah Fati-mah(HPSF)andspecificallythepercentagesof malnutrition status among these HD pa-tients. The other aims were to assess cor-relation between anthropometric parameters (dry weight, body mass index, mid upper arm circumference) with SGA, and to determine correlation between protein and caloric intake with SGA.
Materials and Methods
This research is registered on the Malaysian National Medical Research Register (ID NMRR-12-1374-13189) and approved by the Medi-cal Research Ethical Committee of Ministry of Health Malaysia. This is cross sectional study where the respondents were 61 patients on maintenance HD. Criteria for inclusion were age 18 and above, stable and have been dia-lyzed for more than 6 month and agreed to participate in the study. The exclusion crite-ria were patients who refused to participate in the study, pregnant, less than 18 years old and dialyzed for less than 6 months. Af-ter informed consent was obtained from the patients, they were interviewed using a ques-tionnaire form from 2 July to 31 July 2012. Nutritional status was assessed by ModifiedSGA to evaluate protein energy nutritional status14. Kalanter-Zadeh et al. described there was 7 original SGA components included in this SGA version and created a quantitative scoring system15. It includes weight change, dietary intake, gastrointestinal symptoms, functional capacity, co-morbidity, subcuta-neous fat and signs of muscle wasting. Each component has a score from 1 (normal) to 5 (very severe). Thus, malnutrition scoring 7
was normal and 35 were severely malnour-ish. Based on this scoring of each patient, it reflectedthenutritionalstatusasfollow:1=normal nutritional status, 2 = mild malnutri-tion status, 3 = moderate malnutrition and 4 = severe malnutrition1.The questionnaires included demographic data, socioeconomic background, anthropo-metric data, biochemical data, 24-hour diet recall for dialysis day and non-dialysis day. The biochemical data taken from the patient’s record were albumin, ferritin, TIBC, choles-terol and creatinine. This research was con-ducted for 30 days. General demographic data information collected includes age, gen-der, diagnosis, co-morbidities, clinical and di-alysis history. Anthropometrics data were dry weight, height, body mass index (BMI), mid upperarmcircumference(MAC)andmodifiedSGA. Regarding statistical analysis, values were presented as mean ± SD. P value < 0.05 was considered to be significant. Themeasure-ment to assess correlation between SGA with anthropometric data, biochemistry data and diet intake by using Spearman’s rank correla-tionanalysisafterconfirmationwasnotnor-mal distribution by the Kolmogorov-Smirnov test.
Results
Socio-demographic data46 patients out of 61 patients (27 males and 19 females, mean age 54.32±14.61, range 22 to 85 years) were selected for this study as seen in table 1. Most of the data is normally distributed by Kolmogorov-Smirnov test. The duration of HD in the subjects ranged as per Figure 1 below. Majority of patients had been undergoing HD for a period of more than 4 to 10 years and more than 10 years which was 37.0% (N=17). Followed by more than 2 to 4 years which 15.2% (N=7) and 6 months to 2 years which 10.9% (N=5).The frequency of HD was thrice weekly. The patients were undergoing HD in 2 shifts, 56.5% (N=26)inthefirstshift(Monday,Wednesdayand Friday) and 43.5% (N=20) in the second shift (Tuesday, Thursday and Saturday). The co-morbidities of study population were hy-pertension (58.7%, N=27) and diabetes mel-litus (23.9%, N=11). The others causes of ESRD were toxic nephropathy, renal failure, unknown and others.

34Jurnal Kesihatan Johor, Vol. 11, 2014
Table 1: Socio-demographic data among HD patients
Socio-demographic No. of patients(N= 46)
n %Ethnicity
Malay
Chinese
Indian
27 58.7
16 34.8
3 6.5Married status Single Married
1135
23.976.1
Currently staying with Alone Family
145
2.297.8
Level of education None Primary Secondary College/ University
220177
4.343.537.015.2
Working Yes No
1531
32.667.4
Why not working?
Able to work but un-able to get jobAble to work but un-able due to dialysis scheduleHousewifeRetiredBad health condition
2
6
959
6.5
19.4
29.016.129.0
Party responsible for dialysis cost Wife/husband Children Relatives Government Non- governmental organization
162334
2.213.04.371.78.7
Table 2: Anthropometric data (mean±SD) among HD’s Patients
Anthro-pometric
Allpatients (N=46)
Male (N=27)
Female (N=19)
Dry weight (kg)BMI (kg/m2)MAC (cm)
58.1±12.9
23.9±4.7
27.2±3.9
61.2±12.2
24.3±4.2
27.6±3.5
53.5±12.8
23.3±5.5
26.5±4.4
Biochemistry dataTotal protein and albumin were in the normal range level.
Table 3a: Biochemistry data among HD’s PatientsBiochemistry Parameters Descriptive Analysis
Median IQR 25 – 75
Total ProteinAlbuminFerritin
Total IronBinding CountBUN predialysis BUN post di-alysisUrea predialysis
77.0040.00542.70
191.00
44.35
12.00
18.35
70.00 – 82.2537.00 – 42.00
237.62 – 1097.50
177.75 – 210.00
37.72 – 50.25
9.25 – 14.70
15.35 – 20.72
6 months-2 years >2-5 years >5-10 years >10 years
Figure 1: Percentage of Dialysis Durations among HD Patients
Antropometric dataDry weight, BMI and MAC for male are more than female patients showed in Table 2. Me-dian score for height was 150cm (150-160) and for SGA score was 12.50(10.75–15.00).

35Jurnal Kesihatan Johor, Vol. 11, 2014
Table 3b: Biochemistry data (mean±SD) among HD’s Patients
Bio All patients Male Femalechemistry Parameters (N=46) (N=27) (N=19)Serum Iron
Transferin Ratio
Cholesterol
Creatinine pre dialysis
Creatinine post dialy-sis
Kt/V
Urea post dialysis
58.9±21.5 64.6±21.4 50.67±19.3
30.3±11.4 32.8±10.7 26.7±11.7
4.5±0.7 4.5±0.7 4.6±0.7
919.5±188.7 997.0±179.3 807.5± 142.5
300.8±109.0 344.8±102.5 237.3± 85.9
1.7±0.4 1.6±0.3 1.9±0.5
5.2±2.1 5.8±2.0 4.0±1.7
Diet Requirement and intakeAverage energy intake was 1457 kcal/day with 78.0% patients achieved energy require-ment. The average protein intake was 61.5g/day with 95.2% patients achieved protein re-quirement.
Table 4: Dietary Requirement and Intake (mean±SD) among HD’s Patients
Allpatients (N=46)
Male (N=27)
Female (N=19)
Calorie 1925.8± 2015.77± 1809.4±Require- 322.5 281.0 316.8mentProtein 67.2±12.3 70.2± 62.8±Require- 11.0 11.8mentCalorie 1456.9 ±485.3 1563.6±Intake 544.8 1323.2± 378
Protein 61.5 ±24.2 66.7±Intake 26.7 55.9± 19.1
Figure 2: Percentage of dialysis duration among Hemodialysis patient by SGA score
Figure 2 showed percentages of dialysis du-ration among HD patient by SGA score. SGA showed that 91.3% (N=42) HD patients were mildly malnourished and 8.7% (N=4) were moderately malnourished.
Table 5 Spearman Correlation between SGA score and the parameters
Parameters SGA Score (N=46)
Correlation (r) Sig. (2 tailed)
Dry Weight BMI MACCreatinine pre dialysisCalorie intakeProtein intake
-0.4310**-0.4990** -0.4710** -0.3840**
-0.0170-0.0020
-0.4310**-0.4990** -0.4710** -0.3840**
-0.0170-0.0020
*pvalue<0.05significantcorrelation
Correlationtestfoundasignificant,goodandnegative relationship between SGA with dry weight, BMI, MAC and creatinine pre dialysis as seen in Table 5. However, there was no significantcorrelationbetweenSGAwithcalo-rie and protein intake.
Discussion
From this study, we found that, 91.3% were mildly malnourished and 8.7% was moder-ately malnourished. Average BMI for the pa-tients were 23.9 ± 4.7 which is lower than 24.3 + 8.4kg/m2 reported in 20th Malaysian Renal Registry Report17. BMI may be mislead-ing in the presence of edema, which is com-mon amongst HD patients18. Our analysis used dry weight but there were studies using post dialysis weight. High BMI seemed to have low mortality due to greater energy reserves if HD adds to catabolism18,19.Average albumin was 39.5 g/L which is higher than 38.7 + 5g/L reported in 20th Malaysian
62.5 -
50 -
37.5 -
25 -
12.5 -
Perc
enta
ge
0 -0.6-2 >2-4 >4-10 >10
36Jurnal Kesihatan Johor, Vol. 11, 2014
Qureshi AR, Alvestrand A, Danielsson A, et al: Factors influencingmalnutrition inhemodialysis patients: a cross-sectional study. Kidney Int. 1998; (53): 773-782.
World Health Organization: Malnutrition. Available at: http://www.who.int/water_sanitation_health/disease/malnutrition/en/ (Accessed 12 September 2012)
Noah SS. Protein-Energy Malnutrition. Available at: http://emedicine.medscape.com/article/1104623 (Accessed 27 May 2013)
Bossola M. Malnutrition in chronic patients in hemodialysis: prevalence, pathogene-sis, treatment. G Ital Nefrol. 2009; 201-214.
Malaysian Society of Nephrology. 19th Re-port of the Malaysian Dialysis and Trans-plant Registry 2011. Malaysia: Malaysian Society of Nephrology; 2011.
Raguso CA, Maisonneuve N, Pichard C. Subjective global assessment (SGA): evaluation and follow up of nutritional state. 2004;124:607-610.
Sarkar SR, Kuhlmann MK, Khilnani R, et al: Assessment of body composition in long-term hemodialysis patients: Rationale and methodology. J RenNutr , 2005:15:152-158.
Bollag D, Genton L, Pilchard C: Assess-ment of nutritional status. Ann Med In-terne. 2000; 151:575-583.
Kalantar-Zadeh K, Kleiner M, Dunne E, Lee GH,LuftFC.Amodifiedquantitativesub-jective global assessment of nutrition for dialysis patient. Nephrol Dial Transplant. 1999; 14:1732-1738.
Kopple JD, Zhu X, Lew NL, Lowrie EG: Body weight-for-height relationships pre-dict mortality in maintenance hemodialy-sis patients. Kidney Int. 1999; 56:1136-1148.
KDOQI, National Kidney Foundation: clinical practice guidelines for nutrition in chronic renal failure. Am J Kidney. Dec 2000; 35:81-140.
1.
2.
3.
4.
5.
6.
7.
8.
9.
10.
11.
Renal Registry Report17. This showed that nu-tritional status for the dialysis patient in HD Unit, HPSF is better than the reported in the national study.Malnutrition status is said to be associated with inadequate energy and protein intake among patient16 but also influencedby sev-eral co-morbidity1. 82.6% of our respondents had co-morbidity. Hypertension was more fre-quent among patients in this study. This study showed that energy intake for the men were 77.5% and the women were 73.0% from to-tal energy intake. For protein requirement, the men have achieved 95.0% and women 89.0%. Several other studies also showed that energy intake was less than requirement but protein intake was adequate16. However therewasnosignificantcorrelationbetweenSGA with diet intake.In this study, SGA was negatively correlated with body weight (r=-0.4310, p=0.0030), BMI (r=-0.4990, p=0.0001) and MAC (r=-0.4710, p=0.0010) and creatinine pre HD (r=-0.384, p=0.009). Others study also showed negative correlation between SGA and BMI and MAC9,
20. Most of the other studies were using mid arm muscle circumference (MAMC) derived from triceps skin fold thickness but we did not use them due to the limitation of our equip-ment. In our study, we found that albumin was not correlated with SGA20 but some studies showed that albumin was strongly correlated with SGA9, 21. This is because serum albumin is a marker of visceral protein store and ef-fected by non-nutritional factors such as in-flammation,hydrationstatus,andorcatabolicprocess18. In order to improve the nutritional status of the patient, team approach manage-ment is very important to help patient in up-grading their quality of life.
Conclusion
All HD patients in HPSF were mildly malnour-ish. There were significant correlation be-tween SGA and dry weight, BMI, MAC and pre HD creatinine only among HD patient in HD Unit, HPSF, Muar.
Acknowledgement
The authors would like to thank the Director General of Health Malaysia for permission to publish this paper. We are grateful to Dr. Sela-huddeen Bin Abd. Aziz, Hospital Director); Dr. Yia Hua Jern, Head, Department of Nephrol-ogy and the staff in HD Center, HPSF.
References

37Jurnal Kesihatan Johor, Vol. 11, 2014
Cooper BA, Bartlett LH, Aslani A, et al : Validity of subjective global assessment as a nutritional marker in end-stage renal disease. Am J Kidney Dis. 2002; 40:126-132.
Christensson L, Unossons M, Ek AC: Mea-surement of perceived health problems as a means of detecting elderly people at risk of malnutrition. J Nutr Health Aging. 2003; 7:257-262.
Detsky AS, McLaughlin JR, Baker JP, John-ston N, Whittaker S, et al. What is subjec-tive global assessment of nutritional sta-tus? J Parenter Enterol Nutr 33:650-653, 1987
Kalanter- Zadeh K, Kopple JD, Block G, et al: A malnutrition-inflammation score iscorrelated with morbidity and mortality in maintenance hemodialysis patients. Am J Kidney. Dec 2001; 38:1251-1263.
Morais AAC, Silva MAT, Faintuch J, Vidi-gal EJ, Costa RA, Lyrio DC, et al. Corre-lation of nutritional status and food in-take in hemodialysis patients. Clinics. 2005;60(3):185-92.
12.
13.
14.
15.
16.
Malaysian Society of Nephrology. 20th Report of Malaysian Dialysis & Transplant Registry 2012. Malaysia: Malaysian Soci-ety of Nephrology; 2012.
Piferet et al. Mortality risk in hemodialysis patients and changes in nutritional status. Kidney Int. 2002; 62:2238–2245.
Leavey SF, Strawderman RL, Jones CA, et al. Simple nutritional indicators as inde-pendent predictors of mortality in hemo-dialysis patients. Am J Kidney. Dec 1998; 31:997-1006.
Manandhar DN, Chhetri PK, Pahari LR, et al. Nutritional assessment of patients un-der hemodialysis in Nepal Medical College Teaching Hospital. Nepal Med Coll J. 2008; 10(3):164-169.
Afshar R, Sanavi S, Izadi-Khah A. As-sessment of nutritional status in patients undergoing maintenance hemodialysis: a single study from Iran–Saudi. J Kidney Dis Transplant. 2007; 18(3): 397-404.
17.
18.
19.
20.
21.

38Jurnal Kesihatan Johor, Vol. 11, 2014
Corresponding author:
Tan Chor Lip Henry,General Surgery Department,Hospital Sultan Ismail, Jalan Persiaran Mutiara Emas Utama,Taman Mount Austin,81100 Johor Bahru, Johor.Phone: 073565000Fax: 073565034Email: [email protected]
Abstract
Introduction: Acute upper gastrointestinal re-bleeding is a gastroenterological emer-gency which has 5 times higher mortality rates compared to non-variceal upper gas-tro intestinal bleeding (UGIB). Objective: To determine the predictors of re-bleeding, 30 daysafterconductofthefirsthemostaticen-doscopy. The predictors were High Risk Ul-cer (HRU) versus Low Risk Ulcer (LRU) and ModifiableRiskFactors(MRF).Method: Ret-rospective study of endoscopy records of pa-tients who underwent emergency OGDS for indications of UGIB in Hospital Sultan Ismail, JB between January 2009 till May 2013. Re-sults: 516 patients were included comprising 354 (69%) males with a total mean age of 60.7 years. 152 (29.5%) patients had HRU and 364 (70.5%) were found to have LRU. The HRU group had twice the risk of re-bleed-ing at 21.7% (33/152) when compared to the LRU group at 9.3% (34/364) risk with a crude oddsratio(OR)of2.69(95%ConfidenceIn-terval (CI) : 1.60, 4.54, p-value<0.001). Both werefoundtobesignificantindependentriskfactors. MRF independently does not increase re-bleeding risk (p-value=0.604). MRF does not influence re-bleeding in thosewithHRUwith an adjusted OR of 2.70; (95 % CI: 1.60-4.56, p < 0.001). Conclusion: The Forrest 1A, 1Bor2Aclassificationsofulcersaresignifi-cant predictive factors of re-bleeding within
30dayspostfirstinterventionOGDS.Modifi-able risk factors were not associated with re-bleeding. Patients with HRU should be given an earlier follow-up date (before 30 days) to allow clinicians to identify early re-bleed-ing and commence the needful intervention, hence improving clinical outcomes.
Keywords: Non-Variceal, Rebleeding,Modifi-able Risk Factor, High risk ulcer, Low risk ul-cer
Introduction
Upper gastrointestinal bleeding (UGIB) is a common surgical emergency that has an in-cidence of 100 per 100,000 population yearly in the UK (1,2). In Malaysia, it has been re-ported that we have an incidence of 72 per 100,000 adult population 3. Upper gastroin-testinalbleeding(UGIB)isdefinedasbleed-ing derived from a source proximal to the ligament of Treitz 4. The main causes of UGIB can be divided into 2 broad categories name-ly; variceal and non-variceal(NV) bleeding. Common causes of NV bleeding include peptic ulcer disease, gastritis and Mallory Weis tear. Less common causes of NV bleeding include esophagitis, gastric cancer and aorto-enteric fistulas3.The mainstay of treatment for patients with NV UGIB is intravenous proton pump inhibi-tors and haemostasis by OGDS. UGIB carries a mortality of 6-10% with a 5 times higher mortality rate if the patient re-bleeds after treatment/ intervention (OGDS) 4,5.It is imperative to stratify patients’ risks to identify those at high risk of re-bleeding. Till date, there is not one scoring system that can predict re-bleeding accurately after endoscop-ic treatment.
Hypothesis There is an association between patients with high risk ulcers of Forrest 1A, 1B and 2A clas-sificationandre-bleeding.
8
Volume 11
2014
High Versus Low Risk Ulcer AndModifiableRiskFactors–PredictorsOf30days
Rebleeding In Non-Variceal Upper Gastrointestinal Bleeding
Tan C. L. H.1, Heah H. T.1, Arulanantham S.1
1 Hospital Sultan Ismail, Johor Bahru, Malaysia

39Jurnal Kesihatan Johor, Vol. 11, 2014
There is an association between patients with modifiableriskfactorsandre-bleeding.
Objectives Primary Objective : To determine the predic-tors of re-bleeding (30 days) after first he-mostatic endoscopy in relations to high risk ulcer(HRU) versus low risk ulcer(LRU) and modifiableriskfactors(MRF).Secondary Objective : To determine whether the patients who rebleed within 60 days after first hemostatic endoscopy.
Materials & Methods
This research is registered on the Malaysian National Medical Research Register (ID NMRR-14-526-21354). This is a retrospective study which re-examined data/records of patients who visited Johor Bahru Surgical Department Endoscopic Unit, Sultan Ismail Hospital (HSI), between January 2009 till May 2013 (about 52 months). Hospital Sultan Ismail, Johor Bahru is a spe-cialist tertiary hospital equipped with a fully computerized system known as Total Hospi-tal Information System or THIS and provides services to more than 700,000 people in the 8 district and its surrounding areas. All patients who underwent emergency OGDS with indications of upper gastrointestinal bleed within 24-48 hours from admission or firstreferralwerereviewedretrospectively.EmergencyOGDS is defined asOGDS donewithin 24-48 hours of admission or refer-ral to the surgical team with indications of UGIB which include 1 or more of the following symptoms : haematemesis, melaena, coffee ground vomitus, anaemia and drop in haemo-globin level with strong suspicion of UGIB. Patientswithendoscopicfindingsofnon-va-riceal bleeding ulcers of Forest 1A, 1B and 2A were defined as high risk ulcers whereas For-est 2B, 2C, and C were defined as low risk ul-cers. Both these groups were included in this study. Patients’ previous records were kept in the hospital’s computer database called Total Hos-pital Information System or THIS. From the patients’ preceding records, we registeredpatients’modifiable risk factors ofsmoking, NSAIDS, alcohol intake, traditional medication and patients who had 2 or more of thementionedriskfactors(2>rf)fromthefirstgeneral examination (clerking) or documents elicited. All patients with NV UGIB who achieved ini-tial haemostasis were followed up for 60 days.
Patients who were discharged were kept on a single form of oral PPI and given a 6 week fol-low up date to reassess the symptoms.During follow up appointments, if there were no symptoms of re-bleeding, patients were given further follow up every 2 months to re-assess symptoms. The duration of follow up given was based on clinicalfindingsaswellassurgeonpreference.If clinical and endoscopic findings indicate ahigher risk of re-bleed, patients were given an earlier duration of follow-up.On follow up, patients were screened for signs of re-bleeding i.e. haematemesis, melaena, fresh per rectal bleeding and coffee ground vomitus. Patientswhore-bledwereclassifiedbasedonpresence or existence of a positive endoscopic findingofre-bleedingorfurtherbleeding,theneed for laparotomy to achieve haemostasis or mortalitywithin30daysafterfirstsuccessfulendoscopic treatment.Patients were also followed up for at least 60 days to reassess signs and symptoms of re-bleeding in our surgical follow up clinic.
Inclusion Criteria:1. All patients whom an emergency OGDS was performed for indications of UGIB and re-ferred to surgical unit HSI JB.2. All patients whom had a presence of a posi-tiveendoscopicfindingofre-bleedingorfur-ther bleeding, need for laparotomy to achieve haemostasis or mortality within 30days after firstsuccessfulendoscopictreatment.3. All patients who had comprehensive exam-inationwithcompletenotesofOGDSfindingsreporting HRU (Forrest 1A, 1B, 2A), LRU (2B, 2C, 3) and statements of MRF namely; smok-ing, NSAID, alcohol and traditional medication intake were recorded and included.
Exclusion Criteria :1. Patients without complete OGDS records.2. Patients who underwent emergency OGDS but not for the purpose of UGIB. eg. to assess tumour, emergency Ryle’s tube placement.
Ethical Consideration :The researchers obtained approval from the Head of Department, Surgical Unit to collect data from the Endoscopic Unit, HSIJB and complied to good clinical practice (GCP) and the declaration of Helsinki.
Data Analysis :The investigators analysed data using sta-tistical software SPSS version 15. Crude and

40Jurnal Kesihatan Johor, Vol. 11, 2014
adjusted odds ratio values were derived from simple and multiple logistic regression tests.
Results :
516 patients were included comprising 354 (69%) males with a total mean age of 60.7 years. 152 (29.5%) patients had HRU and 364 (70.5%) were found to have LRU. The HRU group had twice the risk of re-bleeding at 21.7% (33/152) when compared to the LRU group at 9.3% risk (34/364) with a crude odds ratio(OR)of2.69(95%ConfidenceInterval(CI) : 1.60-4.54, p-value<0.001). High risk ulcerswere foundtobesignificant indepen-dent risk factors. MRF independently does not increase re-bleeding risk with a crude odds ra-tio of 0.87 (p-value=0.604). Multiple logistic regressionshowsthatMRFdoesnotinfluencere-bleeding in those with HRU with an adjust-ed odds ratio of 2.70 (95% CI: 1.60-4.56) against the low risk group (p-value<0.001). Refer Figures 1 and 2.
Discussion
About 90% of patients will achieve primary haemostasis with endoscopic intervention. Despitewithriskstratification,adavancementin endoscopic techniques in securing UGIB andppi’s,20%ofUGIBpatientsafterfirsthe-mostatic endoscopy will develop rebleeding.
Patients that rebleed has a ten times higher mortality rate and is an important predictor of mortality 1,3.To date, there are only 3 validated scoring systems to predict risk of re-bleeding which are the Rockall, Blatchford and Addenbrooke risk scoring system. However, these validated risk scoring systems have low sensitivity to-wards predicting patients with high risk of re-bleeding. Re-bleeding is considered the most important risk factor for mortality and records 5 times higher mortality rate as opposed to patients with initial UGIB managed and ar-rested by OGDS 4.Early endoscopy coupled with intravenous proton pump inhibitors remain the foundation of treatment to achieve initial haemostasis 6. In our study, re-bleeding is defined as thepresenceof a positive endoscopic findingofre-bleeding or further bleeding, need for lapa-rotomy to achieve haemostasis or mortality within 30 days after first successful endo-scopic treatment 7,8,9.According to Rockall’s original audit of four thousand english patients, there was an in-crease in rebleeding in increase in the post endoscopy rockall score 10. This may be due to the addition to the fact that the diagnosis on endoscopy was included which gives high risk ulcers a higher score which further vali-datestheuseofforestclassificationtostratifypatient at high risk at rebleeding. According to Hadzibulic et al, the percent-age of rebleeding was 27.78% from pa-tients with forest 2b ulcers, followed by for-est 2a(13.3%) and forest 1b(18.18%). Forest 1a ulcer showed no rebleeding probably due to low number of patients with only 1 patient with forest 1a ulcer 1. In our study we did not include forest 2b ulcer which is an adherant clot as there is a pos-sibility if the clot was removed during endos-copy would reveal the true ulcer which may be downgraded to forest 2c or 3 or upgraded to an forest 1a, 1b or 2a ulcer 11.By stratifying patient risk base on patients endoscopic findings, patients with high riskulcermaybenefittohavebetterprognosisifmonitored closely in ICU of HDW for signs of early rebleeding. Low risk patient may also be managed as outpatient and planned for early discharge which would free up hospital resources for treating other severe cases 2.
Conclusion
TheForrest1A,1Bor2Aclassificationsoful-cers are significant predictive factors of re-

41Jurnal Kesihatan Johor, Vol. 11, 2014
HadzibulicE,GovedaricaS.SignificanceofForrestclassification,Rockall’sandblatch-ford’s risk scoring system in prediction of rebleeding in peptic ulcer disease. Acta Medica Medianae. 2007;46(4):38-43
Enns RA, Gagnon YM, Barkun AN, Arm-strong D, Gregor JC, Fedorak RN et al. Validation of the Rockall scoring system for outcomes from non-variceal upper gastro-intestinal bleeding in a Canadian setting. World Journal of Gastroenterology. 2006; 12(48):7779-7785
Malaysian Clinical Practise Guidelines On Management Of Non-Variceal Upper Gas-trointestinal Bleeding April 2003. Available from:http://www.acadmed.org.my/index.cfm?&menuid=67
Wang CY, Qin J, Wang J, Sun CY, Cao T, Zhu DD et al. Rockall score in predicting outcomes of elderly patients with acute up-per gastrointestinal bleeding. World Journal of Gastroenterology.2013 June 14; 19(22): 3466-3472
Chen IC, Hung MS, Chiu TF, Chen JC, Hsiao CT. Risk scoring systems to predict need for clinical intervention for patients with non-variceal upper gastrointestinal tract bleed-ing. American Journal of Emergency Medi-cine. 2007; 25(7):774-779
National Clinical Guideline Centre.CG141 Acute upper GI bleeding: full guideline, ap-pendices A – L June 2012. Available from: http://www.nice.org.uk/guidance/cg141/resources/cg141-acute-upper-gi-bleeding-full-guideline-appendices-a-l2
1.
2.
3.
4.
5.
6.
bleedingwithin30dayspostfirstinterventionOGDS.Modifiableriskfactorswerenotasso-ciated with re-bleeding. Patients with HRU should be given an earlier follow-up date (within 30days) to allow clini-cians to identify re-bleeding and commence early intervention that will improve clinical outcome.
Acknowledgement
The author(s) would like to thank the Director General of Health Malaysia for permission to publish this paper.
References
Vreeburg EM et al. Acute upper gastroin-testinal bleeding in the Amsterdam area: incidence, diagnosis, and clinical outcome. American Journal of Gastroenterology. 1997; 92(2):236-243
Gralnek IM, Dulai GS. Incremental value of upper endoscopy for triage of patients with acute non-variceal upper-GI hemor-rhage. Gastrointestinal Endoscopy. 2004; 60(1):9-14
Bessa X, O’Callaghan E, Balleste B, Nieto M, Seoane A, Panades A et al. Applicability of the Rockall score in patients undergoing endoscopic therapy for upper gastrointes-tinal bleeding. Digestive and Liver Disease. 2006; 38(1):12-17
RockallTA,LoganRF,DevlinHB,NorthfieldTC. Risk assessment after acute upper gastrointestinal haemorrhage. Gut. 1996; 38(3):316-321
Elmunzer BJ, Young SD, Inadomi JM, Schoenfeld P, Laine L. Systematic Review of the predictors of recurrent hemorrhage after endoscopic hemostatic therapy for bleeding peptic ulcers. American Journal of Gastroenterology. 2008;103:2625-2632
7.
8.
9.
10.
11.
42Jurnal Kesihatan Johor, Vol. 11, 2014
Corresponding author:
Dr Ahmad Nizal Bin Mohd Ghazali,Pejabat Kesihatan Daerah Ledang,JKR2831, Jalan Hospital, 84900 Ledang, JohorPhone: 06-9787762Fax: 06-9787724Email: [email protected]
Abstract
Introduction:This study observed the pat-tern of reported dengue infections, param-eters measured, dengue serology and circu-lating dengue serotypes in Johor, Malaysia. The aim of this study was to determine the co-circulation of the four different dengue vi-rus serotypes in Johor. Methodology:We an-alyzed the surveillance data (VEKPRO) from Johor State Health Department and Nation-al Public Health Laboratory, Malaysia on re-ported dengue infections from 1st January 2011 to 31st December 2011. Results:There were 1583 reported dengue infections, 1388 (87.7%) cases were dengue fever (DF) and 195 (12.3%) were dengue hemorrhagic fe-ver (DHF). The mean age was 27.3 ± 15.5 years old and most were young adults, aged 15 years old and older. Working, males (p < 0.05), and those residing in Johor Bahru dis-trict (p < 0.05) were more likely to get den-gue infections. Majority of the cases having fever, admitted on day 4 and 5 after devel-oping symptoms and low platelet less than 100,000. All four dengue serotypes (DEN 1 – 4) were present, including a case of con-current infection with 2 different dengue se-
rotypes (DEN-2/DEN-3). Conclusion:Dengue affected all age groups particularly young adults and males. Most cases reported were in urban areas and Johor Bahru district. Peak ofthedengueinfectionsoccurredinthefirstquater of the year, with DEN-1 was being the most predominant dengue serotype. A con-current infection with 2 different dengue se-rotypes was also observed.
Key words: Dengue fever (DF), dengue hae-morrhagic fever (DHF), socio-demographic factors, dengue serology, dengue serotype
Introduction
Dengue viral infections are one of the most im-portant mosquito-borne diseases in the world. Although dengue has a global distribution, the WHO South-East Asia (SEA) Region together withWesternPacificRegionbearsnearly75%of the current global disease burden. Dengue is described as ‘endemic’ in many countries in the SEA Region – which means that cases occureveryyear,althoughthereissignificantvariation between countries and within each country1. In Malaysia, an average of 5000 cases were reported dengue cases annually in the early 1990s2. However, between 2002 and 2004 more than 30 000 cases have been reported every year. The number of reported dengue fever and dengue haemorrhagic fever cases in Malaysia continue to show an increasing trend. The incidence rate also shows an up-ward trend from 44.3 cases/100,000 popula-tion in 1999 to 181 cases/100,000 population in 20073.Dengue cases are increasing every year in Johor, with total of 4,406 cases in
9
Volume 11
2014
Dengue Infections andCirculating Serotypes in Johor, Malaysia
Mohd Ghazali AN1, Hod R2, Shahani M3, Che Mat Din S4, Amin F5, Ismail N5, Mohd Salleh Z1
1District Health Office, Ledang, Johor, Malaysia 2Department of Community Medicine, UKM Medical Centre, Universiti Kebangsaan
Malaysia. 3Faculty of Allied Health Sciences, Universiti Kebangsaan Malaysia, Kuala Lumpur,
Malaysia.4District Health Office, Johor Bahru, Johor, Malaysia.
5National Public Health Laboratory, Sungai Buloh, Selangor, Malaysia.
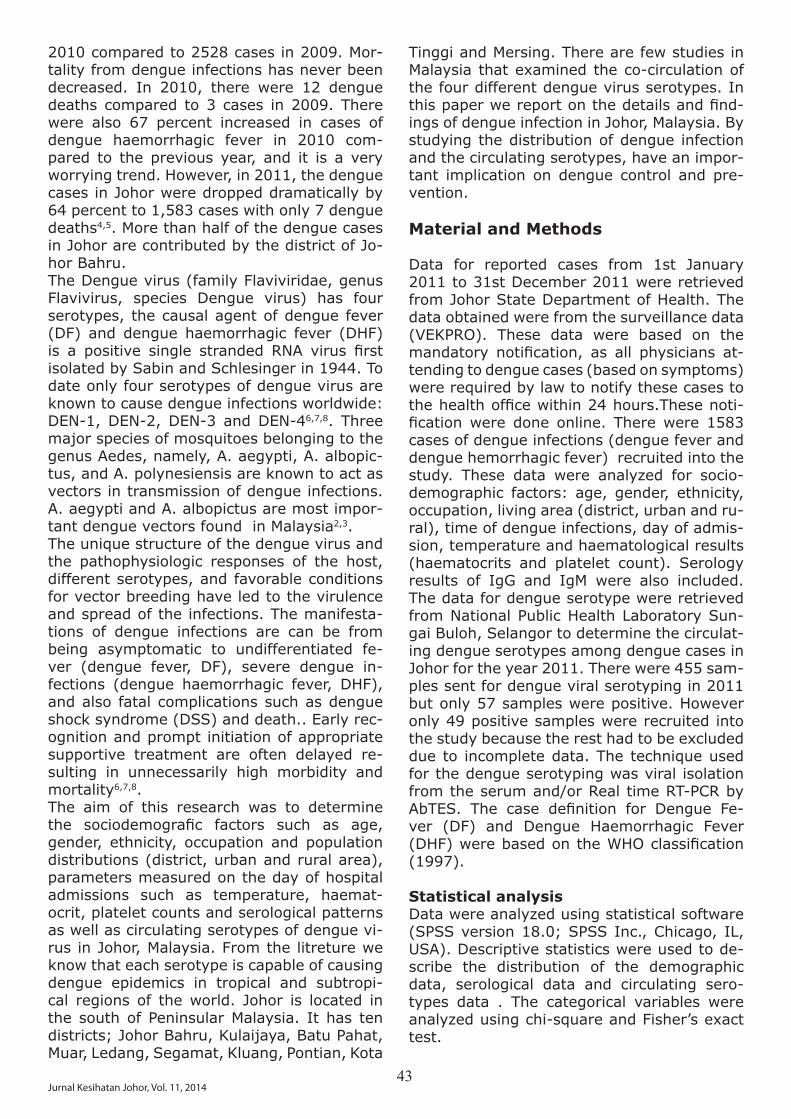
43Jurnal Kesihatan Johor, Vol. 11, 2014
2010 compared to 2528 cases in 2009. Mor-tality from dengue infections has never been decreased. In 2010, there were 12 dengue deaths compared to 3 cases in 2009. There were also 67 percent increased in cases of dengue haemorrhagic fever in 2010 com-pared to the previous year, and it is a very worrying trend. However, in 2011, the dengue cases in Johor were dropped dramatically by 64 percent to 1,583 cases with only 7 dengue deaths4,5. More than half of the dengue cases in Johor are contributed by the district of Jo-hor Bahru.The Dengue virus (family Flaviviridae, genus Flavivirus, species Dengue virus) has four serotypes, the causal agent of dengue fever (DF) and dengue haemorrhagic fever (DHF) is a positive single stranded RNA virus firstisolated by Sabin and Schlesinger in 1944. To date only four serotypes of dengue virus are known to cause dengue infections worldwide: DEN-1, DEN-2, DEN-3 and DEN-46,7,8. Three major species of mosquitoes belonging to the genus Aedes, namely, A. aegypti, A. albopic-tus, and A. polynesiensis are known to act as vectors in transmission of dengue infections. A. aegypti and A. albopictus are most impor-tant dengue vectors found in Malaysia2,3.The unique structure of the dengue virus and the pathophysiologic responses of the host, different serotypes, and favorable conditions for vector breeding have led to the virulence and spread of the infections. The manifesta-tions of dengue infections are can be from being asymptomatic to undifferentiated fe-ver (dengue fever, DF), severe dengue in-fections (dengue haemorrhagic fever, DHF), and also fatal complications such as dengue shock syndrome (DSS) and death.. Early rec-ognition and prompt initiation of appropriate supportive treatment are often delayed re-sulting in unnecessarily high morbidity and mortality6,7,8. The aim of this research was to determine the sociodemografic factors such as age,gender, ethnicity, occupation and population distributions (district, urban and rural area), parameters measured on the day of hospital admissions such as temperature, haemat-ocrit, platelet counts and serological patterns as well as circulating serotypes of dengue vi-rus in Johor, Malaysia. From the litreture we know that each serotype is capable of causing dengue epidemics in tropical and subtropi-cal regions of the world. Johor is located in the south of Peninsular Malaysia. It has ten districts; Johor Bahru, Kulaijaya, Batu Pahat, Muar, Ledang, Segamat, Kluang, Pontian, Kota
Tinggi and Mersing. There are few studies in Malaysia that examined the co-circulation of the four different dengue virus serotypes. In thispaperwereportonthedetailsandfind-ings of dengue infection in Johor, Malaysia. By studying the distribution of dengue infection and the circulating serotypes, have an impor-tant implication on dengue control and pre-vention.
Material and Methods
Data for reported cases from 1st January 2011 to 31st December 2011 were retrieved from Johor State Department of Health. The data obtained were from the surveillance data (VEKPRO). These data were based on the mandatory notification, as all physicians at-tending to dengue cases (based on symptoms) were required by law to notify these cases to thehealthofficewithin24hours.Thesenoti-ficationwere done online. Therewere 1583cases of dengue infections (dengue fever and dengue hemorrhagic fever) recruited into the study. These data were analyzed for socio-demographic factors: age, gender, ethnicity, occupation, living area (district, urban and ru-ral), time of dengue infections, day of admis-sion, temperature and haematological results (haematocrits and platelet count). Serology results of IgG and IgM were also included. The data for dengue serotype were retrieved from National Public Health Laboratory Sun-gai Buloh, Selangor to determine the circulat-ing dengue serotypes among dengue cases in Johor for the year 2011. There were 455 sam-ples sent for dengue viral serotyping in 2011 but only 57 samples were positive. However only 49 positive samples were recruited into the study because the rest had to be excluded due to incomplete data. The technique used for the dengue serotyping was viral isolation from the serum and/or Real time RT-PCR by AbTES. The case definition for Dengue Fe-ver (DF) and Dengue Haemorrhagic Fever (DHF)werebasedontheWHOclassification(1997).
Statistical analysis Data were analyzed using statistical software (SPSS version 18.0; SPSS Inc., Chicago, IL, USA). Descriptive statistics were used to de-scribe the distribution of the demographic data, serological data and circulating sero-types data . The categorical variables were analyzed using chi-square and Fisher’s exact test.

44Jurnal Kesihatan Johor, Vol. 11, 2014
Co
un
t
WEEK
Figure 1. Time of Dengue Infections According to Epidemiological Week in 2011
TYPE DHF DF
Results
From 1583 cases of dengue infections in Johor in 2011 analyzed, 1388 (87.7%) cases were dengue fever and the remaining 195 (12.3%) were dengue hemorrhagic fever.
Time of dengue infections Dengue infections can occur anytime within the study period. Based on the epidemio-
logical week, week 2 and 7 in 2011 had the most cases with 61 and 62 cases respectively. Theseweeksareinthefirstquateroftheyear(January-March), the period with the most dengue cases reported, 564 cases with 100 of them were dengue hemorrhagic fever. The dengue infections slightly reduced after that and remained fairly constant through out until the end of the year (Figure 1).
Socio-demographic factors All age groups, gender and ethnicity were af-fected from dengue infections. The youngest was 4 months old and the oldest case was 88 years old. The mean age was 27.29 ± 15.49 years old and most were young adults, aged 15 years old and older (Table 1). For both den-
gue fever and dengue haemorrhagic fever in this study, there were 986 males compared to 597 females. The ratio of male to female was 1.7 to 1.0. The ratio of dengue fever cases for male to female was also 1.7 to 1.0. For den-gue haemorrhagic fever, the ratio of male to female was 1.6: 1.0.
45Jurnal Kesihatan Johor, Vol. 11, 2014
Table 1. Distribution of socio-demographic factors among the dengue cases
DiagnosisSosio-demographic factors DHF
(n=195)DF
(n=1388)Test p value
Age (year) Mean 0-14 15 and older
Gender Male Female
Ethnicity Malay Chinese Indian Others
Occupation Employed Student Housewives Unemployed
District Johor Bahru Kulaijaya Batu Pahat Muar Ledang Segamat Kluang Pontian Kota Tinggi Mersing
Living area Urban Rural
38 (12.6%) 157 12.3%)
120 (12.2%)75 (12.6%)
119 13.0%)33 (8.1%)16 (14.3%) 27 (18.0%)
104 11.8%)60 (15.2%)14 (10.1%)17 (9.9%)
153 15.8%)2 (4.4%)
14 (11.8%)2 (4.2%)4 (18.2%)5 (7.1%)11 (6.8%)0 (0.0%)3 (3.8%)1 (4.8%)
171 12.8%)24 (9.6%)
264 (87.4%)1124 87.7%)
866 (99.1%)522 (87.4%)
793 (87.0%)376 (91.9%)96 (85.7%)123 (82.0%)
774 (88.2%)334 (84.8%)125 (89.9%)115 (90.1%)
818 (84.2%)43 (95.6%)105 (88.2%)46 (95.8%)18 (81.8%)65 (92.9%)151 (93.2%)45 (100.0%)77 (96.2%)20 (95.2%)
1162 87.2%)226 (90.4%)
χ2=0.024**
χ2=0.053**
χ2=12.174
χ2=4.865
χ2=39.060
χ2=2.031**
0.846
0.813
0.007*
0.182
< 0.001*
0.173
*pvalueissignificantifp<0.05 **Fisher’sExactTest
Malay was the most infected ethnicity with 912 (57.6%) cases, followed by Chinese, 409 (25.8%), others, 150 (9.5%) and Indian, 112 (7.1%). The differences of type of dengue in-fectionbetweenethnicitywassignificant,p<0.05. In this research, majority 878 (55.5%) of the DF and DHF infections occurred in the work-ing group followed by student (24.9%), un-employed 172 (10.9%) and housewives 139 (8.8%). However, the differences were not significant,p=0.812
District and living area The district of Johor Bahru contributed most of the dengue cases reported in 2011, with the highest number of dengue cases, 971 (61.3%). 153 of them were dengue hae-morrhagic fever (15.8%), p < 0.001 (Table 1). Distribution of dengue infection across the state of Johor were concentrated in the more urban areas. Majority of the dengue fe-ver and dengue haemorrhagic fever reported in 2011 came from the urban areas, 1333 (84.2%) cases. For DHF, 171 out of 195 cases (87.7%), resided in urban areas. For DF, 1162 out of 1388 cases (83.7%), lived in urban ar-
27.79 ± 15.49

46Jurnal Kesihatan Johor, Vol. 11, 2014
eas. However, this difference was not statisti-callysignificant,p=0.173(Table1)
Parameters MeasuredMost of dengue cases in Johor in 2011 had been admitted to the hospitals on day 4 (391 cases, 24.7%) and day 5 (395 cases, 25.0%) of fever (or symptoms presented), with the mean day of 4.5 ± 1.6 (Table 2, Figure 2). Majority of dengue cases were having fever
on the day of admission (978 cases, 61.8%) with the mean temperature 37.7 ± 0.9 ºC.Blood investigations done on patients with dengue infections on the day of admission showed decreased platelet counts less than 100,000 µL in 981 (62.0%) of cases with the mean platelet count was 93,985.85 ± 53,871.56 /µL. The mean for haematocrit was 42.16 ± 5.37 %.
Table 2. Parameters Measured On the Hospital Admission
Parameters Diagnosis Test p valueDHF
(n = 195)DF
(n = 1388)
Day of Admission Mean
Temperature (ºC) Mean
Haematocrit (%) Mean
Platelet Count (/µL) Mean
Serology IgM Positive Negative Nil
IgG Positive Negative Nil
4.52 ± 1.63
37.71 ± 0.87
42.16 ± 5.37
-
χ2=65.550
χ2=319.772
χ2=302.531
-
-
0.057
0.001*
0.030*
< 100,000 130 (13.3%)
>100,000 65 (10.8%)
72 (13.1%)13 (10.2%)110 (12.1%)
26 (14.8%)29 (17.3%)140 (11.3%)
851 (86.7%)
537 (89.2%)
478 (86.9%)114 (89.8%)796 (87.9%)
150 (85.2%)139 (82.7%)1099(88.7%)
*pvalueissignificantifp<0.05
93,985.85 ± 53,871.56

47Jurnal Kesihatan Johor, Vol. 11, 2014
Fre
qu
en
cy
DAY OF ADMISSIONFigure 2. Day of Admission of Dengue Patients in 2011
Dengue SerologySerological analysis (IgG and IgM) was im-portant in supporting the diagnosis of dengue infection in hospital in Malaysia. Out of 1583 dengue cases, 42.8% of them had complete documentation of IgM, with positive result was high in dengue infections, 550 cases (dengue fever 478 and dengue haemorrhagic fever 72 cases respectively) (Table 2). However, IgG results were only documented in 344 (21.7%) of the cases. The positive results were found in 150 cases of dengue fever and only 26 in dengue haemorrhagic fever cases.
Dengue serotypes All four dengue serotypes (DEN 1 – 4) were documented in Johor throughout 2011 with a case of concurrent infection with two differ-
ent dengue serotype (DEN-2 and DEN-3). The commonest serotype was DEN-1 (38.8%), followed by DEN-3 (24.5%), DEN-2 (22.4%), DEN-4 (12.2%) and DEN-2/DEN-3 (2.0%). The sinusoidal pattern of dengue serotype in-fections can be observed, with the pre-domi-nant serotype was DEN-3, starting in January and February, then followed by DEN-1, peaked around March and April 2011. DEN-3 was the most dominant circulating dengue serotype in December 2011 (Figure 3). The dengue se-rotypes affected all age groups, gender and ethnicity in Johor (Table 3). Male and female gender are all affected by all serotypes no-tably with DEN-1 and DEN-3. Malay and Chi-nese ethnics had been infected by DEN-1 and DEN-3 the most, and this pattern was the same for the rest of other ethnics.
Co
un
t
SEROTYPE DEN 1 DEN 2 DEN 2 / DEN 3 DEN 3 DEN 4
MONTHFigure 3. Circulating Dengue Serotype According to Month in 2011

48Jurnal Kesihatan Johor, Vol. 11, 2014
Table 3. Circulating Dengue Serotypes in Johor in 2011.
Dengue Serotype(n=49)
DEN-1 DEN-2 DEN-2 / 3 DEN-4 DEN-5Gender Male Female
Ethnic Malay Chinese Indian Others
Districts Johor Bahru Batu Pahat Muar Segamat Kota Tinggi
15 (50.0%)4 (21.1%)
7 (28.0%)8 (47.1%)2 (50.0%)2 (66.7%)
14 (41.2%)0 (0.0%)4 (66.7%)1 (20.0%)0 (0.0%)
1 (3.3%)5 (26.3%)
4 (16.0%)2 (11.8%)0 (0.0%)0 (0.0%)
5 (14.7%)1 (33.3%)0 (0.0%)0 (0.0%)0 (0.0%)
1 (3.3%)0 (0.0%)
1 (4.0%)0 (0.0%)0 (0.0%)0 (0.0%)
1 (2.9%)0 (0.0%)0 (0.0%)0 (0.0%)0 (0.0%)
8 (26.7%)4 (21.1%)
7 (28.0%)4 (23.5%)1 (25.0%)0 (0.0%)
6 (17.6%)2 (66.7%)2 (33.3%)2 (40.0%)0 (0.0%)
5 (16.7%)6 (31.6%)
6 (24.0%)3 (17.6%)1 (25.0%)1 (33.3%)
8 (23.5%)0 (0.0%)0 (0.0%)2 (40.0%)1 (100.0%)
Datacollectedhadrevealedonlyfiveoutoftendistrictsreportedandcompleteserotypingre-sult. DEN-1 and DEN-3 was found to be present in almost all districts, with predominant DEN-1 serotype in Johor Bahru.
Discussion
Several studies in south East Asia showed that dengue infection is more severe in the less than 15 year old age group giving rise to den-gue haemorrhagic fever, shock and death1,8. In Malaysia, the incidence of dengue cases increased in the age group of 15 and above particularly for the past two years with the highest incidence rate is among the working and school-going age groups2,3. In this study, the mean age of the cases of dengue infec-tions was 27.8 ± 15.5 years old, which can be categorised as young adults. It was also found that working and student age group were the most infected. This was supported by other studies done in Malaysia, Singapore, Bangladesh and Indonesia9,10,11,12. In this re-search, most cases (61.3%) came from dis-trict of Johor Bahru (p < 0.05) and 84.2% of the dengue cases reported were from urban areas where there are high density of popu-lations and rapid development activities fac-tors, which are favourable for dengue trans-mission3.Dengue infection is a dynamic disease. Its clinical course changes as the disease pro-gresses. After the incubation period, the ill-ness begins abruptly and will be followed by 3 phases: febrile, critical and recovery phase. In Febrile phase, patients typically develop high-grade fever suddenly. This acute febrile
phase usually lasts 2 to 7 days1,3. Majority of patients in Johor in 2011 were admitted to the hospital during day 4 and 5 of illness (24.7% and 25.0% of dengue cases respec-tively), with the mean day of admission was 4.5 ± 1.6 day. Most of them (61.8%) were having fever on the day of admission. The critical phase occurs towards the late febrile phase, often after 3rd day of fever or around defervescence (usually between 3rd to 5th day of illness but may go up to 7th day) when a rapid drop in temperature may coincide with an increase in capillary permeability in some patients. During this phase, platelet counts usually dropped with increased in level of haematocrit from baseline1,3. In this research, majority of the dengue cases (981, 62.0%) on the day of admission were having throm-bocytopaenia with the mean platelet count of 93,985.9 ± 53,871.6 /µL (p < 0.05) and the mean haematocrit of 42.2 ± 5.4 percent (p < 0.05).The IgM capture enzyme-linked immunosor-bent assay (ELISA) is the most widely used serologicaltest.Thisantibodytitreissignifi-cantly higher in primary infections, compared to secondary infections. Once the IgM is de-tectable, it rises quickly and peaks at about 2 weeks after the onset of symptoms, and it wanes to undetectable levels by 60 days and up to 90 days in some patients3,13. In primary and secondary dengue infection, dengue IgG

49Jurnal Kesihatan Johor, Vol. 11, 2014
was detected in 100% of patients after day 7 of onset of fever3,13,14. In this study, only 34.7% of dengue cases were IgM positive and 11.1% were IgG positive.Different dengue viral serotypes circulates around the world (DEN 1-4). All can be pres-ent at the same time at the same locality at aspecifictime,oronlyprominentserotype(s)would be present. Since a person can theo-retically be infected up to four different times, each by a different serotype virus, it was dis-covered in the 1960s that those with second-ary infections had a much higher risk of devel-opingDHF.Thatis,thefirstinfectionprovideslong-lasting immunity to that serotype virus, but subsequent infection by another serotype causes much more severe disease6,15-19.In Malaysia, all four serotypes can be isolated at any one time but the predominant circulat-ing dengue virus will show a sinusoidal pat-tern. For example, DEN-3 was the predomi-nant serotype in the early 90s with a peak in 1993, and then subsequently declined. It then re-emerged, reaching the peak in 2001. Since then DEN-4 was predominant until year 2006. In 2007 the re-emergence of DEN-2 as the predominant serotype3,12. Likewise in Jo-hor in 2011, the sinusoidal pattern of den-gue serotype infections can be observed, with the predominant serotype was DEN-3, start-ing in January and February, then followed by DEN-1, peaked around March and April 2011. DEN-3 was the most dominant circulating dengue serotype in December 2011. Adefinitelinkbetweendistinctserotypesandsevere manifestations of dengue infection has not been established yet. However, Fried et. al (2006) found that DEN-2 and -3 to be twice as likely to result in DHF as DEN-4 and DEN-115. Few other previous studies done in India also found that DEN-2 and DEN-3 were caus-ing more severe dengue infections20,21,22 and supported by Guzman et al (2002, 2008), noted that Asian genotypes of both DEN-2 and DEN-3 were more virulent in term of DHF outbreaks23,24. The presence of predominant DEN-3 serotype in the beginning of the year 2011, may explained the peak of dengue fe-ver and dengue haemorrhagic fever in Johor and overall lower dengue cases compared to the previous year might be contributed by a presence of relatively less virulent DEN-1 se-rotype as the most dominant dengue serotype in Johor in 2011.The use of secondary data certainly produced some limitations to the research done such as the data collection and documentation par-ticularly the clinical presentations of the pa-
tients including serological analysis reported. The low yield of positive serotyping might be due to the quality of the sample sent for se-rotyping including time, storage and trans-portation3. Another limitation of this study is that from the way the data is collected, it was not possible to link up between the serotype results to the individual patients seen in the government health fascilities. Therefore we were unable to determine wether there were any reinfection among the cases.
Conclusion
Dengue infection is the most important vector-borne viral disease in tropical and subtropi-cal countries. The clinical spectrum of dengue infection ranges from asymptomatic, undif-ferentiated fever, dengue hemorrhagic fever (DHF), to dengue shock syndrome (DSS), which can be fatal affecting millions of people every year from all age groups, gender and ethnicity, causing considerable morbidity and mortality. In this research, the pattern of the disease in Johor for the year 2011 was discussed in term of socio-demographic factors such as age, ethnicity, locality (district, urban and rural), day of admission, parameters taken on the day of the admission; temperature, haematocrit level, platelet counts, serological analysis (IgG and IgM) and dengue serotypes. In Johor, Malaysia for the year 2011, most of the dengue cases occured in young adults, male working class affected compared to fe-male, and Malay ethnicity. Johor Bahru district contributed most of those dengue cases and more concentrated in urban areas. Majority of patients were admitted to the hospital dur-ing day 4 and 5 of illness, with fever, throm-bocytopaenia and haematocrit within normal ranges.Dengue serology (IgM and IgG) were impor-tant tools in supporting the diagnosis of the dengue infections in Malaysia. All dengue se-rotypes (DEN-1, DEN-2, DEN-3 and DEN-4), including a case of a concurrent infection with two different dengue serotypes (DEN-2/DEN-3) were present in 2011 in Johor. From the data analysed in this research, den-gue infection is and will continue to be a ma-jor public health in Johor. Therefore, it is of very important that the public health services are optimised to meet this challenge. Contin-ueed epidemiological, serological, virological as well as entomological surveillance should be strengthened. Public awareness as well as community commitment and participation

50Jurnal Kesihatan Johor, Vol. 11, 2014
need to be addressed to maintain and improve the control of dengue infection.
Acknowledgement
First of the foremost, thank you to the Direc-tor General of Health Malaysia for the permis-sion to publish the journal. We wish to ac-knowledge the generous co-coperation that we have received from the National Public Health Laboratory, Sungai Buloh, Selangor, Johor State Health Department and Mahmoo-diah Outpatient Clinic, Johor Bahru. The au-thors would also like to thank the Ministry of Health for NMRR ID: NMRR-11-1134-10759 and the Faculty of Medicine, UKM for the fund-ing part of this research activities, code No: FF-345-2011.
References
World Health Organisation. Dengue Guide-lines for Diagnosis, Treatment, Prevention and Control-New Edition 2009. Geneva.
Ministry Of Health. Annual Report 2004. Vector-Borne Diseases Section, Malaysia.
Ministry Of Health. Clinical Practice Guide-lines on Management of Dengue Infection in Adults (Revised 2nd Edition) 2010.
Ministry of Health Malaysia. Http://www.moh.gov.my/press_release. Accessed 13/01/2012
Johor State Health Department. Johor weekly Epidemiological Buletin (CDC). Http://jknjohor.moh.gov.my. Accessed 28/01/2012
Balmaseda B, Hammond S, Perez L, Tellez Y, Indira S, Mercado JC, et al. Serotype-Specific Differences in Clinical Menifesta-tions of Dengue. Am. J. Trop. Med. Hyg. 2006; 74(3) 449–456.
World Health Organisation. Clinical and Laboratory Presentations of Dengue Pa-tients with Different Serotypes. Dengue Bulletin 2000; Volume 24.
World Health Organisation. Clinical and Laboratory Guidelines for Dengue Fever and Dengue Haemorrhagic Fever/Dengue Shock Syndrome for Health Care Providers. Caribbean Epidemiology Center (CAREC) Pan American Health Organization. 2000.
1.
2.
3.
4.
5.
6.
7.
8.
Koh BKW, Ng LC, Kita Y, et al. The 2005 dengue epidemic in Singapore: epidemi-ology, prevention and control. Ann Acad Med Singapore. 2008; 37: 538-45.
Guha-Sapir D, Schimmer B. Dengue Fever : New Paradigms for a Changing Epidemi-ology. Emerging Themes in Epidemiology 2005; 2:1. Available from: http: www.ete-online:com/content/2/1/1(accessed 15 November 2011).
Bangs MJ, Larasati RP, Corwin AL, et al. Climatic factors associated with epidemic dengue in Palembang, Indonesia: implica-tions of short term meteorological events on virus transmission. Southeast Asian J Trop Med Public Health 2006; 37(6): 1103-16.
Ahmad Nizal MG, Rozita H, Mazrura S, Zai-nudin MA, et al. Dengue Infections and Circulating Serotypes in Negeri Sembi-lan, Malaysia. Malaysian Journal of Public Health Medicine 2012, Vol. 12(1): 21-30.
Buchy P, Yoksan S, Peeling RW and Hun-sperger E. Laboratory Tests For The Diag-nosis Of Dengue Virus Infection. Working paperfortheScientificWorkingGrouponDengue Research, convened by the Spe-cial Programme for Research and Training in Tropical Diseases, Geneva, 1-5 October 2006. WHO on behalf of the Special Pro-gramme for Research and Training inTropi-cal Diseases 2007.
Byron M, Koraka P, & Osterhaus ADME. Dengue Virus Pathogenesis: an Integrated View. Clinical Microbiology Reviews. Octo-ber 2009; p. 564–581 Vol. 22, No. 4.
Fried JR, Gibbons RV, Kalayanarooj S, et al. Serotype differences and dengue hem-orrhagic fever: an analysis of data col-lected in Bangkok, Thailand from 1994 to 2006. Available from: http:www.plosntds.org. Accessed 22 October 2010.
Halstead SB, Simasthien P. Observations related to the pathogenesis dengue hae-morrhagic fever. II antigenic and biolog-ic properties of dengue viruses and their association with disease response in the host. Yale J Biol Med 1970; 42: 276-92.
Guzmán MG, Kourí G, Valdés L, Bravo J, Vázquez S & Halstead SB. 2002. Enhanced
9.
10.
11.
12.
13.
14.
15.
16.
17.
51Jurnal Kesihatan Johor, Vol. 11, 2014
severity of secondary dengue-2 infec-tions: Death rates in 1981 and 1997 Cu-ban outbreaks. Rev Panam Salud Publica. 11:223-7.
Guzmán MG. 2005. Global voices of sci-ence. Deciphering dengue: The Cuban experience. Science 309:1495-7.
Lei HY,Huang KJ, Lin YS, et. al. Immunop-athogenesis of dengue hemorrhagic fever. American Journal of Infectious Diseases 2008; 4(1): 1-9.
Bharaj P, Chahar HS, Pandey A, et al. Con-current infections by all four circulating dengue serotypes during outbreak of den-gue in 2006 in Delhi, India. Virology Jour-nal 2008; 5: 1.
Gupta E, Dar L, Kapoor G, Broor S. The changing epidemiology of dengue in Delhi, India. Virology Journal 2006; 3: 92.
Kumaria R. Correlation of disease spec-trum among four Dengue serotypes: a fiveyearshospitalbasedstudyfromIndia.Braz J Infect Dis 2010;14(2):141-146
Guzman MG, Kouri G, Valdes L, et al. En-hance severity of secondary dengue-2 infection: death rates in 1981 and 1997 Cuban outbreaks. Pan-American Journal of Public Health 2002; 11: 223-7.
Guzman MG, Perez AB, Fuentes O and Kouri G. Dengue, Dengue Haemorrhagic Fever. PAHO/WHO Collaborating Centre for the Study of Dengue and it’s Vector, ‘Pedro Kouri’ Tropical Medicine Institute, Havana, Cuba.2008.Availablefrom: http://www.sciencedirect.com/science/article/pii/B9780123739605005645. Accessed 22 September 2011.
18.
19.
20.
21.
22.
23.
24.

52Jurnal Kesihatan Johor, Vol. 11, 2014
Corresponding author:
Tan Jih Huei,General Surgery Department,Hospital Sultan Ismail, Jalan Persiaran Mutiara Emas Utama,Taman Mount Austin,81100 Johor Bahru, Johor.Phone: 073565000Fax: 073565034Email: [email protected]
Gastrointestinal stromal tumors (GIST) are mesenchymal tumors of the digestive tract mainly affect stomach and small intestine. The incidence of GIST occurring in Meckel’s diver-ticulum (MD) is about 0.5 to 3.2%, often pre-senting with abdominal mass or GI bleeding. To date, there are 4 cases of perforated GIST in MD reported in the literature. Here, we re-port a case of a 43-years-old female present-ingwith acute abdomenand irondeficiencyanemia. Operative and pathological findingsdiagnosed a perforated Meckel’s diverticulum with GIST tumor. We discuss the current op-tions available after a resection of perforated GIST diverticulum.
Case Presentation
43 years old Malay lady presented with lower abdominal pain, vomiting and watery brown-ish stools. She was pale, febrile with tempera-ture of 39’C and tachycardic at 120 bpm. Her Abdomen was tender over right iliac fossa and suprapubic region. Systemic examination was unremarkable. Blood investigation shows hy-pochromic microcytic anemia with Hb of 8.1g/dL and low serum iron of 1.9mcmol/L. With a diagnosis of perforated appendicitis, she was taken to theatre where the abdomen was en-tered via a Lanz incision. We found an ileal diverticulum measuring about 15x9cm, 60cm from the ileoceacal junction, perforated and
adhered to bladder dome. The initial incision was extended into a transverse laparotomy then the diverticulum was resected and ileum anastomosed. Rests of the lower abdominal organs were normal.
Figure 1: Intraoperative image of the mass prior to resection
10
Volume 11
2014
Perforated gastro-intestinal stromal tumor(GIST) in Meckel’s diverticulum.What’s next after a resection?
Tan J.H.1, Md Sikin S.1, Arulanantha S.1, Jamalludin N.S.2, Khalid N.2
1Department of Surgery, Hospital Sultan Ismail, Johor Bahru, Malaysia2Department of Pathology, Hospital Sultanah Aminah, Johor Bahru, Malaysia

53Jurnal Kesihatan Johor, Vol. 11, 2014
Figure 2: Opening of the diverticular mass connecting to the ileal mucosa
Specimen was confirmed by pathologist asMeckel’s diverticulum as all the 3 layers of small bowel lining are present and this diver-ticulum arises from antimesenteric border of ileum. It was found at 2 feet away from ile-oceacal valve.Histologically, there were bland spindled cells occasionally arranged as fascicles but focal ar-eas of nuclear palisading resembling verocay bodies were seen. Immunochemistry stains of the tumor cells were positive for CD117. Focal staining for smooth muscle actin was positive. However, they were negative for CD34, S100 protein, CD31, Pancytokeratin, CD99, Bcl 2 andNeurofilament stains.Mitosis countwas2/50 hpf with minimal nuclear pleomorphism. Ki67labellingindexwasabout2%.Thefinalhistopathological impression was a perforated GIST of intermediate malignancy with clear surgical margin.
Figure 3: Immunochemistry stain with CD 117
Postoperatively, she recovered within a week and was discharged home. Staging CT scan 1 month later did not show distant metasta-sis. With the diagnosis of perforated GIST, she was started with oral imatinib 400mg daily. Post op 4 months, she remains in good gen-eral condition with no signs of disease recur-rence.
Discussion
GISTs are rare in Meckel’s diverticulum. They usually present with mass or GI bleeding and diagnosed preoperatively as Meckels’s mass or a small bowel tumor. Rarely, it present with perforation. We discuss the challenges in di-
agnosing and managing a perforated GIST tu-mor in meckel’s diverticulum.Pre-operative imaging if available can only di-agnose a meckel’s diverticulum or mass. Most cases have either an ultrasound or CT scan1. MRI is the better modality to assess tumor extent in large intestinal GIST within the ab-domen and pelvis. Treatment response is best followedupwithCTscanandinspecificcasesby PET scan2.DefinitediagnosisofGISTinmeckel’sdiver-ticulum requires histopathology and immu-nohistochemistry examination. Histologically, there is either presence of spindled cells or epitheliod cells. Immunohistochemically, they are usually stained positive with CD 117.1 The main prognostic factor for GIST is mitotic count. Malignant potential of these tumor are classified to low, intermediate andhigh riskdepending on mitotic count and tumor size. With imatinib treatment, perforated GIST in small bowel has long term disease-free sur-vival3. However, there are incidences of per-forated GIST in MD not treated with imatinib that showed complete recovery. All GISTs in MD are KIT- positive (CD 117+) therefore they respond to Imatinib. Imatinib is shown to be effective in improving overall survival rate and relapse rate due to its action as a pow-erful selective inhibitor of tyrosine kinases. Hence, we started our patient on imatinib as treatment of a perforated small bowel GIST. 4 months follow up period did not show any evi-dence of disseminated disease. But long term follow up on her is required to validate the ef-ficacyofimatinib.2ndlinetreatmentchoicesfor imatinib resistant GISTs are sunitinib, nilo-tinib and sorafenib. So far no GISTs in MD are reported resistant to imatinib therapy. 5 years survival rate for perforated GIST is about 24% compared to non- perforated 46%. Clear surgical margin in resection of GIST tumor increase the survival rate from 8% to 41%. Adjuvant therapy with imatinib for 3 years rather than 1 year has been prov-en in improving overall survival and recur-rences free survival4. Despite the increased cost, imatinib therapy has shown economic value in intermediate risk GISTs compared to cost incurred in managing recurrent disease5. As a conclusion, following complete resection the careful selection of patients for imatinib therapy can lead to improved clinical out-comes with cost savings at the same time.

54Jurnal Kesihatan Johor, Vol. 11, 2014
Scialpi M, Franzini C, Cavaliere A, et al. Clin-ical Outcome of High Risk Gastrointestinal Stromal Tumor in a Meckel’s Diverticulum. International journal of biomedical science : IJBS 2009; 5(1): 74-8.
Bensimhon D, Soyer P, Boudiaf M, et al. Imaging of gastrointestinal stromal tu-mors. Journal de radiologie 2009; 90(4): 469-80.
1.
2.
Acknowledgement
We would like to thank the Director General of Health of Malaysia for his permission to pub-lish this paper. The authors would also like to thank the Ministry of Health for NMRR ID: NMRR-13-990-16799.
References
Roy SD, Khan D, De KK, De U. Spontaneous perforation of jejunal gastrintestinal strom-al tumour (gist). Case report and review of literature. World journal of emergency sur-gery : WJES 2012; 7(1): 37.Eisenberg BL. The SSG XVIII/AIO trial: re-sults change the current adjuvant treat-ment recommendations for gastrointestinal stromal tumors. American journal of clini-cal oncology 2013; 36(1): 89-90.
RutkowskiP,GronchiA.Efficacyandeco-nomic value of adjuvant imatinib for gas-trointestinal stromal tumors. The oncolo-gist 2013; 18(6): 689-96.
3.
4.
5.

Table 3: Circulating Dengue Serotypes in Johor in 2011
Dengue Serotype (n=49)
DEN-1 DEN-2 DEN 2/ 3
DEN-3 DEN-4
Gender Male 15 (50.0%) 1 (3.3%) 1 (3.3%) 8 (26.7%) 5 (16.7%) Female 4 (21.1%) 5 (26.3%) 0 (0.0%) 4 (21.1%) 6 (31.6%)
Ethnic Malay 7 (28.0%) 4 (16.0%) 1 (4.0%) 7 (28.0%) 6 (24.0%) Chinese 8 (47.1%) 2 (11.8%) 0 (0.0%) 4 (23.5%) 3 (17.6%)
Indian 2 (50.0%) 0 (0.0%) 0 (0.0%) 1 (25.0%) 1 (25.0%)
Others 2 (66.7%) 0 (0.0%) 0 (0.0%) 0 (0.0%) 1 (33.3%)
Districts Johor Bahru 14 (41.2%) 5 (14.7%) 1 (2.9%) 6 (17.6%) 8 (23.5%) Batu Pahat 0 (0.0%) 1 (33.3%) 0 (0.0%) 2 (66.7%) 0 (0.0%)
Muar 4 (66.7%) 0 (0.0%) 0 (0.0%) 2 (33.3%) 0 (0.0%)
Segamat 1 (20.0%) 0 (0.0%) 0 (0.0%) 2 (40.0%) 2 (40.0%)
Kota Tinggi 0 (0.0%) 0 (0.0%) 0 (0.0%) 0 (0.0%) 1 (100.0%)
*Kesilapan pencetakan dalam artikel bertajuk ’Dengue Infections and Circulating Serotypes in Johor, Malaysia’, pada muka surat 48 dalam Jurnal Kesihatan Johor 2014 Jilid 11, merujuk Jadual 3, baris ke-2