John Snelling, ANZ - Market developments - Outlook and impacts for Galilee projects
25
Market Developments Galilee Basin Coal & Energy Conference John Snelling Executive Director - Corporate Advisory 25 November 2013
-
Upload
informa-australia -
Category
Technology
-
view
578 -
download
3
description
John Snelling, Executive Director, Corporate Advisory, ANZ Bank delivered this presentation at the Galilee Basin Coal & Energy Conference. This conference focuses on developing a new, world scale energy province in Central Queensland. It looks at the significant proposed investment in the Galilee area including coal mining, underground coal gasification, coal seam gas, geothermal, shale and much more, bringing together the wide variety of explorers, project developers, service providers and government representatives under the one roof. The event is run in conjunction with the Australian Journal of Mining (AJM). For more information about the event, please visit the conference website: http://www.informa.com.au/galileebasin2013
Transcript of John Snelling, ANZ - Market developments - Outlook and impacts for Galilee projects
Market Developments
Galilee Basin Coal & Energy Conference
John SnellingExecutive Director - Corporate Advisory
25 November 2013
22
Agenda
Macro
Coal
Finance
3
Macro
4
A better looking 2014
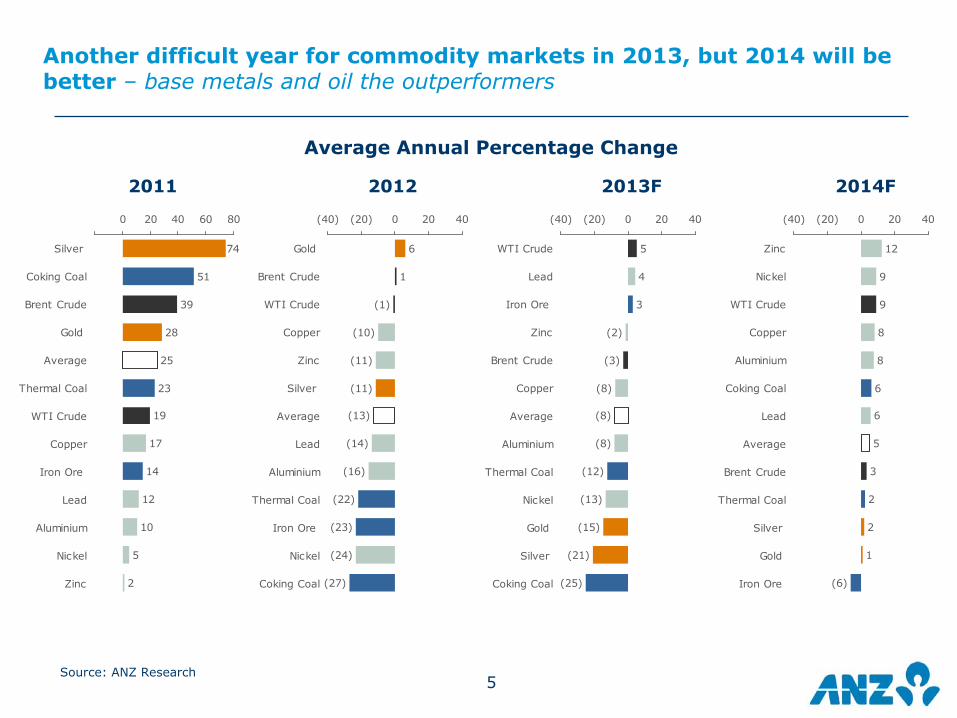
• We expect commodities to firm towards the end of the year and improve in 2014 as comfort around the Chinese demand outlook and improving growth elsewhere sets a positive backdrop for prices
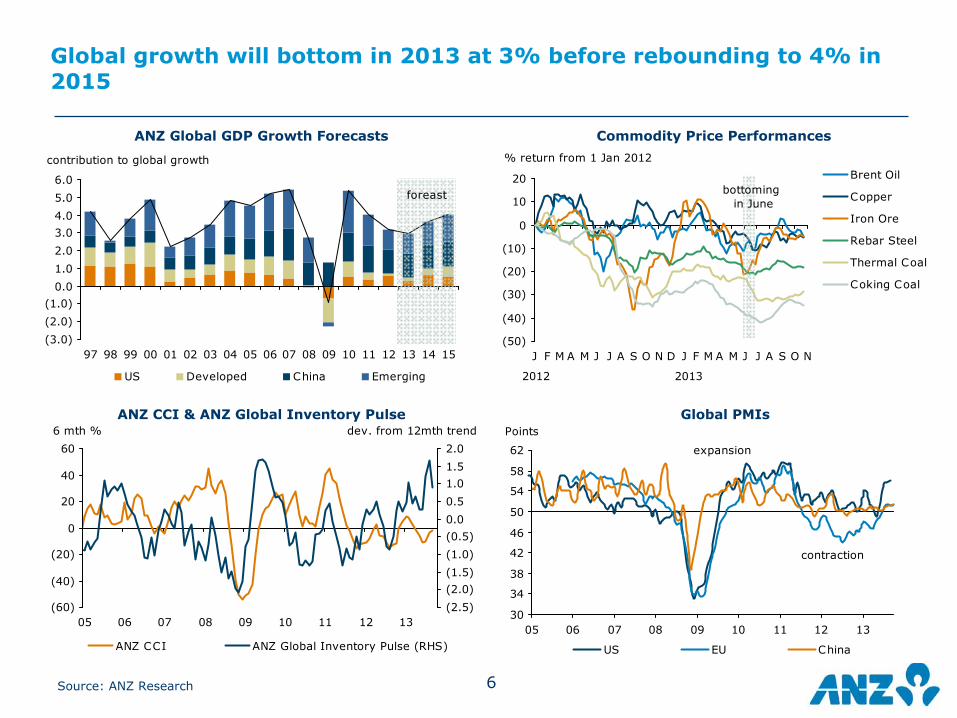
• We think prices bottomed in June this year, with official Chinese PMI data basing and Chinese government stimulus and inventory restocking re-emerging
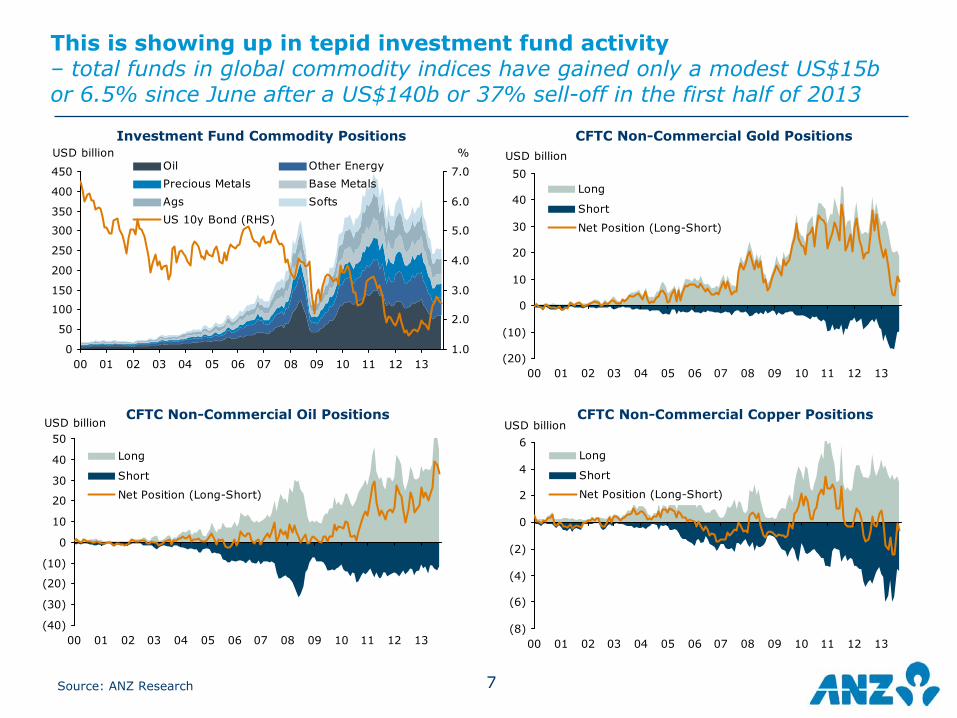
• Investment positions look more encouraging with commodity index holdings and US commodity futures markets trending higher over the third quarter
• That said price gains have been tepid and look more like relief rallies and short covering rather than fresh buying. Signs of more consistent positive data in China would improve the sentiment triggering long investors to return
• The US news flow will continue to provide a volatile backdrop with better economic data offset by QE exit chatter. The reverse would be better, with dull data pushing back the timing on QE tapering
• Inventory levels still look tight, which flags the need for further restocking - particularly in iron ore and copper. Coal and oil stocks look higher
• Most of the base metals and coal look oversold, while iron ore and oil look fair value. Precious metals looks vulnerable while US bond yields continue to rise
• Our preferred exposure in 2014 are base metals and energy markets which will be more exposed to positive demand-side dynamics. The bulks will lag, with increasing supply and or inventory overhang holding back better price gains
5
Another difficult year for commodity markets in 2013, but 2014 will be better – base metals and oil the outperformers
Source: ANZ Research
2012 2013F
Average Annual Percentage Change
2014F2011
74
51
39
28
25
23
19
17
14
12
10
5
2
0 20 40 60 80
Silver
Coking Coal
Brent Crude
Gold
Average
Thermal Coal
WTI Crude
Copper
Iron Ore
Lead
Aluminium
Nickel
Zinc
6
1
(1)
(10)
(11)
(11)
(13)
(14)
(16)
(22)
(23)
(24)
(27)
(40) (20) 0 20 40
Gold
Brent Crude
WTI Crude
Copper
Zinc
Silver
Average
Lead
Aluminium
Thermal Coal
Iron Ore
Nickel
Coking Coal
5
4
3
(2)
(3)
(8)
(8)
(8)
(12)
(13)
(15)
(21)
(25)
(40) (20) 0 20 40
WTI Crude
Lead
Iron Ore
Zinc
Brent Crude
Copper
Average
Aluminium
Thermal Coal
Nickel
Gold
Silver
Coking Coal
12
9
9
8
8
6
6
5
3
2
2
1
(6)
(40) (20) 0 20 40
Zinc
Nickel
WTI Crude
Copper
Aluminium
Coking Coal
Lead
Average
Brent Crude
Thermal Coal
Silver
Gold
Iron Ore
6
(60)
(40)
(20)
0
20
40
60
05 06 07 08 09 10 11 12 13(2.5)(2.0)(1.5)(1.0)(0.5)0.00.51.01.52.0
ANZ CCI ANZ Global Inventory Pulse (RHS)
6 mth % dev. from 12mth trend
30
34
38
42
46
50
54
58
62
05 06 07 08 09 10 11 12 13
US EU China
Points
expansion
contraction
(50)
(40)
(30)
(20)
(10)
0
10
20
J F M A M J J A S O N D J F M A M J J A S O N
Brent Oil
Copper
Iron Ore
Rebar Steel
Thermal Coal
Coking Coal
% return from 1 Jan 2012
2012 2013
bottoming in June
(3.0)(2.0)(1.0)
0.01.02.03.04.05.06.0
97 98 99 00 01 02 03 04 05 06 07 08 09 10 11 12 13 14 15
US Developed China Emerging
contribution to global growth
foreast
Source: ANZ Research
ANZ Global GDP Growth Forecasts Commodity Price Performances
ANZ CCI & ANZ Global Inventory Pulse Global PMIs
Global growth will bottom in 2013 at 3% before rebounding to 4% in 2015
7
0
50
100
150
200
250
300
350
400
450
00 01 02 03 04 05 06 07 08 09 10 11 12 131.0
2.0
3.0
4.0
5.0
6.0
7.0Oil Other EnergyPrecious Metals Base MetalsAgs SoftsUS 10y Bond (RHS)
USD billion %
(8)
(6)
(4)
(2)
0
2
4
6
00 01 02 03 04 05 06 07 08 09 10 11 12 13
Long
Short
Net Position (Long-Short)
USD billion
(40)
(30)
(20)
(10)
0
10
20
30
40
50
00 01 02 03 04 05 06 07 08 09 10 11 12 13
Long
Short
Net Position (Long-Short)
USD billion
(20)
(10)
0
10
20
30
40
50
00 01 02 03 04 05 06 07 08 09 10 11 12 13
Long
Short
Net Position (Long-Short)
USD billion
Source: ANZ Research
Investment Fund Commodity Positions
This is showing up in tepid investment fund activity– total funds in global commodity indices have gained only a modest US$15b or 6.5% since June after a US$140b or 37% sell-off in the first half of 2013
CFTC Non-Commercial Gold Positions
CFTC Non-Commercial Oil Positions CFTC Non-Commercial Copper Positions
8
100
200
300
400
500
600
05 06 07 08 09 10 11 12 130
500
1,000
1,500
2,000
2,500
3,000
3,500
ANZ-CCI Shanghai Composite (RHS)
Index points Index points
China play
-2
0
2
4
6
8
10
12
14
16
2005 2006 2007 2008 2009 2010 2011 2012 2013
Official Property Price Index ANZ Property Price Index
5
6
7
8
9
10
11
12
13
00 02 04 06 08 10 12 14-15
-10
-5
0
5
10
15
20
25
30
China GDP Power Production Growth
y/y %
0
20
40
60
80
100
120
J F M A M J J A S O N DGov't Exp (2012) Gov't Exp (2013) Target
%
Source: ANZ Research
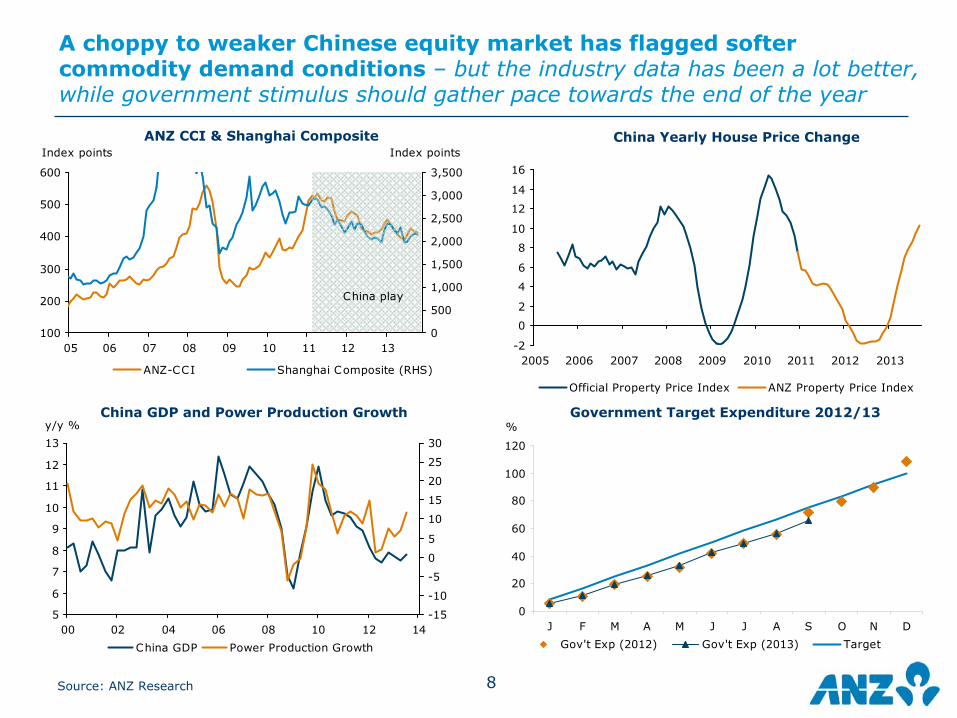
ANZ CCI & Shanghai Composite China Yearly House Price Change
China GDP and Power Production Growth Government Target Expenditure 2012/13
A choppy to weaker Chinese equity market has flagged softer commodity demand conditions – but the industry data has been a lot better, while government stimulus should gather pace towards the end of the year
9
134
106 103
57
36 3323 19 18 18
0
20
40
60
80
100
120
140
Ther
mal
Coa
l
Bau
xite
Cok
ing
Coa
l
Iron
Ore
Nic
kel
Cop
per
Silv
er
Gol
d
Lead
&Z
inc
Plat
inum
Years
55
0 10,000 20,000 30,000 40,000 50,000
Real GDP per capita (US$)
India
CopperSteel
Aluminium
Coal
China
GasIntensity per capita
25
69
1618
2222
2327
2930
0 5 10 15 20 25 30 35
IndiaBrazilChinaWorld
AustraliaUKUS
CanadaSouth Korea
TaiwanGermany
Japan
Min level for steel intensive exporting countries
Min level for infrastructure and housingdevelopment in a developed economy
(4)(2)
02
46
810
1214
00 01 02 03 04 05 06 07 08 09 10 11 12 13 14 15
Consumption Investment Net Exports GDP, y/y
y/y %
F F F F
ANZ Forecasts
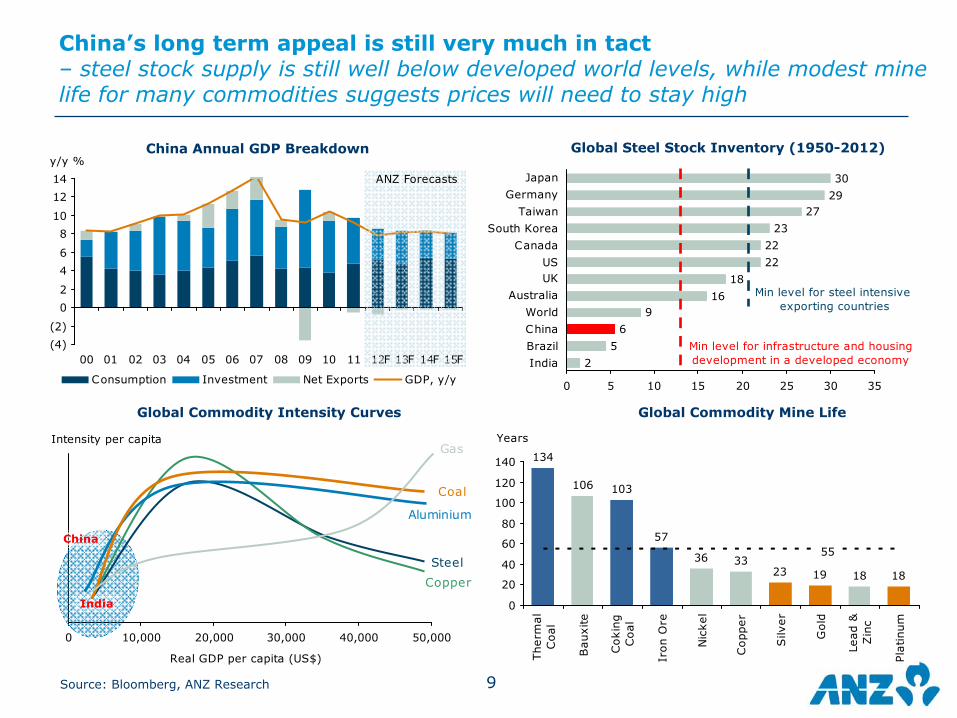
China’s long term appeal is still very much in tact – steel stock supply is still well below developed world levels, while modest mine life for many commodities suggests prices will need to stay high
Source: Bloomberg, ANZ Research
Global Steel Stock Inventory (1950-2012)China Annual GDP Breakdown
Global Commodity Intensity Curves Global Commodity Mine Life
1010
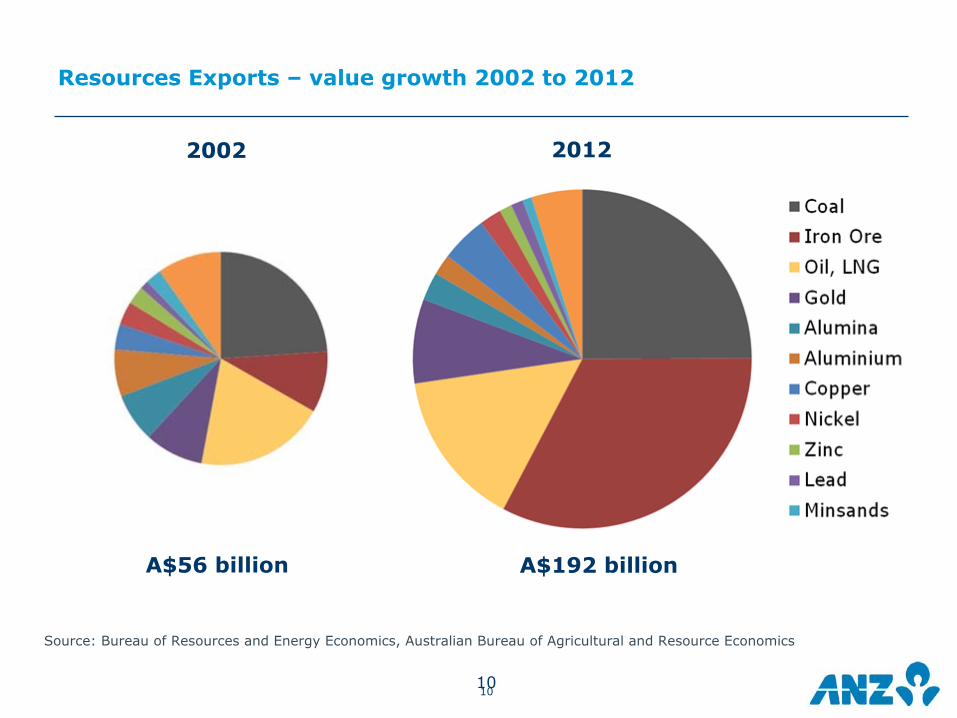
Resources Exports – value growth 2002 to 2012
A$56 billion A$192 billion
2002 2012
Source: Bureau of Resources and Energy Economics, Australian Bureau of Agricultural and Resource Economics
11
Coal
12
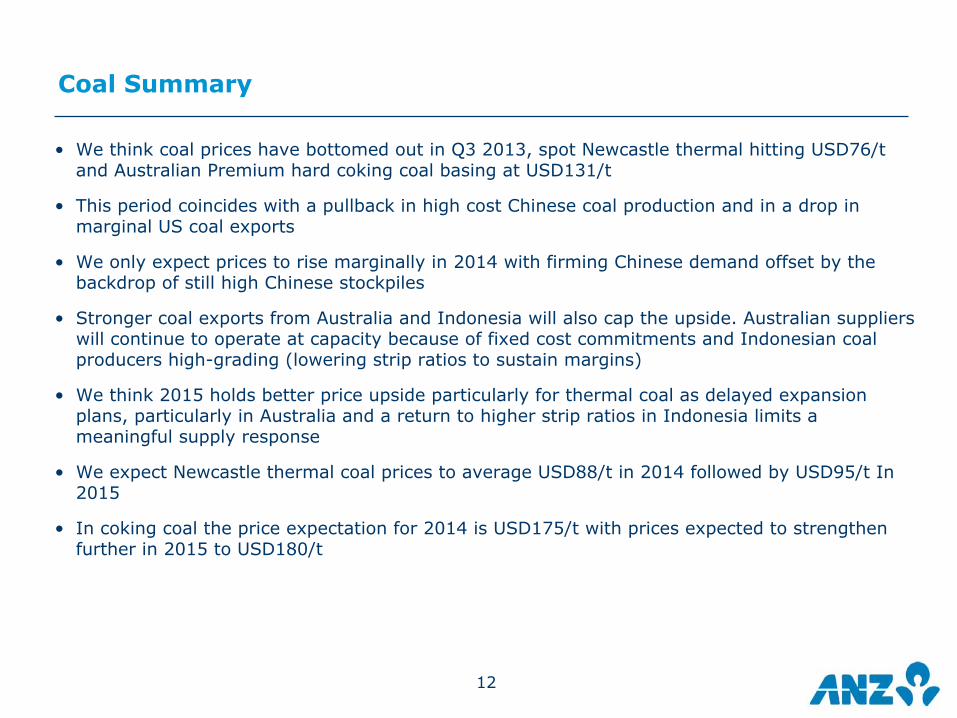
Coal Summary
• We think coal prices have bottomed out in Q3 2013, spot Newcastle thermal hitting USD76/t and Australian Premium hard coking coal basing at USD131/t
• This period coincides with a pullback in high cost Chinese coal production and in a drop in marginal US coal exports
• We only expect prices to rise marginally in 2014 with firming Chinese demand offset by the backdrop of still high Chinese stockpiles
• Stronger coal exports from Australia and Indonesia will also cap the upside. Australian suppliers will continue to operate at capacity because of fixed cost commitments and Indonesian coal producers high-grading (lowering strip ratios to sustain margins)
• We think 2015 holds better price upside particularly for thermal coal as delayed expansion plans, particularly in Australia and a return to higher strip ratios in Indonesia limits a meaningful supply response
• We expect Newcastle thermal coal prices to average USD88/t in 2014 followed by USD95/t In 2015
• In coking coal the price expectation for 2014 is USD175/t with prices expected to strengthen further in 2015 to USD180/t
13
(30)
(20)
(10)
0
10
20
30
40
50
04 05 06 07 08 09 10 11 12 13
Hydro power Thermal power
y/y % change
(15)(10)(5)
05
101520253035
04 05 06 07 08 09 10 11 12 13
Coal output Thermal power output
y/y % change
Source: Bloomberg, ANZ Research
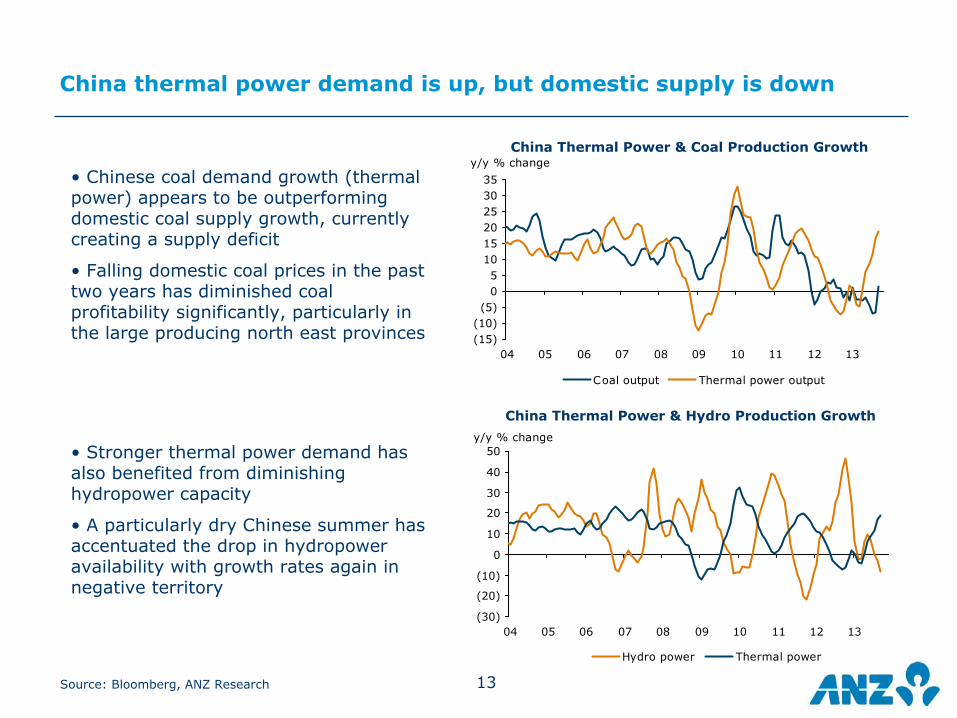
China thermal power demand is up, but domestic supply is down
China Thermal Power & Coal Production Growth
China Thermal Power & Hydro Production Growth
• Chinese coal demand growth (thermal power) appears to be outperforming domestic coal supply growth, currently creating a supply deficit
• Falling domestic coal prices in the past two years has diminished coal profitability significantly, particularly in the large producing north east provinces
• Stronger thermal power demand has also benefited from diminishing hydropower capacity
• A particularly dry Chinese summer has accentuated the drop in hydropower availability with growth rates again in negative territory
14
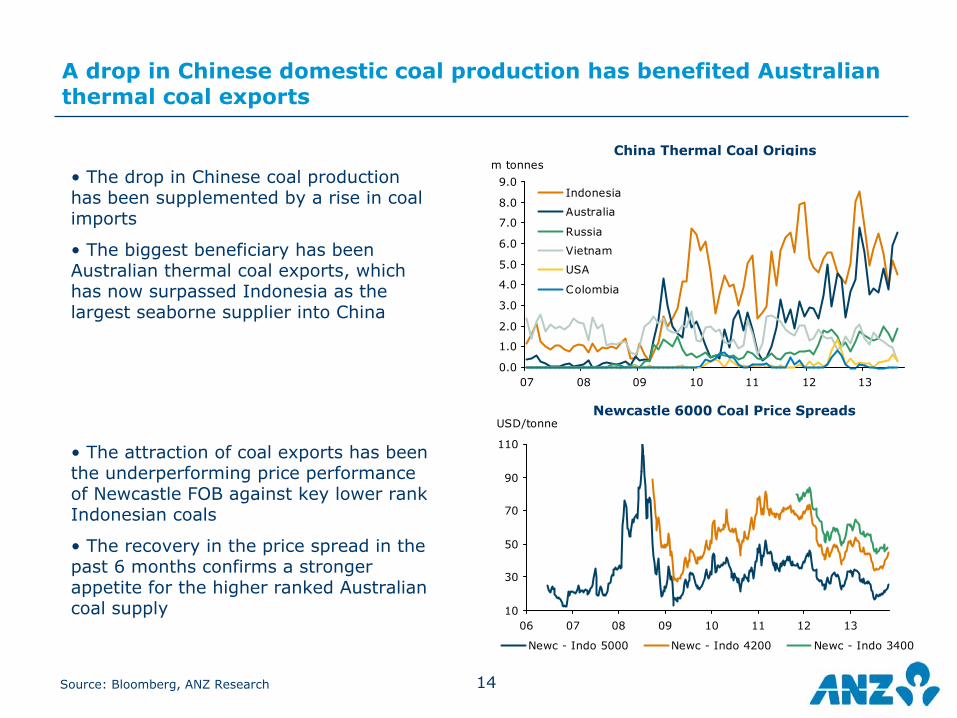
A drop in Chinese domestic coal production has benefited Australian thermal coal exports
Source: Bloomberg, ANZ Research
China Thermal Coal Origins
10
30
50
70
90
110
06 07 08 09 10 11 12 13
Newc - Indo 5000 Newc - Indo 4200 Newc - Indo 3400
USD/tonneNewcastle 6000 Coal Price Spreads
0.0
1.0
2.0
3.0
4.0
5.0
6.0
7.0
8.0
9.0
07 08 09 10 11 12 13
Indonesia
Australia
Russia
Vietnam
USA
Colombia
m tonnes• The drop in Chinese coal production has been supplemented by a rise in coal imports
• The biggest beneficiary has been Australian thermal coal exports, which has now surpassed Indonesia as the largest seaborne supplier into China
• The attraction of coal exports has been the underperforming price performance of Newcastle FOB against key lower rank Indonesian coals
• The recovery in the price spread in the past 6 months confirms a stronger appetite for the higher ranked Australian coal supply
15Source: Bloomberg, ANZ Research
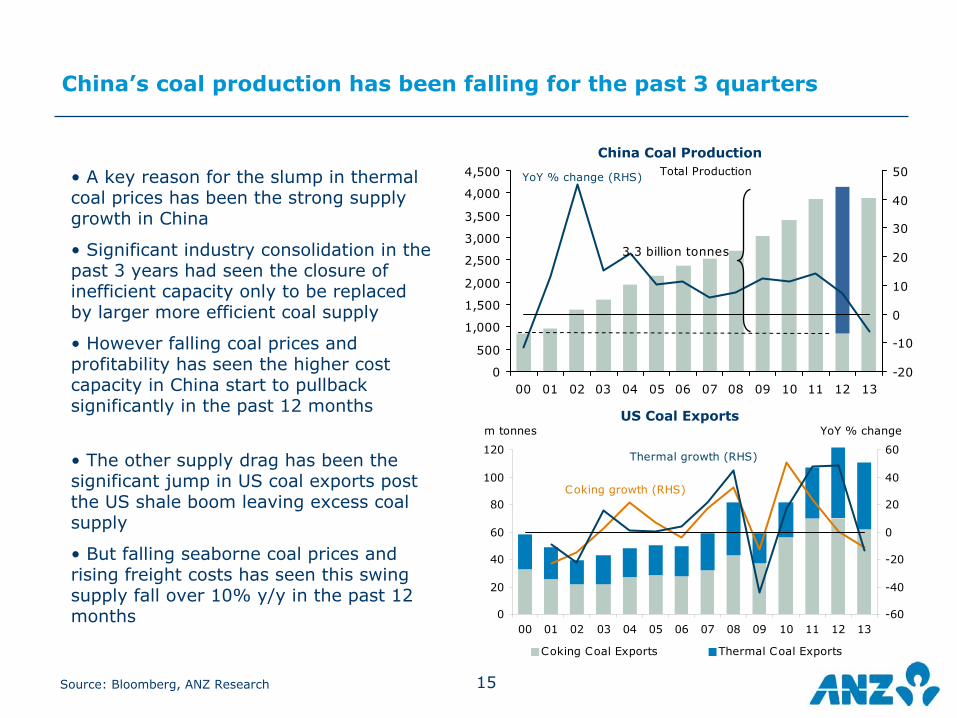
China’s coal production has been falling for the past 3 quarters
China Coal Production
0
20
40
60
80
100
120
00 01 02 03 04 05 06 07 08 09 10 11 12 13-60
-40
-20
0
20
40
60
Coking Coal Exports Thermal Coal Exports
m tonnes YoY % change
Coking growth (RHS)
Thermal growth (RHS)
US Coal Exports
0
500
1,000
1,500
2,000
2,500
3,000
3,500
4,000
4,500
00 01 02 03 04 05 06 07 08 09 10 11 12 13-20
-10
0
10
20
30
40
50YoY % change (RHS) Total Production
3.3 billion tonnes
• A key reason for the slump in thermal coal prices has been the strong supply growth in China
• Significant industry consolidation in the past 3 years had seen the closure of inefficient capacity only to be replaced by larger more efficient coal supply
• However falling coal prices and profitability has seen the higher cost capacity in China start to pullback significantly in the past 12 months
• The other supply drag has been the significant jump in US coal exports post the US shale boom leaving excess coal supply
• But falling seaborne coal prices and rising freight costs has seen this swing supply fall over 10% y/y in the past 12 months
16Source: Bloomberg, ANZ Research
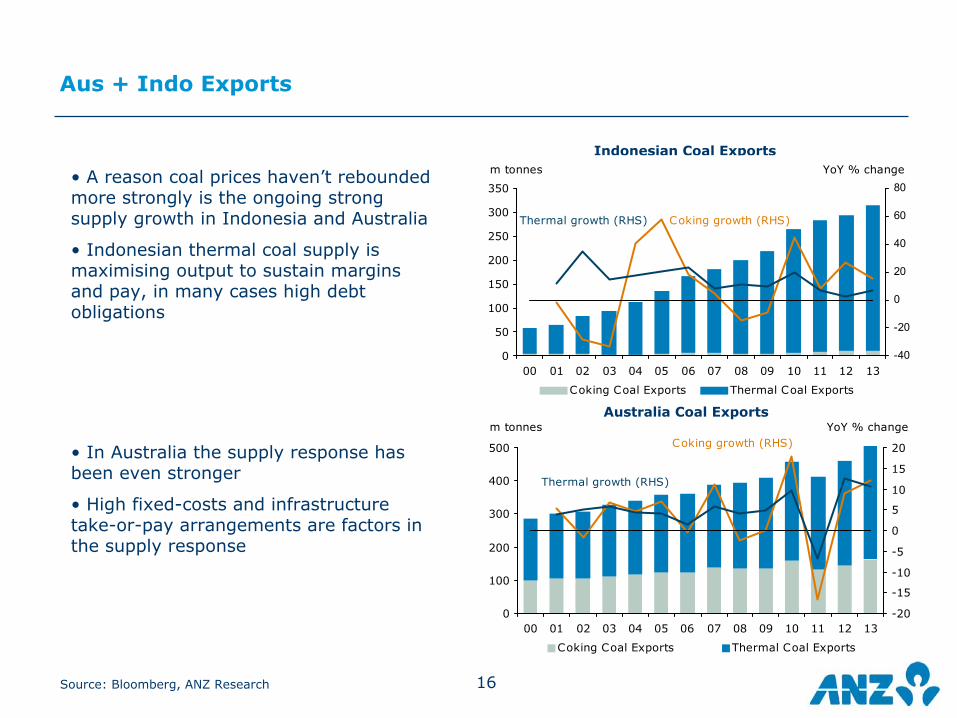
Aus + Indo Exports
Indonesian Coal Exports
0
100
200
300
400
500
00 01 02 03 04 05 06 07 08 09 10 11 12 13-20
-15
-10
-5
0
5
10
15
20
Coking Coal Exports Thermal Coal Exports
m tonnes YoY % changeCoking growth (RHS)
Thermal growth (RHS)
Australia Coal Exports
0
50
100
150
200
250
300
350
00 01 02 03 04 05 06 07 08 09 10 11 12 13-40
-20
0
20
40
60
80
Coking Coal Exports Thermal Coal Exports
m tonnes YoY % change
Coking growth (RHS)Thermal growth (RHS)
• A reason coal prices haven’t rebounded more strongly is the ongoing strong supply growth in Indonesia and Australia
• Indonesian thermal coal supply is maximising output to sustain margins and pay, in many cases high debt obligations
• In Australia the supply response has been even stronger
• High fixed-costs and infrastructure take-or-pay arrangements are factors in the supply response
17
118
190
0
50
100
150
200
250
300
350
2000 2010 20200
10
20
30
40
50
60
70
8075%
10%
% yoym tonnes
55
145
0
50
100
150
200
250
300
350
2000 2010 20200
5
10
15
20
25
10%
20%
% yoym tonnes
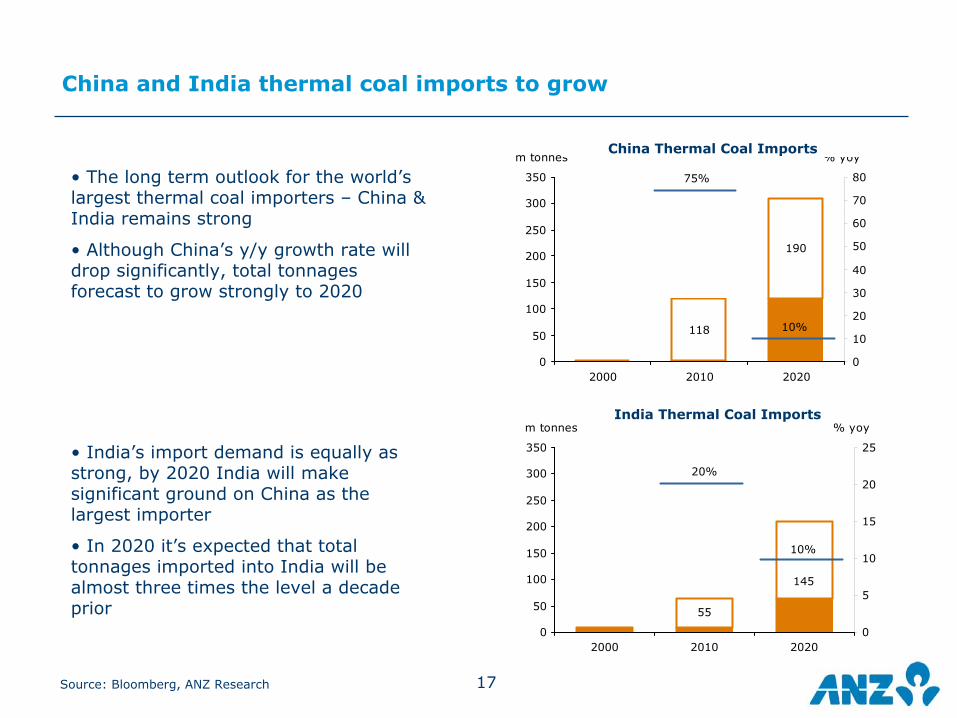
China and India thermal coal imports to grow
Source: Bloomberg, ANZ Research
China Thermal Coal Imports
India Thermal Coal Imports
• The long term outlook for the world’s largest thermal coal importers – China & India remains strong
• Although China’s y/y growth rate will drop significantly, total tonnages forecast to grow strongly to 2020
• India’s import demand is equally as strong, by 2020 India will make significant ground on China as the largest importer
• In 2020 it’s expected that total tonnages imported into India will be almost three times the level a decade prior
18
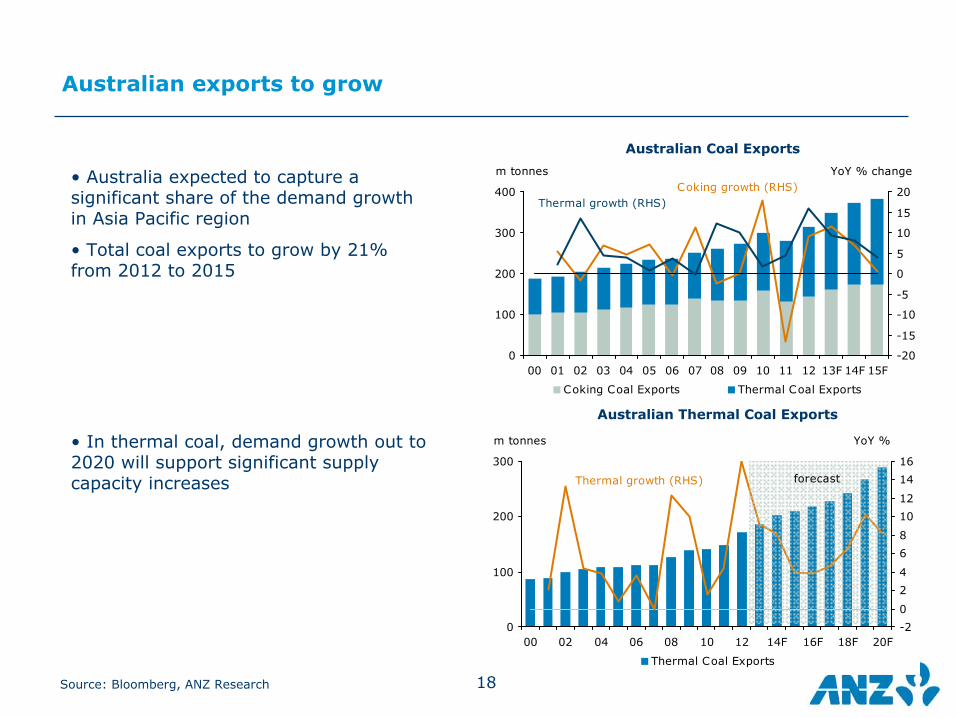
Australian exports to grow
Source: Bloomberg, ANZ Research
Australian Coal Exports
Australian Thermal Coal Exports
0
100
200
300
400
00 01 02 03 04 05 06 07 08 09 10 11 12 13F 14F 15F-20
-15
-10
-5
0
5
10
15
20
Coking Coal Exports Thermal Coal Exports
m tonnes YoY % changeCoking growth (RHS)
Thermal growth (RHS)
0
100
200
300
00 02 04 06 08 10 12 14F 16F 18F 20F-20
24
68
1012
1416
Thermal Coal Exports
m tonnes YoY %
Thermal growth (RHS) forecast
• Australia expected to capture a significant share of the demand growth in Asia Pacific region
• Total coal exports to grow by 21% from 2012 to 2015
• In thermal coal, demand growth out to 2020 will support significant supply capacity increases
19
Finance
20
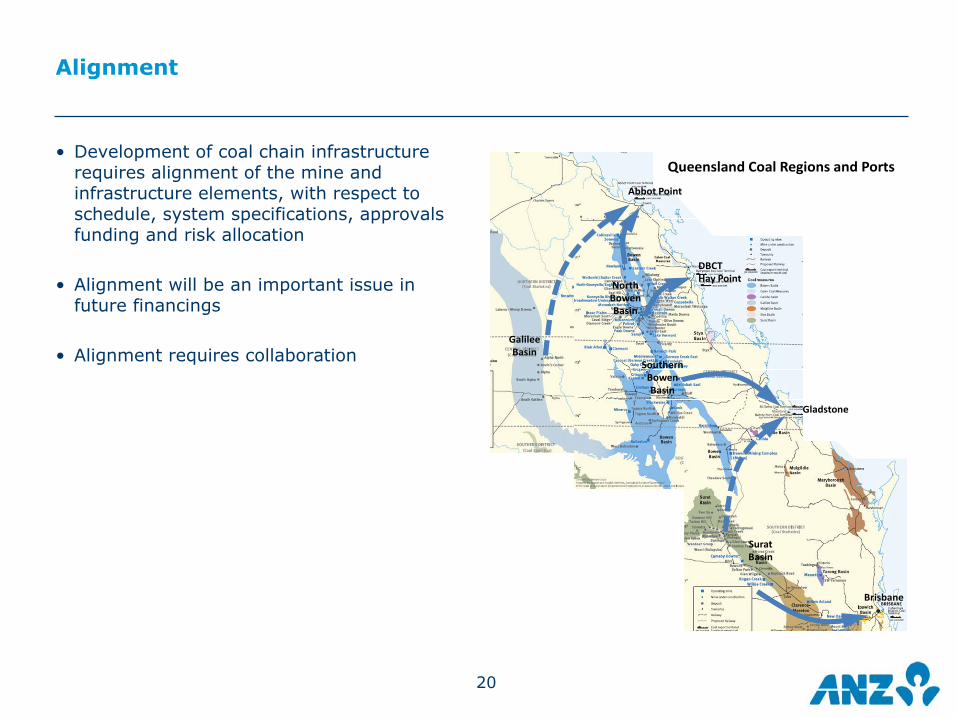
Alignment
Queensland�Coal�Regions�and�Ports
GalileeBasin
SouthernBowenBasin
SuratBasin
Abbot�Point
DBCTHay�Point
Gladstone
Brisbane
NorthBowenBasin
• Development of coal chain infrastructure requires alignment of the mine and infrastructure elements, with respect to schedule, system specifications, approvals funding and risk allocation
• Alignment will be an important issue in future financings
• Alignment requires collaboration
21
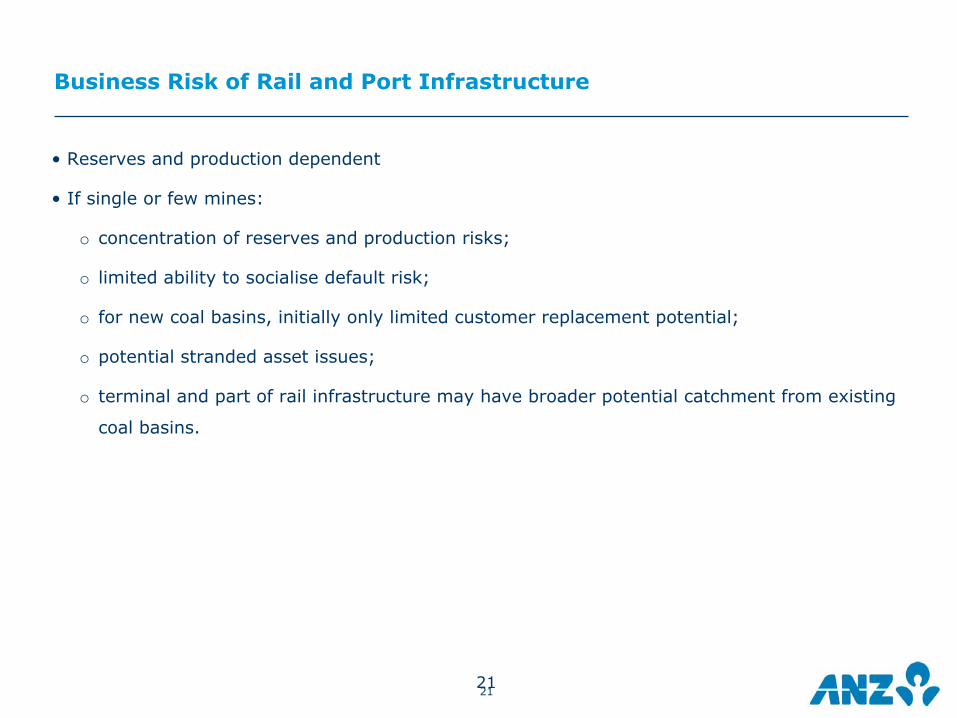
Business Risk of Rail and Port Infrastructure
21
• Reserves and production dependent
• If single or few mines:
o concentration of reserves and production risks;
o limited ability to socialise default risk;
o for new coal basins, initially only limited customer replacement potential;
o potential stranded asset issues;
o terminal and part of rail infrastructure may have broader potential catchment from existing
coal basins.
22
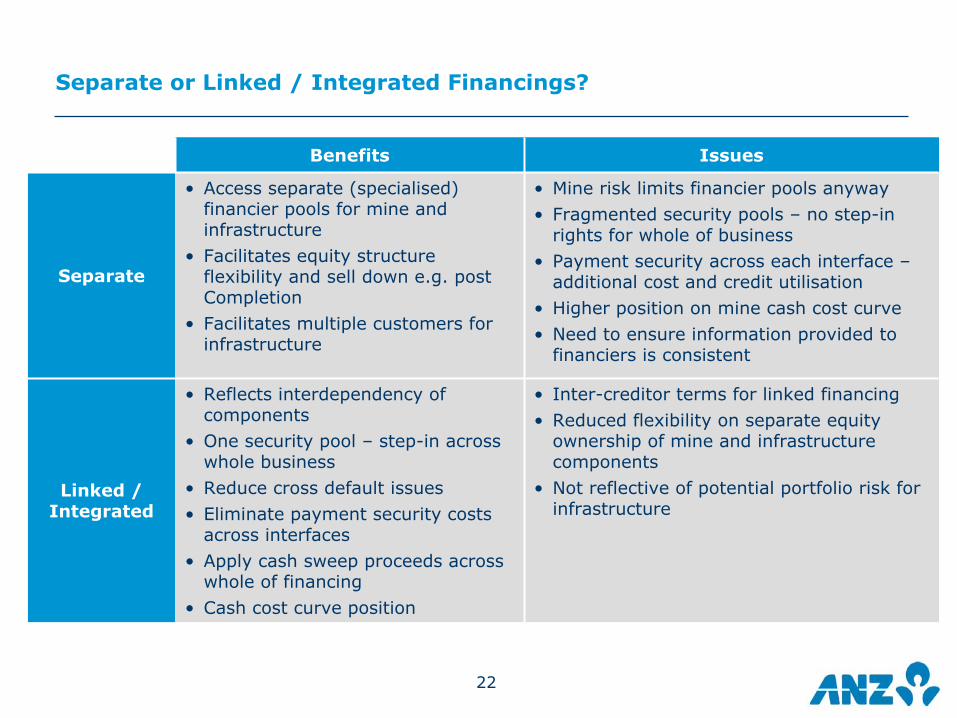
Separate or Linked / Integrated Financings?
Benefits Issues
Separate
• Access separate (specialised) financier pools for mine and infrastructure
• Facilitates equity structure flexibility and sell down e.g. post Completion
• Facilitates multiple customers for infrastructure
• Mine risk limits financier pools anyway• Fragmented security pools – no step-in
rights for whole of business• Payment security across each interface –
additional cost and credit utilisation• Higher position on mine cash cost curve• Need to ensure information provided to
financiers is consistent
Linked / Integrated
• Reflects interdependency of components
• One security pool – step-in across whole business
• Reduce cross default issues • Eliminate payment security costs
across interfaces• Apply cash sweep proceeds across
whole of financing• Cash cost curve position
• Inter-creditor terms for linked financing• Reduced flexibility on separate equity
ownership of mine and infrastructure components
• Not reflective of potential portfolio risk for infrastructure

24
IMPORTANT NOTICE
The distribution of this document may be restricted by law in certain jurisdictions. Persons who receive this document must inform themselves about and observe all relevant restrictions.
COUNTRY/REGION SPECIFIC INFORMATION:
AUSTRALIA. This document is distributed in Australia by Australia and New Zealand Banking Group Limited (ABN 11 005 357 522) (“ANZ”). ANZ holds an Australian Financial Services licence no. 234527. A copy of ANZ's Financial Services Guide is available at http://www.anz.com/documents/AU/aboutANZ/FinancialServicesGuide.pdf and is available upon request from your ANZ point of contact. If trading strategies or recommendations are included in this document, they are solely for the information of ‘wholesale clients’ (as defined in section 761G of the Corporations Act 2001 Cth). Persons who receive this document must inform themselves about and observe all relevant restrictions.
BRAZIL. THIS DOCUMENT IS DISTRIBUTED IN BRAZIL BY AUSTRALIA AND NEW ZEALAND BANKING GROUP LIMITED (ABN 11 005 357 522) ONLY FOR THE INFORMATION OF THE CENTRAL BANK OF BRAZIL. NO SECURITIES ARE BEING OFFERED OR SOLD IN BRAZIL UNDER THIS DOCUMENT, AND NO SECURITIES HAVE BEEN AND WILL NOT BE REGISTERED WITH THE SECURITIES COMMISSION - CVM.
BRUNEI. JAPAN. KUWAIT. MALAYSIA. TAIPEI. This document is distributed in each of Brunei, Japan, Kuwait, Malaysia and Taipei by Australia and New Zealand Banking Group Limited (ABN 11 005 357 522) on a cross-border basis.
EUROPEAN ECONOMIC AREA (“EEA”): UNITED KINGDOM. Australia and New Zealand Banking Group Limited (ABN 11 005 357 522) (“ANZ”) is authorised and regulated in the United Kingdom by the Financial Services Authority (“FSA”). This document is distributed in the United Kingdom by ANZ solely for the information of persons who would come within the FSA definition of “eligible counterparty” or “professional client”. It is not intended for and must not be distributed to any person who would come within the FSA definition of “retail client”. Nothing here excludes or restricts any duty or liability to a customer which ANZ may have under the UK Financial Services and Markets Act 2000 or under the regulatory system as defined in the Rules of the FSA. GERMANY. This document is distributed in Germany by the Frankfurt Branch of ANZ solely for the information of its clients. OTHER EEA COUNTRIES. This document is distributed in the EEA by ANZ Bank (Europe) Limited (“ANZBEL”) which is authorised and regulated by the FSA in the United Kingdom, to persons who would come within the FSA definition of “eligible counterparty” or “professional client” in other countries in the EEA. This document is distributed in those countries solely for the information of such persons upon their request. It is not intended for, and must not be distributed to, any person in those countries who would come within the FSA definition of “retail client”.
HONG KONG. This document is distributed in Hong Kong by the Hong Kong branch of Australia and New Zealand Banking Group Limited (ABN 11 005 357 522), which is registered by the Hong Kong Securities and Futures Commission to conduct Type 1 (dealing in securities), Type 4 (advising on securities) and Type 6 (advising on corporate finance) regulated activities. The contents of this document have not been reviewed by any regulatory authority in Hong Kong. If in doubt about the contents of this document, you should obtain independent professional advice.
NEW ZEALAND. This document is distributed in New Zealand by ANZ National Bank Limited. This document is intended to be of a general nature, does not take into account your financial situation or goals, and is not a personalised adviser service under the Financial Advisers Act 2008.
PEOPLE’S REPUBLIC OF CHINA. If and when the material accompanying this document is distributed by Australia and New Zealand Banking Group Limited (ABN 11 005 357 522) (“ANZ”) or an affiliate (other than Australia and New Zealand Bank (China) Company Limited ("ANZ C")), the following statement and the text below is applicable: No action has been taken by ANZ or any affiliate which would permit a public offering of any products or services of such an entity or distribution or re-distribution of this document in the People’s Republic of China (“PRC”). Accordingly, the products and services of such entities are not being offered or sold within the PRC by means of this document or any other document. This document may not be distributed, re-distributed or published in the PRC, except under circumstances that will result in compliance with any applicable laws and regulations. If and when the material accompanying this document relates to the products and/or services of ANZ C, the following statement and the text below is applicable: This document is distributed by ANZ C in the Mainland of the PRC.
SINGAPORE. This document is distributed in Singapore by the Singapore branch of Australia and New Zealand Banking Group Limited (ABN 11 005 357 522) (“ANZ”) solely for the information of “accredited investors”, “expert investors” or (as the case may be) “institutional investors” (each term as defined in the Securities and Futures Act Cap. 289 of Singapore). ANZ is licensed in Singapore under the Banking Act Cap. 19 of Singapore and is exempted from holding a financial adviser’s licence under Section 23(1)(a) of the Financial Advisers Act Cap. 100 of Singapore. In respect of any matters arising from, or in connection with the distribution of this document in Singapore, contact your ANZ point of contact.
UNITED ARAB EMIRATES. This document is distributed in the United Arab Emirates (“UAE”) or the Dubai International Financial Centre (as applicable) by Australia and New Zealand Banking Group Limited (ABN 11 005 357 522) (“ANZ”). This document: does not, and is not intended to constitute an offer of securities anywhere in the UAE; does not constitute, and is not intended to constitute the carrying on or engagement in banking, financial and/or investment consultation business in the UAE under the rules and regulations made by the Central Bank of the United Arab Emirates, the Emirates Securities and Commodities Authority or the United Arab Emirates Ministry of Economy; does not, and is not intended to constitute an offer of securities within the meaning of the Dubai International Financial Centre Markets Law No. 12 of 2004; and, does not constitute, and is not intended to constitute, a financial promotion, as defined under the Dubai International Financial Centre Regulatory Law No. 1 of 200. ANZ DIFC Branch is regulated by the Dubai Financial Services Authority (“DFSA”). The financial products or services described in this document are only available to persons who qualify as “Professional Clients” or “Market Counterparty” in accordance with the provisions of the DFSA rules. In addition, ANZ has a representative office (“ANZ Representative Office”) in Abu Dhabi regulated by the Central Bank of the United Arab Emirates. ANZ Representative Office is not permitted by the Central Bank of the United Arab Emirates to provide any banking services to clients in the UAE.
25
IMPORTANT NOTICE
UNITED STATES. If and when this document is received by any person in the United States or a "U.S. person" (as defined in Regulation S under the US Securities Act of 1933, as amended) (“US Person”) or any person acting for the account or benefit of a US Person, it is noted that ANZ Securities, Inc. (“ANZ S”) is a member of FINRA (www.finra.org) and registered with the SEC. Also, ANZ S’s address is 277 Park Avenue, 31st Floor, New York, NY 10172, United States of America (Tel: +1 212 801 9160 Fax: +1 212 801 9163). This document is distributed in the United States by ANZ S (a wholly owned subsidiary of Australia and New Zealand Banking Group Limited (ABN 11 005 357 522)), which accepts responsibility for its content. Information on any securities referred to in this document may be obtained from ANZ S upon request. Any US Person receiving this document and wishing to effect transactions in any securities referred to in this document must contact ANZ S, not its affiliates.
2. DISCLAIMER
Except if otherwise specified above, this document is issued and distributed in your country/region by Australia and New Zealand Banking Group Limited (ABN 11 005 357 522) (“ANZ”), on the basis that it is only for the information of the specified recipient or permitted user of the relevant website (collectively, “recipient”). This document may not be reproduced, distributed or published by any recipient for any purpose. It has been prepared without taking into account the objectives, financial situation or needs of any person. Nothing in this document is intended to be an offer to sell, or a solicitation of an offer to buy, any product, instrument or investment, to effect any transaction or to conclude any legal act of any kind. If, despite the foregoing, any services or products referred to in this document are deemed to be offered in the jurisdiction in which this document is received or accessed, no such service or product is intended for nor available to persons resident in that jurisdiction if it would be contradictory to local law or regulation. Such local laws, regulations and other limitations always apply with non-exclusive jurisdiction of local courts. Before making an investment decision, recipients should seek independent financial, legal, tax and other relevant advice having regard to their particular circumstances.
The views and recommendations expressed in this document are the author’s. They are based on information known by the author and on sources which the author believes to be reliable, but may involve material elements of subjective judgement and analysis. Unless specifically stated otherwise: they are current on the date of this document and are subject to change without notice; and, all price information is indicative only. Any of the views and recommendations which comprise estimates, forecasts or other projections, are subject to significant uncertainties and contingencies that cannot reasonably be anticipated. On this basis, such views and recommendations may not always be achieved or prove to be correct. Indications of past performance in this document will not necessarily be repeated in the future. No representation is being made that any investment will or is likely to achieve profits or losses similar to those achieved in the past, or that significant losses will be avoided. Additionally, this document may contain ‘forward looking statements’. Actual events or results or actual performance may differ materially from those reflected or contemplated in such forward looking statements. All investments entail a risk and may result in both profits and losses. Foreign currency rates of exchange may adversely affect the value, price or income of any products or services described in this document. The products and services described in this document are not suitable for all investors, and transacting in these products or services is considered risky. ANZ and its related bodies corporate and affiliates, and the officers, employees, contractors and agents of each of them (including the author) (“Affiliates”), do not make any representation as to the accuracy, completeness or currency of the views or recommendations expressed in this document. Neither ANZ nor its Affiliates accept any responsibility to inform you of any matter that subsequently comes to their notice, which may affect the accuracy, completeness or currency of the information in this document.
Except as required by law, and only to the extent so required: neither ANZ nor its Affiliates warrant or guarantee the performance of any of the products or services described in this document or any return on any associated investment; and, ANZ and its Affiliates expressly disclaim any responsibility and shall not be liable for any loss, damage, claim, liability, proceedings, cost or expense (“Liability”) arising directly or indirectly and whether in tort (including negligence), contract, equity or otherwise out of or in connection with this document.
If this document has been distributed by electronic transmission, such as e-mail, then such transmission cannot be guaranteed to be secure or error-free as information could be intercepted, corrupted, lost, destroyed, arrive late or incomplete, or contain viruses. ANZ and its Affiliates do not accept any Liability as a result of electronic transmission of this document.
Disclosure of Interests
ANZ and its Affiliates may have an interest in the products and services described in this document as follows:
xThey may receive fees from customers for dealing in the products and/or services described in this document, and their staff and introducers of business may share in such fees or receive a bonus that may be influenced by total sales.
xThey or their clients may have or have had interests or long or short positions in the products and/or services described in this document, and may at any time make purchases and/or sales in them as principal or agent.
xThey may act or have acted as market-maker in products described in this document.
ANZ may rely on information barriers and other arrangements to control the flow of information contained in one or more areas within ANZ into other areas of ANZ. Further details on the above disclosures are available upon request from your ANZ point of contact.