John Cymbalsky-DOE Verena Radulovi-EPA Jeremy Dommu...
13
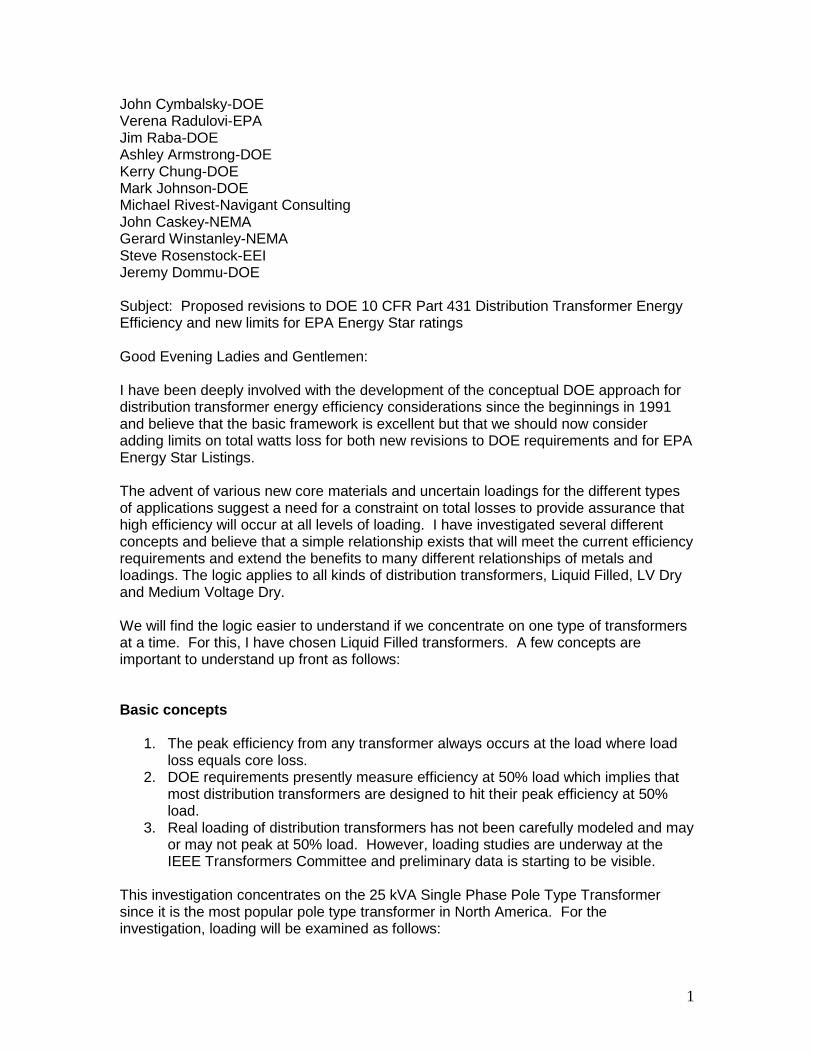
1 John Cymbalsky-DOE Verena Radulovi-EPA Jim Raba-DOE Ashley Armstrong-DOE Kerry Chung-DOE Mark Johnson-DOE Michael Rivest-Navigant Consulting John Caskey-NEMA Gerard Winstanley-NEMA Steve Rosenstock-EEI Jeremy Dommu-DOE Subject: Proposed revisions to DOE 10 CFR Part 431 Distribution Transformer Energy Efficiency and new limits for EPA Energy Star ratings Good Evening Ladies and Gentlemen: I have been deeply involved with the development of the conceptual DOE approach for distribution transformer energy efficiency considerations since the beginnings in 1991 and believe that the basic framework is excellent but that we should now consider adding limits on total watts loss for both new revisions to DOE requirements and for EPA Energy Star Listings. The advent of various new core materials and uncertain loadings for the different types of applications suggest a need for a constraint on total losses to provide assurance that high efficiency will occur at all levels of loading. I have investigated several different concepts and believe that a simple relationship exists that will meet the current efficiency requirements and extend the benefits to many different relationships of metals and loadings. The logic applies to all kinds of distribution transformers, Liquid Filled, LV Dry and Medium Voltage Dry. We will find the logic easier to understand if we concentrate on one type of transformers at a time. For this, I have chosen Liquid Filled transformers. A few concepts are important to understand up front as follows: Basic concepts 1. The peak efficiency from any transformer always occurs at the load where load loss equals core loss. 2. DOE requirements presently measure efficiency at 50% load which implies that most distribution transformers are designed to hit their peak efficiency at 50% load. 3. Real loading of distribution transformers has not been carefully modeled and may or may not peak at 50% load. However, loading studies are underway at the IEEE Transformers Committee and preliminary data is starting to be visible. This investigation concentrates on the 25 kVA Single Phase Pole Type Transformer since it is the most popular pole type transformer in North America. For the investigation, loading will be examined as follows:
Transcript of John Cymbalsky-DOE Verena Radulovi-EPA Jeremy Dommu...
1
John Cymbalsky-DOE Verena Radulovi-EPA Jim Raba-DOE Ashley Armstrong-DOE Kerry Chung-DOE Mark Johnson-DOE Michael Rivest-Navigant Consulting John Caskey-NEMA Gerard Winstanley-NEMA Steve Rosenstock-EEI Jeremy Dommu-DOE Subject: Proposed revisions to DOE 10 CFR Part 431 Distribution Transformer Energy Efficiency and new limits for EPA Energy Star ratings Good Evening Ladies and Gentlemen: I have been deeply involved with the development of the conceptual DOE approach for distribution transformer energy efficiency considerations since the beginnings in 1991 and believe that the basic framework is excellent but that we should now consider adding limits on total watts loss for both new revisions to DOE requirements and for EPA Energy Star Listings. The advent of various new core materials and uncertain loadings for the different types of applications suggest a need for a constraint on total losses to provide assurance that high efficiency will occur at all levels of loading. I have investigated several different concepts and believe that a simple relationship exists that will meet the current efficiency requirements and extend the benefits to many different relationships of metals and loadings. The logic applies to all kinds of distribution transformers, Liquid Filled, LV Dry and Medium Voltage Dry. We will find the logic easier to understand if we concentrate on one type of transformers at a time. For this, I have chosen Liquid Filled transformers. A few concepts are important to understand up front as follows: Basic concepts
1. The peak efficiency from any transformer always occurs at the load where load loss equals core loss.
2. DOE requirements presently measure efficiency at 50% load which implies that most distribution transformers are designed to hit their peak efficiency at 50% load.
3. Real loading of distribution transformers has not been carefully modeled and may or may not peak at 50% load. However, loading studies are underway at the IEEE Transformers Committee and preliminary data is starting to be visible.
This investigation concentrates on the 25 kVA Single Phase Pole Type Transformer since it is the most popular pole type transformer in North America. For the investigation, loading will be examined as follows:
2
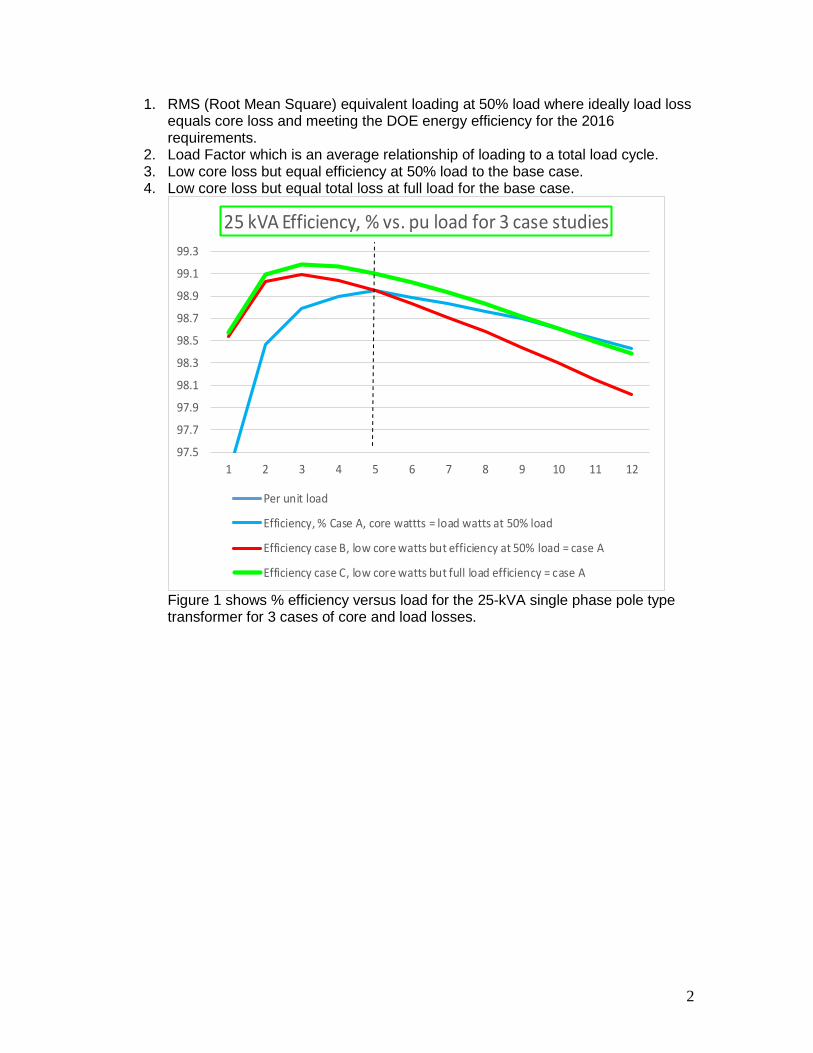
1. RMS (Root Mean Square) equivalent loading at 50% load where ideally load loss equals core loss and meeting the DOE energy efficiency for the 2016 requirements.
2. Load Factor which is an average relationship of loading to a total load cycle. 3. Low core loss but equal efficiency at 50% load to the base case. 4. Low core loss but equal total loss at full load for the base case.
97.5
97.7
97.9
98.1
98.3
98.5
98.7
98.9
99.1
99.3
1 2 3 4 5 6 7 8 9 10 11 12
25 kVA Efficiency, % vs. pu load for 3 case studies
Per unit load
Efficiency, % Case A, core wattts = load watts at 50% load
Efficiency case B, low core watts but efficiency at 50% load = case A
Efficiency case C, low core watts but full load efficiency = case A
Figure 1 shows % efficiency versus load for the 25-kVA single phase pole type transformer for 3 cases of core and load losses.

3
0
100
200
300
400
500
600
700
1 2 3 4 5 6 7 8 9 10 11 12
25 kVA watt losses vs. pu load for 3 case studies
Per unit load
Loss watts, Case A core = load at 50% load
Loss watts Case B low core loss, equal efficiency at 50% load
Loss watts Case C low core loss but equal full load loss
Figure 2 shows total losses vs. per unit load for the 25-kVA single phase pole type transformer for 3 cases of core and load losses
Part A Transformers Optimized to hit peak efficiency at 50% load and tested at 50% load
1. The RMS-equivalent load for liquid filled distribution transformers has been assumed to be approximately at 50% of their nameplate rating. It may or may not be accurate but is the basis of the current efficiency standard.
2. The peak efficiency of a transformer always occurs at the loading where core loss equals load loss. This is a very important concept because we always want to design a transformer to operate at peak efficiency if possible and certainly want to measure efficiency at its peak. Hence, modern transformers that meet the DOE requirements are generally designed to operate at peak efficiency at 50% load and are tested at that loading. That also says that most of them have about equal core and load losses at 50% load.
3. Load loss at any load is related to the per unit load square times the full load watts times a temperature correction factor.
4. The temperature correction factor is less than unity because the winding resistance drops with temperature and thus drops with loading.
5. At 50% load, the load loss will thus be < 25% of what it was at full load. 6. If we assume that transformer stray and eddy losses are of the order of 14% of
rated winding resistive losses, then a typical temperature correction factor would be approximately 0.928. This suggests that the actual winding loss at 50% load is equal to the full load winding loss times (1/4)^2 times 0.928 or about 0.232 times full load current squared.
7. Knowing the relationship between winding loss at full load to that at 50% load suggests that we can easily determine one from the other.
8. Efficiency in per unit values = output VA/Input VA 9. But input VA = Output VA + allowable watt losses.
4
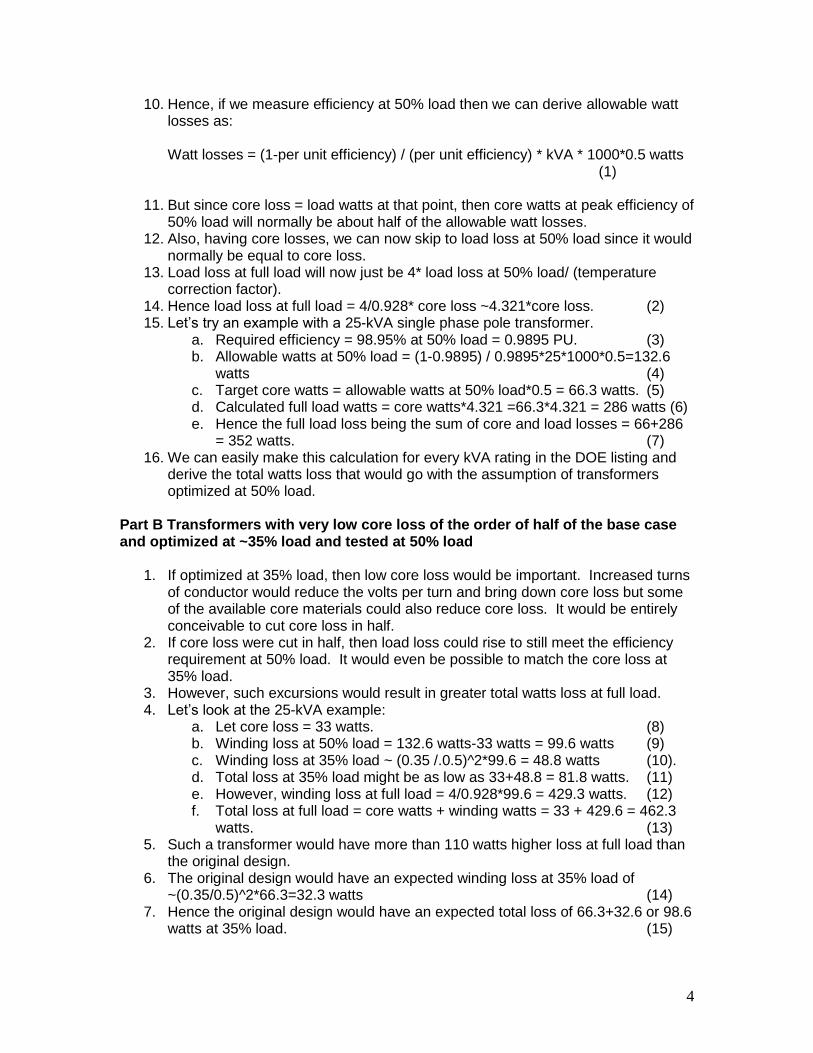
10. Hence, if we measure efficiency at 50% load then we can derive allowable watt losses as: Watt losses = (1-per unit efficiency) / (per unit efficiency) * kVA * 1000*0.5 watts (1)
11. But since core loss = load watts at that point, then core watts at peak efficiency of 50% load will normally be about half of the allowable watt losses.
12. Also, having core losses, we can now skip to load loss at 50% load since it would normally be equal to core loss.
13. Load loss at full load will now just be 4* load loss at 50% load/ (temperature correction factor).
14. Hence load loss at full load = 4/0.928* core loss ~4.321*core loss. (2) 15. Let’s try an example with a 25-kVA single phase pole transformer.
a. Required efficiency = 98.95% at 50% load = 0.9895 PU. (3) b. Allowable watts at 50% load = (1-0.9895) / 0.9895*25*1000*0.5=132.6
watts (4) c. Target core watts = allowable watts at 50% load*0.5 = 66.3 watts. (5) d. Calculated full load watts = core watts*4.321 =66.3*4.321 = 286 watts (6) e. Hence the full load loss being the sum of core and load losses = 66+286
= 352 watts. (7) 16. We can easily make this calculation for every kVA rating in the DOE listing and
derive the total watts loss that would go with the assumption of transformers optimized at 50% load.
Part B Transformers with very low core loss of the order of half of the base case and optimized at ~35% load and tested at 50% load
1. If optimized at 35% load, then low core loss would be important. Increased turns of conductor would reduce the volts per turn and bring down core loss but some of the available core materials could also reduce core loss. It would be entirely conceivable to cut core loss in half.
2. If core loss were cut in half, then load loss could rise to still meet the efficiency requirement at 50% load. It would even be possible to match the core loss at 35% load.
3. However, such excursions would result in greater total watts loss at full load. 4. Let’s look at the 25-kVA example:
a. Let core loss = 33 watts. (8) b. Winding loss at 50% load = 132.6 watts-33 watts = 99.6 watts (9) c. Winding loss at 35% load ~ (0.35 /.0.5)^2*99.6 = 48.8 watts (10). d. Total loss at 35% load might be as low as 33+48.8 = 81.8 watts. (11) e. However, winding loss at full load = 4/0.928*99.6 = 429.3 watts. (12) f. Total loss at full load = core watts + winding watts = 33 + 429.6 = 462.3
watts. (13) 5. Such a transformer would have more than 110 watts higher loss at full load than
the original design. 6. The original design would have an expected winding loss at 35% load of
~(0.35/0.5)^2*66.3=32.3 watts (14) 7. Hence the original design would have an expected total loss of 66.3+32.6 or 98.6
watts at 35% load. (15)

5
8. The point is that unconstrained total loss would result in many situations where total effective losses from low core loss designs could raise total system losses during periods of peak load.
Part C Let’s look at an option where watt each reduction in core loss would allow an equal watt increase in load loss but not allow any increases in total loss.
1. The starting losses for the 25-kVA example are 66.3 watts core loss, 286 watts load loss and 352 watts total loss. We need to keep the total loss at 352 watts.
2. Core loss has been reduced to 33 watts. Hence load loss can be increased to 286 + 66.3-33 watts or to 319.3 watts at full load. Here the total loss is still 352 watts.
3. Hence the load loss at 50% load would be (1/2)^2*0.928*319.3 = 74.0 watts. (16) 4. With this result, the total loss at 50% load = 33 watts core loss + 74 watts load
loss or 107 watts. (17) 5. This is excellent since the allowable loss today is 132.6 watts at 50% load and in
fact it remains fine all the way up to full rated load. 6. The result of such a move would be to find a condition which generally improves
efficiency of the system over the original DOE intention at all loadings up to rated load.
7. This option is possible and a good choice with improved core materials. 8. This option is not generally usable through simple changes in design since
reductions in core loss normally increase winding losses by equal percentages and not by equal losses. In examining several cases, increasing winding turns and reducing volts per turn normally results in 4 watts of winding loss increase for each watt of core loss reduction.
9. Higher permeability core materials are excellent candidates to make this option work. Thinner core materials with low eddy current losses are also excellent candidates.
Part D Let’s look at an option where watt each reduction in core loss would allow two watts increase in load loss, resulting in increases in total loss. This option would seem to allow modest changes in design to achieve some reduced core loss with modest increases in load and total losses. However, in examining real designs, we find that load loss must increase by around 4 times the reduction in core loss to achieve meaningful improvements. However, this results in very large increases in total loss at the peak loads where these transformers are applied and does not appear to be very useful.
6
97.5
97.7
97.9
98.1
98.3
98.5
98.7
98.9
99.1
99.3
1 2 3 4 5 6 7 8 9 10 11 12
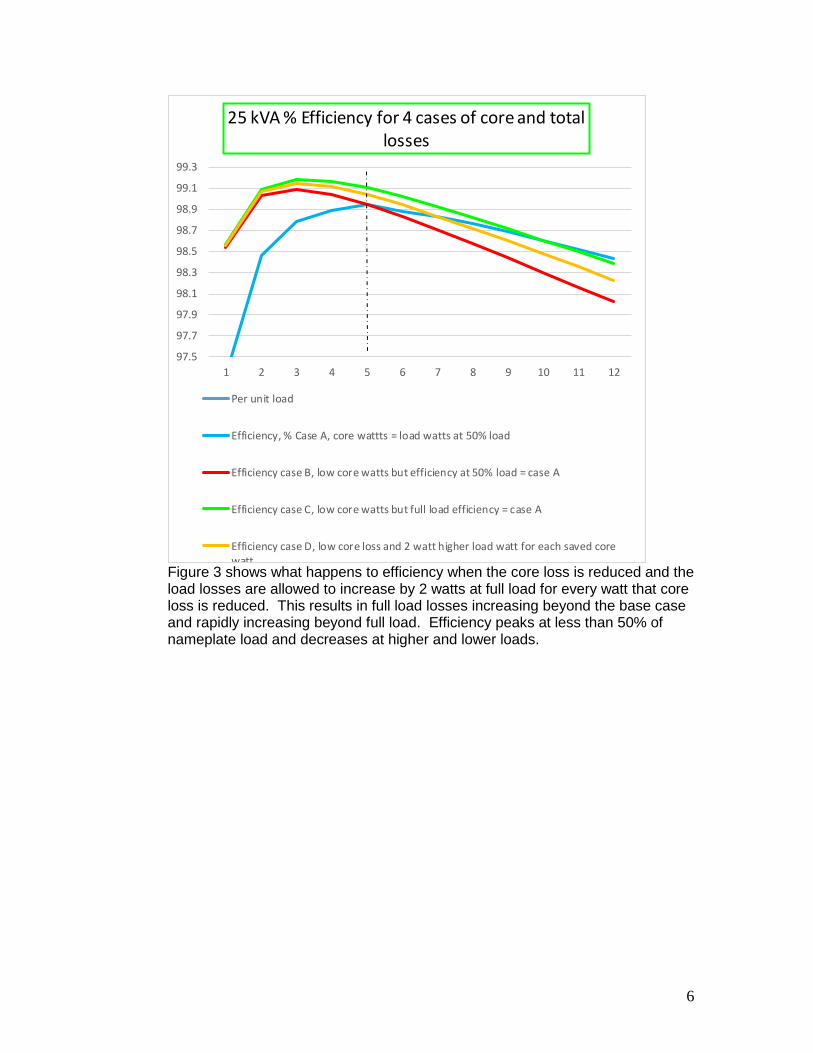
25 kVA % Efficiency for 4 cases of core and total losses
Per unit load
Efficiency, % Case A, core wattts = load watts at 50% load
Efficiency case B, low core watts but efficiency at 50% load = case A
Efficiency case C, low core watts but full load efficiency = case A
Efficiency case D, low core loss and 2 watt higher load watt for each saved corewatt
Figure 3 shows what happens to efficiency when the core loss is reduced and the load losses are allowed to increase by 2 watts at full load for every watt that core loss is reduced. This results in full load losses increasing beyond the base case and rapidly increasing beyond full load. Efficiency peaks at less than 50% of nameplate load and decreases at higher and lower loads.
7
0
100
200
300
400
500
600
700
1 2 3 4 5 6 7 8 9 10 11 12
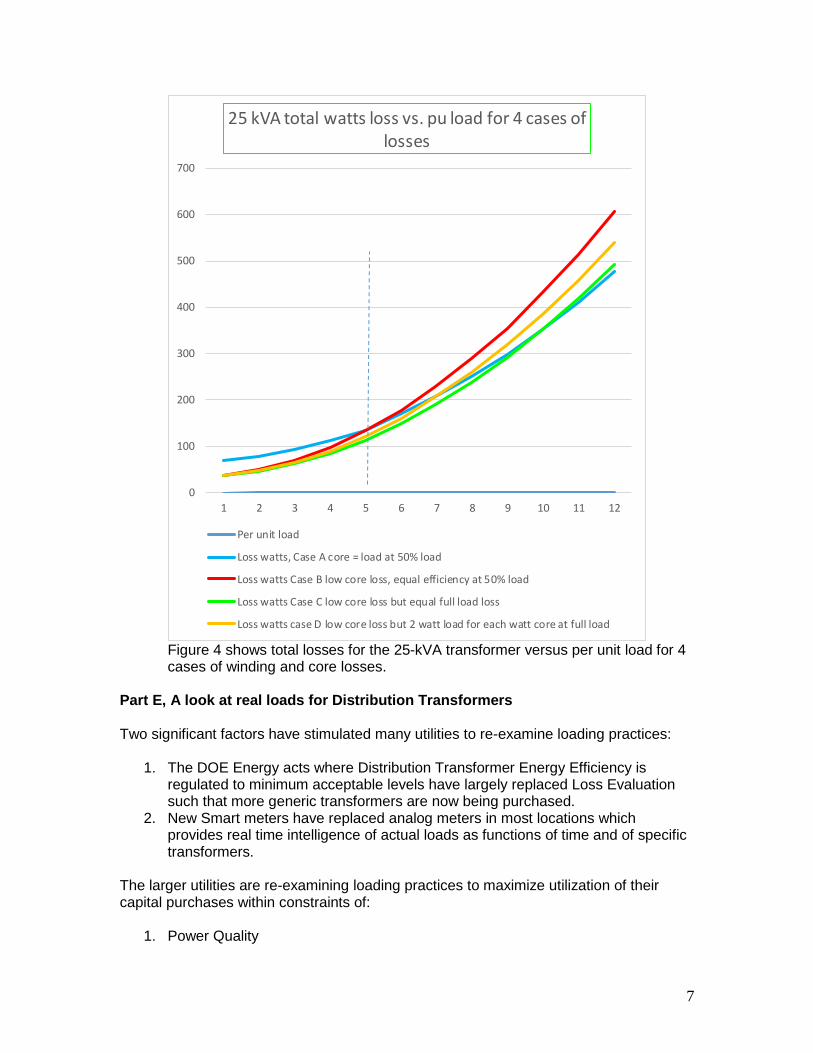
25 kVA total watts loss vs. pu load for 4 cases of losses
Per unit load
Loss watts, Case A core = load at 50% load
Loss watts Case B low core loss, equal efficiency at 50% load
Loss watts Case C low core loss but equal full load loss
Loss watts case D low core loss but 2 watt load for each watt core at full load
Figure 4 shows total losses for the 25-kVA transformer versus per unit load for 4 cases of winding and core losses.
Part E, A look at real loads for Distribution Transformers Two significant factors have stimulated many utilities to re-examine loading practices:
1. The DOE Energy acts where Distribution Transformer Energy Efficiency is regulated to minimum acceptable levels have largely replaced Loss Evaluation such that more generic transformers are now being purchased.
2. New Smart meters have replaced analog meters in most locations which provides real time intelligence of actual loads as functions of time and of specific transformers.
The larger utilities are re-examining loading practices to maximize utilization of their capital purchases within constraints of:
1. Power Quality
8
2. Temperature rise and thermal life 3. Voltage regulation limits
Pacific Gas and Electric is the first large utility to share some of their data. It is organized by rate class, transformer type, power level, and basic application. A snapshot of their 2006 calendar year had data collected in one hour increments over all 8760 hours of the year. For the residential overhead group and particularly for the 25 kVA (North America’s most popular pole type transformer) the peak load can hit 120% of the nameplate kVA rating or effectively 30 kVA during each load cycle. The simple average load factor of the yearly load cycle was 39.6% of the load cycle but the RMS equivalent load was 49% of the nameplate 25 kVA rating. Interestingly, other rate classes had higher percent loadings which suggests that this needs more investigation. An IEEE Transformers Committee Task Force is currently working to gather more information on loadings at all regions of the country and into many more transformer types. Part F. Early Take-away’s from loading study investigations to date
1. Distribution transformer loading is likely to be variable at most regions of the country. Some will have loading > 50% of nameplate kVA and some will have loading < 50% of nameplate kVA.
2. Distribution transformers are generally treated as commodity items by utilities and stocked for general application and not for specific installations. This means that specific load cycles cannot be precisely predetermined. However, population centers show evidence of high loading while rural areas may have lower loading.
3. Factually, since large numbers of such transformers are purchased each year and placed into stock, the actual installation of any of such transformers into specific locations is not predetermined. The transformer may serve residential loads or it may serve commercial or industrial loads.
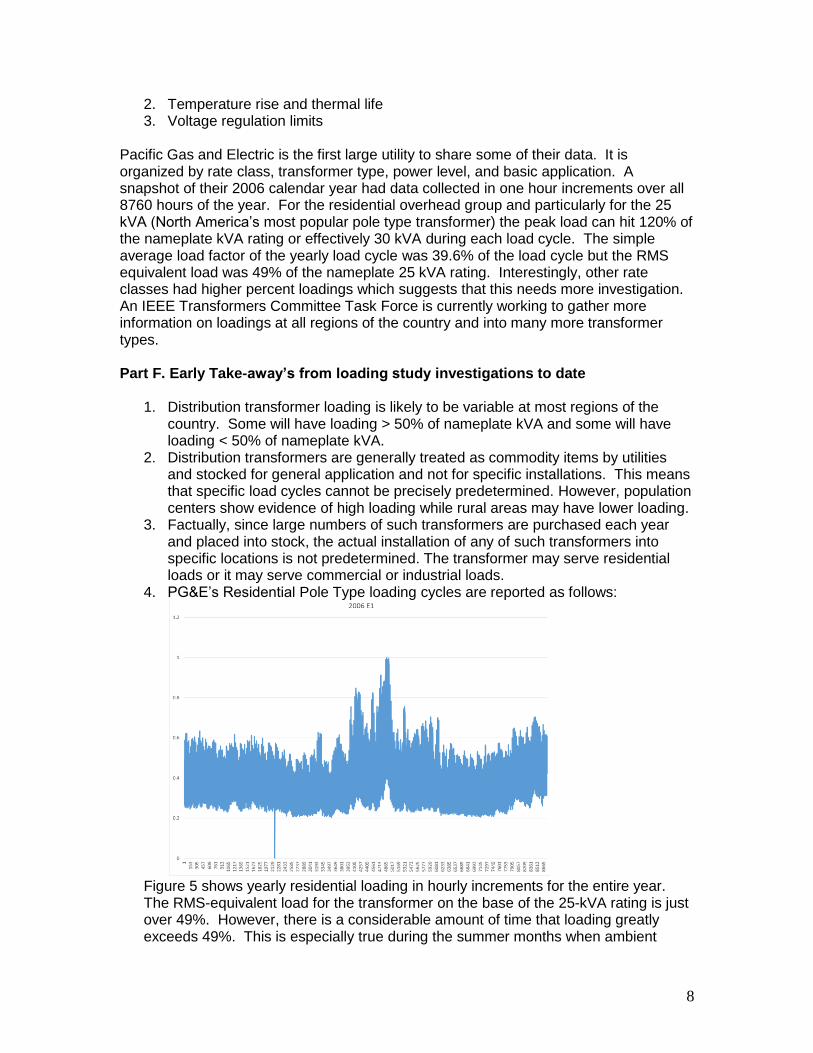
4. PG&E’s Residential Pole Type loading cycles are reported as follows:
Figure 5 shows yearly residential loading in hourly increments for the entire year. The RMS-equivalent load for the transformer on the base of the 25-kVA rating is just over 49%. However, there is a considerable amount of time that loading greatly exceeds 49%. This is especially true during the summer months when ambient

9
temperatures are highest. Here loading to 100% and in some cases to 120% have been recorded. 5. PG&E’s Commercial Segment Pole Type loading is reported as:
Figure 6 shows PG&E’s Commercial Segment Pole Type yearly load cycle in one hour increments. Note here, that RMS-equivalent loading is about 70% of nameplate with many excursions of 90 to 100% of nameplate.
6. PG&E’s summary for Pole Type Transformers is as follows
Figure 7 shows the load cycle peak versus rated overhead transformer kVA. Load factors then are computed against the load cycle peaks. Hence, if load factor is 40% it must be multiplied by the peak KVA to obtain the effective percent of transformer nameplate rating.

10
Figure 8 shows the equivalent installation practice for padmounted transformers. In each case, the peak of the load cycles are intended to exceed nameplate kVA. Load cycles and capabilities have also been established for subsurface and vault type transformers as well as Intertie transformers but I have not included them in this write-up for simplicity.
11
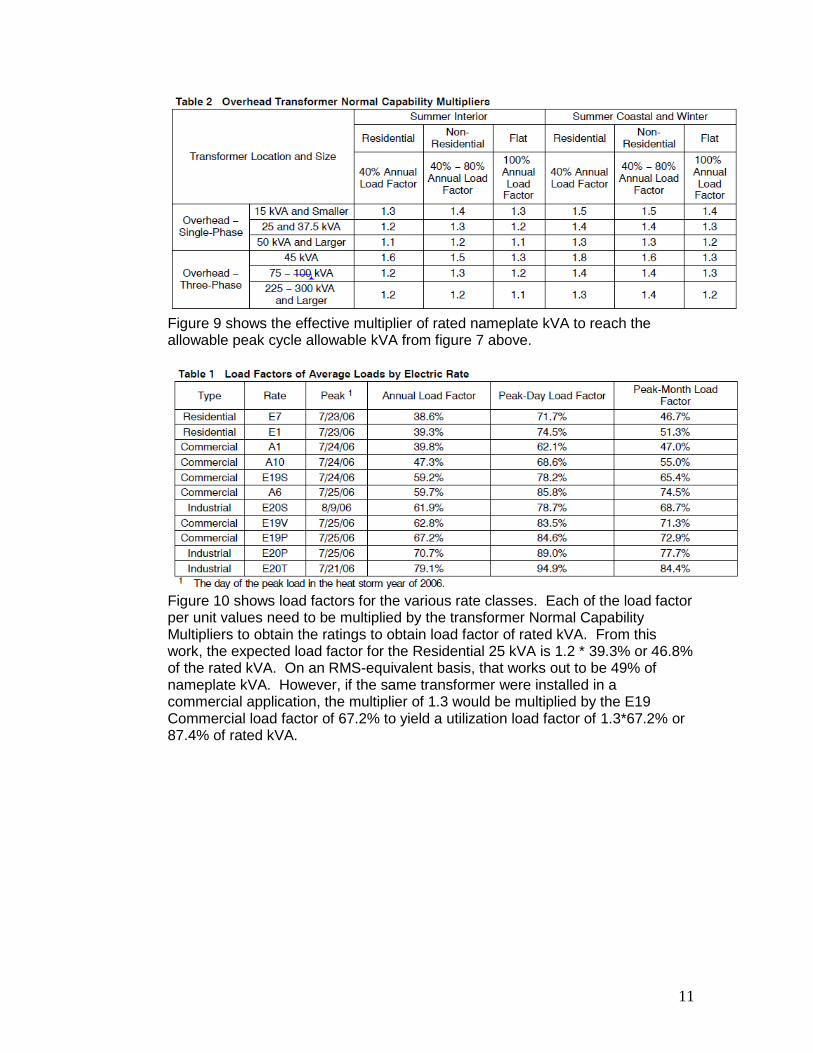
Figure 9 shows the effective multiplier of rated nameplate kVA to reach the allowable peak cycle allowable kVA from figure 7 above.
Figure 10 shows load factors for the various rate classes. Each of the load factor per unit values need to be multiplied by the transformer Normal Capability Multipliers to obtain the ratings to obtain load factor of rated kVA. From this work, the expected load factor for the Residential 25 kVA is 1.2 * 39.3% or 46.8% of the rated kVA. On an RMS-equivalent basis, that works out to be 49% of nameplate kVA. However, if the same transformer were installed in a commercial application, the multiplier of 1.3 would be multiplied by the E19 Commercial load factor of 67.2% to yield a utilization load factor of 1.3*67.2% or 87.4% of rated kVA.
12
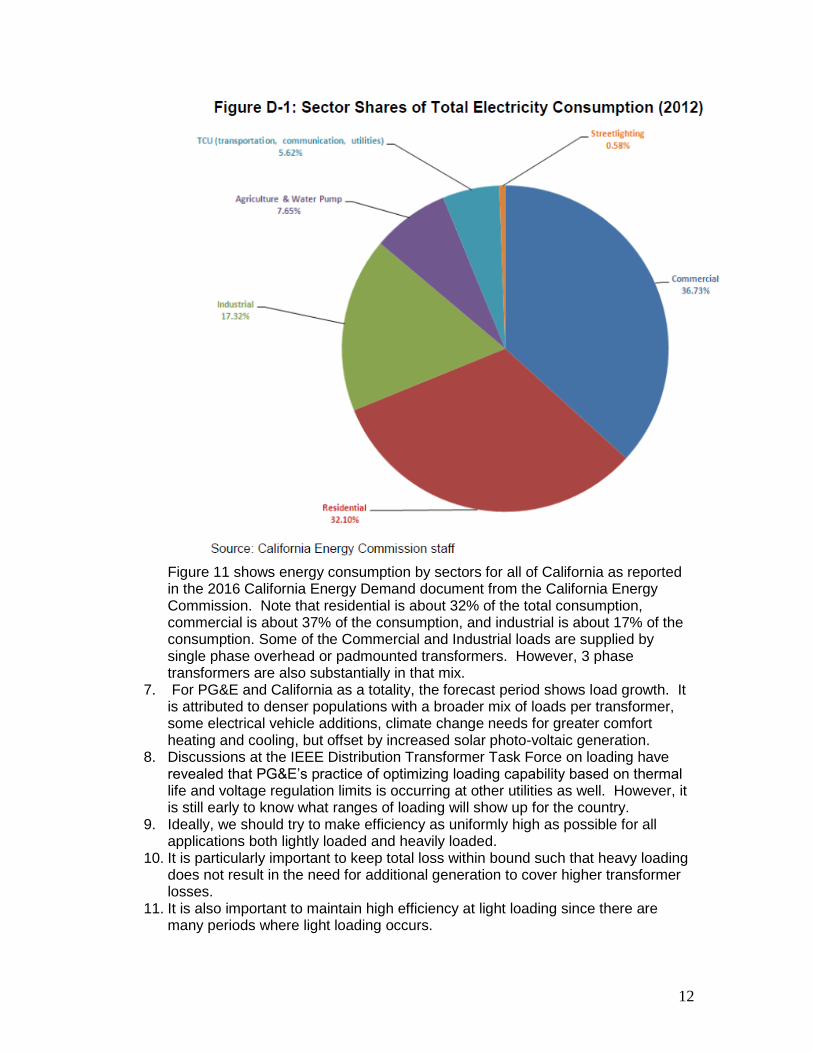
Figure 11 shows energy consumption by sectors for all of California as reported in the 2016 California Energy Demand document from the California Energy Commission. Note that residential is about 32% of the total consumption, commercial is about 37% of the consumption, and industrial is about 17% of the consumption. Some of the Commercial and Industrial loads are supplied by single phase overhead or padmounted transformers. However, 3 phase transformers are also substantially in that mix.
7. For PG&E and California as a totality, the forecast period shows load growth. It is attributed to denser populations with a broader mix of loads per transformer, some electrical vehicle additions, climate change needs for greater comfort heating and cooling, but offset by increased solar photo-voltaic generation.
8. Discussions at the IEEE Distribution Transformer Task Force on loading have revealed that PG&E’s practice of optimizing loading capability based on thermal life and voltage regulation limits is occurring at other utilities as well. However, it is still early to know what ranges of loading will show up for the country.
9. Ideally, we should try to make efficiency as uniformly high as possible for all applications both lightly loaded and heavily loaded.
10. It is particularly important to keep total loss within bound such that heavy loading does not result in the need for additional generation to cover higher transformer losses.
11. It is also important to maintain high efficiency at light loading since there are many periods where light loading occurs.

13
12. The trade-off allowing each watt savings of core loss to be added to one watt increase of full load loss with no net increase in rated kVA total loss appears most able to meet the DOE’s energy objectives.
Recommendation Look closely at adding this total loss constraint to both the DOE requirements as well as the requirement to receive EPA Energy Star listing. It maintains continuity of the past excellent investigative work and prepares for wide ranges of transformer loading that may be present across the country now in the foreseeable future.
Philip J Hopkinson Philip J Hopkinson, PE
President & CEO HVOLT Inc.