John Culver PACIFIC 21 years Mark Ring GLOBAL RETAIL OPERATIONS SERVICES AND PARTNER DIGITAL...
19
John Culver group president, Global Retail
Transcript of John Culver PACIFIC 21 years Mark Ring GLOBAL RETAIL OPERATIONS SERVICES AND PARTNER DIGITAL...
John Culvergroup president, Global Retail
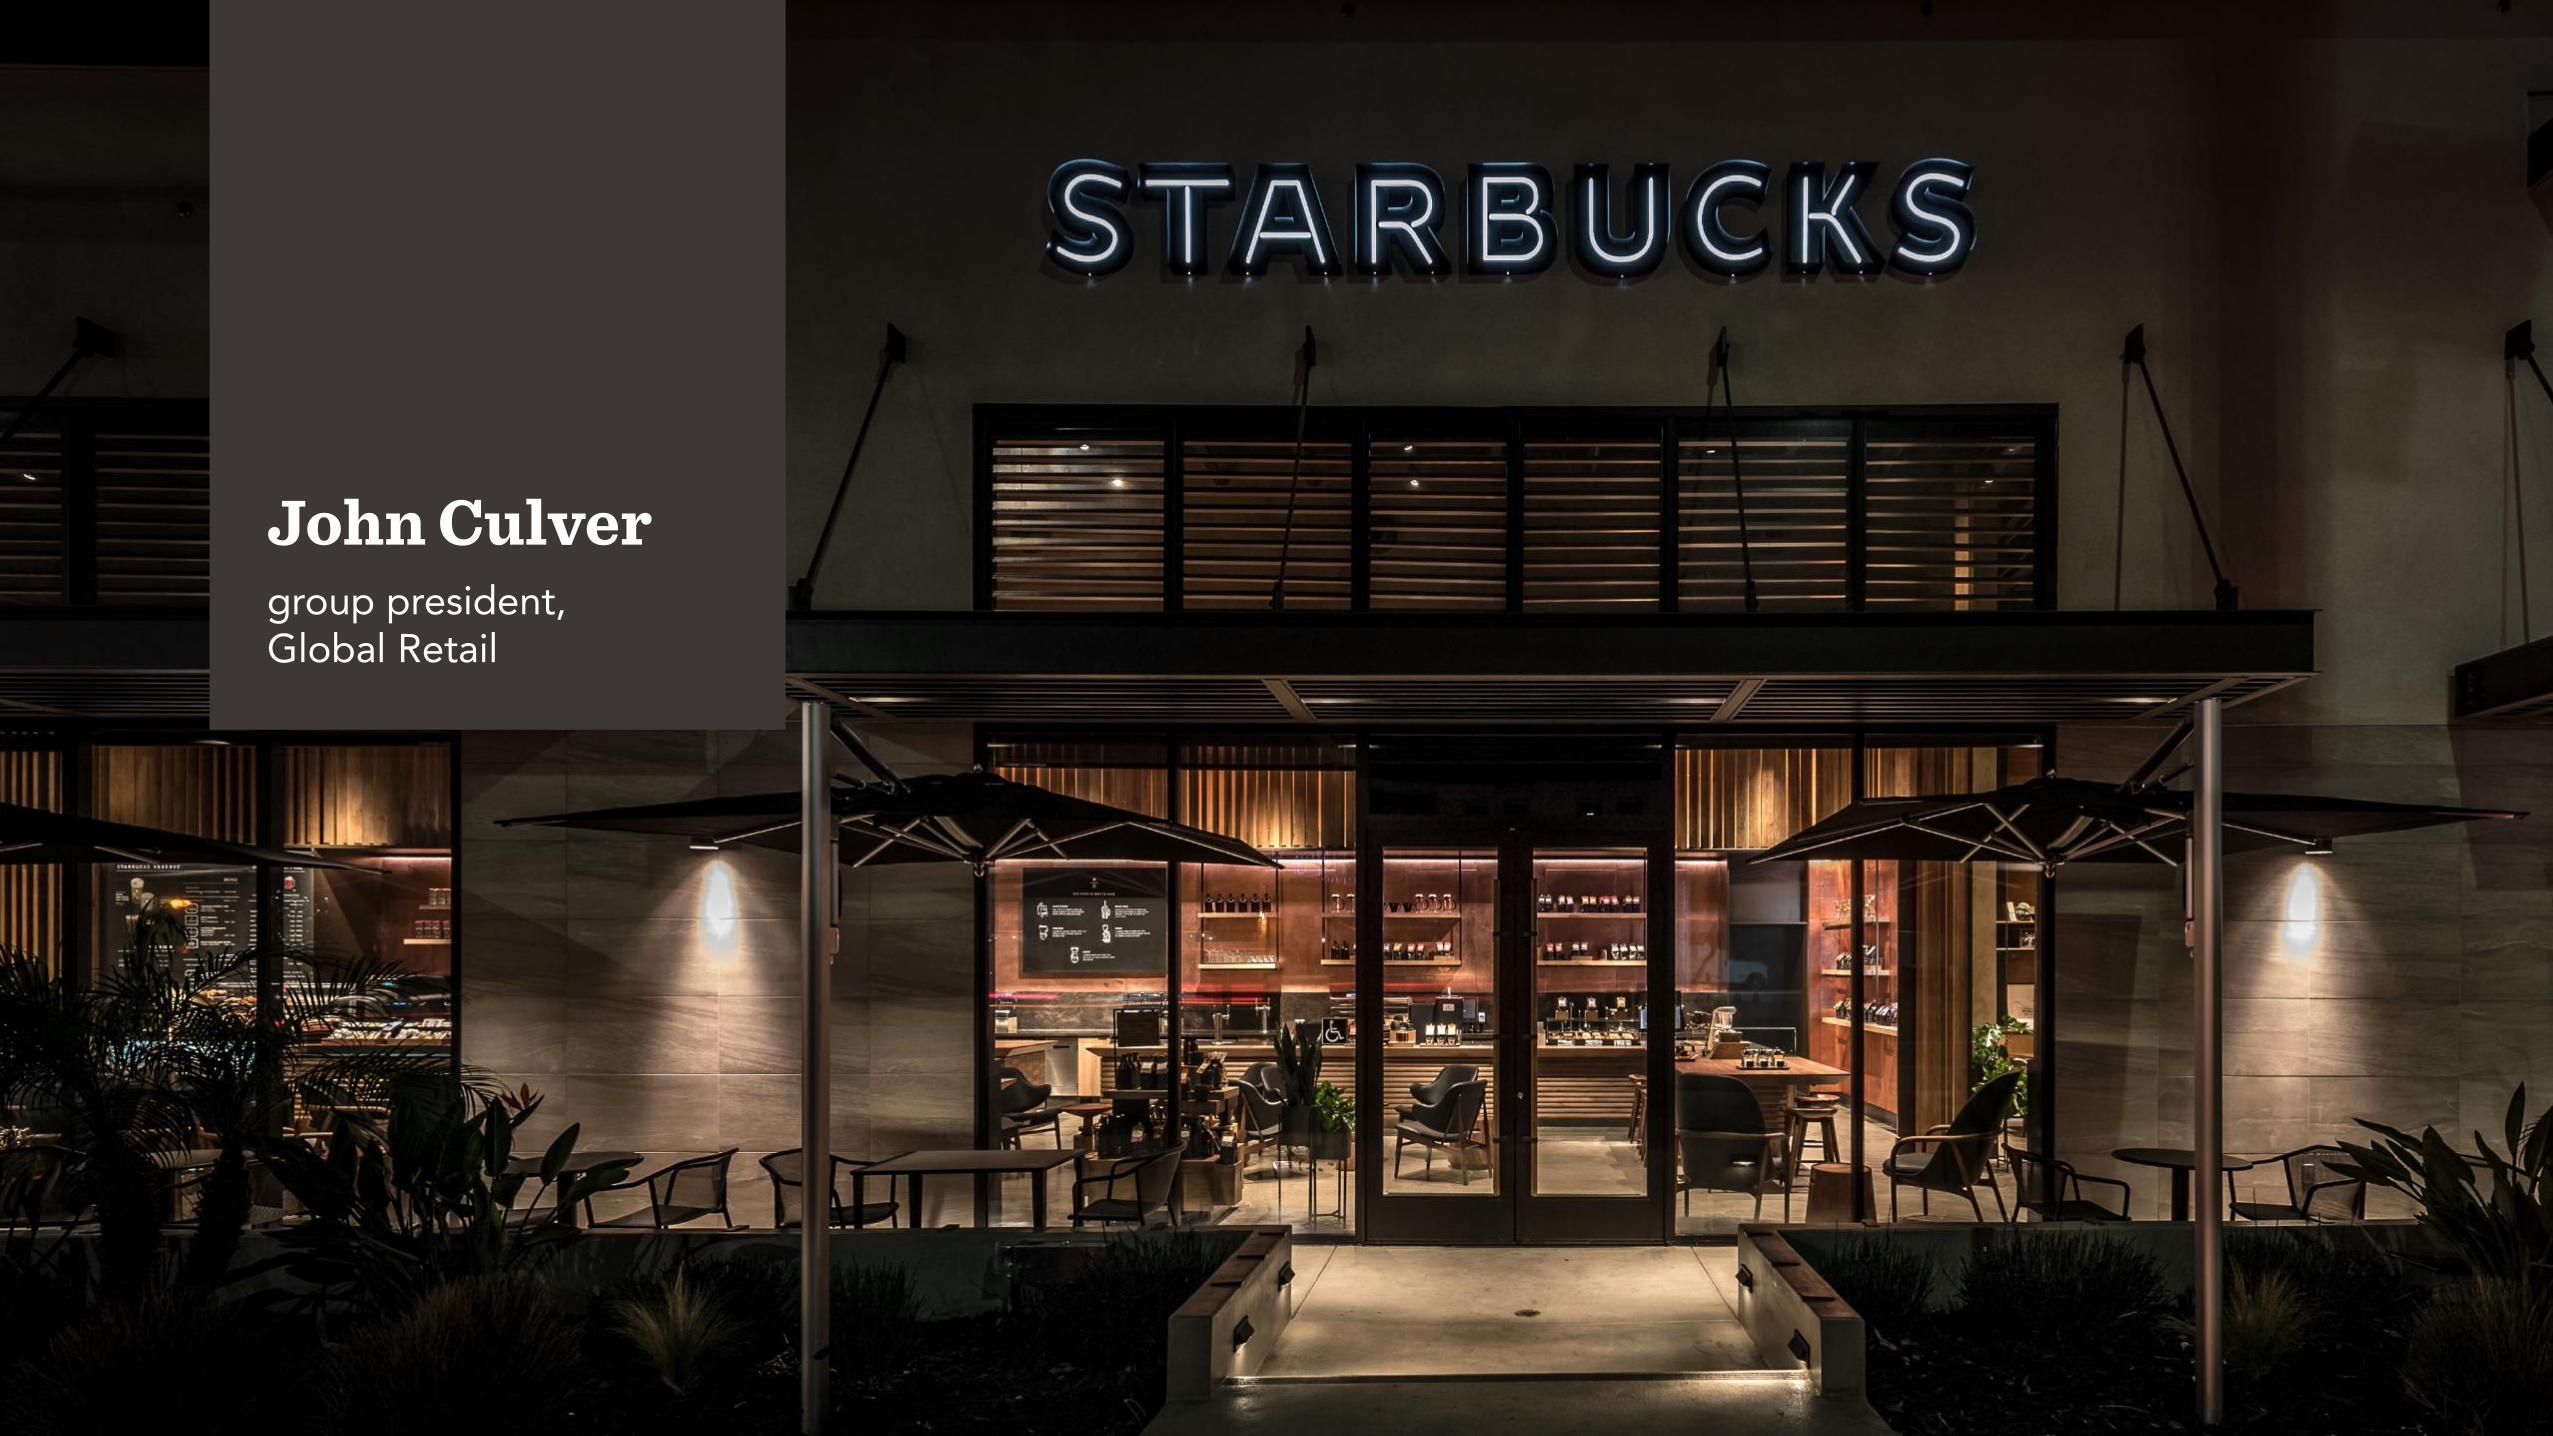
Starbucks has delivered strong growth globally
19,344 24,692
FY13 FY16
$13.0 $18.5
FY13 FY16
CONSOLIDATED REVENUEUSD BILLIONS
STORE COUNTOPERATING MARGINPERCENT OF REVENUE
$2.8 $4.4
FY13 FY16
OPERATING INCOMEUSD BILLIONS
21%
24%
FY13 FY16
CAGR 12% CAGR 17%
CAGR 8%
GLOBAL RETAIL
FY16 operating results are non-GAAP measures. FY16 operating results exclude the impact of the 53rd week in Q4. A reconciliation of GAAP to non-GAAP measures can be found at the end of the CFO presentation.
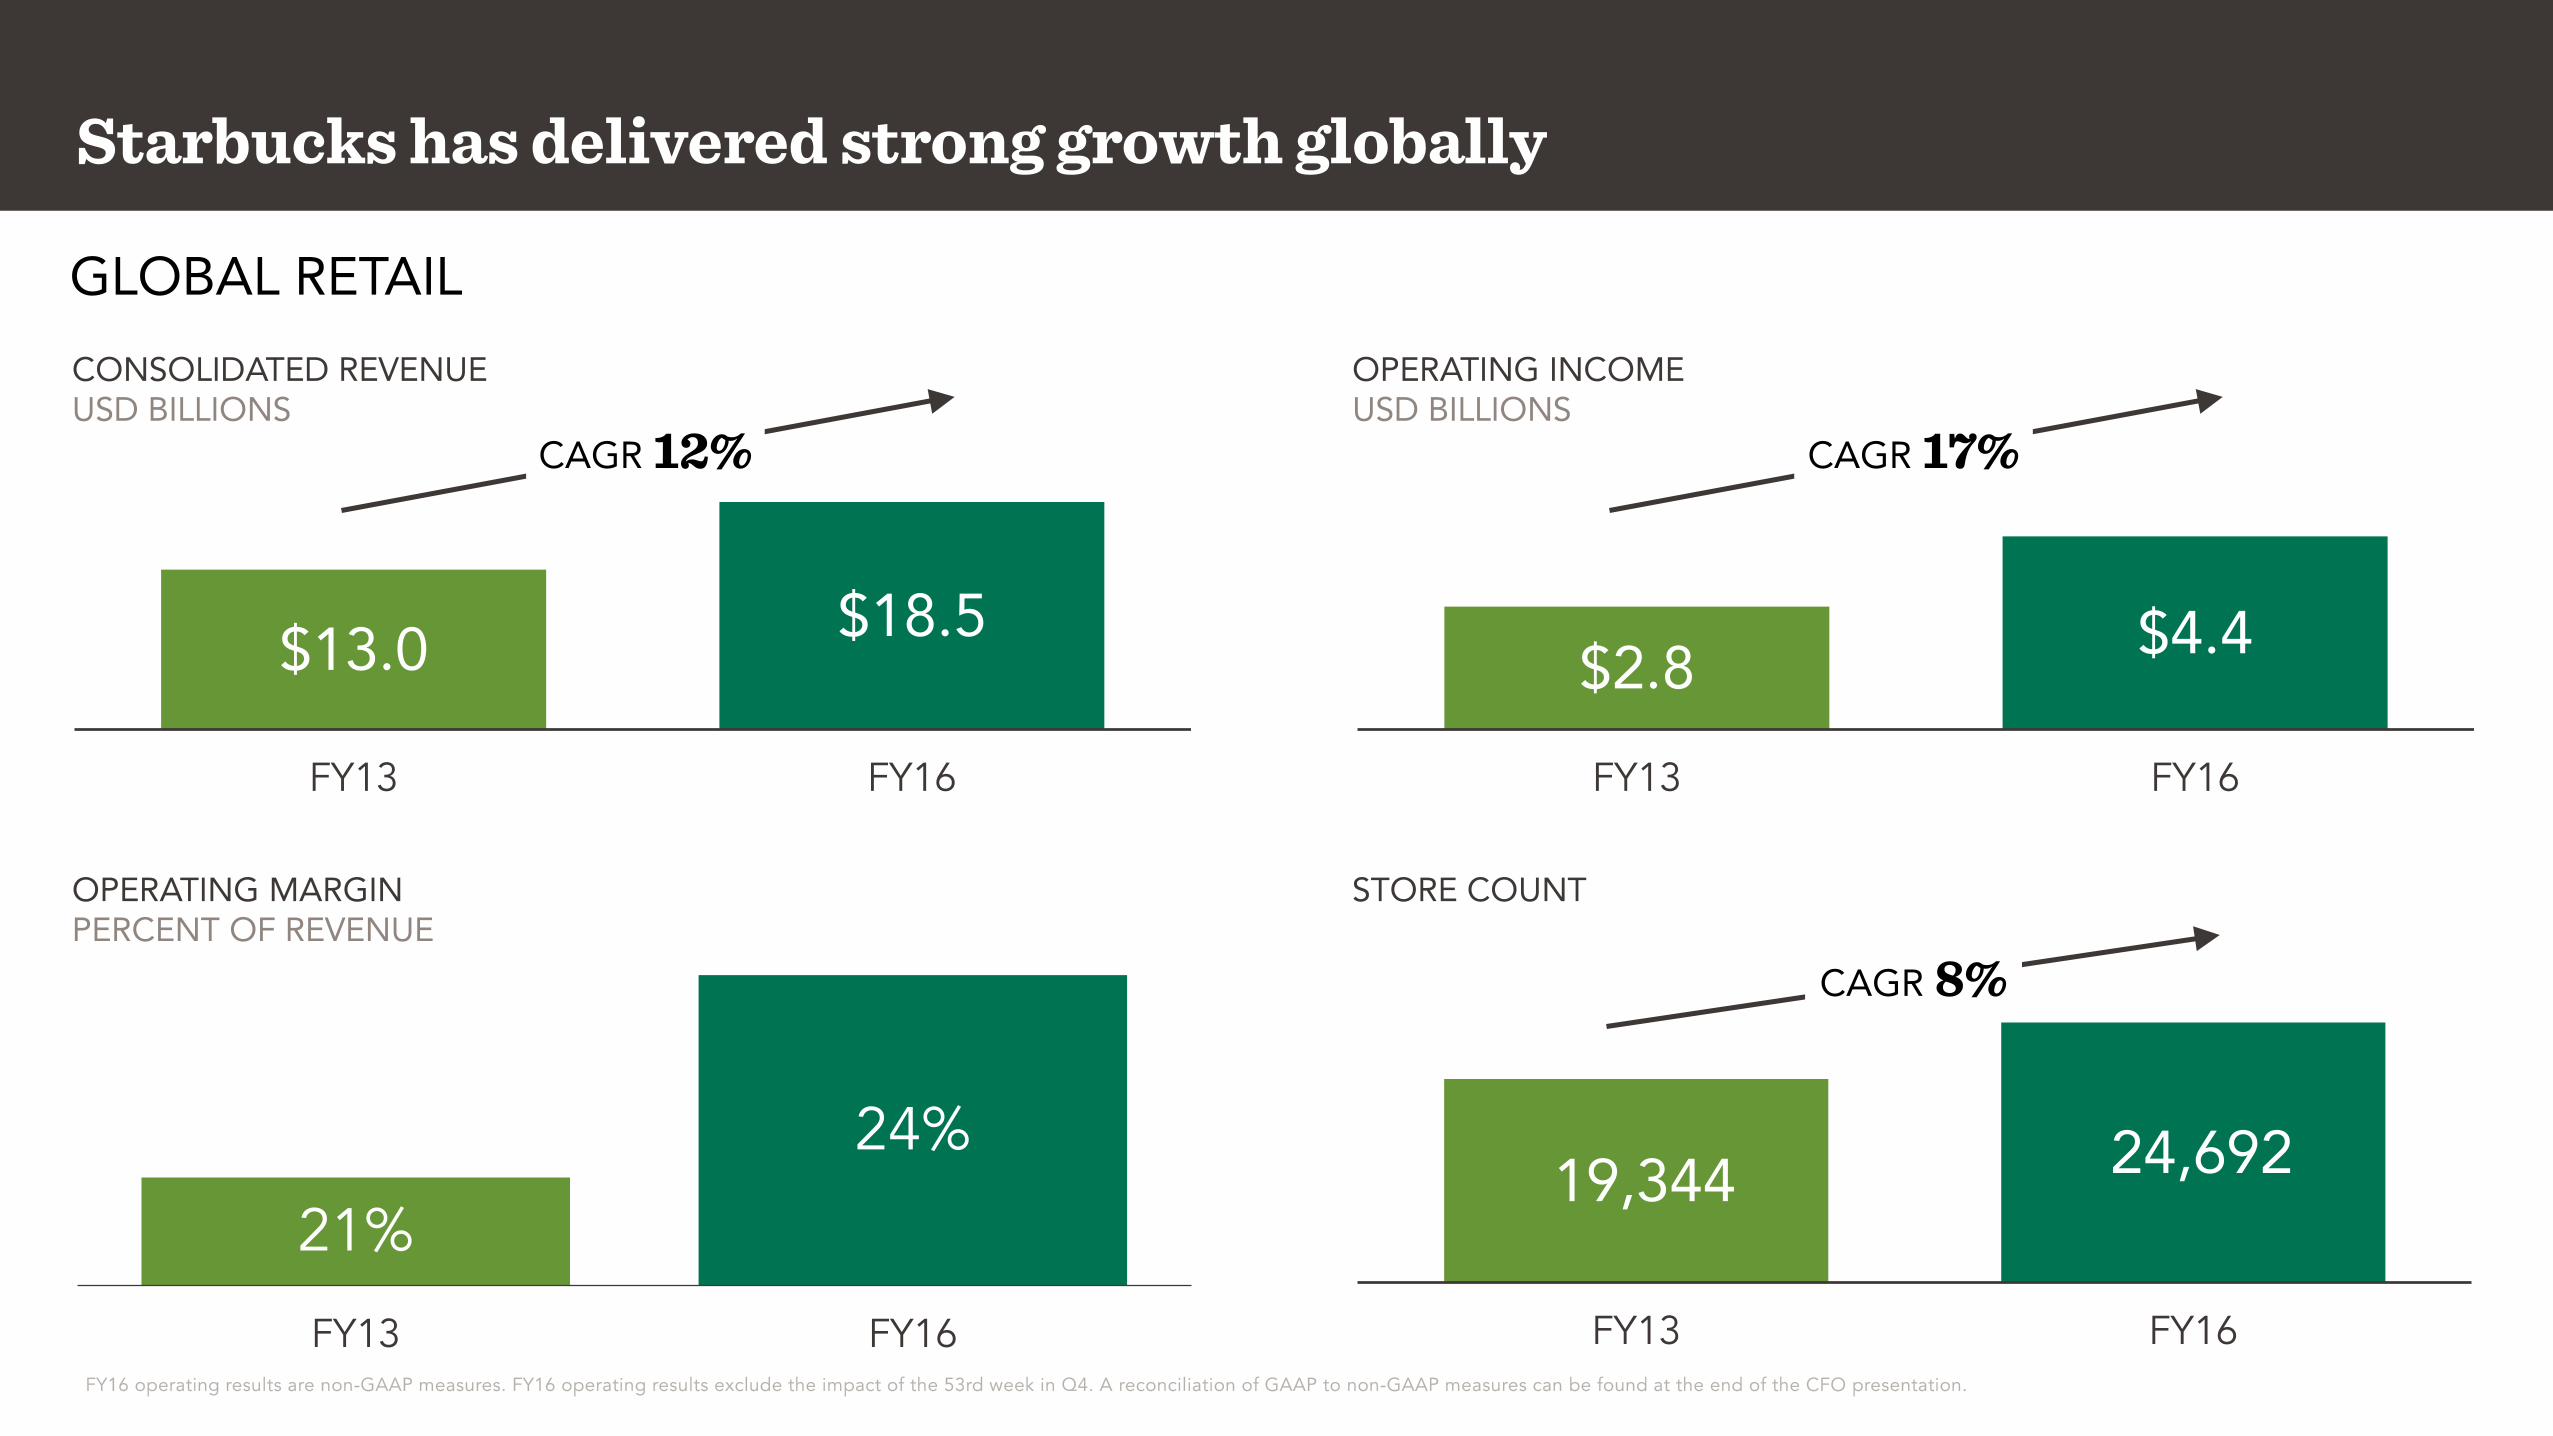
U.S. CHINA JAPAN
Store portfolio FY16
Store count 7,880 1,272 1,140
Average unit volume (1) $1.6M $0.8M $1.4M
Store cash profit %(2) 31% 34% 26%New stores FY16 age class
Year 1 AUV (1) $1.5M $0.7M $1.4M
Year 1 cash profit % (2) 34% 35% 27%
ROI (3) 75% 73% 46%
Profitable store growth around the world
Includes Company Operated Stores only; FY16 age class performance is based on latest year 1 projections(1) Non-US AUV's converted to USD using Sept month end FX rates(2) Cash profit is pre-tax and is represented as store level profit excluding depreciation and non-cash rent (in local currency)(3) ROI is calculated as total cash profit (pre-tax) over total investment (in local currency)
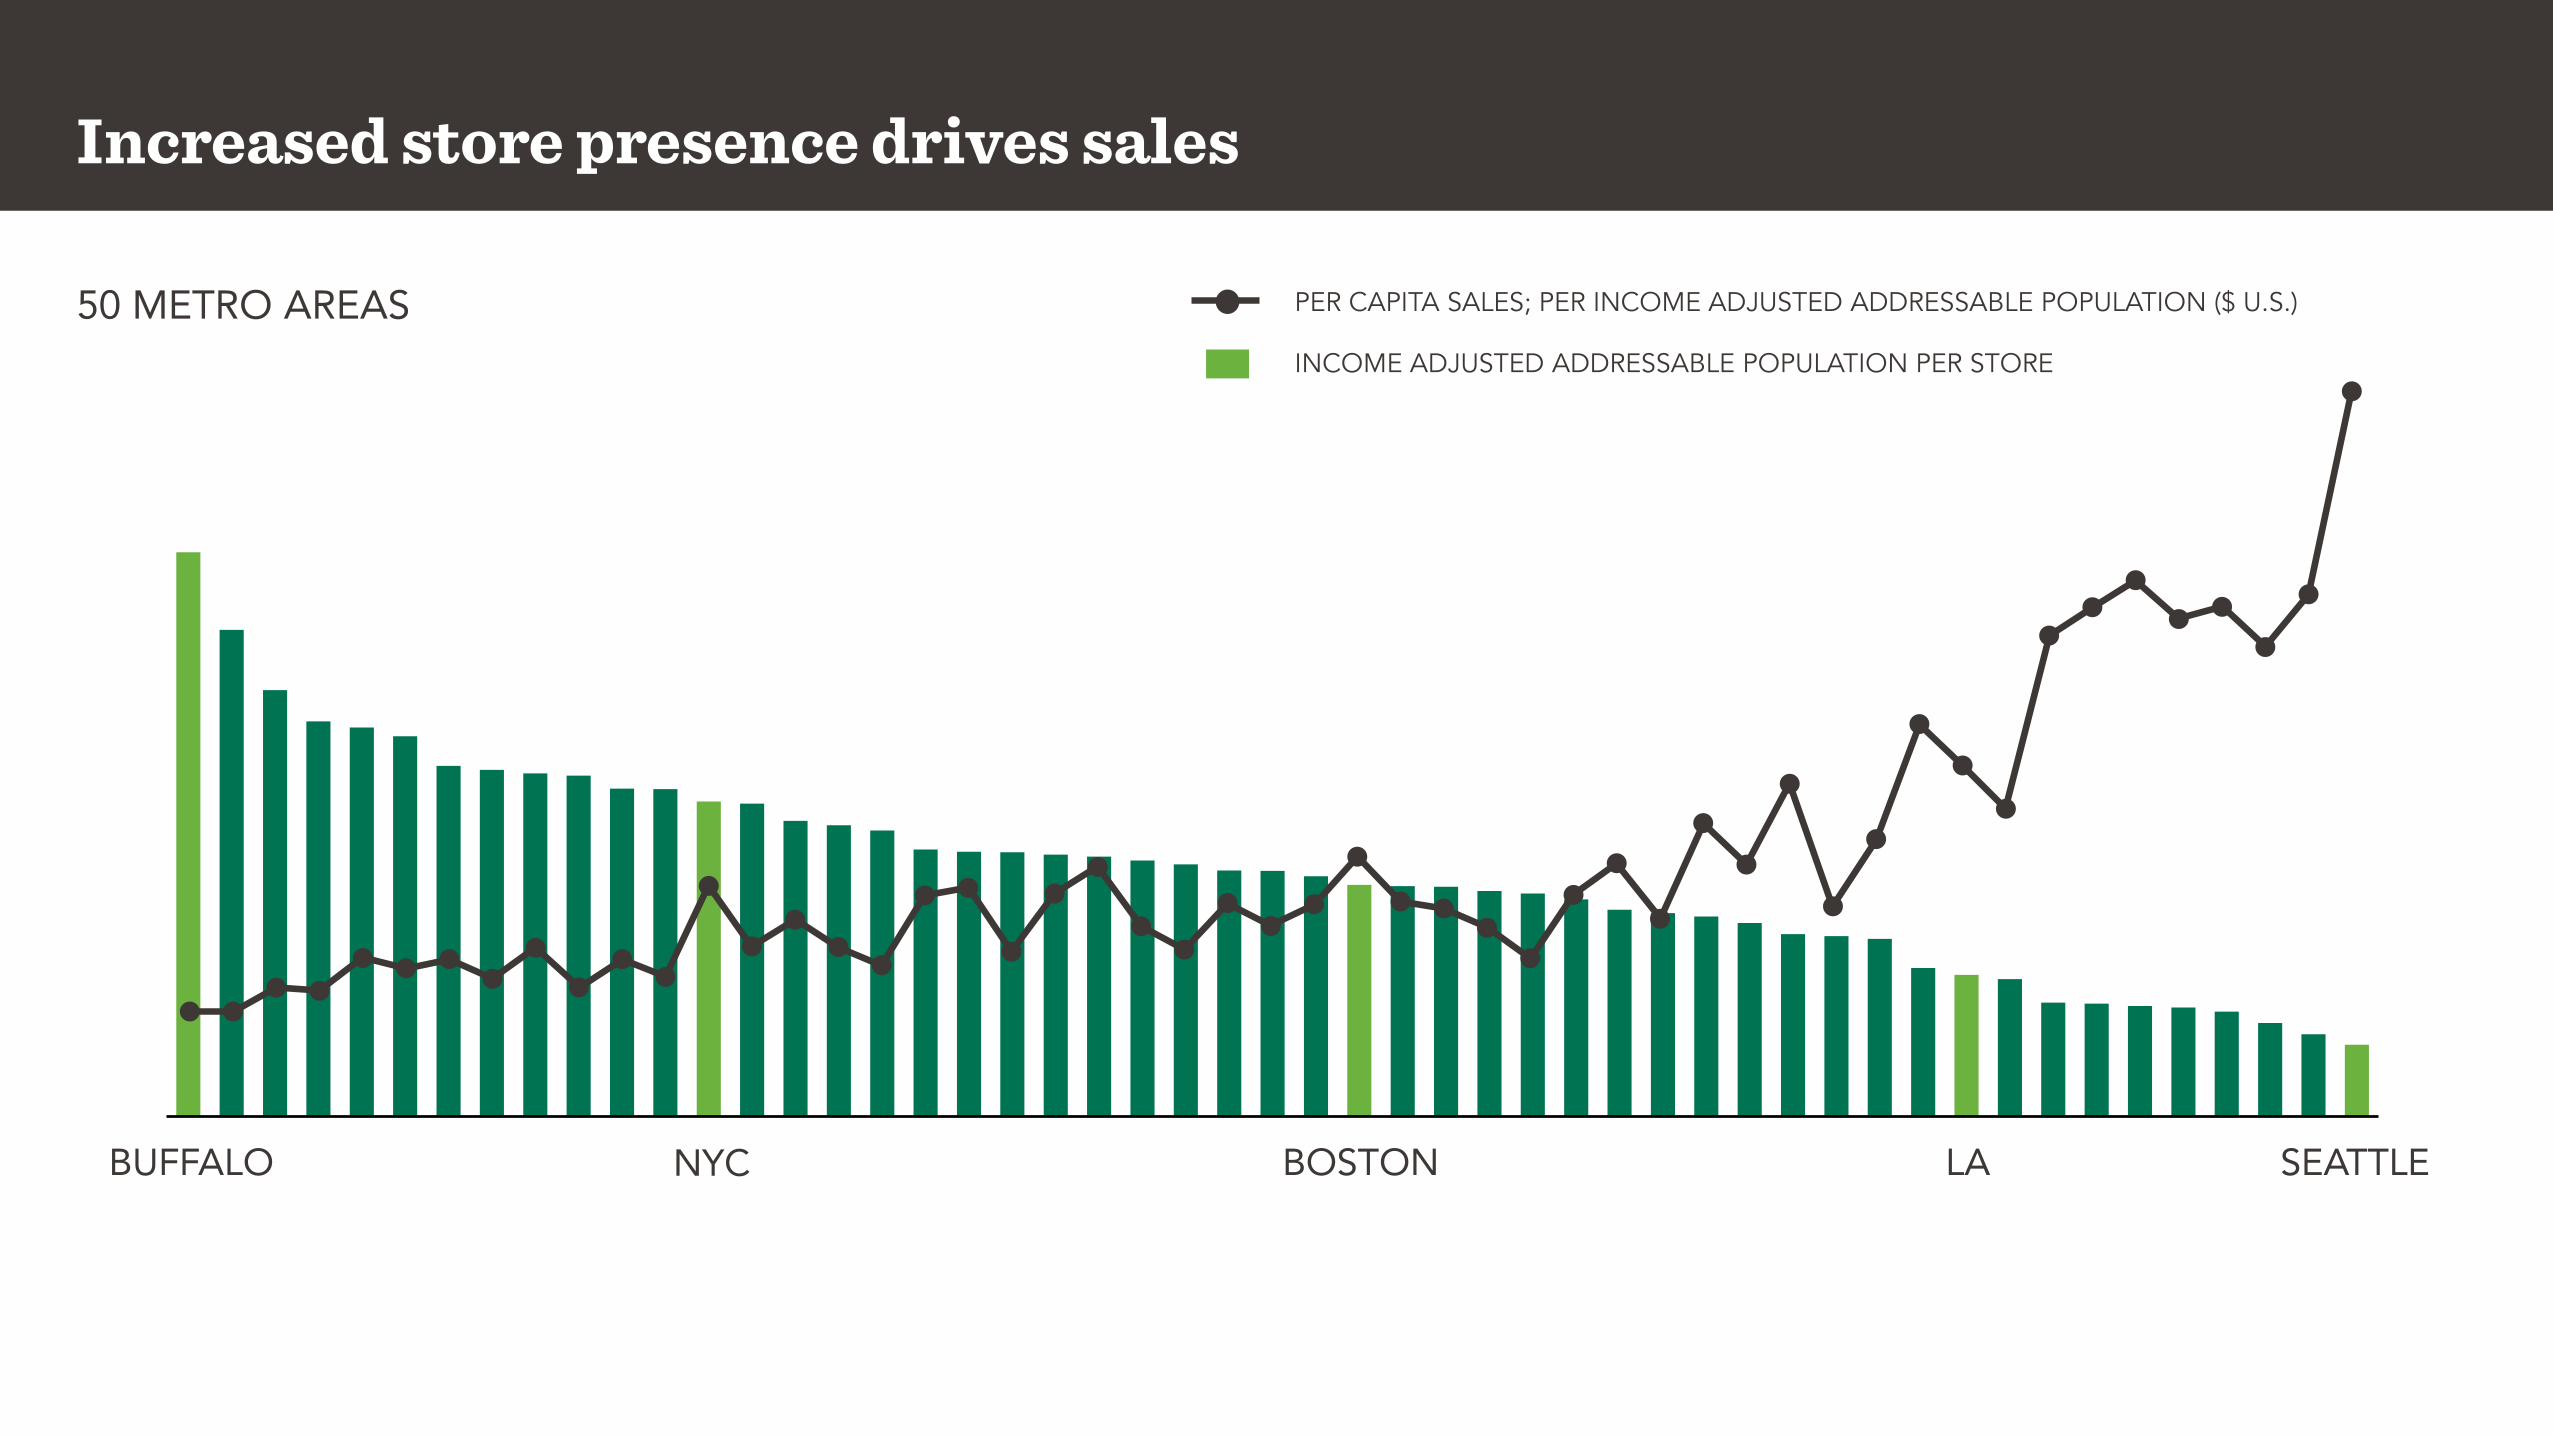
SEATTLELABOSTONNYCBUFFALO
Increased store presence drives sales
50 METRO AREASINCOME ADJUSTED ADDRESSABLE POPULATION PER STORE
PER CAPITA SALES; PER INCOME ADJUSTED ADDRESSABLE POPULATION ($ U.S.)
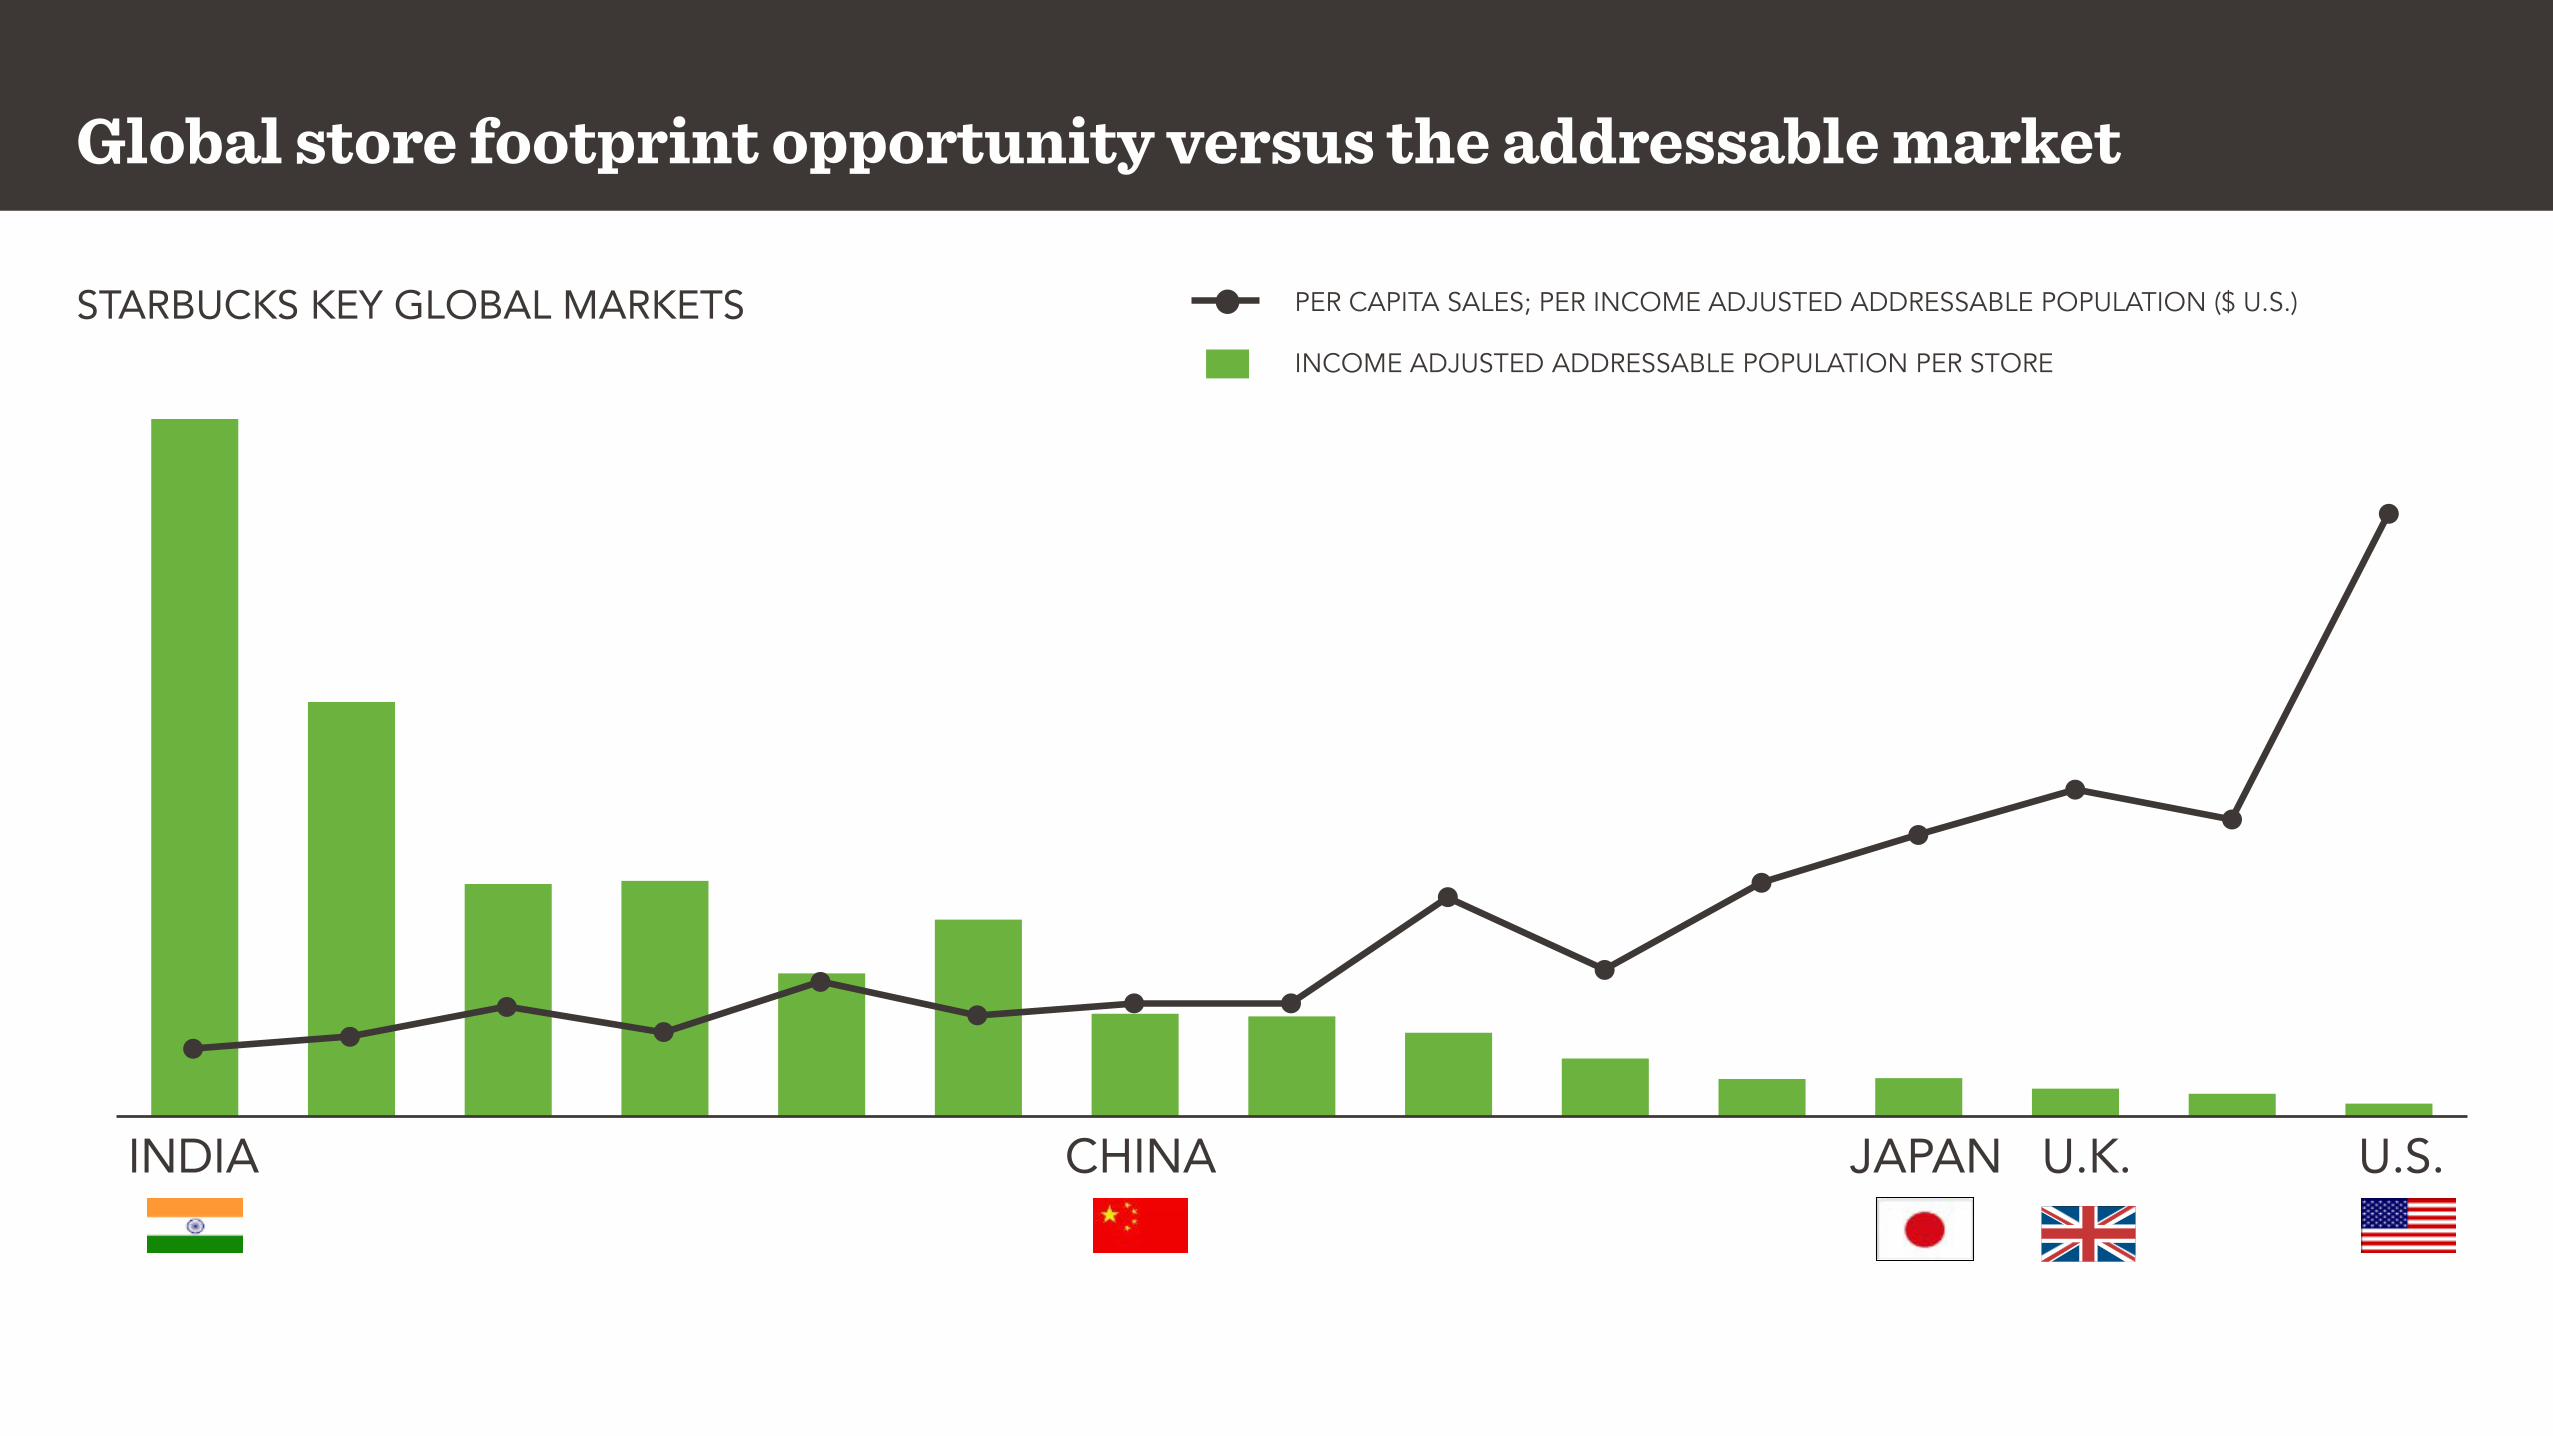
Global store footprint opportunity versus the addressable market
U.K.JAPAN U.S.CHINAINDIA
STARBUCKS KEY GLOBAL MARKETSINCOME ADJUSTED ADDRESSABLE POPULATION PER STORE
PER CAPITA SALES; PER INCOME ADJUSTED ADDRESSABLE POPULATION ($ U.S.)
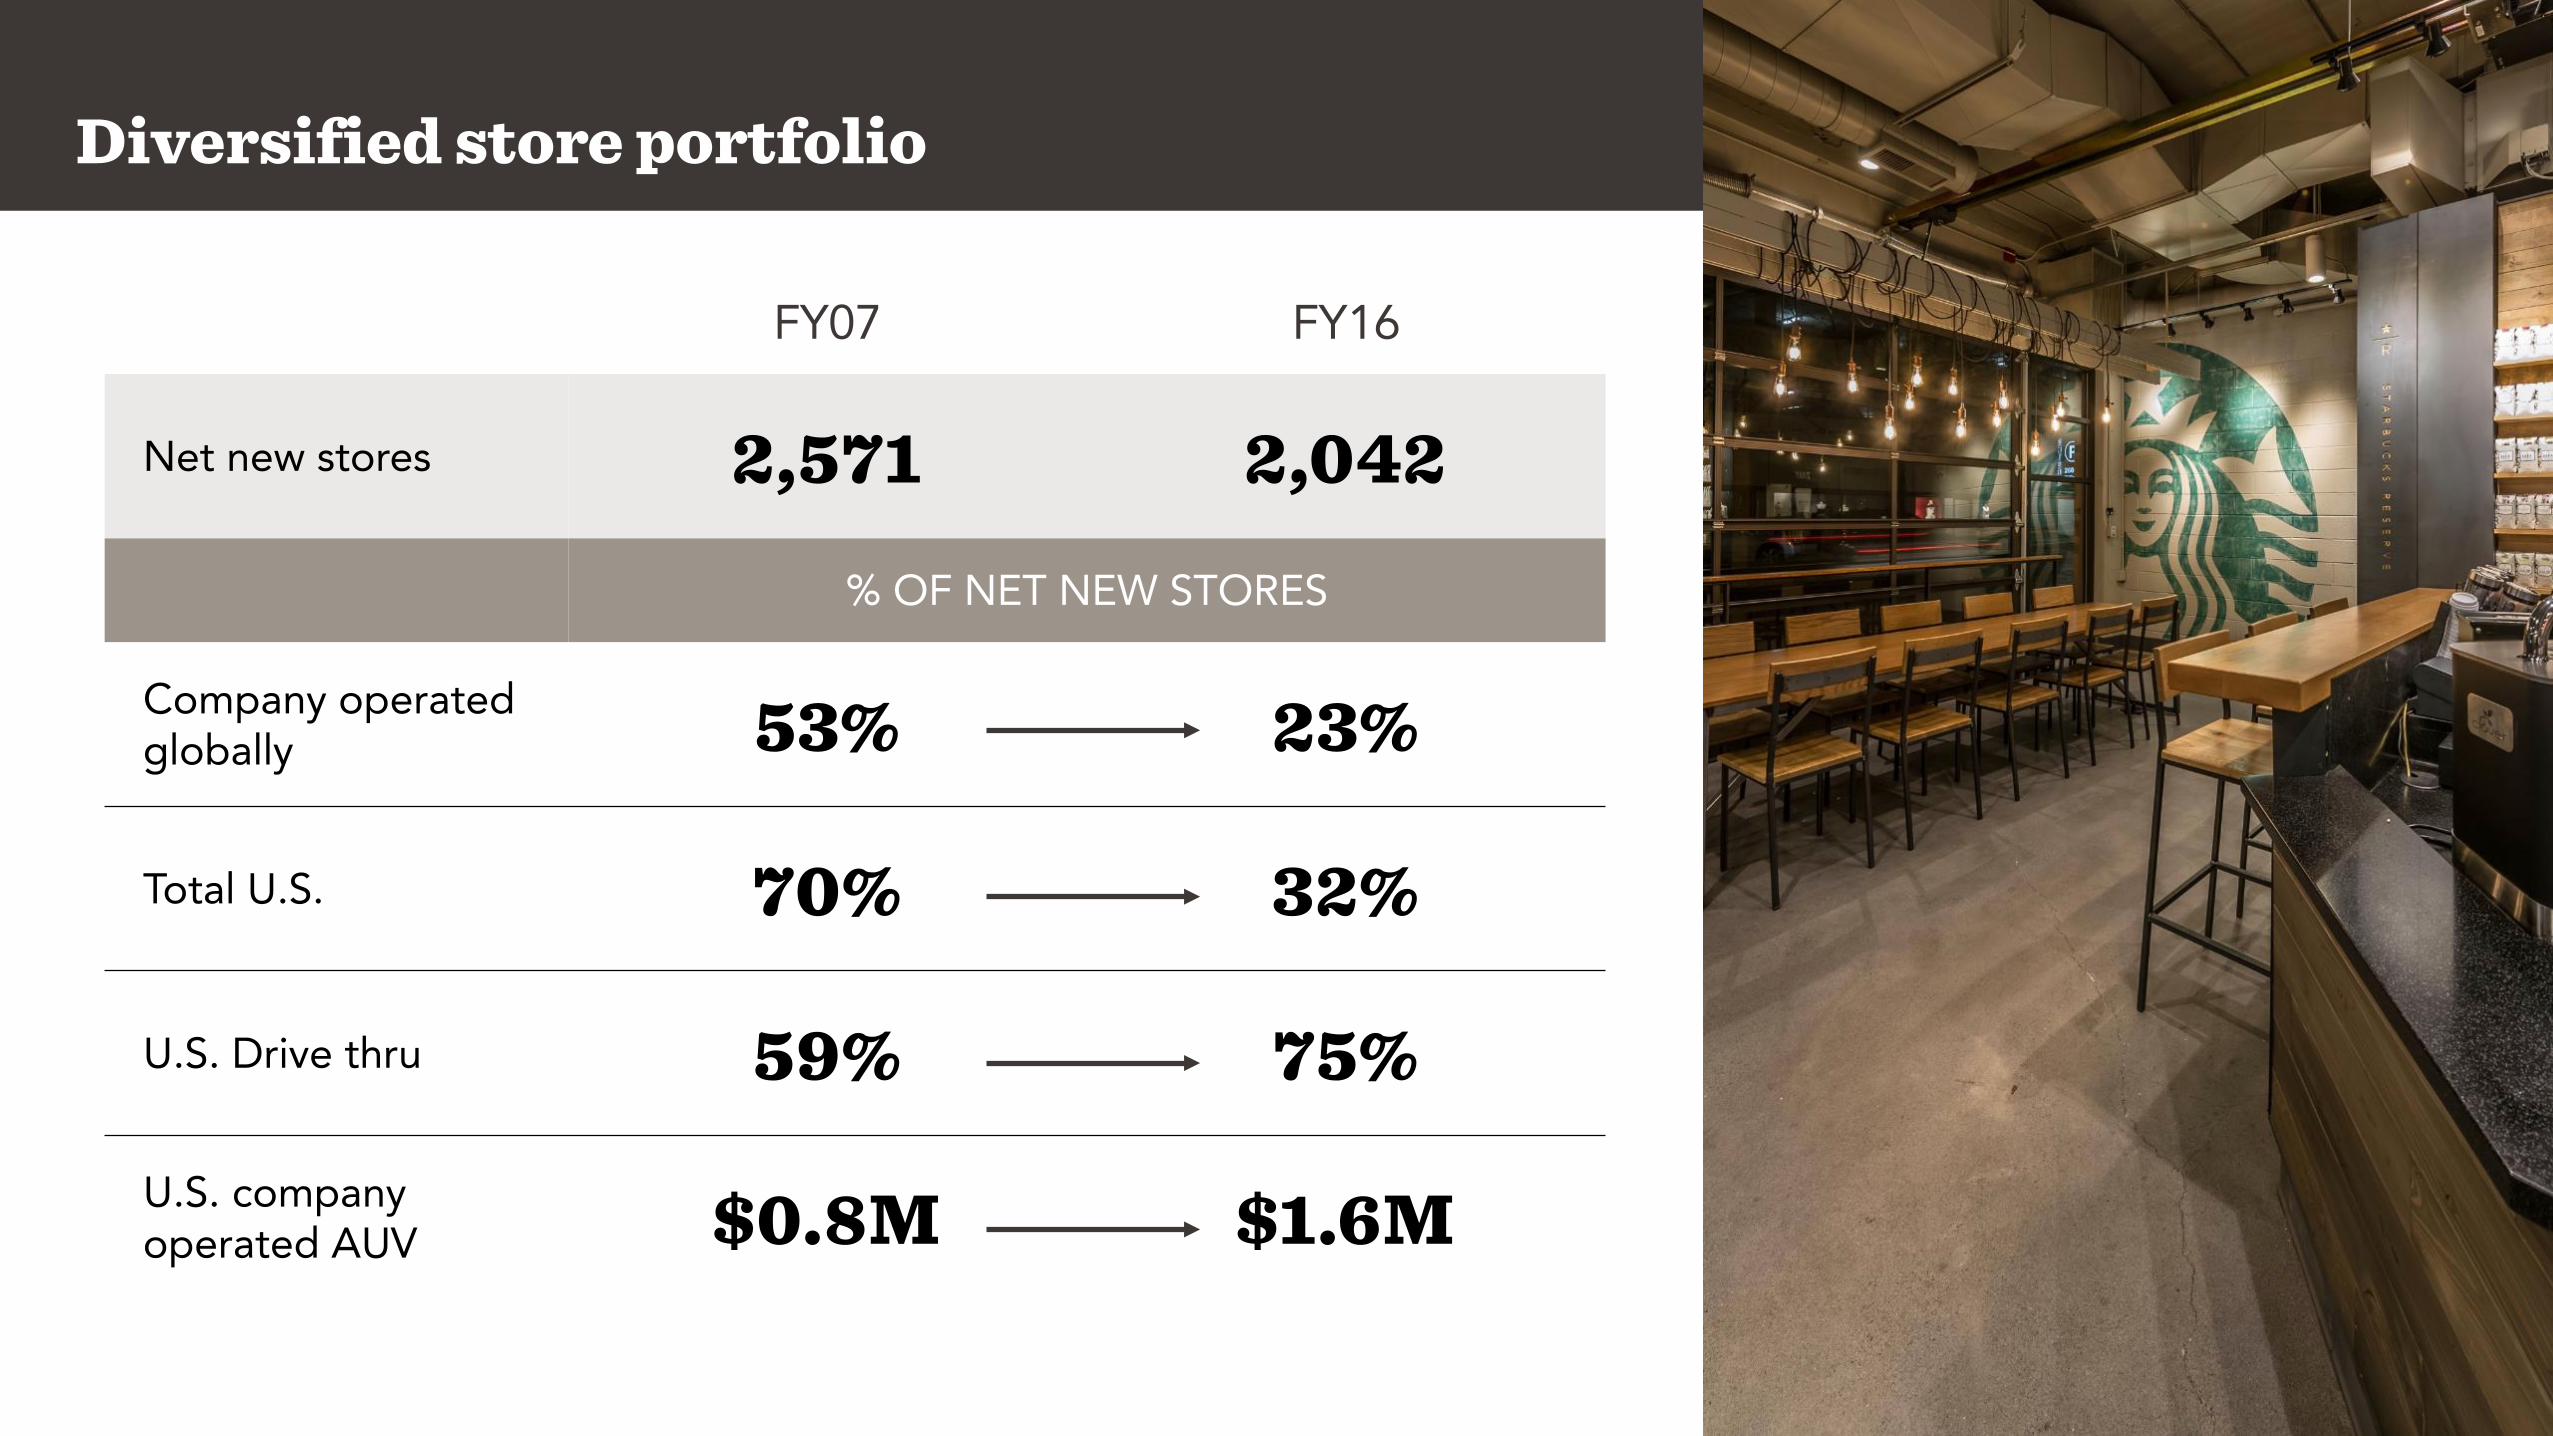
Diversified store portfolio
FY07 FY16
Net new stores 2,571 2,042
% OF NET NEW STORES
Company operated globally 53% 23%
Total U.S. 70% 32%
U.S. Drive thru 59% 75%
U.S. company operated AUV $0.8M $1.6M
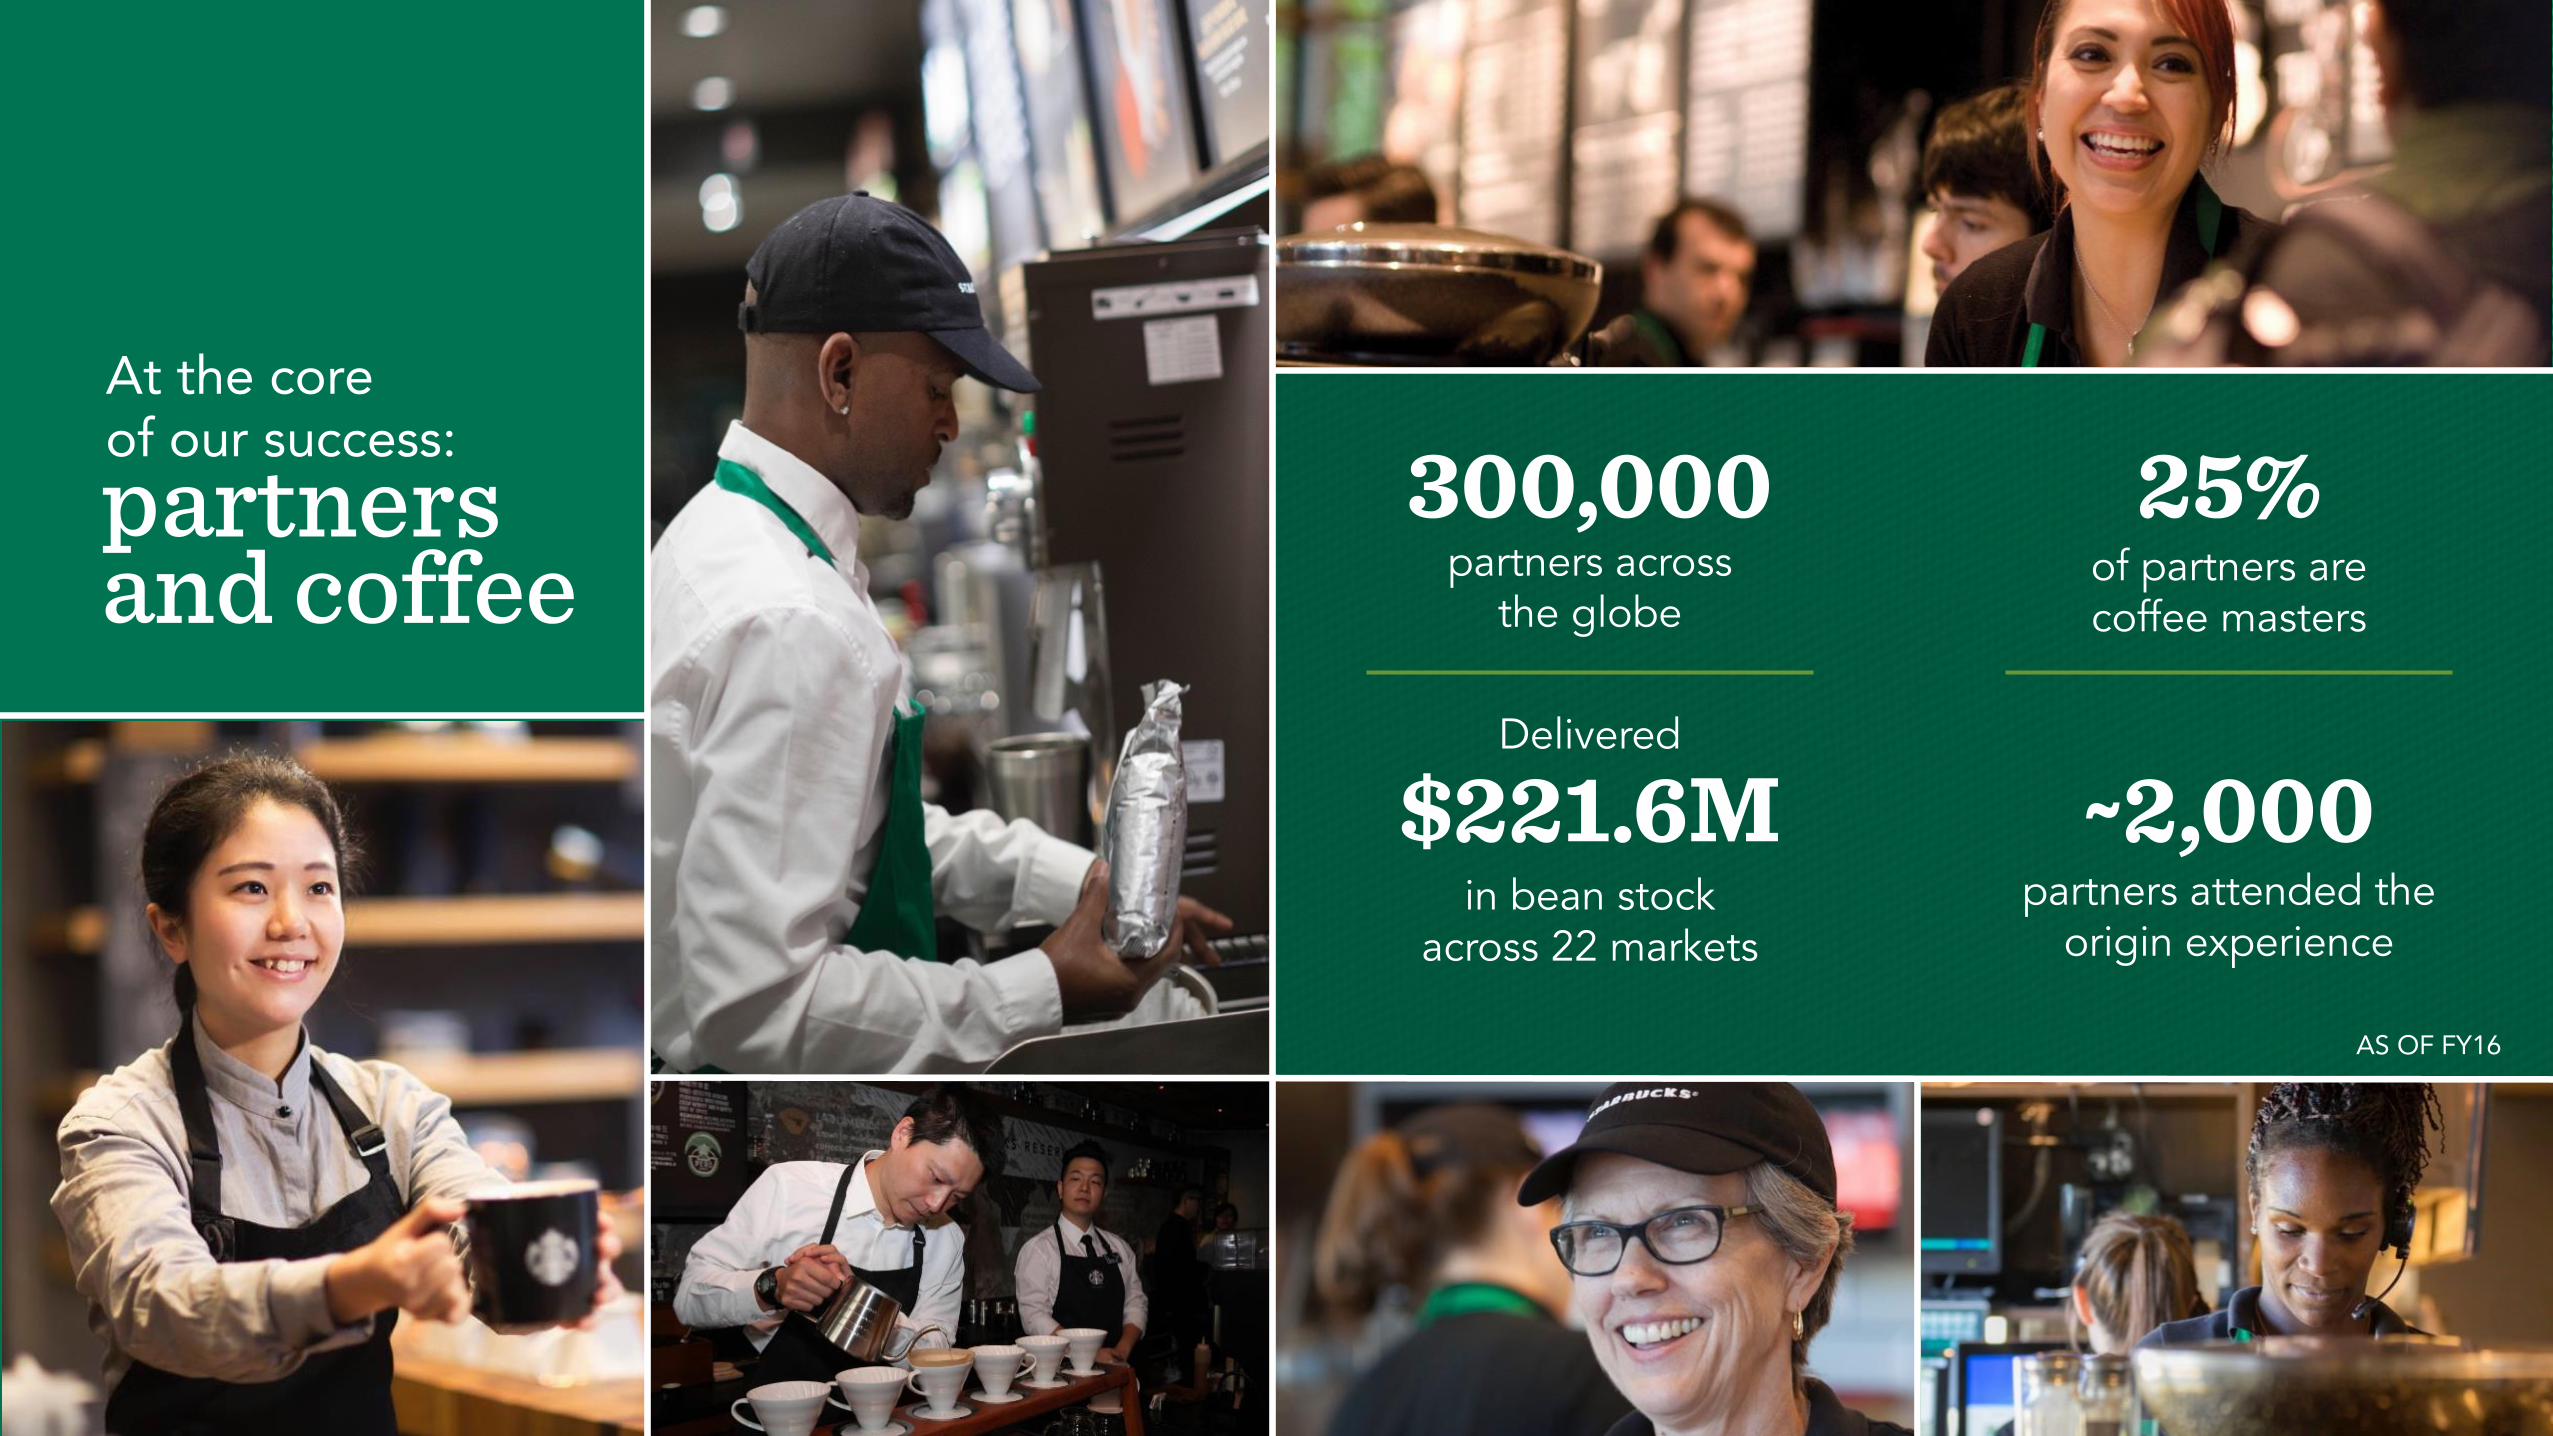
partners across the globe
300,000
in bean stock across 22 markets
$221.6M
OF PARTNERS ARE COFFEE MASTERS
Delivered
~2,000partners attended the
origin experience
25%of partners are coffee masters
AS OF FY16
At the core of our success:
partners and coffee
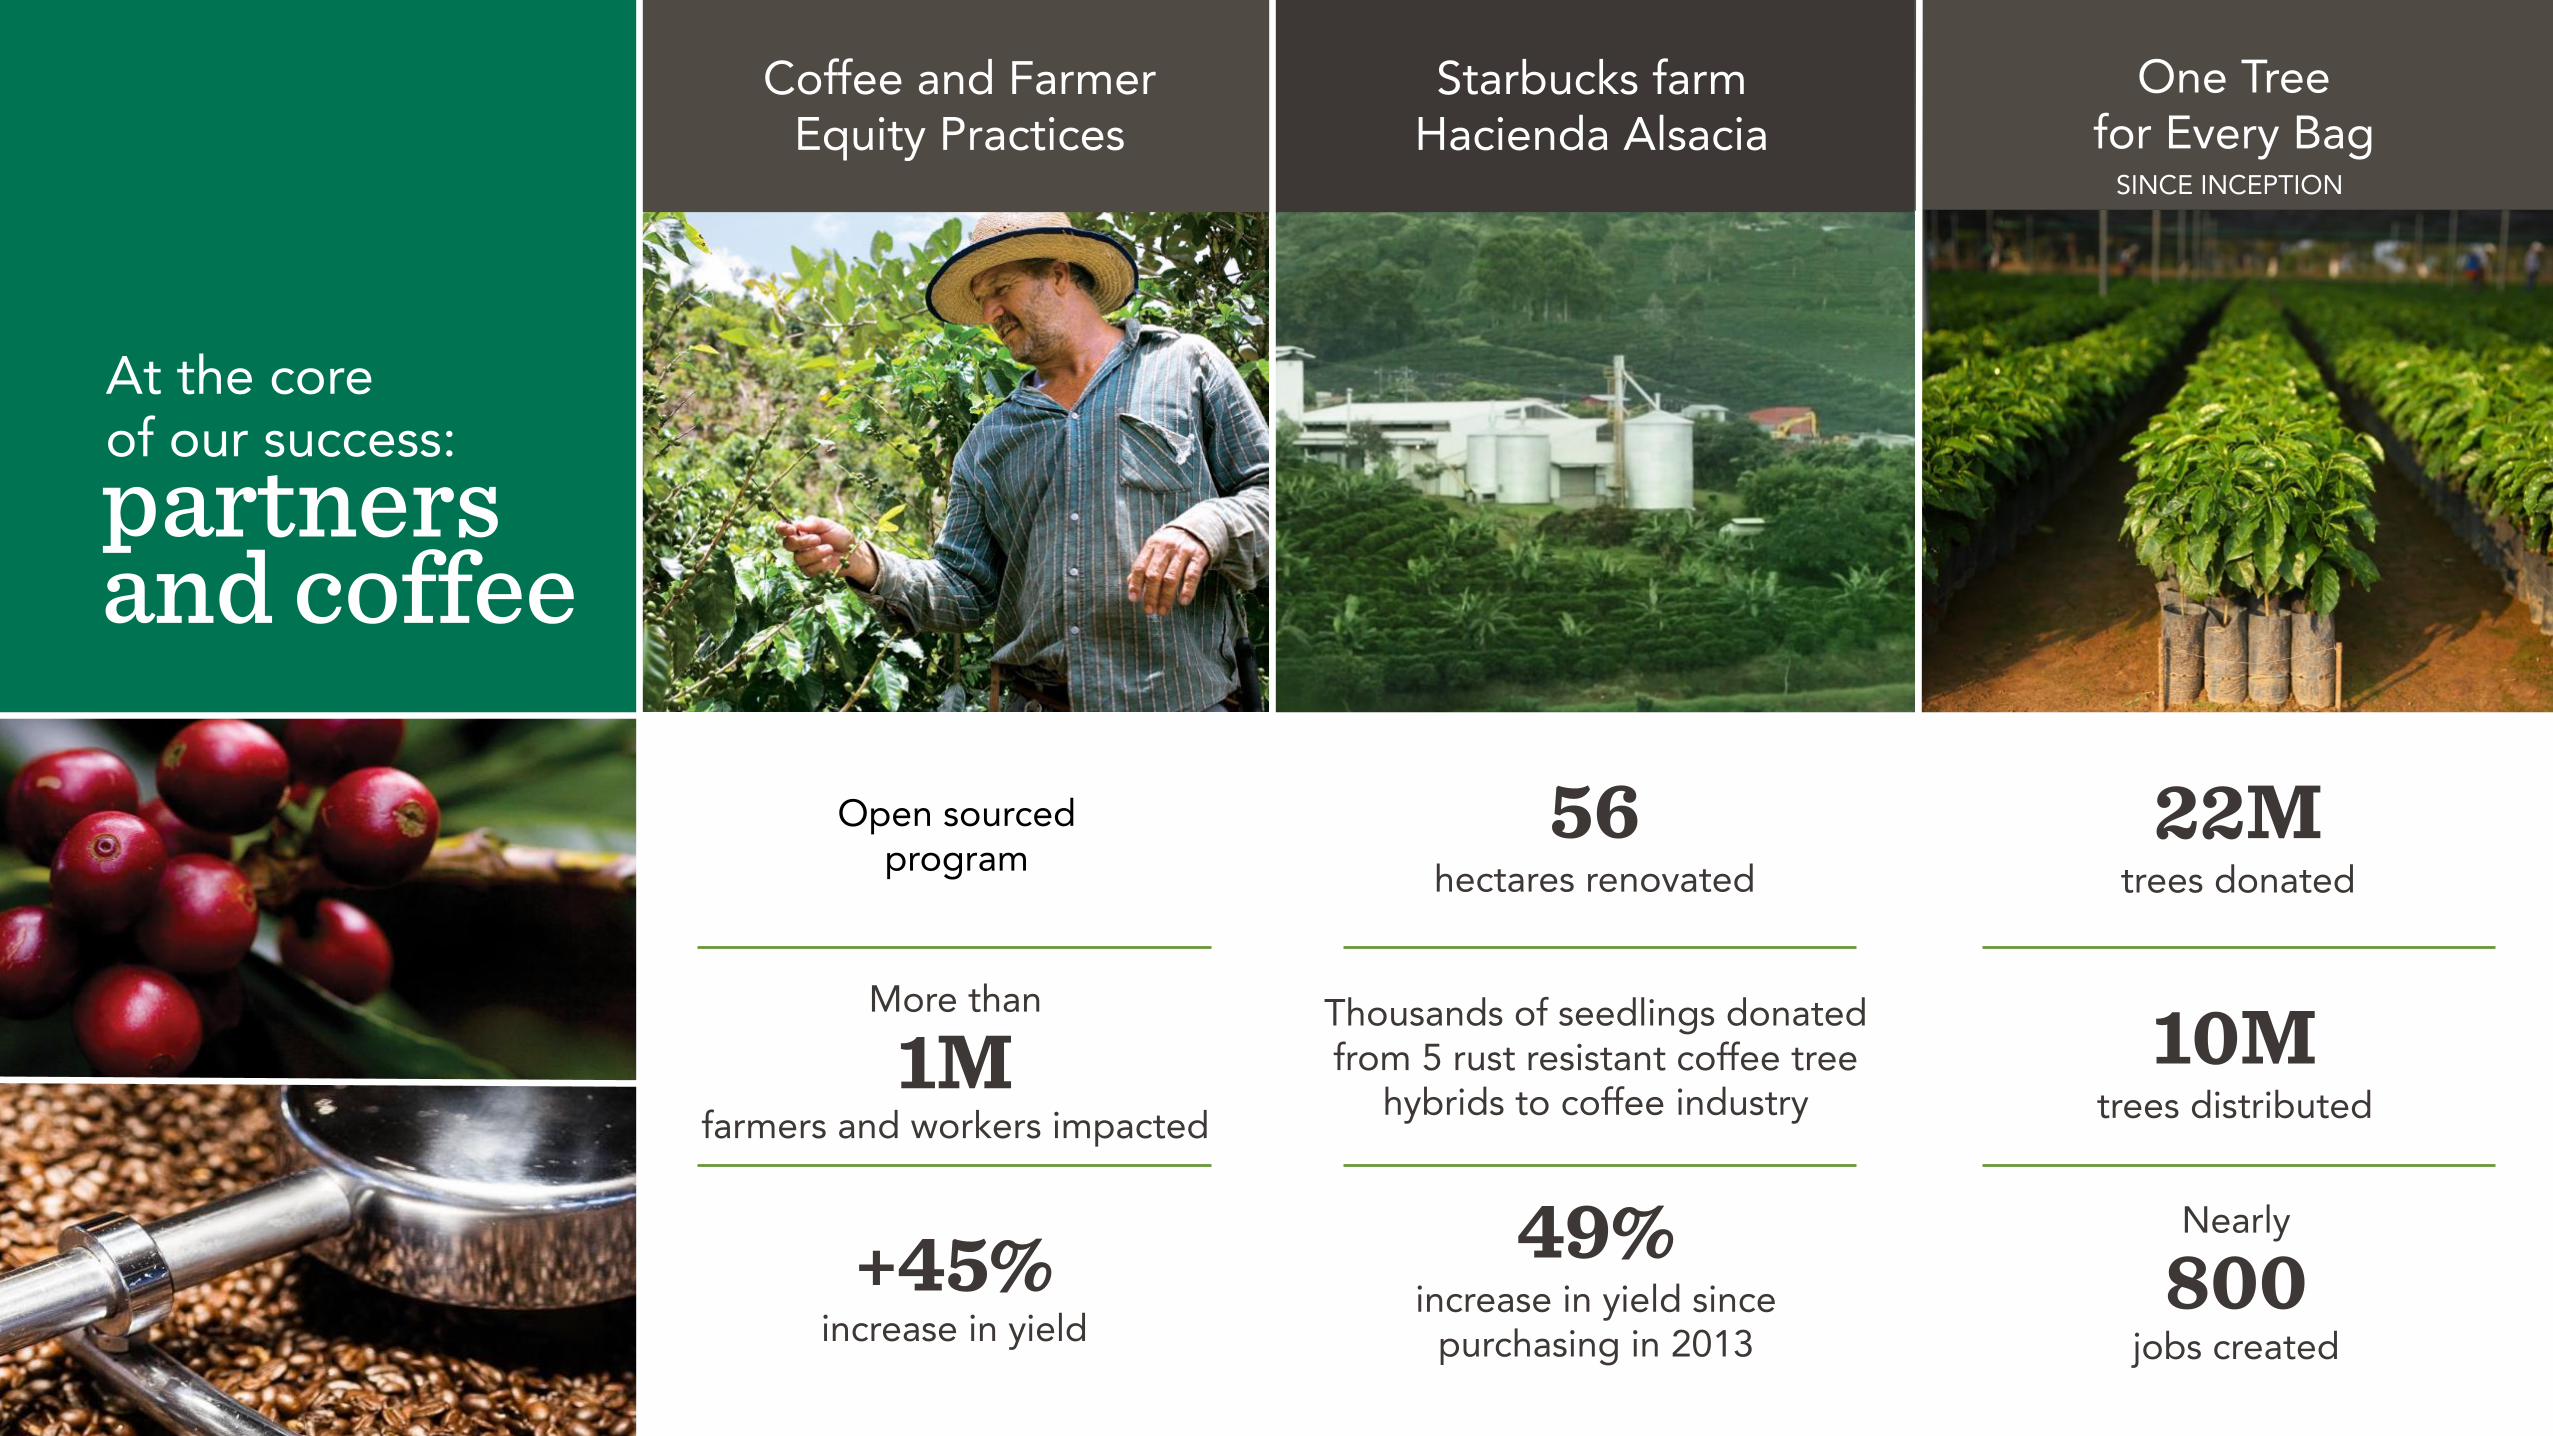
Open sourced program
More than
1Mfarmers and workers impacted
+45%increase in yield
56 hectares renovated
Thousands of seedlings donated from 5 rust resistant coffee tree
hybrids to coffee industry
49%increase in yield since
purchasing in 2013
22Mtrees donated
10M trees distributed
Nearly
800 jobs created
partners and coffee
At the core of our success:
Coffee and Farmer Equity Practices
One Tree for Every Bag
Starbucks farmHacienda Alsacia
SINCE INCEPTION
$0.9
$2.9
FY13 FY16
$1.2 $1.1
FY13 FY16
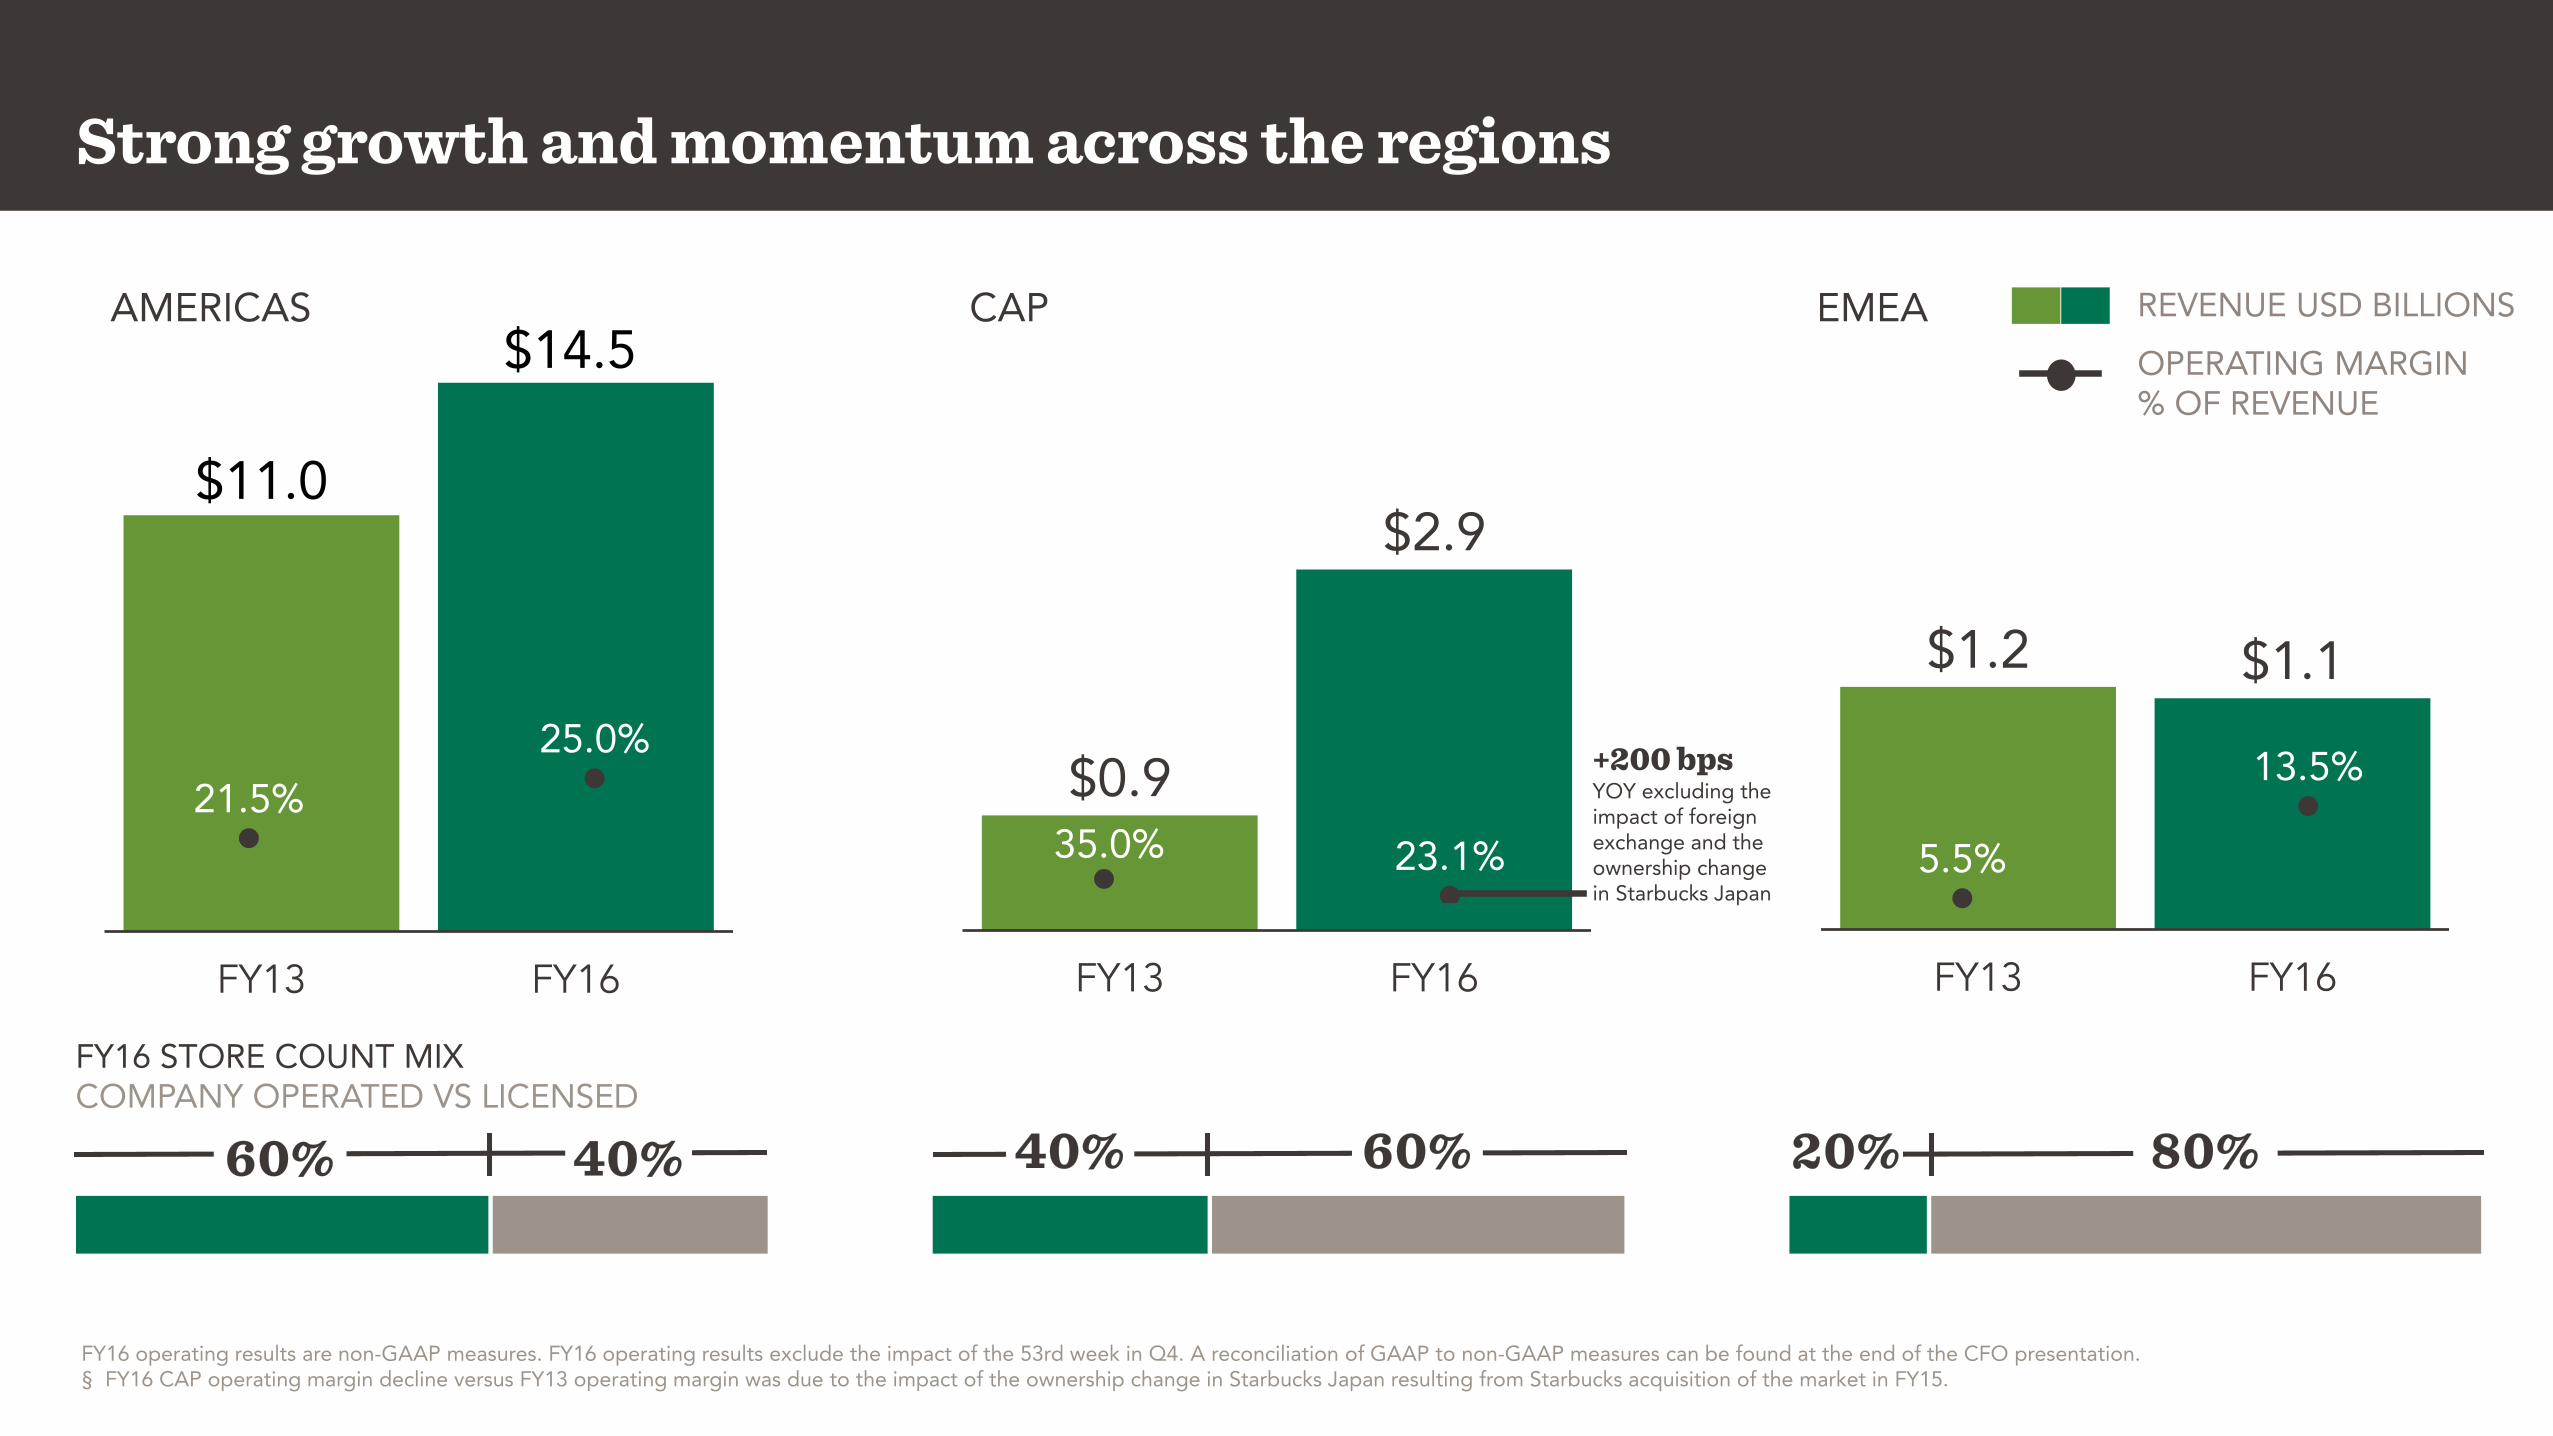
Strong growth and momentum across the regions
$11.0
$14.5
FY13 FY16
AMERICAS CAP EMEA
60% 40%
35.0% 23.1%
60%40% 80%20%
5.5%
13.5%
REVENUE USD BILLIONS
OPERATING MARGIN % OF REVENUE
21.5%
25.0%
FY16 STORE COUNT MIXCOMPANY OPERATED VS LICENSED
FY16 operating results are non-GAAP measures. FY16 operating results exclude the impact of the 53rd week in Q4. A reconciliation of GAAP to non-GAAP measures can be found at the end of the CFO presentation.§ FY16 CAP operating margin decline versus FY13 operating margin was due to the impact of the ownership change in Starbucks Japan resulting from Starbucks acquisition of the market in FY15.
+200 bpsYOY excluding the impact of foreign exchange and the ownership change in Starbucks Japan
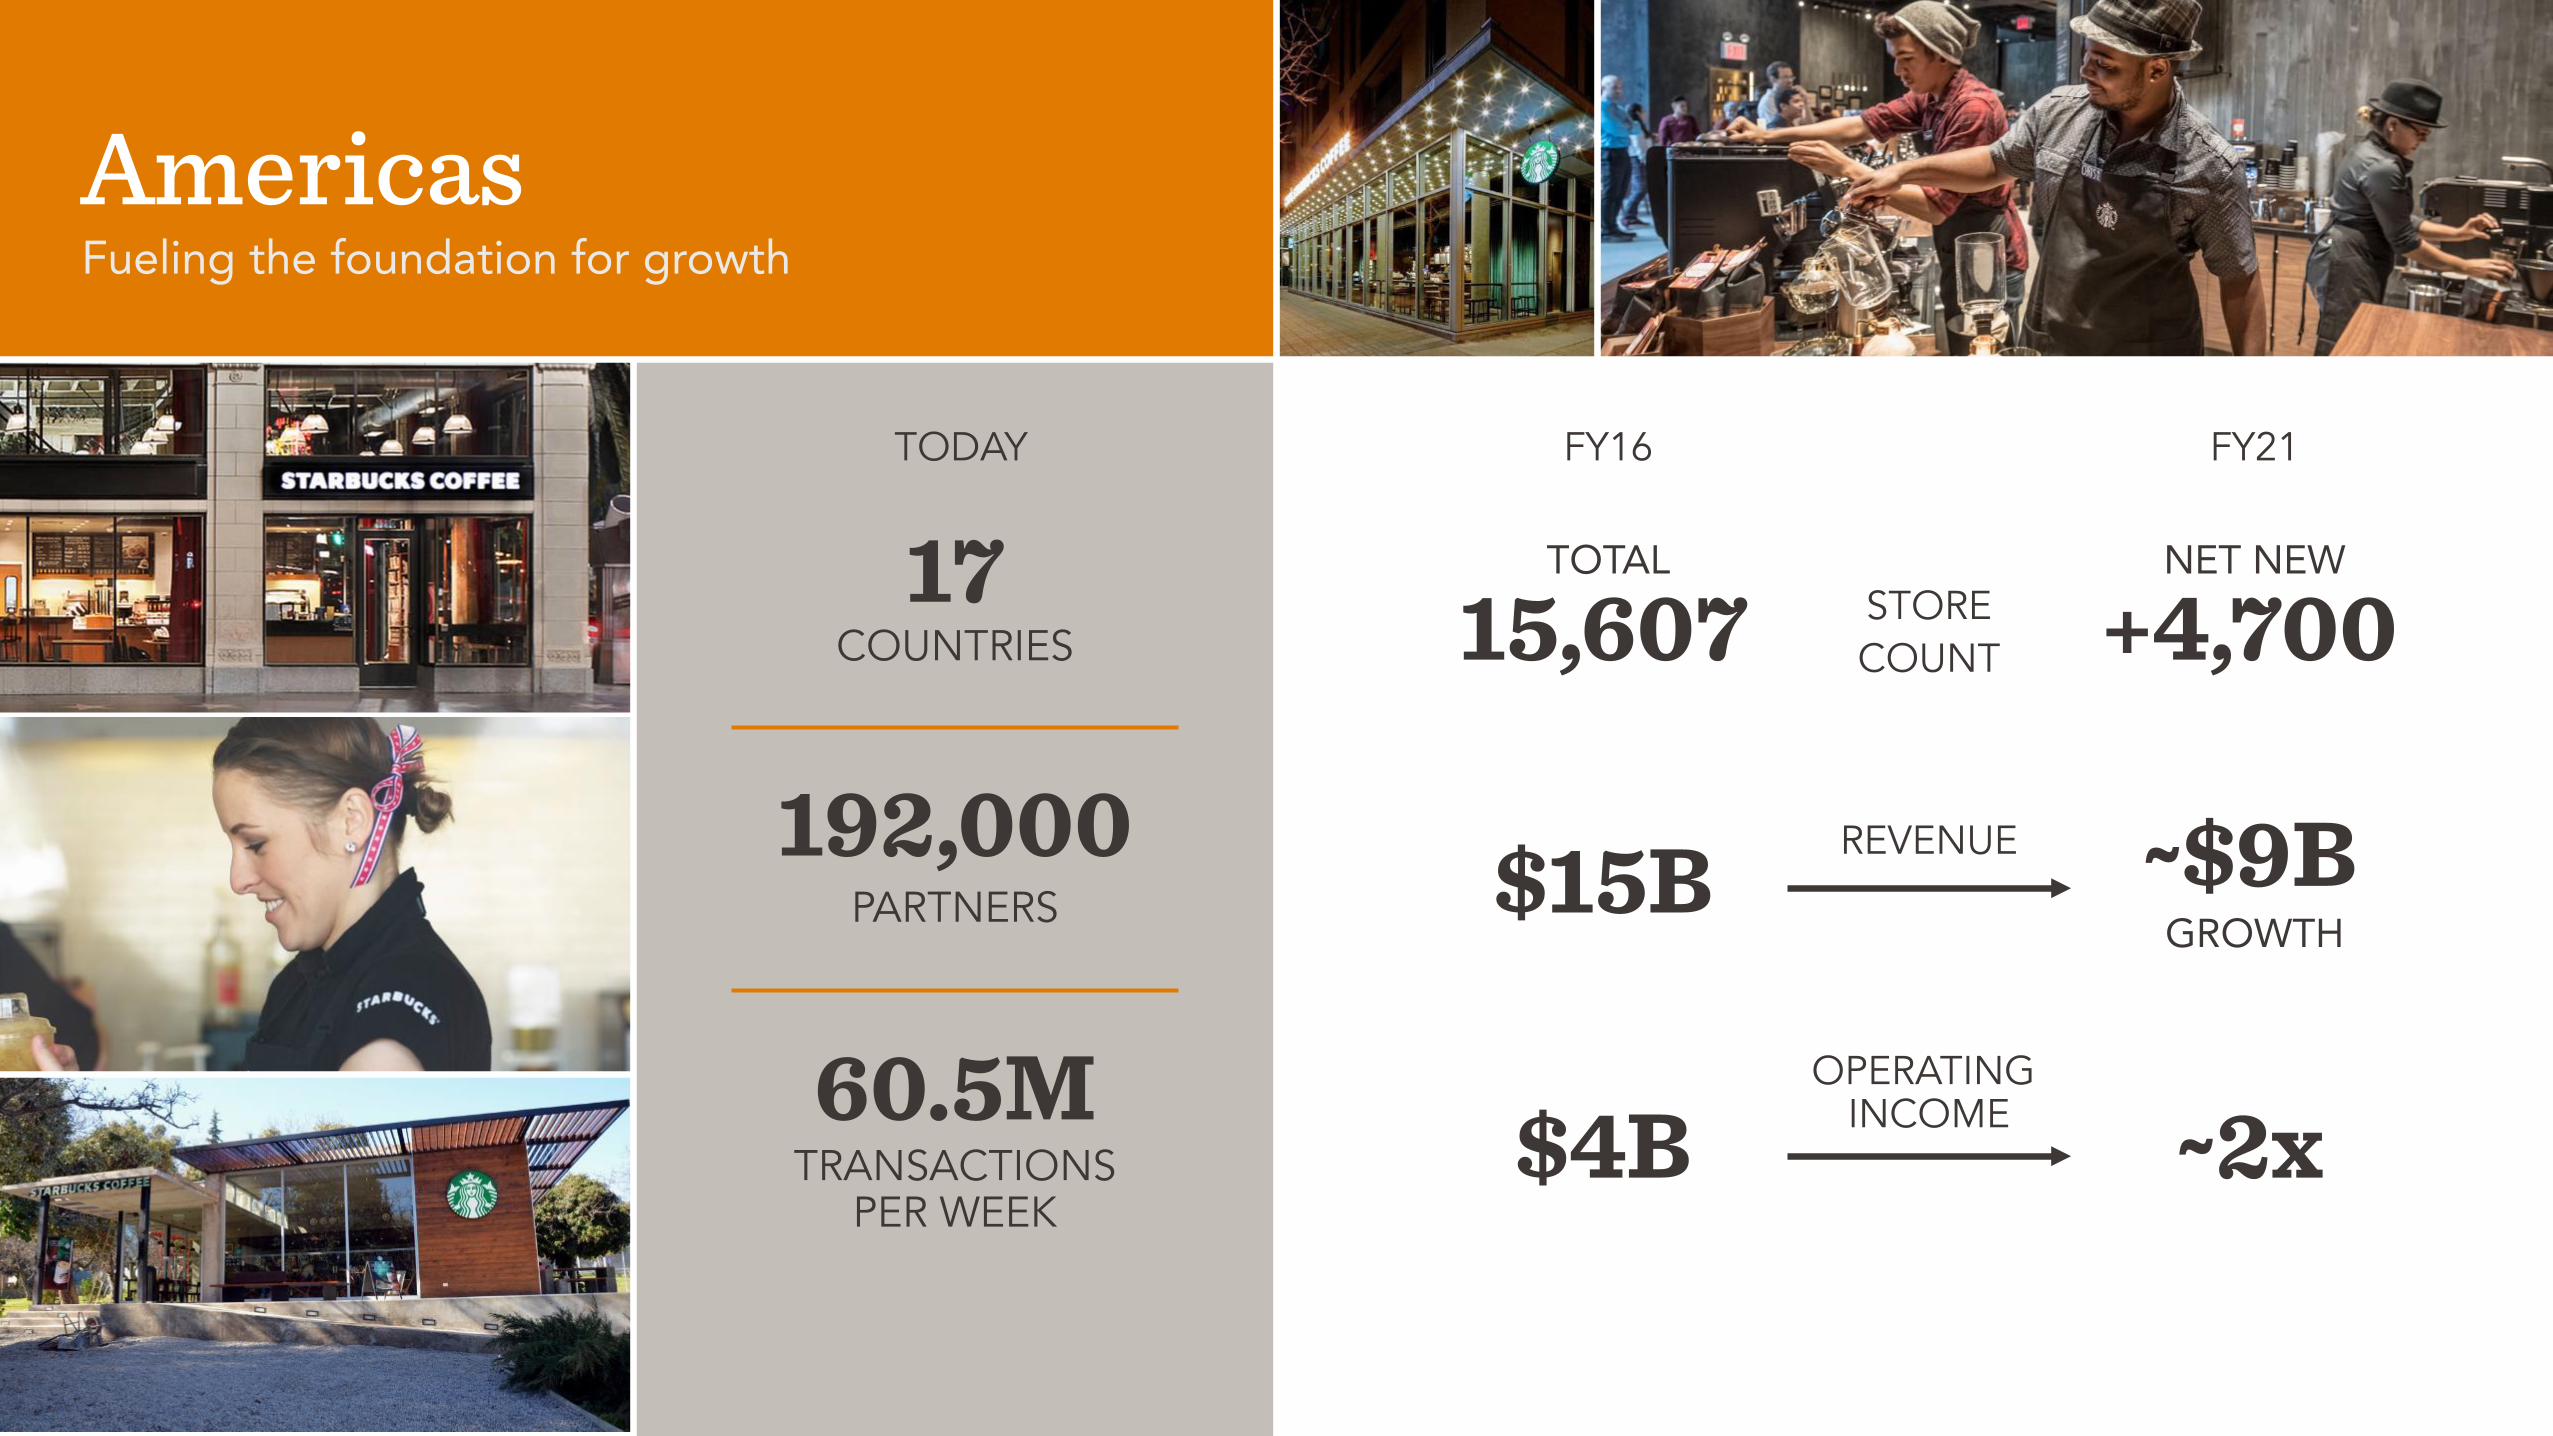
AmericasFueling the foundation for growth
15,607 +4,700
REVENUE$15B ~$9B
FY16 FY21
$4B ~2xOPERATING
INCOME
COUNTRIES17
PARTNERS
192,000
TRANSACTIONS PER WEEK
60.5M
TODAY
STORE COUNT
NET NEWTOTAL
GROWTH
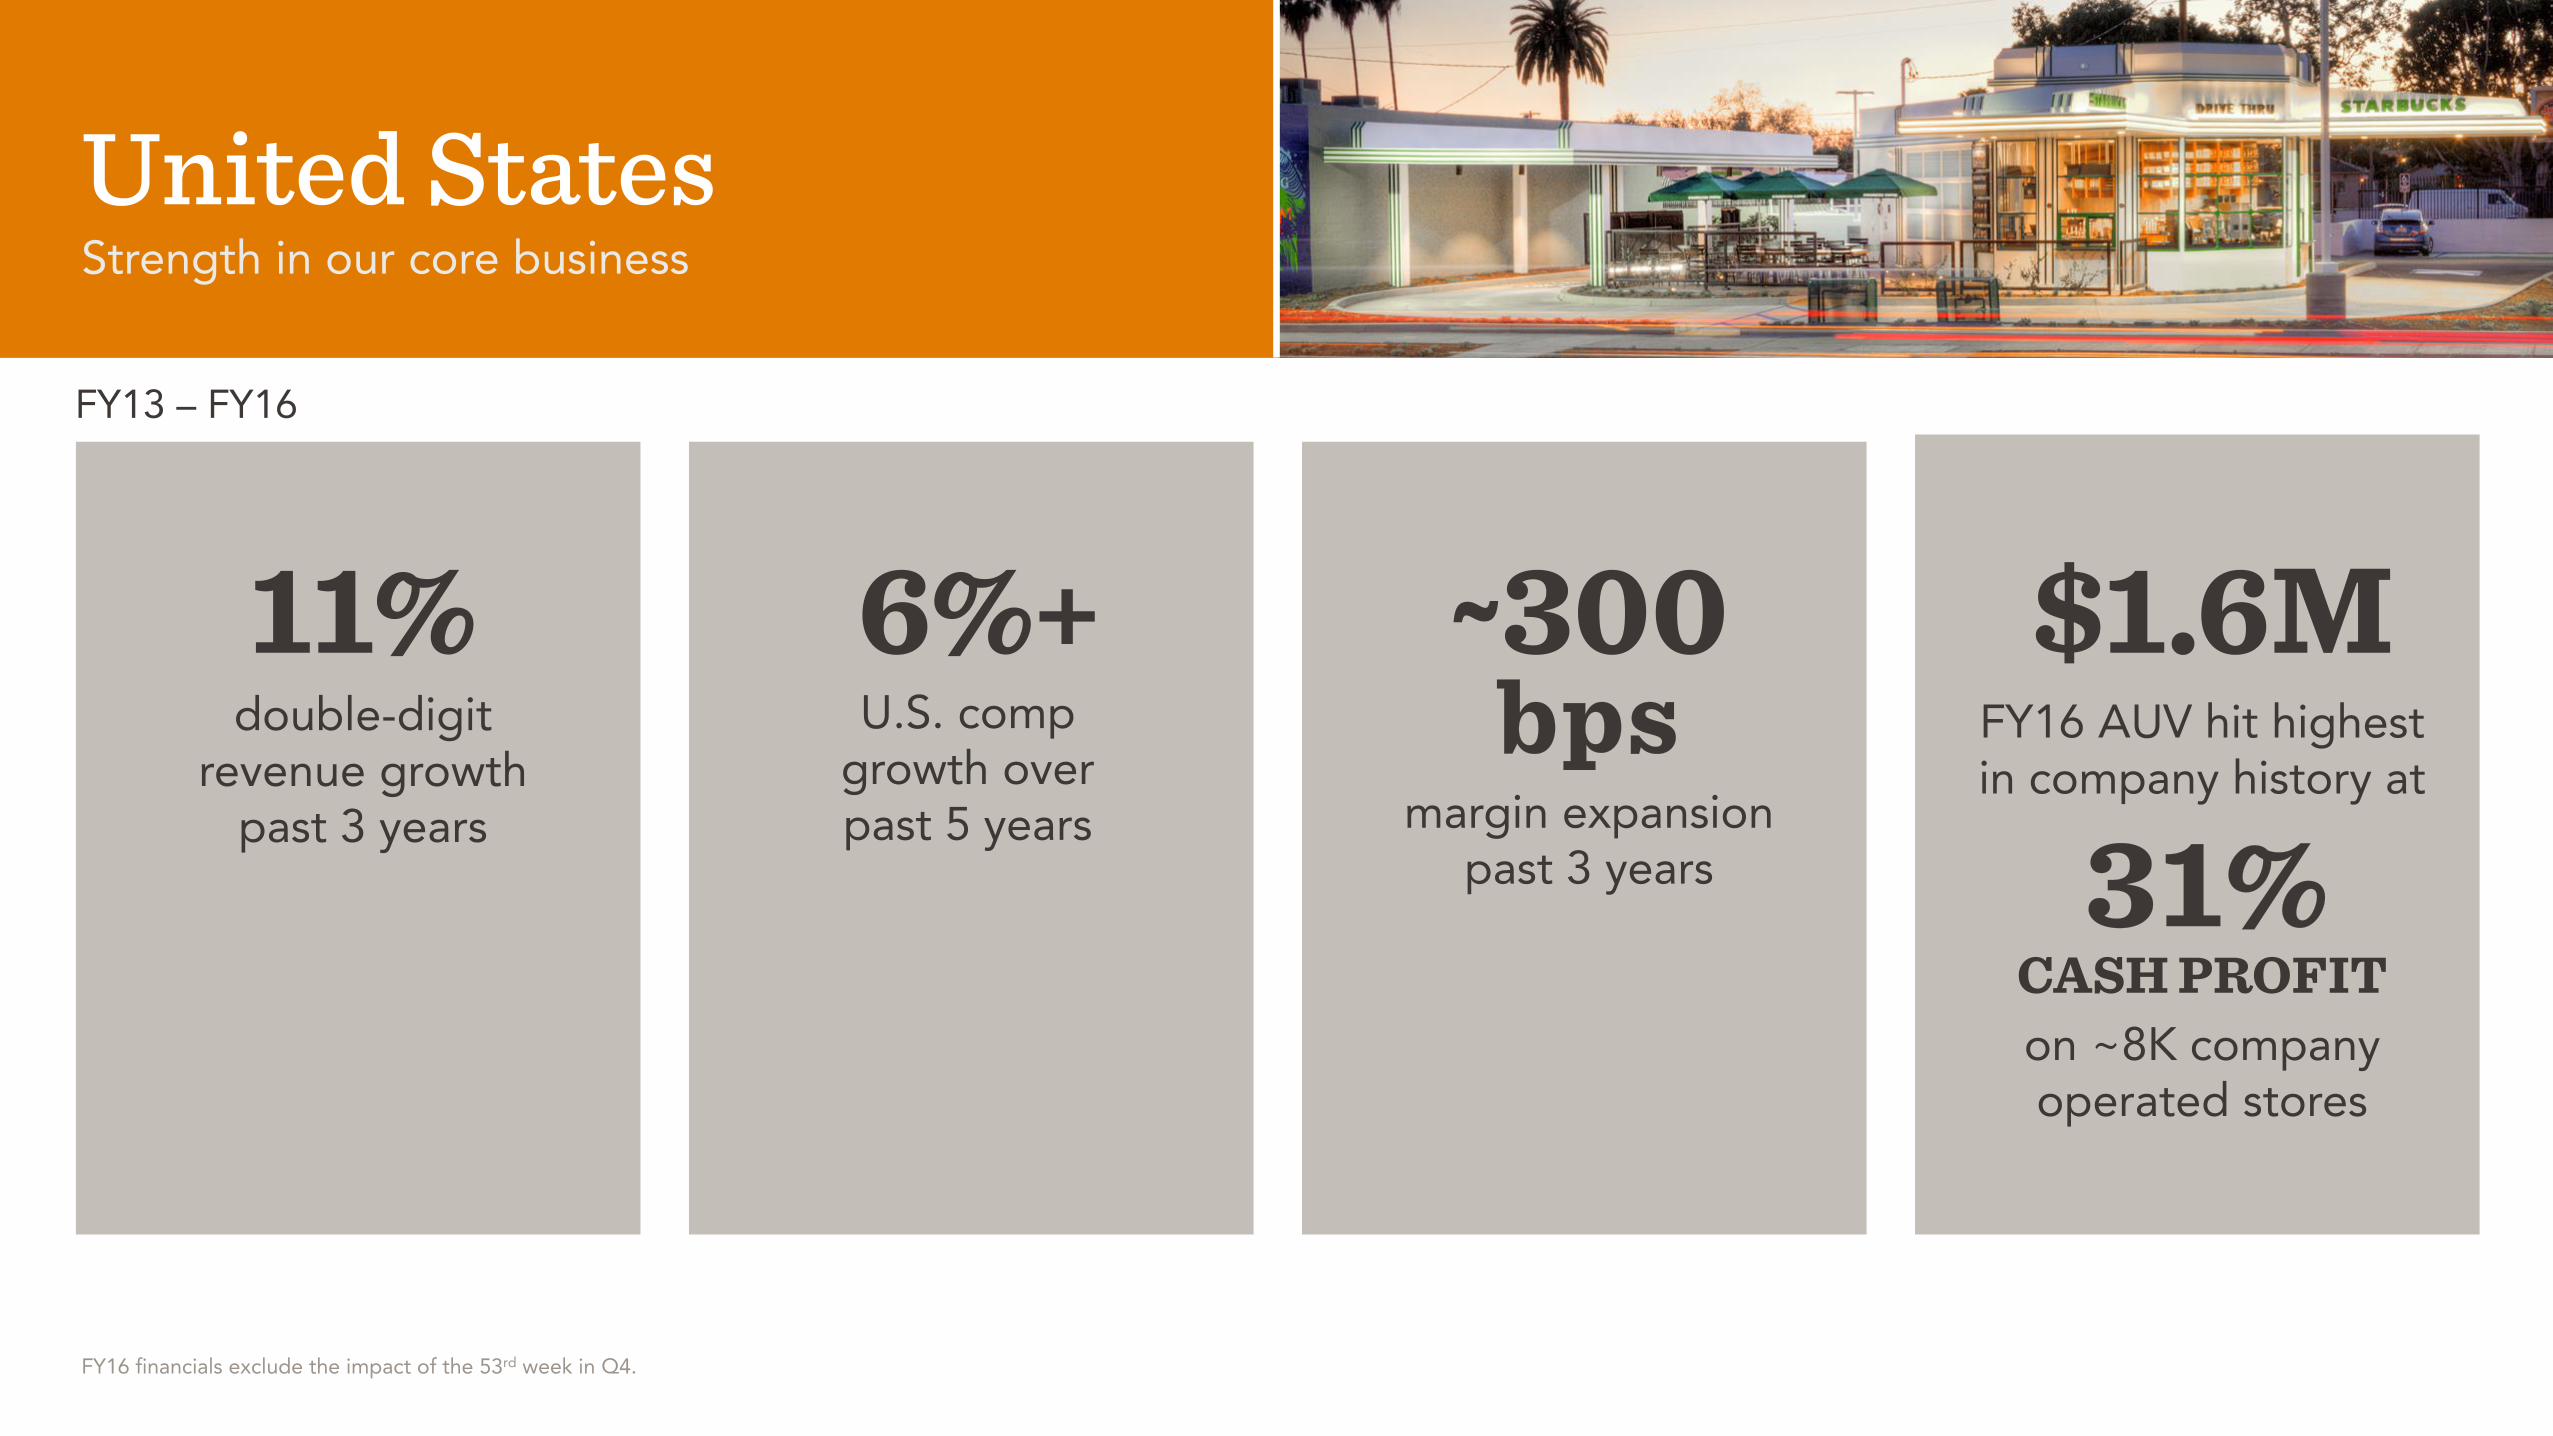
United StatesStrength in our core business
6%+U.S. comp
growth over past 5 years
11%double-digit
revenue growth past 3 years
~300 margin expansion
past 3 years
$1.6M
31%FY16 AUV hit highest in company history at
on ~8K company operated stores
CASH PROFIT
bps
FY13 – FY16
FY16 financials exclude the impact of the 53rd week in Q4.
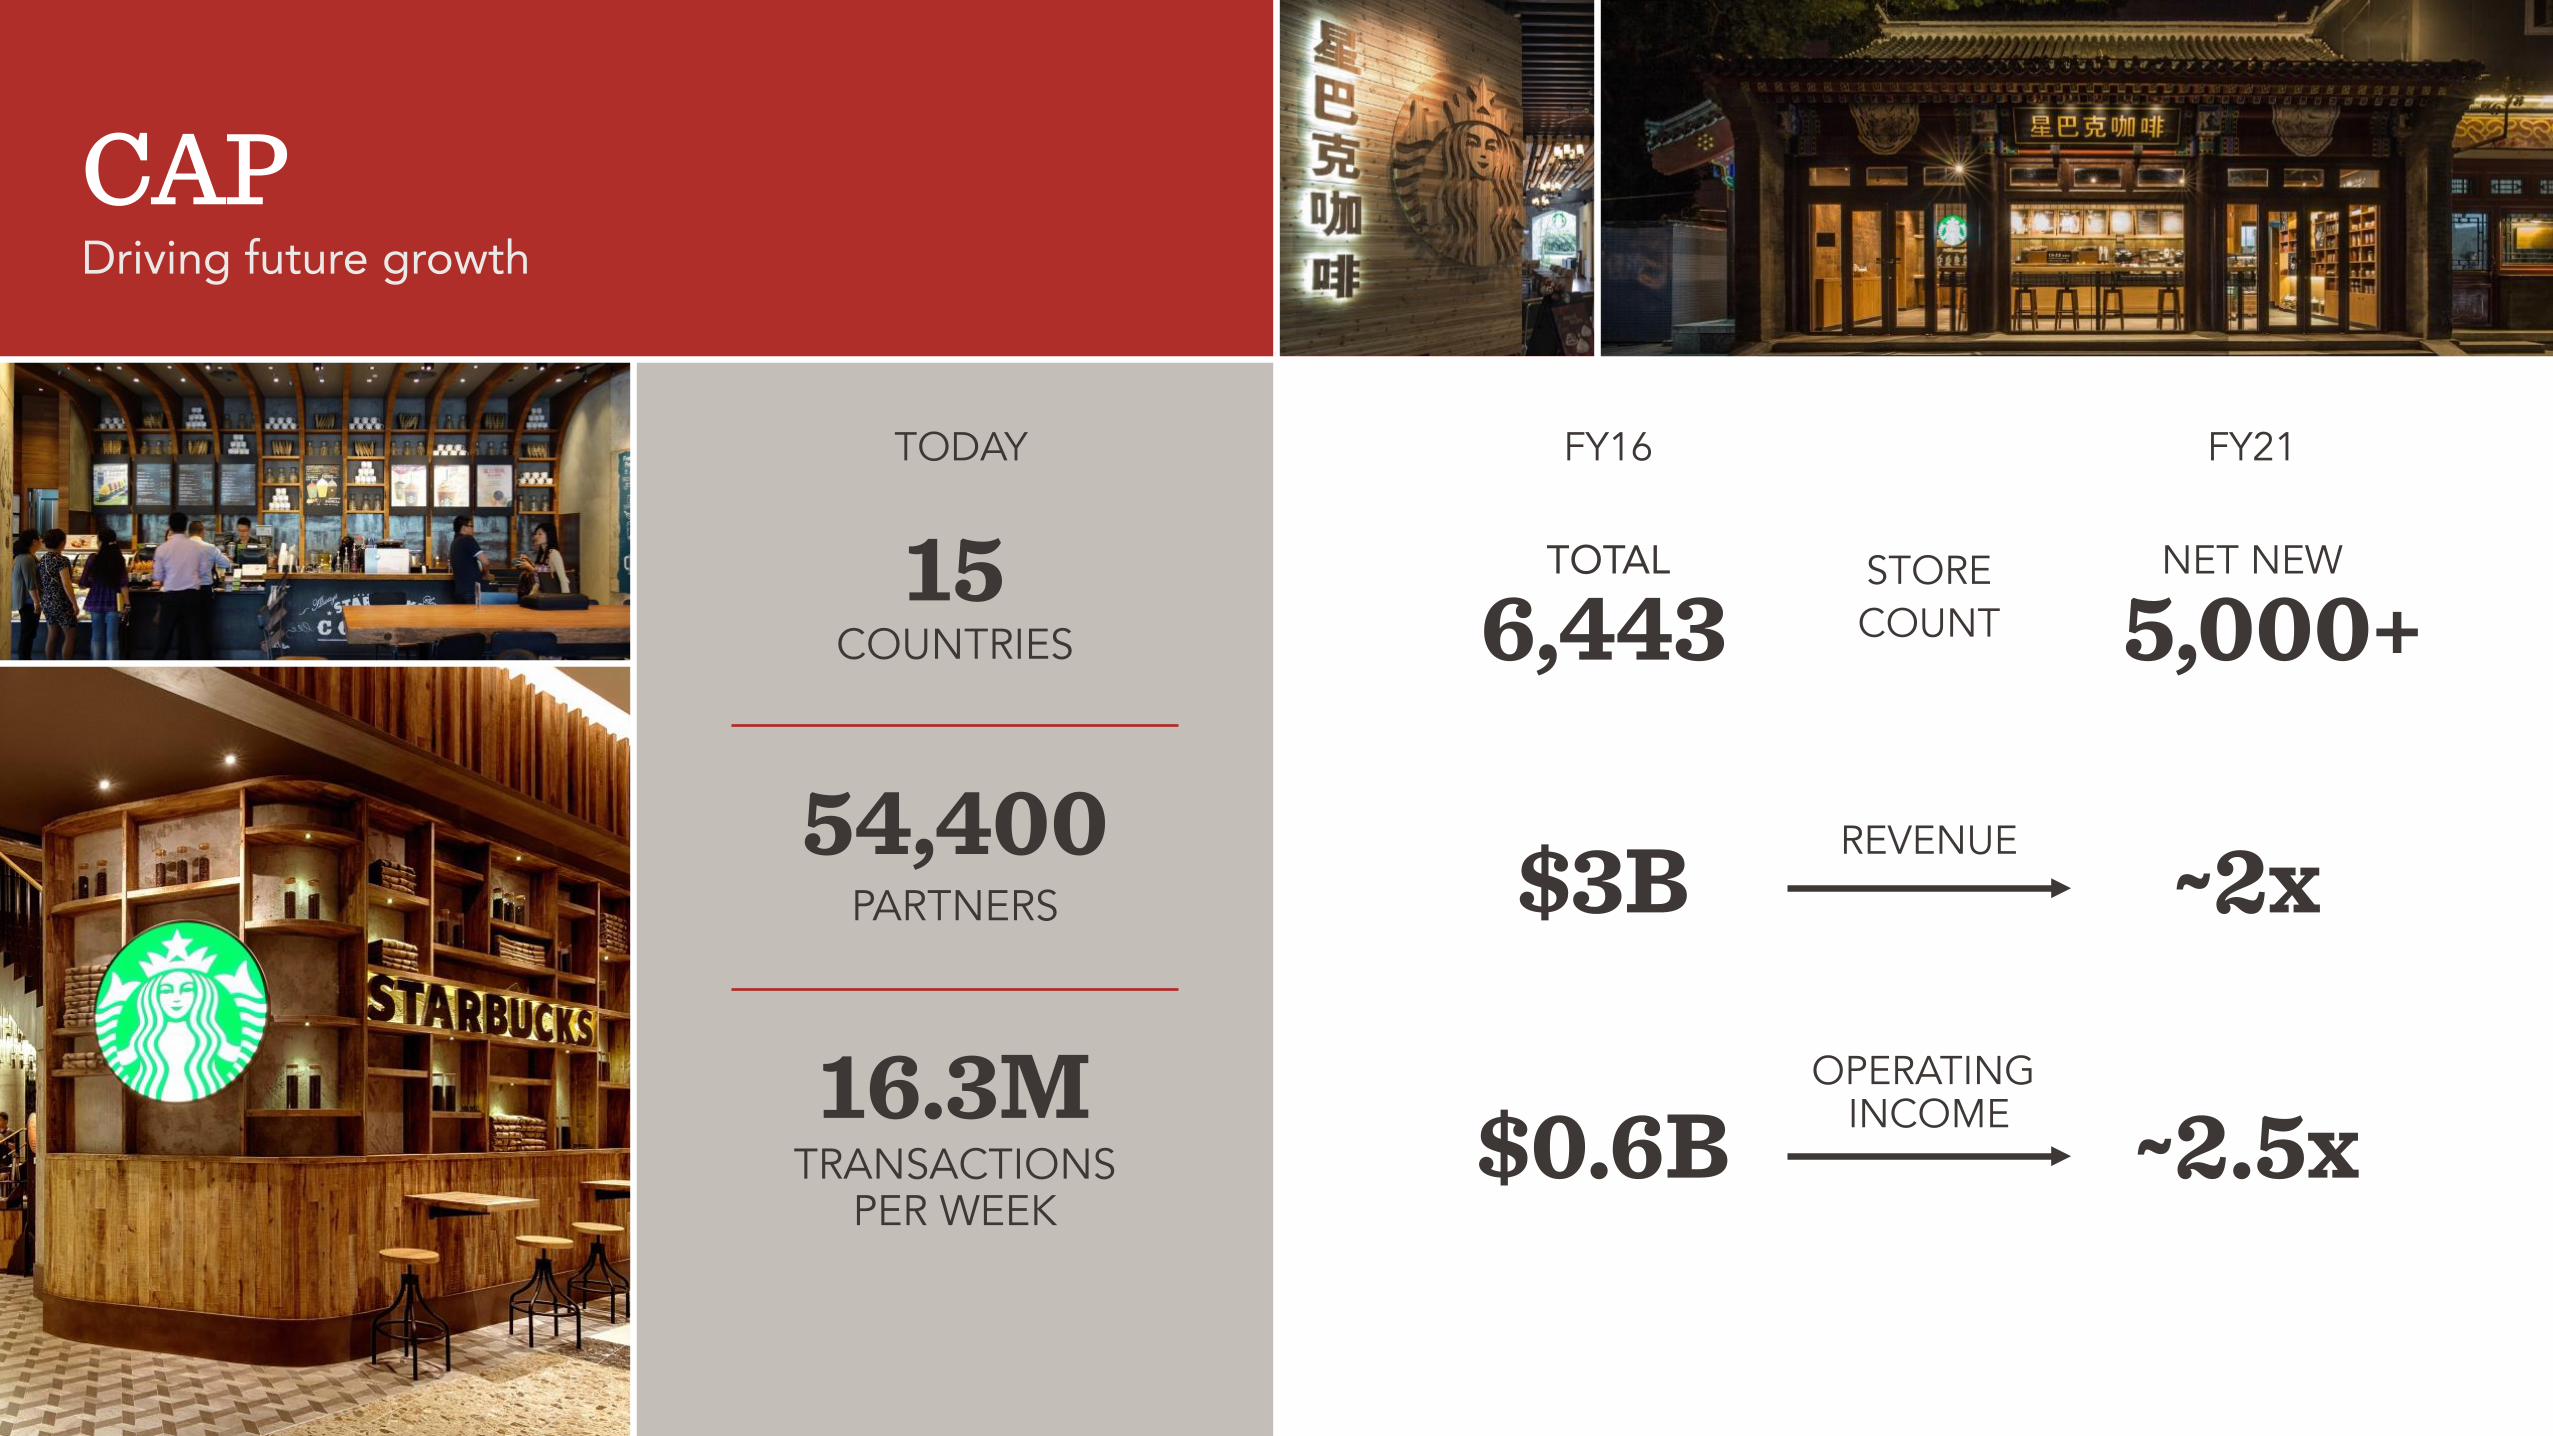
CAPDriving future growth
6,443 5,000+
$3B ~2x
$0.6B ~2.5x
COUNTRIES15
PARTNERS
54,400
TRANSACTIONS PER WEEK
16.3M
REVENUE
OPERATING INCOME
STORE COUNT
NET NEWTOTAL
FY16 FY21TODAY
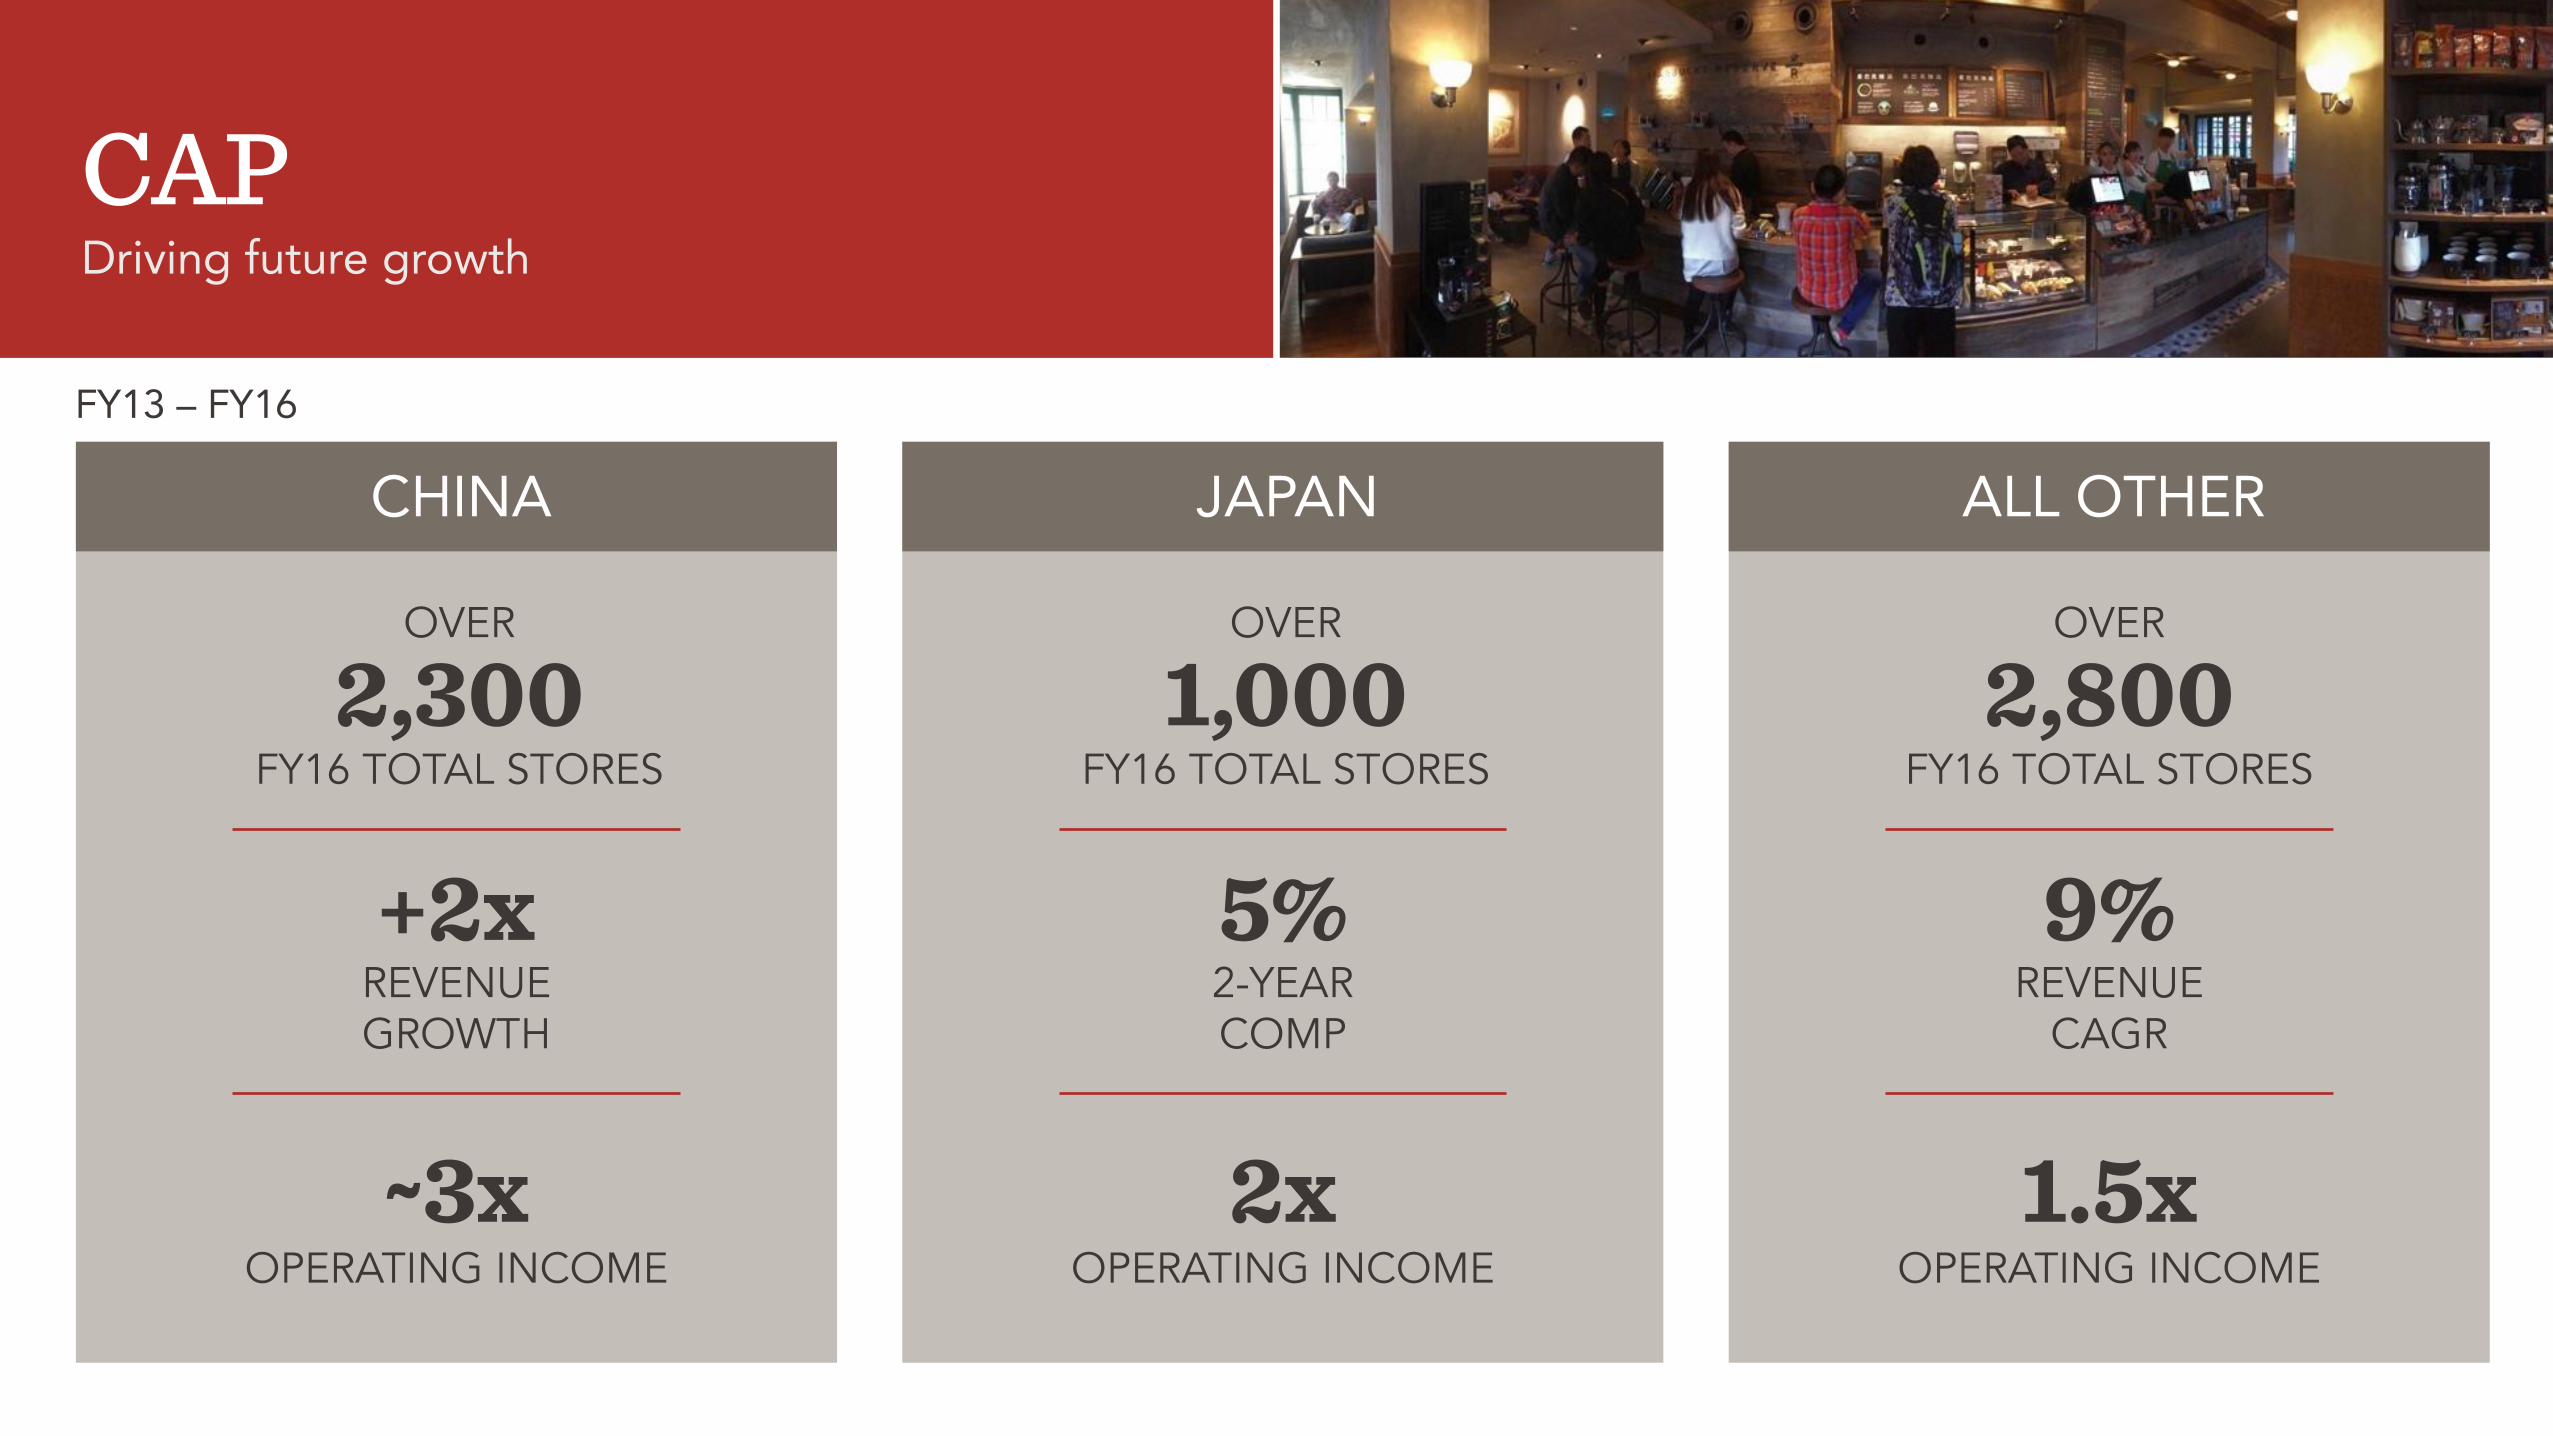
CAPDriving future growth
CHINA JAPAN ALL OTHER
FY16 TOTAL STORES2,300
REVENUE GROWTH
+2x
OPERATING INCOME~3x
FY16 TOTAL STORES1,000
2-YEAR COMP
5%
OPERATING INCOME2x
FY16 TOTAL STORES2,800
REVENUECAGR
9%
OPERATING INCOME1.5x
OVEROVEROVER
FY13 – FY16
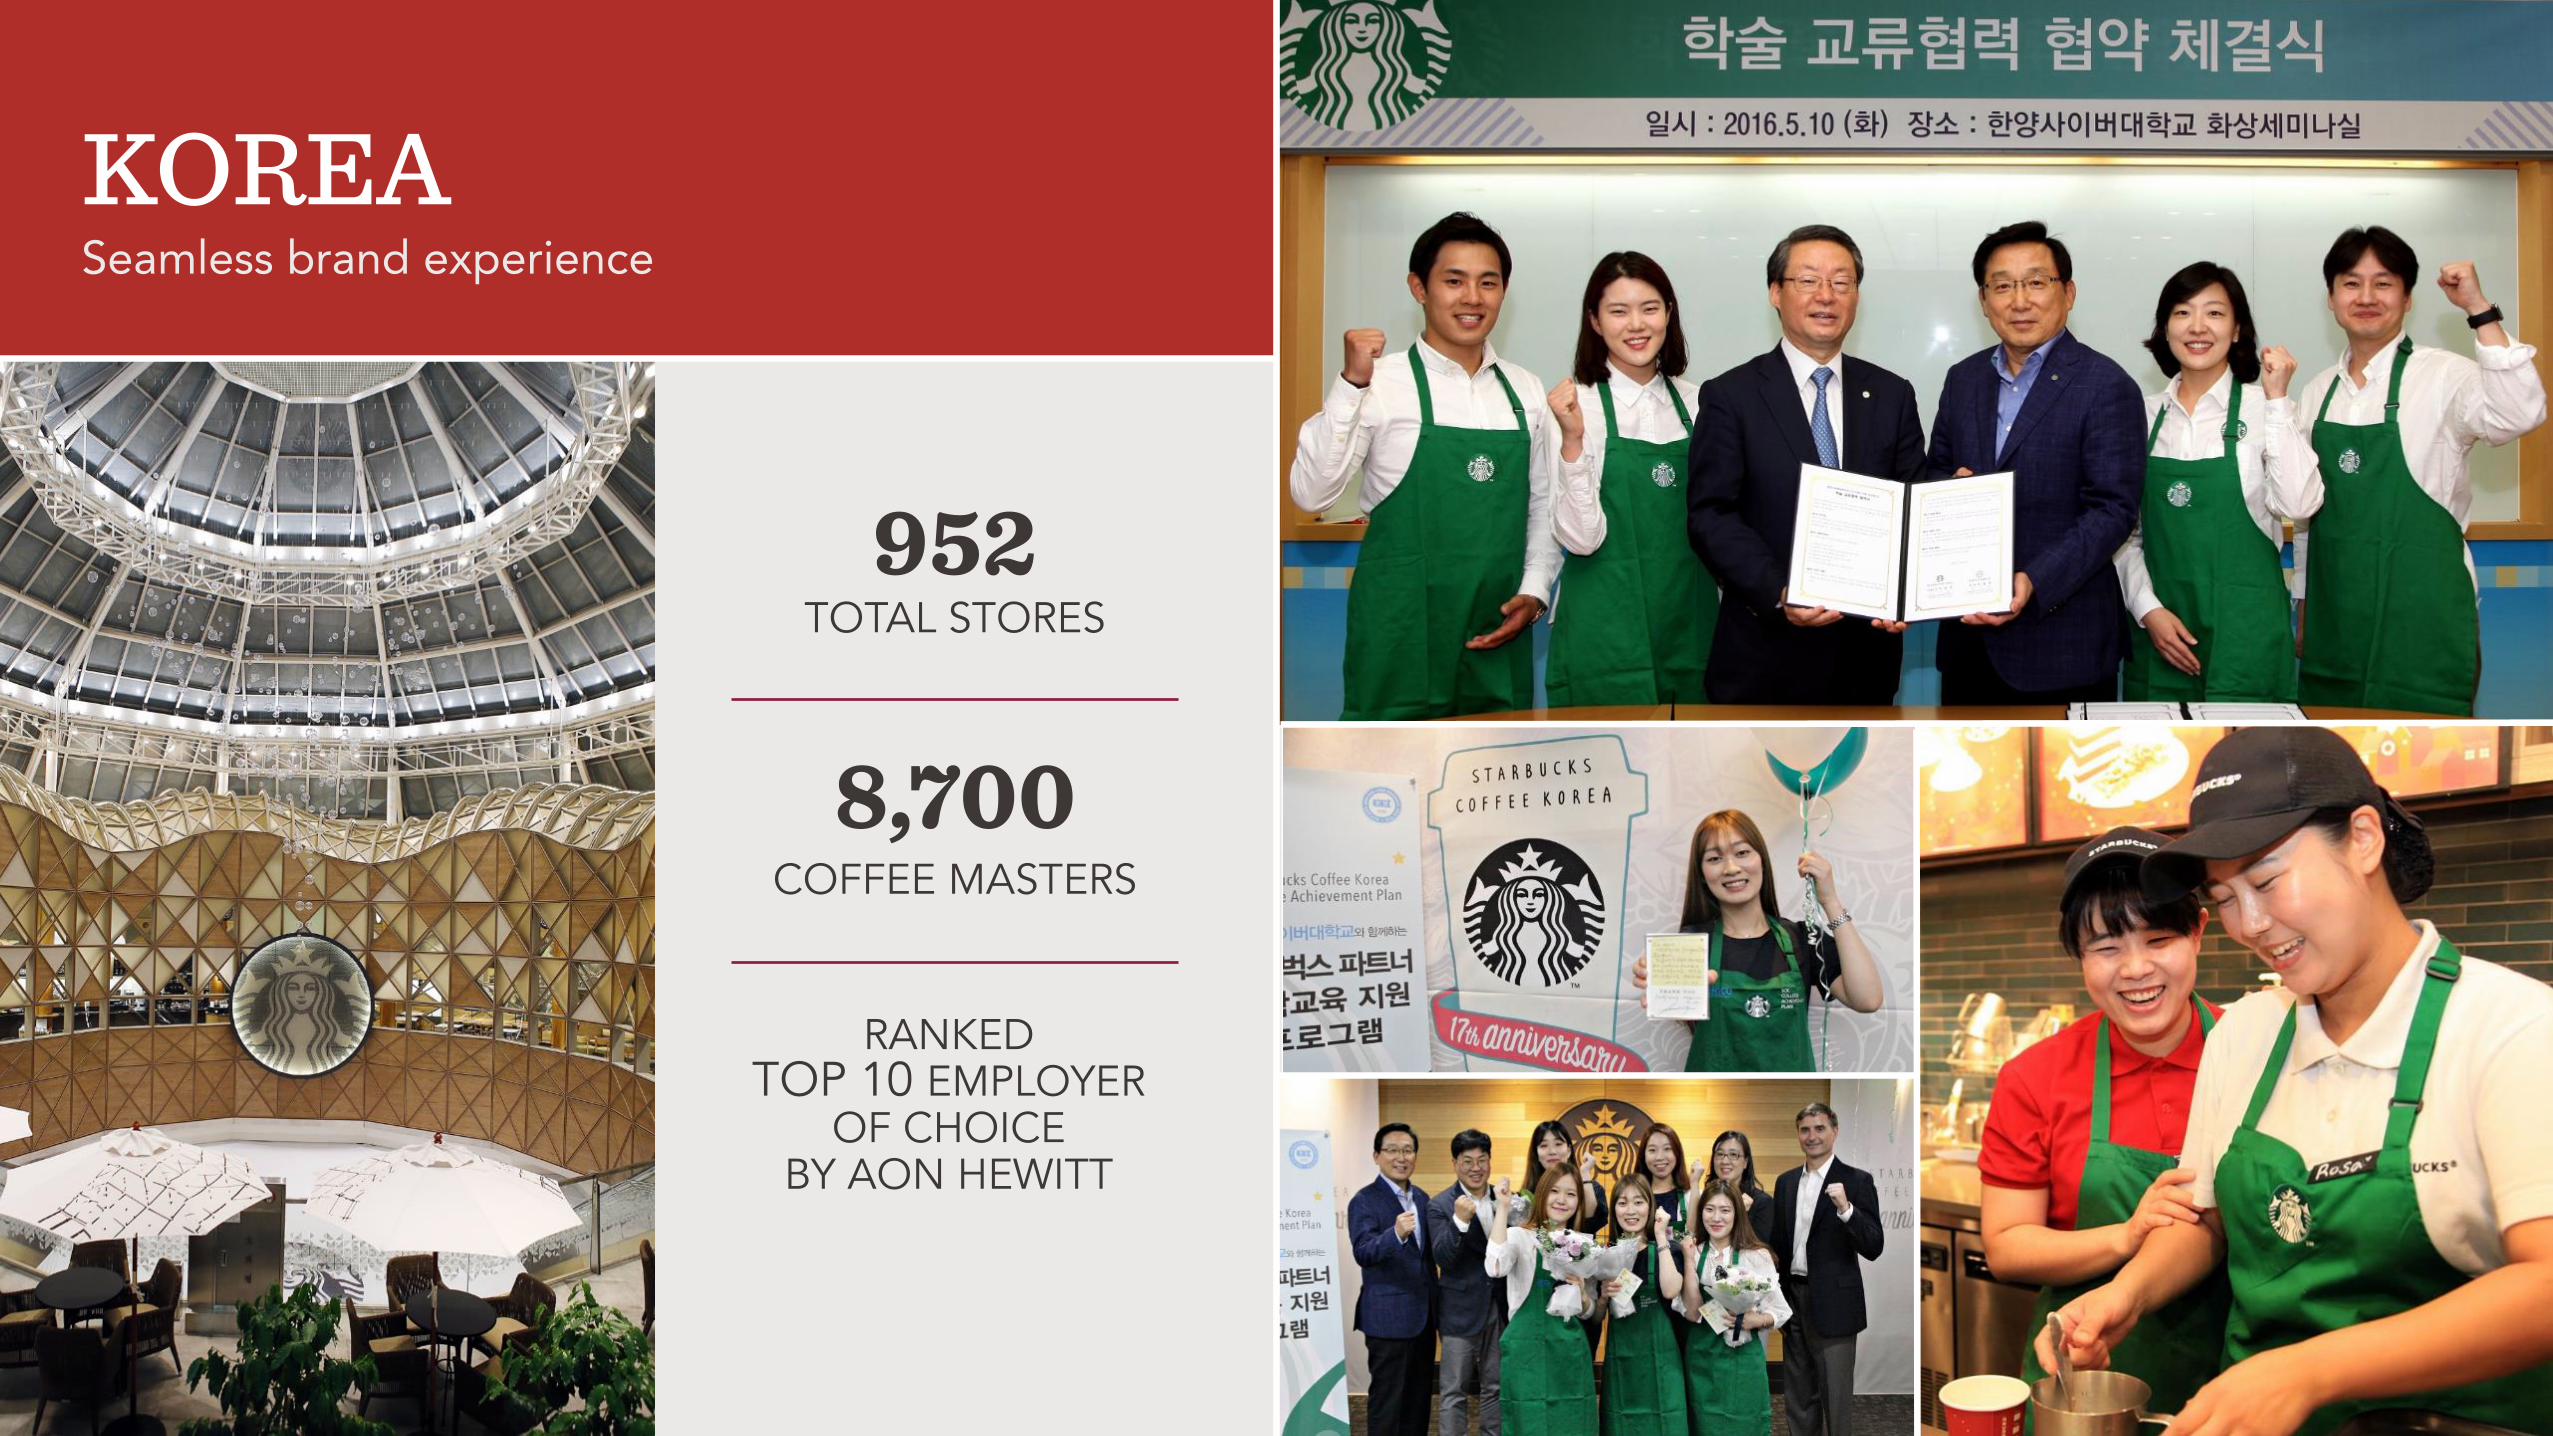
KOREASeamless brand experience
RANKED TOP 10 EMPLOYER
OF CHOICE BY AON HEWITT
TOTAL STORES952
COFFEE MASTERS
8,700
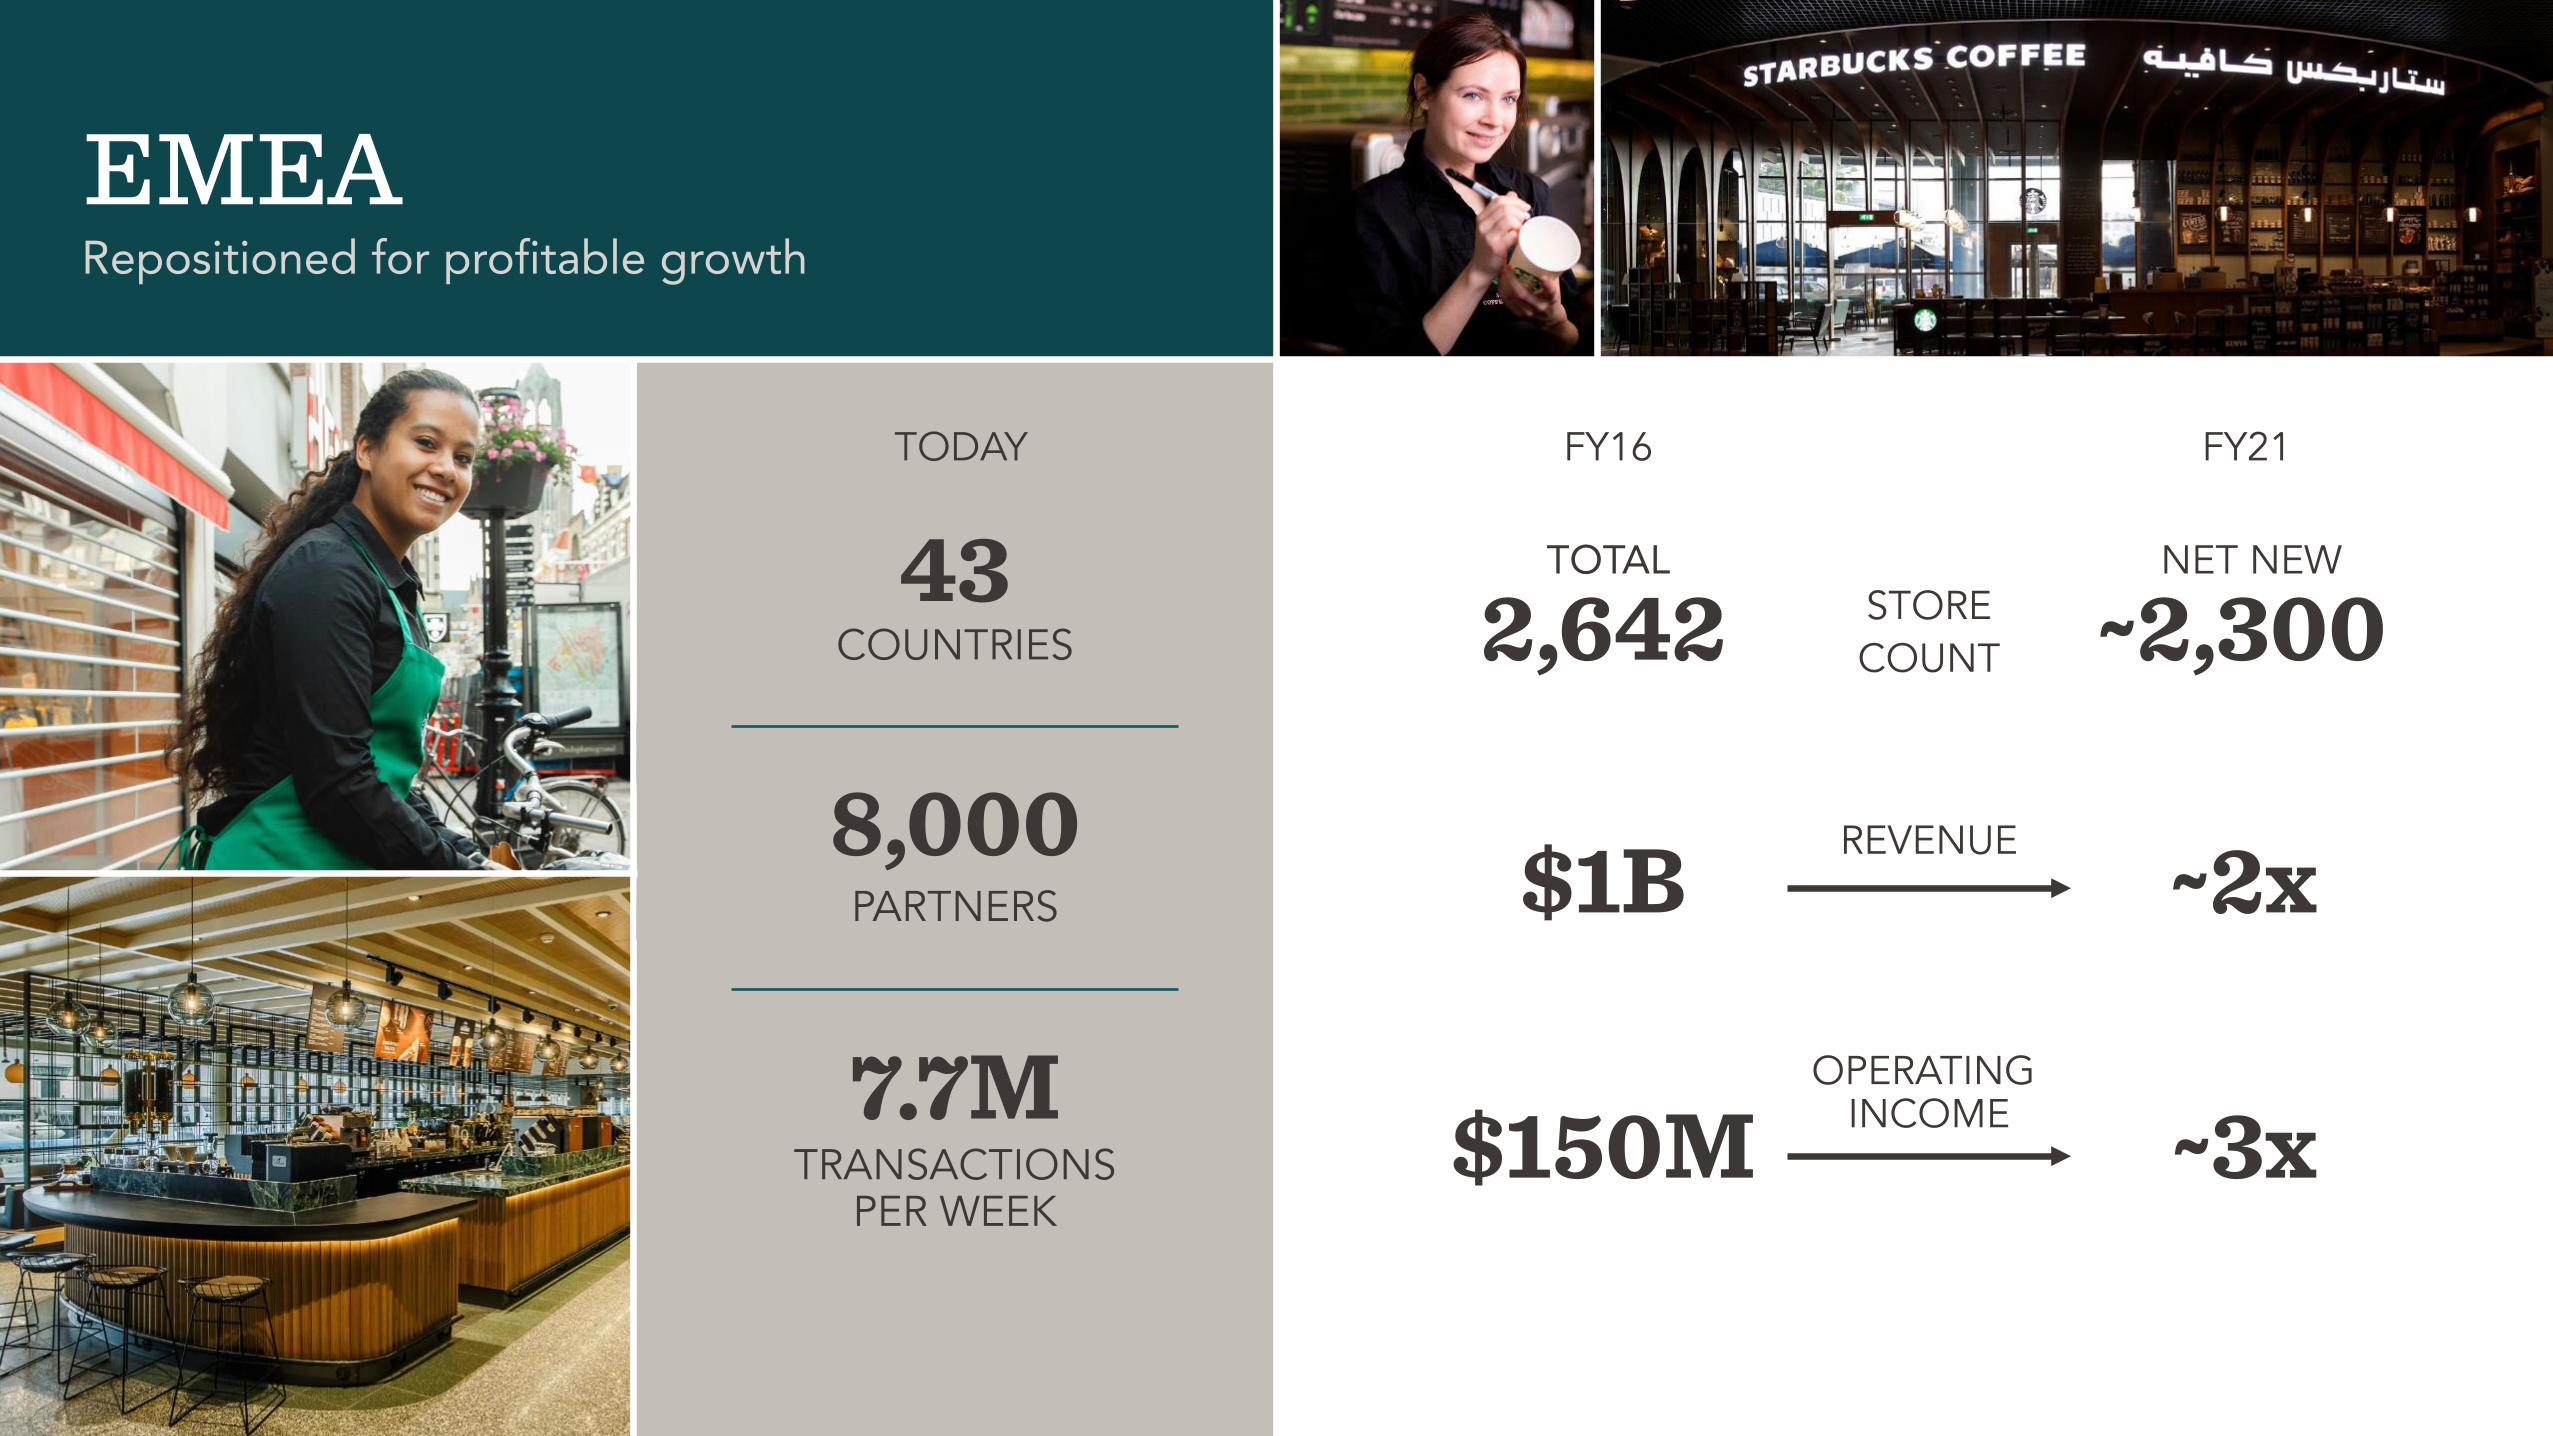
EMEARepositioned for profitable growth
2,642 ~2,300
$1B ~2x
$150M ~3x
COUNTRIES43
PARTNERS
8,000
TRANSACTIONS PER WEEK
7.7M
REVENUE
OPERATING INCOME
STORE COUNT
NET NEWTOTAL
FY16 FY21TODAY
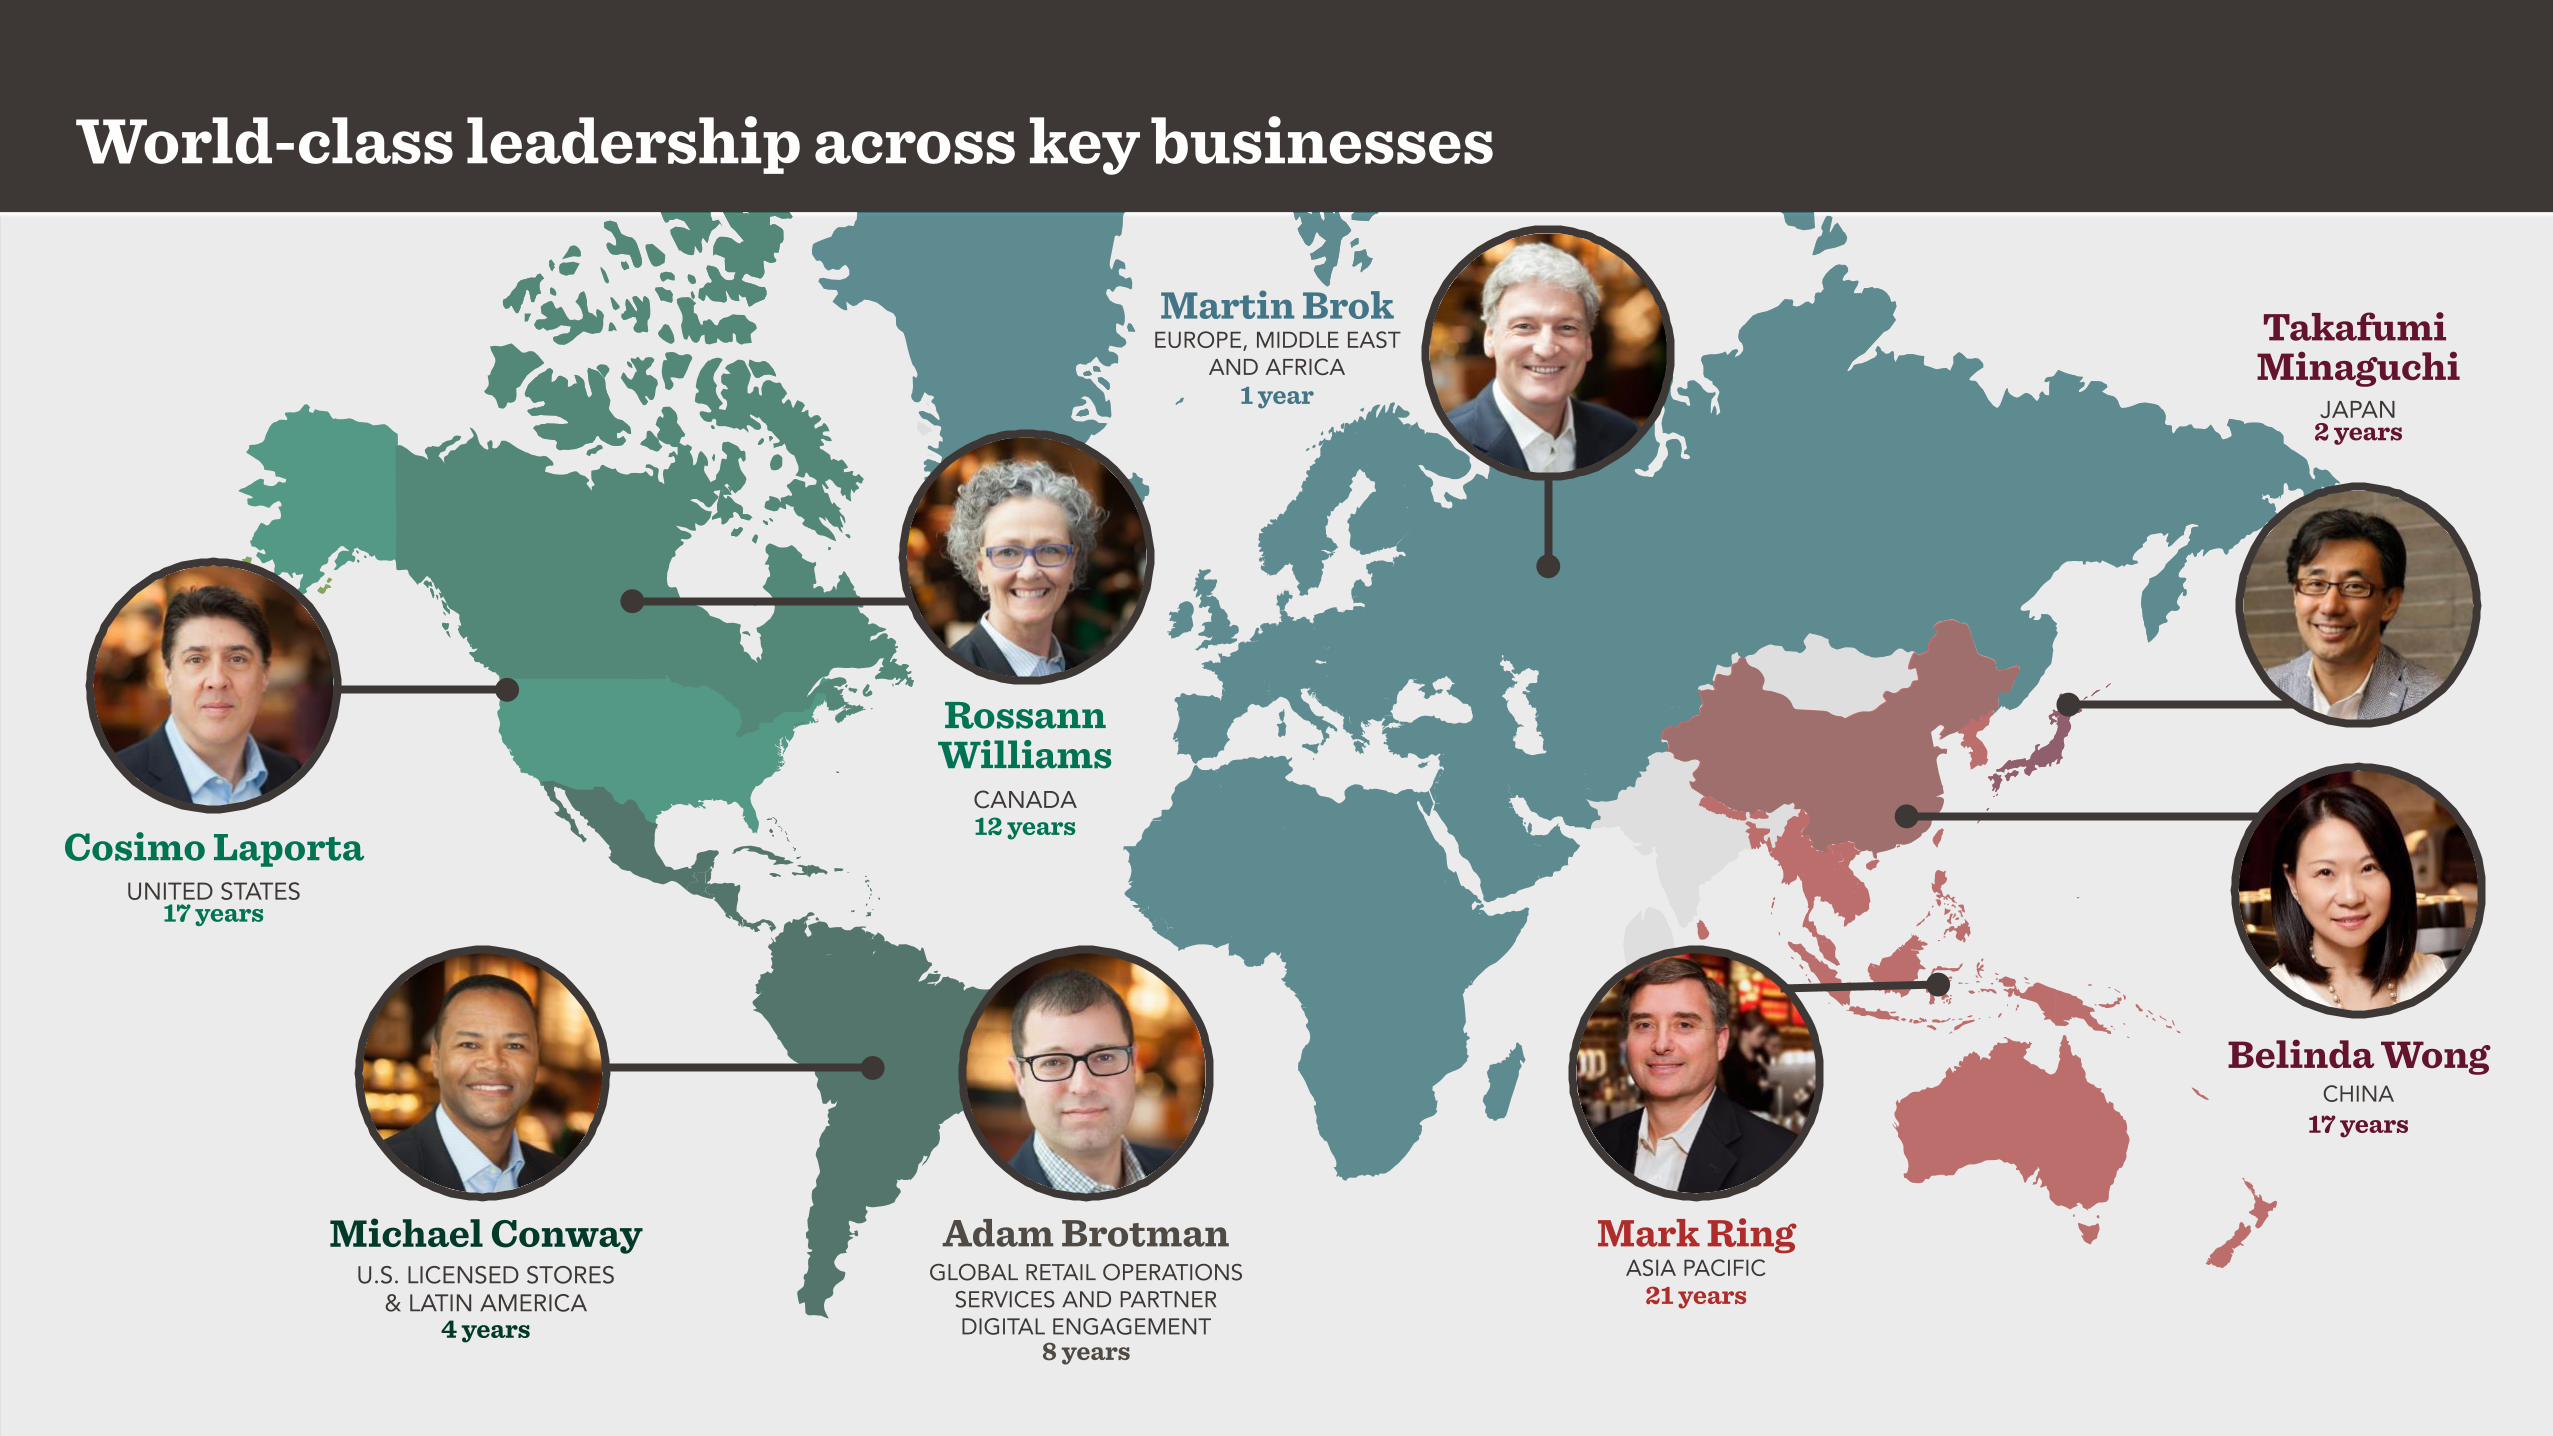
ASIA PACIFIC21 years
Mark RingGLOBAL RETAIL OPERATIONS
SERVICES AND PARTNER DIGITAL ENGAGEMENT
8 years
Adam BrotmanU.S. LICENSED STORES
& LATIN AMERICA4 years
Michael Conway
UNITED STATES17 years
Cosimo LaportaCANADA12 years
RossannWilliams
JAPAN2 years
TakafumiMinaguchi
CHINA17 years
Belinda Wong
World-class leadership across key businesses
1 year
Martin BrokEUROPE, MIDDLE EAST
AND AFRICA
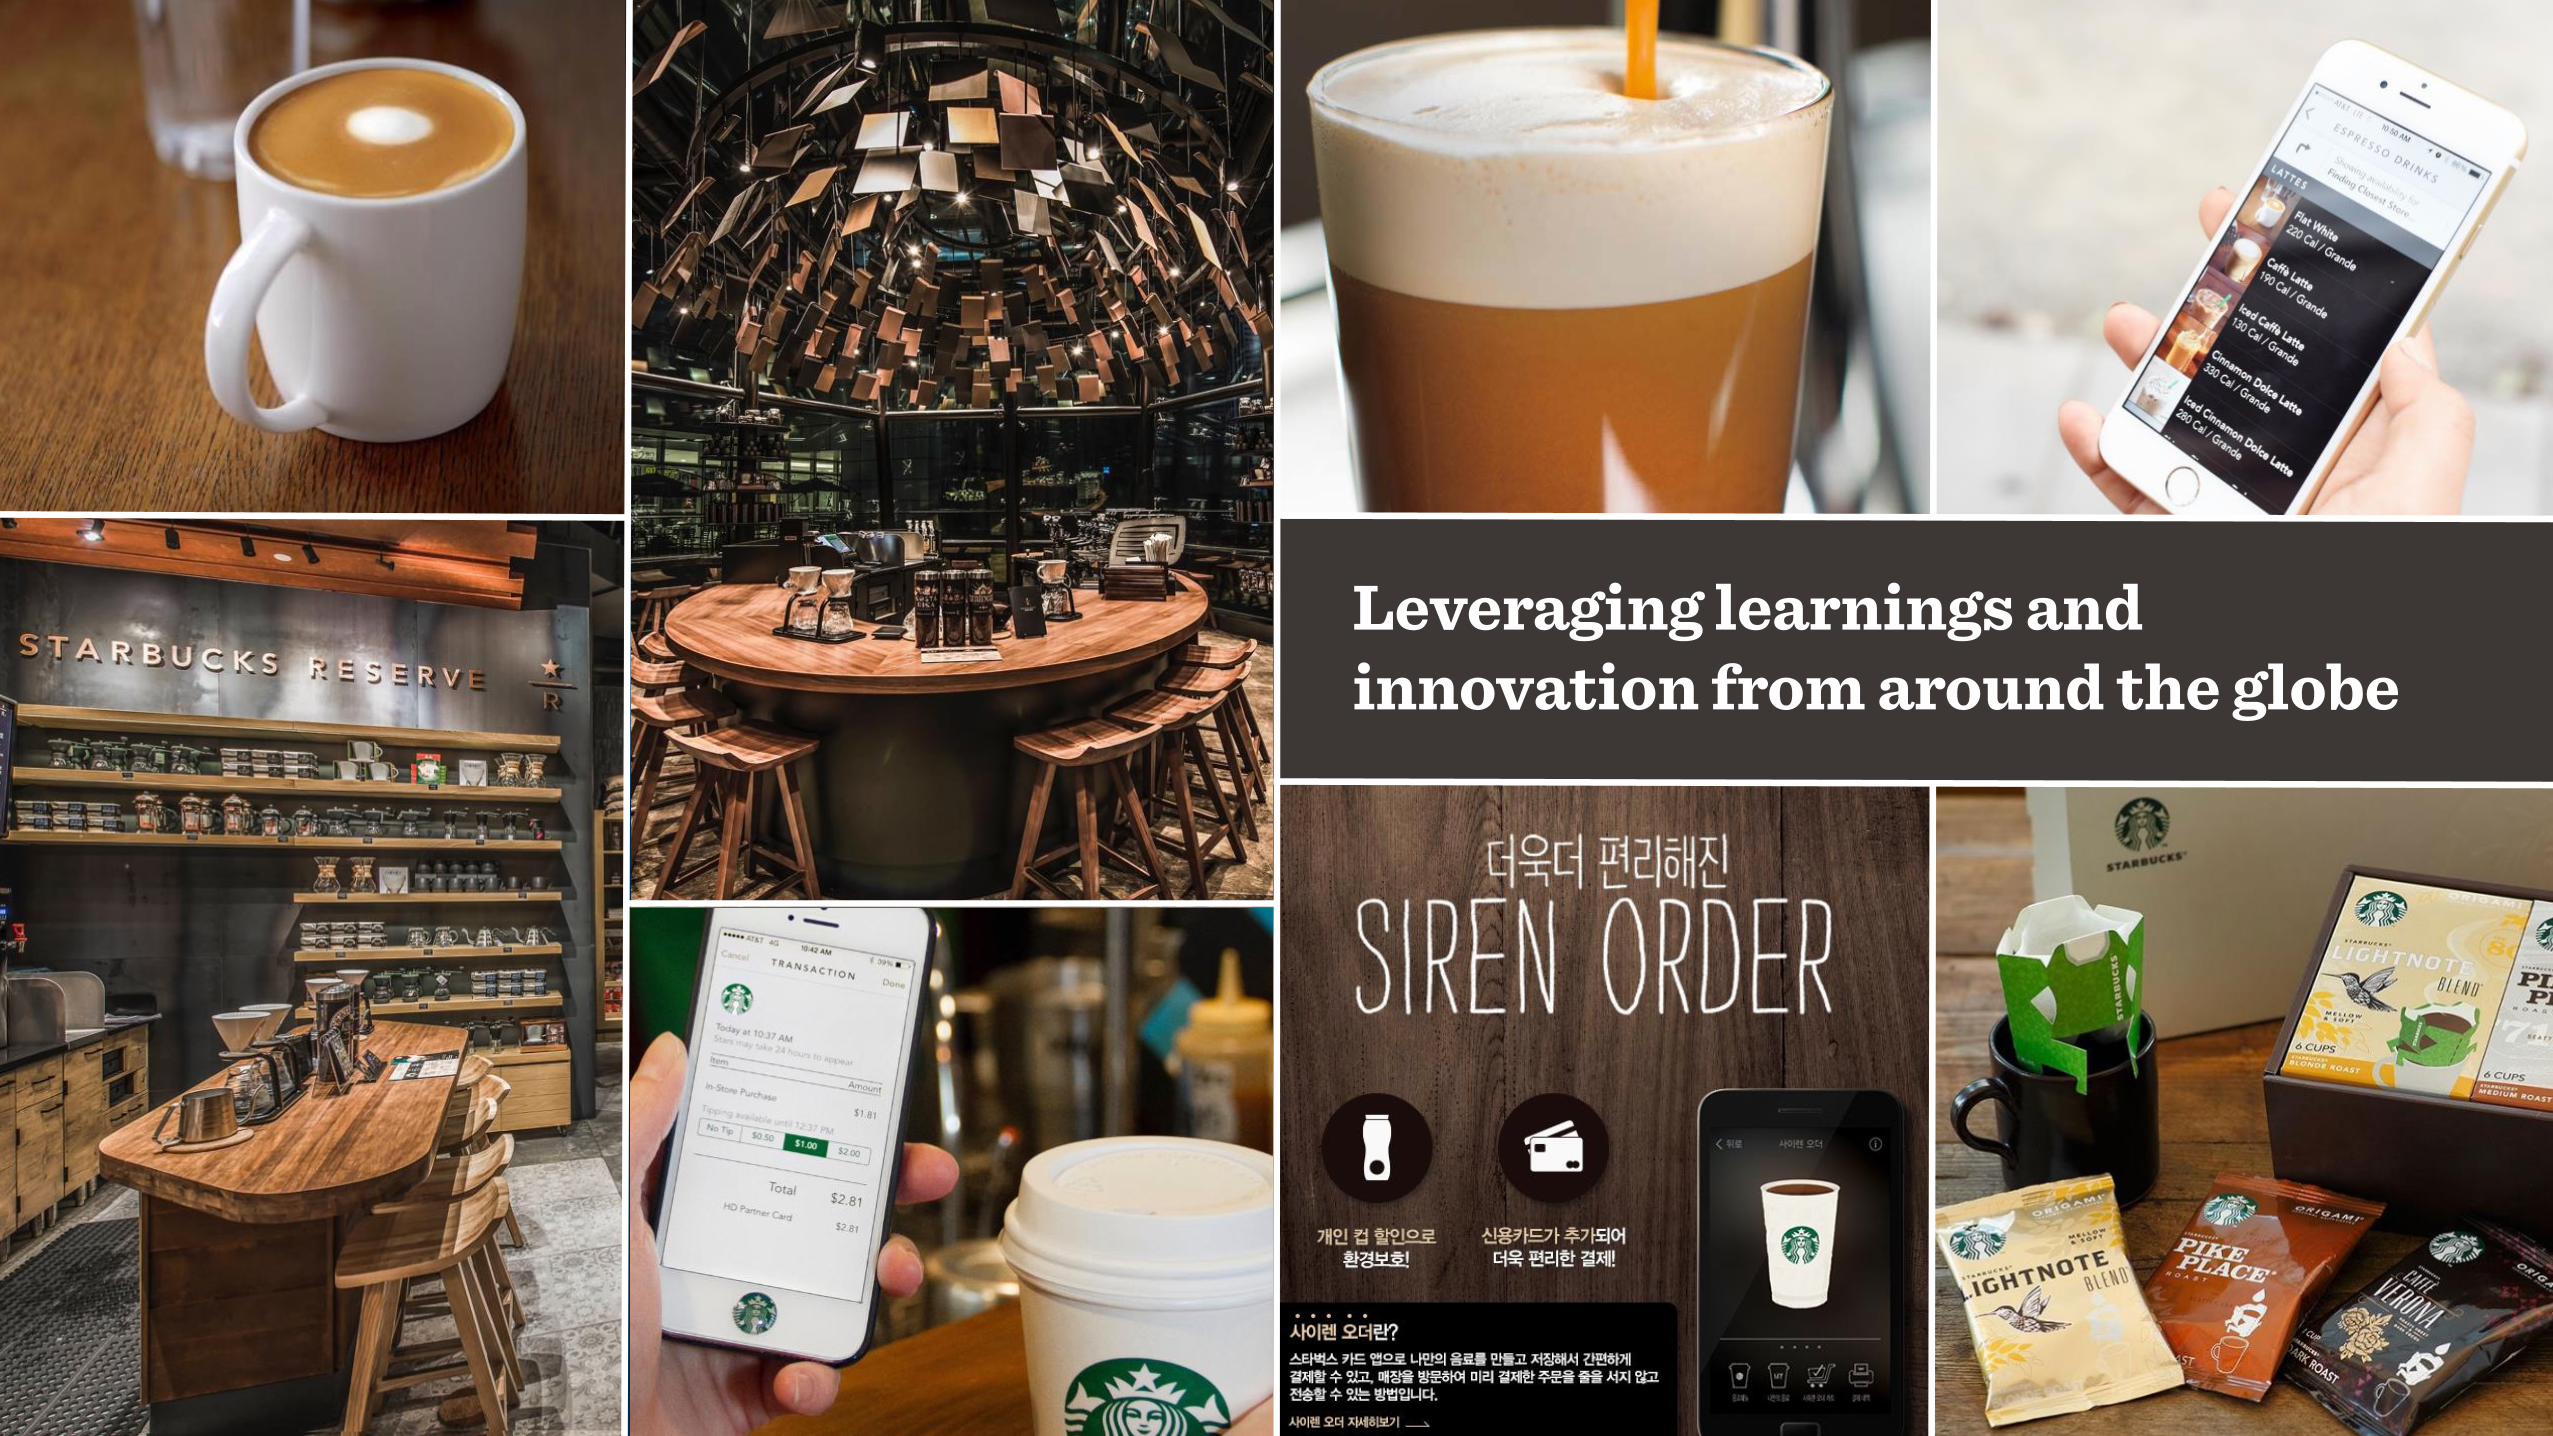
Leveraging learnings and innovation from around the globe
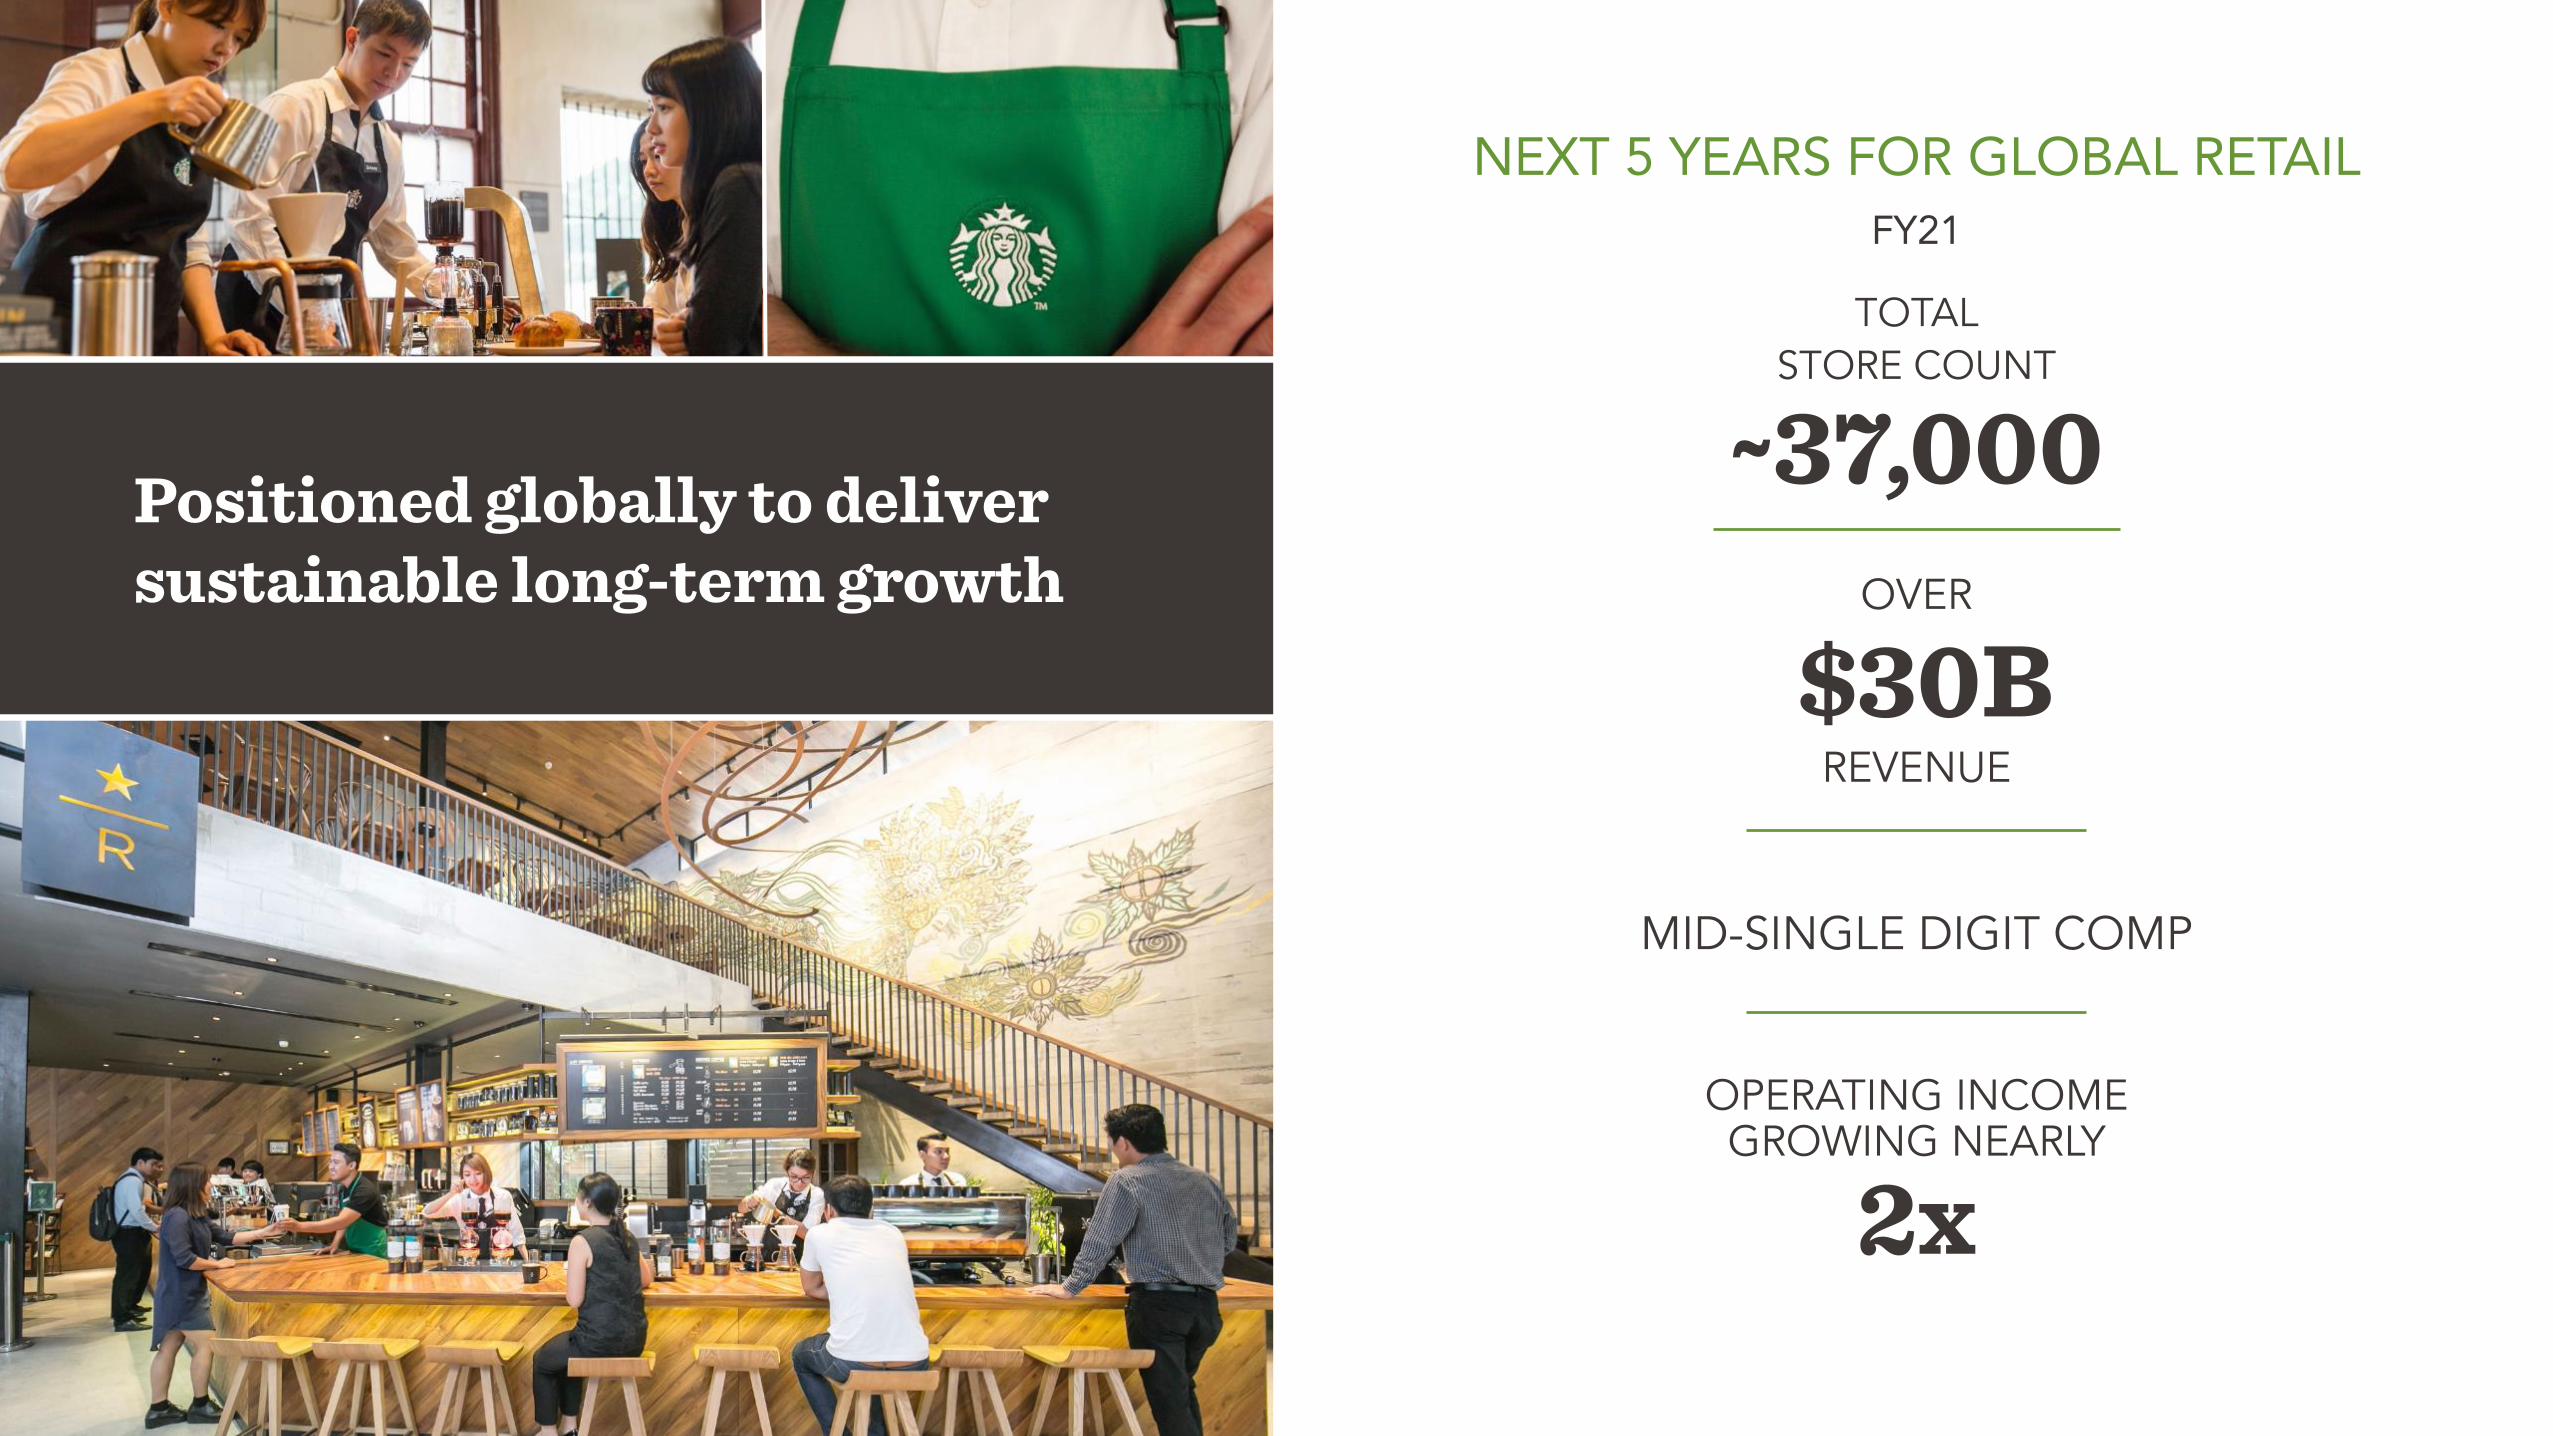
Positioned globally to deliver sustainable long-term growth
NEXT 5 YEARS FOR GLOBAL RETAILFY21
~37,000
OPERATING INCOME GROWING NEARLY
2x
$30BREVENUE
OVER
MID-SINGLE DIGIT COMP
TOTALSTORE COUNT