John Butters, Senior Earnings Analyst Media Questions/Requests Desk/Earnings... · earnings growth...
25
Copyright © 2017 FactSet Research Systems Inc. All rights reserved. FactSet Research Systems Inc. www.factset.com 1 All data published in this report is available on FactSet. Please contact [email protected] or 1-877-FACTSET for more information. Key Metrics • Earnings Scorecard: As of today (with 83% of the companies in the S&P 500 reporting actual results for Q1 2017), 75% of S&P 500 companies have beat the mean EPS estimate and 66% of S&P 500 companies have beat the mean sales estimate. • Earnings Growth: For Q1 2017, the blended earnings growth rate for the S&P 500 is 13.5%. If 13.5% is the actual growth rate for the quarter, it will mark the highest (year-over-year) earnings growth for the index since Q3 2011 (16.7%). • Earnings Revisions: On March 31, the estimated earnings growth rate for Q1 2017 was 9.0%. Nine sectors have higher growth rates today (compared to March 31) due to upward revisions to earnings estimates and upside earnings surprises, led by the Industrials sector. • Earnings Guidance: For Q2 2017, 58 S&P 500 companies have issued negative EPS guidance and 25 S&P 500 companies has issued positive EPS guidance. • Valuation: The forward 12-month P/E ratio for the S&P 500 is 17.5. This P/E ratio is above the 5-year average (15.2) and the 10-year average (14.0). To receive this report via e-mail, please go to www.factset.com/data/news_research/researchdesk To view other market stories with FactSet content, please go to www.factset.com/insight John Butters, Senior Earnings Analyst [email protected] May 5, 2017 Media Questions/Requests [email protected]
Transcript of John Butters, Senior Earnings Analyst Media Questions/Requests Desk/Earnings... · earnings growth...

Copyright © 2017 FactSet Research Systems Inc. All rights reserved. FactSet Research Systems Inc. www.factset.com 1
All data published in this report is available on FactSet. Please contact [email protected] or 1-877-FACTSET for more information.
Key Metrics • Earnings Scorecard: As of today (with 83% of the companies in the S&P 500 reporting actual results for Q1 2017), 75% of
S&P 500 companies have beat the mean EPS estimate and 66% of S&P 500 companies have beat the mean sales estimate.
• Earnings Growth: For Q1 2017, the blended earnings growth rate for the S&P 500 is 13.5%. If 13.5% is the actual growth rate for the quarter, it will mark the highest (year-over-year) earnings growth for the index since Q3 2011 (16.7%).
• Earnings Revisions: On March 31, the estimated earnings growth rate for Q1 2017 was 9.0%. Nine sectors have higher growth rates today (compared to March 31) due to upward revisions to earnings estimates and upside earnings surprises, led by the Industrials sector.
• Earnings Guidance: For Q2 2017, 58 S&P 500 companies have issued negative EPS guidance and 25 S&P 500 companies has issued positive EPS guidance.
• Valuation: The forward 12-month P/E ratio for the S&P 500 is 17.5. This P/E ratio is above the 5-year average (15.2) and the 10-year average (14.0).
To receive this report via e-mail, please go to www.factset.com/data/news_research/researchdesk
To view other market stories with FactSet content, please go to www.factset.com/insight
John Butters, Senior Earnings Analyst
May 5, 2017
Media Questions/Requests

Copyright © 2017 FactSet Research Systems Inc. All rights reserved. FactSet Research Systems Inc. www.factset.com 2
Topic of the Week:
Are Any Retailers Reporting Earnings Growth for Q1?
The next several weeks will be focus weeks for retail earnings for the S&P 500, as 25 of the 87 remaining companies in the index that have yet to report actual results for the first quarter are retailers. As of today, which retail sub-industries and companies in the S&P 500 have reported or are projected to report the highest earnings growth for the first quarter?
Of the 13 retail sub-industries in the S&P 500, just four have reported or are expected to report earnings growth for the first quarter, led by the Internet & Direct Marketing Retail and Home Improvement Retail sub-industries.
The Internet Direct Marketing Retail sub-industry is expected to report the highest earnings growth of all 13 retail sub-industries at 22.4%. However, only two of the five companies in this sub-industry have reported or are expected to report earnings growth for the first quarter: Amazon.com ($1.48 vs. $1.07) and Netflix ($0.40 vs. $0.06).
The Home Improvement Retail sub-industry is projected to report the second highest earnings growth at 9.6%. Both companies in this sub-industry are expected to report earnings growth for the quarter, led by Lowe’s Companies. The mean EPS estimate for Lowe’s Companies is $1.05, compared to year-ago EPS of $0.87. Lowe’s Companies is scheduled to release results on May 24.
At the company level, 18 of the 37 S&P 500 companies in these 13 retail sub-industries are expected to report or have already reported EPS growth for the first quarter, led by Netflix (+567%), Amazon.com (+38%), Ulta Beauty (+24%), and Lowe’s Companies (+21%).
Copyright © 2017 FactSet Research Systems Inc. All rights reserved. FactSet Research Systems Inc. www.factset.com 3
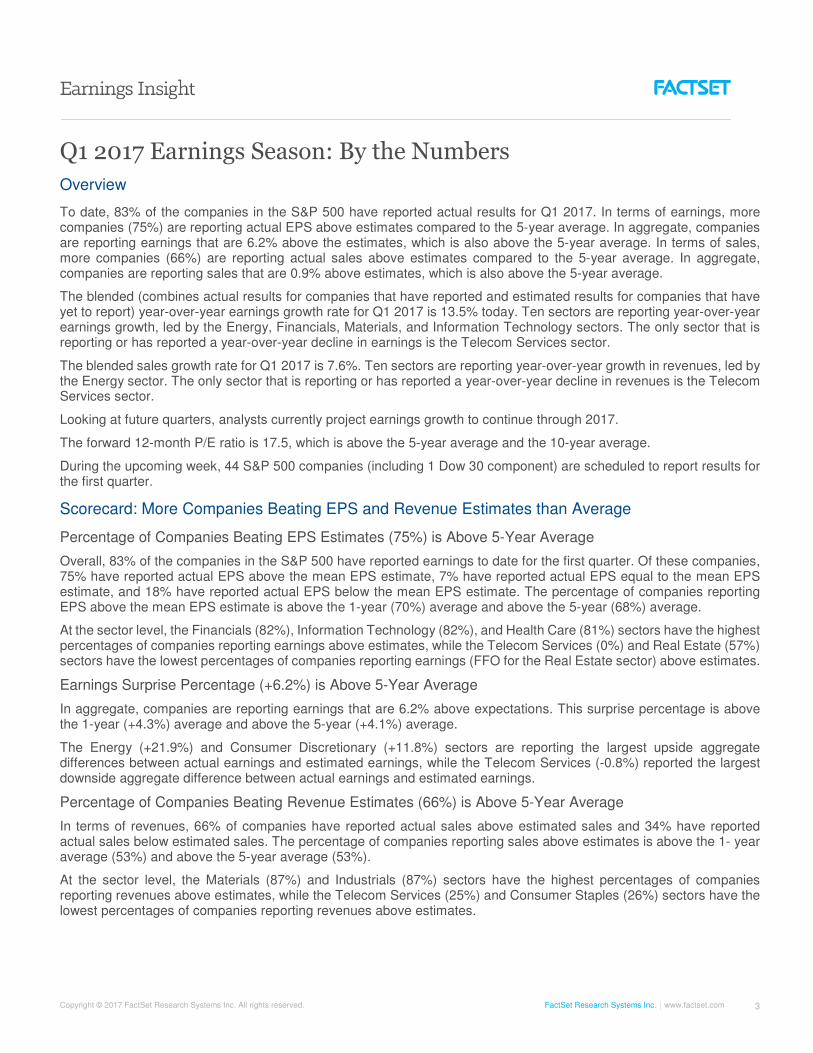
Q1 2017 Earnings Season: By the Numbers
Overview
To date, 83% of the companies in the S&P 500 have reported actual results for Q1 2017. In terms of earnings, more companies (75%) are reporting actual EPS above estimates compared to the 5-year average. In aggregate, companies are reporting earnings that are 6.2% above the estimates, which is also above the 5-year average. In terms of sales, more companies (66%) are reporting actual sales above estimates compared to the 5-year average. In aggregate, companies are reporting sales that are 0.9% above estimates, which is also above the 5-year average.
The blended (combines actual results for companies that have reported and estimated results for companies that have yet to report) year-over-year earnings growth rate for Q1 2017 is 13.5% today. Ten sectors are reporting year-over-year earnings growth, led by the Energy, Financials, Materials, and Information Technology sectors. The only sector that is reporting or has reported a year-over-year decline in earnings is the Telecom Services sector.
The blended sales growth rate for Q1 2017 is 7.6%. Ten sectors are reporting year-over-year growth in revenues, led by the Energy sector. The only sector that is reporting or has reported a year-over-year decline in revenues is the Telecom Services sector.
Looking at future quarters, analysts currently project earnings growth to continue through 2017.
The forward 12-month P/E ratio is 17.5, which is above the 5-year average and the 10-year average.
During the upcoming week, 44 S&P 500 companies (including 1 Dow 30 component) are scheduled to report results for the first quarter.
Scorecard: More Companies Beating EPS and Revenue Estimates than Average
Percentage of Companies Beating EPS Estimates (75%) is Above 5-Year Average
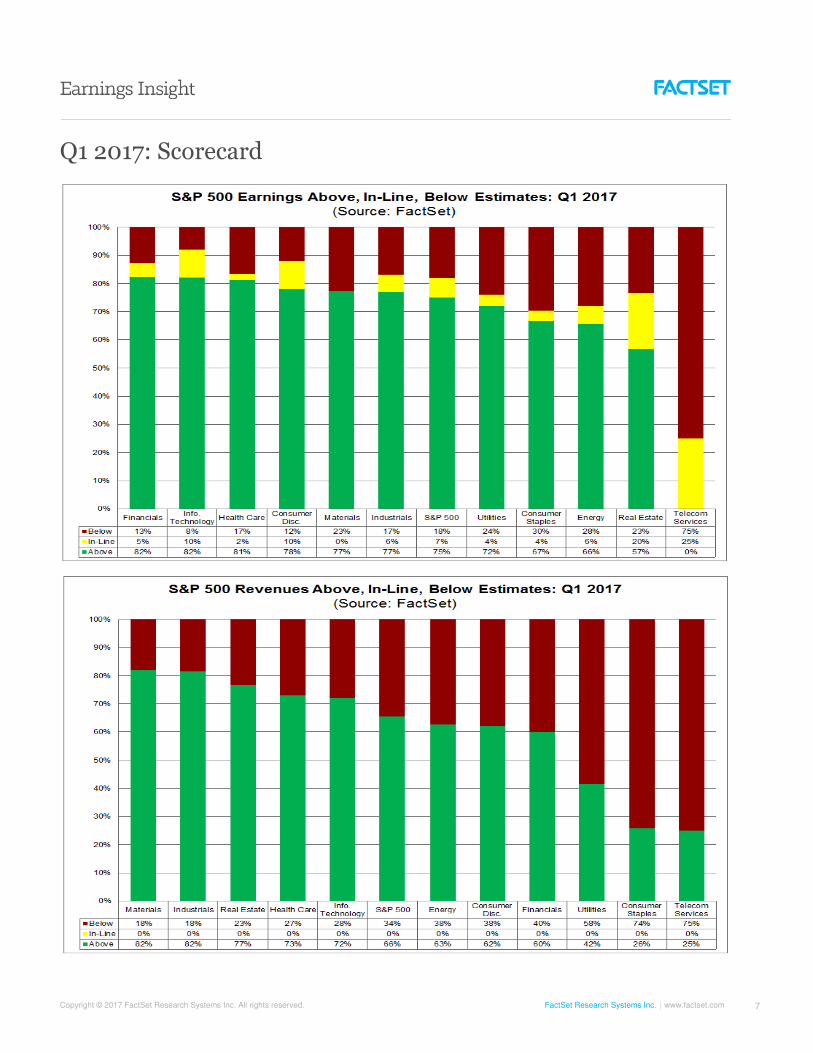
Overall, 83% of the companies in the S&P 500 have reported earnings to date for the first quarter. Of these companies, 75% have reported actual EPS above the mean EPS estimate, 7% have reported actual EPS equal to the mean EPS estimate, and 18% have reported actual EPS below the mean EPS estimate. The percentage of companies reporting EPS above the mean EPS estimate is above the 1-year (70%) average and above the 5-year (68%) average.
At the sector level, the Financials (82%), Information Technology (82%), and Health Care (81%) sectors have the highest percentages of companies reporting earnings above estimates, while the Telecom Services (0%) and Real Estate (57%) sectors have the lowest percentages of companies reporting earnings (FFO for the Real Estate sector) above estimates.
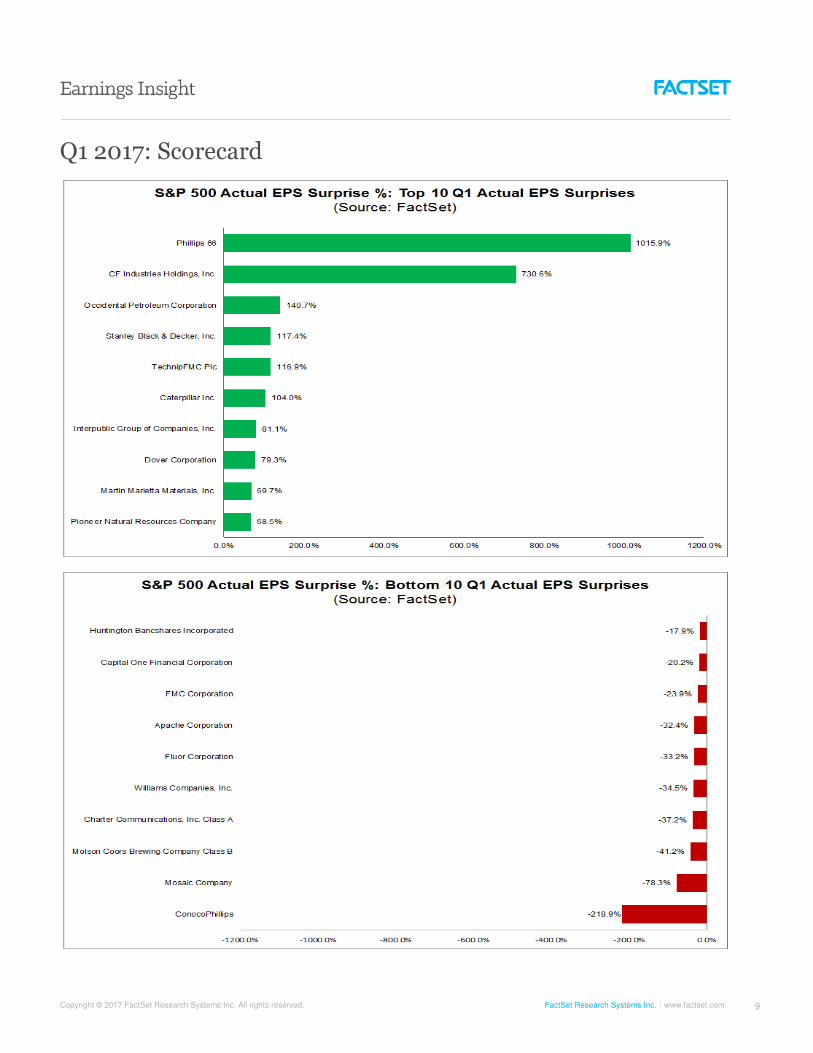
Earnings Surprise Percentage (+6.2%) is Above 5-Year Average
In aggregate, companies are reporting earnings that are 6.2% above expectations. This surprise percentage is above the 1-year (+4.3%) average and above the 5-year (+4.1%) average.
The Energy (+21.9%) and Consumer Discretionary (+11.8%) sectors are reporting the largest upside aggregate differences between actual earnings and estimated earnings, while the Telecom Services (-0.8%) reported the largest downside aggregate difference between actual earnings and estimated earnings.
Percentage of Companies Beating Revenue Estimates (66%) is Above 5-Year Average
In terms of revenues, 66% of companies have reported actual sales above estimated sales and 34% have reported actual sales below estimated sales. The percentage of companies reporting sales above estimates is above the 1- year average (53%) and above the 5-year average (53%).
At the sector level, the Materials (87%) and Industrials (87%) sectors have the highest percentages of companies reporting revenues above estimates, while the Telecom Services (25%) and Consumer Staples (26%) sectors have the lowest percentages of companies reporting revenues above estimates.

Copyright © 2017 FactSet Research Systems Inc. All rights reserved. FactSet Research Systems Inc. www.factset.com 4
Revenue Surprise Percentage (+0.9%) is Above 5-Year Average
In aggregate, companies are reporting sales that are 0.9% above expectations. This surprise percentage is above the 1-year (0.0%) average and above the 5-year (+0.1%) average.
The Materials (+3.6%) and Consumer Discretionary (+2.6%) sectors are reporting the largest upside aggregate differences between actual sales and estimated sales, while the Telecom Services (-2.4%) sector reported the largest downside aggregate difference between actual earnings and estimated earnings.
Increase in Blended Earnings Growth This Week Due to Upside Surprises in Multiple Sectors
Increase in Blended Earnings Growth This Week Due to Upside Surprises in Multiple Sectors
The blended earnings growth rate for the first quarter is 13.5% this week, which is higher than the earnings growth rate of 12.6% last week. Upside earnings surprises reported by companies in the Financials, Information Technology, Health Care, Utilities, and Consumer Discretionary sectors were mainly responsible for the increase in the overall earnings growth rate for the index during the past week.
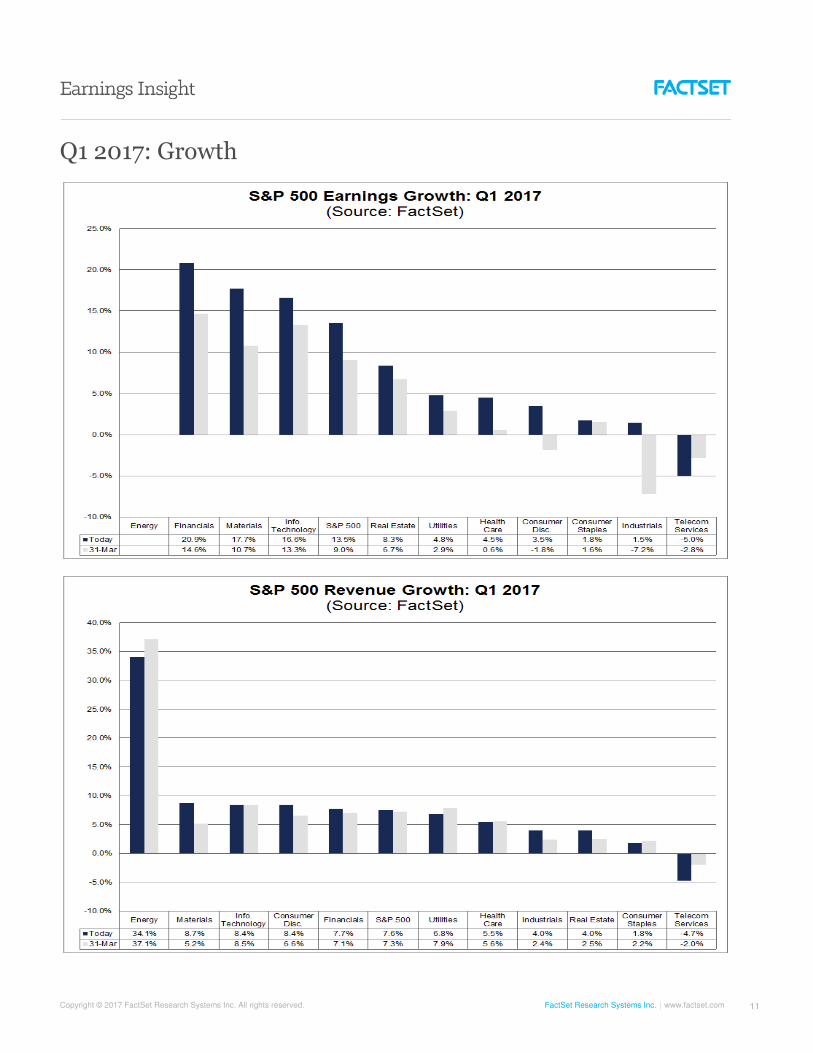
Industrials Sector Has Seen Largest Increase in Earnings since March 31
The blended earnings growth rate for Q1 2017 of 13.5% is higher than the estimate of 9.0% at the end of the first quarter (March 31). Nine sectors have recorded an increase in earnings growth since the end of the quarter due to upward revisions to earnings estimates and upside earnings surprises, led by the Industrials (to 1.5% from -7.2%), Materials (to 17.7% from 10.7%), and Financials (to 20.9% from 14.6%) sectors. The only sector that has recorded a decrease in earnings growth since the end of the quarter due to downward revisions to estimates and downside earnings surprises is the Telecom Services (to -5.0% from -2.8%) sector. A growth rate is not being calculated for the Energy sector for the first quarter.
Earnings Growth: Highest Earnings Growth (13.5%) since Q3 2011 (16.7%)
The blended earnings growth rate for Q1 2017 is 13.5%. If 13.5% is the actual earnings growth rate for the quarter, it will mark the highest year-over-year earnings growth reported by the index since Q3 2011 (16.7%). The first quarter will also mark the first time the index has seen year-over-year growth in earnings for three consecutive quarters since Q3 2014 through Q1 2015. Ten sectors are reporting year-over-year growth in earnings, led by the Energy, Financials, Materials, and Information Technology sectors. The only sector that is reporting or has reported a year-over-year decline in earnings is the Telecom Services sector.
Energy: Largest Contributor to Earnings Growth for Q1
A growth rate is not being calculated for the Energy sector because the sector reported a loss in the year-ago quarter. On a dollar-level basis, the Energy sector is reporting earnings of $8.5 billion in Q1 2017, compared to a loss of -1.5 billion in Q1 2016. Due to this $10.0 billion year-over-year increase in earnings, the Energy sector is the largest contributor to earnings growth for the S&P 500 as a whole. If this sector is excluded, the blended earnings growth rate for the remaining ten sectors would fall to 9.3% from 13.5%
At the sub-industry level, four of the six sub-industries in the sector are reporting or have reported earnings growth: Oil & Gas Exploration & Production (N/A due to year-ago loss), Integrated Oil & Gas (558%), Oil & Gas Equipment & Services (41%), and Oil & Gas Storage & Transportation (14%). On the other hand, the Oil & Gas Drilling (-210%) and Oil & Gas Refining & Marketing (-14%) sub-industries are the only two sub-industries that are reporting or have reported a year-over-year decline in earnings.
Financials: Balanced Growth Across Sector
The Financials sector is reporting the highest (year-over-year) earnings growth rate of all eleven sectors at 20.9%. At the industry level, four of the five industries in this sector are reporting or have reported earnings growth. All four of these industries are reporting or have reported double-digit earnings growth: Diversified Financial Services (55%), Capital Markets (37%), Banks (19%), and Insurance (18%). At the company level, Bank of America is the largest contributor to

Copyright © 2017 FactSet Research Systems Inc. All rights reserved. FactSet Research Systems Inc. www.factset.com 5
earnings growth for this sector. The company reported actual EPS of $0.41 for Q1 2017, compared to year-ago EPS of $0.21.
Materials: Metals & Mining Industry Leads Growth
The Materials sector is reporting the second highest (year-over-year) earnings growth rate of all eleven sectors at 17.7%. At the industry level, two of the four industries in this sector are reporting or have reported earnings growth, led by the Metals & Mining (792%) industry. The Metals & Mining industry is also the largest contributor to earnings growth for the sector. If this industry is excluded, the blended earnings growth rate for the Materials sector would fall to 9.3% from 17.7%. At the company level, Freeport-McMoRan is the largest contributor to earnings growth for the sector. The company reported actual EPS of $0.15 for Q1 2017, compared to year-ago EPS of -$0.16. If this company alone is excluded, the blended earnings growth rate for the Materials sector would fall to 11.8% from 17.7%.
Information Technology: Balanced Growth Across Sector, Led by Semiconductor Industry
The Information Technology sector is reporting the third highest (year-over-year) earnings growth rate of all eleven sectors at 16.6%. At the industry level, all seven industries in this sector are reporting or have reported earnings growth. Four of these seven industries are reporting or have reported double-digit earnings growth: Semiconductor & Semiconductor Equipment (55%), Electronic Equipment, Instruments, & Components (21%), Internet Software & Services (13%), and Software (13%). The Semiconductor and Semiconductor Equipment industry is also the largest contributor to earnings growth for the sector. If this industry is excluded, the blended earnings growth rate for the Information Technology sector would fall to 10.0% from 16.6%. At the company level, Micron Technology is the largest contributor to earnings growth for this sector. Micron Technology reported actual EPS of $0.90 for Q1 2017, compared to year-ago EPS of -$0.05.
Telecom Services: Verizon Led Decline
The Telecom Services sector is the only sector that has reported a (year-over-year) decline in earnings at -5.0%. Of the four companies in the sector, Verizon was the largest contributor to the decline in earnings. The company reported actual EPS of $0.95 for Q1 2017, compared to year-ago EPS of $1.06. If this company is excluded, the actual earnings decline for the Telecom Services sector would improve to -0.4% from -5.0%.
Revenues: Highest Revenue Growth (7.6%) since Q4 2011 (8.1%)
The blended revenue growth rate for Q1 2017 is 7.6%. If 7.6% is the actual revenue growth rate for the quarter, it will mark the highest year-over-year revenue growth reported by the index since Q4 2011 (8.1%). The first quarter will also mark the first time the index has seen year-over-year growth in sales for three consecutive quarters since Q2 2014 through Q4 2014. Ten sectors are reporting year-over-year growth in revenues, led by the Energy sector. The only sector that is reporting or has reported a decline in revenues is the Telecom Services sector.
Energy: Largest Contributor to Revenue Growth for Q1
The Energy sector is reporting the highest (year-over-year) revenue growth of all eleven sectors at 34.1%. At the sub-industry level, five of the six sub-industries in the sector are reporting or have reported revenue growth: Oil & Gas Exploration & Production (54%), Oil & Gas Refining & Marketing (38%), Integrated Oil & Gas (34%), Oil & Gas Storage & Transportation (23%), and Oil & Gas Equipment & Services (11%). On the other hand, the Oil & Gas Drilling (-33%) sub-industry is the only sub-industry that has reported a year-over-year decline in earnings.
This sector is also the largest contributor to revenue growth for the S&P 500. If the Energy sector is excluded, the blended earnings growth rate for the index would fall to 5.7% from 7.6%.
Telecom Services: Verizon Leads Decline
The Telecom Services sector is the only sector that reported a (year-over-year) decline in sales at -4.7%. All four companies in the sector reported a decline in sales, led by Verizon (-7%).

Copyright © 2017 FactSet Research Systems Inc. All rights reserved. FactSet Research Systems Inc. www.factset.com 6
Looking Ahead: Forward Estimates and Valuation
Guidance: Negative EPS Guidance (70%) for Q2 Below Average
At this point in time, 83 companies in the index have issued EPS guidance for Q2 2017. Of these 83 companies, 58 have issued negative EPS guidance and 25 have issued positive EPS guidance. The percentage of companies issuing negative EPS guidance is 70% (58 out of 83), which is below the 5-year average of 74%.
Growth Expected to Continue for Remainder of 2017
For the first quarter, companies are reporting earnings growth of 13.5% and revenue growth rate of 7.6%. Analysts currently expect earnings and revenue growth to continue in 2017.
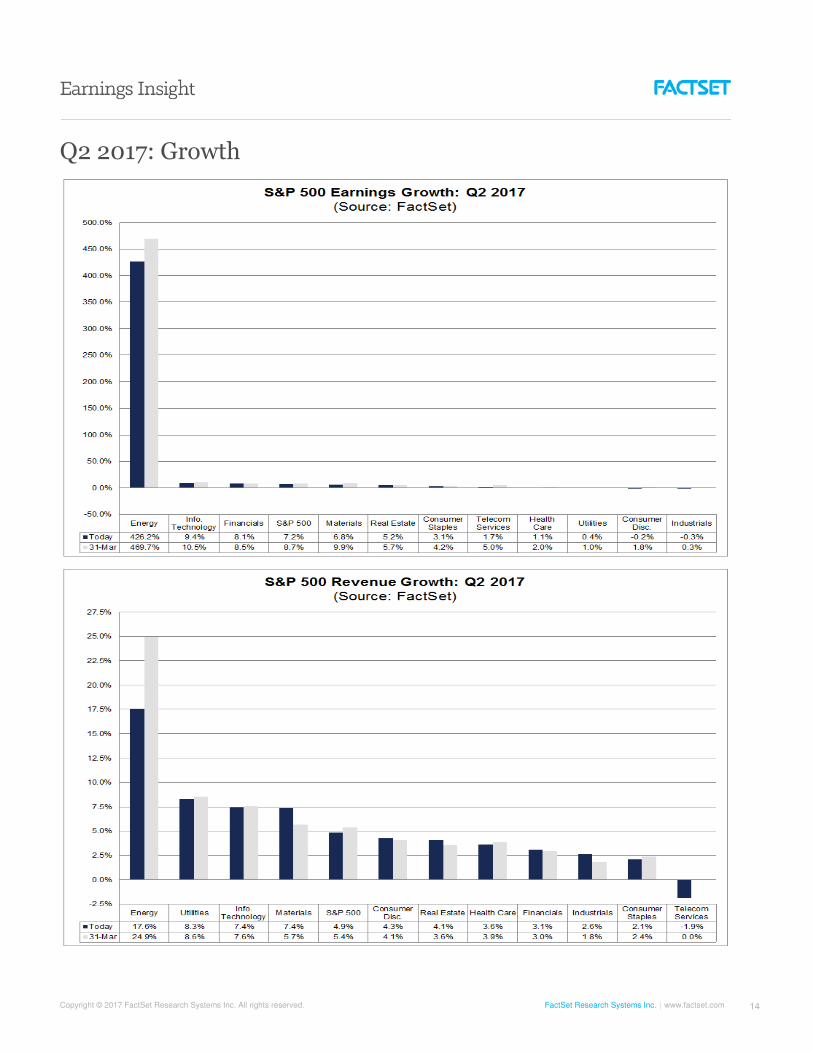
For Q2 2017, analysts are projecting earnings growth of 7.2% and revenue growth of 4.9%.
For Q3 2017, analysts are projecting earnings growth of 7.7% and revenue growth of 4.8%.
For Q4 2017, analysts are projecting earnings growth of 12.5% and revenue growth of 5.2%.
For all of 2017, analysts are projecting earnings growth of 10.0% and revenue growth of 5.2%.
Valuation: Forward P/E Ratio is 17.5, above the 10-Year Average (14.0)
The forward 12-month P/E ratio is 17.5. This P/E ratio is above the 5-year average of 15.2, and above the 10-year average of 14.0. It is also equal to the forward 12-month P/E ratio of 17.5 recorded at the start of the second quarter (March 31). Since the start of the second quarter, the price of the index has decreased by 1.1%, while the forward 12-month EPS estimate has increased by 1.4%.
At the sector level, the Energy (27.6) sector has the highest forward 12-month P/E ratio, while the Telecom Services (12.9) sector has the lowest forward 12-month P/E ratio. Nine sectors have forward 12-month P/E ratios that are above their 10-year averages, led by the Energy (27.6 vs. 18.2) sector. One sector (Telecom Services) has a forward 12-month P/E ratio that is below the 10-year average (12.9 vs. 14.3). Historical averages are not available for the Real Estate sector.
Companies Reporting Next Week: 44
During the upcoming week, 44 S&P 500 companies (including 1 Dow 30 component) are scheduled to report results for the first quarter.
Copyright © 2017 FactSet Research Systems Inc. All rights reserved. FactSet Research Systems Inc. www.factset.com 7
Q1 2017: Scorecard

Copyright © 2017 FactSet Research Systems Inc. All rights reserved. FactSet Research Systems Inc. www.factset.com 8
Q1 2017: Scorecard
Copyright © 2017 FactSet Research Systems Inc. All rights reserved. FactSet Research Systems Inc. www.factset.com 9
Q1 2017: Scorecard

Copyright © 2017 FactSet Research Systems Inc. All rights reserved. FactSet Research Systems Inc. www.factset.com 10
Q1 2017: Projected EPS Surprises (Sharp Estimates)
Copyright © 2017 FactSet Research Systems Inc. All rights reserved. FactSet Research Systems Inc. www.factset.com 11
Q1 2017: Growth

Copyright © 2017 FactSet Research Systems Inc. All rights reserved. FactSet Research Systems Inc. www.factset.com 12
Q2 2017: Guidance

Copyright © 2017 FactSet Research Systems Inc. All rights reserved. FactSet Research Systems Inc. www.factset.com 13
Q2 2017: EPS Revisions
Copyright © 2017 FactSet Research Systems Inc. All rights reserved. FactSet Research Systems Inc. www.factset.com 14
Q2 2017: Growth

Copyright © 2017 FactSet Research Systems Inc. All rights reserved. FactSet Research Systems Inc. www.factset.com 15
CY 2017: Growth

Copyright © 2017 FactSet Research Systems Inc. All rights reserved. FactSet Research Systems Inc. www.factset.com 16
CY 2018: Growth
Copyright © 2017 FactSet Research Systems Inc. All rights reserved. FactSet Research Systems Inc. www.factset.com 17
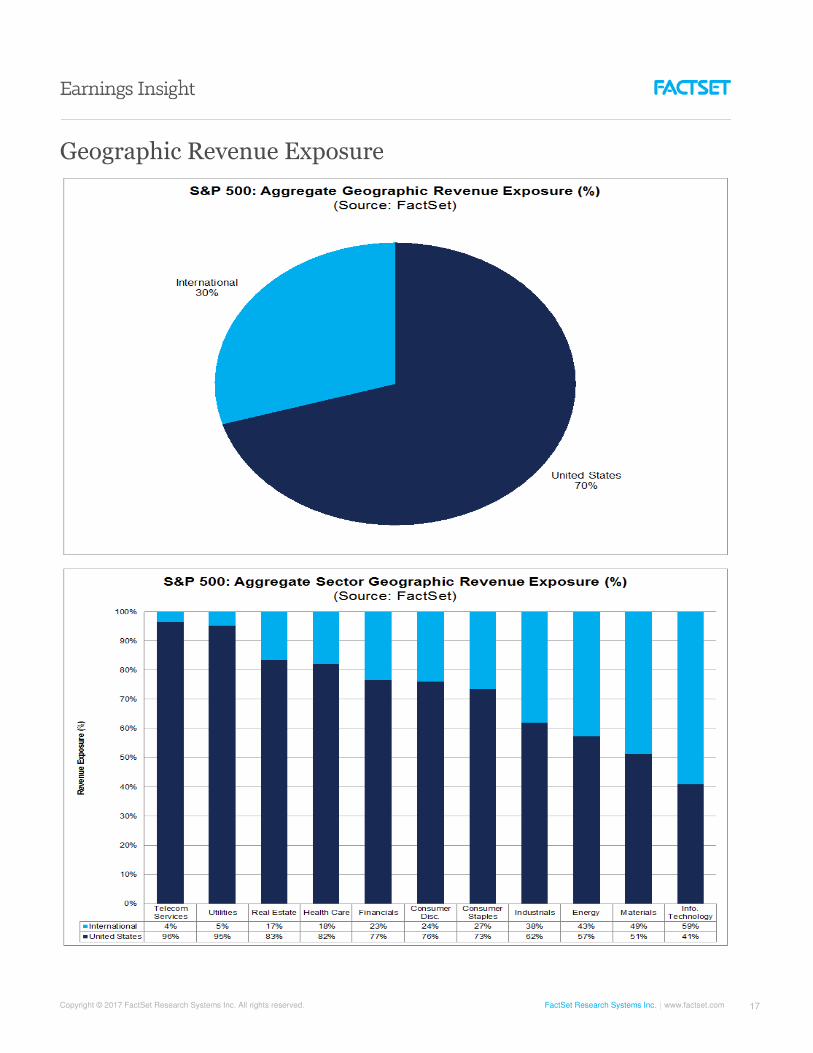
Geographic Revenue Exposure

Copyright © 2017 FactSet Research Systems Inc. All rights reserved. FactSet Research Systems Inc. www.factset.com 18
Bottom-up EPS Estimates: Revisions
Copyright © 2017 FactSet Research Systems Inc. All rights reserved. FactSet Research Systems Inc. www.factset.com 19
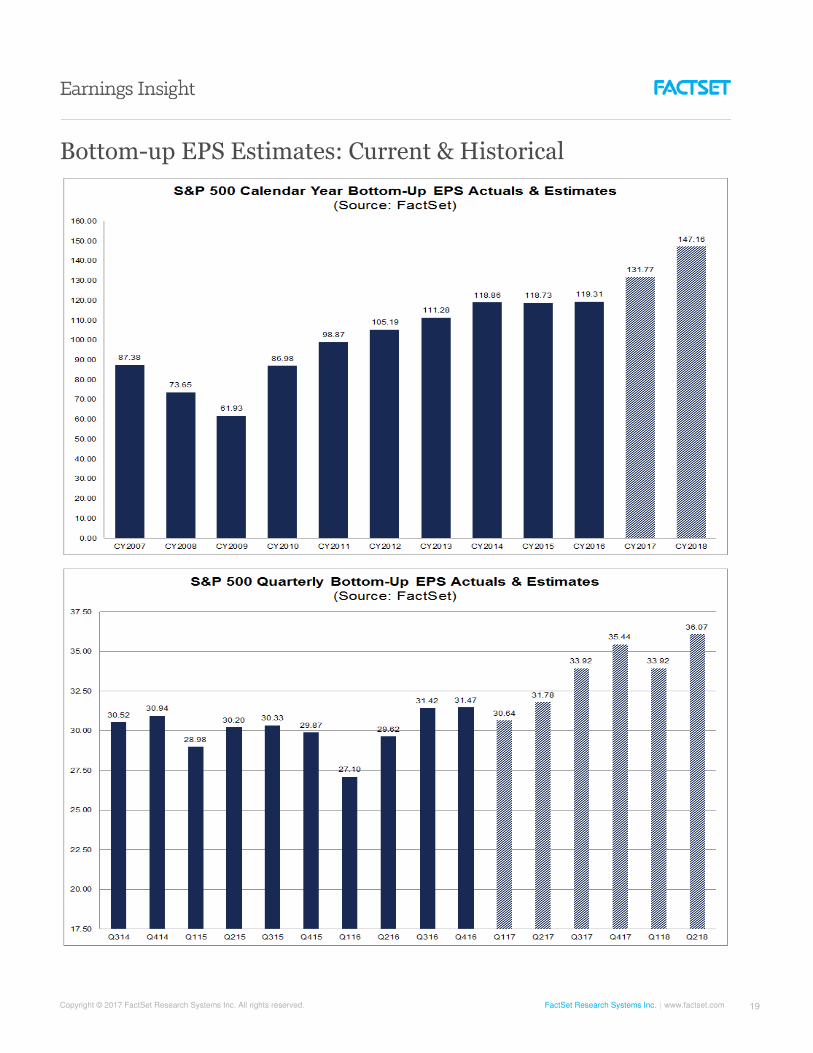
Bottom-up EPS Estimates: Current & Historical
Copyright © 2017 FactSet Research Systems Inc. All rights reserved. FactSet Research Systems Inc. www.factset.com 20
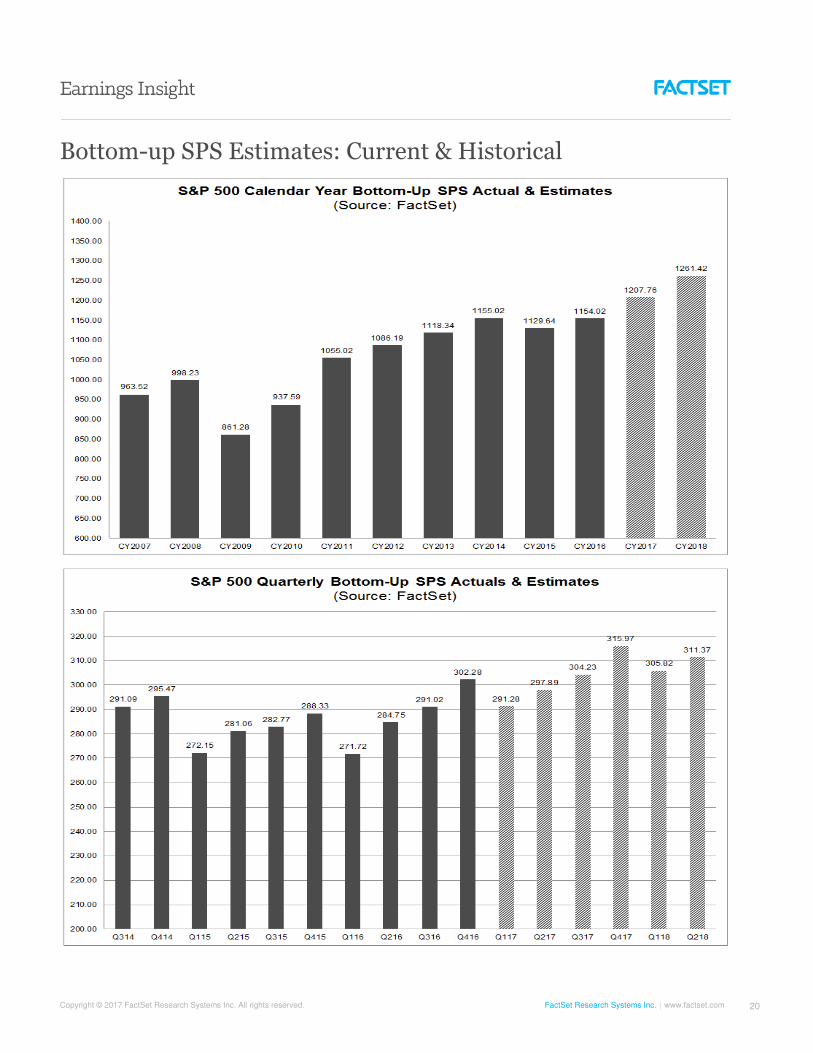
Bottom-up SPS Estimates: Current & Historical
Copyright © 2017 FactSet Research Systems Inc. All rights reserved. FactSet Research Systems Inc. www.factset.com 21
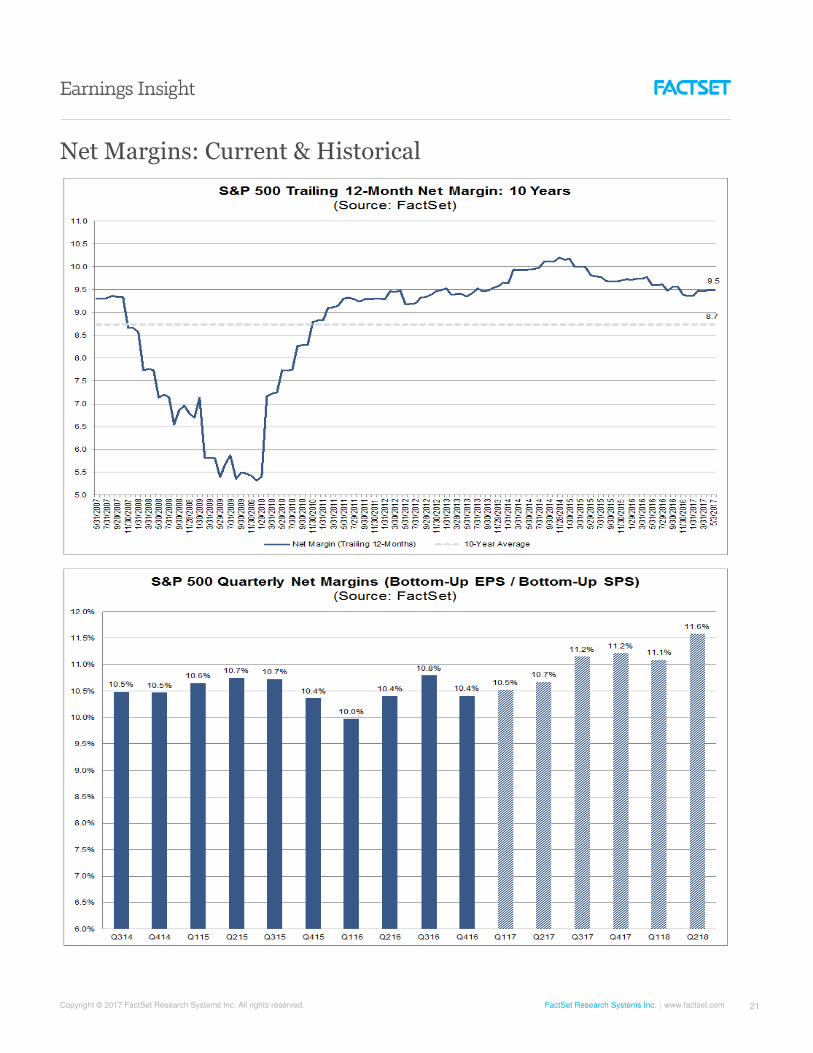
Net Margins: Current & Historical

Copyright © 2017 FactSet Research Systems Inc. All rights reserved. FactSet Research Systems Inc. www.factset.com 22
Forward 12M P/E Ratio: Sector Level

Copyright © 2017 FactSet Research Systems Inc. All rights reserved. FactSet Research Systems Inc. www.factset.com 23
Forward 12M P/E Ratio: Long-Term Averages

Copyright © 2017 FactSet Research Systems Inc. All rights reserved. FactSet Research Systems Inc. www.factset.com 24
Trailing 12M P/E Ratio: Long-Term Averages

Copyright © 2017 FactSet Research Systems Inc. All rights reserved. FactSet Research Systems Inc. www.factset.com 25
Important Notice
The information contained in this report is provided “as is” and all representations, warranties, terms and conditions, oral or written, express or implied (by common law, statute or otherwise), in relation to the information are hereby excluded and disclaimed to the fullest extent permitted by law. In particular, FactSet, its affiliates and its suppliers disclaim implied warranties of merchantability and fitness for a particular purpose and make no warranty of accuracy, completeness or reliability of the information. This report is for informational purposes and does not constitute a solicitation or an offer to buy or sell any securities mentioned within it. The information in this report is not investment advice. FactSet, its affiliates and its suppliers assume no liability for any consequence relating directly or indirectly to any action or inaction taken based on the information contained in this report.
About FactSet
FactSet (NYSE:FDS | NASDAQ:FDS) delivers superior analytics, service, content, and technology to help more than 66,000 users see and seize opportunity sooner. We are committed to giving investment professionals the edge to outperform, with fresh perspectives, informed insights, and the industry-leading support of our dedicated specialists. We're proud to have been recognized with multiple awards for our analytical and data-driven solutions and repeatedly ranked as one of Fortune's 100 Best Companies to Work For and a Best Workplace in the United Kingdom and France. Subscribe to our thought leadership blog to get fresh insight delivered daily at insight.factset.com. Learn more at www.factset.com and follow on Twitter: www.twitter.com/factset.