
JOBS FUND PRESENTATION Presenter: Mr Xolani Ndungane Head : Project Origination 19 th February 2013.
25
JOBS FUND PRESENTATION Presenter: Mr Xolani Ndungane Head : Project Origination 19 th February 2013
-
Upload
harriet-cooper -
Category
Documents
-
view
221 -
download
0
Transcript of JOBS FUND PRESENTATION Presenter: Mr Xolani Ndungane Head : Project Origination 19 th February 2013.

JOBS FUND PRESENTATION
Presenter: Mr Xolani Ndungane Head : Project Origination 19th February 2013

PRESENTATION OUTLINE
• Background of the Jobs Fund• What the Jobs Fund tries to achieve• Jobs Fund focus areas• How the Jobs Fund windows help to overcome labour market failures • The goals of the Jobs Fund• How the Jobs Fund differs from other initiatives• Strategic principles applied by the Jobs Fund• What the Jobs Fund will not fund• Targeted beneficiaries• Initial project assessment criteria
2

BACKGROUND OF THE JOBS FUND
3
The Fund was announced by the President during the State of the Nation Address in Feb 2011
The Jobs Fund is aimed at piloting and up scaling existing innovative approaches to employment creation
The Fund’s activities include planning, financing and oversight of implementation of job creation projects
The Minister of Finance appointed DBSA as an implementing agent
The National Treasury has allocated R 9billion towards the Fund & expects the Fund to leverage approximately R10 billion from the private and public sector.
4
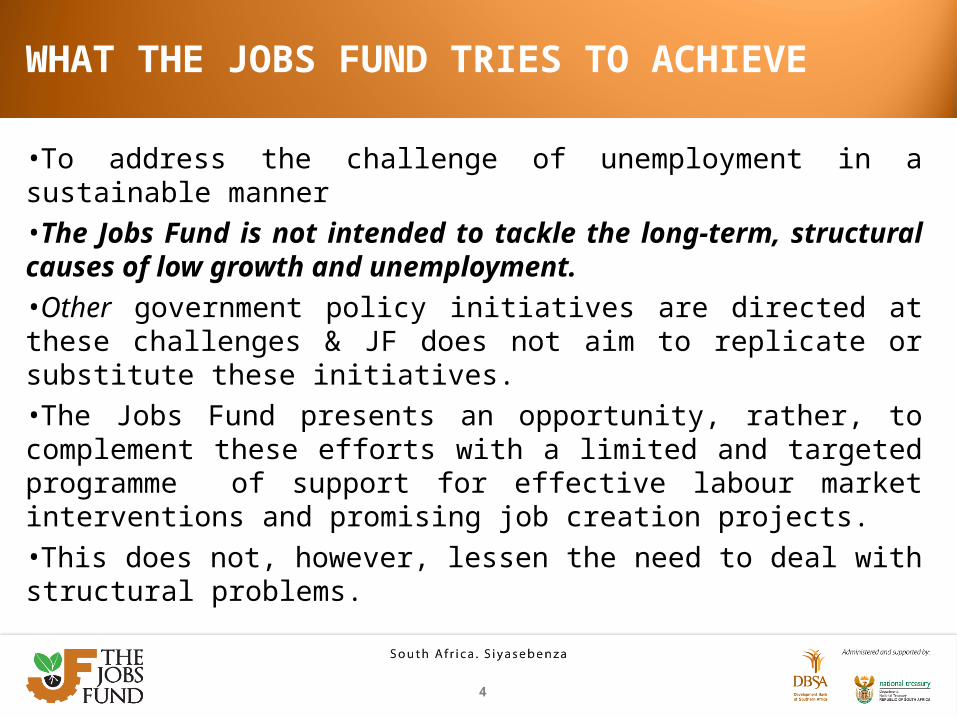
WHAT THE JOBS FUND TRIES TO ACHIEVE
•To address the challenge of unemployment in a sustainable manner•The Jobs Fund is not intended to tackle the long-term, structural causes of low growth and unemployment. •Other government policy initiatives are directed at these challenges & JF does not aim to replicate or substitute these initiatives. •The Jobs Fund presents an opportunity, rather, to complement these efforts with a limited and targeted programme of support for effective labour market interventions and promising job creation projects. •This does not, however, lessen the need to deal with structural problems.
5
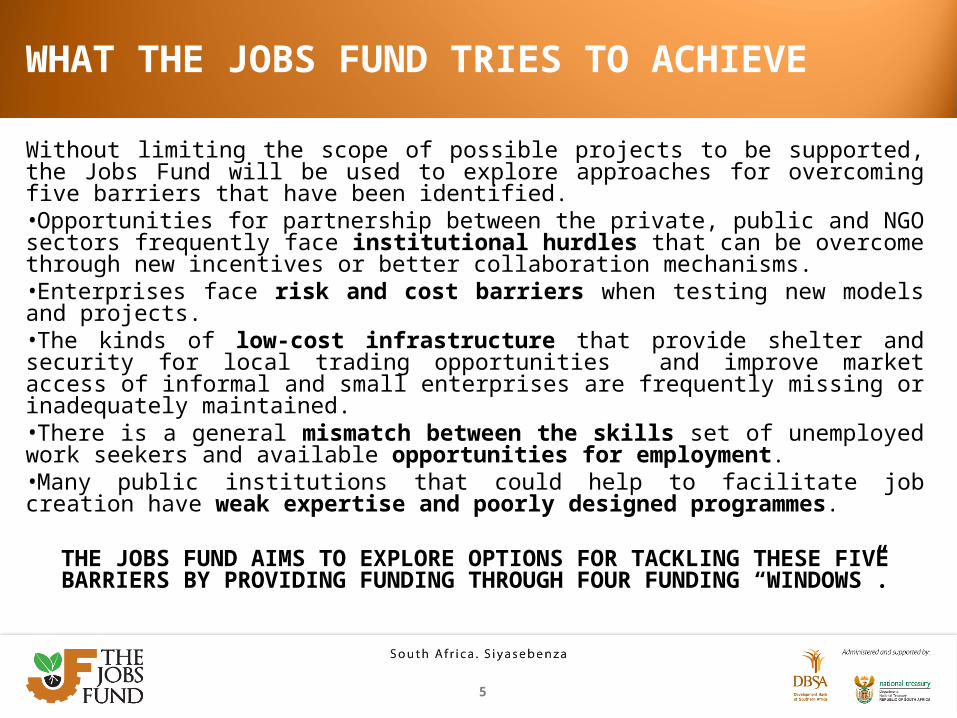
WHAT THE JOBS FUND TRIES TO ACHIEVE
Without limiting the scope of possible projects to be supported, the Jobs Fund will be used to explore approaches for overcoming five barriers that have been identified.•Opportunities for partnership between the private, public and NGO sectors frequently face institutional hurdles that can be overcome through new incentives or better collaboration mechanisms. •Enterprises face risk and cost barriers when testing new models and projects. •The kinds of low-cost infrastructure that provide shelter and security for local trading opportunities and improve market access of informal and small enterprises are frequently missing or inadequately maintained. •There is a general mismatch between the skills set of unemployed work seekers and available opportunities for employment.•Many public institutions that could help to facilitate job creation have weak expertise and poorly designed programmes.
THE JOBS FUND AIMS TO EXPLORE OPTIONS FOR TACKLING THESE FIVE BARRIERS BY PROVIDING FUNDING THROUGH FOUR FUNDING “WINDOWS”.
6
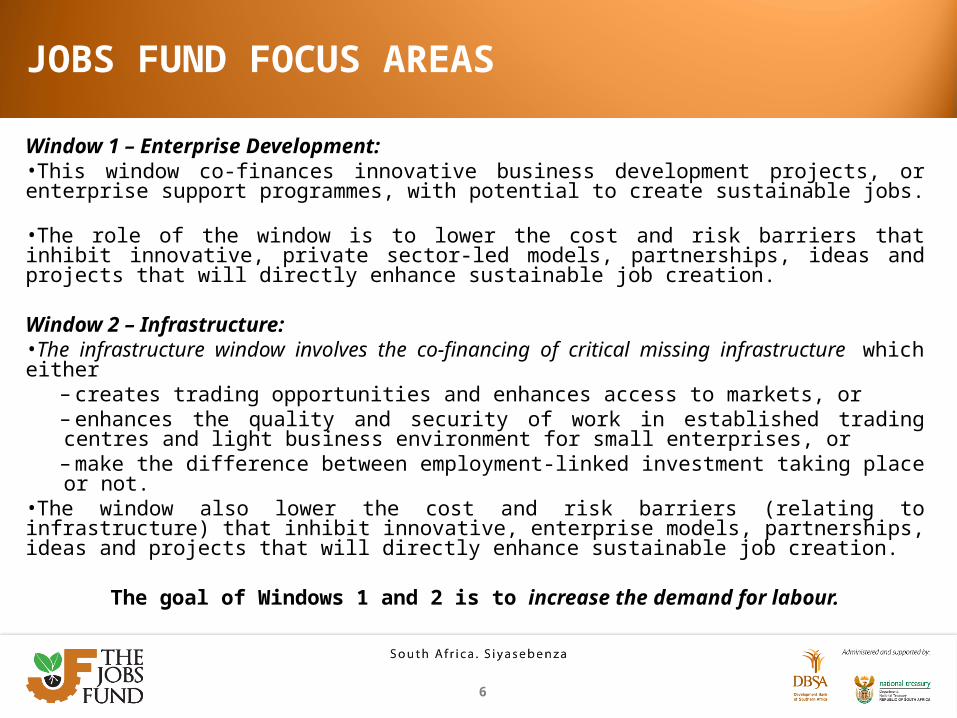
JOBS FUND FOCUS AREAS
Window 1 – Enterprise Development: •This window co-finances innovative business development projects, or enterprise support programmes, with potential to create sustainable jobs. •The role of the window is to lower the cost and risk barriers that inhibit innovative, private sector-led models, partnerships, ideas and projects that will directly enhance sustainable job creation.
Window 2 – Infrastructure: •The infrastructure window involves the co-financing of critical missing infrastructure which either
–creates trading opportunities and enhances access to markets, or –enhances the quality and security of work in established trading centres and light business environment for small enterprises, or –make the difference between employment-linked investment taking place or not.
•The window also lower the cost and risk barriers (relating to infrastructure) that inhibit innovative, enterprise models, partnerships, ideas and projects that will directly enhance sustainable job creation.
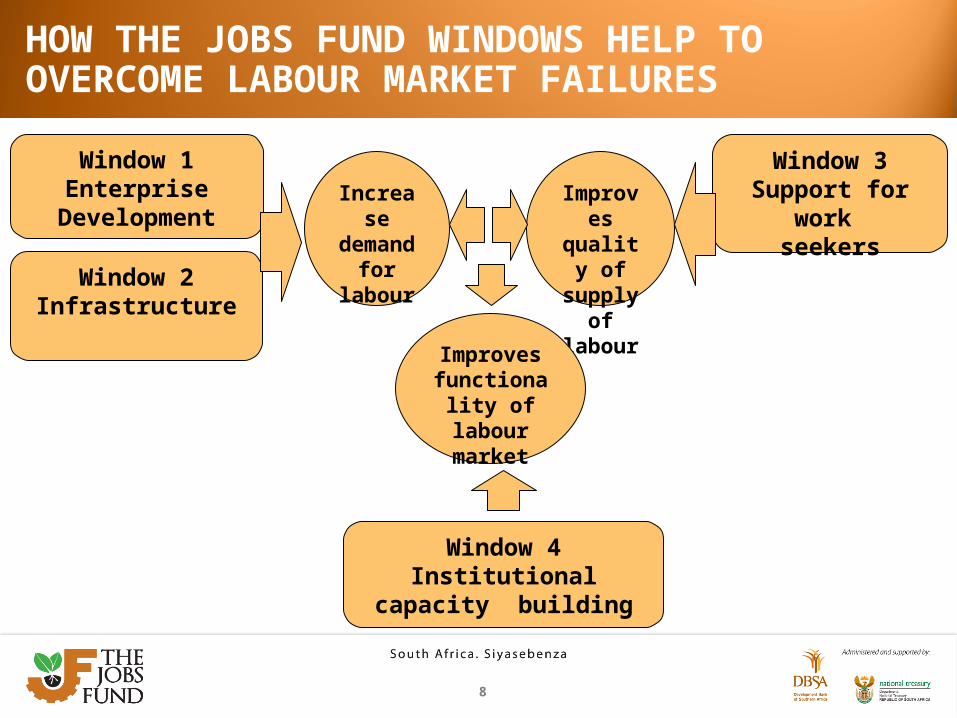
The goal of Windows 1 and 2 is to increase the demand for labour.

7
JOBS FUND FOCUS AREAS
Window 3 – Support for work seekers: •This window provides co-financing support to innovative initiatives and programmes that directly link active work-seekers, especially young people, to formal sector opportunities and employment placements.
Window 3’s goal is to improve the supply of labour.
Window 4 – Institutional capacity building: •Funding from the institutional window aims to improve the capacity and efficiency of public institutions responsible for facilitating job placement, job creation and the functioning of the labour market.
Window 4’s goal is to improve the operation of the labour market.
8
HOW THE JOBS FUND WINDOWS HELP TO OVERCOME LABOUR MARKET FAILURES
Window 1Enterprise
Development
Window 2Infrastructure
Window 3Support for work
seekers
Window 4Institutional capacity
building
Increase demand
for labour
Improves quality of supply of
labour
Improves functionality
of labour market
9
THE GOALS OF THE JOBS FUND
•The ultimate goal of the Jobs Fund is to identify and learn from effective interventions and programmes that will contribute to accelerated job creation and a better functioning labour market. •The specific goal of the Jobs Fund is to provide a mechanism that can identify and fund creative solutions to overcome identified barriers to job creation and active labour markets. •In the process, the Jobs Fund aims to create a minimum of 150 000 sustainable jobs in South Africa over a five-year period. A “sustainable” job in the context means a new, full-time equivalent job that is self-sustaining beyond the lifetime of the initial grant.
10
THE GOALS OF THE JOBS FUND
The Jobs Fund will be judged a success by four outcomes:•The establishment of a portfolio of sustainable employment initiatives across all the funding windows, which together yield 150,000 sustainable jobs in three years.•The uncovering, development and operation of innovative models, partnerships and initiatives in a number of sectors from which valuable lessons are derived which inform longer term approaches to employment creation.•The transformative improvement of the prospects of unemployed people involved in Jobs Fund initiatives.•The effective implementation of the Fund within the time-scale and budget defined for it.

11
HOW THE JOBS FUND DIFFERS FROM OTHER INITIATIVES
A Challenge Fund: •The Jobs Fund has been designed as a Challenge Fund. The effectiveness of Challenge Funds lies in two features:
–Open competition: Challenge funding is allocated to projects on open, competitive basis. Public requests for proposals are issued to the private, public and NGO sectors. The Fund is open to applications across all sectors and from all geographic regions. The open architecture ensures that, as long as the overarching objective of creating sustainable employment is met, all good ideas are eligible to compete for funding, and the best ideas rise to the top. This ensures a pipeline of applicants and projects far richer than conventional funding intermediaries can typically achieve. Open competition directly spurs innovation, drawing on the ‘wisdom of many’ as opposed to the handful of mandated institutions that follow conventional approaches to development funding.–The once-off, limited duration of the grant along with the requirement for matched funding by the applicant. The applicant must put forward a matched funding contribution. This limits the scope for distortionary subsidies which can inhibit economic activity; undermine incentives and which can lead to dependency on the state. It also ensures the applicant has some “skin in the game: - put simply, a good incentive to ensure the project is successful.
12
HOW THE JOBS FUND DIFFERS FROM OTHER INITIATIVES
Emphasis on innovation: •The Jobs Fund is intended to provide pilot-funding for innovative approaches that unearth new job creation ideas that can be replicated at scale. •The emphasis on innovation necessarily encourages the funding of projects associated with higher risk. This would ordinarily make them less attractive to traditional funders. •Mitigating this risk with well-placed and strategic public funding allows innovation to be tested (and then replicated).Partnership approach: •The Jobs Fund recognizes the inherent role of the private sector as the largest holder and creator of employment. •The project is effectively a partnership between the financial resources of the state and existing private and public sector business expertise.

13
HOW THE JOBS FUND DIFFERS FROM OTHER INITIATIVES
Rigorous evaluation of success and dissemination of learning: •The number and nature of the jobs created by the Fund will be professionally monitored and measured. •The idea is to take the guesswork out of state employment funding by testing what works, knowing what works, and disseminating the learning quickly. •Lessons from successful and unsuccessful projects will be fed into future application rounds to guide pipeline development and the decisions of the Jobs Fund Investment Committee. •Success stories will be disseminated widely to allow good models to be copied.
14
STRATEGIC PRINCIPLES APPLIED BY THE JOBS FUND
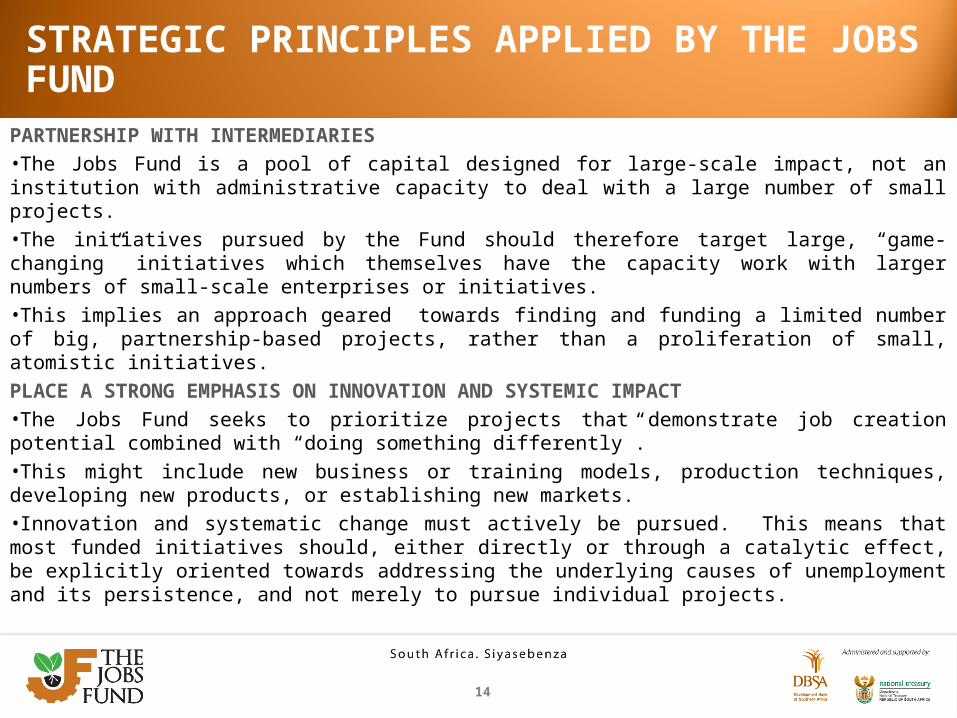
PARTNERSHIP WITH INTERMEDIARIES•The Jobs Fund is a pool of capital designed for large-scale impact, not an institution with administrative capacity to deal with a large number of small projects. •The initiatives pursued by the Fund should therefore target large, “game-changing” initiatives which themselves have the capacity work with larger numbers of small-scale enterprises or initiatives. •This implies an approach geared towards finding and funding a limited number of big, partnership-based projects, rather than a proliferation of small, atomistic initiatives.PLACE A STRONG EMPHASIS ON INNOVATION AND SYSTEMIC IMPACT•The Jobs Fund seeks to prioritize projects that demonstrate job creation potential combined with “doing something differently”. •This might include new business or training models, production techniques, developing new products, or establishing new markets. •Innovation and systematic change must actively be pursued. This means that most funded initiatives should, either directly or through a catalytic effect, be explicitly oriented towards addressing the underlying causes of unemployment and its persistence, and not merely to pursue individual projects.
15
STRATEGIC PRINCIPLES APPLIED BY THE JOBS FUND
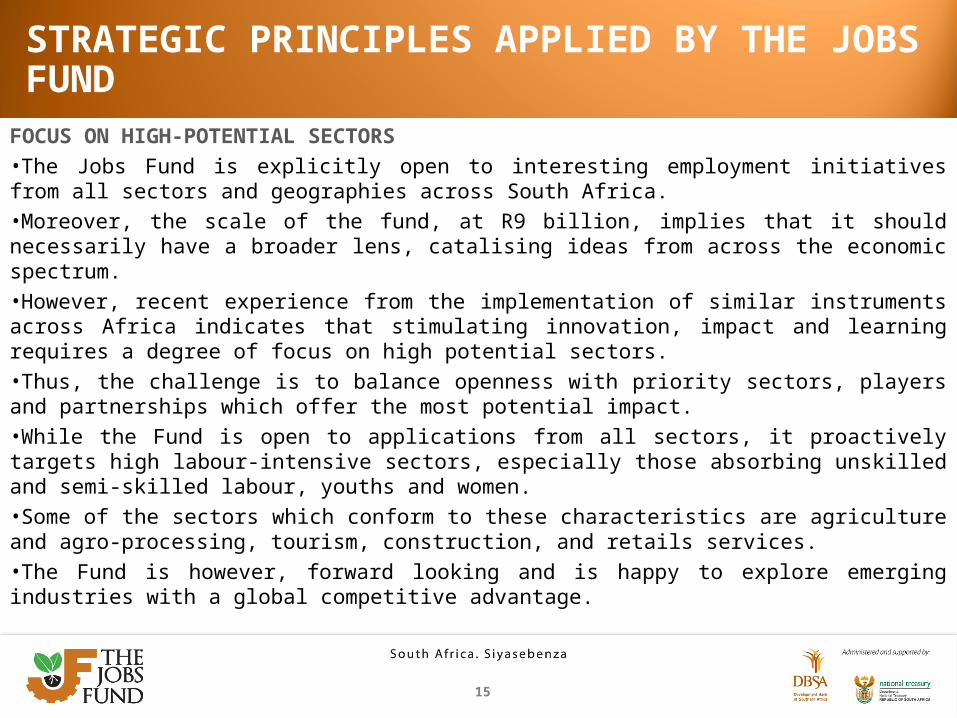
FOCUS ON HIGH-POTENTIAL SECTORS•The Jobs Fund is explicitly open to interesting employment initiatives from all sectors and geographies across South Africa. •Moreover, the scale of the fund, at R9 billion, implies that it should necessarily have a broader lens, catalising ideas from across the economic spectrum. •However, recent experience from the implementation of similar instruments across Africa indicates that stimulating innovation, impact and learning requires a degree of focus on high potential sectors.•Thus, the challenge is to balance openness with priority sectors, players and partnerships which offer the most potential impact. •While the Fund is open to applications from all sectors, it proactively targets high labour-intensive sectors, especially those absorbing unskilled and semi-skilled labour, youths and women. •Some of the sectors which conform to these characteristics are agriculture and agro-processing, tourism, construction, and retails services.•The Fund is however, forward looking and is happy to explore emerging industries with a global competitive advantage.
WHAT THE JOBS FUND WILL NOT FUND
16
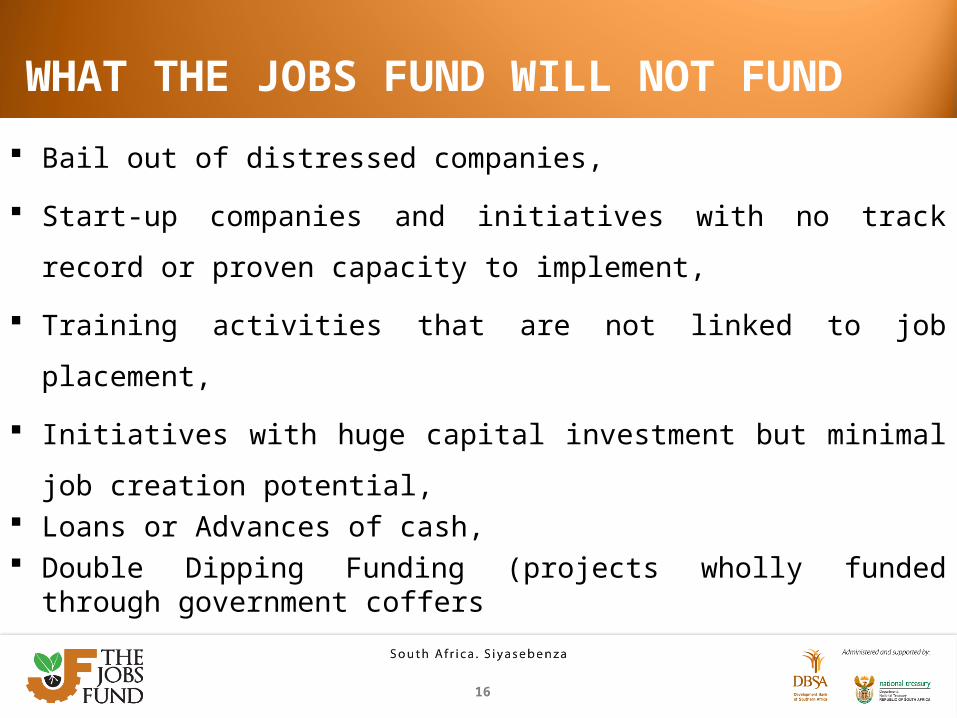
Bail out of distressed companies,
Start-up companies and initiatives with no track record or proven
capacity to implement,
Training activities that are not linked to job placement,
Initiatives with huge capital investment but minimal job creation
potential, Loans or Advances of cash, Double Dipping Funding (projects wholly funded through government
coffers

INITIAL PROJECT ASSESMENT CRITERIA
17
Eligibility Impact Due diligence (e.g. Tax Clearance
Certificate) Track record Private sector led/linkages Commercial basis No outstanding legal decisions Matched funding
Potential for job creation Innovation Additionality Sustainability Capacity to implement Contribution to economic
development Value for money Systemic change

CLIENT SPLIT OF APPROVALS: 1ST & 2ND CFP
10
• Some NGOs are part co-funded by government departments and agencies
JF Projects Approved
Grant Amount
(R'm)
Matched Funding
(R'm)Co-funding
ratio
Projected No of
Permanent Jobs
Projected No of
Placements
JF Avg Cost per
Job/Placement ‘R’
Project Avg Cost per
Job/Placement ‘R’
PUBLIC (17) 1,394.2 968.7 1:0.69 10,443 25,960 38,298 64,910
NGO/NPO (32) 812.4 730.4 1:0.90 66,330 24,575 8,937 16,971
PRIVATE (16) 1,219.2 1,423.2 1:1.17 20,480 13,395 35,992 78,006
Total Grant Approvals (65)
3,425.8 3,122.3 1:0.91 97,253 63,930 21,254 40,625
R1,394.2m or 40.7%
R812.4m or 23.7%
R1,219.2m or 35.6% PUBLIC (17)
NGO/NPO (32)
PRIVATE (16)
PARTNERSHIP SPLIT OF APPROVALS: 1ST & 2ND CFP
11
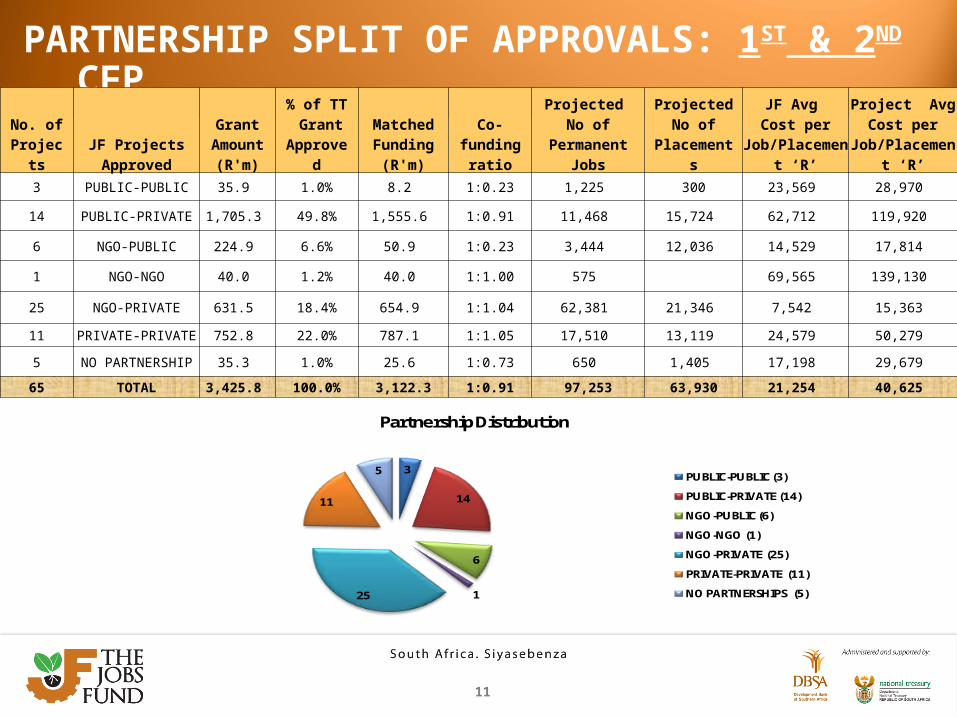
No. of Projects
JF Projects Approved
Grant Amount
(R'm)
% of TT Grant
Approved
Matched Funding
(R'm)
Co-funding
ratio
Projected No of
Permanent Jobs
Projected No of
Placements
JF Avg Cost per
Job/Placement ‘R’
Project Avg Cost per
Job/Placement ‘R’
3 PUBLIC-PUBLIC 35.9 1.0% 8.2 1:0.23 1,225 300 23,569 28,970
14 PUBLIC-PRIVATE 1,705.3 49.8% 1,555.6 1:0.91 11,468 15,724 62,712 119,920
6 NGO-PUBLIC 224.9 6.6% 50.9 1:0.23 3,444 12,036 14,529 17,814
1 NGO-NGO 40.0 1.2% 40.0 1:1.00 575 69,565 139,130
25 NGO-PRIVATE 631.5 18.4% 654.9 1:1.04 62,381 21,346 7,542 15,363
11 PRIVATE-PRIVATE 752.8 22.0% 787.1 1:1.05 17,510 13,119 24,579 50,279
5 NO PARTNERSHIP 35.3 1.0% 25.6 1:0.73 650 1,405 17,198 29,679
65 TOTAL 3,425.8 100.0% 3,122.3 1:0.91 97,253 63,930 21,254 40,625
3
14
6
125
11
5
Partnership Distribution
PUBLIC-PUBLIC (3)
PUBLIC-PRIVATE (14)
NGO-PUBLIC (6)
NGO-NGO (1)
NGO-PRIVATE (25)
PRIVATE-PRIVATE (11)
NO PARTNERSHIPS (5)
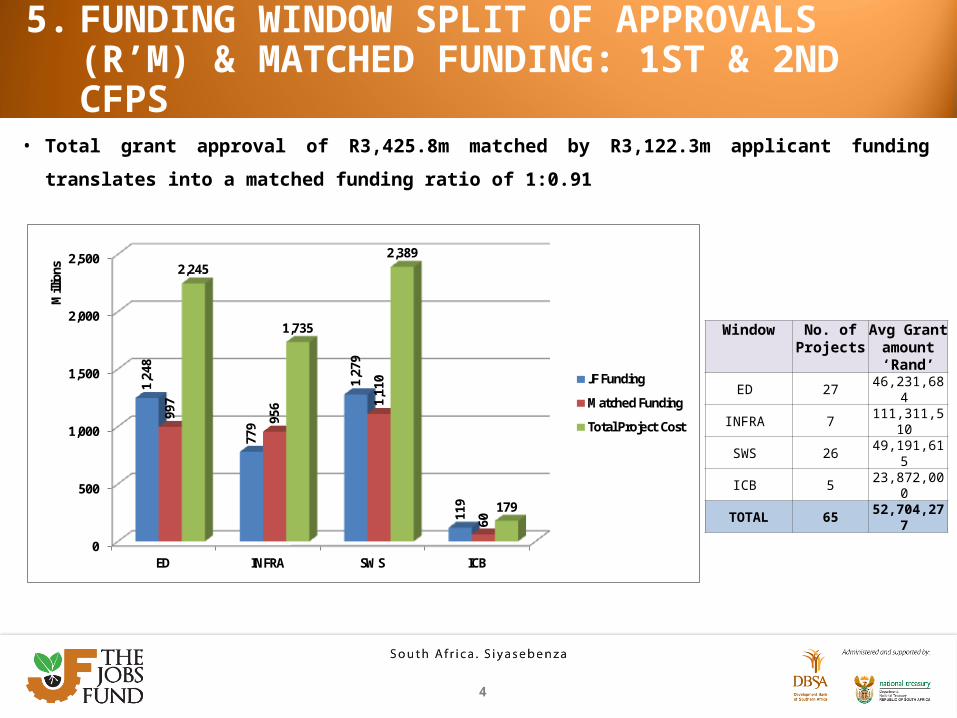
5. FUNDING WINDOW SPLIT OF APPROVALS (R’M) & MATCHED FUNDING: 1ST & 2ND CFPS
4
• Total grant approval of R3,425.8m matched by R3,122.3m applicant funding translates into a matched funding
ratio of 1:0.91
0
500
1,000
1,500
2,000
2,500
ED INFRA SWS ICB
1,24
8
779
1,27
9
119
997
956 1,
110
60
2,245
1,735
2,389
179
Mill
ions
JF Funding
Matched Funding
Total Project Cost
Window No. of Projects
Avg Grant amount ‘Rand’
ED 27 46,231,684
INFRA 7 111,311,510
SWS 26 49,191,615
ICB 5 23,872,000
TOTAL 65 52,704,277
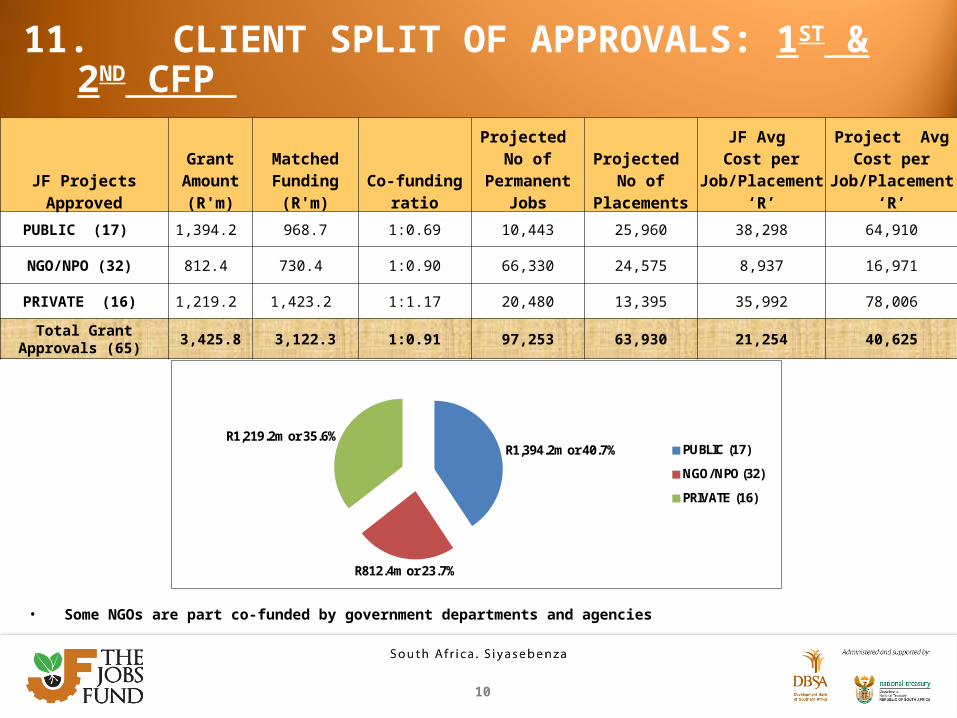
11. CLIENT SPLIT OF APPROVALS: 1ST & 2ND CFP
10
• Some NGOs are part co-funded by government departments and agencies
JF Projects Approved
Grant Amount
(R'm)
Matched Funding
(R'm)Co-funding
ratio
Projected No of
Permanent Jobs
Projected No of
Placements
JF Avg Cost per
Job/Placement ‘R’
Project Avg Cost per
Job/Placement ‘R’
PUBLIC (17) 1,394.2 968.7 1:0.69 10,443 25,960 38,298 64,910
NGO/NPO (32) 812.4 730.4 1:0.90 66,330 24,575 8,937 16,971
PRIVATE (16) 1,219.2 1,423.2 1:1.17 20,480 13,395 35,992 78,006
Total Grant Approvals (65)
3,425.8 3,122.3 1:0.91 97,253 63,930 21,254 40,625
R1,394.2m or 40.7%
R812.4m or 23.7%
R1,219.2m or 35.6% PUBLIC (17)
NGO/NPO (32)
PRIVATE (16)

12
13. PROVINCIAL SPLIT OF APPROVALS: 1st & 2nd CFP
**Projects that operate in all nine provinces of South Africa.
*Projects that operate in more than one, but not all nine provinces.
Approved Projects by Region and Funding Window
No. of Projects
Region ED SWS ICB InfraTotal JF Grant (R’m)
Matched Funding
(R’m)
Cofunding
Ratio
Projected New
Permanent Jobs
Projected New
Placements
JF Avg Cost per
Job/Placement ‘R
Project Avg Cost per
Job/Placement ‘R
15 National** 6 8 1 - 1,486.3 1,574.1 1:1.06 46,460 31,441 19,079 39,285
14 Multiple* 5 5 2 2 424.8 312.0 1:0.73 29,073 3,439 13,067 22,664
9 Eastern Cape 4 3 - 2 374.7 272.8 1:0.73 4,466 3,764 45,533 78,680
8 Gauteng 4 2 - 2 670.2 719.5 1:1.07 10,200 182 64,551 133,857
8 KwaZulu Natal 4 2 2 - 147.6 46.6 1:0.32 3,064 325 43,550 57,307
1 Limpopo 1 - - - 6.8 1.7 1:0.25 2,100 - 3,227 4,034
1 Mpumalanga 1 - - - 14.6 3.5 1:0.24 424 - 34,339 42,700
1 Northern Cape 1 - - - 18.3 24.8 1:1.36 320 - 57,031 134,563
1 North West - 1 - - 40.0 42.8 1:1.07 - 10,512 3,806 7,873
7 Western Cape 1 5 - 1 242.6 124.5 1:0.51 1,146 14,267 15,739 23,816
65 Totals 27 26 5 7 3,425.8 3,122.3 1:0.91 97,253 63,930 21,254 40,625

SECTOR SPLIT OF APPROVALS: 1ST & 2ND CFP
23

13
SECTOR SPLIT OF APPROVALS: 1st & 2nd CFP (CONT’D)
• Bulk of projects in the services sector
No Sector Grant Amount
(R'm)% of TT Grant
Approved
Matched Funding
(R'm)
Co-funding
ratio
Projected No of
Permanent Jobs/Placemen
ts
JF Avg Cost per
Job/Placement (R)
Project Avg Cost per
Job/Placement (R)
18
Agri & Forestry
536.9 9.9%
308.2
0.57
42,996
12,488
19,655
3 Services/ICT
320.0 10.2%
320.0
1.00
9,226
34,685
69,369
4 Manufacturing
207.2 9.2%
287.0
1.39
3,171
65,330
155,850
2 Services/Real Estate
409.9 17.9%
560.3
1.37
2,015
203,414
481,489
4 Services/Automotive
313.4 10.1%
314.6
1.00
6,014
52,119
104,424
1 Services/Mining
40.0 1.4%
42.8
1.07
10,512
3,806
7,873
2 Green economy
31.4 0.4%
11.6
0.37
528
59,470
81,439
20 Services
796.5 18.8%
586.6
0.74
55,300
14,403
25,011
4 Services/Finance
380.8 10.0%
312.6
0.82
28,979
13,141
23,928
2 Services/Health
16.7 0.4%
11.7
0.70
290
57,426
97,645
1 Services/Hospitality
46.1 9.0%
282.0
6.12
1,150
40,082
285,338
4 Services/EcoTourism
326.9 2.7%
85.0
0.26
1,002
326,270
411,054
65 Total 3,425.8 100.0% 3,122.3
0.91
161,183
21,254
40,625