JOB SATISFACTION OF HIGH SCHOOL PRINCIPALS IN THE ...
110
JOB SATISFACTION OF HIGH SCHOOL PRINCIPALS IN THE COMMONWEALTH OF VIRGINIA Sandra Rochelle Brown Dissertation submitted to the faculty of Virginia Polytechnic Institute and State University in partial fulfillment of the requirements for the degree of DOCTOR OF PHILOSOPHY in Educational Leadership & Policy Studies Dr. Travis W. Twiford, Chair Dr. Carol S. Cash Dr. John E. Smith Dr. N. Wayne Tripp March 23, 2009 Virginia Beach, Virginia Key Words: Job Satisfaction, Secondary School Principals
Transcript of JOB SATISFACTION OF HIGH SCHOOL PRINCIPALS IN THE ...

JOB SATISFACTION OF HIGH SCHOOL PRINCIPALS IN THE COMMONWEALTH OF
VIRGINIA
Sandra Rochelle Brown
Dissertation submitted to the faculty of
Virginia Polytechnic Institute and State University
in partial fulfillment of the requirements for the degree of
DOCTOR OF PHILOSOPHY
in
Educational Leadership & Policy Studies
Dr. Travis W. Twiford, Chair
Dr. Carol S. Cash
Dr. John E. Smith
Dr. N. Wayne Tripp
March 23, 2009
Virginia Beach, Virginia
Key Words: Job Satisfaction, Secondary School Principals

JOB SATISFACTION OF HIGH SCHOOL PRINCIPALS IN THE
COMMONWEALTH OF VIRGINIA
by
Sandra R. Brown
Dr. Travis W. Twiford, Chair
Educational Leadership & Policy Studies
(ABSTRACT)
Studies have shown that effective principals are a key ingredient to high performing
schools. Studies also indicate that a shortage of effective administrators is looming and some
contend that the shortage is here (Daresh & Capasso, 2002). Johnson and Holdaway, 1991 report
that it is important to study job satisfaction for many reasons. They also contend that one of the
reasons it is important to study job satisfaction is that job satisfaction is related to absenteeism as
well as staff turnover.
One way to address the shortage of effective administrators is to continually assess the
job satisfaction of administrators to determine which aspects of the job affect satisfaction. In this
study, the researcher examined the job satisfaction of high school principals in the
Commonwealth of Virginia in 2008. A replication of procedures used by Dr. James Stemple in
2004 provided the opportunity to compare results with Stemple‟s study to determine if the job
satisfaction of high school principals has changed since 2004. Dr. Stemple‟s study was one of
the first studies to assess job satisfaction after the implementation of the accountability
movement.

iii
However, federal accountability including Adequate Yearly Progress has risen
considerably since Stemple‟s 2004 study. In 2004, a pass rate of 65% for reading and 63% for
math was required in order for a school to make AYP. During the 2008-2009 school year the
required passing rate is 81% for reading and 79% for math. This study assessed job satisfaction
of high school principals through the lens of the federal and state accountability movements.

iv
ACKNOWLEDGEMENTS
Thank you to my family. First, to my parents, Nan and Chesley Rochelle, who taught me to
be strong, work hard, and trust in God; I owe everything to you. To my brother Doug who has
always been and continues to be always by my side when I need him; thank you. To my husband
Bill, who put up with me for years as I focused on this project; I‟m back. Last, to my son
Nicholas, who prayed every night that I would finish my paper and who told me over and over
again that I could do it; thank you, son, I love you.
Thank you also to my boss, Dr. Brian Matney for his never-ending support, for offering
advice and tutelage throughout this project and for being flexible with my work schedule and
allowing me time to complete this project. Thank you for years of support, encouragement, and
friendship. Most of all, thank you for believing in me.
Special thanks to Dr. Travis Twiford who agreed very early in the program to chair my
committee. You never failed to show me that you had faith in me. Because of that, I had faith in
myself. Thanks also to my other committee members, Dr. Carol Cash, Dr. John Smith, and Dr.
Wayne Tripp, for your time, encouragement, and support. You were a wonderful committee,
and I could not have completed this without you.
Finally, thank you to Dr. Cathy Rogers and Dr. John Smith, your constant encouragement and
motivation during the Ed.S. program inspired me to continue my education and pursue my
doctorate. You were both wonderful, inspirational instructors. Thank you.

v
CONTENTS
Table of Figures ................................................................................................................. ix
List of Tables .......................................................................................................................x
CHAPTER I INTRODUCTION TO THE STUDY ...........................................................1
Historical Perspective ..................................................................................................1
Statement of the Problem ....................................................................................3
Significance of the Study ....................................................................................5
Purpose ................................................................................................................7
Justification for the Study ...................................................................................7
Research Questions .............................................................................................8
Definitions of Key Terms....................................................................................9
Limitations and Assumptions ..............................................................................9
Organization of the Study ...................................................................................9
CHAPTER TWO REVIEW OF LITERATURE ......................................................11
Defining Job Satisfaction ..................................................................................11
Theories of Job Satisfaction ..............................................................................12
Content Theories .......................................................................................12
Traditional Theory ....................................................................................12
Process Theories .......................................................................................14
Variables of Job Satisfaction .............................................................................18
Job Satisfaction Scales ......................................................................................22
The Accountability Movement .........................................................................25
Principals and Job Satisfaction..........................................................................29

vi
Summary ...........................................................................................................36
CHAPTER 3 METHODOLOGY AND DESIGN FOR DATA COLLECTION .....38
Research Questions ...........................................................................................38
The Population ..................................................................................................39
Instrumentation .................................................................................................39
The Minnesota Satisfaction Questionnaire (MSQ) ...................................41
Achievement .............................................................................................42
Comfort .....................................................................................................42
Altruism ....................................................................................................42
Status.........................................................................................................42
Safety ........................................................................................................43
Autonomy .................................................................................................43
Data Collection Procedures .......................................................................................44
Non -response…………………………………………………………….46
Statistical Analyses……………………………………………………….47
Summary………………………………………………………………….50
CHAPTER FOUR ANALYSIS OF DATA ..............................................................51
Description of the Sample .................................................................................51
MSQ Scale Reliability Analysis .......................................................................52
Data Analysis Organized by Research Questions .............................................56
Personal Characteristics ....................................................................................58
Age ............................................................................................................58
Gender .......................................................................................................59
Professional Characteristics ..............................................................................60
Salary ........................................................................................................60

vii
Number of Assistant Principals ................................................................63
Total Years as Principal ............................................................................63
Total Years in the School Division ...........................................................63
Time Spent with Students .........................................................................63
Percent of students on free and reduced price lunch ................................63
Virginia Accreditation Status ...................................................................66
Adequate Yearly Progress ........................................................................66
Summary ....................................................................................................................67
CHAPTER FIVE SUMMARY, DISCUSSION, AND CONCLUSIONS ................70
Summary of the Study .......................................................................................70
Findings .............................................................................................................70
Implications for Practitioners ............................................................................75
Recommendations for Further Study ................................................................77
Discussion .........................................................................................................78
Reflections.........................................................................................................79
Summary ...........................................................................................................80
References ..........................................................................................................................82
Appendix A Individual Information Sheet……………………………………………....89
Appendix B Minnesota Satisfaction Questionnaire Sample Questions…………………..92
Appendix C First Invitation to Participants sent December 4, 2008……………………..94
Appendix D Second Invitation to Participants sent December 11, 2008…………………95
Appendix E Third and Final Invitation………………………………………………...…96
Appendix F Institutional Review Board Approval…………………………………….....97
Appendix G Request for Permission to Use the MSQ……………………………………98

viii
Appendix H Permission to use the MSQ……………………………………………....….99
Appendix I Training in Human Subjects Protection Certificate………………….…....…100

ix
Table of Figures
Figure 1. Continuum of Job Satisfaction..............................................................................2
Figure 2. Illustration of the Theory of Work Adjustment ..................................................17
Figure 3. AYP Benchmarks ................................................................................................26
Figure 4. Frequency Distribution for Total Satisfaction. ..................................................59

x
List of Tables
Table 1 Motivators and Hygienes .................................................................................….15
Table 2. Measurements of Job Satisfaction .......................................................................24
Table 3. Frequency Distributions for Demographic Variables ( n=169) ...........................53
Table 4. Chronbachs Alpha for Total Score………………………………………….…..57
Table 5. Analyses of Variance for Job Satisfaction: Personal Characteristics ..................60
Table 6. Analyses of Variance for Job Satisfaction: Professional Characteristics ............61
Table 7. Rank Order of Each Dimension of Job Satisfaction………………………...….65
Table 8. General Satisfaction and Demographics (Accreditation and AYP)……...…….66
Table 9. Rank Order of Influences in Change in Job Satisfaction……………………....68

1
CHAPTER I
INTRODUCTION TO THE STUDY
Job satisfaction is how people feel about their jobs in general and how they feel about
specific aspects of their jobs. “It is the extent to which people like (satisfaction) or dislike
(dissatisfaction) their jobs” (Spector, 1997, p.2). The study of job satisfaction is common in
many organizations, including education. Organizations concerned with employee well-being,
humanitarian, as well as increased productivity, pragmatic, may initiate a study of employee job
satisfaction.
Regardless of whether the reason for examining job satisfaction is humanitarian or
pragmatic, the study of job satisfaction can be approached in two ways (Herzberg, Mausner, &
Snyderman, 1959). First, one may view job satisfaction as a general, overall feeling about a job.
This approach is useful in investigating demographic variables. Second, a facet approach may be
used and job satisfaction may be approached as specific feelings or attitudes about certain
aspects or facets of the job. The overall approach is used if one wishes to determine the end
result of whether employees are generally satisfied or dissatisfied. A facet approach is used
when one seeks to find out specifically which parts of the job cause satisfaction or dissatisfaction
(Herzberg et al., 1959).
Historical Perspective
Studies of job satisfaction can be traced back to those conducted in the early 1900‟s by
Frederick Taylor and Elton Mayo. Taylor‟s study at Bethlehem steelworks involved redesigning
equipment and selecting the right workers for the job, resulting in an increase in production. A
study conducted by Elton Mayo at the Hawthorne plant of the Western Electric Company studied
the effect of light on productivity. He found that production increased even if the light was

2
reduced to moonlight. This finding was explained as the individuals increased production
because they were in an experimental situation. Now, when subjects improve production
because of the experimental situation, it is known as the Hawthorne effect (as cited in
Gruneberg, 1979).
In the 1930‟s Hoppock was one of the first to use survey methods and attitude scales to
examine job satisfaction (Gruneberg, 1979). These were primarily studies of industry workers
and approached job satisfaction as an overall, general attitude.
In 1952, Katz and Kahn conducted the first studies which considered job satisfaction in
relation to factor analysis. These were the first studies to approach job satisfaction from a facet
approach rather than a general, overall assessment. The researchers found four relevant
dimensions of job satisfaction: satisfaction with supervision, satisfaction with the job,
satisfaction with the company, and satisfaction with mobility as cited in Wernimont, 1964. At
this time employee‟s attitudes regarding factors of a job were scored on a continuum with
satisfaction and dissatisfaction at opposite ends.
The researcher illustrates the continuum in the following:
dissatisfaction satisfaction
Figure 1. Continuum of Job Satisfaction
Employees‟ attitudes toward job
facets Dissatisfaction Satisfaction

3
In 1959, Herzberg et al. conducted a study which examined the factors affecting the way
workers felt on the job, resulting attitudes toward the job, and effects of the attitudes on
performance. Approximately 200 accountants and engineers from nine companies in the
Pittsburgh area participated. Each participant was asked to explain a time when they felt
exceptionally good or exceptionally bad about their job. This technique is known as the critical
incident technique. The researchers concluded that job satisfaction and dissatisfaction were not
caused by the same factors (Herzberg et al., 1959). Herzberg‟s study, along with most other
studies since that time consider job satisfaction utilizing this conceptual framework.
Statement of the Problem
“Over the past quarter century, significant changes have been reshaping the role of the
building level administrator” (Barrack & Shortt, 2001, p.1). The responsibilities of the principal
continue to expand. The managerial responsibilities of the principal are expanding as principals
report increasing paperwork loads. Principals are also spending more time coping with student
behavior problems. Additionally, email which is an effective venue of communication between
administrators, teachers, and parents, has also added a significant demand on the principal‟s
time. While being an effective manager used to be good enough, principals are now expected to
be instructional leaders, maintain school safety, and insure special education services are
delivered appropriately.
Not only have the principal‟s managerial tasks expanded but principals are expected to
be instructional leaders, insuring all students meet high standards and insuring that the challenges
of students with disabilities are met (Di Paola & Tschannen-Moran, 2001). With the ever
increasing demands of federal mandates such as No Child Left Behind and Adequate Yearly
Dissatisfaction Satisfaction

4
Progress principals can no longer be merely effective managers. Before the age of
accountability, principals were expected to insure a well disciplined student body and organized,
efficient school operations. Principals are still expected to effectively manage the school but are
also now thrust into the role of instructional leader. Public school principals must be versed in
the routine workings of the school such as building issues as well as the details of standards,
objectives, and curricula for a variety of subjects.
Principals are expected to be teacher leaders; to provide a vision for their school; and
inspire faculty and staff to work toward that vision. A Mid-continent Research for Education
and Learning (McREL) study by Marzano, McNulty, and Walters identified 21 responsibilities
of a school leader. According to this meta-analysis, each of these 21 behaviors has a statistically
significant relationship with student achievement. These responsibilities reflect the wide and
varied duties that fall upon the high school principal (Marzano et al., 2005).
Along with serving as instructional leader, the principal must insure the safety of students
and staff. With recent tragedies, school safety is more important than ever. The principal is
charged with enforcing new sets of school security and developing protocols that insure students
and parents that the school is a safe environment (Di Paola & Tschannen-Moran, 2001).
During the last three decades, federal mandates have expanded services to students with
disabilities. Section 504 of the Rehabilitation Act and the Americans with Disabilities Act have
increased demands on principals as they strive to accommodate individual student needs (Di
Paola & Tschannen-Moran, 2001). Successful implementation of programs to meet the
requirements of the Americans with Disabilities Act and school safety, along with increased
accountability from federal mandates require principals to hire and supervise more people,
5
enforce new policies, and expand services. But while principals‟ new responsibilities increase,
the principal‟s role in other areas has not been reduced (Di Paola & Tschannen-Moran, 2001).
The increasing demands and responsibilities placed on high school principals are
illustrated by Richford and Fortune in the following:
To be effective, high school principals require authority commensurate with their duties
and responsibilities. They must maintain good interpersonal relations with parents,
teachers, students and other administrators as well as with community leaders and social
service personnel. As society becomes more complex and diverse, education along with
other social institutions, must respond to accountability and efficiency concerns
(Richford & Fortune, 2001, p.17).
Significance of the Study
Principal satisfaction and retention are important issues in education. (Marzano,
McNulty, and Walters, 2005) suggest that the leadership of the school could be considered the
single most important aspect of effective school reform. Though leadership does not rest with a
single individual, no one other than the principal can easily assume the role of the leader of a
reform effort. “The principal‟s role is important” (Marzano et al., 2005, p. 174). “Research
studies strongly support the fact that the leadership of the school principal impacts directly on the
climate of the school and, in turn, on student achievement” (Norton, 2002, p. 50).
With increased demands to be an effective manager as well as an instructional leader,
along with the constantly changing roles of the principal, fewer qualified people are being
attracted to the position. (Norton, 2002). This is compounded by the fact that more and more
qualified principals are leaving the field. “Increasing demands upon the work life of the

6
principal, low salary levels, time constraints, lack of parent and community support and lack of
respect are among the reasons that principals are leaving the position” (Norton, 2002, p. 50).
Not only are current principals leaving the field, but the number of aspiring principals is
dwindling as well. “Owing to difficult and challenging times, the position of school
administrator appears less appealing to other educators. High school principalships have
attracted fewer aspirants in recent years and are viewed by many as burnout positions” (Gmelch
and Gates, 1997, p. 146). Johnson and Holdaway (1991) state, “Furthermore, calls for
educational and administrative accountability and features of the modern work and social
environment have been associated with growing frustration and stress and declining quality of
work life; so efforts to understand job satisfaction have become ever more necessary” (p. 51).
“National statistics relating to principal turnover and dwindling supplies of qualified
replacements show clearly that principal turnover has reached crisis proportions” (Norton, 2002,
p. 50). “The „graying‟ of school administrators as well as the increased responsibility and
accountability of administrative roles has created increased numbers of administrative vacancies
nationwide” (Di Paola and Tschannen-Moran, 2001, p.4). They go on to say, “…. the
recruitment and retention of qualified and certified administrators is one of the greatest
challenges confronting school divisions in Virginia and across the nation” (p. 4). Lovely (2004)
agrees, “In the wake of looming retirements, diminishing applicant pools, declining employee
loyalty, and budget-induced downsizing, survival depends upon holding on to the leaders you
already have” (p. 99).
Research shows that principals are a critical element in effective schools and student
achievement (Marzano et al., 2005). Studies also show that principal turnover is increasing and
there is a lack of qualified candidates to fill these positions. Some contend that one of the

7
reasons for the lack of interest in the principalship is an unintended consequence of educational
reform policies (Gronn & Rawlings-Sanaei, 2003). “Since satisfaction is related to turnover,
those people who are most highly dissatisfied are also most likely to leave” (Lawler, 1994, p.
182).
Purpose
This study investigated the overall satisfaction level of public high school principals in
the Commonwealth of Virginia as measured by the Minnesota Satisfaction Questionnaire
(MSQ). This instrument measures twenty dimensions of job satisfaction. This study also
investigated the influence of personal and professional demographic variables such as gender,
age, salary level, years of experience, number of assistant principals, years in current school
district, school socioeconomic level, school size, school accreditation status and Adequate
Yearly Progress. Additionally, this study investigated public high school principals‟ overall
satisfaction in relation to the twenty dimensions of the job as measured by the Minnesota
Satisfaction Questionnaire. It is critical to understand which components of the principalship
affect job satisfaction. With this understanding, we will be equipped to retain and recruit highly
effective administrators. This study provides important data regarding the job satisfaction of high
school principals as the federal mandates of No Child Left Behind as well as state and local
mandates for accountability increase.
Justification for the Study
If public schools are to compete with the oftentimes more lucrative private industry for
the best and brightest leaders, they must be aware of the intricacies of the job of principal. It is
important to understand which aspects of the principalship are most enjoyed and which aspects
are least enjoyed by administrators. With this knowledge, mentoring programs can be tailored to
8
address the aspects of the principalship which lead to principals‟ satisfaction. As a result, these
mentoring programs will likely be more effective and successful. Human resource departments
may also find the results of this study useful. It is critical that the human resources department
understands the key components of the high school principalship and how these varying roles
contribute to job satisfaction. With successful mentoring programs and a knowledgeable human
resources department, public schools are more likely to attract and retain the most effective
administrators.
Due to the ever-increasing demands on the principal, it is important to continually assess
the job satisfaction of principals. Stemple, 2004 recommended replicating his study every four
to five years to provide an opportunity for comparison of results over a longitudinal timeframe.
As stated by Dr. Stemple, this will provide the researcher an opportunity to examine changes in
job satisfaction with relation to Virginia Accreditation standards and Federal Adequate Yearly
Progress requirements.
Research Questions
The overarching research question that guided this study is: What is the general level of
satisfaction of current public high school principals in the Commonwealth of Virginia as
measured by the Minnesota Satisfaction Questionnaire?
Additional research questions:
1. What is the satisfaction level of public high school principals in Virginia according to the
following variables: gender, age, salary level, years of experience, number of assistant
principals, years in current school district, school socioeconomic level, school size, and
accreditation status?

9
2. What is the satisfaction level of public high school principals in Virginia for each of the
twenty dimensions of the job as measured by the MSQ?
3. Based on the demographic variables of accreditation status and Adequate Yearly Progress
(AYP), what is the general job satisfaction level of high school principals in Virginia?
Definitions of Key Terms
Principal – “The individual identified as the chief building level administrator in the
school” (Long, 1989, p.12).
High School – for the purposes of this study, a high school will be considered a public
school with at least grades 10 – 12.
Job Satisfaction – “is simply how people feel about their jobs and different aspects of
their jobs. It is the extent to which people like (satisfaction) or dislike (dissatisfaction) their
jobs” (Spector, 1997, p.2).
Limitations and Assumptions
The limitations of this study are listed below:
1. This study was limited to principals in the Commonwealth of Virginia; therefore,
generalizations to principals in the rest of the country or world may not be
considered.
2. The study was also limited to those principals who chose to respond to the survey.
3. This study relied on principals to self-report demographic variables along with
truthful and thoughtful responses to the MSQ.
Organization of the Study
This study investigated the job satisfaction of public high school principals in the
Commonwealth of Virginia. Procedures replicated a 2004 study by Dr. James Stemple. This

10
allowed the researcher to compare the results of this 2008 study to the results of Dr. Stemple‟s
2004 study through the lens of the accountability movement. This study is organized into five
chapters. Chapter one is the introductory chapter and includes a statement of the problem as well
as guiding questions. The purpose of the study, the significance of the study, definitions of key
terms, and limitations of the study will also be found in chapter one. Chapter two contains a
review of literature relating to job satisfaction and the accountability movement. The Theory of
Work Adjustment on which the MSQ is based is explained here as well. Chapter three provides
the methodology including the design of the study. Chapter four reports the findings and chapter
five includes the summary, findings, implications for practice, conclusions, and
recommendations for further study.

11
CHAPTER TWO
REVIEW OF LITERATURE
The purpose of this study was to investigate the job satisfaction of public high school
principals in the Commonwealth of Virginia, including both personal and job related
characteristics. The purpose of the literature review was to examine literature relating to job
satisfaction. Though the topic of job satisfaction is much broader, this literature review focused
on defining job satisfaction, job satisfaction theories, facets of job satisfaction, measurements of
job satisfaction, and the accountability movement. This chapter is divided into five major
sections: 1) definitions of job satisfaction; 2) theories of job satisfaction; 3) variables of job
satisfaction; 3) job satisfaction scales, 4) increasing accountability and 5) a summary of previous
studies relating to job satisfaction and public school personnel.
Defining Job Satisfaction
A review of the literature reveals a general agreement among researchers regarding the
definition of job satisfaction . Job satisfaction is generally considered how a worker feels about
his job. Hoppock (1935) defined job satisfaction as the individual‟s feelings about his job. More
specifically, Hoppock goes on the define job satisfaction as “any combination of psychological,
physiological, and environmental circumstances that causes a person truthfully to say, „I am
satisfied with my job‟” (p. 47). According to Spector, “Job satisfaction is simply how people
feel about their jobs and different aspects of their jobs. It is the extent to which people like
(satisfaction) or dislike (dissatisfaction) their jobs” (p. 2). Locke (1976) defines job satisfaction
as “the pleasurable or positive emotional state resulting from the appraisal of one‟s job or job
experiences (p. 1300). Lofquist & Dawis, (1969) defined job satisfaction as “the pleasurable
12
emotional state resulting from the appraisal of the extent to which the work environment fulfills
an individual‟s requirement” (p. 47).
Theories of Job Satisfaction
Lunenburg and Ornstein (2000) suggest that theories of job satisfaction can be divided
into two categories, content and process. Content theories suggest that all workers have the same
set of basic needs. Therefore, the theory prescribes desired characteristics to be present in jobs.
Process theories, on the other hand, stress that each individual has different needs. These
theories focus on the mental processes that create these differences.
Content Theories
Content theory includes both traditional and two-factor theories of motivation. Traditional
theory states that job satisfaction rests on a continuum. Good working conditions and complete
job satisfaction are at one end of the continuum while bad working conditions and complete
dissatisfaction rest at the other. This theory suggests that all workers‟ attitudes toward their job
and job satisfaction fall somewhere on this continuum (Gruneberg, 1976; Mischkind, 1967).
Three prominent theorists who subscribed to the concept of content theory are Robert Hoppock
(1935), Abraham Maslow (1954), and Frederick Herzberg (1959).
Traditional Theory
Hoppock, who made one of the first attempts to measure job satisfaction, contended that if
a certain factor caused satisfaction, the absence of the factor would cause dissatisfaction.
Likewise, lower amounts of the factor would lead to decreased satisfaction. Hoppock also
contended that there was a zone of neutrality in which the individual was neither satisfied nor
dissatisfied. One may consider this theory a horizontal continuum with satisfaction on the far
right and dissatisfaction on the far left. Individuals‟ feelings about specific facets of their jobs

13
may fall anywhere along the continuum, including the middle of the line indicating neutrality
and neither satisfaction nor dissatisfaction (Hoppock, 1935).
Similar to Hoppock, Maslow‟s Hierarchy of Needs theorized that satisfaction could be
conceptualized as a pyramid with five distinct horizontal levels. It suggested that all human
needs could be placed in one of these five categories or levels in the pyramid. The basic needs,
and the lowest level in the pyramid, consist of physiological necessities such as water, food, and
shelter. The next level consists of physical safety and financial security. The third level includes
love and acceptance of others. The fourth level consists of recognition by others. The top level
in the pyramid consists of self actualization. Self actualization, according to Maslow, includes
self development and autonomy. Maslow maintained that the lower level needs had to be met
before the individual could be motivated to achieve the next level (Maslow, 1954).
Two-Factor Theory
Contrary to the traditionalists‟ beliefs of a continuum of satisfaction, Herzberg offered a two
factor theory of job satisfaction. This theory resulted from his research concerning job attitudes
and motivation in which he conducted semi-structured interviews with over 200 engineers and
accountants. From their responses, Herzberg identified two distinctly different sets of factors.
He contended that job satisfaction consists of both satisfiers (motivators) and dissatisfiers
(hygienes) (Herzberg et al., 1959).
Job satisfiers or motivators are intrinsic to the employee and increase feelings of happiness.
The motivators which are primarily responsible for job satisfaction consist of recognition,
achievement, advancement, responsibility, and the work itself. Dissatisfiers or hygiene factors
are extrinsic and consist of the environment of the work. The factors of company policy and
administration, technical aspects of supervision, salary, interpersonal relations, and working

14
conditions cause dissatisfaction. These two sets of job facets are mutually exclusive (Herzberg
et al., 1959). These motivators and hygienes are listed in Table 1.
Process Theories
While content theories focus on a prescription for characteristics that need to be present in a
job, process theories focus on the individuality of the worker. Process theory seeks to
understand the cognitive processes responsible for the varying needs of the individual worker.
Important process theories include equity theory; reference group, needs/fulfillment, and work
adjustment theory.
Equity Theory
Equity theory originated around 1965. This theory suggests job satisfaction may be affected
by the difference between what the worker expects and what they actually receive from the
employer. An important component of this theory contends that the worker has a preconceived
notion of what they should receive for their efforts (Adams, 1965). It also contends that workers
will look to coworkers to compare rewards. This theory assumes that one integral cognitive
process involves the worker observing the effort others are exerting toward their work and the
rewards that follow this effort. This is driven by our need for fairness and equity (Adams, 1965).
Reference Group Theory
Reference group theory is much like equity theory in that it suggests that employees compare
themselves to their co-workers regarding effort exerted on the job and rewards received. It is
important to understand that employees compare themselves to others. The results of these
comparisons will likely affect job satisfaction (Hulin & Blood, 1968).

15
Table 1
Motivators and Hygienes
Motivators (Satisfiers) Hygienes (Dissatisfiers)
Responsibility Supervision
Recognition Salary
Promotion Work environment
Achievement Company policies
Intrinsic aspects of the job Relationship with colleagues
Fulfillment Theory
The needs/fulfillment theory states that job satisfaction will be determined in part by how
much of a reward they receive for their work. What this theory failed to include however, is the
individual differences regarding how people feel about what they receive as well as the worker‟s
preconceived notion regarding what they should receive. One example of this in education may
be the well-documented dissatisfaction with educators‟ salaries when compared with other
professions requiring similar preparation (Vroom, 1995).
Vroom (1964) developed two models of need fulfillment theory, subtractive and
multiplicative. The subtractive model suggests that job satisfaction is dependent on the
difference between the worker‟s needs and the degree to which the job fills those needs. The
multiplicative model includes the worker‟s need for importance. In this model, the perceived
degree to which a job meets the worker‟s needs is multiplied by the importance of the need to the

16
worker (Vroom, 1964). Since that time Vroom has stated that when explaining the differences in
the effort people give their jobs, we have focused too much on extrinsic factors and failed to
recognize individual differences (Vroom, 1995).
Work Adjustment Theory
Another process theory and the theory on which this study will be based is the work
adjustment theory. The study of work adjustment originally focused on resolving problems
related to work such as employee morale, work motivation, and worker productivity. With no
integrating theory, the results of these studies were reported in isolation. The theory of work
adjustment was offered as one overarching framework to allow systemic inquiry into the study of
work adjustment (Dawis & Lofquist, 1984). The theory was a result of research in the Work
Adjustment Project at the University of Minnesota. After reviewing the literature Scott, Dawis,
England, and Lofquist realized that an integrating theory was needed for the study of work
adjustment.
In 1964, Dawis, England, and Lofquist published the first version of the theory of work
adjustment. Since that time, the theory has been extended and modified in a subsequent
publication in 1969 as well as in several journal articles. In relation to work, correspondence is
described as the worker fulfilling the requirements of the job and the job fulfilling the
requirements or needs of the worker. The work adjustment theory is based on the belief that the
worker is a responding organism. As such, the worker constantly interacts with the environment.
Environments may include work, home, and school and interactions in one environment may
affect interactions in another. Weiss claimed that the interactions of the worker to the
environment are based on how the worker‟s abilities relate to the abilities required to perform a
specific task combined with the worker‟s needs in relation to the rewards available in the

17
workplace (Dawis & Lofquist, 1981). The researcher of this study illustrates the framework of
the work adjustment theory below:
Figure 2. Illustration of the Theory of Work Adjustment
The following statements were provided by Dawis et al. (1964) to summarize the theory of work
adjustment.
1. Work is conceptualized as an interaction between an individual and a work environment.
2. The work environment requires that certain tasks be performed, and the individual brings
skills to perform the tasks.
3. In exchange, the individual requires compensation for work performance and certain
preferred conditions, such as a safe and comfortable place to work.
Job Satisfaction
Work
Environment
Worker
Rewards
Available
Worker‟s
Abilities Abilities
Needed
Rewards
Needed

18
4. The environment and the individual must continue to meet each other‟s requirements for
the interaction to be maintained. The degree to which the requirements of both are met
may be called correspondence.
5. Work adjustment is the process of achieving and maintaining correspondence. Work
adjustment is indicated by the satisfaction of the individual with the work environment
and by the satisfaction of the work environment with the individual, by the individual‟s
satisfaction
6. Satisfaction and satisfactoriness result in the employee staying in the position for a longer
period of time, the principal indicator of work adjustment.
7. Work personalities and work environments can be described in terms of structure and
style variables that are measured on the same dimensions (p. 9-10).
The theory of work adjustment has guided many studies of job satisfaction in the field of
education (Newby, 1999; Waskiewicz, 1999; Chen, 2000; Stemple, 2004; Bowling, 2007; Bane,
2006, McQueen, 2007). These researchers agree that individuals are responding organisms who
interact with their environments, thus the theory of work adjustment is an effective means of
studying job satisfaction.
Variables of Job Satisfaction
Most researchers agree that certain variables should be considered when examining job
satisfaction (Graham and Messner, 1998; Eckman, 2002; Brogan, 2003; Wheelis, 2005; Monroe,
2007). The following variables will be considered when assessing overall job satisfaction as
well as satisfaction with various facets of the job.
Age, time spent in the current position, and educational experience are most often considered
to be interrelated. Usually, time spent in the current position and educational experience increase

19
as age increases. Older workers typically have more time in the current position than younger
workers and they typically have more experience in the field of education. This is not always the
case. Bedeian, Farris, & Kacmar (1992) state that age and time spent in the current position are
two distinct variables leading to different outcomes. However, Stemple, 2004, found a positive
correlation between age and salary, age and total years as principal, and age and total years in
current district. These correlations suggest that older principals tend to have higher salaries,
have been principals longer and have more tenure.
Herzberg theorized that job satisfaction in relation to age was curvilinear in nature. However,
others have contended that age and job satisfaction are linear. (Hulin & Smith, 1964; Clark,
Oswald, & Warr, 1996) A study by Newby (1999) indicated results that agreed with Herzberg‟s
curvilinear theory. She found that younger and older principals reported being more satisfied
with their jobs than middle aged principals. Bowling (2007) replicated Dr. Newby‟s study and
found principals less than 35 years old to be more satisfied with their jobs than older principals.
Bowling‟s study also reported principals with seven to nine years of experience were
significantly more satisfied than those with more or less years of experience. This study
considered job satisfaction in relation to the principal‟s age as well as in relation to the number
of years a principal has been in the district.
Findings regarding gender of the worker and job satisfaction often contradict themselves.
(Hulin & Smith, 1965) state that findings generally suggest women are less satisfied with their
jobs because they are placed on lower level jobs with lower pay rates and with fewer
opportunities for promotions. Also, males working in industry are meeting societal expectations
concerning appropriate roles for men and women. Women working in industry however may not
feel they are meeting societal expectations. Women who are married or who have children may

20
also feel role conflict when working outside the home. Eckman (2002) found that many female
principals experience role conflict with the competing demands of home and work. While the
majority of instructional positions are filled with females, most principalships are held by males.
It is important to continue to assess job satisfaction in relation to gender as more females enter
the principalship.
Clark (1997) states that job satisfaction may generally be higher for females because
traditionally females did not have access to certain jobs. Women‟s expectations for jobs tend to
be lower than males, thus satisfaction with the job is generally higher. The number of female
principals continues to rise, still high schools in Virginia are led predominantly by males.
According to Eckman (2002) female principals‟ perception of role conflict was inversely and
significantly related to job satisfaction. Therefore, as female principals felt the increasing
demands of home, spouse, and children, their job satisfaction was significantly decreased. This
will likely be an important component to the study as federal and state accountability continue to
demand more and more of the principal‟s time.
“Satisfaction with pay, as with the attainment of any valued outcome, is likely to be a
function of several different processes” (fa, Fraser, Treasure & Cochran, 1987, p. 544).
Berkowitz et al. found that satisfaction with pay is usually a combination of factors including
equity, material benefits, and intrinsic job satisfaction. Herzberg‟s two factor theory stated that
compensation served only as a dissatisfier. Several studies including Newby (1999) and Graham
& Messner (1998) found that principals were less satisfied with compensation than with most
other aspects of the job. “It is clear that individuals who believe they are inequitably paid are
dissatisfied with their job” (Locke, 1976).

21
Larger schools bring greater demands to the principal. By default, larger schools will have
additional extracurricular demands and activities that must be supervised by an administrator.
Additionally, as the number of faculty, staff, and students increase so do issues and concerns
regarding each of these groups. Surprisingly, Newby (1999) reported that principals of large
schools were slightly more satisfied than principals of small or mid-sized schools. However,
Graham & Messner (1998) reported that principals in mid-sized schools reported higher overall
satisfaction than principals of small or large schools.
The number of assistant principals is directly related to school size. Typically, school
divisions allocate the number of assistant principals based on student enrollment. Interestingly
though, Stemple found that the number of assistant principals was one of the two best predictors
of job satisfaction.
The socioeconomic status of a school is becoming increasingly more important as the
demands of No Child Left Behind continue to rise. One of the sub groups considered in NCLB
is economically disadvantaged. As such, schools with predominantly low socioeconomic
students may struggle to meet benchmarks. Additionally, schools with small percentages of low
socioeconomic students and historically high overall pass rates may find themselves struggling to
meet the demands of AYP within subgroups.
It is important to remember why most educators entered the profession in the first place.
Classroom teachers report that one of the reasons that they would not pursue administration is
the belief that they would lose contact with the students. Stemple‟s 2004 study revealed that job
satisfaction increased when the percentage of time principals spend with children increases.
Though this finding was not significant, it is important to compare the time spent with students
and job satisfaction as principals face ever-increasing demands on their time.

22
Stemple also reported that principals of schools that were fully accredited under the Virginia
Accreditation Standards reported significantly higher satisfaction than principals of non-
accredited schools. It is important to note Virginia accreditation standards have not changed
since Stemple‟s study was conducted. However, federally required benchmarks for meeting
Adequate Yearly Progress have continued to rise. It was of interest to assess whether or not
accreditation and AYP affect the job satisfaction of principals.
Job Satisfaction Scales
Traditionally, job satisfaction is measured by conducting interviews or asking participants to
respond to questionnaires. Questionnaires can easily be used with a large number of people and
their results are relatively easy to quantify. Interviews, on the other hand, may be more time
consuming but provide richer, in depth information as respondents are allowed to elaborate on
responses (Spector, 1997). There is a vast array of approaches to assessing job satisfaction.
Likewise, a number of instruments used to measure job satisfaction can also be found. This
section of this literature review will give an overview of the approaches to measuring job
satisfaction and existing satisfaction scales. Three of the most commonly used satisfaction scales
will then be discussed.
According to Spector (1997) there are many advantages to assessing job satisfaction using
one of the existing job satisfaction scales: first, many of the scales cover the major facets of job
satisfaction; second, most of the scales provide norms to allow for comparison and interpretation;
third, many existing scales exhibit both reliability and construct validity insuring the facets of job
satisfaction will be measured consistently; and last, using one of the existing scales, rather than
developing one of your own, saves both time and money.

23
Job satisfaction may be measured as a global feeling about a job or more specifically how the
worker feels about various aspects of the job. This approach is used to find out which parts of
the job cause satisfaction or dissatisfaction. Spector identifies two general satisfaction scales: the
Job in General Scale and the Michigan Organization Assessment Questionnaire satisfaction
subscale. He goes on to identify scales that measure job satisfaction using a facet approach: the
Job Satisfaction Survey (JSS), the Job Descriptive Index (JDI), the Minnesota Satisfaction
Questionnaire (MSQ), and the Job Diagnostic Survey (JDS).
The Job Satisfaction Survey (JSS) was developed by Paul E. Spector to assess overall
satisfaction as well as satisfaction with various facets of the job. The JSS consists of 36 items
and response choices on a six point scale range from strongly disagree to strongly agree. This
satisfaction scale targets the following nine facets of job satisfaction: pay, promotion, benefits,
supervision, contingent rewards, operating procedures, coworkers, nature of work, and
communication. This instrument is provided free for noncommercial and educational research.
Spector who developed the instrument, reports that it is not only the most popular job satisfaction
scale, but also easy to modify and has well-documented reliability and validity (Spector, 1997).
The Job Descriptive Index (JDI) has been used for more than 40 years is also one of the most
widely used measures of job satisfaction (DeMeuse, 1985; Zedeck, 1987). It contains a total of
72 items. An abridged version of the JDI is also available; it contains a total of 25 items. Both
the abridged and non-abridged versions measure five aspects of job satisfaction: present job,
present pay, opportunities for promotion, supervision, and coworkers. This instrument is
frequently combined with the Job in General scale which was developed to measure overall job
satisfaction.

24
Table 2. Measurements of Job Satisfaction
Name of Instrument Type Specifics
Job in General Scale (JIG) General Job Satisfaction Good for overall
assessment of job
satisfaction
Michigan Organizational
Assessment Questionnaire
Subscale
General Job Satisfaction Contains a three item
overall satisfaction
subscale; good for use in
longer questionnaires;
established reliability and
validity
Job Satisfaction Survey
(JSS)
Facet Approach Most popular; easy to
modify; well documented
reliability and validity
Job Descriptive Index
(JDI)
Facet Approach Limited to five facets
Minnesota Satisfaction
Questionnaire (MSQ)
Facet Approach Facets are more specific
than the JSS or the JDI
Job Diagnostic Survey Facet Approach Studies the effects of job
characteristics
The Minnesota Satisfaction Questionnaire developed in 1967 by Weiss, Dawis, England, and
Lofquist is widely used to assess job satisfaction. The MSQ is appropriate for individuals who
read at a fifth grade level or higher. The long form requires 15 to 20 minutes to complete while
the short form takes approximately five minutes to complete. There are three versions of this
instrument. There are two versions of the long form: a 1977 version and a 1967 version. The
1977 version, originally copyrighted in 1963, uses a five choice response scale with “neither
satisfied nor dissatisfied” being the middle choice. A ceiling effect resulted with most answers

25
positively skewed to “satisfied” or “very satisfied.” The 1967 version replaced the neutral
choice with “satisfied” and added “very satisfied” and “extremely satisfied” to the list of
responses. This resulted in more symmetrically distributed responses. The 1967 version is
recommended for prediction studies.
The Accountability Movement
“We conclude that declines in educational performance are in large part the result of
disturbing inadequacies in the way the educational process itself is often conducted” (U.S.
National Commission on Excellence in Education, 1983, p. 1). With this statement modern
educational reform surged forward. In 1981, T.H. Bell, Secretary of Education for the U.S.
Department of Education created the National Commission on Excellence in Education. He
directed this commission to present a report on the quality of education in America. In 1983, A
Nation at Risk: The Imperative for Educational Reform was submitted. Several key findings
were highlighted in this report. The committee suggested that the American public school
curriculum was too broad and no longer had a central purpose. Next, expectations regarding
level of knowledge, abilities, and skills graduates should possess were far below other countries.
Likewise, the committee suggested that the time students spent in school and time spent outside
of school completing school work was also far below other industrialized nations. Last, the
committee reported that not enough qualified candidates were being attracted to the teaching
field and that the professional working life of current teachers was unacceptable. The first wave
of current education reform was initiated by the publication of this disturbing report. There
seemed to be a consensus from the committee that public education within the K-12 environment
was in dire straits (U.S. National Commission on Excellence in Education, 1983).

26
One of the biggest changes stemming from A Nation at Risk was the movement to
standardize our public education system. These efforts included more systematic standardized
testing, more strenuous graduation requirements, more regular testing, and increased preparation
for standardized tests. Additionally, many states implemented merit pay programs (U.S.
National Commission on Excellence in Education, 1983).
Another significant reform came in January 2002 when President George W. Bush signed the
No Child Left Behind Act of 2001 (NCLB) into law. NCLB requires states to conduct annual
testing in reading and math. Each state must also set yearly benchmarks or goals. These
benchmarks must increase progressively upward until reaching 100 percent passing by the year
2014. The yearly benchmarks established by the Virginia Board of Education are known as
Annual Measureable Objectives (AMOs). The annual measureable objectives for the
Commonwealth of Virginia are outlined below.
Figure 3. AYP Benchmarks, (http://www.doe.virginia.gov/VDOE/nclb/)
AYP: ANNUAL MEASURABLE OBJECTIVES FOR READING
2001-
2002
2002-
2003
2003-
2004
2004-
2005
2005-
2006
2006-
2007
2007-
2008
2008-
2009
2009-
2010
2010-
2111
2111-
2012
2012-
2013
2013-
2014
60.7 61.0 61.0 65.0 69.0 73.0 77.0 81.0 85.0 89.0 93.0 97.0 100
AYP: ANNUAL MEASUREABLE OBJECTIVES FOR MATHEMATICS
2001-
2002
2002-
2003
2003-
2004
2004-
2005
2005-
2006
2006-
2007
2007-
2008
2008-
2009
2009-
2010
2010-
2111
2111-
2012
2012-
2013
2013-
2014
58.4 59.0 59.0 63.0 67.0 71.0 75.0 79.0 83.0 87.0 91.0 95.0 100

27
No Child Left Behind also incorporates the following mandates:
NCLB requires annual testing in grades 3-8 and at least once in high school to measure
student progress in reading and mathematics.
NCLB requires all students to be proficient in reading and mathematics by 2013-2014.
NCLB requires schools, school divisions, and states to meet annual objectives for
Adequate Yearly Progress (AYP) for student performance on statewide tests in reading
and mathematics.
NCLB requires the identification of states, schools and school divisions making and not
making AYP (http://www.doe.virginia.gov/VDOE/nclb/)
It is important to note that in order to make AYP, states must meet or exceed 29
benchmarks. The benchmarks include participation in testing, achievement in reading
and mathematics, and attendance or science (at the elementary and middle school level)
or graduation at the high school level. Not only must the overall pass rate for the school
meet the benchmark in each identified area, but the pass rate for each subgroup must
meet the benchmark as well. NCLB identifies the following subgroups: African
American, Asian, Caucasian, Hispanic, Limited English Proficiency student, and students
with disabilities, and economically disadvantaged students. If a school or school division
fails to meet any one of these 29 benchmarks, the school or school division does not
make AYP (http://www.doe.virginia.gov/VDOE/nclb/)
A Title I school is a school that receives federal funds to assist economically disadvantaged
students to succeed academically (http://www.doe.virginia.gov/VDOE/nclb/). If a Title I school
fails to meet AYP, the school is required to implement a two-year improvement plan. If the
school does not make AYP in the same subject area for two consecutive years, the school is

28
required to notify parents and offer them an opportunity to transfer to an accredited school. If
the school does not make AYP for a third consecutive year, the school must notify parents,
continue to offer school choice, and supplemental educational services. Additionally, school
divisions are required to take corrective action, which may include replacing school staff,
implementing new curriculum, or extending the school year or school day. A fourth consecutive
year of failing to make AYP must result in the school division developing a restructuring plan.
A fifth consecutive year will result in one of the following: reopen the school as a charter school,
replace all or most of the staff, turn the management of the school over to a private firm, or other
major restructuring.
A non-Title I school that does not meet AYP is not subject to NCLB sanctions. In Virginia,
schools that do not meet AYP for three consecutive years are required to continue to analyze data
and implement corrective actions as dictated by the school division. If a school division fails to
make AYP for two consecutive years, the division is required to develop and implement
improvement plans within three months of identification
(http://www.doe.virginia.gov/VDOE/nclb/). The Commonwealth of Virginia‟s accountability
system consists of two components. Schools must comply with the rigorous academic demands
of No Child Left Behind, successfully making each of the 29 benchmarks yearly. Schools that
meet all 29 benchmarks have met Adequate Yearly Progress in compliance with NCLB. In
addition, schools must also meet state accreditation requirements. A school‟s accreditation status
is primarily based upon overall student achievement in the core areas of English, math, science,
and social studies. In secondary schools, students must achieve at least a 70 percent pass rate on
the Standards of Learning tests in order to meet accreditation standards.

29
Schools that meet these criteria are considered fully accredited. Schools whose pass rates fall
below 70 percent are considered Accredited with Warning. These schools must undergo
extensive academic reviews, implement research-based instructional strategies, and must also
craft a school improvement plan. A school may be considered Accredited with Warning for no
more than three years. If a school fails to achieve a 70 percent pass rate in each of the four core
subject areas for four consecutive years, it is denied accreditation. If a school is considered
Accreditation Denied, the local school board is required to submit a corrective action plan to the
state Board of Education. This corrective action plan should outline the steps that will be taken
to improve student achievement. Additionally, schools denied accreditation must provide to
stakeholders a written notice of the accreditation status, a copy of the corrective action plan, and
an opportunity to comment on the action plan.
The NCLB benchmark for both reading and math was raised to above 70% passing for the
2006-2007 school year. Therefore, since that year, if a Virginia school made AYP, it was
accredited as well. However, a Virginia school can achieve state accreditation without fulfilling
the requirements to make AYP (http://www.doe.virginia.gov/VDOE/nclb/). Many authors
would agree that the scope and number of mandates demand precious time and money that
should be spent educating the children (Johnson, 2004).
Principals and Job Satisfaction
Over the years many researchers have addressed the topic of job satisfaction and
education. One study was conducted by Dr. JoeAnn in Virginia during the 1998-1999 school
year. The purpose of Newby‟s study was to assess job satisfaction of middle school principals in
Virginia as measured by the Minnesota Satisfaction Questionnaire (MSQ) 1967 long form. A

30
total of 188 middle school principals in Virginia were asked to participate in the study.
Participants were asked to provide demographic information including gender, age, experience,
degree, school location and school population.
There were several significant findings from her study. A general satisfaction score for
middle school principals was calculated to a mean of 3.65 (SD = .57). This indicates that
principals were satisfied (3.00-3.99). The mean score for the 20 dimensions measured on the
MSQ ranged from (2.00-2.99) to (4.00-4.99) slightly satisfied to very satisfied.
In addition Newby found females were significantly more satisfied with activity and
variety than males; younger and older principals were significantly more satisfied with activity
than middle aged principals. Principals with Education Specialist degrees were significantly
more satisfied with achievement than doctorate and masters degreed principals. Principals from
suburban schools were significantly more satisfied with compensation, supervision, and working
conditions than urban and rural principals. Principals of large schools were significantly more
satisfied with general satisfaction, advancement, and security than principals from small schools.
Findings revealed that being of service to others was the highest contributor to overall
satisfaction. Compensation contributed least to overall satisfaction. Findings showed that
principals in suburban schools were more satisfied with compensation than urban and rural
principals. Also, compensation, supervision, and working conditions contributed to the high
satisfaction of suburban principals. Principals from large schools were highly satisfied with
advancement, supervision, and security. Last, findings from this study indicate that females like
to be busy doing a variety of different tasks, more so than males. This study has been replicated
numerous times.

31
One such replication was conducted by Dr. James Stemple in the 2003-2004 school year.
This study investigated the job satisfaction of high school principals in the Commonwealth of
Virginia. Like Newby, Dr. Stemple used the Minnesota Satisfaction Questionnaire to analyze
the 20 components of job satisfaction as measured by the MSQ. This replication was updated to
include federal and state accountability mandates such as No Child Left Behind and state
accreditation.
Dr. Stemple sent the MSQ (1977 long form) to 183 high school principals via electronic
mail. Statistical techniques included descriptive statistics, correlations, analysis of variance and
multiple regressions. The study found that high school principals were generally satisfied. High
school principals were most satisfied with level of activity, ability to serve, and ability to do the
job within their moral conscience. High school principals were least satisfied with
compensation. Highest scores of satisfaction came from principals of medium sized, fully
accredited schools that met AYP, who had three assistant principals. Males reported slightly
higher overall satisfaction scores than females. Recommendations provided at the end of this
study included replicating the study every four or five years to monitor effects of the
accountability movement.
Five conclusions were drawn from this study. First, many principals are at or near
retirement which may indicate a shortage of qualified candidates for the principalship in the near
future. Second, although about half of the respondents reported earnings of $75,000 to
$100,000, compensation was rated as the lowest contributor to job satisfaction. Third, there was
a significant relationship between job satisfaction and number of assistant principals. The
number of assistant principals is directly related to school size. The researcher found that job
satisfaction of Virginia high school principals is related to school size. Fourth, principals in

32
Virginia will respond to Internet surveys when asked by a fellow Virginia high school principal.
Last, accreditation status was a significant indicator of job satisfaction while adequate yearly
progress was not.
A third study was conducted by Waskiewicz to identify variables that explain job
satisfaction of secondary assistant principals. Four hundred assistant principals were selected
from the 1996 National Association of Secondary School Principals. Dr. Waskiewicz mailed the
short form of the MSQ along with a questionnaire he designed. From the 291 responses, he
reported that assistant principals in Virginia are marginally satisfied with their jobs. He further
stated that he found many of the variables he thought would impact job satisfaction such as age,
compensation, and opportunity for advancement had no significant bearing on job satisfaction.
Supervisor relations were the only variable that had a significant effect on intrinsic, extrinsic, and
general job satisfaction.
Another examination of principals and job satisfaction was conducted by Ellen Eckman
during the 1998-1999 school year. Eckman‟s study examined the experiences of female public
high school principals in Illinois, Minnesota, and Wisconsin to determine the impact of role
conflict, role commitment, and job satisfaction on women in the high school principalship. This
mixed methods study combined quantitative and qualitative components through survey and
interview techniques. Three established surveys were mailed to 237 female high school
principals. One hundred sixty-four of these were returned.
The findings described the demographics of high school female principals as 90.5%
White; 67.9% married, 74% had children with 58.3% of these having children still living at
home. The mean age for female high school principals was 47.7 years of age. Dr. Eckman
reported that female high school principals were moderately satisfied with their job. Many

33
female principals were faced with competing interests of home and work. The study also
revealed the importance of female mentors.
Five conclusions were drawn from this study. There were a disproportionately low
number of female principals with only 15.2% female principals and 48.5 female teachers at the
high school level. Next, there is a growing shortage of qualified candidates for the high school
principalship. One expectation of the high school principalship that needs to be examined is the
extensive time demand. Also, to attract more women to the principalship, a better understanding
of the multiple demands and expectations of women‟s lives is needed. Last, mentoring is a key
factor in enabling women to become principals. Several themes emerged in the study of
exclusively female principals that were not examined in other studies. The competing interests
of home and work were a significant factor in the job satisfaction of female principals.
A more recent study was conducted by Dr. Daniel Bowling in 2007. Dr. Bowling
replicated Dr. Newby‟s 1999 study to investigate the satisfaction level of public middle school
principals in Virginia. The MSQ (1967 long form) was used to determine the levels of job
satisfaction for the 20 dimensions of the job. There were three primary purposes in this study:
(1) conduct a general assessment of the job satisfaction levels of middle school principals in
Virginia (2) determine the specific job dimensions that contribute to job satisfaction (3)
determine the influence of demographic variables on job satisfaction.
Results of the study showed that the general satisfaction of middle school principals
increased since Newby‟s study. Males still reported slightly higher satisfaction scores than
females. Not surprisingly, principals of accredited schools who met AYP standards reported the
highest satisfaction scores.

34
Eight conclusions were drawn from this study. First, participating principals were very
satisfied with their roles. Second, the location of a principal‟s school is important. Principals in
suburban schools were most highly satisfied. Third, age is important in job satisfaction.
Principals 35 years of age and younger reported the highest levels of job satisfaction. Fourth,
gender also plays a role in the job satisfaction of high school principals with males reporting a
statistically significantly higher level of satisfaction than females. Principals with an education
specialist degree reported statistically significantly higher levels of satisfaction than principals
with lower or higher degrees. Fifth, principals with seven to nine years of experience reported
statistically significantly higher levels of satisfaction than principals with more or fewer years of
experience. Sixth, school population was also a statistically significant component with
principals of schools with 1,000 or more students reporting higher satisfaction than principals of
smaller schools. Last, accreditation and adequate yearly progress had no statistically significant
bearing on job satisfaction.
Brogan (2003) studied the job satisfaction of high school principals in Idaho. He mailed
the MSQ (short form) along with a demographic questionnaire to 128 high school principals.
Demographic data included gender, years in current position, highest degree held, ethnicity, and
number of assistant principals. Dr. Brogan used a multiple regression to analyze the data.
Findings indicated that males tended to have slightly higher overall satisfaction than females.
Principals with more tenure had slightly higher job satisfaction than less experienced principals.
Last, principals with the highest number of assistant principals reported higher satisfaction.
Wheelis (2005) conducted a study of job satisfaction of principals in Louisiana. Dr.
Wheelis mailed 1,328 elementary, middle, and high school principals the MSQ (short form)
along with a questionnaire. The questionnaire consisted of three demographic questions and

35
three open-ended questions. An analysis of variance was conducted and findings demonstrated
that there were no significant differences in intrinsic, extrinsic, or general satisfaction. Sixty-
four percent of respondents identified their greatest source of satisfaction was from the students
and the chance to work with the students. A study of elementary school principals in Central
Virginia also revealed that principals indicated overall satisfaction with their jobs (McQueen,
2008).
An even more recent study was conducted in 2006-2007 in Arizona by Dr. Gerrick
Monroe. The purpose of his study was to determine the administrative stress and job satisfaction
levels of Arizona high school principals. In Dr. Monroe‟s study, subjects were randomly
selected from the target population of all Arizona public high school principals. A survey, which
included the Administrative Stress Index (ASI) and the Job Satisfaction Survey (JSS), was sent
to 100 randomly selected principals. Fifty-five of these principals responded. A follow-up
interview was conducted with nine of the 55 respondents. The researcher asked subjects to
provide one item of demographic data, their years of experience as a high school principal. Of
the 55 principals who responded 21 had one to three years of experience; 24 had four to nine
years of experience; and ten had ten or more years of experience.
The online survey consisted of the Administrative Stress Index (ASI) and the Job
Satisfaction Survey (JSS). Both of these instruments have been tested for reliability and validity.
The ASI was created from stress logs completed by administrators. The ASI was then piloted for
validity and clarity. After revision and a second pilot test, the final instrument was created. The
36 items in the JSS are strongly correlated with the subscales of the Job Descriptive Index. The
questions in the JSS were reviewed by professors at Northern Arizona University as well as
former principals to determine clarity; revisions were made based on the feedback.

36
The results of this study indicated that high school principals report the following:
excessive workload and difficulty in complying with federal, state, and district policies. The
most satisfying parts of the job included working with their co-workers, working with students
and parents, and leading positive changes at the school. The most dissatisfying elements of their
work included excessive workload, bureaucratic obstacles, and too much time at work. Both
quantitative and qualitative data suggested that there is no difference in job stress and job
satisfaction levels of inexperienced and experienced high school principals in Arizona.
Summary
This chapter reviewed literature associated with job satisfaction and the accountability
movement within education. Theories of job satisfaction were explained. These theories
included both content and process theories. Among the content theories presented were: (a)
traditional theory and (b) two-factor theory. Among the process theories discussed were (a)
equity theory, (b) fulfillment theory and (c) adjustment theory. The literature review then
considered variables associated with job satisfaction: age, gender, salary, school size, number of
assistant principals, school socioeconomic status, school accreditation status and Adequate
Yearly Progress. Next, a brief historical account of the accountability movement in education
was presented. Finally, various job satisfaction studies were discussed. Three major themes
were repeated throughout these studies on job satisfaction of public school principals. So far,
these researchers agree on several points. First, male principals are generally more satisfied with
the principalship than females. At least one study suggests that this is due to competing interests
of home and work. Second, compensation was identified as a source of dissatisfaction in the
majority of studies. One study did however indicate that principals from suburban schools were
more satisfied with compensation than principals from urban or rural locations. Third, location

37
is an important factor in the job satisfaction of principals. Principals from suburban schools
reported higher overall job satisfaction than principals from urban or rural schools.

38
CHAPTER 3
METHODOLOGY AND DESIGN FOR DATA COLLECTION
This descriptive study was designed to examine job satisfaction of public high school
principals in the Commonwealth of Virginia. This is the third study in a series of studies
examining job satisfaction of public school principals in Virginia. The design of this study
replicates the procedures used in a 2004 study conducted by Dr. James Stemple on the
satisfaction levels of high school principals in Virginia. Dr. Stemple‟s study replicated Dr.
JoeAnn Newby‟s 1999 study of the satisfaction of middle school principals in Virginia. Dr.
Stemple was the first to consider the influence of accountability in relation to principals‟ job
satisfaction in Virginia. The genesis for this study was a recommendation from Dr. Stemple that
the study is replicated every four to five years in order to compare results over a longitudinal
timeframe. This allowed the researcher to investigate whether or not levels of job satisfaction of
high school principals changed under Virginia Accreditation standards and Adequate Yearly
Progress. This chapter presents the research questions, the selection and description of the
participants, explanation of the research instrument, data collection techniques, and statistical
treatment of data.
Research Questions
This study was designed to answer the following research questions:
Question 1:
What is the general level of satisfaction of current public high school principals in the
Commonwealth of Virginia as measured by the Minnesota Satisfaction Questionnaire?

39
Question 2:
What is the satisfaction level of public high school principals in Virginia according to the
following variables: gender, age, salary level, years of experience, number of assistant principals,
years in current school district, school socioeconomic level, and school size?
Question 3:
What is the satisfaction level of public high school principals in Virginia for each of the twenty
dimensions of the job as measured by the MSQ?
Question 4:
Based on the demographic variables of accreditation status and Adequate Yearly Progress
(AYP), what is the general job satisfaction level of high school principals in Virginia?
The Population
The population for this study included all public high school principals in the
Commonwealth of Virginia. Names and email addresses for all public high school principals
were obtained from the Virginia High School League.
Instrumentation
The research instrument consisted of two parts: both the individual data sheet and the
Minnesota Satisfaction Questionnaire (1977 long form) were distributed electronically via
Survey Monkey. The individual data sheet was used to gather information regarding selected
demographic characteristics and also allowed the researcher to compare overall job satisfaction
to selected demographic characteristics. These demographic characteristics are listed below:

40
Gender: refers to the gender of the participant. Respondents were asked to select “male” or
“female”.
Age: refers to the number of years the participant has been alive. Respondents were asked to
select the appropriate age range.
Salary: refers to the monetary compensation the participant receives yearly in exchange for the
work performed. Respondents were asked to choose from the appropriate salary range.
Number of assistant principals: refers to the number of assistant principals who are assigned to
work at the participant‟s school. Respondents were asked to choose the number of assistant
principals currently working at their school.
Years as a principal: refers to the number of years the participant has been a principal at any
level and at any location. Respondents were asked to choose, from a given range, the
appropriate number of years he or she has worked as a principal.
Years in current school district: refers to the number of years the participant has worked, in
any capacity, in the current school district. This variable was measured by asking respondents to
choose the appropriate number of years they have worked in the current school district from a
given range.
Percentage of time spent with students: refers to the percentage of time the principal spends in
contact with students on a daily basis. Respondents were asked to choose from identified ranges
of time.
School socio–economic status: refers to the percentage of students currently enrolled in the
school who receive free or reduced lunch. This variable was assessed by asking respondents to
choose from a predetermined range of percentages ranging from 0 to 100.

41
School size: refers to school enrollment. Respondents were asked to identify the number of
students currently enrolled in their school by selecting from a given range.
School accreditation status: refers to the overall pass rates on the reading and math portions of
the Virginia SOL tests. Respondents were asked to select from the following to describe their
schools‟ accreditation ratings: yes or no.
Adequate Yearly Progress: refers to 29 indicators, as identified in the federal mandate, No
Child Left Behind, that must be met in order to be identified as “making Adequate Yearly
Progress.” Respondents were asked to choose from the following to describe their schools
designation regarding Adequate Yearly Progress: yes or no.
In addition to the demographic questions, principals were asked to choose from the
following to describe their job satisfaction in the last five years: increased, decreased, or
remained the same. They were then asked to rank the top five influences on their job satisfaction
in the last five years using the following choices:
_____ No Child Left Behind _____ Personal Issues
_____ Relationships with Parents _____ Other (please list)
_____ Student Behavior _____ __________________
_____ Adequate Yearly Progress _____ __________________
_____ State Accreditation
The Minnesota Satisfaction Questionnaire (MSQ)
This study utilized the long form of the Minnesota Satisfaction Questionnaire (1977
revision). The MSQ measures the employee‟s satisfaction with his or her job. This instrument is
self-administered in approximately 15-20 minutes and contains 5 items for each of the 20 job
dimensions for a total of 100 items. Each item has five possible responses including very

42
dissatisfied, dissatisfied, neutral, satisfied, and very satisfied. The theory of work adjustment,
on which the MSQ is based, has identified a list of twenty components relevant to both the work
environment (needs) as well as relevant to the individual in the work environment (reinforcers).
These twenty components can then be organized into six value groups for individuals and six
reinforcement groups for jobs. These 20 needs-reinforcers grouped into the six value groups are
listed below: (Dawis & Lofquist, 1981)
Achievement
Ability utilization- makes use of one‟s abilities
Achievement- gives a feeling of accomplishment
Comfort
Activity-provides opportunities to be busy all the time
Independence-working alone at times
Variety-doing something different every day
Compensation- pay compares well with others
Security- steady employment
Working conditions-good environment in which to work
Altruism
Co-workers- friends at work
Moral values-compatible with my moral beliefs
Social service- assisting other people
Status
Advancement-opportunity to move to a higher position
Recognition-recognized for good work

43
Authority-opportunity to tell other people what to do
Social status- being respected by the community
Safety
Company policies and practices-company administers its policies
Supervision-human relations- immediate supervisor supports the workers
Supervision-technical- workers are trained well
Autonomy
Creativity-opportunity to try out your own ideas
Responsibility-making decisions on your own
“Research is always dependent on measurement” (Ary et al., 1996, p. 262). There are
two characteristics of measurement in research, reliability and validity. Reliability is the extent
to which the measuring device is consistent in measuring whatever it measures. A measuring
device is reliable if the scores made by an individual remain nearly the same in repeated
measurements (Pedhazur & Schmelkin, 1991).
Two measures were used to test for reliability in the MSQ, internal consistency and
stability. Internal consistency refers to whether all the items in a test are measuring the same
thing (Ary et al., 1996). Hoyt reliability coefficients ranged from .97 to a low of .59. Of the 567
Hoyt reliability coefficients less than 3% were lower than .70 however 83% were .80 or higher.
This suggests that the MSQ has internal consistency (Weiss et al. 1967).
Stability tells us whether we can generalize from the score a person receives on one
occasion to a score the person would receive on another occasion (Ary et al., 1996). Stability
also assumes that the characteristic measured remains constant. Therefore, a characteristic such
as mood would not have a high stability coefficient. Additionally, stability assumes that enough

44
time has passed between measures so that scores will not be influenced by memory or practice
effect (McMillan & Schumacher, 2001). Scores testing for stability of the MSQ were collected
at the one week and one year intervals. The one week stability coefficients ranged from .66-.91
with a median coefficient of .83 and general satisfaction at .89. The one year stability
coefficients ranged from .35 to .71 with a median coefficient of .61 and general satisfaction at
.70 (Weiss et al. 1967).
Construct validity refers to the extent to which a measuring device is consistent in
measuring whatever it is supposed to measure. A construct refers to something that cannot be
measured directly. A theory, for example, cannot be measured; however, behaviors associated
with the construct can be measured. Construct validation is the extent to which a test measures a
theoretical concept (Ary et al., 1996). To test the construct validity, 25 occupational groups were
identified to test for differences in levels of expressed gratification. An analysis of variance and
Bartlett‟s test of homogeneity of variance was performed (Weiss et al., 1967). Results for the
tests were statistically significant indicating construct validity.
Data Collection Procedures
With permission from the Institutional Review Board at Virginia Tech, all materials were
emailed to participants via Survey Monkey using the email addresses from the Virginia High
School League Directory. The use of the Internet survey allowed respondents to respond to the
survey unbiased by an interviewer and at any time of their choosing (Salant & Dillman, 1994).
A four step data collection method was employed.
1. An introductory email was sent to encourage participation. The first paragraph of the
introductory email was designed to do two things: explain what the study is about and convince

45
the respondent that the study is useful (Dillman, 1978). This email included the purpose of the
study and encouragement to participate.
2. Two weeks after the initial invitation was sent a reminder email was distributed to
encourage participation. Again, the purpose of the study was explained along with a reiteration
of the importance of each person‟s participation.
3. The second invitation was distributed just before the December holiday break.
Therefore, no more reminders were distributed until after the break was over. Survey Monkey
has the ability to identify which participants have responded as well as those who have failed to
respond. With this information a third reminder email was distributed to those who have not yet
responded.
4. After the third invitation, some prospective participants were contacted individually
and asked to participate. Principals were very receptive; oftentimes volunteering to contact their
peers to encourage participation.
Data were collected through Survey Monkey. These data were then coded as necessary
and imported into SPSS. Confidentiality is crucial when conducting surveys via the Internet.
When subjects are recruited online and data are collected confidentiality requires that data is
transmitted via a secure server; server log files listing identifiable data; and secure protection of
the information during the study as well as removal of the records upon completion of the study
(Nosek, Banaji, & Greenwald, 2002). Although respondents were not recruited online, the
Institutional Review Board (IRB) as well as APA requires that reasonable precautions are taken
to protect information (American Psychological Association, 2003). All data were stored on my
personal laptop in order to insure confidentiality. All data were destroyed upon defense of this
dissertation.

46
Non-response
Dillman (2000) states, “non-response error occurs if a significant number of people in the
survey sample do not respond to the questionnaire and have different characteristics from those
who do respond, when these characteristics are important to the study” (p. 10). There are some
steps that can be taken to reduce non-response error. It is important to emphasize the usefulness
and the importance of each person‟s participation. Contacting prospective participants through
multiple reminders also reduces non-response. In order to proactively address non-response
error, both of these methods were employed in this study.
After all data were collected it was important to minimize non-response error by
determining significance of non-respondents. According to McMillan and Schumacher, if the
sample is 200 or more and the return rate is at least 70 percent, the non-respondents will
probably not affect the results. They go on to say that there are two acceptable methods for
checking for non-response bias. First, the researcher can somehow obtain a random sample of
the non-respondents and interview them. Their responses could then be compared to those who
completed the online survey. If it isn‟t possible to interview the non-respondents then McMillan
and Shumacher suggest that the researcher should compare the demographics of non-respondents
to respondents. If the demographics are different then this should be noted in the discussion and
interpretation of results.
Another method of checking for non-response error is offered by Ary, Jacob, &
Razavieh. In this method, the researcher compares the early respondents to the late respondents.
The last 10 percent of respondents were considered late respondents and their results were
compared with the early respondents to determine whether or not there was a difference in

47
responses. This method was used to check for non-response error in this study. This replicated
the manner in which Dr. Stemple accounted for non-response error in his 2004 study.
Statistical Analysis
The primary objectives of this study were: (1) the assessment of the general job
satisfaction of Virginia public high school principals, (2) the assessment of the general job
satisfaction of Virginia public high school principals according to the demographic variables of
gender, age, salary level, years of experience, number of assistant principals, years in current
school district, school socioeconomic level, and school size, (3) the assessment of general job
satisfaction of Virginia public high school principals for each of the twenty dimensions as
measured by the MSQ, and (4) a determination of the influence of accreditation status and
Adequate Yearly Progress on job satisfaction. A data analysis was conducted to respond to each
research question. A descriptive analysis for each variable was then completed. The descriptive
analysis included means, standard deviations, and a range of scores. Below is a list of each
research question along with the method of analysis:
The overarching research question that guided this study was:
1. What is the general level of satisfaction of current public high school principals in the
Commonwealth of Virginia as measured by the Minnesota Satisfaction Questionnaire? The
MSQ manual identifies 20 items, one from each of the 20 dimensions, to measure general job
satisfaction. Each item uses a five point scale, meaning scores can range from 20-100. From
these 20 identified questions, the general job satisfaction mean score for high school principals in
Virginia was determined.

48
These data are presented in a frequency table illustrating general mean satisfaction
scores. According to McMillan, 2004, frequency distributions are a systematic arrangement of
individual measures from lowest to highest. From a frequency distribution it is possible to
examine the general shape of the distribution. The researcher can determine whether they are
distributed evenly or tend to cluster, and where the clusters occur.
A histogram was used to represent these results as recommended by Ary et al., 1996. A
histogram is similar to a bar graph; in a histogram, however, the adjacent bars touch. The
absence of the space between the bars suggests that the scale between the scores continues.
Histograms are recommended for plotting a small range of interval or ratio scores (Ott &
Longnecker, 2001).
Each respondent had five options from which to choose when answering the MSQ items.
The five options were weighted as follows:
Weight Scale Option
1 Extremely Dissatisfied
2 Dissatisfied
3 Neutral
4 Satisfied
5 Extremely Satisfied
The scores for the 20 specific items on the MSQ were summed. Using the five point
Likert Scale, scores could range from 20 to 100. The frequency of responses for each of the
twenty dimensions of the MSQ and the general satisfaction as reported by respondents are
presented in table format. Scores are displayed in a frequency table as well as a histogram.
2. What is the satisfaction level of high school principals in Virginia according to the
following variables: gender, age, salary level, years of experience, number of assistant principals,

49
years in current school district, school socioeconomic level, school size? A one-way ANOVA
was used to compare the mean job satisfaction scores grouped by each demographic. To answer
this question, the researcher used the same 20 specific items from the MSQ and reported overall
job satisfaction as related to each demographic variable. Results are presented in a table format.
An Analysis of Variance (ANOVA) is defined as a procedure for determining whether
significant differences exist in an experiment that contains two or more conditions (Heiman,
2001). An ANOVA was used to analyze the data in relation to the first three questions. An
ANOVA was the statistical method of choice because it demonstrates the relationships between
the dependent and the independent variables when the independent variable has more than two
conditions. For the purposes of this study the dependent variable is job satisfaction and the
independent variables are demographic variables and job dimensions as measured by the MSQ.
Analysis of variance (ANOVA) is one of the most used statistical techniques in research.
There are two underlying reasons for this. The ANOVA deals with differences between or
among sample means but unlike the t-test there is no limit on the number of means. Also, the
ANOVA also allows the researcher to consider two or more independent variables
simultaneously while examining the individual effects of each variable separately (Howell,
2007). This information is presented in a frequency table that includes the number of
participants, mean, standard deviation and frequency.
3. What is the satisfaction level of high school principals in Virginia for each of the twenty
dimensions of the job as measured by the MSQ?
To report these data mean scores were used to compare job satisfaction for each dimension.
Each dimension on the MSQ is represented by five items, for a score ranging from 5 to 25.
These data are presented in a table including number, mean, and standard deviation of each of
the 20 dimensions of the MSQ.

50
4. Based on the demographic variables of accreditation status and Adequate Yearly Progress
(AYP), what is the general job satisfaction level of high school principals in Virginia? The
researcher used an ANOVA to analyze the independent variables of accreditation status and
AYP in relation to overall job satisfaction.
Summary
The intent of this study was to provide descriptive information regarding the job
satisfaction of public high school principals in the Commonwealth of Virginia. Comparisons
were made between current levels of job satisfaction and levels of job satisfaction in Stemple‟s
2004 study to identify trends and provide longitudinal data on job satisfaction in relation to the
increasing state and federal accountability in education. Further, this study investigated the
relationship of job satisfaction as it is related to gender, age, salary level, years of experience,
number of assistant, principals, years in current school district, school socioeconomic level, and
school size. A demographic survey and the MSQ were distributed via email and responses
collected using Survey Monkey. Data were analyzed using frequency distributions and
ANOVAs. Chapter three provides a detailed description of the methods, selection and
description of the participants, explanation of the research instrument, data collection techniques,
and the statistical treatment of the data. It is the researcher‟s intent that this study resulted in
important information regarding the job satisfaction of public high school principals in Virginia.

51
CHAPTER FOUR
ANALYSIS OF DATA
The purpose of this chapter is to present the analysis of data that were collected from the
study of job satisfaction of public high school principals in the Commonwealth of Virginia and
to describe the level of job satisfaction of the principals. The sections of this chapter include: (a)
description of the sample; (b) data analyses presented by research questions; and (c) a brief
summary of data analyses
Description of the Sample
Using the Virginia Department of Education Website, 302 public high schools were
identified as having at least grades 10-12. Of the identified 302 public high school principals,
297 had working email addresses listed with the Virginia High School League. Five of the 302
Virginia public high school principals did not have valid email addresses. Each of these
remaining 297 principals were contacted via Survey Monkey and asked to complete a two-part
survey. Eleven of the remaining 297 principals had previously opted-out of participating in
surveys distributed via Survey Monkey. Thus there were 286 potential respondents to the two
part survey. The first part of the survey included 13 demographic questions and the second part
included the 1977 long form of the Minnesota Satisfaction Questionnaire. One hundred and
sixty-nine high school principals responded, for a response rate of 59% (n=169). According to
Krejcie and Morgan (1970) this is an adequate response rate for .05 significance for a population
of 286.
The demographic data indicated that most respondents were males between the ages of
35 and 55. Seventy-two percent of respondents were male and 57.9% of respondents were
between the ages of 35 and 55. Forty-eight percent of principals who participated earned

52
between $75,000 and $100,000 per year. More than half of the participants had been with their
current school district for more than 15 years; however, 36.3% of respondents were relatively
inexperienced, serving only 1-3 years as principal. Twenty-eight percent of the principals who
responded reported spending between 21 and 31 percent of their time with students. Twenty-
three percent of respondents were principals from schools with enrollments ranging from 1201-
1600 students. While 37% of principals were from schools with greater than 25% economically
disadvantaged students. Ninety-nine percent of responding principals were from schools who
were fully accredited and 83.3% of these schools also met Adequate Yearly Progress. These
data are illustrated in the frequency distribution in Table 3. Respondents to this study from fully
accredited schools as well as schools that made AYP were reflective of the percentage of high
schools in Virginia that met state accreditation standards and who made AYP.
MSQ Scale Reliability Analysis
The Minnesota Satisfaction Questionnaire consists of 100 items which measure 20
dimensions of job satisfaction. Additionally, the researcher may obtain a general satisfaction
score by using one item from each of the twenty dimensions of the MSQ. Respondents replied to
each statement on the MSQ by choosing from a 5-point Likert Scale: very dissatisfied,
dissatisfied, neutral, satisfied, and very satisfied. Weiss, Dawis, England, and Lofquist (1967)
suggest that an internal consistency reliability coefficient be calculated for the sample. The
Statistical Package for the Social Sciences (SPSS) was used to compute the Chronbach‟s Alpha
test of internal consistency on the 20 dimensions of job satisfaction measured by the MSQ.
Chronbach‟s Alpha for total scale was determined to be .91. Results are displayed in Table 4.
This alpha indicates that there is high internal consistency and reliability with this sample. This
coefficient compares to (Stemple .97, Bowling .95 and Newby .95).

53
Table 3
Frequency Distributions for Demographic Variables (n=169)
Demographic Variable N Percentage
Age
Younger than 35 5 3.0
36-45 65 38.7
46-55 63 37.5
Older than 55 32 19.0
Missing 4 1.8
Gender
Male 118 70.2
Female 42 25.0
Missing 8 4.8
Salary
Under $50,000 0 0
$50,000- $75,000 18 10.7
$75,000-$100,000 80 47.6
More than $100,000 67 39.9
Missing 3 1.8

54
Number of Assistant Principals
None 4 2.4
One 34 20.2
Two 27 16.1
Three 53 31.5
Four 32 19.0
Five or more 15 8.9
Total Years as a Principal
1-3 58 34.5
4-6 45 26.8
7-9 26 15.5
10-15 22 13.1
More than 15 9 5.4
Missing 8 4.8
Years in Current District
1-4 26 15.5
5-10 25 14.9
11-15 25 14.9
More than 15 83 49.4
Missing 9 5.4

55
% of Time with Students
Less than 10% 12 7.1
11-20% 35 20.8
21-30% 47 28.0
31-40% 33 19.6
41-50% 21 12.5
More than 50% 16 9.5
Missing 4 2.4
% of students on free lunch
Less than 5% 13 7.7
5-9% 15 8.9
10-14% 26 15.5
15-19% 30 17.9
20-24% 19 11.3
Over 25% 61 36.3
Missing 4 2.4
School Size
Less than 400 students 18 10.7
401-800 34 20.2
801-1200 24 14.3
1201-1600 38 22.6
1602-2000 26 15.5
2001-2400 15 8.9

56
Over 2400 students 10 6.0
Missing 3 1.8
Virginia Accreditation Status
Fully Accredited 163 99.0
Provisionally Accredited:
Meets State Standards
2 1.0
Provisionally Accredited:
Needs Improvement
0 0
Missing 3 1.8
AYP Status
Yes 140 83.3
No 24 14.3
Missing 4 2.4
Data Analysis Organized by Research Questions
This section contains a review of the overarching research question that guided this
study along with the three additional research questions. Each question is followed by a
description of the analysis used along with a review of the data assessment.
Question 1
What is the general level of satisfaction of current public high school principals in the
Commonwealth of Virginia as measured by the Minnesota Satisfaction Questionnaire?

57
Table 4
Chronbach's Alpha for Total Score
Chronbach‟s Alpha Chronbach‟s Alpha Based on
Standardized Items
N of items
.910 .914 20
The MSQ provides a scale to measure general job satisfaction. One question from each
of the 20 identified dimensions of job satisfaction was used to determine the general job
satisfaction. Weiss et al. determined that the 20 questions to be used to measure general job
satisfaction are as follows: 24, 25, 28, 30, 35, 43, 51, 61, 66, 67, 69, 72, 74, 77, 82, 93, 96, 98,
99, and 100. For this study, missing responses were re-coded to the mean response for each
item. According to Pedhauzer (1991) re-coding missing data to the mean is a recommended
method of accounting for missing data.
Each respondent had five options from which to choose when answering the MSQ items.
The five options were weighted as follows:
Weight Scale Option
1 Extremely Dissatisfied
2 Dissatisfied
3 Neutral
4 Satisfied
5 Extremely Satisfied
Scores ranged from 58-100 with a possible range of 20 – 100. The calculated mean score
for participants was M = 78.16 with a standard deviation of SD = 9.1 (n = 169). According to

58
the MSQ manual, the overall satisfaction for high school principals in Virginia is considered to
be satisfied (Weiss et al., 1967). These results are comparable to Brogan‟s 2003 study of high
school principals in Idaho as well as Wheelis‟ 2005 study of elementary, middle, and high school
principals in Louisiana M = 80.94, SD = 11.03. Results are displayed in the histogram in Figure
4.
Question 2
What is the satisfaction level of public high school principals in Virginia according to the
following variables: gender, age, level, salary level, years of experience, number of assistant
principals, years in current school district, school socioeconomic level, and school size?
The general job satisfaction level was determined for each of the demographic variables by
using the MSQ general job satisfaction scale. One-way ANOVAs were used to compare the
mean job satisfaction scores grouped by each demographic variable. Table 5 displays the results
of the ANOVA data analysis for the personal demographic variables of age and gender. Table 6
displays the results of the professional demographic variables of salary, number of assistant
principals, total years as a principal, total years in the division, time spent with students, and
percentage of students receiving free or reduced lunch.
Personal Characteristics
Age
There was no statistically significant difference in job satisfaction based on the
principal‟s age. Principals whose age ranged from 46-55 indicated slightly higher satisfaction
(M=3.95, SD=.442) than their counterparts of different ages.

59
Figure 4. Frequency Distribution for Total Satisfaction.
Gender
There was also no statistically significant difference in job satisfaction based on gender.
Female principals indicated slightly higher job satisfaction (M-3.96, SD=.500) than male
principals (M=3.89, SD=.443). Personal demographic information along with satisfaction scores
can be found in Table 5.
60.00 70.00 80.00 90.00
Mean Score for Overall Satisfaction
0
10
20
30
Frequency
of Response

60
Table 5
Analyses of Variance for Job Satisfaction: Personal Characteristics
Variable n M SD Df F p
Age 164 3.90 .457 3 .488 .691
Younger than 35 5 3.87 .51
36-45 64 3.85 .44
46-55 63 3.95 .44
Older than 55 32 3.91 .50
Gender 159 3.91 .457 1 .669 .415
Male 118 3.89 .443
Female 41 3.96 .500
Professional Characteristics
This section presents the results of the ANOVA data analysis for professional
characteristics. Professional demographic information along with scores can be found in Table
6.
Salary
There was no statistically significant difference in job satisfaction as related to salary.
Principals earning $50,000 - $75,000 (M=3.84, SD=.53) and those earning more than $100,000
(M=3.86, SD=.446) reported slightly less satisfaction than those earning $75,000-$100,000
(M=3.94, SD=.449).

61
Table 6.
Analysis of Variance for Job Satisfaction: Professional Characteristics
Variable n M SD Df F p
Salary 164 3.90 .457 2 .770 .465
$50,000- $75,000 17 3.84 .535
$75,000-$100,000 80 3.94 .449
More than $100,000 67 3.86 .446
Number of Assistant Principals 160 3.90 .460 4 .724 .577
One 34 3.97 .452
Two 27 3.97 .466
Three 53 3.90 .455
Four 31 3.81 .453
Five or more 15 3.84 .512
Total Years as a Principal 159 3.90 .456 4 .768 .547
1-3 57 3.91 .423
4-6 45 3.81 .527
7-9 26 3.92 .416
10-15 22 4.01 .444
More than 15 9 3.87 .430
Years in Current District 159 3.90 .461 3 1.00 .392
1-4 26 3.99 .487
5-10 25 3.88 .399
11-15 25 3.99 .537

62
More than 15 83 3.85 .446
% of Time with Students 163 3.90 .453 3 .488 .691
Less than 10% 12 3.61 .615
11-20% 35 3.98 .384
21-30% 46 3.94 .446
31-40% 33 3.81 .475
41-50% 21 3.89 .402
More than 50% 16 4.06 .424
% of students on free lunch 163 3.90 .455 5 2.22 .057
Less than 5% 13 3.87 .523
5-9% 14 3.72 .498
10-14% 26 4.02 .450
15-19% 30 3.95 .360
20-24% 19 3.66 .470
Over 25% 61 3.96 .448
School Size 164 3.90 .457 6 1.23 .291
Less than 400 students 18 3.93 .495
401-800 34 4.01 .400
801-1200 24 3.80 .396
1201-1600 38 3.93 .489
1602-2000 25 3.82 .415
2001-2400 15 4.00 .571
Over 2400 students 10 3.67 .455
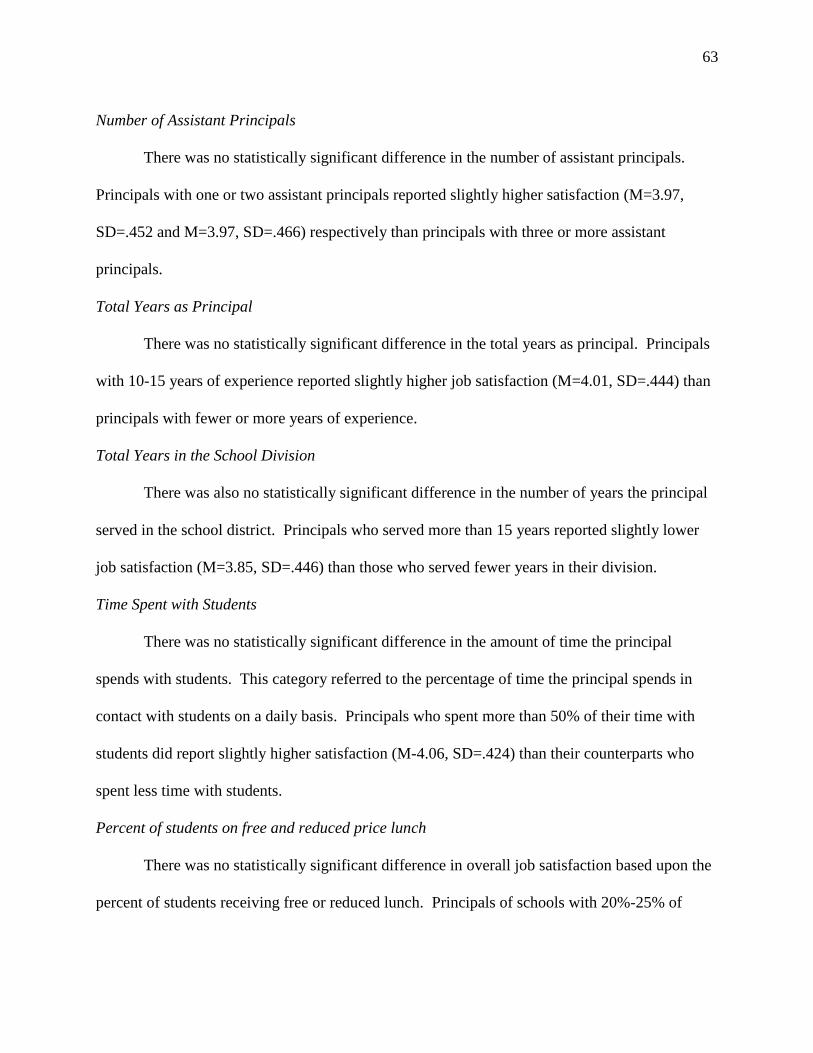
63
Number of Assistant Principals
There was no statistically significant difference in the number of assistant principals.
Principals with one or two assistant principals reported slightly higher satisfaction (M=3.97,
SD=.452 and M=3.97, SD=.466) respectively than principals with three or more assistant
principals.
Total Years as Principal
There was no statistically significant difference in the total years as principal. Principals
with 10-15 years of experience reported slightly higher job satisfaction (M=4.01, SD=.444) than
principals with fewer or more years of experience.
Total Years in the School Division
There was also no statistically significant difference in the number of years the principal
served in the school district. Principals who served more than 15 years reported slightly lower
job satisfaction (M=3.85, SD=.446) than those who served fewer years in their division.
Time Spent with Students
There was no statistically significant difference in the amount of time the principal
spends with students. This category referred to the percentage of time the principal spends in
contact with students on a daily basis. Principals who spent more than 50% of their time with
students did report slightly higher satisfaction (M-4.06, SD=.424) than their counterparts who
spent less time with students.
Percent of students on free and reduced price lunch
There was no statistically significant difference in overall job satisfaction based upon the
percent of students receiving free or reduced lunch. Principals of schools with 20%-25% of

64
socio economically disadvantaged students reported the lowest level of overall satisfaction
(M=3.66, SD=.470).
Question 3
What is the satisfaction level of public high school principals in Virginia for each of the twenty
dimensions of the job as measured by the MSQ?
A mean score and standard deviation for each of the 20 dimensions of the Minnesota
Satisfaction Questionnaire was determined. Each of the twenty dimensions has a mean score
within the possible range of 1-5. Principals reported the highest levels of satisfaction with social
service, achievement, and activity. Lowest levels of satisfaction were reported in the areas of
authority, independence, and compensation respectively. These results are displayed in rank
order in Table 7.
Question 4
Based on the demographic variables of accreditation status and Adequate Yearly Progress
(AYP), what is the general job satisfaction level of high school principals in Virginia? The
general job satisfaction level was determined for the demographic variables of accreditation
status and Adequate Yearly Progress. The mean job satisfaction scores were grouped by each of
the two demographic variables and compared using ANOVAs. Results from the ANOVA data
analyses are displayed in Table 8.

65
Table 7
Rank Order of Each Dimension of Job Satisfaction
Dimension n M SD
Social Service 169 4.36 .563
Achievement 169 4.24 .733
Activity 169 4.20 .627
Responsibility 169 4.19 .631
Security 169 4.15 .706
Variety 169 4.12 .612
Moral Values 169 4.11 .664
Ability Utilization 169 4.09 .698
Co-workers 169 3.99 .675
Creativity 169 3.99 .731
Supervision: Technical 169 3.92 .884
Working Conditions 169 3.85 .904
Supervision: Human Relation 169 3.75 .945
Social Status 169 3.74 .945
Advancement 169 3.74 .813
Recognition 169 3.57 .874
Company Policy and Procedures 169 3.56 .826
Authority 169 3.55 .605
Independence 169 3.55 .663
Compensation 169 3.40 1.01

66
Table 8
General Satisfaction and Demographics (Accreditation and AYP)
Variable N M SD F p
Accreditation Status 164 3.90 .458 1 .223
Fully Accredited 162 4.26 .155
Provisionally Accredited: Meets State Standards 2 3.90 .457
Adequate Yearly Progress 163 3.90 .457 1 .223
Yes 139 3.91 .464
No 24 3.86 .420
Virginia Accreditation Status
There was no statistically significant difference in the job satisfaction of principals of
schools who were fully accredited (M=4.26, SD=.155) and schools who were accredited with
warning under Virginia Accreditation Standards (M=3.90, SD=.458).
Adequate Yearly Progress
There was also no statistically significant difference between principals whose school
met Adequate Yearly Progress (M=3.91, SD=.464) and principals whose schools did not meet
Adequate Yearly Progress (M=3.86, SD=.420). Although no statistical significance was found
regarding AYP and overall satisfaction, principals who reported decreased job satisfaction in the
last five years identified AYP most often as one of the top five contributors to decreased job
satisfaction. These same principals identified NCLB as the second most influential factor for
their decreased job satisfaction.

67
Principals who reported that their job satisfaction has increased in the last five years
ranked relationships with parents most often as one of the top five influences for their increased
job satisfaction. These same principals reported student behavior as the second most influential
factor with AYP ranked as the fourth and NCLB as the fifth most influential factors. Likewise,
principals who reported that their job satisfaction had remained the same in the last five years
ranked relationships with parents as first, with student behavior ranked second. AYP was listed
as third most influential with NCLB ranked fourth. Results can be found in Table 9. Eighty-
three percent of principals who responded to this survey were from schools that made AYP.
Similarly, eighty-four percent of high school principals across the state of Virginia are from
schools that made AYP.
Summary
This chapter presented information gathered from a two-part survey. Demographic
information from the Individual Data Sheet along with the Minnesota Satisfaction Questionnaire
was collected from 169 participants and analyzed. Results from these analyses provided
information regarding (a) the demographics of the high school principal in Virginia, (b) the
overall level of job satisfaction, (c) the level of job satisfaction as related to the 20 dimensions of
job satisfaction identified by the Minnesota Satisfaction Questionnaire, and (d) the overall job
satisfaction of high school principals in Virginia as related to the demographics of accreditation
and Adequate Yearly Progress.
These analyses indicated that high school principals in the Commonwealth of Virginia
are generally satisfied. The overall mean score for satisfaction was 78.19 on a scale of 20-100.
On the Likert scale this score was 3.86. This score was slightly higher than Stemple‟s 2004

68
Table 9
Rank Order of Influences in Change in Job Satisfaction
Increased Job Satisfaction Decreased Job Satisfaction Remained the Same
Relationships with parents AYP Relationships with parents
Student Behavior NCLB Student Behavior
Accreditation Student Behavior AYP
AYP Relationships with parents NCLB
Personal Reasons Accreditation Accreditation
NCLB Personal Reasons Personal Reasons
study which found an overall mean satisfaction score of 3.45. Public high school principals in
Virginia are most satisfied with social service, achievement, and activity. These findings are
consistent with earlier studies (Newby, 1999, Stemple, 2004, Bowling, 2007). In addition to
school personnel, mental health professionals such as school counselors also rate social service
as the highest dimension affecting satisfaction (Bane, 2006). Respondents reported being least
satisfied with authority, independence, and compensation. As in previous studies, compensation
had the lowest mean score of the twenty dimensions (Newby, 1999, Stemple, 2004, Bowling,
2007).
Results also indicate no significant difference in job satisfaction among principals
regardless of accreditation or Adequate Yearly Progress status. Although no statistically
significant difference regarding accreditation status or AYP and overall job satisfaction was
found, principals who indicated that their job satisfaction had decreased in the last five years
identified AYP and NCLB as the two most influential factors in the change in job satisfaction.

69
Stemple‟s 2004 study found a significant difference in accreditation status and overall job
satisfaction but no difference regarding AYP or NCLB and job satisfaction.

70
CHAPTER FIVE
SUMMARY, DISCUSSION, AND CONCLUSIONS
This chapter begins with a summary of the study. Following the summary of the
study, a summary of the findings is presented. The second part of the chapter will present
implications for practice along with recommendations for further study. Following will be a
discussion as well as reflections on the findings. The third and final section contains the
summary of the chapter.
Summary of the Study
The purpose of this study was to determine the level of job satisfaction of public high
school principals in the Commonwealth of Virginia. Specifically, the researcher investigated (a)
the overall satisfaction level of public high school principals in the Commonwealth of Virginia;
(b) the satisfaction level of public high school principals in Virginia according to the following
demographic variables: age, gender, salary level, years of experience as a principal, number of
assistant principals, years in current school district, school socioeconomic level, and school size;
(c) the satisfaction level of public high school principals in Virginia for each of the twenty
dimensions measured by the Minnesota Satisfaction Questionnaire; (d) the overall satisfaction
level of public high school principals as related to the demographic variables of accreditation
status and Adequate Yearly Progress. Each of these questions was analyzed using descriptive
statistics including frequency distributions, and ANOVAs.
Findings
The following conclusions were drawn based on the data reported in chapter 4.
1. Since 2004, job satisfaction levels have increased for public high school
principals in Virginia. This study found an overall satisfaction mean score of

71
3.86 on a five-point Likert scale. Stemple (2004) found a mean score of 3.45.
Both mean scores indicate that high school principals are generally satisfied
with the score being closer to satisfied than to neutral. This is consistent with
Newby (1999) who found an overall satisfaction score of 3.65 for middle
school principals.
2. The majority of high school principals are between the ages of 35 and 55. Of
the 169 respondents 57.8% were between the ages of 35 and 55. These data
are consistent with Stemple‟s 2004 study which reported over half of his
respondents were 55 and older and therefore at or near retirement age.
Stemple conjectured that many of these principals would be retiring in the
next 4 years. With 57.8% of this study‟s respondents being between the ages
of 35 and 55 the researcher concludes that many of the participants in
Stemple‟s study have, in fact, retired and been replaced by younger principals.
3. Compensation received the lowest satisfaction rating. The majority of high
school principals reported earning $75,000 or more, however satisfaction with
compensation received the lowest satisfaction rating. Principals reported
being least satisfied with how their pay compares with the pay of others in
similar jobs. This supports the findings of Stemple (2004), Brogan (2003),
and Bowling (2007).
4. The percentage of students who receive free or reduced lunch does not
significantly affect the overall job satisfaction level of the principal. Despite
ever-increasing benchmarks for sub-groups including socioeconomically
disadvantaged students, this study found no significance regarding the

72
percentage of socioeconomically disadvantaged students and the principal‟s
overall job satisfaction.
5. High school principals receive a feeling of accomplishment through helping
others. The two dimensions reported with the highest levels of satisfaction
were achievement (M=4.24, SD=.733) and social service (M=4.36, SD=.563).
Achievement is defined by the MSQ as giving a feeling of accomplishment
and social service is defined as the having the opportunity to help others.
6. Principals enjoy the high level of activity and opportunity to be busy in a high
school setting. High school principals indicated activity (M=4.20, SD=.627)
as the dimension receiving the third highest satisfaction rating.
7. Principals feel they are not given authority commensurate with the level of
responsibility. Other than compensation, the lowest levels of satisfaction were
indicated with regards to authority (M=3.55, SD=.605) and independence
(M=3.55, SD=.663). Newby (1999) and Stemple (2004) also found that
independence received the next to lowest rating in satisfaction. In 1999 and
2004 principals indicated that opportunity for advancement was the third
lowest rated dimension. The results of this study indicate that principals are
now less satisfied with authority than opportunity for advancement.
8. Gender, years of experience, number of assistant principals, years in the
current school districts and school size have no impact on high school
principals‟ level of job satisfaction. This study found no significant difference
in job satisfaction among these groups.

73
Female principals reported a slightly higher level of job satisfaction
(M=3.96, SD.500) than their male counterparts (M= 3.89, SD.443). Female
principals also indicate a higher level of satisfaction with achievement
(M=4.47, SD=.612) than the male respondents (M=4.19, SD=.772). This is
contrary to Stemple‟s 2004 study which indicated a slightly higher level of
satisfaction for male principals. Likewise, Brogan‟s 2003 study of high
school principals in Idaho revealed male principals were significantly more
satisfied than female principals.
There was no significant difference in school size or the number of
assistant principals. Principals with four or more assistant principals reported
the lowest levels of overall job satisfaction (M=3.81, SD=.453). Stemple
(2004) found that principals with three assistant principals were significantly
more satisfied than those with fewer or more assistant principals. This finding
is contrary to Brogan‟s (2003) study which found that principals with more
assistant principals were overwhelmingly more satisfied than those with fewer
assistant principals.
There was no significant difference in job satisfaction with regards to the
number of years the respondent served as principal, nor the number of years
the respondent had worked in his or her current school district. Findings
indicated that principals with more than 15 years of experience were least
satisfied with security (M=3.77, SD.971) as well as compensation (M=3.11,
SD=1.05). Principals who had served their current school district for 5-10

74
years were less satisfied with compensation (M=2.84, SD=1.01) than their
counterparts who had more or less years with their current school districts.
9. State accreditation and Adequate Yearly Progress have not significantly
affected high school principals‟ level of job satisfaction. Principals who
reported that their satisfaction with the principalship has increased in the last
five years indicated the most significant factors for increased satisfaction were
relationships with parents and student behavior. Adequate Yearly Progress
was the third most listed factor. This suggests that the increasing demands of
the accountability movement are not affecting the job satisfaction of public
high school principals in the Commonwealth of Virginia. When overall
satisfaction was compared with regards to accreditation status and Adequate
Yearly Progress there was no significant difference in principals of schools
who were fully accredited (M=4.26, SD=.155) and schools who were
accredited with warning under Virginia Accreditation Standards (M=3.90,
SD=.458). Likewise, there was no significant difference between principals
whose school met Adequate Yearly Progress (M=3.91, SD=.464) and
principals whose schools did not meet Adequate Yearly Progress (M=3.86,
SD=.420). Although no statistical significance was found regarding AYP and
overall satisfaction, those principals who reported decreased job satisfaction
in the last five years identified AYP most often as one of the top five
contributors to decreased job satisfaction. These same principals identified
NCLB as the second most influential factor for their decreased job
satisfaction.

75
Implications for Practitioners
This study provides important information for understanding the job satisfaction of public
high school principals in the Commonwealth of Virginia. This information will assist state and
local officials in developing and enhancing mentoring programs for principals leading to greater
retention of effective principals. This understanding will also be useful to human resources
departments as they seek to attract the most qualified principals to lead our schools.
1. State and local officials need to continually assess the job satisfaction of principals in
order to maintain a high level of satisfaction. This study indicates that participants
reported being satisfied in their positions as high school principals. It is important
that state and local officials continue to monitor the overall job satisfaction of high
school principals as well as job satisfaction in relation of dimensions of the job.
2. School boards need to insure principals‟ pay is competitive nationally. Increased
compensation may prevent the loss of qualified principals to more lucrative
professions. High school principals are least satisfied with compensation. The
findings from this study indicated that compensation was the lowest of the 20 job
satisfaction dimensions.
3. The majority of high school principals who participated in this study were between
the ages of 35-55. This indicates that recently retired principals are being replaced by
younger principals. Division based professional development programs should be
tailored to meet the needs and develop the capacity of young administrators.
4. Mentoring programs should be developed to assist future and current administrators
in becoming more effective. These programs may offer training in developing

76
relationships and forging partnerships with parents and students. Increased
partnerships and positive parent and student involvement will further enhance the job
satisfaction of high school principals. The programs should also provide awareness
of various community outreach programs to better equip principals to provide
assistance to their school population.
5. Division leaders should implement procedures and programs that provide greater
reliance on site-based management. Superintendents should consider strategies and
initiatives to increase principals‟ perception of authority in order to further increase
job satisfaction. One such facilitation could be a greater reliance on site-based
management.
6. High school principals should consider the time demands of a high school
principalship and whether or not they are effectively balancing these demands with
the demands of their personal lives. Although high school principals ranked activity
as the third highest dimension of job satisfaction, the high school principalship is
extremely time-demanding. The high school principalship is both mentally and
physically challenging. Principals must meet the needs of students, parents, faculty
and staff, central office, and the superintendent. This involves high-stakes decisions
regarding academics, curriculum, discipline, and athletics. High school principals
must also meet grueling demands of after-school activities. It has been pointed out
that the high school principalship is a burn-out position (Gmelch and Gates, 1997).
Female principals also report a large degree of role conflict as they work to balance
the demands of home and work (Eckman, 2002).

77
7. Human resources departments should not consider years of experience or years in
current school district when selecting potential candidates to serve as high school
principals. This study found that these professional demographic indicators do not
influence the overall job satisfaction of the high school principal.
8. Those who oppose increased accountability such as state accreditation and Adequate
Yearly Progress should not tout the job satisfaction of high school principals as a
reason to eliminate federal or state accountability initiatives. This study found that
state and accreditation and Adequate Yearly Progress do not significantly affect the
job satisfaction of high school principals.
Recommendations for Further Study
On the basis of the findings and conclusions drawn from the study, five recommendations
have been developed. The recommendations follow:
1. This study could be done using qualitative or mixed methods research methodology.
This would allow the researcher to investigate job satisfaction using in-depth
information and rich data from interviews and focus groups.
2. This study has been conducted using both middle and high school principals in
Virginia. Additionally, a study of job satisfaction and elementary school principals in
Central Virginia has been conducted, but no study of job satisfaction of elementary
principals in the Commonwealth of Virginia has been completed. A study of the job
satisfaction of elementary principals in Virginia should be conducted to allow for a
more comprehensive understanding of the job satisfaction of principals in Virginia.

78
3. This study could be replicated using a different survey instrument. The MSQ was
originally designed to measure job satisfaction in business and industry. Some
participants noted concerns regarding the length and repetitious nature of the
questions. Several also commented that the survey does not address specific concerns
of education and principals.
4. A comparative study including elementary, middle, and high school principals could
be conducted. This study would increase knowledge of the job satisfaction and the
principalship in the Commonwealth of Virginia.
5. This study could be replicated in four to five years to investigate whether or not the
job satisfaction of public high school principals continues to increase. This will
become increasingly important as the benchmarks approach 100% and the impact of
safe harbor is lessened.
Discussion
The purpose of this study was to determine the level of job satisfaction of public high
school principals in the Commonwealth of Virginia. The population for this study included all
public high school principals in the Commonwealth of Virginia who had emails listed in the
Virginia High School League Directory for the 2008-2009 school year. Of the 302 principals
listed, five emails were returned as undeliverable and eleven had previously opted out of
participating in Survey Monkey. From the 286 emails originally sent, 169 ultimately responded
for a return rate of 59%. The work adjustment theory was used to research the job satisfaction of
public high school principals in the Commonwealth of Virginia. The Minnesota Satisfaction
Questionnaire (1977 revision) developed by the Minnesota Studies in Vocational Rehabilitation

79
based on the work adjustment theory was used. The MSQ measures the employee‟s satisfaction
with his or her job based on 20 dimensions of job satisfaction.
The findings of this study suggest that public high school principals in the
Commonwealth of Virginia are generally satisfied with their jobs. Principals reported the
highest areas of satisfaction as social service, achievement, and activity. The lowest areas of
satisfaction were authority, independence, and compensation. As in studies by Newby (1999),
Chen (2000), and Stemple (2004) compensation was the lowest ranked dimension of satisfaction.
Reflections
The findings from this study indicate that even as the accountability increases and the
benchmarks for Adequate Yearly Progress continue to rise, so does the job satisfaction of public
high school principals in the Commonwealth of Virginia. This positive correlation, of course,
does not indicate causation. The rise in job satisfaction may be attributed to several factors. The
researcher believes that many in the field of education welcomed greater accountability. As
such, the No Child Left Behind mandate to achieve in all sub groups has been embraced by
educators including principals. Principals may feel greater overall job satisfaction in knowing
that they are meeting the challenges put forth in this federal legislation.
Secondly, the majority of respondents to this survey were between the ages of 35 – 55.
Perhaps, the younger principals are more adept with technology and data driven decision
making. These principals new to the profession may have received more recent training in being
an instructional leader. These skills would make it easier to navigate the requirements of
aligning curriculum and objectives, meeting benchmarks and the like.
The increase in the overall job satisfaction of public high school principals speaks to the
resiliency of those who choose the profession. Time and time again, principals indicate that their

80
greatest satisfaction comes from social service. Men and women who choose to lead schools
have a desire to serve. Despite increased paperwork or the pressure of Standards of Learning
scores, principals still find satisfaction in serving the students and parents of their communities.
This explains why those principals who indicated increased job satisfaction or no change in job
satisfaction in the last five years attributed their satisfaction to interactions with parents and
student behavior. Principals remain dedicated to educating students.
This study also leaves some unanswered questions. First, this study found that job
satisfaction increased for public high school principals while AYP benchmarks continue to rise.
What role then, if any, does No Child Left Behind play in the job satisfaction of high school
principals? It would be interesting to investigate more specifically the direct and indirect effects
of the accountability movement on the job satisfaction of high school principals. Second,
compensation is consistently the lowest ranked dimension of job satisfaction Stemple (2004),
Newby (1999). Although the Virginia Department of Education reports that the average
budgeted salary for fiscal year 2009 is 92,174, a 3.56 percent increase from 2008, satisfaction
with compensation remains low. It is important to reveal what level of compensation would lead
principals to rate compensation at a higher level. It is also important to find out how the current
level of compensation compares with similar professions.
Summary
This chapter discussed the results of this study including statistically significant findings.
The purpose of this study was to examine the job satisfaction of public high school principals in
the Commonwealth of Virginia. This research replicated the procedures used in a 2004 study
conducted by Dr. James Stemple. The data indicated that public high school principals in the

81
Commonwealth of Virginia are generally satisfied with their jobs. Based on the results of the
study, the researcher provided recommendations for future research. Next a general discussion
of findings was presented followed by reflections.

82
References
Adams, J. S. (1965). Advances in experimental social psychology (Vol. 2). New York: Academic
Press.
American Psychological Association. (2003). Publication manual of the American psychological
association (5th ed.). Washington, DC, US: Author.
Ary, D., Jacobs, L. C., & Asghar, R. (1996). Introduction to research in education (5th ed.). New
York: Harcourt Brace College Publishers.
Bane, T. Y. (2006). Job satisfaction among professional middle school counselors in Virginia.
Unpublished doctoral dissertation, Virginia Polytechnic University, Blacksburg, VA.
Barrack, R. & Shortt, T. (2001). Report on the 2001 Virginia Principals Study: Preface (School
of Education). Williamsburg, VA: The College of William and Mary.
Bedeian, A. G., Ferris, G. R., & Kacmar, K. M. (1992). Age, tenure, and job satisfaction: a tale
of two perspectives. Journal of Vocational Behavior, 40(1), 33-48.
Berkowitz, L., Fraser, C., Treasure, P., & Cochran, S. (1987). Pay, equity, job gratifications, and
comparisons in pay satisfaction. Journal of Applied Psychology, 72(4), 1-9.
Bowling, D. (2007). Job satisfaction of public middle school principals in the Commonwealth of
Virginia: Revisited. Unpublished doctoral dissertation, Virginia Polytechnic University,
Blacksburg, VA.
Brogan, G. (2003). Job satisfaction of Idaho high school principals. Unpublished doctoral
dissertation, Idaho State University, Pocatello, ID.
Chen, K. (2000). Job satisfaction among high school assistant principals. Unpublished doctoral
dissertation, Mississippi State University, Starkeville.

83
Clark, A. E. (1997). Job satisfaction and gender. Labour Economics, 4, 341-372.
Clark, A., Oswald, A., & Warr, P. (1996). Is job satisfaction u shaped? Journal of Occupational
and Organizational Psychology, 69, 57-81.
Daresh, J. C., & Capasso, R. (2002, April). Where are the future principals? Explaining a lack
of interest. Paper presented at the Annual Meeting of the American Educational Research
Association, New Orleans, LA: Author.
Dawis, R.V., England, G.W., & Lofquist, L.H. (1964). A theory of work adjustment.
Minneapolis, MN: University of Minnesota, Industrial Relations Center.
Dawis, R., & Lofquist, L. (1981). Job satisfaction & work adjustment (Information Series No.
18, pp. 1-24). Columbus, Ohio: Ohio State University.
Dawis, R., & Lofquist, L. (1984). A pschological theory of work adjustment. Minneapolis:
University of Minnesota Press.
DeMeuse, K. P. (1985). A compendium of frequently used measures in industrial/organizational
psychology. The Industrial-Organizational Psychologist, 23, 53-59.
Dillman, D. (2000). Mail and internet surveys: The tailored design method. New York: John
Wiley & Sons.
Dillman, D. (1978). Mail and telephone surveys. New York: Wiley-Intersceince Publication.
Di Paola, M., & Tschannen-Moran, M. (2001). Report on the 2001 Virginia Principals Study
(School of Education). Williamsburg, VA: The College of William and Mary.
Eckman, E. (2002). Women high school principals; perspectives on role conflict, role
commitment, and job satisfaction. Journal of School Leadership, 12, 57-77.

84
Gmelch, W., & Gates, G. (1997). The impact of personal. professional, and organizational
characteristics on administrator burnout. Journal of Educational Administration, 36(2),
146-159.
Graham, M., & Messner, P. (1998). Principals and job satisfaction. Journal of Educational
Management, 12(5), 196-202.
Gronn, P., & Rawlings-Sanaei, F. (2003). Principal recruitment in a climate of leadership
disengagement. Australian Journal of Education, 47, 1.
Gruneberg, M. (1979). Understanding job satisfaction. Thetford, Norfolk, Great Britain: Lowe
and Brydone Printers ltd.
Gruneberg, M. M. (1976). Job satisfaction - a reader. London: Macmillan.
Heiman, G. W. (2001). Understanding research methods and statistics. Boston: Houghton
Mifflin Company.
Herzberg, F., Mausner, B., & Snyderman, B. (1959). The motivation to work. New York: John
Wiley & Sons.
Hoppock, R. (1935). Job satisfaction. New York: Harper and Brothers.
Howell, D. (2007). Statistical methods for psychology (6th ed.). Thomson: Wadsworth.
Hulin, C., & Blood, M. (1968). Job enlargement, individual differences, and worker responses.
Psychological Bulletin, 69(1), 41-55.
Hulin, C., & Smith, P. (1964). Sex differences in job satisfaction. Journal of Applied Psychology,
48(2), 88-92.
Hulin, C., & Smith, P. (1965). A linear model of job satisfaction. Journal of Applied Psychology,
49(3), 209-216.
Johnson, J. (2004). What school leaders want. Educational Leadership, 61(7), 24-27.

85
Johnson, N., & Holdaway, E. (1991). Perceptions of effectiveness and the satisfaction of
principals in elementary schools. Journal of Educational Administration, 29(1), 51-70.
Krejcie, R., & Morgan, D. (1970). Determining sample size for research activities. Educational
and Psychological Measurement, 30, 607-610.
Lawler, E. E. (1994). Motivation in Work Organizations. San Francisco: Jossey-Bass.
Locke, E. A. (1976). The nature and causes of job satisfaction. In M.D. Dunnet (Ed.), Handbook
of of Industrial and Organizational Psychology (pp. 1297-1349). Chicago: Rand
McNally.
Lofquist, L., & Dawis, R. (1969). What is job satisfaction? Organizational Behavior and Human
Performance, 4, 309-336.
Long, F. A. (1989). Connecticut middle school principals' job satisfaction with respect to
selected motivators and hygienes. Unpublished doctoral dissertation, University of
Connecticut, Storrs.
Lovely, S. (2004). Staffing the principalship: finding, coaching, and mentoring school leaders.
Alexandria, Virginia: Association for Supervision and Curriculum Development.
Lunenburg, F. C., & Ornstein, A. C. (2000). Educational administration: concepts and practices
(3rd ed.). Wadsworth, Connecticut: Belmont Publishing Corp.
Marzano, R., McNulty, B., & Walters, T. (2005). School Leadership that Works: From Research
to Results. Aurora, Colorado: Mid-continent Research for Education and Learning.
Maslow, A. H. (1954). Motivation and personality. New York: Harper.
McMillan, J. (2004). Educational Research: Fundamentals for the Consumer (4th ed.). New
York: Pearson and AB.

86
McMillan, J., & Schumacher, S. (2001). Research in Education: A Conceptual Introduction (5th
ed.). New York: Longman.
McQueen, M. (2007). Motivators of Job Satisfaction for Elementary School Principals in
Central Virginia. Unpublished dissertation thesis, Virginia Commonwealth University,
Richmond.
Mischkind, L. (1967). A two factor theory of job satisfaction?; a multi-method and situational
analysis. Unpublished doctoral dissertation, New York University, New York.
Monroe, G. (2007). The administrative stress and job satisfaction levels of Arizona high school
principals. Unpublished doctoral dissertation, Northern Arizona University, Flagstaff,
AZ.
Newby, J. (1999). Job satisfaction of middle school principals in Virginia. Unpublished doctoral
dissertation, Virginia Polytechnic University, Blacksburg, VA.
Norton, M. S. (2002). Let's keep our quality school principals on the job. The High School
Journal, Dec. 2002/Jan. 2003, 50-56.
Nosek, B. A., Banaji, M. R., & Greenwald, A. G. (2002). E-research: ethics, security, design, and
control in psychological reseach on the internet. Journal of Social Issues, 58(1), 161-176.
Ott, R. L., & Longnecker, M. (2001). An introduction to statistical methods and data analysis
(5th ed.). US: Duxbury.
Pedhazur, E., & Schmelkin, L. (1991). Measurement, design, and analysis: an integrated
approach. Hillsdale, NJ: Lawrence Erlbaum Associates.
Richford, M. L., & Fortune, J. (2001). The secondary principal's job satisfaction in relation to
two personality constructs. Education, 105, 17-20.

87
Salant, P., & Dillman, D. (1994). How to conduct your own survey. New York: John Wiley &
Sons, Inc.
Spector, P. (1997). Job satisfaction. Thousand Oaks, CA: Sage.
Stemple, J. D. (2004). Job satisfaction of high school principals in Virginia. Unpublished
doctoral dissertation, Virginia Polytechnic University, Blacksburg, VA.
U.S. National Commission on Excellence in Education. (1983). A nation at risk: the imperative
for educational reform: a report to the nation and the Secretary of Education, U.S.
Department of Education. Washington, USA.
Virginia Department of Education. (2008). 2008-2009 Teacher, assistant principal, and
principal salary report. Available from
http://www.vassp.org/VDOE%202009%20Teacher%20Principal%20Asst.%20Prin.%20S
alary%20Report.pdf
Virginia Department of Education. (2008). Virginia implements No Child Left Behind. Available
from http://www.doe.virginia.gov/VDOE/nclb/
Vroom, V. (1964). Work and Motivation. New York: John Wiley & Sons.
Vroom, V. (1995). Work and Motivation. San Francisco, CA: Jossey-Bass.
Waskiewicz, S. P. (1999). Variables that contribute to job satisfaction of secondary school
assistant principals. Unpublished doctoral dissertation, Virginia Polytechnic University,
Blacksburg, VA.
Weiss, D. J., Dawis, R. V., England, G. W., & Lofquist, L. H. (1967). Manual for the Minnesota
Satisfaction Questionnaire. Minneapolis, MN: Work Adjustment Project, Industrial
Relations Center.

88
Wernimont, P. (1964). Intrinsic and Extrinsic Factors in Job Satisfaction. Unpublished doctoral
dissertation, University of Minnesota, Twin Cities, MN.
Wheelis, V. L. (2005). The relationship between school performance scores and job satisfaction
of principals in Louisiana. Unpublished doctoral dissertation, Louisiana Tech, Ruston,
LA.
Zedeck, S. (1987, Oct). Satisfaction in union members and their spouses. Paper presented at the
Job Satisfaction: Advances in Research and Practice Conference, Bowling Green, OH.

89
Appendix A
Individual Information Sheet
1. What is your age?
a. Younger than 35
b. 36-45
c. 46-55
d. Older than 55
2. What is your gender?
a. Male
b. Female
3. What is your salary range?
a. Less than $50,000
b. $50,000-$75,000
c. $75,000-$100,000
d. More than $100,000
4. How many assistant principals are assigned to your school?
a. 0
b. 1
c. 2
d. 3
e. 4
f. 5 or more
5. How many years have you been a high school principal?
a. 1-3
b. 4-6
c. 7-9
d. 10-15
e. 15 or more
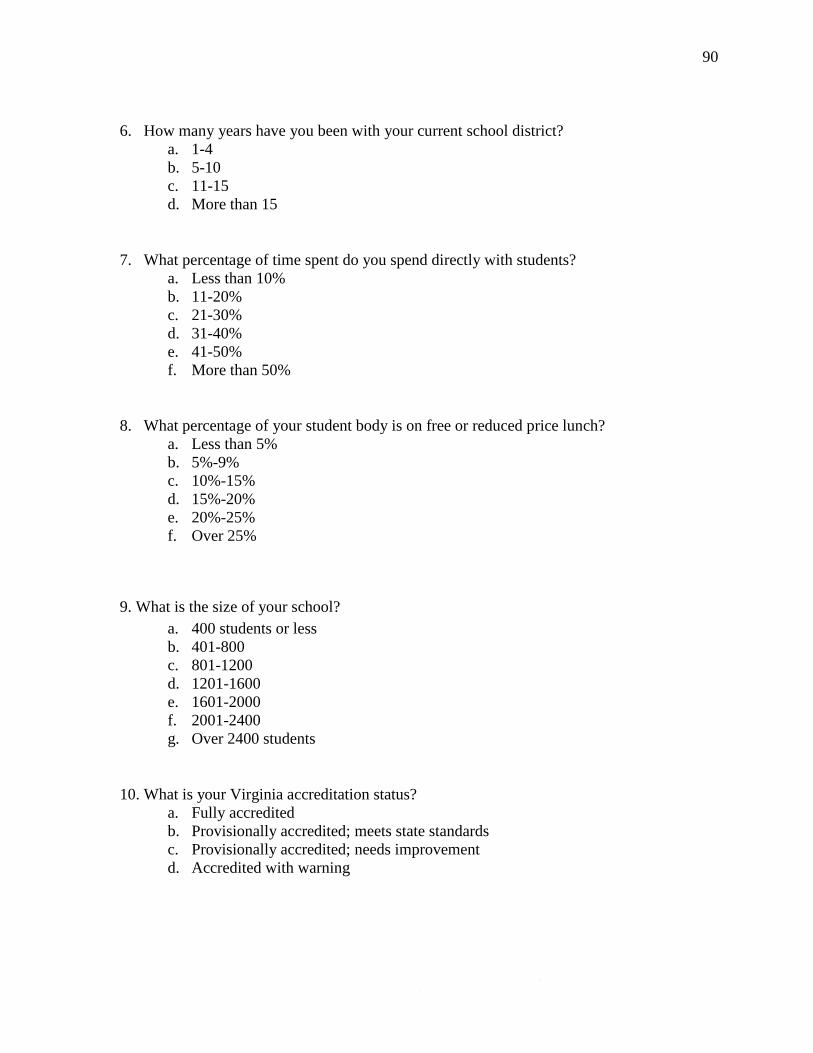
90
6. How many years have you been with your current school district?
a. 1-4
b. 5-10
c. 11-15
d. More than 15
7. What percentage of time spent do you spend directly with students?
a. Less than 10%
b. 11-20%
c. 21-30%
d. 31-40%
e. 41-50%
f. More than 50%
8. What percentage of your student body is on free or reduced price lunch?
a. Less than 5%
b. 5%-9%
c. 10%-15%
d. 15%-20%
e. 20%-25%
f. Over 25%
9. What is the size of your school?
a. 400 students or less
b. 401-800
c. 801-1200
d. 1201-1600
e. 1601-2000
f. 2001-2400
g. Over 2400 students
10. What is your Virginia accreditation status?
a. Fully accredited
b. Provisionally accredited; meets state standards
c. Provisionally accredited; needs improvement
d. Accredited with warning

91
11. Did your school make Adequate Yearly Progress under No Child Left Behind for
the 2007-2008 school year?
a. yes
b. no
12. In the last five years my job satisfaction has
a. increased
b. decreased
c. remained the same
13. Rank the top five items that have influenced your level of job satisfaction in the
last five years:
_____ No Child Left Behind _____ Personal Issues
_____Relationships with Parents _____Other (please list)
_____Student Behavior _____ __________________
_____Adequate Yearly Progress _____ __________________
_____State Accreditation

92
Appendix B
Minnesota Satisfaction Questionnaire
Sample Questions
Ask yourself: How satisfied am I with this aspect of my job?
Very Sat. means I am very satisfied with this aspect of my job.
Sat. means I am satisfied with this aspect of my job.
N means I can‟t decide whether I am satisfied or not with this aspect of my job.
Dissat. means I am dissatisfied with this aspect of my job.
Very Dissat. means I am very dissatisfied with this aspect of my job.
Very
Dissat. Dissat. N Sat.
Very
Sat.
1. The chance to be of service to others.
5. The variety in my work.
10. The way my supervisor and I understand each other.
15. The technical “know-how” of my supervisor.
20. The chance to be active much of the time.
25. The chance to do different things from time to time.
30. The way my supervisor handles his/her employees.
36. The chance to develop close friendships with my co-
workers.
43. Being able to do things that don‟t go against my
conscience.
50. The way my supervisor backs up his/her employees
(with top management).
60. Being able to stay busy.
66. The chance to tell people what to do.
72. My pay and the amount of work I do.

93
78. The way they usually tell me when I do my job well.
85. The chance to do many different things on the job.
91. The way layoffs and transfers are avoided in my job.
94. The chance for advancement.
98. The praise I get for doing a good job.
100. Being able to keep busy all the time.
Sample questions used with permission from the Manual for the Minnesota Satisfaction
Questionnaire (Weiss, Dawis, England, & Lofquist, 1967)

94
Appendix C
First Invitation sent December 4, 2008
To: [Email]
From: [email protected]
Subject: Job Satisfaction of High School Principals
Body: My name is Sandra Brown; I am an assistant principal at
Frank W. Cox High School in Virginia Beach and a doctoral student at Virginia Tech. I am in the process of conducting a study of the job satisfaction of public high school principals in Virginia. Your input is crucial to the success of this study. Below, you will find a link to the survey instrument. Please take approximately 15 minutes to complete this survey as it will yield important information for our human resources departments as well as our division-based mentoring programs. It is my hope that this study will also add to the understanding and appreciation of our craft.
https://www.surveymonkey.com/s.aspx I realize how valuable your time is and appreciate your assistance with this important study. To show my gratitude, I will include the names of all respondents in a drawing for a 3 day-2 night vacation at the beautiful Virginia Beach Resort Hotel on the Chesapeake Bay. Our first 100 respondents will also be included in a drawing for a $50.00 Olive Garden gift certificate.
If you have any questions, please do not hesitate to contact me. As always, many thanks to you for your help with this important endeavor. Respectfully, Sandra R. Brown Frank W. Cox High School

95
Appendix D
Second Invitation sent December 11, 2008
To: [Email]
From: [email protected]
Subject: Job Satisfaction of High School Principals in Virginia
Body: Dear High School Principals,
As you recall, you received an email from me last week with a link to a survey. It is my belief, the results of this survey will provide important information that can continue to inform our profession and capture the challenges which face high school principals in the Commonwealth. All answers are, of course, completely confidential and no individual or school system will be identified. As promised, the first 100 respondents were entered into a drawing for a $50.00 Olive Garden gift card. I am pleased to announce that the winner of the gift card is Dr. Susan Bechtol, principal of Churchland High School in Portsmouth, Virginia. Congratulations! Thanks to all who
have become an integral part of this study. To show my gratitude for your time during this busy season, I would like to offer a second drawing for a $40.00 Applebees gift card to next 100 participants who are able to respond to the survey by Friday, December 19. Below, please find a link to this survey: https://www.surveymonkey.com/s.aspx This link is uniquely tied to this survey and your email address. Please do not forward this message. Also, please remember, all who participate in the survey will be entered into a drawing for a 3 day/2 night stay at the Virginia Beach Resort Hotel on the beautiful
Chesapeake Bay. Many thanks to you for your assistance in this important matter. Happy Holidays! Sandi

96
Appendix E
Third and Final Invitation sent January 6, 2009
To: [Email]
From: [email protected]
Subject: Job Satisfaction of High School Principals
Body: Dear High School Principals,
Happy New Year! As you recall, I am an assistant principal at Frank W. Cox High School in Virginia Beach and a doctoral student at Virginia Tech. You received an email from me before the holidays with a link to a job satisfaction survey. It has been reported to me that completion of this survey takes only 10 minutes. It is my belief that the results of this survey will provide important information regarding our profession. I would be happy to share with you the results of this study upon completion if you desire. All answers are, of course, completely confidential and no individual or school system will be
identified. As promised, a drawing for a $40.00 Applebees gift card was awarded to Mr. Ricky Skeens, principal at George Wythe High School in Wytheville, VA. Congratulations! I am ever so close to receiving the required number of responses allowing me to continue my research. Please consider responding to this brief survey. The next 40 respondents will become eligible for a $35.00 Barnes and Noble gift card. Also, as you will recall, all who participate in the survey will be entered into a drawing for a 3 day/2 night stay at the Virginia Beach Resort Hotel on the beautiful Chesapeake Bay.
Below, please find a link to this survey: https://www.surveymonkey.com/s.aspx This link is uniquely tied to this survey and your email address. Please do not forward this message. Again, many thanks to you for your assistance in this study. Sandi Brown https://www.surveymonkey.com/optout.aspx

97
Appendix F
Institutional Review Board Approval

98
Appendix G
Request for Permission to use the MSQ

99
Appendix H
Permission to Use the MSQ

100
Appendix I
Training in Human Subjects Protection Certificate