Job Market Report 2014
30
1 INOMICS® Job Market Report 2014 Worldwide Overview
Transcript of Job Market Report 2014

1 INOMICS®
Job Market Report 2014Worldwide Overview
! "!
Table of Contents
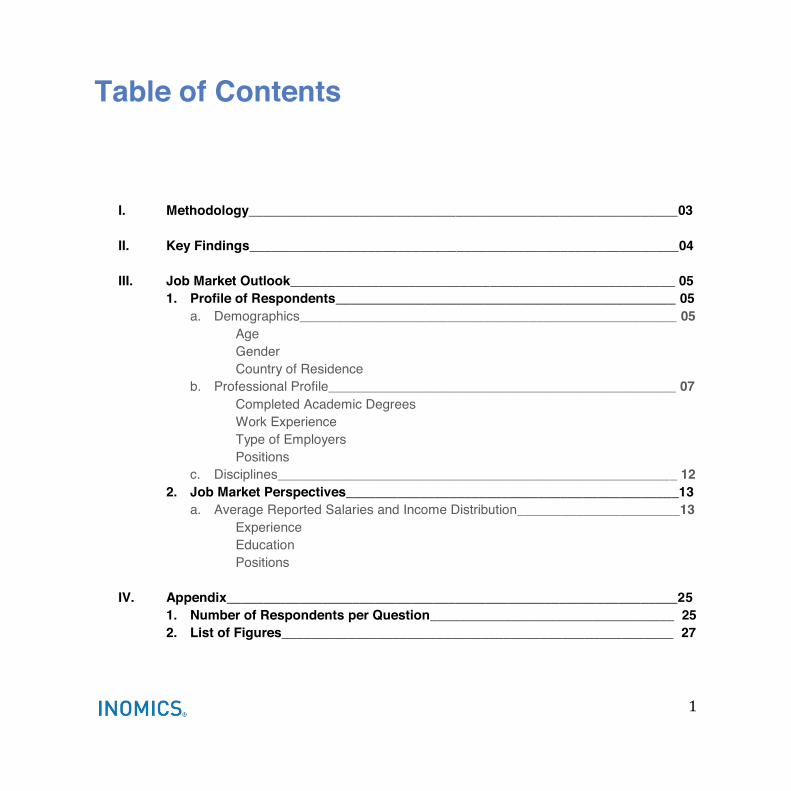
I. Methodology__________________________________________________________03
II. Key Findings__________________________________________________________04
III. Job Market Outlook____________________________________________________ 05
1. Profile of Respondents______________________________________________ 05 a. Demographics___________________________________________________ 05
Age Gender Country of Residence
b. Professional Profile_______________________________________________ 07 Completed Academic Degrees Work Experience Type of Employers Positions
c. Disciplines______________________________________________________ 12 2. Job Market Perspectives_____________________________________________13
a. Average Reported Salaries and Income Distribution______________________13 Experience Education Positions
IV. Appendix_____________________________________________________________25
1. Number of Respondents per Question_________________________________ 25 2. List of Figures_____________________________________________________ 27
!"!
What is INOMICS? A foreword INOMICS has been offering students and professionals a comprehensive online resource for their academic and career choices since 1998. In the 15 years that we have been online, we have succeeded in accumulating a unique audience of niche professionals in economics, business and finance, as well as other disciplines such as marketing, accounting, law, international relations and politics. We represent a unique network of academic, research and private sector institutions interested in recruiting professionals and students in this field. Through feedback from our users and clients, we know how important it is to have enough information about the job market to make the right career decisions and build recruiting strategies. To gather even deeper insights into the market and to make this information available for INOMICS users, we publish our Job Market Survey every year. Based on the information collected this year we have compiled the Job Market Report 2014. We hope that the information presented in this study will support applicants in making informed career and professional decisions, regardless of their country of residence, educational level or work experience and will provide recruiters with necessary insights into the current state of the job market. If you have any suggestions or comments about this study, please feel free to get in touch with the INOMICS Team and we will be happy to assist you with any queries. Kind regards, Andreas Hoffmann, CEO, INOMICS GmbH
!#!
I. Methodology The INOMICS Job Market Survey 2014 was conducted through an online questionnaire between April and June 2014. It was placed on the INOMICS website, a global online platform for academics and professionals with more than 150,000 visits a month from 120 countries worldwide. In addition, the questionnaire was circulated through social media channels and was emailed to academic professionals in selected academic institutions. The data collected was used to compile the Worldwide Job Market Report 2014. In total, 1,064 respondents from 100 countries took part in this survey. The questions were designed to gain a perspective on the job market from the point of view of market candidates and potential applicants. Respondents were asked a set of questions
concerning their professional status, experience and salaries. We recognize that there are significant differences between salary levels and job markets in specific regional contexts. For this reason, this year we have added a geographical comparison section for different positions. Respondents who indicated that they were still
degree were not included in the study (you can learn about INOMICS Student Survey 2014 here), meaning that all of the responses used in the analysis were from working professionals.
To download Job Market Reports 2013 please visit this page.
!$!
II. Key FindingsValue of Academic Degrees Over 60 percent of respondents with PhDs reported earnings at least $35,000 per year and more than 25 percent of PhD holders had reported annual salaries of more than $75,000. When comparing reported annual salaries between respondents whose highest degree
category were far more likely to have a reported annual salary of at least $55,000, with over 20 percent of MBA holders in this income group and only about 10 percent of those with
s degrees. Interestingly, there were no significant differences between respondents with an MBA, Mastecame to those who reported earning less than $15,000 per year, with about 40 percent of each in that salary group. Amongst PhD holders, however, only about 15 percent of respondents were in this salary group. Reported Salaries by Country When examining the reported salaries of respondents with between 3 and 10 years of work experience and a PhD, those living in Australia came out at the top of the list, with an average annual income of $98,000. Survey participants in the U.S. and Canada were not too far behind, with average annual salaries of
$87,000 and $82,000, respectively. The gap to the next highest average salary for respondents at this level of education and experience was quite large, dropping to a reported $56,000 in the UK and $45,000 in the Netherlands and Belgium. Reported Salaries by Position Looking into the averages of reported annual salaries of respondents according to specific positions revealed a bit more nuance in terms of which countries and professions were at the top of the list. Interestingly, respondents in Canada earned the most in the positions of assistant professor, associate professor and mid-level manager ($89,000, $110,000 and $55,000, respectively). Reported salaries amongst consultants were lower than in the past, with the highest average of $59,000 in the U.S. Lecturers, on the other hand, had higher reported incomes than anticipated, with an average of $76,000 in the U.S. and $69,000 in Australia. When reading this report, it is important to remember that all information presented is based on self-reported data from professionals around the world. Moreover, the reported salaries do not take into account such factors as cost of living or possible conversion errors amongst respondent.
!%!
Male 62%
Female 38%
Figure 2. Gender of Respondents
18-24 2%
25-34 48%
35-44 30%
45-60 16%
Over 60 4%
Figure 1. Age of Respondents
III. Job Market Outlook
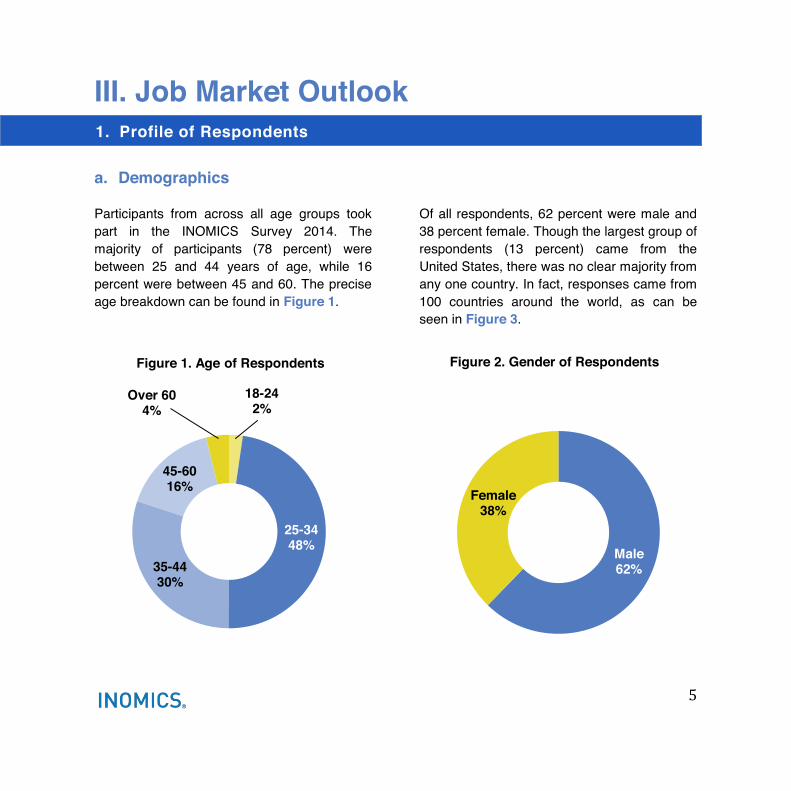
a. Demographics Participants from across all age groups took part in the INOMICS Survey 2014. The majority of participants (78 percent) were between 25 and 44 years of age, while 16 percent were between 45 and 60. The precise age breakdown can be found in Figure 1.
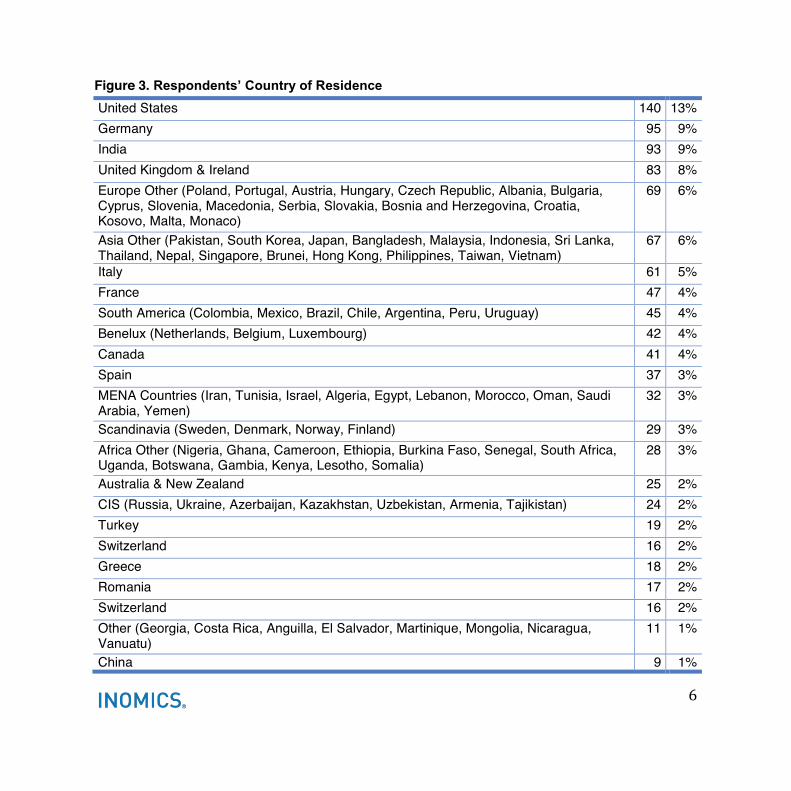
Of all respondents, 62 percent were male and 38 percent female. Though the largest group of respondents (13 percent) came from the United States, there was no clear majority from any one country. In fact, responses came from 100 countries around the world, as can be seen in Figure 3.
1. Profile of Respondents
6
Figure 3. United States 140 13% Germany 95 9% India 93 9% United Kingdom & Ireland 83 8% Europe Other (Poland, Portugal, Austria, Hungary, Czech Republic, Albania, Bulgaria, Cyprus, Slovenia, Macedonia, Serbia, Slovakia, Bosnia and Herzegovina, Croatia, Kosovo, Malta, Monaco)
69 6%
Asia Other (Pakistan, South Korea, Japan, Bangladesh, Malaysia, Indonesia, Sri Lanka, Thailand, Nepal, Singapore, Brunei, Hong Kong, Philippines, Taiwan, Vietnam)
67 6%
Italy 61 5% France 47 4% South America (Colombia, Mexico, Brazil, Chile, Argentina, Peru, Uruguay) 45 4% Benelux (Netherlands, Belgium, Luxembourg) 42 4% Canada 41 4% Spain 37 3% MENA Countries (Iran, Tunisia, Israel, Algeria, Egypt, Lebanon, Morocco, Oman, Saudi Arabia, Yemen)
32 3%
Scandinavia (Sweden, Denmark, Norway, Finland) 29 3% Africa Other (Nigeria, Ghana, Cameroon, Ethiopia, Burkina Faso, Senegal, South Africa, Uganda, Botswana, Gambia, Kenya, Lesotho, Somalia)
28 3%
Australia & New Zealand 25 2% CIS (Russia, Ukraine, Azerbaijan, Kazakhstan, Uzbekistan, Armenia, Tajikistan) 24 2% Turkey 19 2% Switzerland 16 2% Greece 18 2% Romania 17 2% Switzerland 16 2% Other (Georgia, Costa Rica, Anguilla, El Salvador, Martinique, Mongolia, Nicaragua, Vanuatu)
11 1%
China 9 1%
!'!
13%
18%
18%
21%
30%
Less than 1 year
1-3 years
3-5 years
5-10 years
More than 10 years
Figure 5. Work Experience of Respondents
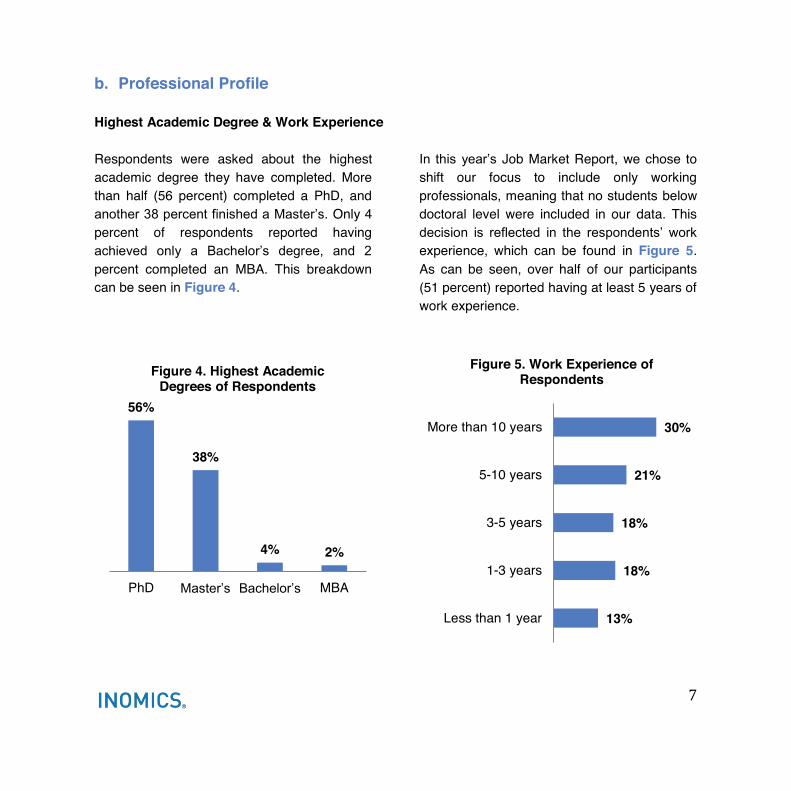
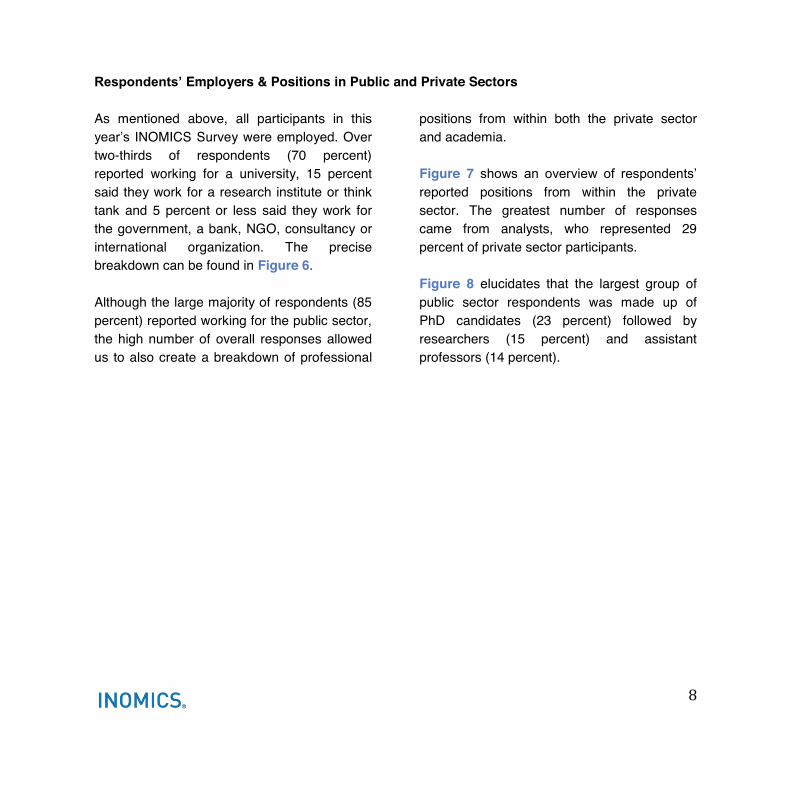
b. Professional Profile Highest Academic Degree & Work Experience Respondents were asked about the highest academic degree they have completed. More than half (56 percent) completed a PhD, and
Only 4 percent of respondents reported having
percent completed an MBA. This breakdown can be seen in Figure 4.
Job Market Report, we chose to shift our focus to include only working professionals, meaning that no students below doctoral level were included in our data. This
experience, which can be found in Figure 5. As can be seen, over half of our participants (51 percent) reported having at least 5 years of work experience.
56%
38%
4% 2%
PhD MBA
Figure 4. Highest Academic Degrees of Respondents
!(!
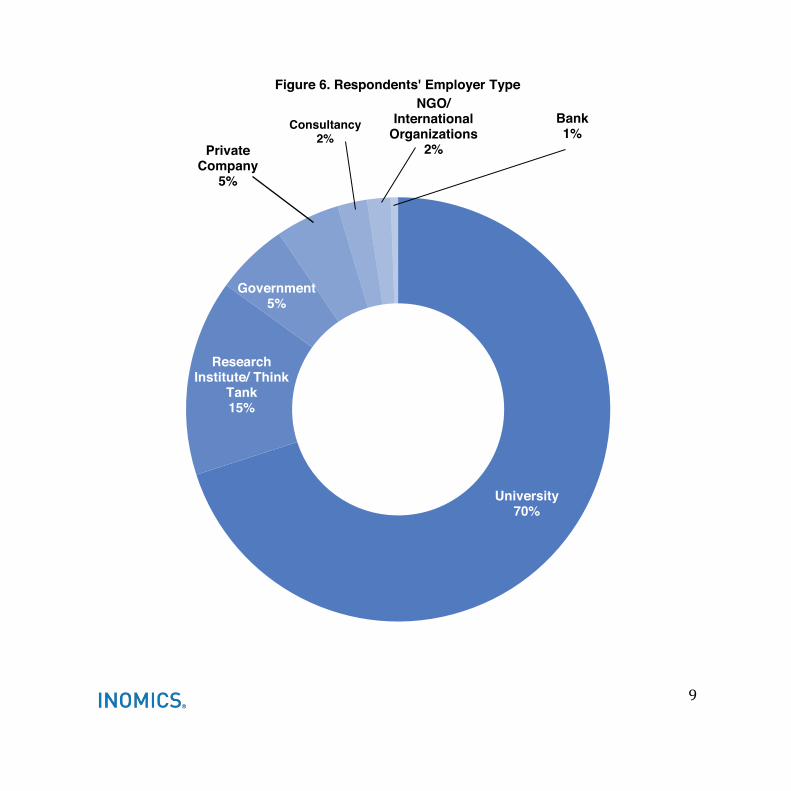
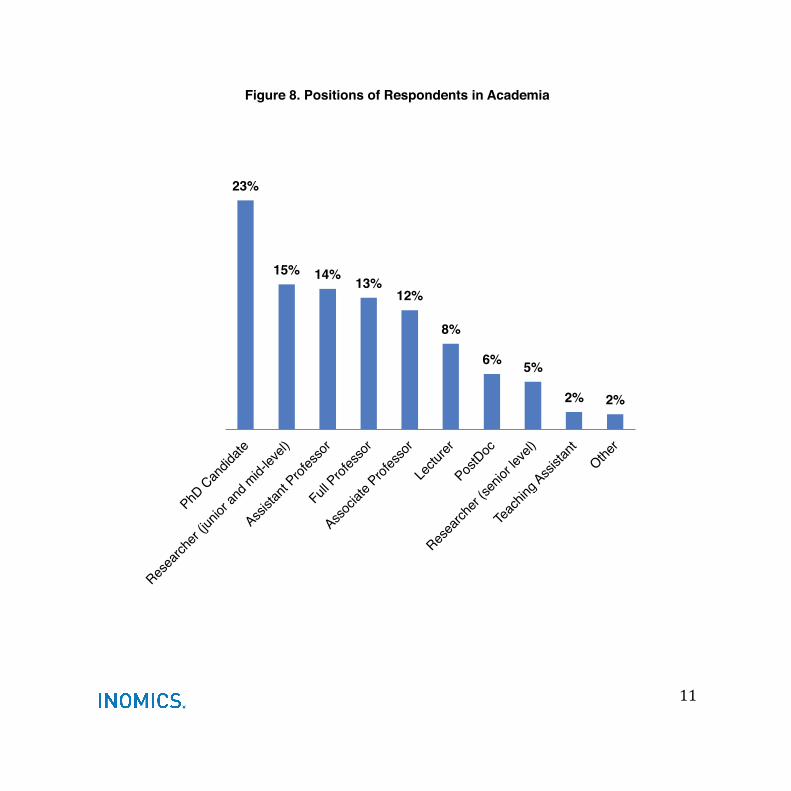
Employers & Positions in Public and Private Sectors As mentioned above, all participants in this
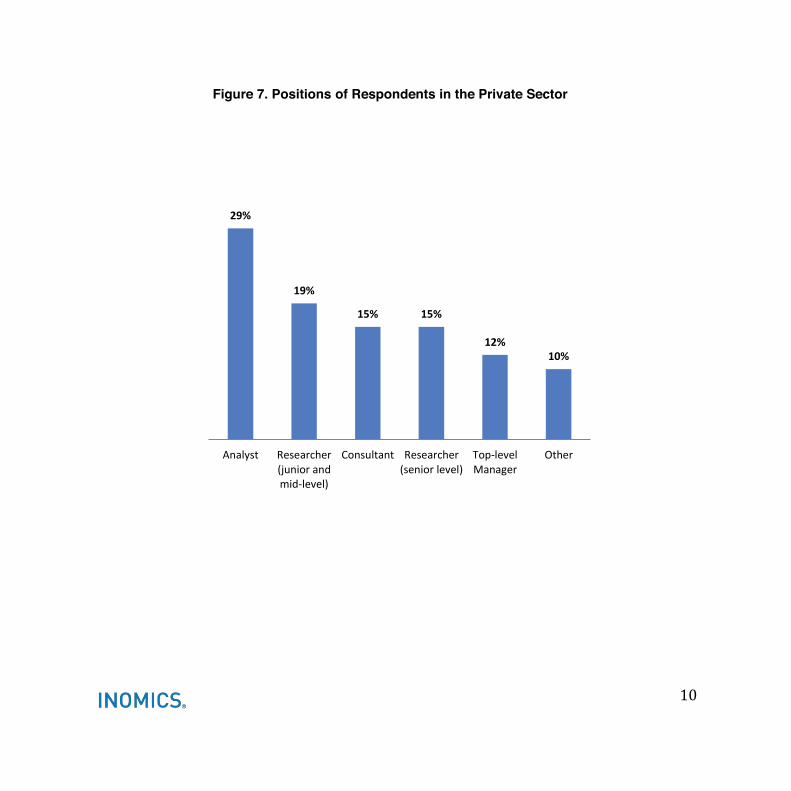
INOMICS Survey were employed. Over two-thirds of respondents (70 percent) reported working for a university, 15 percent said they work for a research institute or think tank and 5 percent or less said they work for the government, a bank, NGO, consultancy or international organization. The precise breakdown can be found in Figure 6. Although the large majority of respondents (85 percent) reported working for the public sector, the high number of overall responses allowed us to also create a breakdown of professional
positions from within both the private sector and academia. Figure 7 reported positions from within the private sector. The greatest number of responses came from analysts, who represented 29 percent of private sector participants. Figure 8 elucidates that the largest group of public sector respondents was made up of PhD candidates (23 percent) followed by researchers (15 percent) and assistant professors (14 percent).
!)!
University 70%
Research Institute/ Think
Tank 15%
Government 5%
Private Company
5%
Consultancy 2%
NGO/ International
Organizations 2%
Bank 1%
Figure 6. Respondents' Employer Type
!"*!
!"#$
%"#$
%&#$ %&#$
%!#$%'#$
!"#$%&' ()&)#*+,)*-./"01*2#"34035$)6)$7
81"&/$'#"' ()&)#*+,)*-&)"01*2$)6)$7
91:5$)6)$;#"#<)*
=',)*
Figure 7. Positions of Respondents in the Private Sector
!
!""!
23%!
15%! 14%! 13%!12%!
8%!
6%! 5%!
2%! 2%!
Figure 8. Positions of Respondents in Academia !
!
!"#!
1%!1%!2%!3%!4%!4%!4%!
9%!9%!
13%!24%!26%!
Physics!Psychology!Engineering!
Health!Computing!
Law!Education!Politics/IR!
Other!Math/Statistics/Econometrics!
Business/Management!Finance!
Figure 10. Disciplines of Non-economist Respondents!
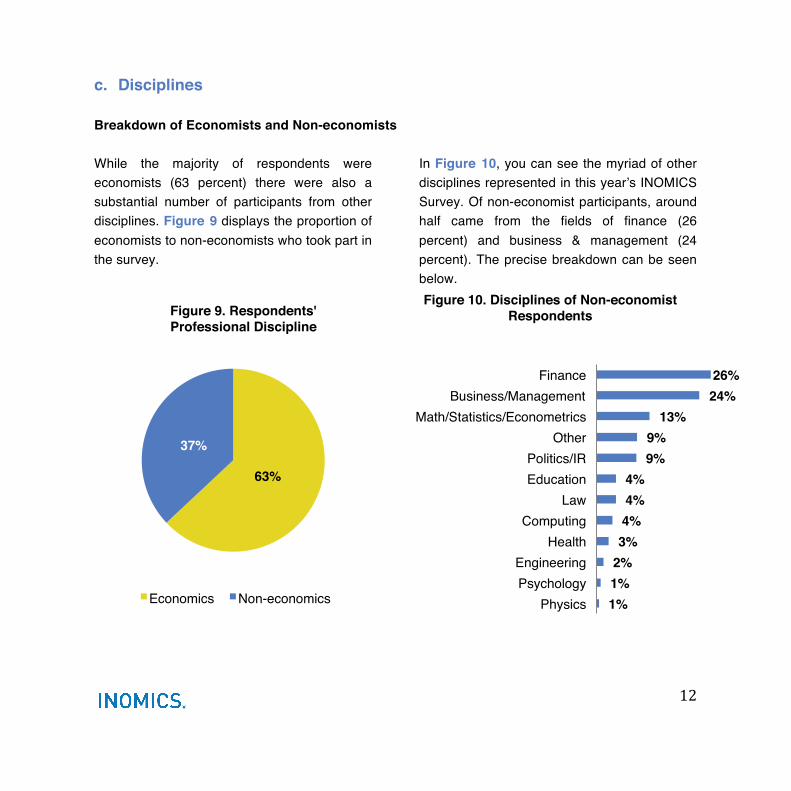
c. Disciplines
Breakdown of Economists and Non-economists While the majority of respondents were economists (63 percent) there were also a substantial number of participants from other disciplines. Figure 9 displays the proportion of economists to non-economists who took part in the survey.
In Figure 10, you can see the myriad of other disciplines represented in this yearʼs INOMICS Survey. Of non-economist participants, around half came from the fields of finance (26 percent) and business & management (24 percent). The precise breakdown can be seen below.
63%!
37%!
Figure 9. Respondents' Professional Discipline!
Economics! Non-economics!
!"#!
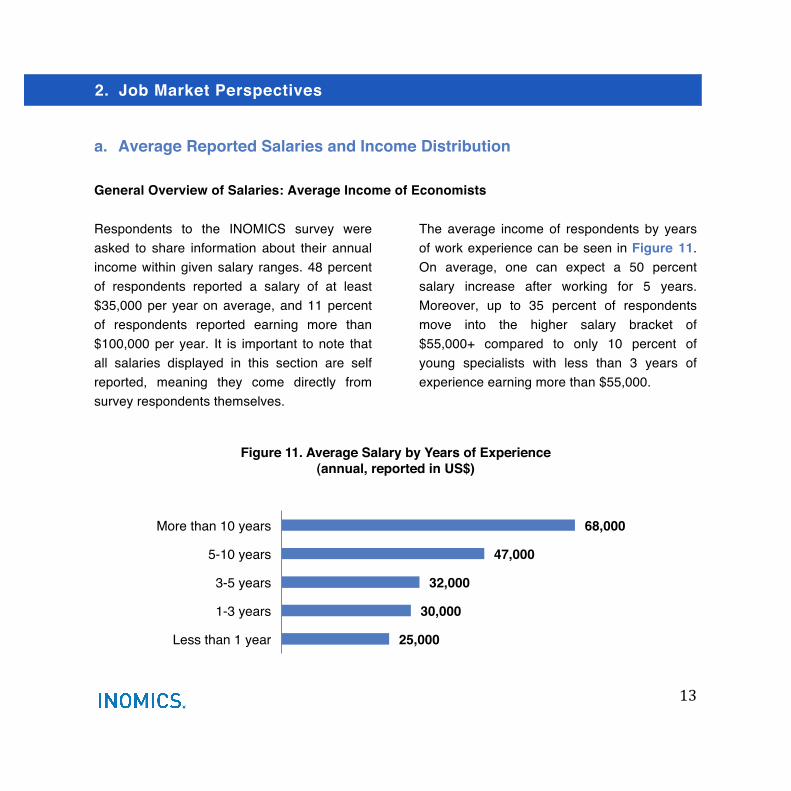
a. Average Reported Salaries and Income Distribution
General Overview of Salaries: Average Income of Economists
Respondents to the INOMICS survey were asked to share information about their annual income within given salary ranges. 48 percent of respondents reported a salary of at least $35,000 per year on average, and 11 percent of respondents reported earning more than $100,000 per year. It is important to note that all salaries displayed in this section are self reported, meaning they come directly from survey respondents themselves.
The average income of respondents by years of work experience can be seen in Figure 11. On average, one can expect a 50 percent salary increase after working for 5 years. Moreover, up to 35 percent of respondents move into the higher salary bracket of $55,000+ compared to only 10 percent of young specialists with less than 3 years of experience earning more than $55,000.
25,000!
30,000!
32,000!
47,000!
68,000!
Less than 1 year!
1-3 years!
3-5 years!
5-10 years!
More than 10 years!
Figure 11. Average Salary by Years of Experience !(annual, reported in US$) !
!
2. Job Market Perspectives
!"$!
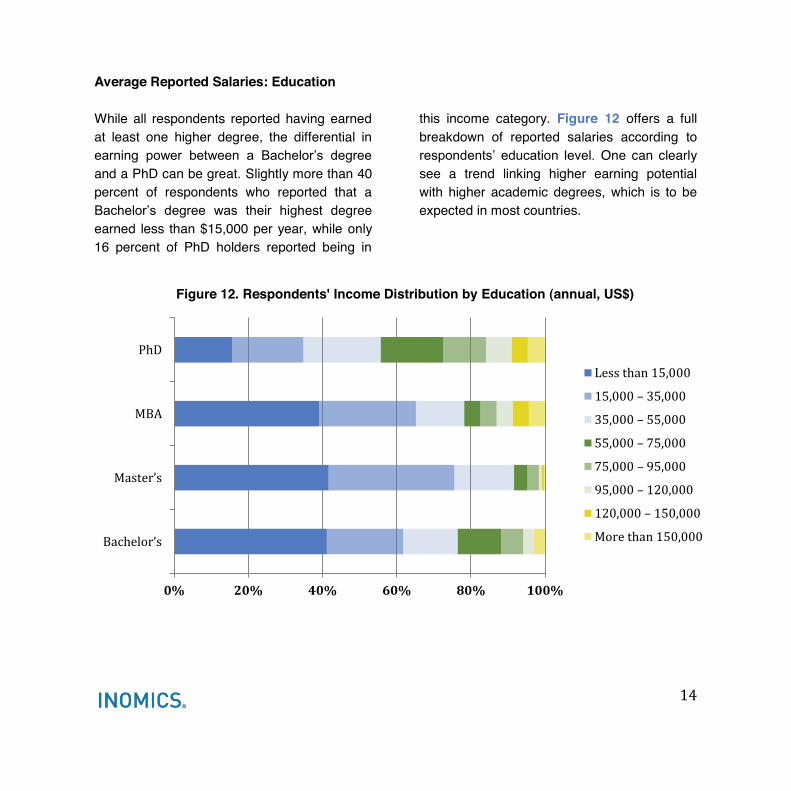
Average Reported Salaries: Education While all respondents reported having earned at least one higher degree, the differential in
and a PhD can be great. Slightly more than 40 percent of respondents who reported that a
est degree earned less than $15,000 per year, while only 16 percent of PhD holders reported being in
this income category. Figure 12 offers a full breakdown of reported salaries according to
One can clearly see a trend linking higher earning potential with higher academic degrees, which is to be expected in most countries.
!" #!" $!" %!" &!" '!!"
!
!
+,-
./0
Figure 12. Respondents' Income Distribution by Education (annual, US$)
1233!4/56!"%7***"%7***! !#%7***!#%7***! !%%7***!%%7***! !'%7***!'%7***! !)%7***!)%7***! !"8*7***!"8*7***! !"%*7***!+9:2!4/56!"%*7***
!"%!
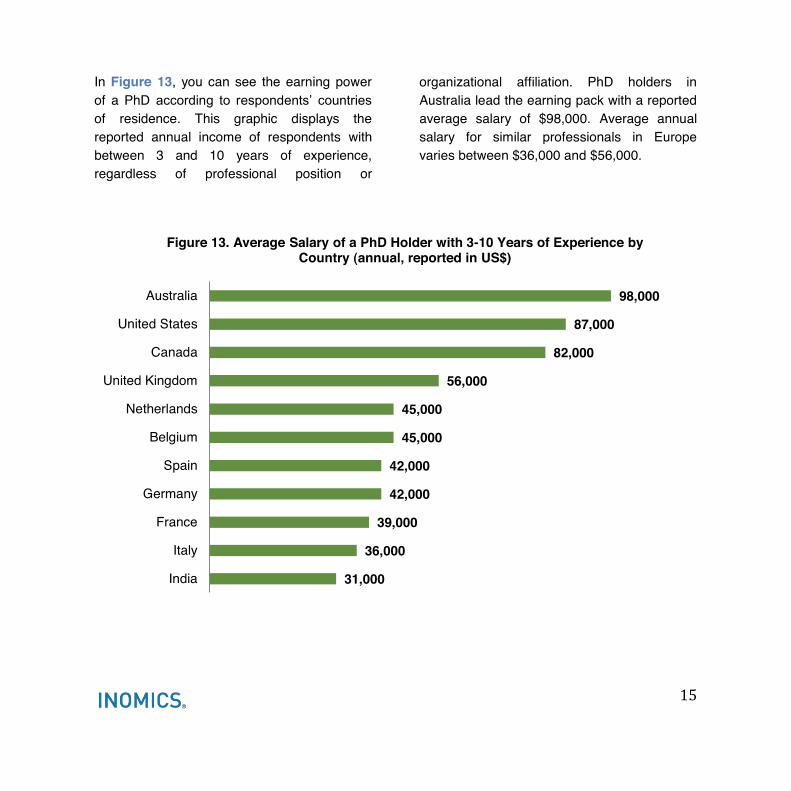
In Figure 13, you can see the earning power of a PhD of residence. This graphic displays the reported annual income of respondents with between 3 and 10 years of experience, regardless of professional position or
organizational affiliation. PhD holders in Australia lead the earning pack with a reported average salary of $98,000. Average annual salary for similar professionals in Europe varies between $36,000 and $56,000.
31,000
36,000
39,000
42,000
42,000
45,000
45,000
56,000
82,000
87,000
98,000
India
Italy
France
Germany
Spain
Belgium
Netherlands
United Kingdom
Canada
United States
Australia
Figure 13. Average Salary of a PhD Holder with 3-10 Years of Experience by Country (annual, reported in US$)
!"&!
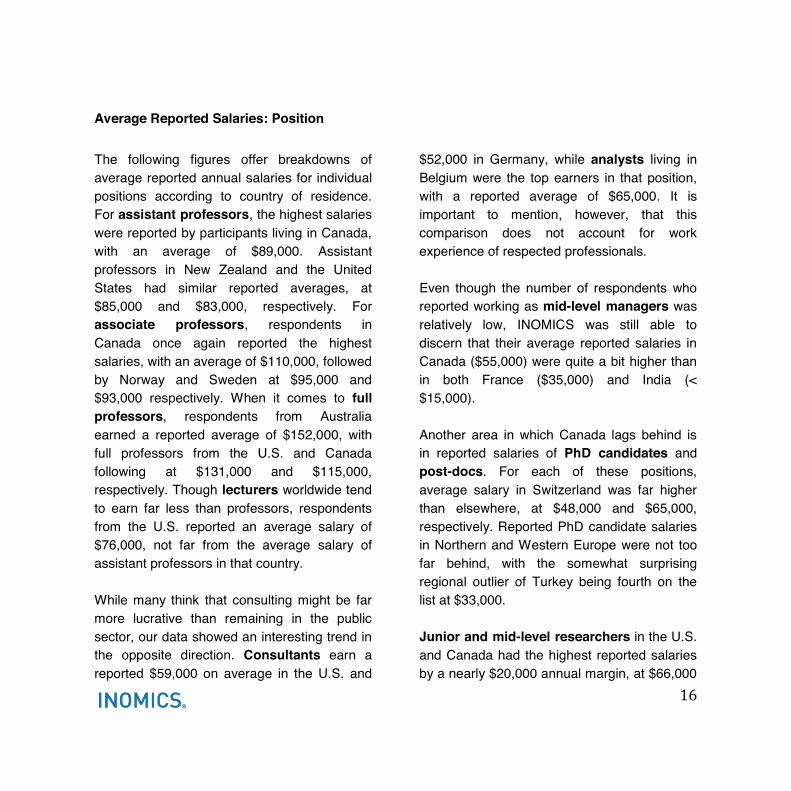
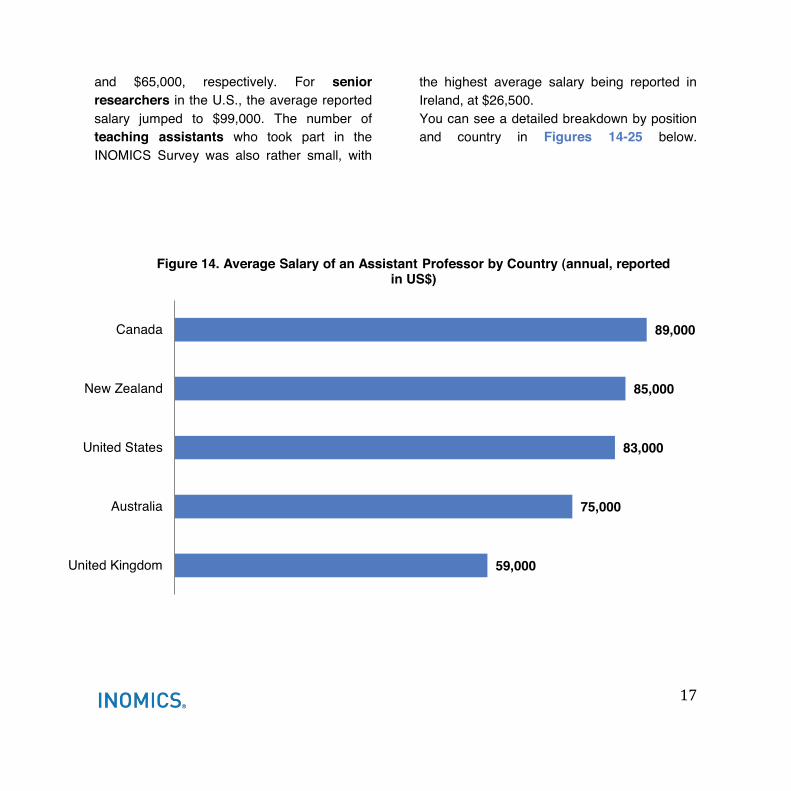
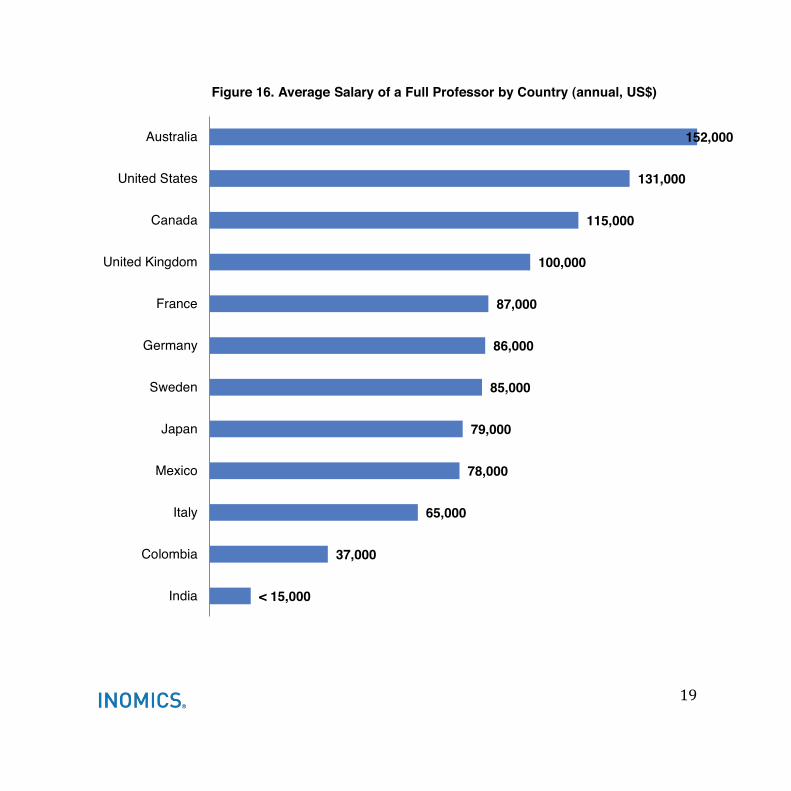
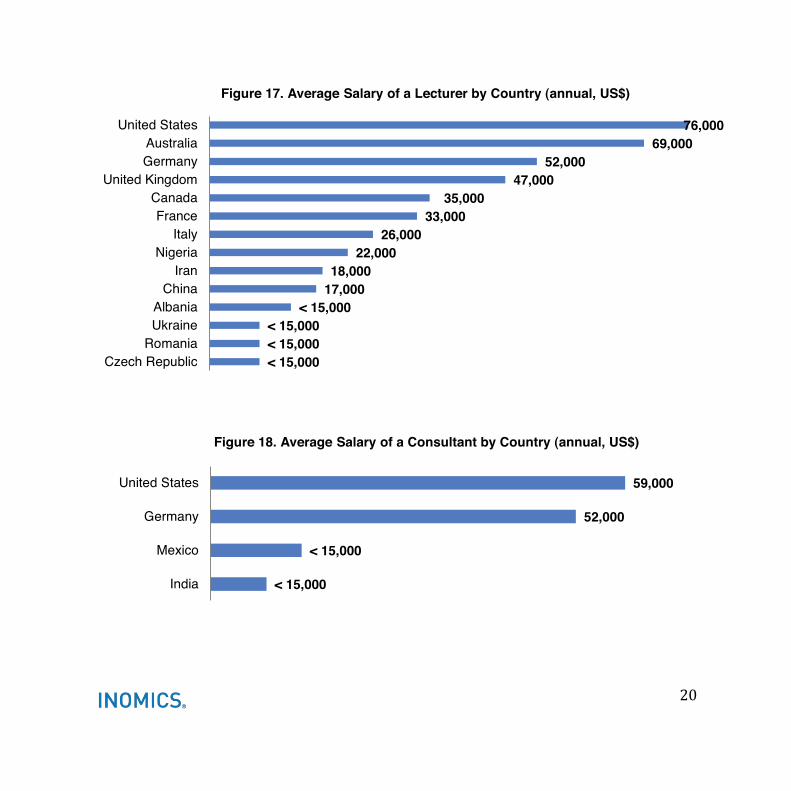
Average Reported Salaries: Position !The following figures offer breakdowns of average reported annual salaries for individual positions according to country of residence. For assistant professors, the highest salaries were reported by participants living in Canada, with an average of $89,000. Assistant professors in New Zealand and the United States had similar reported averages, at $85,000 and $83,000, respectively. For associate professors, respondents in Canada once again reported the highest salaries, with an average of $110,000, followed by Norway and Sweden at $95,000 and $93,000 respectively. When it comes to full professors, respondents from Australia earned a reported average of $152,000, with full professors from the U.S. and Canada following at $131,000 and $115,000, respectively. Though lecturers worldwide tend to earn far less than professors, respondents from the U.S. reported an average salary of $76,000, not far from the average salary of assistant professors in that country. While many think that consulting might be far more lucrative than remaining in the public sector, our data showed an interesting trend in the opposite direction. Consultants earn a reported $59,000 on average in the U.S. and
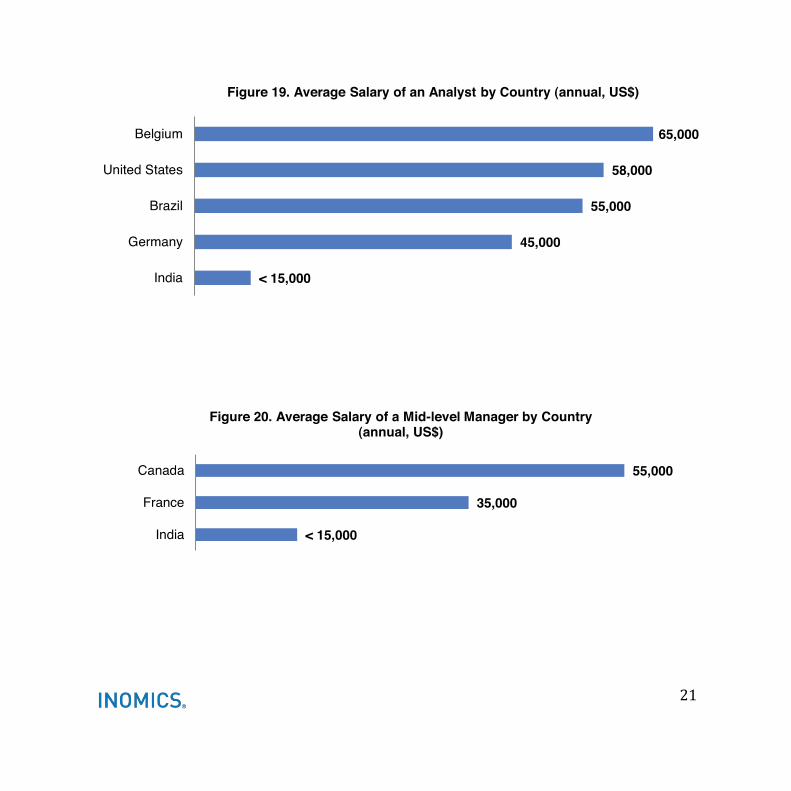
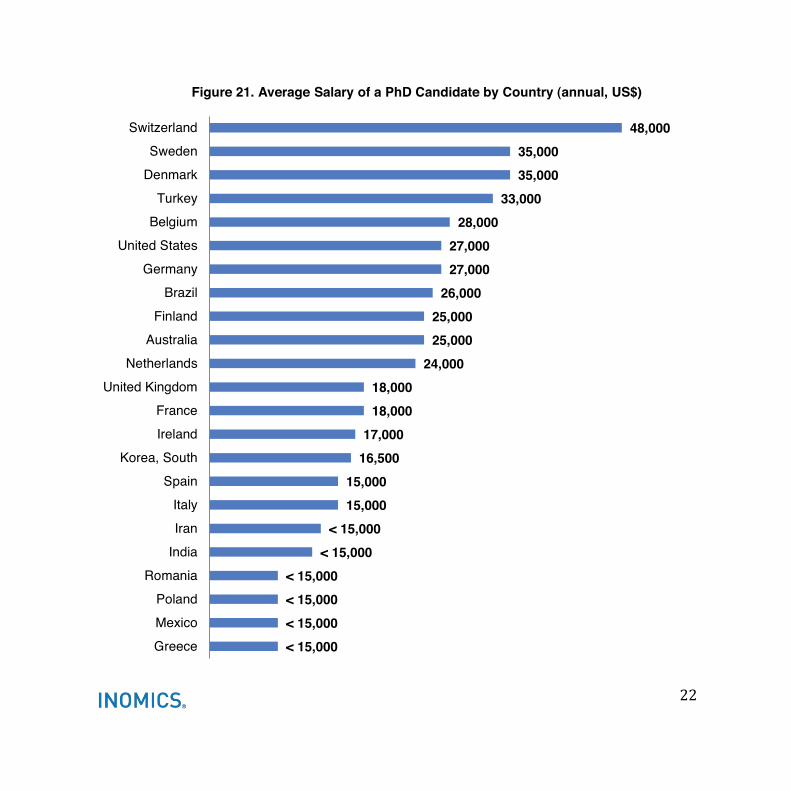
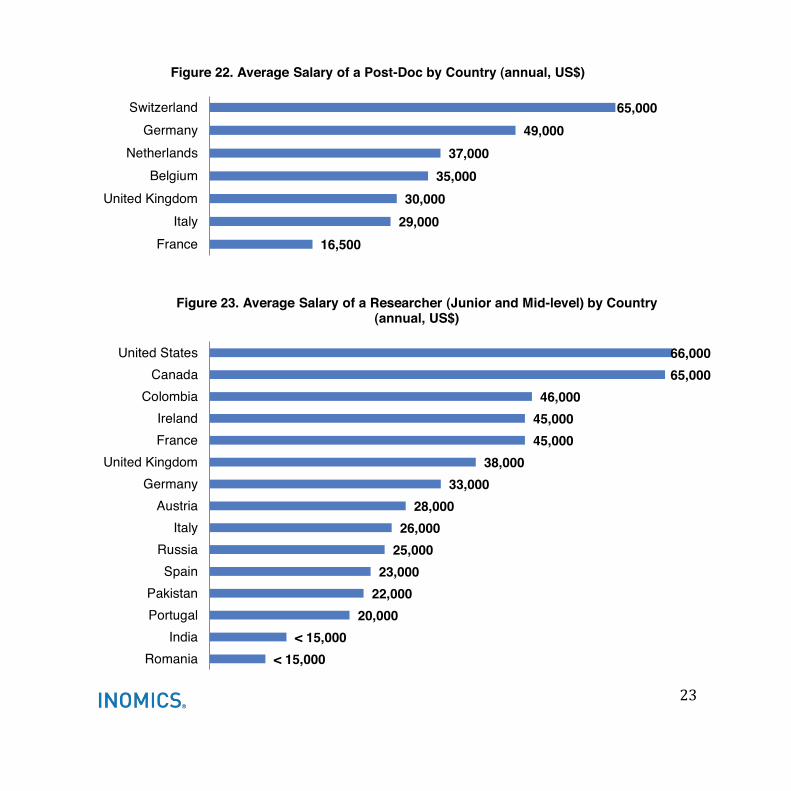
$52,000 in Germany, while analysts living in Belgium were the top earners in that position, with a reported average of $65,000. It is important to mention, however, that this comparison does not account for work experience of respected professionals. Even though the number of respondents who reported working as mid-level managers was relatively low, INOMICS was still able to discern that their average reported salaries in Canada ($55,000) were quite a bit higher than in both France ($35,000) and India (< $15,000). Another area in which Canada lags behind is in reported salaries of PhD candidates and post-docs. For each of these positions, average salary in Switzerland was far higher than elsewhere, at $48,000 and $65,000, respectively. Reported PhD candidate salaries in Northern and Western Europe were not too far behind, with the somewhat surprising regional outlier of Turkey being fourth on the list at $33,000. Junior and mid-level researchers in the U.S. and Canada had the highest reported salaries by a nearly $20,000 annual margin, at $66,000
!"'!
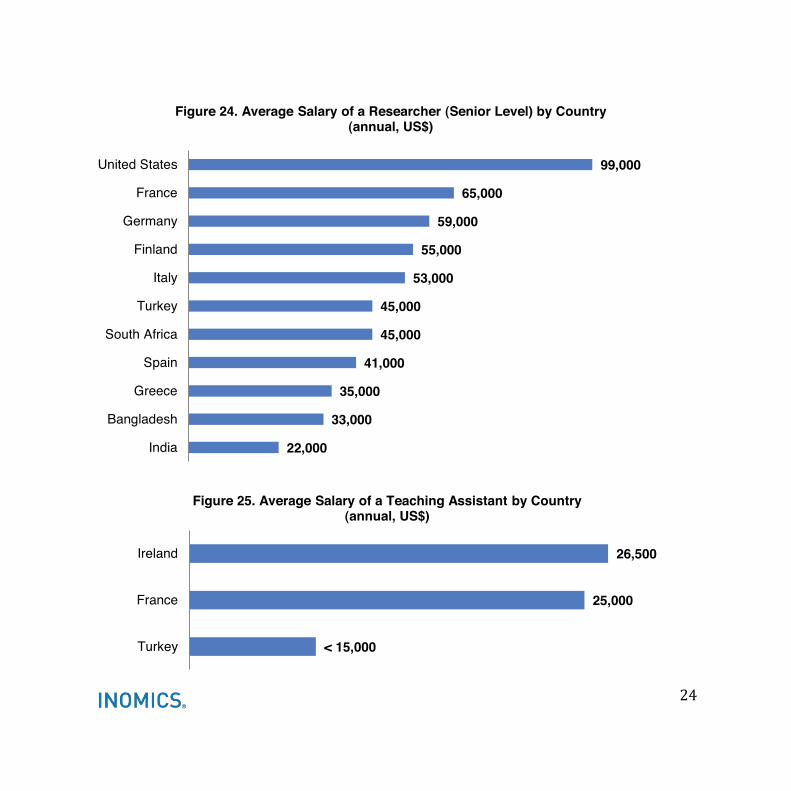
and $65,000, respectively. For senior researchers in the U.S., the average reported salary jumped to $99,000. The number of teaching assistants who took part in the INOMICS Survey was also rather small, with
the highest average salary being reported in Ireland, at $26,500. You can see a detailed breakdown by position and country in Figures 14-25 below.
59,000
75,000
83,000
85,000
89,000
United Kingdom
Australia
United States
New Zealand
Canada
Figure 14. Average Salary of an Assistant Professor by Country (annual, reported in US$)
!"(!
< 15,000
45,000
45,000
47,000
55,000
65,000
72,000
78,000
90,000
93,000
95,000
110,000
Romania
France
Spain
Hungary
Italy
Korea, South
Brazil
United Kingdom
United States
Sweden
Norway
Canada
Figure 15. Average Salary of an Associate Professor by Country (annual, reported in US$)
!")!
< 15,000
37,000
65,000
78,000
79,000
85,000
86,000
87,000
100,000
115,000
131,000
152,000
India
Colombia
Italy
Mexico
Japan
Sweden
Germany
France
United Kingdom
Canada
United States
Australia
Figure 16. Average Salary of a Full Professor by Country (annual, US$)
!8*!
< 15,000 < 15,000 < 15,000
< 15,000 17,000 18,000
22,000 26,000
33,000 35,000
47,000 52,000
69,000 76,000
Czech RepublicRomania
UkraineAlbania
ChinaIran
NigeriaItaly
FranceCanada
United KingdomGermanyAustralia
United States
Figure 17. Average Salary of a Lecturer by Country (annual, US$)
< 15,000
< 15,000
52,000
59,000
India
Mexico
Germany
United States
Figure 18. Average Salary of a Consultant by Country (annual, US$)
!8"!
< 15,000
45,000
55,000
58,000
65,000
India
Germany
Brazil
United States
Belgium
Figure 19. Average Salary of an Analyst by Country (annual, US$)
< 15,000
35,000
55,000
India
France
Canada
Figure 20. Average Salary of a Mid-level Manager by Country (annual, US$)
!88!
< 15,000 < 15,000 < 15,000 < 15,000
< 15,000 < 15,000
15,000 15,000
16,500 17,000
18,000 18,000
24,000 25,000 25,000
26,000 27,000 27,000
28,000 33,000
35,000 35,000
48,000
GreeceMexicoPoland
RomaniaIndiaIranItaly
SpainKorea, South
IrelandFrance
United KingdomNetherlands
AustraliaFinland
BrazilGermany
United StatesBelgium
TurkeyDenmarkSweden
Switzerland
Figure 21. Average Salary of a PhD Candidate by Country (annual, US$)
!8#!
16,500 29,000 30,000
35,000 37,000
49,000 65,000
FranceItaly
United KingdomBelgium
NetherlandsGermany
Switzerland
Figure 22. Average Salary of a Post-Doc by Country (annual, US$)
< 15,000 < 15,000
20,000 22,000 23,000
25,000 26,000
28,000 33,000
38,000 45,000 45,000 46,000
65,000 66,000
RomaniaIndia
PortugalPakistan
SpainRussia
ItalyAustria
GermanyUnited Kingdom
FranceIreland
ColombiaCanada
United States
Figure 23. Average Salary of a Researcher (Junior and Mid-level) by Country (annual, US$)
!8$!
< 15,000
25,000
26,500
Turkey
France
Ireland
Figure 25. Average Salary of a Teaching Assistant by Country (annual, US$)
22,000
33,000
35,000
41,000
45,000
45,000
53,000
55,000
59,000
65,000
99,000
India
Bangladesh
Greece
Spain
South Africa
Turkey
Italy
Finland
Germany
France
United States
Figure 24. Average Salary of a Researcher (Senior Level) by Country (annual, US$)
!8%!
IV. Appendix
! !
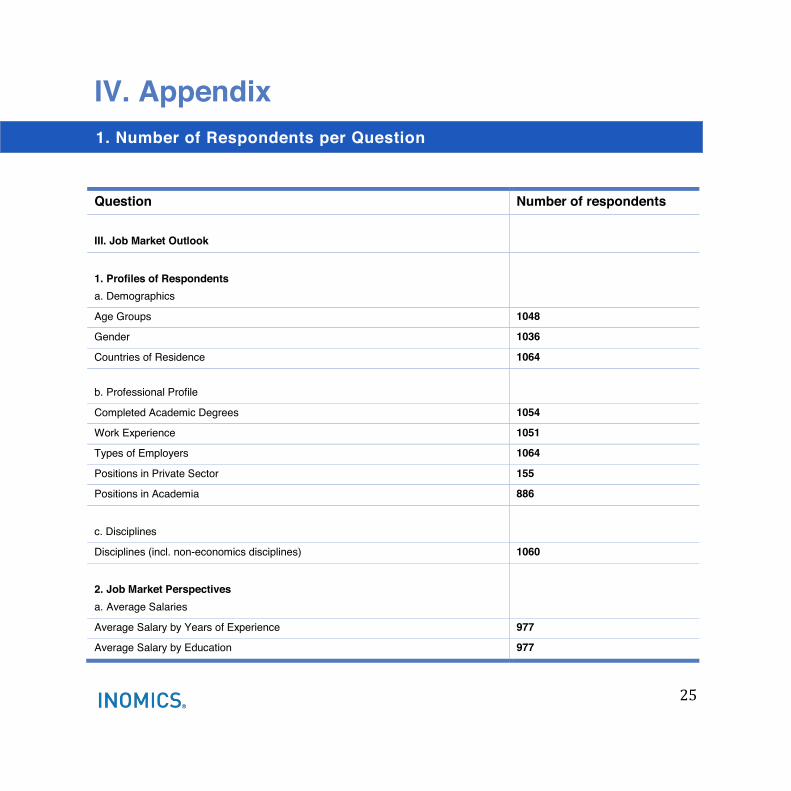
Question Number of respondents III. Job Market Outlook
1. Profiles of Respondents a. Demographics
Age Groups 1048
Gender 1036
Countries of Residence 1064
b. Professional Profile
Completed Academic Degrees 1054
Work Experience 1051
Types of Employers 1064
Positions in Private Sector 155
Positions in Academia 886
c. Disciplines
Disciplines (incl. non-economics disciplines) 1060
2. Job Market Perspectives a. Average Salaries
Average Salary by Years of Experience 977
Average Salary by Education 977
1. Number of Respondents per Question
!8&!
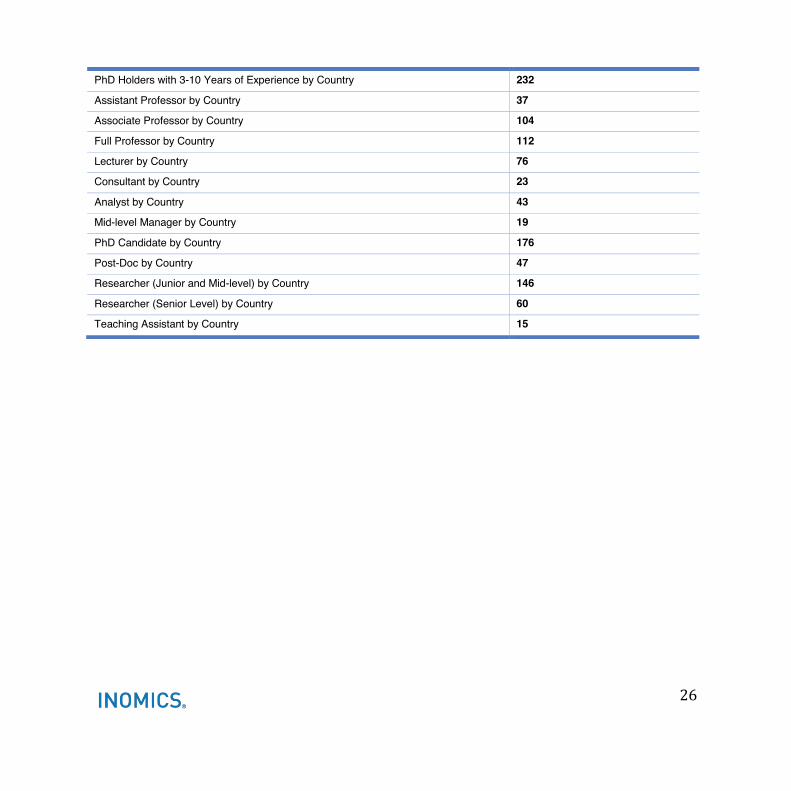
PhD Holders with 3-10 Years of Experience by Country 232
Assistant Professor by Country 37
Associate Professor by Country 104
Full Professor by Country 112
Lecturer by Country 76
Consultant by Country 23
Analyst by Country 43
Mid-level Manager by Country 19
PhD Candidate by Country 176
Post-Doc by Country 47
Researcher (Junior and Mid-level) by Country 146
Researcher (Senior Level) by Country 60
Teaching Assistant by Country 15
!8'!
Figure 1. Age of Respondents
Figure 2. Gender of Respondents
Figure 3.
Figure 4. Highest Academic Degrees of Respondents
Figure 5. Work Experience of Respondents
Figure 6.
Figure 7. Positions of Respondents in the Private Sector
Figure 8. Positions of Respondents in Academia
Figure 9.
Figure 10. Disciplines of Non-economist Respondents
Figure 11. Average Salary by Years of Experience
Figure 12.
Figure 13. Average Salary of a PhD Holder with 3-10 Years of Experience by Country
Figure 14. Average Salary of an Assistant Professor by Country
Figure 15. Average Salary of an Associate Professor by Country
Figure 16. Average Salary of a Full Professor by Country
Figure 17. Average Salary of a Lecturer by Country
Figure 18. Average Salary of a Consultant by Country
Figure 19. Average Salary of an Analyst by Country
Figure 20. Average Salary of a Mid-level Manager by Country
Figure 21. Average Salary of a PhD Candidate by Country
Figure 22. Average Salary of a Post-Doc by Country
Figure 23. Average Salary of a Researcher (Junior and Mid-level) by Country
Figure 24. Average Salary of a Researcher (Senior Level) by Country
Figure 25. Average Salary of a Teaching Assistant by Country
2. List of Figures

2 INOMICS®
INOMICS is an online platform hosting education and career opportunities for highly quali-fied professionals, academics and students. 500,000+ visitors use INOMICS to take the next step in their career. Be it a job, grant, PhD program, academic conference or supplementary course, INOMICS users find thousands of opportunities for every stage of their career - updated daily and tailored to individual interests and areas of specialization.

50 INOMICS® INOMICS®