Job Accessibility in Southwest...
25
Job Accessibility in Southwest Baltimore Tanya Allen, Peter Cunningham, Derek Lombardi, Anusree Nair Under the supervision of Professor Chao Liu URSP688L: Planning Technologies The University of Maryland – College Park Fall, 2015 PALS - Partnership for Action Learning in Sustainability An initiative of the National Center for Smart Growth Gerrit Knaap, NCSG Executive Director Uri Avin, PALS Director
Transcript of Job Accessibility in Southwest...
Job Accessibility in Southwest Baltimore
Tanya Allen, Peter Cunningham,
Derek Lombardi, Anusree Nair
Under the supervision of Professor Chao Liu
URSP688L: Planning Technologies
The University of Maryland – College Park
Fall, 2015
PALS - Partnership for Action Learning in Sustainability
An initiative of the National Center for Smart Growth
Gerrit Knaap, NCSG Executive Director
Uri Avin, PALS Director
2
PAGE
\*
MER
GEFO
Contents
Executive Summary.......................................................................................................................... 3
Job Prospects in Southwest Baltimore............................................................................................. 4
Research Questions.......................................................................................................................... 5
Where are the jobs, and what types of jobs are they? ....................................................... 5
What kinds of jobs do SWP residents currently hold? ........................................................ 6
What transportation options are available to SWP workers? …………………………………………. 6
What job opportunities are available to households without vehicles?............................. 7
Variables and Analysis...................................................................................................................... 7
Longitudinal Employer-Household Dynamics (LEHD) data, LODES v.7.1............................. 7
American Community Survey (ACS) Data 2009-2013 ......................................................... 8
Bike and Pedestrian Data .................................................................................................... 8
Interpretation of Results .................................................................................................................. 9
Number and Location of Jobs............................................................................................... 9
Jobs Residents Hold.............................................................................................................. 11
The Transportation Landscape............................................................................................. 14
Commuting to Work: Travel Modes..................................................................................... 15
Commuting to Work: Travel Time…………….......................................................................... 17
Average Commute Time to Work........................................................................................ 19
Walkability and Bikeability................................................................................................... 19
Conclusions and Findings ………………................................................................................................ 21
Future Research .............................................................................................................................. 22
Appendix .......................................................................................................................................... 25
3
PAGE
\*
MER
GEFO
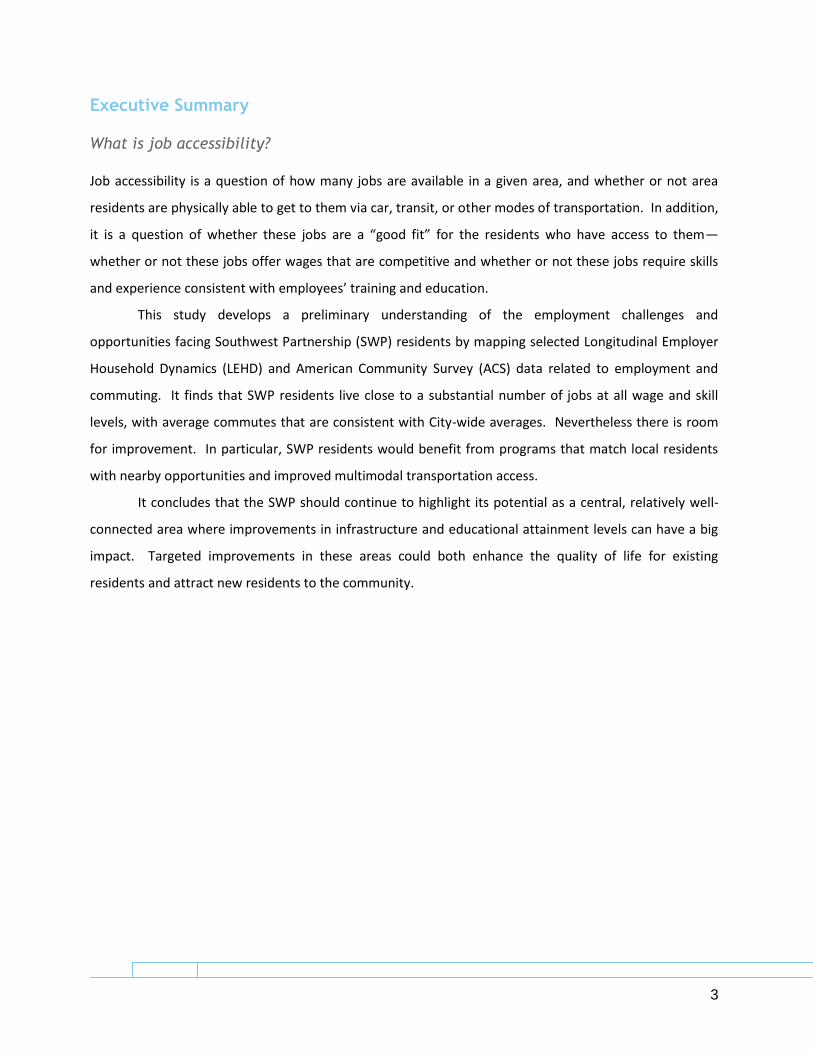
Executive Summary
What is job accessibility?
Job accessibility is a question of how many jobs are available in a given area, and whether or not area
residents are physically able to get to them via car, transit, or other modes of transportation. In addition,
it is a question of whether these jobs are a “good fit” for the residents who have access to them—
whether or not these jobs offer wages that are competitive and whether or not these jobs require skills
and experience consistent with employees’ training and education.
This study develops a preliminary understanding of the employment challenges and
opportunities facing Southwest Partnership (SWP) residents by mapping selected Longitudinal Employer
Household Dynamics (LEHD) and American Community Survey (ACS) data related to employment and
commuting. It finds that SWP residents live close to a substantial number of jobs at all wage and skill
levels, with average commutes that are consistent with City-wide averages. Nevertheless there is room
for improvement. In particular, SWP residents would benefit from programs that match local residents
with nearby opportunities and improved multimodal transportation access.
It concludes that the SWP should continue to highlight its potential as a central, relatively well-
connected area where improvements in infrastructure and educational attainment levels can have a big
impact. Targeted improvements in these areas could both enhance the quality of life for existing
residents and attract new residents to the community.
4
PAGE
\*
MER
GEFO
Job Prospects in Southwest Baltimore
What is the SWP area’s employment profile?
When the Southwest Partnership completed its vision plan earlier this year, it noted that the area
contained 5,700 workers, employed heavily in the following sectors: healthcare and social assistance
(25.8 percent), retail (19 percent), manufacturing (8 percent), accommodation/food services (7.5
percent), and educational services (7.3 percent). While the seven neighborhoods that comprise the SWP
area are primarily residential, roughly 620 businesses are located there. The top three local industries
overlap with the common job profiles of SWP residents: retail (16.8 percent), accommodations/food
(12.7 percent), and healthcare and social assistance (11.6 percent). The other most common industries
are construction (6.3 percent) and real estate and leasing (5.8 percent).
The large share of workers and available jobs in the healthcare and social assistance category owes to the
presence of facilities on the neighborhood’s eastern and western edges, at the UMD Medical Center,
Baltimore VA Medical Center, and Bon Secours Community Works, as well as the smaller drug treatment
and other services scattered across Southwest Baltimore. Most of the other sizable employers that fall
within the SWP area are schools; small storefronts and restaurants on street corners, along West
Baltimore Street, and near Hollins Market; manufacturers and construction companies in southwestern
Pigtown; and retail franchises and offices at Mount Clare Junction.
Where else can SWP residents work?
Due to their proximity to the University of Maryland Baltimore, Baltimore’s Downtown, and BWI airport,
Southwest Baltimore’s seven neighborhoods are well-situated with respect to existing job centers. In
addition to the traditional sectors listed above, the Southwest Partnership has identified new economy
industries as an employment priority for this area. The field of bio-research innovation and care is one
such target since the UMD BioPark is located in the eastern part of Hollins Market. The SWP vision also
notes an intent to capitalize on surrounding developments such as the Horseshoe Casino and the
Montgomery Park adaptive reuse office complex.
Are jobs accessible in Southwest Baltimore?
Broadly, the SWP views workforce development as a critical component of its larger commercial
revitalization strategy. Education requirements often represent a significant barrier to job accessibility.
5
PAGE
\*
MER
GEFO
According to the Baltimore Metropolitan Council’s 2015 workforce development plan, hiring and job
growth trends in the metro area suggest a prevalence of either low-skill and low-paying positions, or
high-skill jobs with ample advancement opportunities. Greater Baltimore is a top contributor of talent
for fields such as IT, biosciences, healthcare, financial services, insurance, high-tech manufacturers, and
other high-skill sectors that require advanced training at the college level and above. Jobs requiring a
high school diploma or less still exist, but few provide a livable salary. A lack of mid-skilled jobs means
that persistent wage gaps or the threat of unemployment may impact Southwest Baltimore residents
who lack educational capital.
Other factors that affect accessibility include an individual’s physical mobility—the quality, quantity, and
cost of their transportation options, substitutes for mobility, and land use patterns (Victoria
Transportation Policy Institute). Commercial activity and job centers in the Baltimore area have spread
much more rapidly in the counties that surround Baltimore City, where transit is far less accessible. Thus,
SWP residents with and without cars face the prospect of prohibitively long commutes. Those without
cars are confronted by additional accessibility challenges, as their search for well-paying jobs that match
their skill and experience levels must also align with the available and affordable transit options.
Governor Hogan’s recent decision to cancel funding for the Red Line light rail line, slated to run through
the SWP area, complicates efforts to improve job accessibility. It also highlights the importance of
understanding what job accessibility challenges residents face and identifying appropriate strategies to
address this issue.
Research Questions
Overview
With the earlier definition of accessibility in mind, this study focuses on the following research questions:
Where are the jobs, and what types of jobs are they?
What kinds of jobs do SWP residents currently hold?
What transportation options are available to SWP workers?
What job opportunities are available to households without vehicles?
Where are the jobs, and what types of jobs are they?
The first phase of this study had an exclusive emphasis on the presence and proximity of available jobs in
and near the Southwest Partnership area. The goal was to identify job centers across the seven
6
PAGE
\*
MER
GEFO
neighborhoods and adjacent communities, and to understand the composition of industries, the range of
available salaries, and the skill and experience levels required of job holders and candidates. Mapping
workplace characteristics can provide a detailed visual analysis of accessibility; for example, which are
SWP’s asset industries? What industries are not represented in nearby employment opportunities?
Where are SWP workers being paid handsomely, or not? Where are there concentrations of jobs for high
school graduates, holders of associate’s degrees, and/or holders of bachelor’s degrees? Where might
there be employment gaps for younger and less experienced workers, or for older and more experienced
workers?
What kinds of jobs do SWP residents currently hold?
After examining workplace characteristics, this study examined the employment characteristics of SWP
residents. Of particular interest was the correlation between available job opportunities in and near
Southwest Baltimore and the types of work that those who live in the SWP area report doing. The
emergence of any noticeable patterns across common industries, wage groups, and education levels
might illuminate some policy and service implications. Examples of the issues this study’s maps address
are: Do citizens of Southwest Baltimore neighborhoods tend to work in industries with high median
yearly earnings or low median yearly earnings? How evenly are earners of various wage levels
distributed across the geography of Southwest Baltimore? Are low, middle, or high earners concentrated
in specific neighborhoods? Do any neighborhoods have a disproportionate share of well-compensated or
low-paid workers? Which parts of the SWP have higher percentages of workers holding jobs with
advanced educational requirements? Where are the more populous pockets of workers who work in
lower-skilled positions?
What transportation options are available to SWP workers?
The physical element of job accessibility is most directly tied to job seekers’ ability to travel to their place
of work. For that reason, this study examined the transportation infrastructure in Southwest Baltimore
and the commutes of SWP residents. The provided descriptive maps of the area’s transportation
infrastructure, as well as maps that attempt to identify trends surrounding vehicle ownership, journey-to-
work mode, travel times to work, and the corresponding relationships these datasets have with the type
of jobs such commuters hold. These visualizations should help the SWP answer questions such as: Which
7
PAGE
\*
MER
GEFO
neighborhoods rely more heavily on public transit or other alternative forms of transportation, rather
than driving, to get to work? Where in the SWP do workers with the longest commutes live? What
industries, wage levels, or education levels overlap most frequently with long commutes, either by car or
by transit?
What job opportunities are available to households without vehicles?
The Southwest Partnership area is characterized by relatively low vehicle ownership rates, relatively high
rates of transit ridership, and relatively low median household incomes vis-a-vis the rest of the City of
Baltimore. Given the high cost of vehicle ownership ($8,986/year, according to 2015 American
Automobile Association estimates) and infrequent/unreliable transit service, car-less households face
additional challenges related to job access. This study includes a series of maps showing the portion of
the City that falls within a reasonable walking/biking distance of the SWP area, as well as the number of
jobs at various wage and education levels that fall within this zone. These visualizations provide context
for discussions of improving the area’s walkability and bikeability, as well as for workforce development
and education programs.
Variables and Analysis
Longitudinal Employer-Household Dynamics (LEHD) data, LODES v.7.1
LEHD data is available at the Census Block level and provides fairly detailed information about the
number, type, and nature of jobs. Block-level data is especially useful because of its geographic accuracy
relative to data available only at the physically larger block group or census tract levels. However, to
better link the LEHD data to other variables examined, some of the figures were summarized to the block
group level. The most recent available version of the LEHD dataset was from 2013, and it includes raw
numerical Workplace Area Characteristics (WAC), totaled by work Census Block, and Residence Area
Characteristics (RAC), totaled by home Census Block. Both the WAC and RAC datasets include over forty
variables that count total jobs and number of jobs for different age ranges, earnings intervals, North
American Industry Classification System (NAICS) categories, races, ethnicities, educational attainment
levels, and sexes. This study used the total figure as well as:
the number of jobs for three different age ranges (29 or younger, 30 to 54, and 55 or older)
8
PAGE
\*
MER
GEFO
the number of jobs for three different earnings intervals ($1250/month or less, $1251/month to
$3333/month, and greater than $3333/month)
the number of jobs for three of the four available educational attainment levels (High school or
equivalent, Some college or Associate degree, and Bachelor’s or advanced degree).
Several of the NAICS categories were taken into consideration, first grouped into professional, service,
and labor sectors, and later into the five highest-paying and five lowest-paying industries, as determined
by the American Community Survey’s 2009-2013 estimated median earnings in the past 12 months.
American Community Survey (ACS) Data 2009-2013
ACS data is available through the U.S. Census, which is constantly collecting and updating its findings.
The ACS provides information about a broad variety of subjects including demographic, housing, social,
and economic data. This study took advantage of the block group level data from Commuting to
Work/Journey to Work, Income and Earnings, Industry and Occupation, Educational Attainment, and
Vehicles Available data sets. The ACS offers data in one-year, three-year, and five-year estimates at a
variety of levels from individual blocks to the entire country. For the best blend of accuracy and
precision, this study uses the 2013 five-year estimates at the block group level. The SWP covers 24 block
groups, however, many of the block group boundaries extend outside the SWP. Therefore, studies and
maps using data at this level need to be analyzed proportionately so they do not mislead by indicating a
greater numbers of applicable data entries than would actually exist within the portion of the block group
that falls in the SWP boundary.
Bike and Pedestrian Data
Bike and pedestrian buffers were generated based on straight-line distances from SWP census block
centroids. They do not take into account important variables like actual street networks, sidewalk
condition and connectivity, available pedestrian crossings, or dedicated bicycle infrastructure. As such,
they should be interpreted as an indication of the area’s potential rather than its current realities.
Buffers were calculated for ¼-mile, ½-mile, and three-mile radii based on conventional wisdom regarding
“comfortable” commute distances for each of these modes. LEHD WAC data was joined to each buffer
and the total number of jobs that fell within the area was calculated.
9
PAGE
\*
MER
GEFO
Interpretation of Results
Number and Location of Jobs
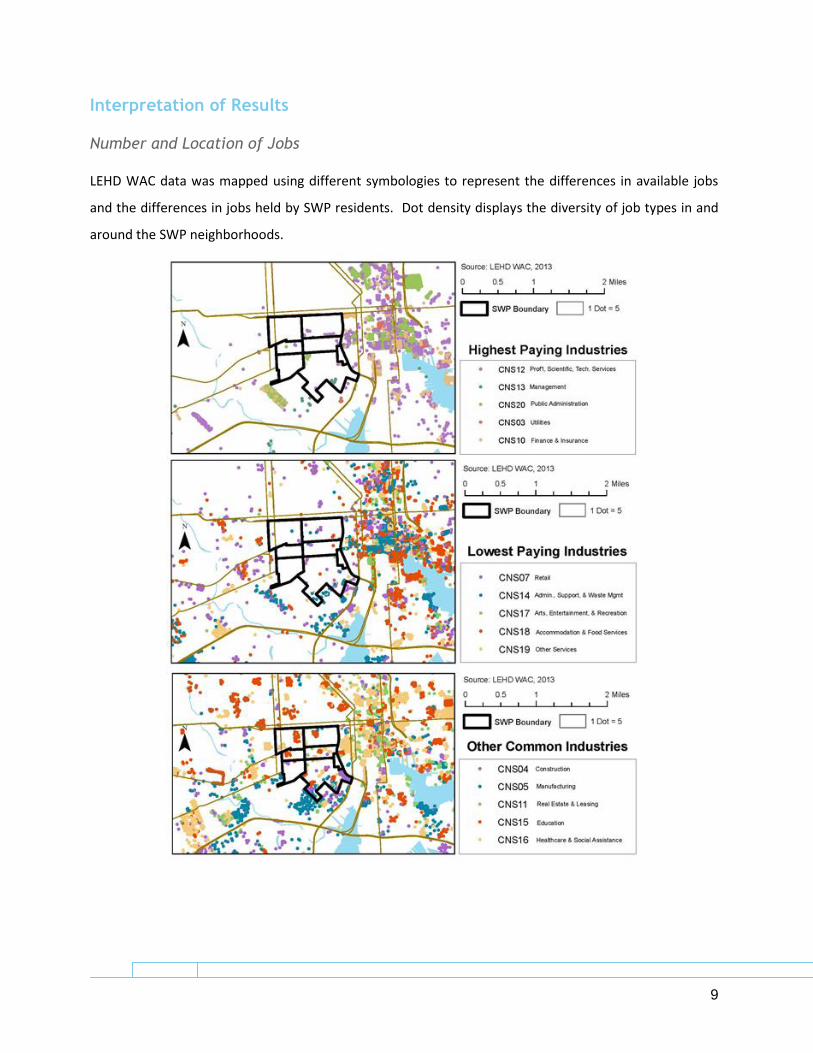
LEHD WAC data was mapped using different symbologies to represent the differences in available jobs
and the differences in jobs held by SWP residents. Dot density displays the diversity of job types in and
around the SWP neighborhoods.
10
PAGE
\*
MER
GEFO
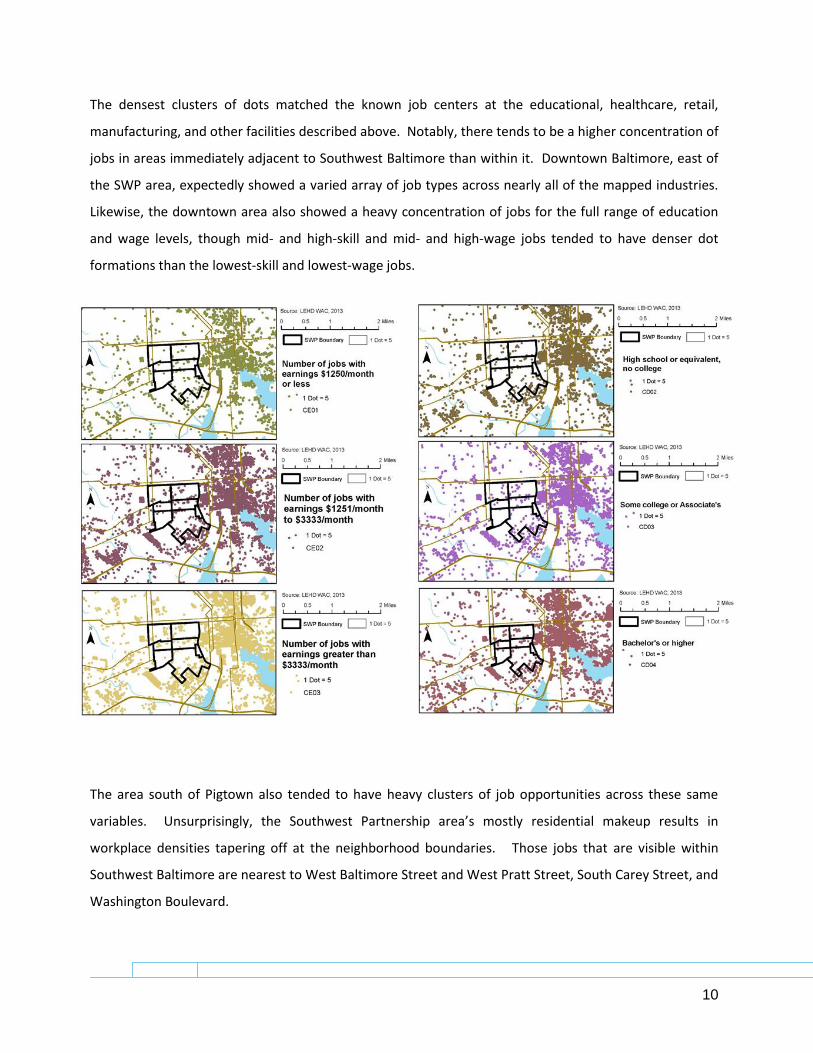
The densest clusters of dots matched the known job centers at the educational, healthcare, retail,
manufacturing, and other facilities described above. Notably, there tends to be a higher concentration of
jobs in areas immediately adjacent to Southwest Baltimore than within it. Downtown Baltimore, east of
the SWP area, expectedly showed a varied array of job types across nearly all of the mapped industries.
Likewise, the downtown area also showed a heavy concentration of jobs for the full range of education
and wage levels, though mid- and high-skill and mid- and high-wage jobs tended to have denser dot
formations than the lowest-skill and lowest-wage jobs.
The area south of Pigtown also tended to have heavy clusters of job opportunities across these same
variables. Unsurprisingly, the Southwest Partnership area’s mostly residential makeup results in
workplace densities tapering off at the neighborhood boundaries. Those jobs that are visible within
Southwest Baltimore are nearest to West Baltimore Street and West Pratt Street, South Carey Street, and
Washington Boulevard.
11
PAGE
\*
MER
GEFO
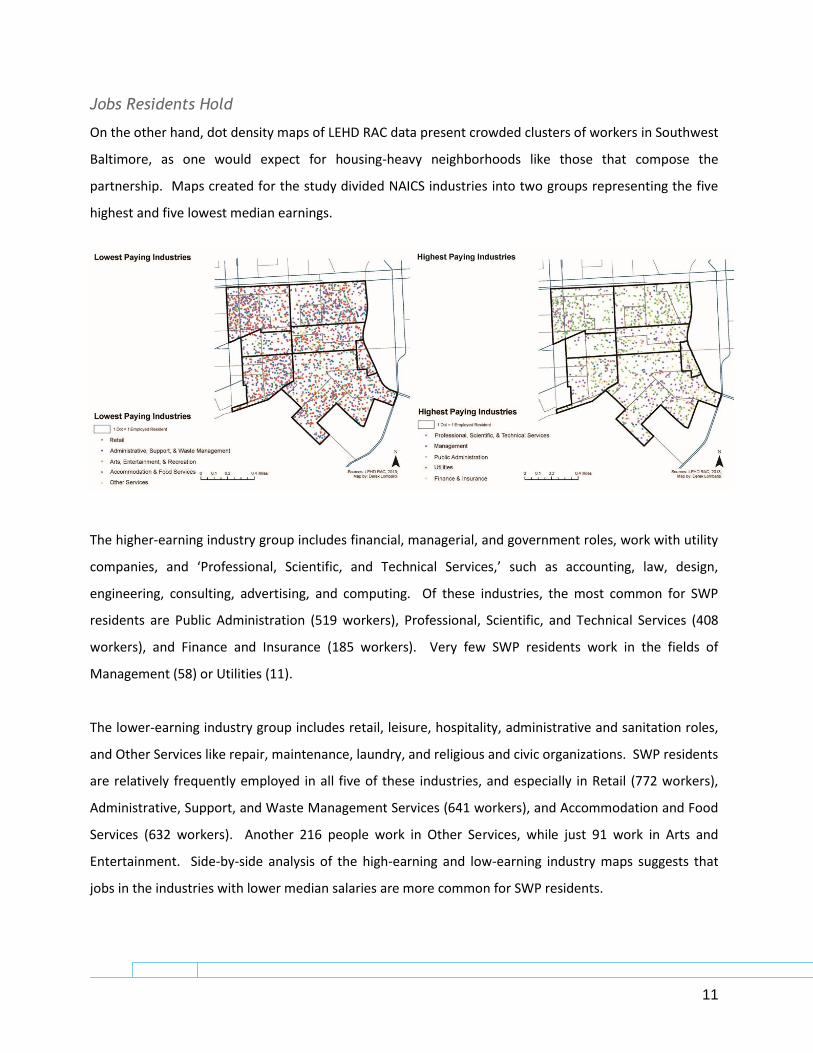
Jobs Residents Hold
On the other hand, dot density maps of LEHD RAC data present crowded clusters of workers in Southwest
Baltimore, as one would expect for housing-heavy neighborhoods like those that compose the
partnership. Maps created for the study divided NAICS industries into two groups representing the five
highest and five lowest median earnings.
The higher-earning industry group includes financial, managerial, and government roles, work with utility
companies, and ‘Professional, Scientific, and Technical Services,’ such as accounting, law, design,
engineering, consulting, advertising, and computing. Of these industries, the most common for SWP
residents are Public Administration (519 workers), Professional, Scientific, and Technical Services (408
workers), and Finance and Insurance (185 workers). Very few SWP residents work in the fields of
Management (58) or Utilities (11).
The lower-earning industry group includes retail, leisure, hospitality, administrative and sanitation roles,
and Other Services like repair, maintenance, laundry, and religious and civic organizations. SWP residents
are relatively frequently employed in all five of these industries, and especially in Retail (772 workers),
Administrative, Support, and Waste Management Services (641 workers), and Accommodation and Food
Services (632 workers). Another 216 people work in Other Services, while just 91 work in Arts and
Entertainment. Side-by-side analysis of the high-earning and low-earning industry maps suggests that
jobs in the industries with lower median salaries are more common for SWP residents.
12
PAGE
\*
MER
GEFO
Other common job fields for SWP residents do not fall on the higher or lower ends of median earnings
spectrum. They are Health Care and Social Assistance (1,235 workers), Educational Services (618
workers), Manufacturing (264 workers), Construction (228 workers), and Real Estate and Leasing (117
workers). Block groups in Pigtown have the largest share of workers in nearly every NAICS category
examined. One of these block groups includes parts of eastern Pigtown and almost all of Barre Circle;
this area tends to have high numbers of financial, insurance, real estate, administrative, sanitation,
education, health, and arts/recreation workers. One notable exception to this observation is in the field
of Public Administration: the central parts of Franklin Square (58 workers) and Poppleton (57 workers)
have large groups of government employees.
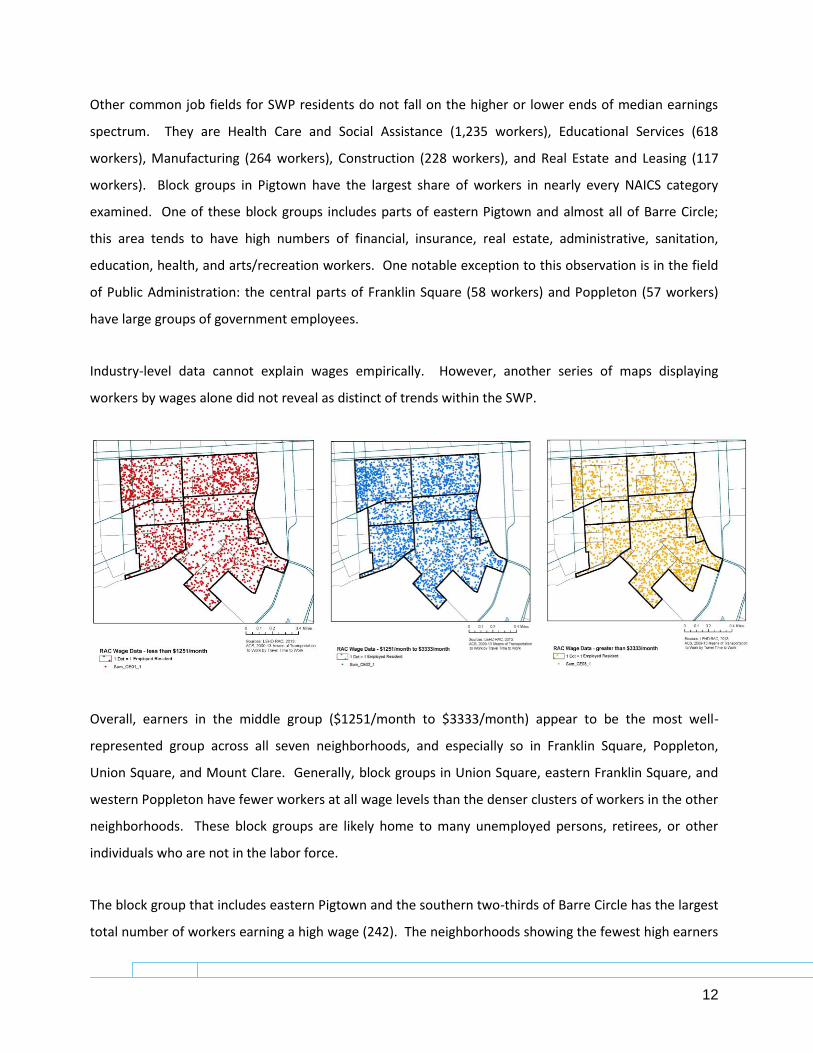
Industry-level data cannot explain wages empirically. However, another series of maps displaying
workers by wages alone did not reveal as distinct of trends within the SWP.
Overall, earners in the middle group ($1251/month to $3333/month) appear to be the most well-
represented group across all seven neighborhoods, and especially so in Franklin Square, Poppleton,
Union Square, and Mount Clare. Generally, block groups in Union Square, eastern Franklin Square, and
western Poppleton have fewer workers at all wage levels than the denser clusters of workers in the other
neighborhoods. These block groups are likely home to many unemployed persons, retirees, or other
individuals who are not in the labor force.
The block group that includes eastern Pigtown and the southern two-thirds of Barre Circle has the largest
total number of workers earning a high wage (242). The neighborhoods showing the fewest high earners
13
PAGE
\*
MER
GEFO
are on the western and northern edges of Southwest Baltimore, but this may be a slightly skewed
observation since the block groups are severed by the SWP boundary, meaning some workers are
excluded if they reside in the same block group but not in Franklin Square, Union Square, or Mount Clare
proper. In a somewhat surprising result, the block group with the fewest high-earning workers that falls
entirely within the SWP area is the eastern half of Union Square, with a mere 41. Again, this may be
attributable to an older population that is past working age.
The block group that includes northern and western Pigtown has the largest share of middle-earning
workers, with 278, followed closely by southwestern Pigtown at 275. In this wage group, it is the western
side of Union Square that shows the fewest middle-earning workers, with just 60 people. Once more,
there are some block groups that have smaller figures, but the data is missing workers who reside outside
of the SWP area.
With 206 workers earning less than $1,251 per month, central Poppleton is the block group with the
most low-wage employees within the limits of the SWP area. Owing to its large overall working-age
population, the block group representing eastern Pigtown and southern Barre Circle has the second
largest share, with 186. Western Union Square has the smallest figure for low-earners, at 60.
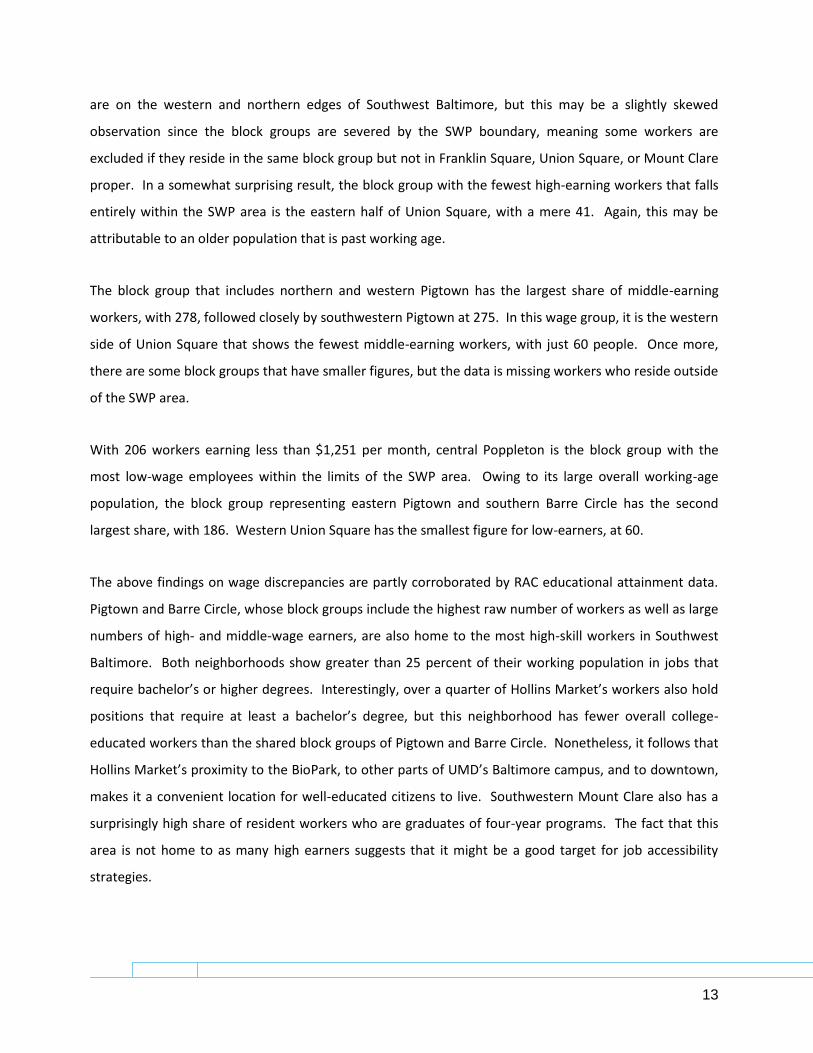
The above findings on wage discrepancies are partly corroborated by RAC educational attainment data.
Pigtown and Barre Circle, whose block groups include the highest raw number of workers as well as large
numbers of high- and middle-wage earners, are also home to the most high-skill workers in Southwest
Baltimore. Both neighborhoods show greater than 25 percent of their working population in jobs that
require bachelor’s or higher degrees. Interestingly, over a quarter of Hollins Market’s workers also hold
positions that require at least a bachelor’s degree, but this neighborhood has fewer overall college-
educated workers than the shared block groups of Pigtown and Barre Circle. Nonetheless, it follows that
Hollins Market’s proximity to the BioPark, to other parts of UMD’s Baltimore campus, and to downtown,
makes it a convenient location for well-educated citizens to live. Southwestern Mount Clare also has a
surprisingly high share of resident workers who are graduates of four-year programs. The fact that this
area is not home to as many high earners suggests that it might be a good target for job accessibility
strategies.
14
PAGE
\*
MER
GEFO
Workers in mid- and low-skill positions are
somewhat evenly spread throughout the rest of
Southwest Baltimore’s residences, with between 20
and 40 percent of workers in all neighborhoods
taking jobs that require either some college or an
associate’s degree, and another 20 to 40 percent in
jobs requiring only a high school diploma. In the
mid-skill group, Pigtown again has the highest
concentration, including over a third of the workers
living in the northern, western, and southernmost
block groups. Employees of low-skill positions,
requiring only a high school diploma or equivalent,
are more well-represented in Poppleton and
southwestern Mount Clare—each neighborhood has roughly a third of its residents engaged in such
work.
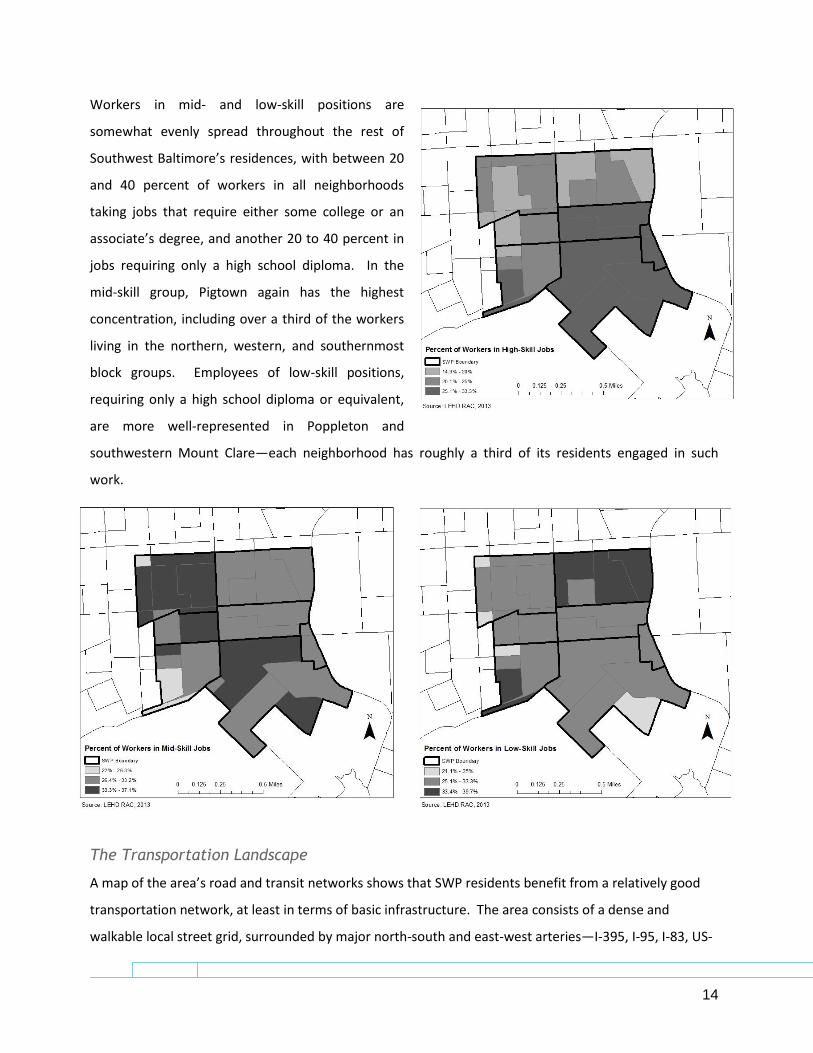
The Transportation Landscape
A map of the area’s road and transit networks shows that SWP residents benefit from a relatively good
transportation network, at least in terms of basic infrastructure. The area consists of a dense and
walkable local street grid, surrounded by major north-south and east-west arteries—I-395, I-95, I-83, US-
15
PAGE
\*
MER
GEFO
1, and US-40. All SWP residents are within ¼ mile of an MTA Transit stop, and the Charm City Circulator’s
Orange Route provides a critical east-west connection to the Downtown area and light rail/Metro service.
At the same time, these maps illustrate several of the area’s transportation shortcomings.
The southern portion of the SWP area is characterized by numerous gaps in the street network,
impassable areas, and limited north-south
travel options. MTA bus service is also
infrequent and unreliable, a factor that
must be factored in to develop a more
accurate evaluation of transit coverage.
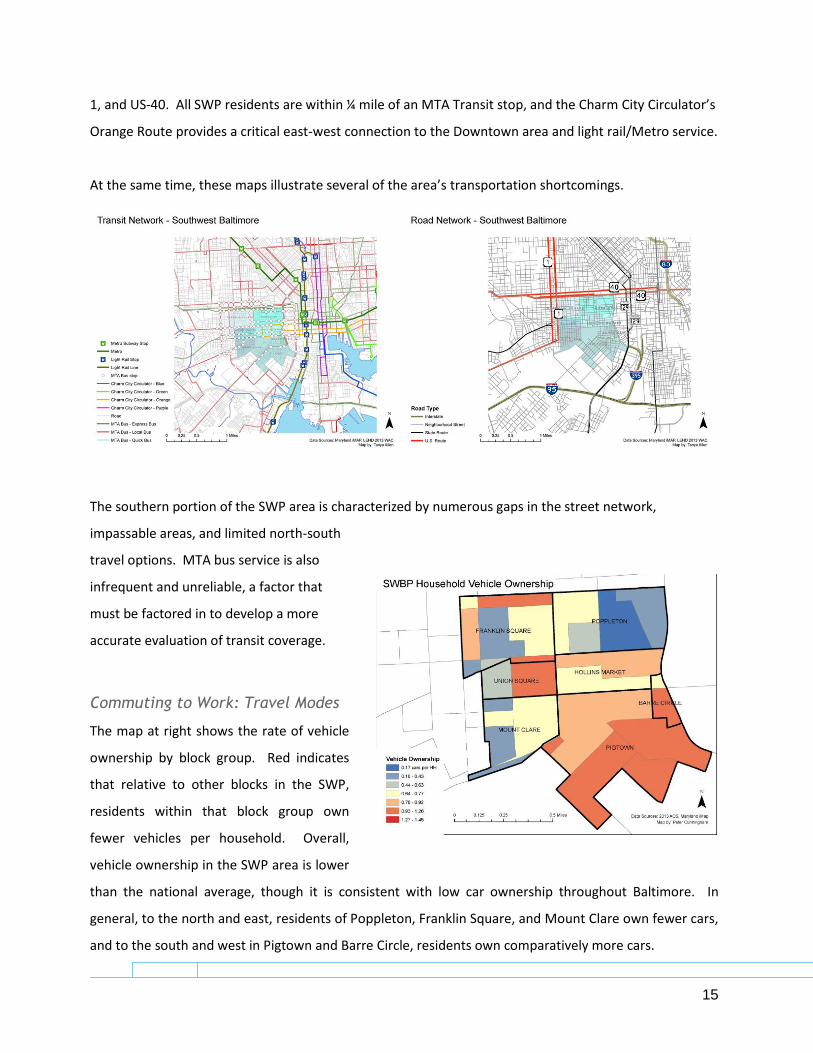
Commuting to Work: Travel Modes
The map at right shows the rate of vehicle
ownership by block group. Red indicates
that relative to other blocks in the SWP,
residents within that block group own
fewer vehicles per household. Overall,
vehicle ownership in the SWP area is lower
than the national average, though it is consistent with low car ownership throughout Baltimore. In
general, to the north and east, residents of Poppleton, Franklin Square, and Mount Clare own fewer cars,
and to the south and west in Pigtown and Barre Circle, residents own comparatively more cars.
16
PAGE
\*
MER
GEFO
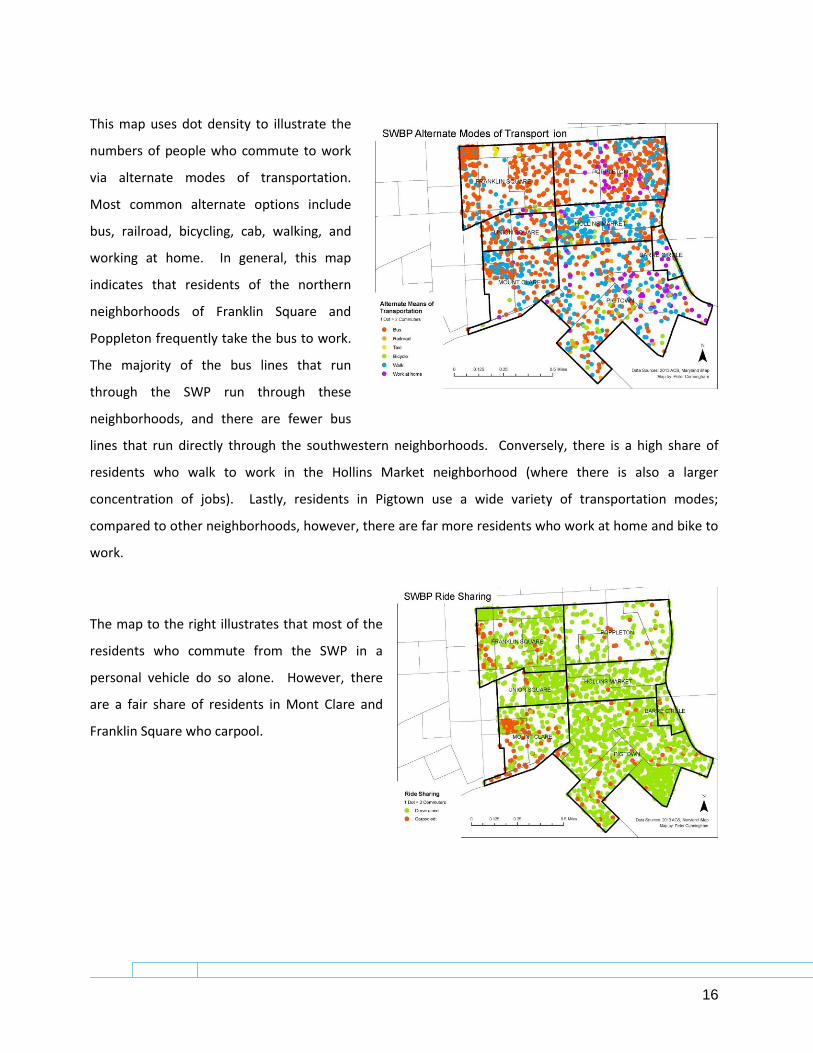
This map uses dot density to illustrate the
numbers of people who commute to work
via alternate modes of transportation.
Most common alternate options include
bus, railroad, bicycling, cab, walking, and
working at home. In general, this map
indicates that residents of the northern
neighborhoods of Franklin Square and
Poppleton frequently take the bus to work.
The majority of the bus lines that run
through the SWP run through these
neighborhoods, and there are fewer bus
lines that run directly through the southwestern neighborhoods. Conversely, there is a high share of
residents who walk to work in the Hollins Market neighborhood (where there is also a larger
concentration of jobs). Lastly, residents in Pigtown use a wide variety of transportation modes;
compared to other neighborhoods, however, there are far more residents who work at home and bike to
work.
The map to the right illustrates that most of the
residents who commute from the SWP in a
personal vehicle do so alone. However, there
are a fair share of residents in Mont Clare and
Franklin Square who carpool.
17
PAGE
\*
MER
GEFO
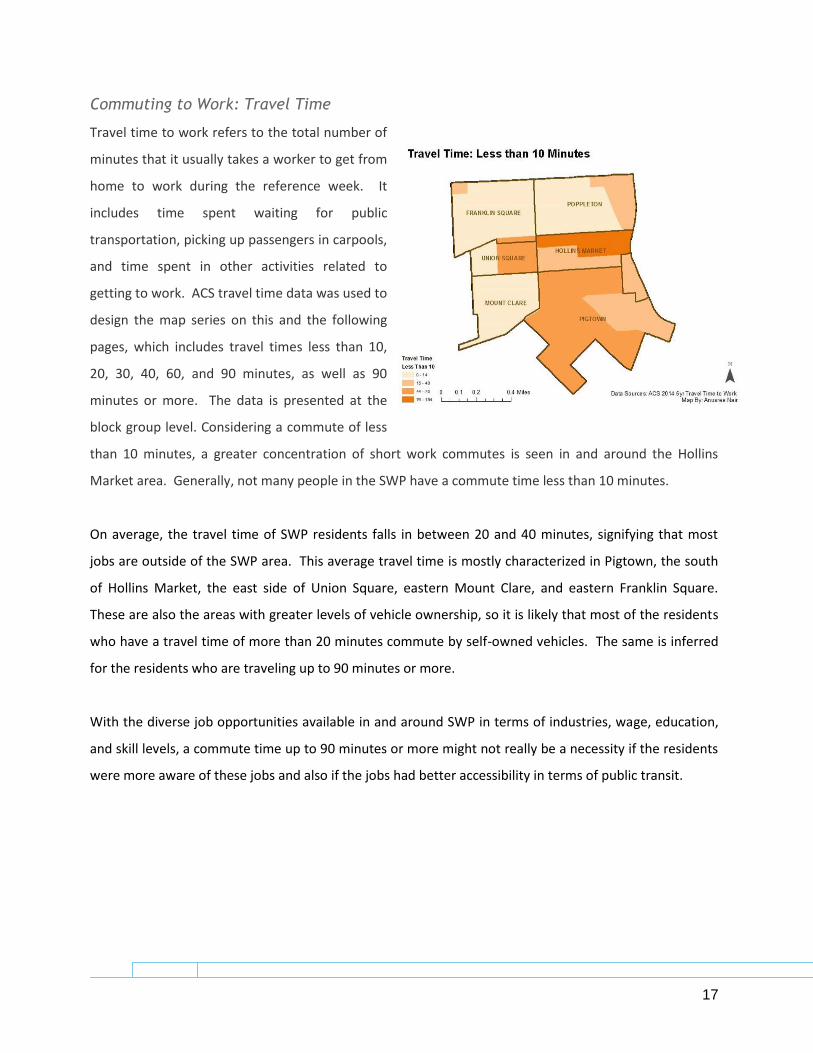
Commuting to Work: Travel Time
Travel time to work refers to the total number of
minutes that it usually takes a worker to get from
home to work during the reference week. It
includes time spent waiting for public
transportation, picking up passengers in carpools,
and time spent in other activities related to
getting to work. ACS travel time data was used to
design the map series on this and the following
pages, which includes travel times less than 10,
20, 30, 40, 60, and 90 minutes, as well as 90
minutes or more. The data is presented at the
block group level. Considering a commute of less
than 10 minutes, a greater concentration of short work commutes is seen in and around the Hollins
Market area. Generally, not many people in the SWP have a commute time less than 10 minutes.
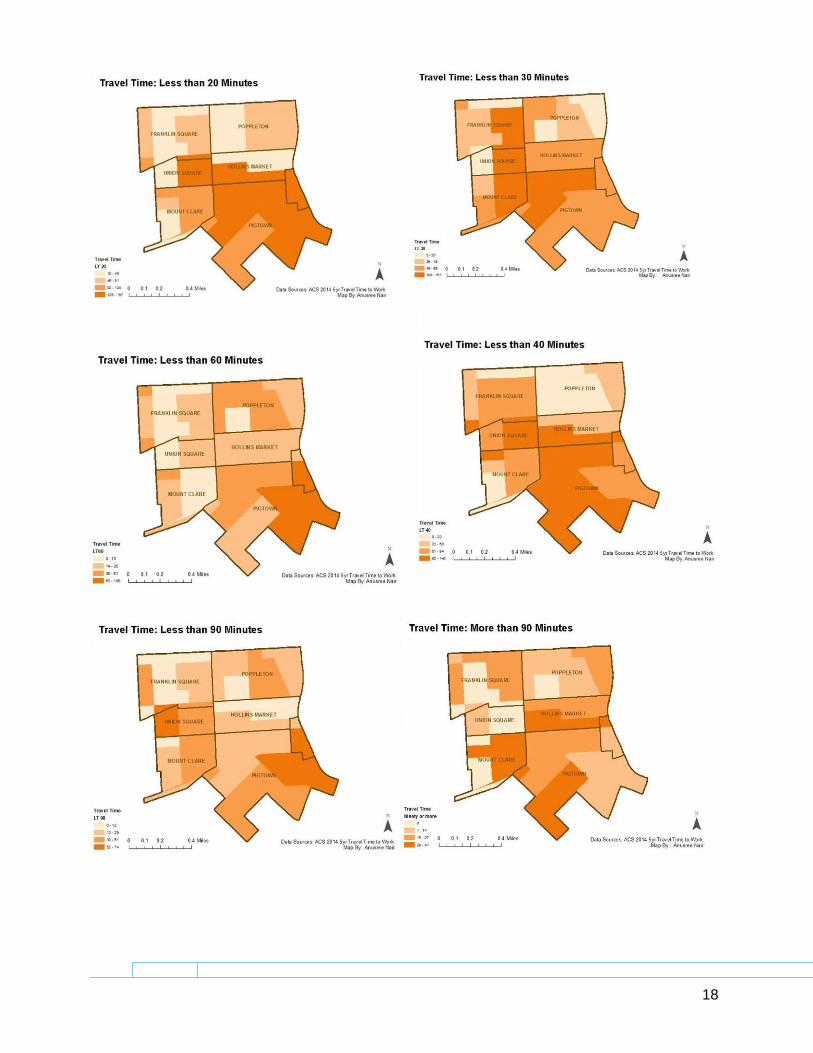
On average, the travel time of SWP residents falls in between 20 and 40 minutes, signifying that most
jobs are outside of the SWP area. This average travel time is mostly characterized in Pigtown, the south
of Hollins Market, the east side of Union Square, eastern Mount Clare, and eastern Franklin Square.
These are also the areas with greater levels of vehicle ownership, so it is likely that most of the residents
who have a travel time of more than 20 minutes commute by self-owned vehicles. The same is inferred
for the residents who are traveling up to 90 minutes or more.
With the diverse job opportunities available in and around SWP in terms of industries, wage, education,
and skill levels, a commute time up to 90 minutes or more might not really be a necessity if the residents
were more aware of these jobs and also if the jobs had better accessibility in terms of public transit.
18
PAGE
\*
MER
GEFO
19
PAGE
\*
MER
GEFO
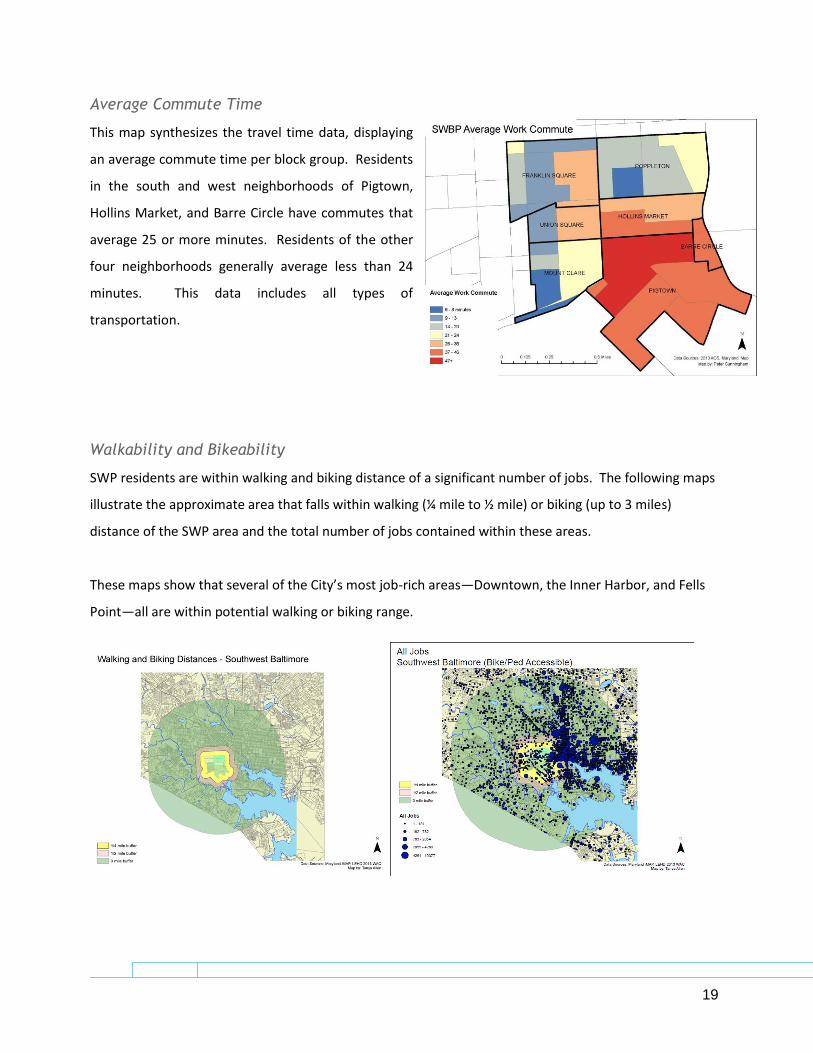
Average Commute Time
This map synthesizes the travel time data, displaying
an average commute time per block group. Residents
in the south and west neighborhoods of Pigtown,
Hollins Market, and Barre Circle have commutes that
average 25 or more minutes. Residents of the other
four neighborhoods generally average less than 24
minutes. This data includes all types of
transportation.
Walkability and Bikeability
SWP residents are within walking and biking distance of a significant number of jobs. The following maps
illustrate the approximate area that falls within walking (¼ mile to ½ mile) or biking (up to 3 miles)
distance of the SWP area and the total number of jobs contained within these areas.
These maps show that several of the City’s most job-rich areas—Downtown, the Inner Harbor, and Fells
Point—all are within potential walking or biking range.
20
PAGE
\*
MER
GEFO
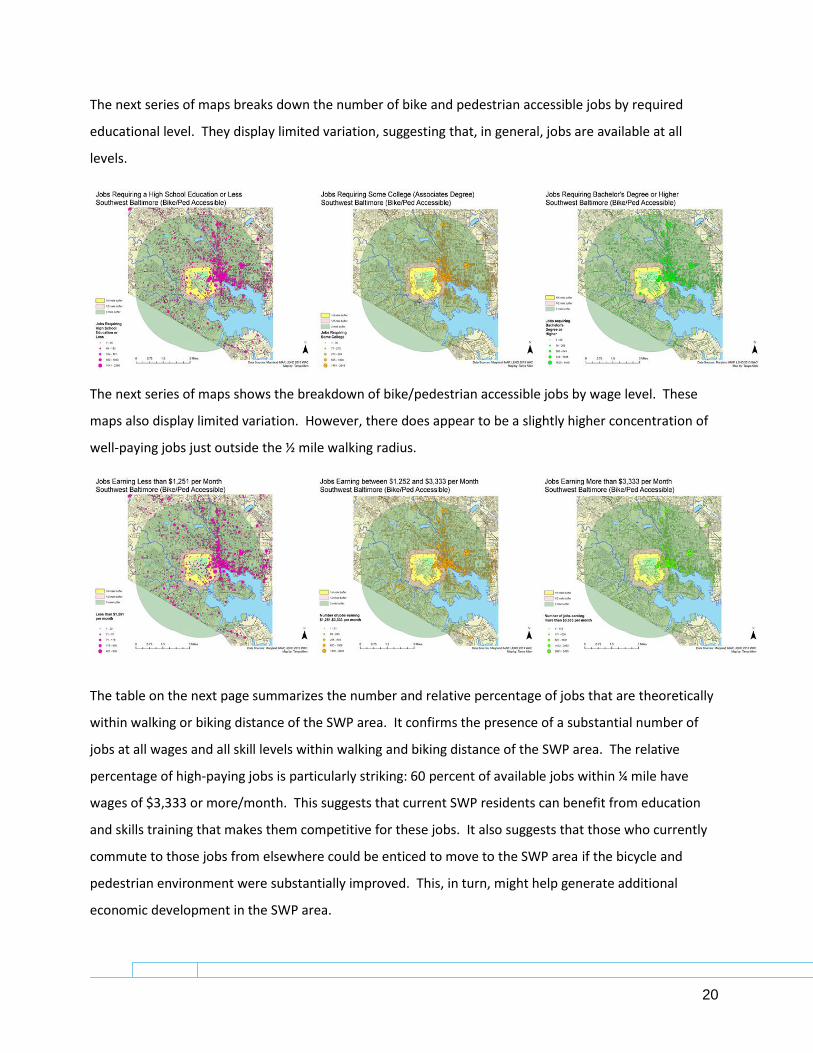
The next series of maps breaks down the number of bike and pedestrian accessible jobs by required
educational level. They display limited variation, suggesting that, in general, jobs are available at all
levels.
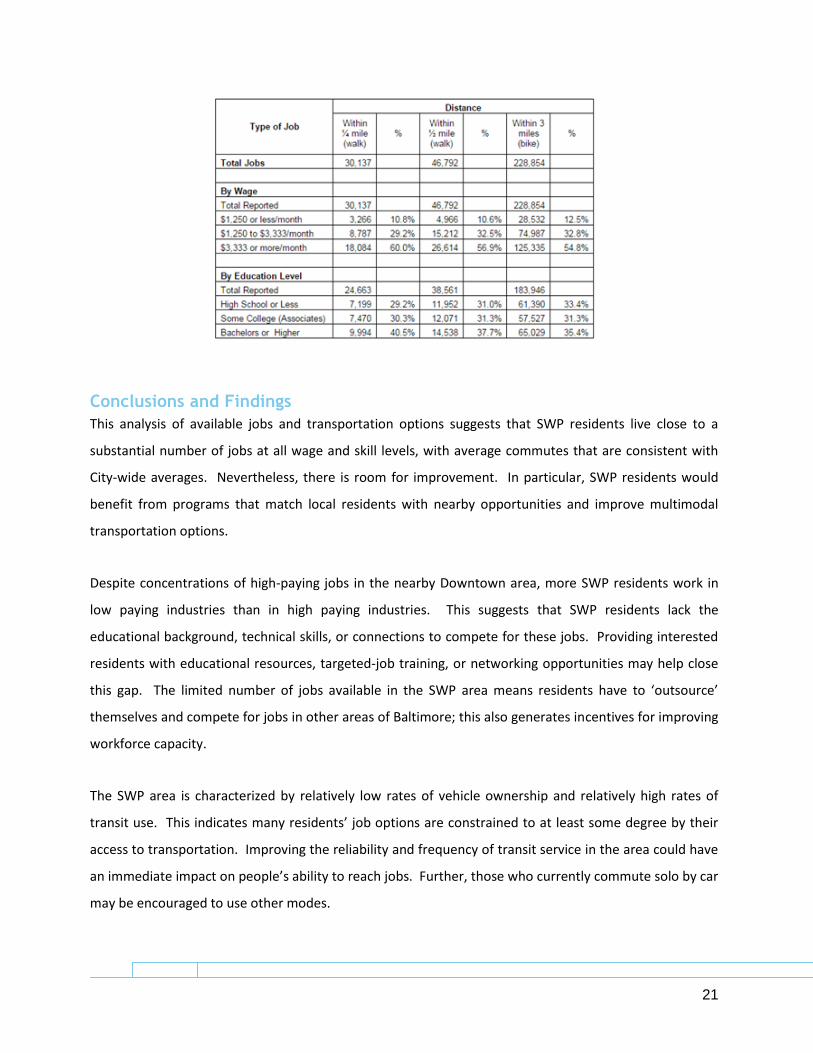
The next series of maps shows the breakdown of bike/pedestrian accessible jobs by wage level. These
maps also display limited variation. However, there does appear to be a slightly higher concentration of
well-paying jobs just outside the ½ mile walking radius.
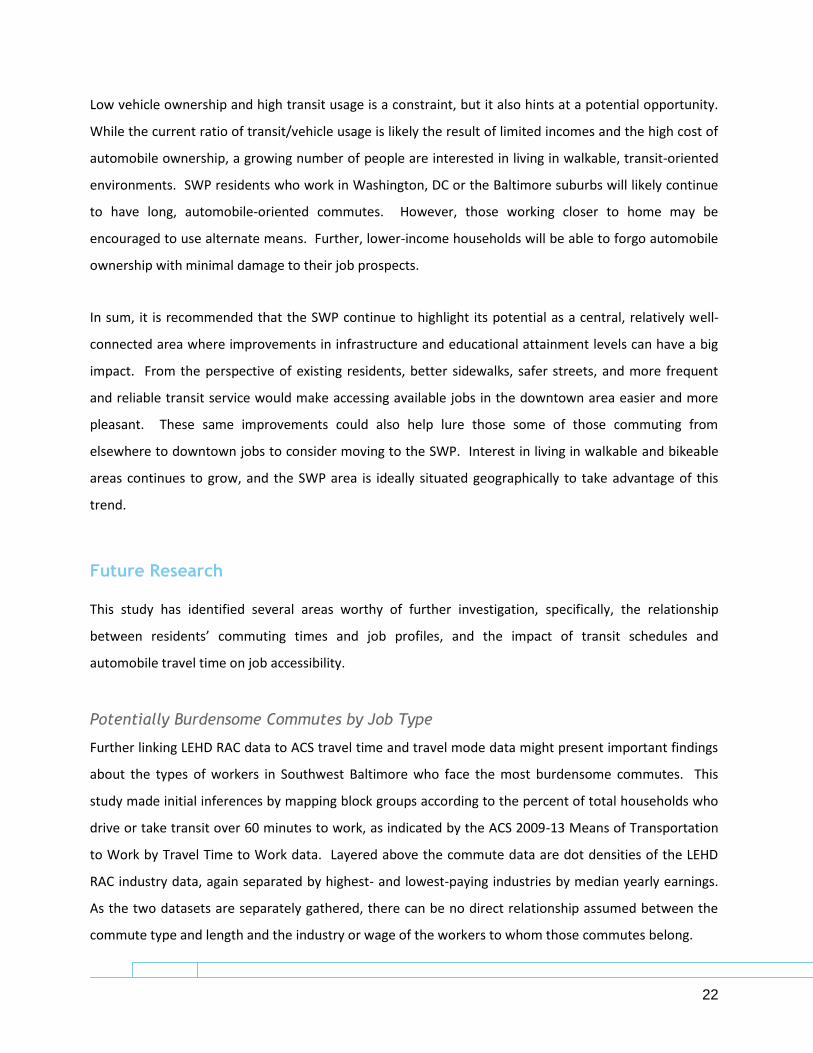
The table on the next page summarizes the number and relative percentage of jobs that are theoretically
within walking or biking distance of the SWP area. It confirms the presence of a substantial number of
jobs at all wages and all skill levels within walking and biking distance of the SWP area. The relative
percentage of high-paying jobs is particularly striking: 60 percent of available jobs within ¼ mile have
wages of $3,333 or more/month. This suggests that current SWP residents can benefit from education
and skills training that makes them competitive for these jobs. It also suggests that those who currently
commute to those jobs from elsewhere could be enticed to move to the SWP area if the bicycle and
pedestrian environment were substantially improved. This, in turn, might help generate additional
economic development in the SWP area.
21
PAGE
\*
MER
GEFO
Conclusions and Findings
This analysis of available jobs and transportation options suggests that SWP residents live close to a
substantial number of jobs at all wage and skill levels, with average commutes that are consistent with
City-wide averages. Nevertheless, there is room for improvement. In particular, SWP residents would
benefit from programs that match local residents with nearby opportunities and improve multimodal
transportation options.
Despite concentrations of high-paying jobs in the nearby Downtown area, more SWP residents work in
low paying industries than in high paying industries. This suggests that SWP residents lack the
educational background, technical skills, or connections to compete for these jobs. Providing interested
residents with educational resources, targeted-job training, or networking opportunities may help close
this gap. The limited number of jobs available in the SWP area means residents have to ‘outsource’
themselves and compete for jobs in other areas of Baltimore; this also generates incentives for improving
workforce capacity.
The SWP area is characterized by relatively low rates of vehicle ownership and relatively high rates of
transit use. This indicates many residents’ job options are constrained to at least some degree by their
access to transportation. Improving the reliability and frequency of transit service in the area could have
an immediate impact on people’s ability to reach jobs. Further, those who currently commute solo by car
may be encouraged to use other modes.
22
PAGE
\*
MER
GEFO
Low vehicle ownership and high transit usage is a constraint, but it also hints at a potential opportunity.
While the current ratio of transit/vehicle usage is likely the result of limited incomes and the high cost of
automobile ownership, a growing number of people are interested in living in walkable, transit-oriented
environments. SWP residents who work in Washington, DC or the Baltimore suburbs will likely continue
to have long, automobile-oriented commutes. However, those working closer to home may be
encouraged to use alternate means. Further, lower-income households will be able to forgo automobile
ownership with minimal damage to their job prospects.
In sum, it is recommended that the SWP continue to highlight its potential as a central, relatively well-
connected area where improvements in infrastructure and educational attainment levels can have a big
impact. From the perspective of existing residents, better sidewalks, safer streets, and more frequent
and reliable transit service would make accessing available jobs in the downtown area easier and more
pleasant. These same improvements could also help lure those some of those commuting from
elsewhere to downtown jobs to consider moving to the SWP. Interest in living in walkable and bikeable
areas continues to grow, and the SWP area is ideally situated geographically to take advantage of this
trend.
Future Research
This study has identified several areas worthy of further investigation, specifically, the relationship
between residents’ commuting times and job profiles, and the impact of transit schedules and
automobile travel time on job accessibility.
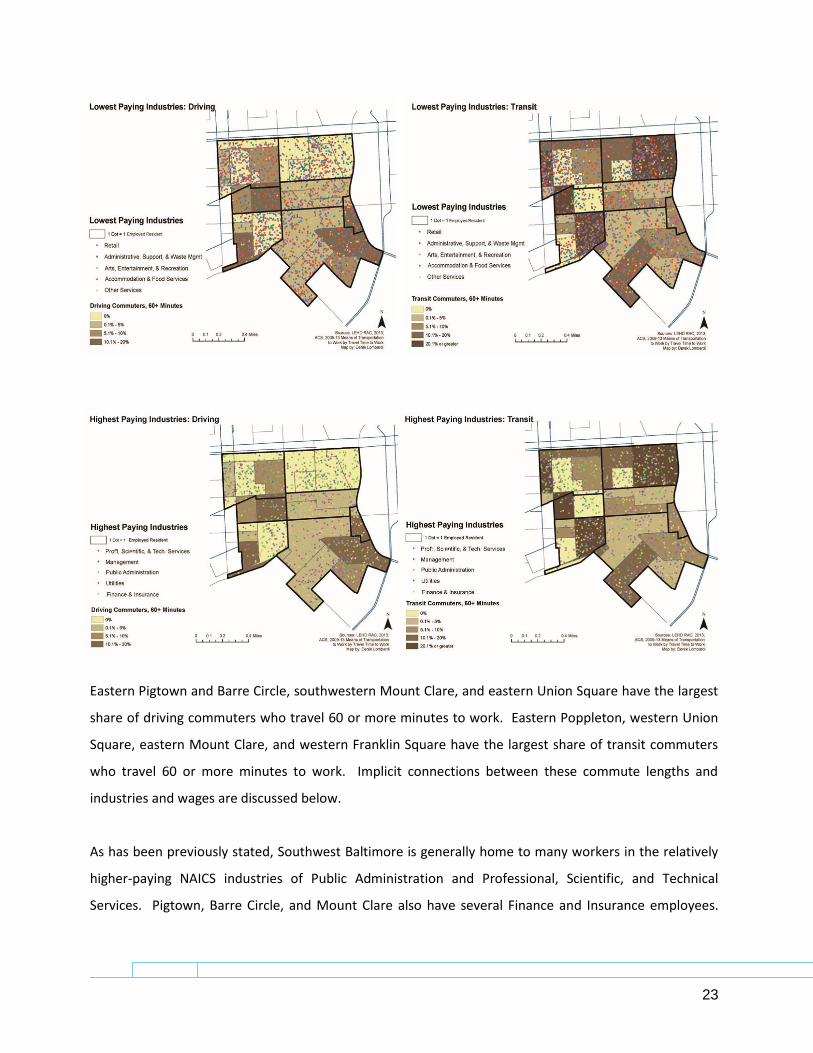
Potentially Burdensome Commutes by Job Type
Further linking LEHD RAC data to ACS travel time and travel mode data might present important findings
about the types of workers in Southwest Baltimore who face the most burdensome commutes. This
study made initial inferences by mapping block groups according to the percent of total households who
drive or take transit over 60 minutes to work, as indicated by the ACS 2009-13 Means of Transportation
to Work by Travel Time to Work data. Layered above the commute data are dot densities of the LEHD
RAC industry data, again separated by highest- and lowest-paying industries by median yearly earnings.
As the two datasets are separately gathered, there can be no direct relationship assumed between the
commute type and length and the industry or wage of the workers to whom those commutes belong.
23
PAGE
\*
MER
GEFO
Eastern Pigtown and Barre Circle, southwestern Mount Clare, and eastern Union Square have the largest
share of driving commuters who travel 60 or more minutes to work. Eastern Poppleton, western Union
Square, eastern Mount Clare, and western Franklin Square have the largest share of transit commuters
who travel 60 or more minutes to work. Implicit connections between these commute lengths and
industries and wages are discussed below.
As has been previously stated, Southwest Baltimore is generally home to many workers in the relatively
higher-paying NAICS industries of Public Administration and Professional, Scientific, and Technical
Services. Pigtown, Barre Circle, and Mount Clare also have several Finance and Insurance employees.
24
PAGE
\*
MER
GEFO
Many of these skilled and well-paid workers may be traveling to suburbs, Annapolis, or Washington, DC
for work. Transit riders may not have easy access to job centers for the aforementioned industries.
Within lower-paying NAICS industries, the SWP area has a prevalence of retail, administrative, and
food/hospitality workers. Residents of eastern Pigtown, Barre Circle, Union Square, and southwestern
Mount Clare who drive to these types of jobs may work outside of Baltimore City. Raising some concern
are the clusters of workers in lower-paid industries who originate in the block groups with high shares of
transit commuters. It might be the case that these Southwest Baltimore residents are traveling along
prohibitively distant or transfer-heavy routes for jobs that don’t offer a wage that matches the time- and
effort-intensity of the commute. Linking these residents to similar job opportunities that are more local
could enhance their commuting experience.
Due to the ambiguous basis for the above analysis, this study recommends a more thorough empirical
evaluation of commutes for workers of various industries, wage-levels, and educational attainment
levels.
Network and Schedule-based Analysis of All Commute Options
Due to limits on both time and technical expertise, the question of job access via transit and automobile
remains unexplored. An additional study that incorporates network analysis techniques and available
data on transit schedules could explore this question. Pedestrian and bicycling distances should also be
recalculated using Network Analysis to generate a more accurate picture of existing conditions and
identify target areas for improvement.
25
PAGE
\*
MER
GEFO
Appendix
Sources/Citations
American Automobile Association (AAA). “Annual Cost to Own and Operate a Vehicle Falls to $8,698,
Finds AAA.” http://newsroom.aaa.com/2015/04/annual-cost-operate-vehicle-falls-8698-finds-aaa//.
Accessed 12/10/2015.
Baltimore Metropolitan Council. Opportunity Collaborative. “Strong Workforce, Strong Economy:
Baltimore Regional Workforce Development Plan.” March 2015.
Litman, Todd. “Evaluating Accessibility for Transportation Planning: Measuring People’s Activities to
Reach Desired Goods and Activities.” Victoria Transportation Policy Institute,
http://www.vtpi.org/access.pdf)., accessed 12/15/2015.
U.S. Census Bureau. 2015. LODES Data. Longitudinal-Employer Household Dynamics Program.
http://lehd.ces.census.gov/data/lodes/
U.S. Census Bureau; American Community Survey, 2009-2013, multiple datasets.
U.S. Department of Commerce, U.S. Census Bureau, Geography Division. 2010 Census Tract, 2010
TIGER/Line Shapefile, 2010.