Jindal financial report
69
Company Profile Name of the company : JINDAL STEEL & POWER LIMITED Registered Office : O.P. Jindal Marge Hisar – 125005 Haryana Corporate Office : Jindal Center 12, Bhikaiji Cama Place, New Delhi – 110066 India Production Plant : In Global 1) Bolivia ( South America ) 2) Africa 3) Democratic Republic of Congo In India 1) Haryana 2) Chhattisgarh
Transcript of Jindal financial report

Company Profile
Name of the company : JINDAL STEEL & POWER LIMITED
Registered Office : O.P. Jindal Marge
Hisar – 125005
Haryana
Corporate Office : Jindal Center
12, Bhikaiji Cama Place,
New Delhi – 110066
India
Production Plant : In Global
1) Bolivia ( South America )2) Africa3) Democratic Republic of Congo
In India
1) Haryana2) Chhattisgarh3) Orissa4) Jharkhand5) Andhra Pradesh
Type of Business : Exploration Development & Production of

Steel, Petroleum and Cement
Network of company : Jindal Steel & Power ltd.
Jindal Petroleum ltd.
Jindal Cement ltd.
Jindal Power Trading company ltd.
Jindal Power ltd.
Mission statement : “TAKING INDIA AHEAD”
Web Site : www.jindalsteelpower.com
History of Company
1998 - The name of the Company has been changed from Orbit Strips Ltd. to Jindal Steel & Power Ltd. on 12th June. 1999 - Shri O.P. Jindal, Shri Ratan Jindal and Shri M.L. Gupta were Appointed as Additional Directors of the Company in terms of Section 260 of the Companies Act, 1956 and Article 117 of Articles of Association of the Company. - Shri M.L. Gupta, appointed as Whole time Director of the Company w.e.f. 1st May for a period of five years. - The Company has joined the Depository System and its securities Can be dematerialized. - The Raigarh and Raipur Divisions of Jindal Strips Limited have been hived off to JINDAL STEEL & POWER LIMITED pursuant to the Scheme of Arrangement approved by Hon'ble High Court of Punjab and Haryana. - The Company has issued 14% 60, 00,000 Cumulative Redeemable Preference Shares of Rs. 100/- each aggregating to Rs. 60 crores on private placement basis. - The Steel Melting Shop of the Company, was shut down in May'98 due to the explosion. It was commissioned in Oct '99.
2007 -Jindal Steel & Power Ltd has appointed Shri A K Purwar, former

Chairman, State Bank of India as an Independent Director on the Board of the Company with immediate effect. - Jindal Steel & Power Ltd has informed that the Board of Directors of the Company has (by circulation) appointed Shri. Ram Vinay Shahi as Additional Director (Independent) and member of the Audit Committee of Directors with effect from October 15, 2007. -Jindal Steel & Power Ltd has appointed Shri. Arun Kumar Mukherji as an Additional Director and Wholetime Director of the Company with effect from April 01, 2008 2008 - The Company has splits its face value from Rs5/- to Rs1/-. -Jindal Steel & Power Ltd has informed that Jindal Power Ltd (JPL), subsidiary of the Company, on September 05, 2008 has commissioned fourth power generating unit of 250 MW. With this, the subsidiary Company has completed the 1000 MW power project and has now the capacity to generate 1000 MW power from this plant.
2009 - Jindal Steel & Power Ltd has informed BSE that the Board of Directors has, vide resolution passed through circulation on January 14, 2009, appointed Shri. Ashok K Mohapatra, Shri. Haigreve Khaitan,
Shri Hardip Singh Wirk and Shri Rahul Mehra as independent directors of the Company with effect from January 14, 2009 - Jindal Steel & Power Ltd has appointed Shri Arun Kumar as independent directors of the Company w.e.f September 16, 2009 - Jindal Steel & Power Ltd has appointed Shri. Arun Kumar as an Additional Director (Independent) from September 16, 2009, to hold
office up to the date of next Annual General Meeting of the Company
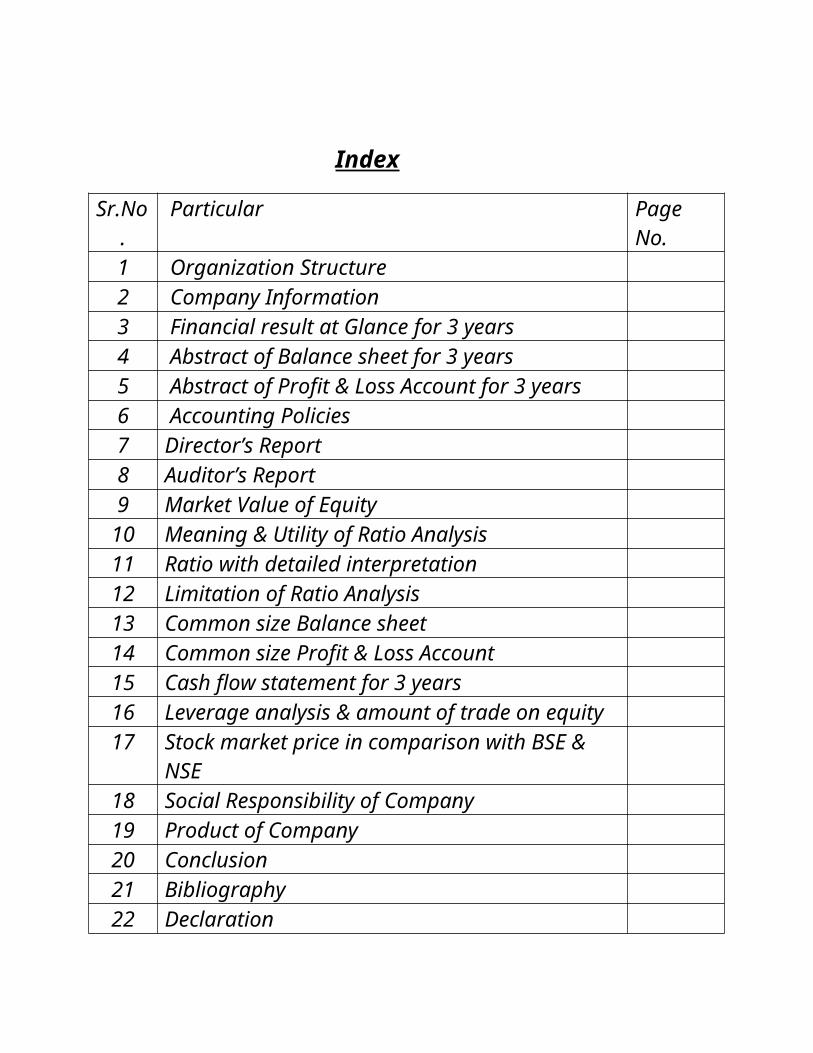
Index
Sr.No.
Particular Page No.
1 Organization Structure 2 Company Information
3 Financial result at Glance for 3 years4 Abstract of Balance sheet for 3 years5 Abstract of Profit & Loss Account for 3 years6 Accounting Policies7 Director’s Report8 Auditor’s Report9 Market Value of Equity10 Meaning & Utility of Ratio Analysis11 Ratio with detailed interpretation12 Limitation of Ratio Analysis13 Common size Balance sheet 14 Common size Profit & Loss Account15 Cash flow statement for 3 years 16 Leverage analysis & amount of trade on equity17 Stock market price in comparison with BSE & NSE 18 Social Responsibility of Company19 Product of Company20 Conclusion21 Bibliography22 Declaration
Organization Structure


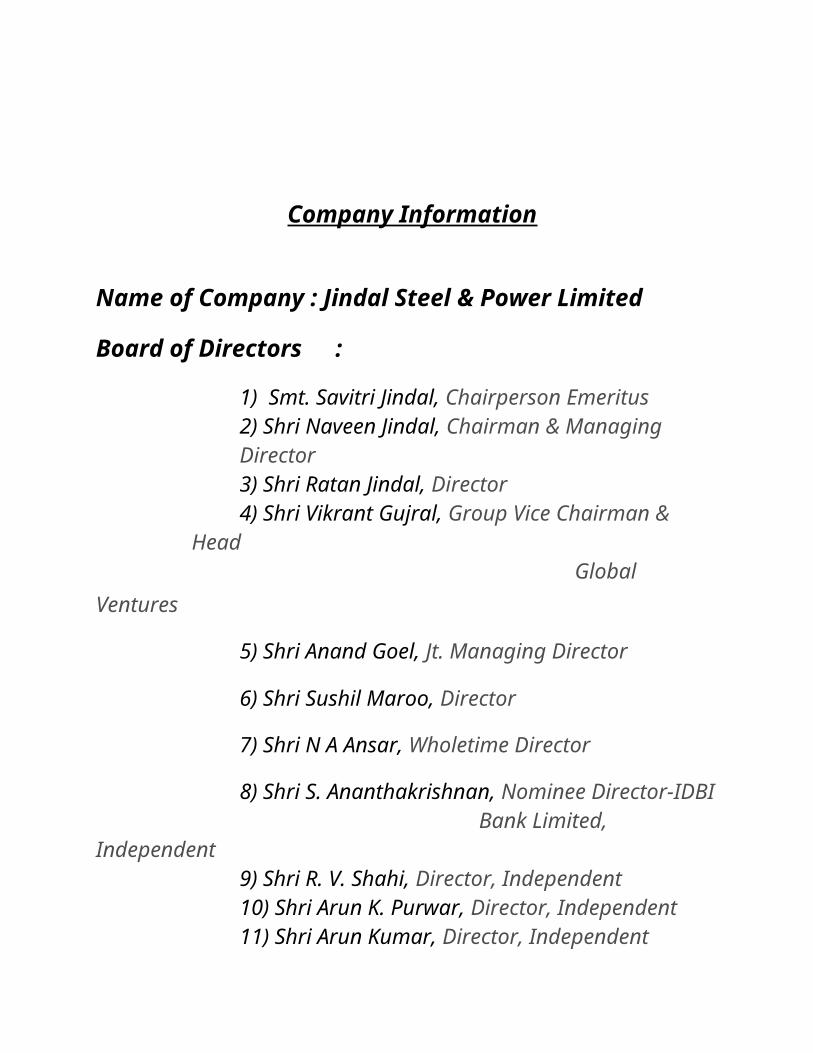
Company Information
Name of Company : Jindal Steel & Power Limited
Board of Directors :
1) Smt. Savitri Jindal, Chairperson Emeritus2) Shri Naveen Jindal, Chairman & Managing Director3) Shri Ratan Jindal, Director4) Shri Vikrant Gujral, Group Vice Chairman & Head
Global Ventures
5) Shri Anand Goel, Jt. Managing Director
6) Shri Sushil Maroo, Director
7) Shri N A Ansar, Wholetime Director
8) Shri S. Ananthakrishnan, Nominee Director-IDBI Bank Limited, Independent
9) Shri R. V. Shahi, Director, Independent10) Shri Arun K. Purwar, Director, Independent
11) Shri Arun Kumar, Director, Independent
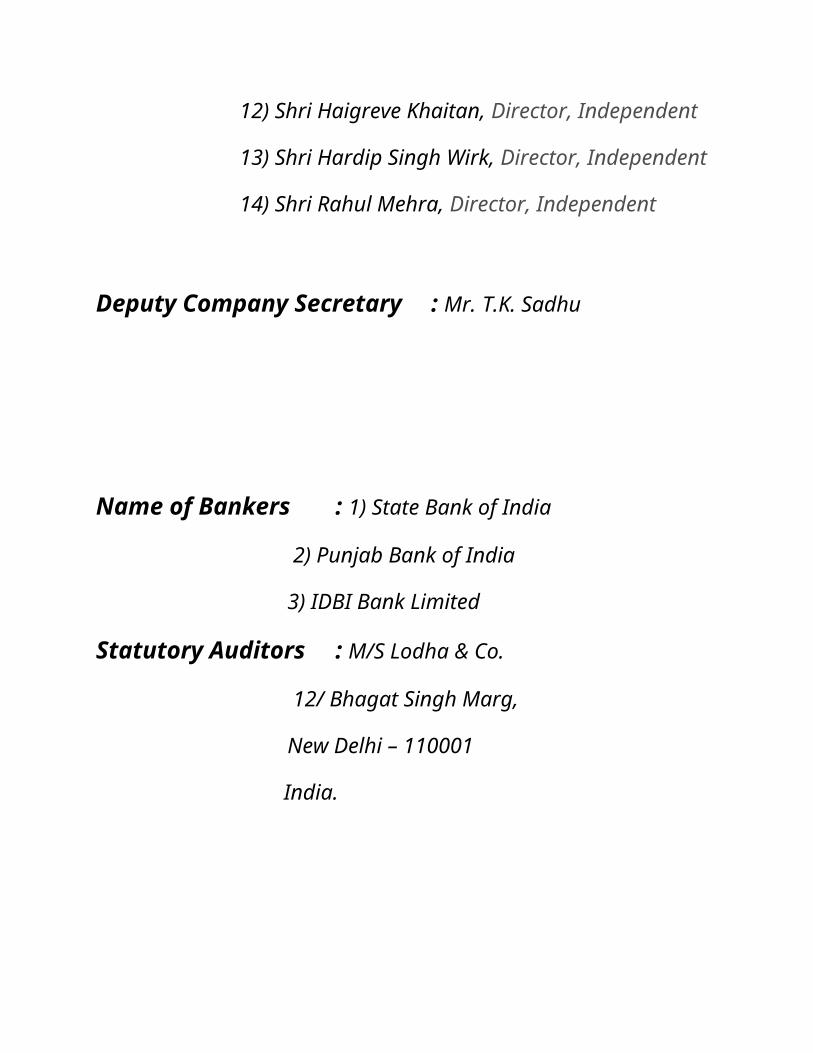
12) Shri Haigreve Khaitan, Director, Independent
13) Shri Hardip Singh Wirk, Director, Independent
14) Shri Rahul Mehra, Director, Independent
Deputy Company Secretary : Mr. T.K. Sadhu
Name of Bankers : 1) State Bank of India
2) Punjab Bank of India
3) IDBI Bank Limited
Statutory Auditors : M/S Lodha & Co.
12/ Bhagat Singh Marg,
New Delhi – 110001
India.
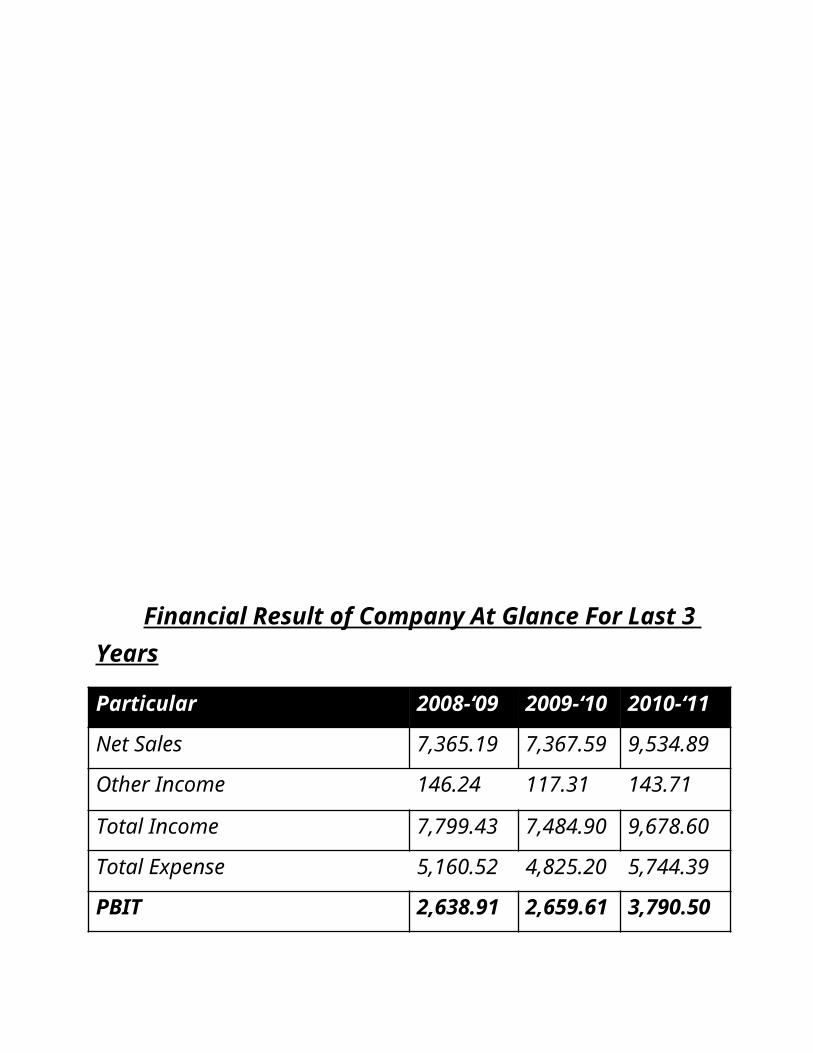
Financial Result of Company At Glance For Last 3 Years
Particular 2008-‘09 2009-‘10 2010-‘11
Net Sales 7,365.19 7,367.59 9,534.89
Other Income 146.24 117.31 143.71
Total Income 7,799.43 7,484.90 9,678.60
Total Expense 5,160.52 4,825.20 5,744.39
PBIT 2,638.91 2,659.61 3,790.50
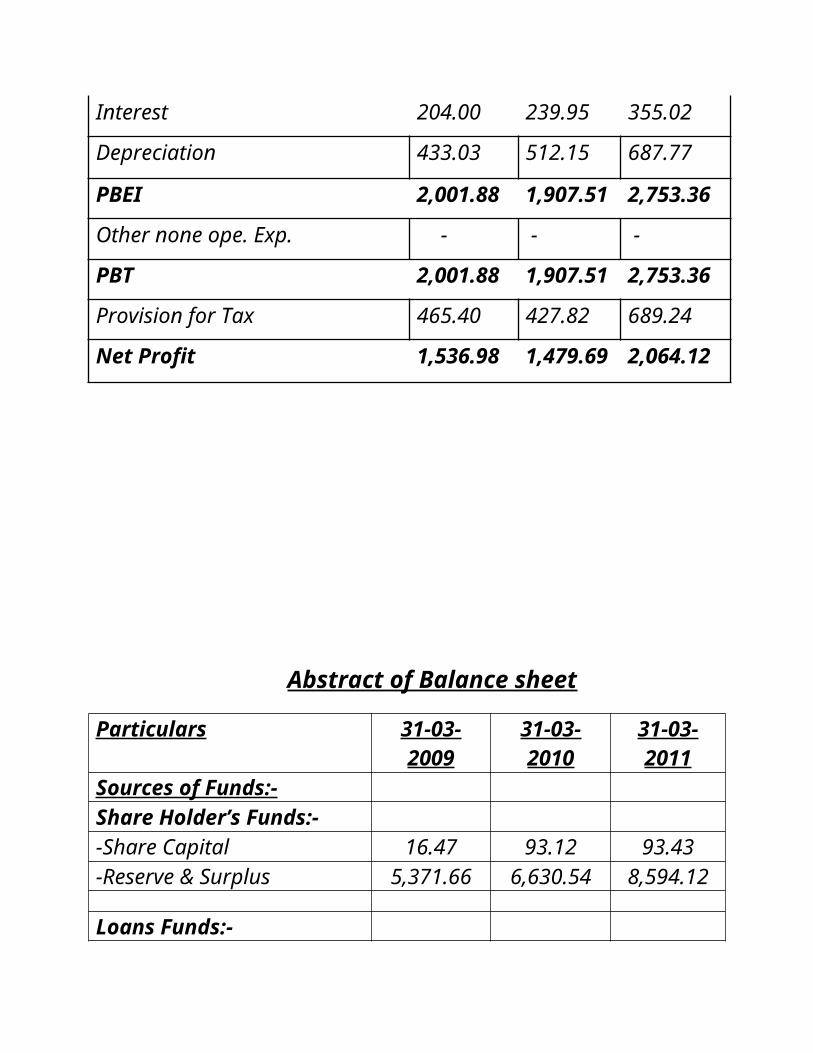
Interest 204.00 239.95 355.02
Depreciation 433.03 512.15 687.77
PBEI 2,001.88 1,907.51 2,753.36
Other none ope. Exp. - - -
PBT 2,001.88 1,907.51 2,753.36
Provision for Tax 465.40 427.82 689.24
Net Profit 1,536.98 1,479.69 2,064.12
Abstract of Balance sheet
Particulars 31-03-2009 31-03-2010 31-03-2011Sources of Funds:-Share Holder’s Funds:--Share Capital 16.47 93.12 93.43-Reserve & Surplus 5,371.66 6,630.54 8,594.12
Loans Funds:--Secured Loans 2,105.49 4,235.16 5,530.93-Unsecured Loans 2,857.16 4,148.10 6,583.74Deferred Tax Liability(Net) 599.77 715.00 8,78.33
Total 10,977.74 15,844.26 21,682.34
Applications of Funds :-(A) Fixed Assets:--Gross Block 7,362.90 8,814.21 12,787.35Less: Deprecation (1,617.00) (2,110.15) (2,786.93)-Net Block 5,745.90 6,704.06 10,000.42-Capital Work in Progress 2,318.01 6,435.28 7,077.87
(B) Investment 1,233.40 1,067.11 1,210.01
Current Assets, Loans & Advance:-(A)Current Assets-Inventories 1,209.96 1,328.50 2,204.12-Sundry Debtors 391.46 622.36 737.12-Cash & Bank balance 308.96 60.10 51.56-Loans & Advances 3,199.04 3,865.94 5,105.00Total (A) 5,109.42 5,876.90 8,097.80(B) Less: Current Liabilities & Provisions-Liabilities 2,446.20 2,898.40 2,810.61-Provision 985.81 1,343.71 1,896.34
Total(B) (3,432.01) (4,242.11) (4,706.95)
Net Current Assets 1,677.41 1,634.79 3,390.85
Miscellaneous Expenditure 3.02 3.02 3.19
Total 10,977.74 15,844.26 21,682.34
Profit & Loss Account

Particular 31-03-2009 31-03-2010 31-03-2011

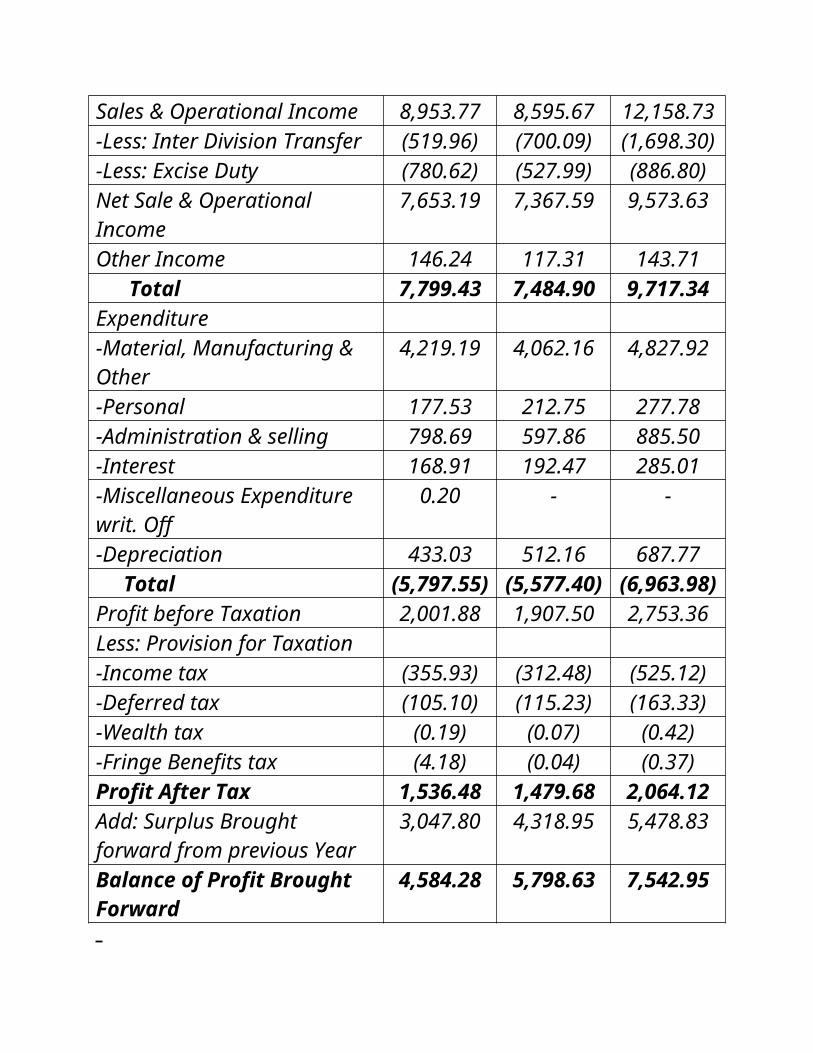
Sales & Operational Income 8,953.77 8,595.67 12,158.73-Less: Inter Division Transfer (519.96) (700.09) (1,698.30)-Less: Excise Duty (780.62) (527.99) (886.80)Net Sale & Operational Income 7,653.19 7,367.59 9,573.63Other Income 146.24 117.31 143.71 Total 7,799.43 7,484.90 9,717.34Expenditure-Material, Manufacturing & Other
4,219.19 4,062.16 4,827.92
-Personal 177.53 212.75 277.78-Administration & selling 798.69 597.86 885.50-Interest 168.91 192.47 285.01-Miscellaneous Expenditure writ. Off
0.20 - -
-Depreciation 433.03 512.16 687.77 Total (5,797.55) (5,577.40) (6,963.98)Profit before Taxation 2,001.88 1,907.50 2,753.36Less: Provision for Taxation-Income tax (355.93) (312.48) (525.12)-Deferred tax (105.10) (115.23) (163.33)-Wealth tax (0.19) (0.07) (0.42)-Fringe Benefits tax (4.18) (0.04) (0.37)Profit After Tax 1,536.48 1,479.68 2,064.12Add: Surplus Brought forward from previous Year
3,047.80 4,318.95 5,478.83
Balance of Profit Brought Forward
4,584.28 5,798.63 7,542.95
Basic Accounting Policies
Basis of Preparation of Financial Statements:

The financial statements are prepared under the historical cost convention, ongoing concern basis and in term of the Accounting standards issued by the Institute of Charterd Accountants of India and in compliance with section 211(3c) of companies Act, 1956
The Company follows the mercantile system of accounting and recognizes income and expenditure on accrual basis to the extent measurable and where there is a certainty of ultimate realization in respect of incomes.
Fixed Assets: Fixed Assets acquired by the company pursuant to a scheme of arrangement are stated at their transfer values.
Intangible Assets: Intangible assets are recognized on the basis of recognized criteria as set out in accounting standard (AS-26)”Intangible Assets”.
Depreciation: Depreciation on fixed assets is provided on straight-line method (SLM) at the rates and in the manner specified in schedule XIV to the companies Act, 1956 Certain Plant & Machinery have been considered as continuous process plant on the basis of technical assessment and depreciation on the same provided for accordingly.
Investment: Long term Investments are carried at the cost provision is made when in the opinion of the management diminution in the
value of investment is other than temporary in nature. Current investments are carried at the lower of cost or market fair value.
Taxes on Income: Provision for current tax is made considering various allowances and benefits available to the company under the provisions of the Income Tax Act, 1961
Director’s Report Financial Result:
(Rs. in crores)
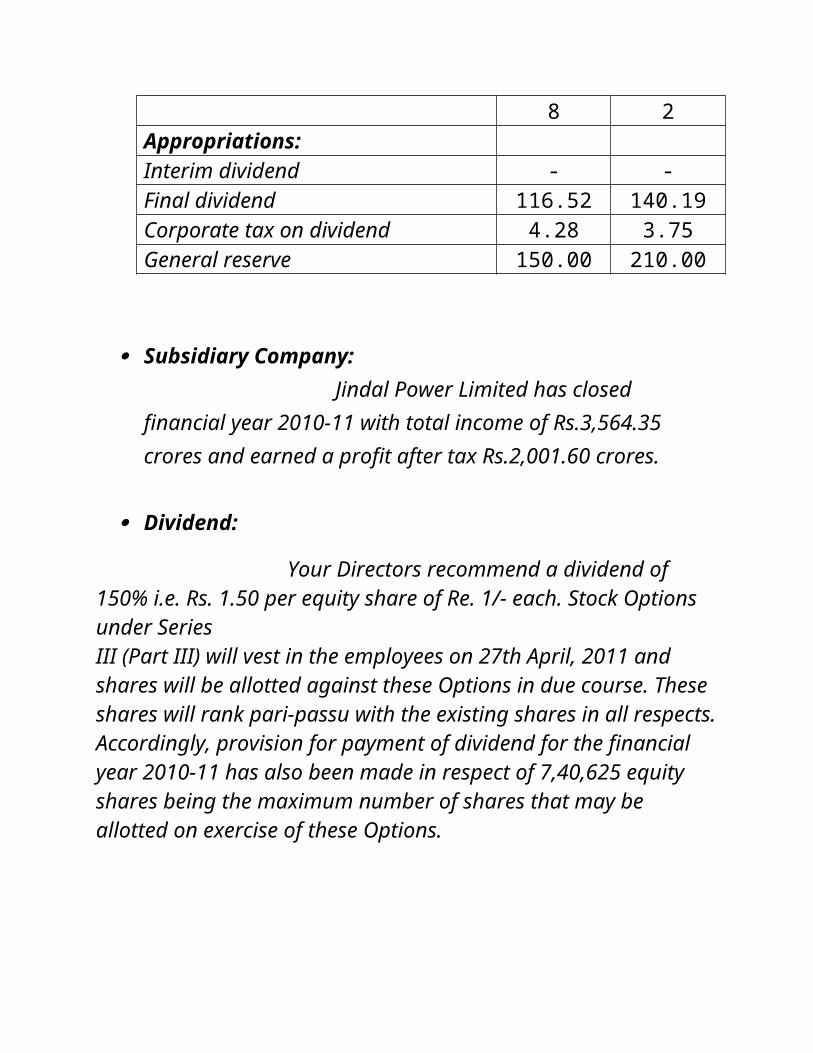
Particular 31-03-2010 31-03-2011Sales & other income 7,484.90 9,717.34Profit before interest and depreciation 2,612.13 3,726.14Profit before tax 1,907.50 2,753.36Profit after tax 1,479.68 2,064.12Appropriations:Interim dividend - -Final dividend 116.52 140.19Corporate tax on dividend 4.28 3.75General reserve 150.00 210.00
Subsidiary Company: Jindal Power Limited has closed financial year 2010-11 with total income of Rs.3,564.35 crores and earned a profit after tax Rs.2,001.60 crores.
Dividend:
Your Directors recommend a dividend of 150% i.e. Rs. 1.50 per equity share of Re. 1/- each. Stock Options under SeriesIII (Part III) will vest in the employees on 27th April, 2011 and shares will be allotted against these Options in due course. These shares will rank pari-passu with the existing shares in all respects. Accordingly, provision for payment of dividend for the financial year 2010-11 has also been made in respect of 7,40,625 equity shares being the maximum number of shares that may be allotted on exercise of these Options.
Corporate Governance:
The company has implanted the conditions of corporate Governance as contained in Clause 49 of listing agreement. Separate

reports on Corporate Governance and Management Discussion and Analysis along with necessary certificates are given elsewhere in this Annual Report.
Future Issue of Capital: The Company has allotted 30,23,507 equity shares of Re.1/- each on various dates against options granted under the Company’s Employee Stock Option Scheme- 2005 during the period under report.
Auditor’s Report

We have audited the attached balance sheet of Jindal Steel & Power Limited, as at 31st March, 2011, the profit & loss Account and the Cash flow statement for the year ended on that date annexed there at these financial statements are the responsibility of the company’s managements. Our responsibility is to express on opinion these financial statements based on our audit.
As required by the companies (Auditor’s Report) Order, 2003 as amended by the companies Auditor’s report amendment order, 2004 (together the ‘order’) issued by the Central Government of India in terms of sub section (4A) of section 227 of the Annexure, a statements on the matters specified in paragraphs 4 & 5 of the said order.
Annexure to Auditor’s Report:
The company has maintained proper recodes showing fall particulars including quantitative detail and situation of fixed assets.
Fixed assets disposed of during the year were not substantial.
The company has not taken any loans, Secured or Unsecured from companies, firm or other parties listed in the register maintained under section 301 of the companies Act, 1956
In our opinion the company has an internal audit system commensurate with the size and nature if it’s business.
Market Value of Equity as on Date:
Meaning and Importance of Ratio
Meaning: “Ratio analysis is process comparison of one figure against another and the interpretation of ratio to known the strengths and weaknesses of firm and its position”.
Importance:
1. Profitability: Useful information about the trend of profitability is available from ratio. The Gross profit ratio, Net profit ratio, And ratio of return on investment give a good idea of profitability of business.
2. Liquidity: In fact, the use of ratio was made initially to ascertain the liquidity of business. The current ratio, liquid ratio, & acid test ratio will tell whether the business will be able to meats its current liabilities as and when they mature.
3. Efficiency: The turnover ratio are excellent guides to measures the efficiency of manager. For example, the stock turnover ratio will indicates how efficient the sale is being made & assets turnover shows the efficiency with which the assets are used in business.
4. Inter-Firm Comparison:
The absolute ratios of a firm are not much use, unless they are compared with similar ratios of the other firm belonging to the same industry.
5. Useful for budgetary Control: Regularly budgetary reports are prepared in business where the system of budgetary control is in use.
6. Useful for Decision Making: Ratios guide the management in making some of the importance decisions. Supposed, the liquidity ratio shows unsatisfactory positions, the management may decide to get additional liquid funds.
Ratio Analysis
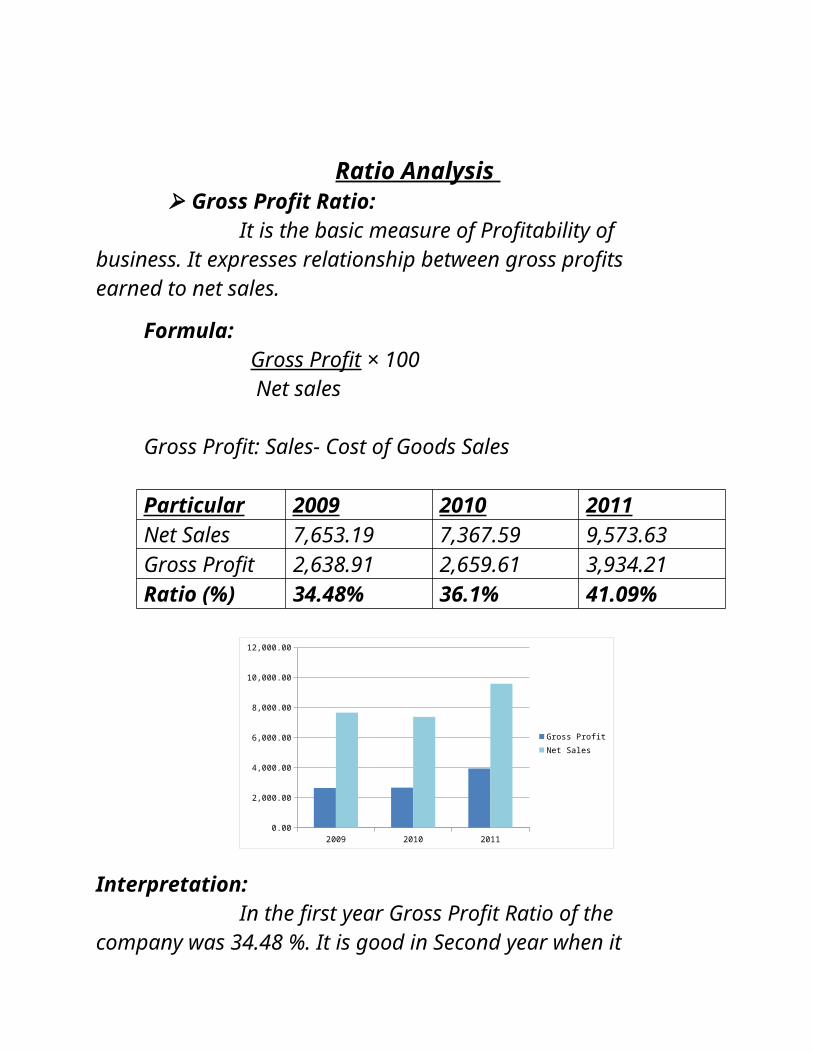
Gross Profit Ratio: It is the basic measure of Profitability of business. It expresses relationship between gross profits earned to net sales.
Formula: Gross Profit × 100
Net sales
Gross Profit: Sales- Cost of Goods Sales
Particular 2009 2010 2011Net Sales 7,653.19 7,367.59 9,573.63Gross Profit 2,638.91 2,659.61 3,934.21Ratio (%) 34.48% 36.1% 41.09%
2009 2010 20110.00
2,000.00
4,000.00
6,000.00
8,000.00
10,000.00
12,000.00
Gross ProfitNet Sales
Interpretation:
In the first year Gross Profit Ratio of the company was 34.48 %. It is good in Second year when it increase and become 36.1 % in the third year it increases and become 41.09 % which is satisfactory for company.
Net Profit Ratio: The net profit is obtained after charging operating Expenses, interest, depreciation and taxes to gross profit.
Formula: Net Profit × 100 Net Sales
Net Profit: Profit after Tax
Particular 2009 2010 2011Net Sales 7,653.19 7,367.59 9,573.63Net Profit 1,581.93 1,479.68 2,064.12Ratio (%) 20.60% 20.08% 21.56%
2009 2010 20110
1000
2000
3000
4000
5000
6000
7000
8000
9000
10000
Net SalesNet Profit
Interpretation:
The Net Profit Ratio of first year and second year was 20.60 % and 20.08 % in which it is decreasing but in the third year it was 21.56 % which has been increasing. The profitability ratio of the company is satisfactory
Operating Ratio: It is a ratio showing relationship cost of good sold plus operating expenses & net sales. It shows the efficiency

of the management. The higher the ratio, the less will be the margin available to proprietors. This ratio is also usually expressed as a percentage.
Formula:
Cost of goods Sales+ Operating Expenses × 100 Net Sales
Particular 2009 2010 2011Net Sales 7,653.19 7,367.59 9,573.63COGS 5014.28 4707.98 5639.42Operating Ex. 143.71 - -Ratio (%) 67.39% 63.90% 58.90%
2009 2010 20110
1000
2000
3000
4000
5000
6000
7000
8000
9000
10000
Net SalesCOGSOperarting EX.
Interpretation:
With the increases in Sales, COGS and Operating Exp. in second year comparing to first year, but at same time the operating ratio decreases from 67.39% to 63.90% and in third year it decreases to 58.90%.
Return on Investment: It is an index of profitability of business & is obtained by comparing Profit before Interest & Taxes with
Capital Employed. The ratio is normally expressed in percentage.
Formula: Profit before Interest & Taxes × 100
Capital Employed
Particular 2009 2010 2011PBIT 2,638.91 2659.61 3790.50Capital Employed 10,374.89 15,103.90 20,799.03Ratio (%) 26.43% 27.61% 18.22%
2009 2010 20110
5000
10000
15000
20000
25000
PBITCapital Employed
Interpretation:
This ratio shows how many capitals used in this ratio. It was 26.43% in 2009, 27.61% in 2010 & 18.22% in 2011.
Return on Shareholder’s Fund:
Profit is earned in business for owners and so they are naturally interested in return they get on their money invested in company’s business.Formula: Net Profit × 100
Owner’s Fund
Particular 2009 2010 2011Owner’s fund 5,388.13 6,723.66 8,687.55Net Profit 1,581.93 1,479.68 2,064.12Ratio (%) 29.35% 22.00% 23.76%
2009 2010 20110
1000
2000
3000
4000
5000
6000
7000
8000
9000
Owner's fundNet Profit
Interpretation: Profit of company decrease in second year but it is increases in third year which may be because of high stock turnover ratio in third year. As a result the company can get higher return on capital provider.
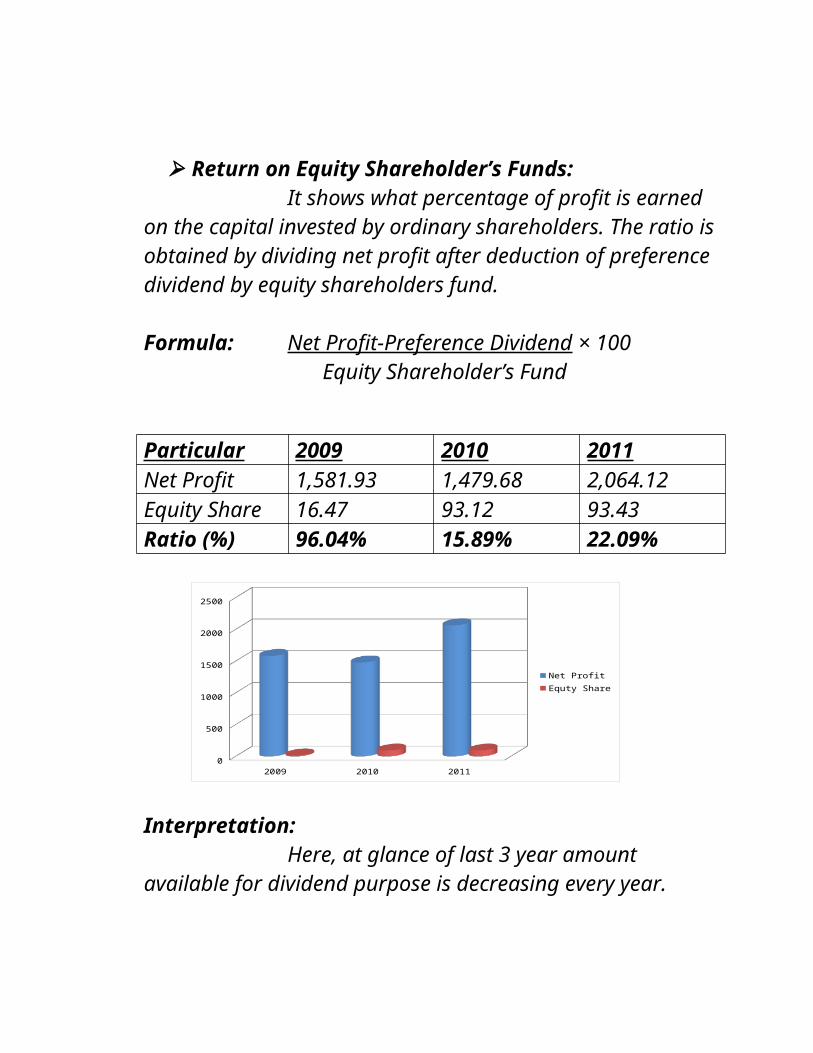
Return on Equity Shareholder’s Funds:

It shows what percentage of profit is earned on the capital invested by ordinary shareholders. The ratio is obtained by dividing net profit after deduction of preference dividend by equity shareholders fund.
Formula: Net Profit-Preference Dividend × 100 Equity Shareholder’s Fund
Particular 2009 2010 2011Net Profit 1,581.93 1,479.68 2,064.12Equity Share 16.47 93.12 93.43Ratio (%) 96.04% 15.89% 22.09%
2009 2010 20110
500
1000
1500
2000
2500
Net ProfitEquty Share
Interpretation:Here, at glance of last 3 year amount available
for dividend purpose is decreasing every year.
Return on Total Assets:

The return on total assets implies how the funds supplied by both owners & creditors are utilized in business.
Formula: Net Profit × 100Total Assets
Particular 2009 2010 2011Net Profit 1,581.93 1,479.68 2,064.12Total Assets 7,619.73 10,377.97 15,129.26Ratio (%) 20.76% 14.26% 13.64%
2009 2010 20110
2000
4000
6000
8000
10000
12000
14000
16000
Net ProfitTotal Assets
Interpretation:Here, as company is getting experienced its
utilization of funds for enterprise is also improving which is good.
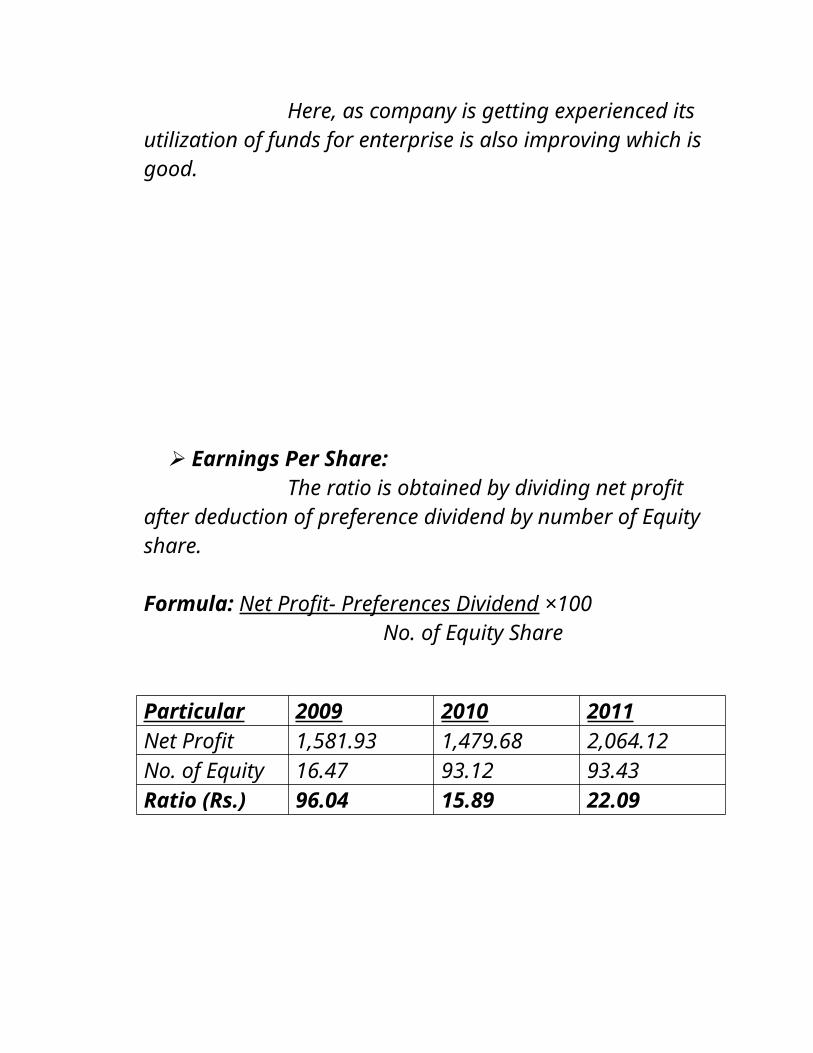
Earnings Per Share:

The ratio is obtained by dividing net profit after deduction of preference dividend by number of Equity share.
Formula: Net Profit- Preferences Dividend ×100No. of Equity Share
Particular 2009 2010 2011Net Profit 1,581.93 1,479.68 2,064.12No. of Equity 16.47 93.12 93.43Ratio (Rs.) 96.04 15.89 22.09
2009 2010 20110
200
400
600
800
1000
1200
1400
1600
Net ProfitNo of Equity
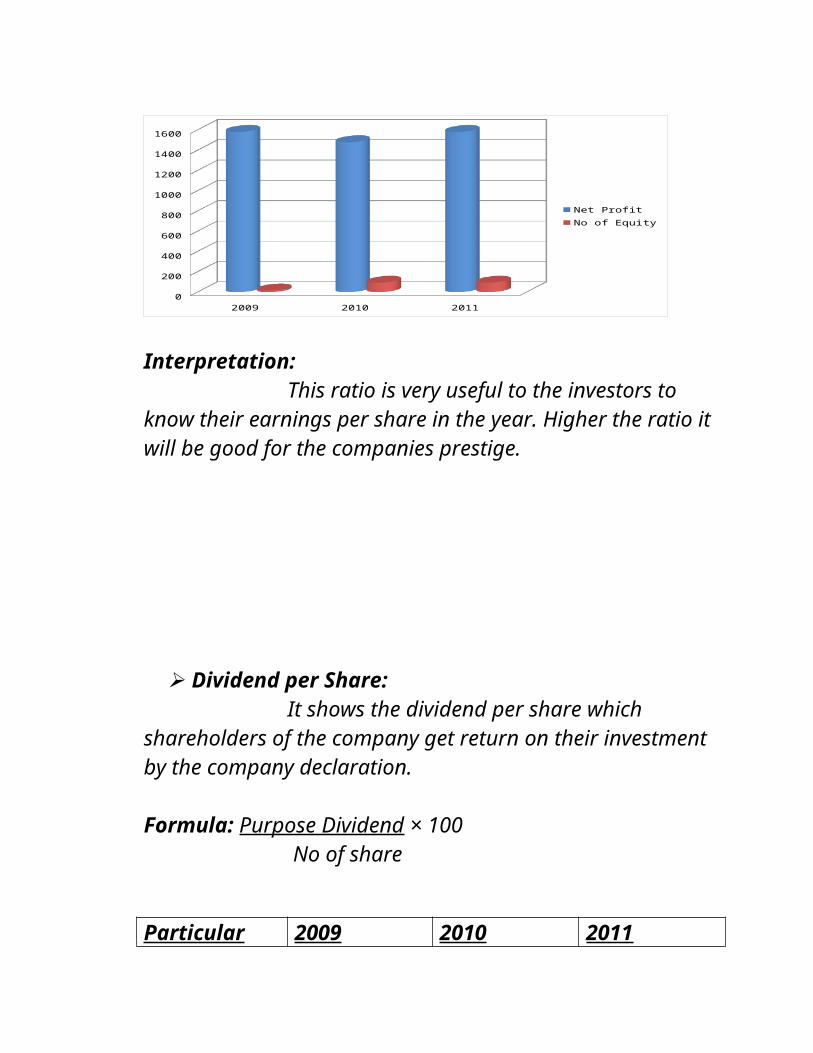
Interpretation:This ratio is very useful to the investors to know
their earnings per share in the year. Higher the ratio it will be good for the companies prestige.
Dividend per Share:

It shows the dividend per share which shareholders of the company get return on their investment by the company declaration.
Formula: Purpose Dividend × 100 No of share
Particular 2009 2010 2011Dividend 85.33 116.52 140.19No of Share 16.47 93.12 93.43Ratio (Rs.) 5.52 1.25 1.50
2009 2010 20110
20
40
60
80
100
120
140
160
DividendNo of Share
Interpretation:This ratio shows the dividend per share. It was
5.52 Rs. in 2009, 1.25 Rs. in 2010 & 1.50 Rs in 2011.
Debt-Equity Ratio:

This ratio shows proportion of funds provided by long term creditors & that provides by shareholders.
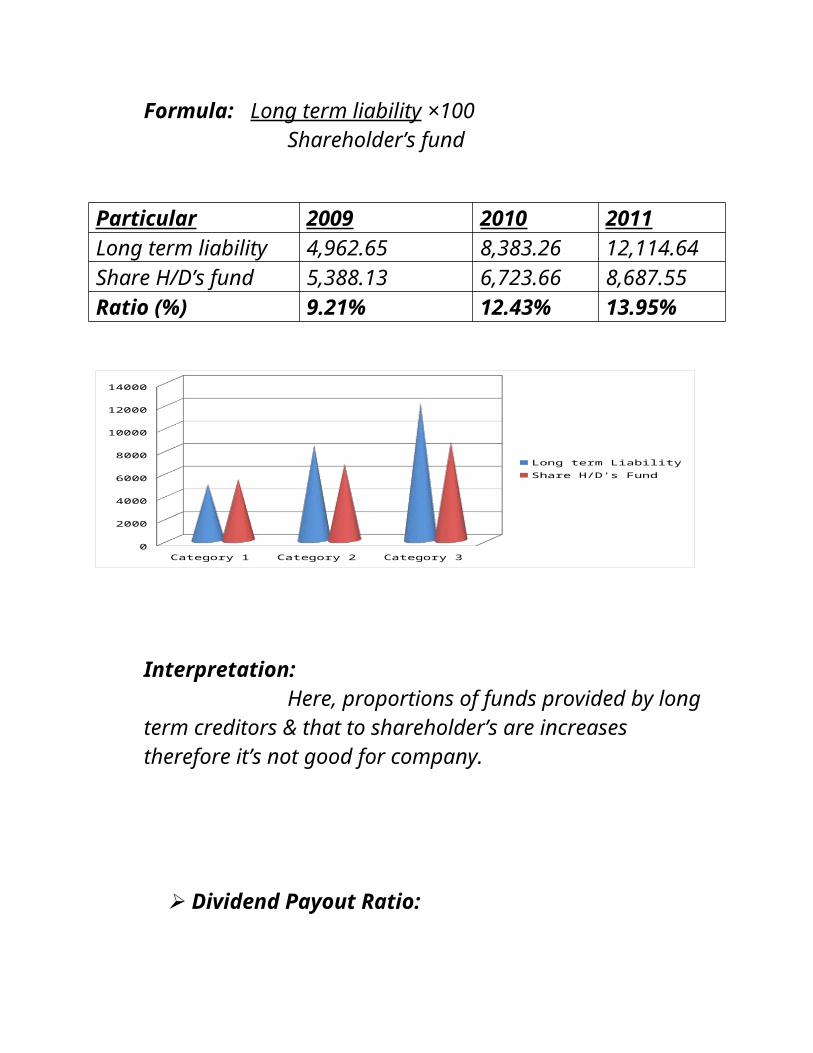
Formula: Long term liability ×100Shareholder’s fund
Particular 2009 2010 2011Long term liability 4,962.65 8,383.26 12,114.64Share H/D’s fund 5,388.13 6,723.66 8,687.55Ratio (%) 9.21% 12.43% 13.95%
Category 1 Category 2 Category 30
2000
4000
6000
8000
10000
12000
14000
Long term LiabilityShare H/D's Fund
Interpretation:Here, proportions of funds provided by long term
creditors & that to shareholder’s are increases therefore it’s not good for company.
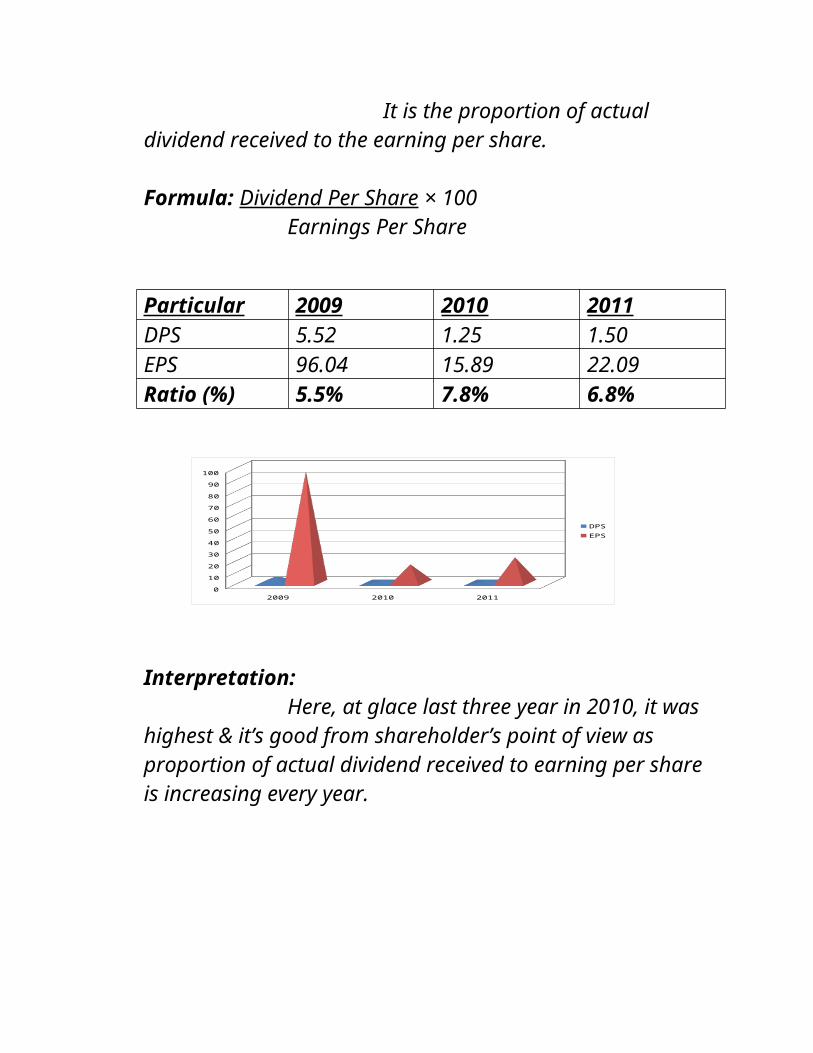
Dividend Payout Ratio: It is the proportion of actual dividend received to the earning per share.
Formula: Dividend Per Share × 100Earnings Per Share
Particular 2009 2010 2011DPS 5.52 1.25 1.50EPS 96.04 15.89 22.09Ratio (%) 5.5% 7.8% 6.8%
2009 2010 20110
10
20
30
40
50
60
70
80
90
100
DPSEPS
Interpretation:Here, at glace last three year in 2010, it was
highest & it’s good from shareholder’s point of view as proportion of actual dividend received to earning per share is increasing every year.
Capital Gearing Ratio:

This ratio indicates the ratio between those capital where interest & dividend pay is compulsory with those capital where dividend payment is not compulsory.
Formula: Fixed Interest bearing Capital Equity share Capital
Particular 2009 2010 2011Fixed Interest bearing Capital 4,962.6
58,383.26 12,114.64
Equity share capital 15.47 93.12 93.43Ratio 32.08 9.02 12.97
2009 2010 20110
2000
4000
6000
8000
10000
12000
14000
Fixed Interest bearing CapitalEquity Share Capital
Interpretation:Capital gearing ratio is continuously decreasing
in given years. It shows that the fixed interest bearing capital is more used compared to the ordinary capital.
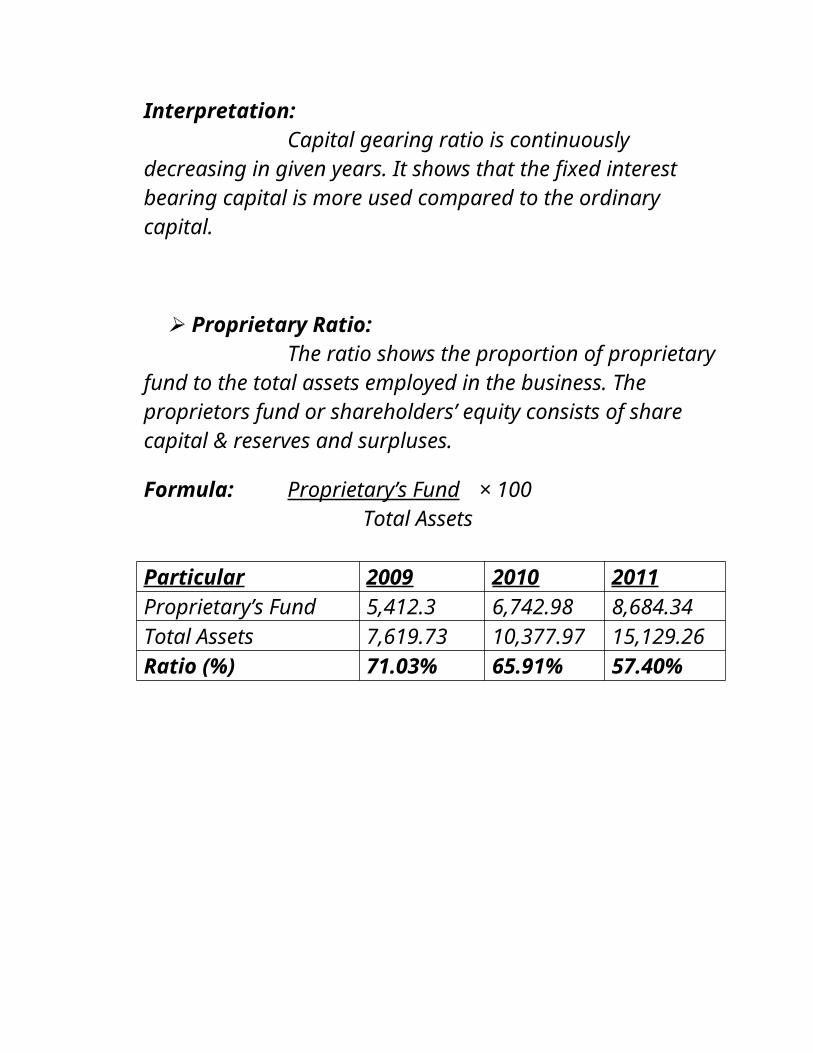
Proprietary Ratio:
The ratio shows the proportion of proprietary fund to the total assets employed in the business. The proprietors fund or shareholders’ equity consists of share capital & reserves and surpluses. Formula: Proprietary’s Fund × 100
Total Assets
Particular 2009 2010 2011Proprietary’s Fund 5,412.3 6,742.98 8,684.34Total Assets 7,619.73 10,377.97 15,129.26Ratio (%) 71.03% 65.91% 57.40%
2009 2010 20110
2000
4000
6000
8000
10000
12000
14000
16000
Proprietary's FundTotal Assets
Interpretation: The higher the ratio the stronger the financial position
of the company as it signifies that the proprietors have provided larger funds to purchases the assets.
Long Term Fund to Fixed Assets:
The fixed assets of business must be purchased out of fixed capital only, which includes share capital, reserve & long term liability. This ratio shows the relationship between fixed capital & fixed assets.
Formula: Long term Liability × 100 Fixed Assets
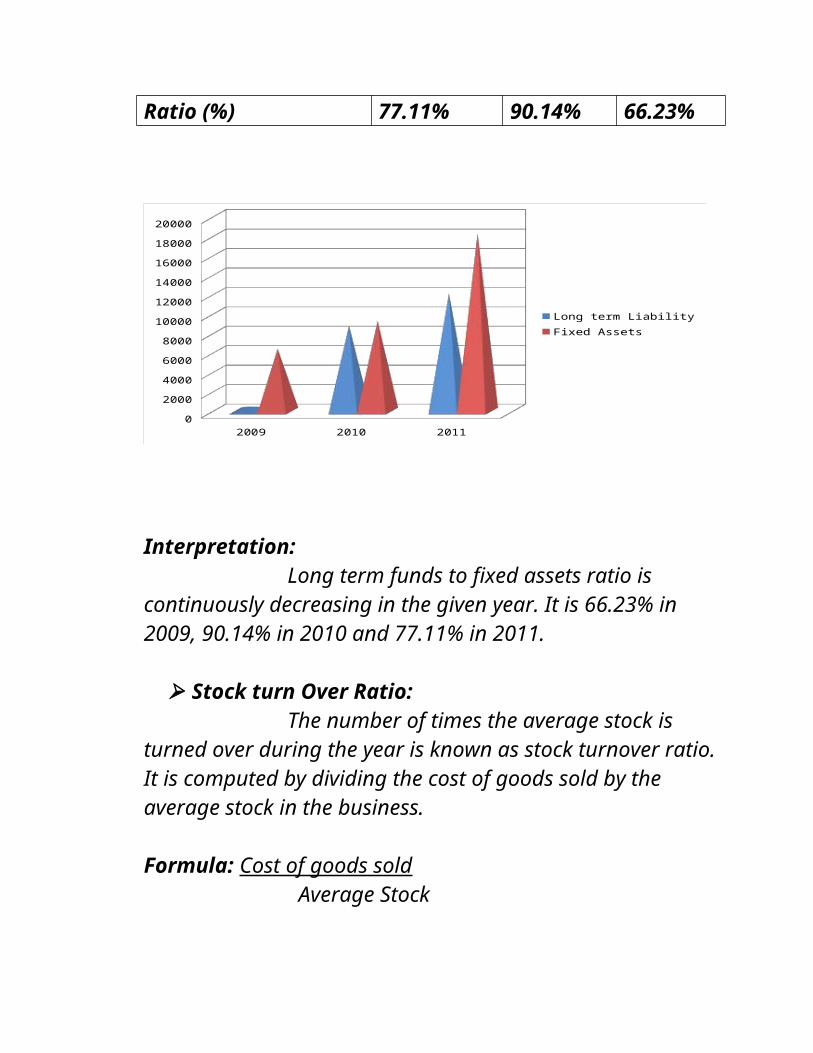
Particular 2009 2010 2011Long term liability 4,942.65 8,783.26 12,114.67Fixed Assets 6,435.64 9,300.33 18,291.49Ratio (%) 77.11% 90.14% 66.23%
2009 2010 20110
2000
4000
6000
8000
10000
12000
14000
16000
18000
20000
Long term LiabilityFixed Assets
Interpretation: Long term funds to fixed assets ratio is continuously decreasing in the given year. It is 66.23% in 2009, 90.14% in 2010 and 77.11% in 2011.
Stock turn Over Ratio:

The number of times the average stock is turned over during the year is known as stock turnover ratio. It is computed by dividing the cost of goods sold by the average stock in the business.
Formula: Cost of goods sold Average Stock
Particular 2009 2010 2011COGS 5014.28 4707.98 5639.42Average Stock 1,095.36 651.72 862.42Ratio 4.58 7.22 6.54
` 2009 2010 20110
1000
2000
3000
4000
5000
6000
COGSAverage Stock
Interpretation:The ratio is very important in judging the ability
of management with which we can move the stock. The higher the turnover ratio, the move profitable the business would be.
Current Ratio:
This is the most widely used ratio which shows the proportion of Current Assets to Current Liabilities. It is also known as Working Capital Ratio.
Formula: Current AssetsCurrent Liability
Particular 2009 2010 2011Current Assets 544.05 2,013.96 2,992.8Current Liability 156.83 2,896.40 2,810.61Ratio 3.47:1 0.7:1 1.06:1
20092010
2011
0
500
1000
1500
2000
2500
3000
Current Assets
Current Liability
Current AssetsCurrent Liability
Interpretation: The ideal Current Ratio is 3.47:1. In first year and
second year the ratio is less than ideal ratio but in third year it is more. It seems that the liquid position is good and there is no unproductive investment in current assets.
Debtor’s Ratio:
The debtor’s ratio shows comparison of debtors plus bill receivable of avg. daily sales. It shows the number of days taken to collect the dues of credit sales. Higher ratio indicates unsatisfactory position, it suggest that the credit & collection policy are weak.
Formula: Debtor + B/R ×365 Credit Sales
Particular 2009 2010 2011Debtor 391.46 622.36 737.12Credit Sales 7,677.83 7,347.44 9,543.47Ratio (Days) 18 30 28
2009 2010 20110
2000
4000
6000
8000
10000
12000
DebtorCredit Sales
Interpretation:Debtor’s ratio is stable in the given years. It is
18days in the 2009, 30days in the 2010 and 28 days in the 2011 respectively. Here company’s credit policy is good for company.
Fixed Assets Turnover Ratio:

The ascertain the efficiency & profitability of business the total fixed assets are compared to sales. The more the sales in relation to amount invested in the fixed assets, the more efficiency is use of fixed assets.
Formula: Net Sales Fixed Assets
Particular 2009 2010 2011Net Sales 7,653.19 7,367.59 9,573.63Fixed Assets 4,322.03 13,139.34 17,078.29Ratio 1.77 0.56 0.56
2009 2010 20110
2000
4000
6000
8000
10000
12000
14000
16000
18000
Net SalesFixed Assets
Interpretation: The ratio shows utilization of fixed assets in the
business. The ratio is low, it indicates that investment in the fixed assets is more than what is necessary & must be reduced.
Total Assets Turnover Ratio:
This ratio measures a firm’s efficiency in utilizing its assets. It indicates how many times the assets were turned over a period & there by generated sales. If assets turnover is high, the company is managing its assets efficiently. If it is low, it means the company has more assets than it really needs for its operation.
Formula: Net Sales Total Sales
Particular 2009 2010 2011Net Sales 7,653.19 7,367.59 9,573.63Total Assets 4,866.08 15,150.3 20,071.09Ratio 1.57 0.49 0.48
2009 2010 20110
5000
10000
15000
20000
25000
Net SalesTotal Assets
Interpretation:The Total assets turnover ratio shows the
efficiency of managing its assets. Higher the ratio, it’s better for the company.
Current Assets turnover Ratio:

This ratio is computed to ascertain how efficiency working capital is utilized in business.
Formula: Net Sales Current Assets
Particular 2009 2010 2011Net Sales 7,653.19 7,367.59 9,573.63Current Assets 544.05 2,010.96 2,992.8Ratio 14.08 3.66 3.20
2009
20102011
0
1000
2000
3000
4000
5000
6000
7000
8000
9000
10000
Current Assets
Net Sales
Current AssetsNet Sales
Interpretation:Average industrial ratio must be 2 so, it’s around
last two years which is good & shows that working capital is being utilized nicely.
Limitation of Ratio Analysis
1) Single year ratio have limited utility: The utility of ratio computed from the financial statement of one year only is obviously limited.
2) Other factor must be considered: While comparing ratio of different firms, it must be remember that different firms follow different accountancy plans and policies.
3) Lack of Standard Ratio: There is practically no standard ratio against which the actual performance can be compared.
4) Other factors Important: Financial result of business depend upon a number of factor such as general economic condition and competition, local factor and the policy adopted by management.
5) Ratio of two irrelevant Figures: Ratio must be established between related matters. It is of no use if ratios are found between two figures.
Common Size Balance Sheet

Particulars (` in crores) Common Size (`)2009 2010 2011 2009 2010 2011
SOURCES OF FUNDS:
Share Capital 867.70 93.12 93.43 15.76 0.62 0.46Reserve and Surplus
1,499.84
6,630.54 8,594.12 27.28 43.89 42.53
Long Term LoansSecured Loan 3,132.7
64,235.16 5,530.93 56.96 28.03 27.37
Unsecured Loan - 4,148.10 6,583.74 - 27.46 32.58TOTAL 5,500.3 15,106.92 20,208.22 100 100 100
APPLICATION OF FUNDS:
Fixed Assets 4,322.03
13,139.34 17,078.29 76.94 82.94 78.78
Investment 244.43 1,067.11 1,210.01 4.35 6.74 5.58
Current Assets 1,538.19
5,876.90 8,097.80 27.38 37.10 37.35
- Current Liabilities
(487.08) (4,242.11) (4,706.95) (8.6) (26.78) (21.71)
TOTAL 5,617.57
15,841.24 21,679.15 100 100 100

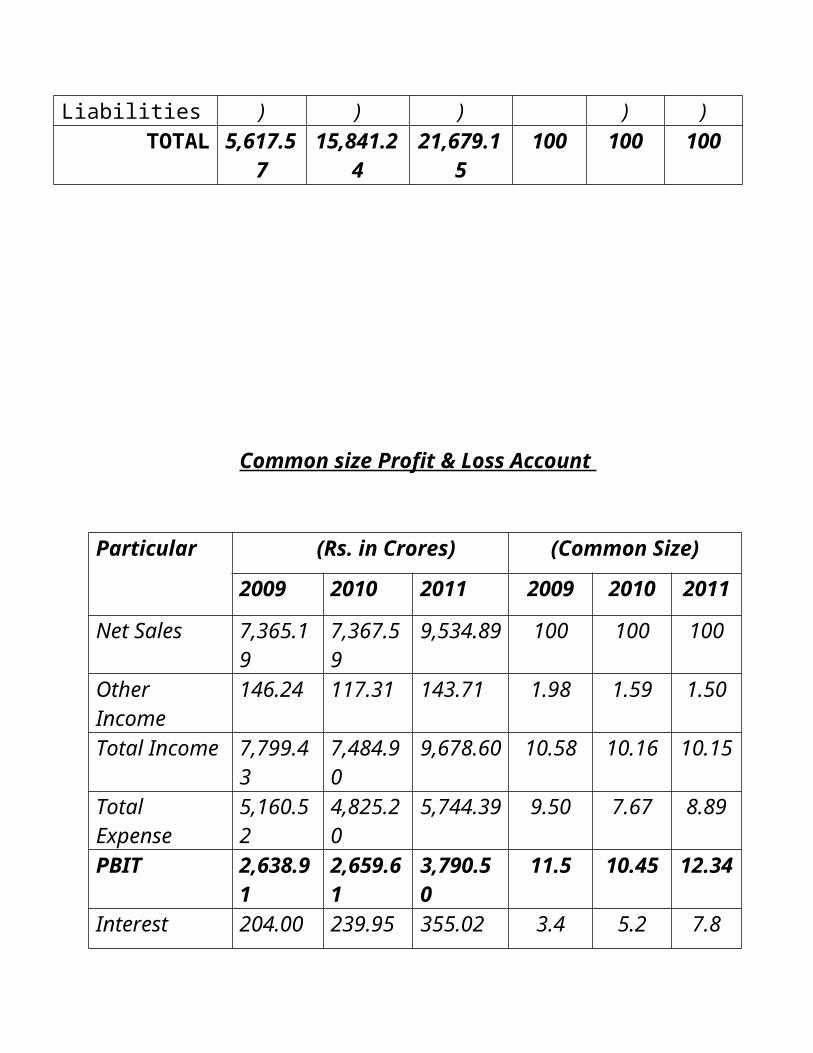
Common size Profit & Loss Account
Particular (Rs. in Crores) (Common Size)
2009 2010 2011 2009 2010 2011
Net Sales 7,365.19 7,367.59 9,534.89 100 100 100
Other Income 146.24 117.31 143.71 1.98 1.59 1.50
Total Income 7,799.43 7,484.90 9,678.60 10.58 10.16 10.15
Total Expense 5,160.52 4,825.20 5,744.39 9.50 7.67 8.89
PBIT 2,638.91 2,659.61 3,790.50 11.5 10.45 12.34
Interest 204.00 239.95 355.02 3.4 5.2 7.8
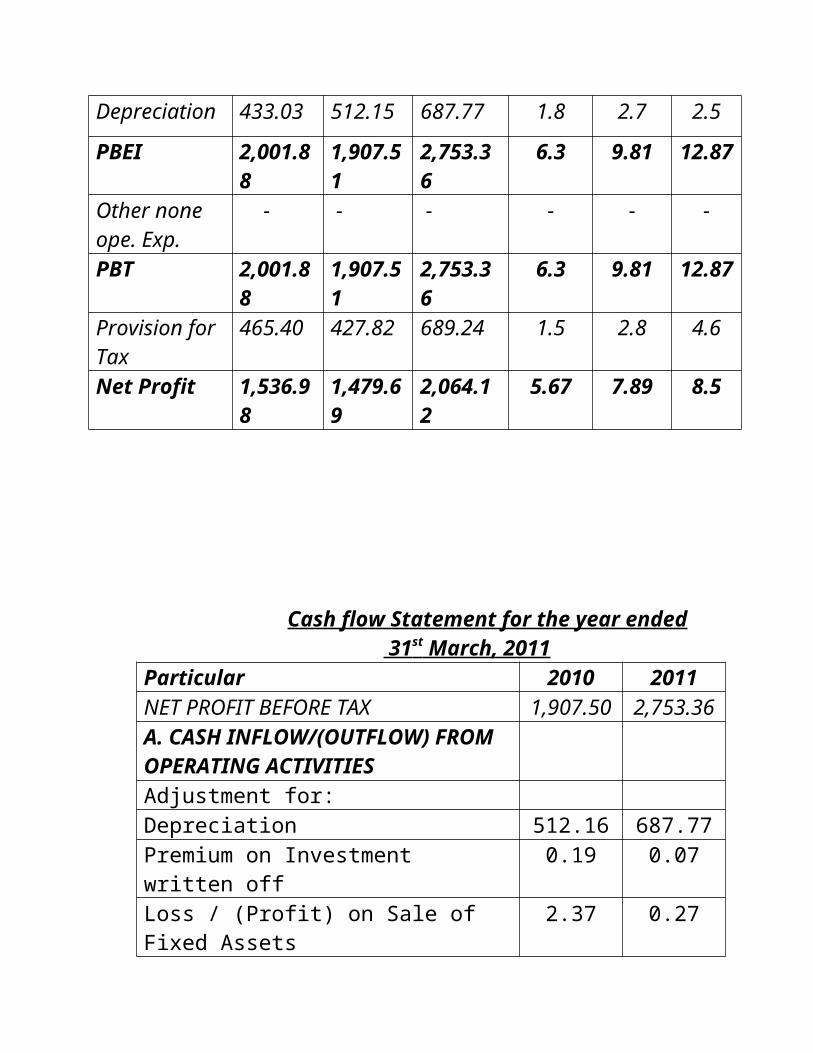
Depreciation 433.03 512.15 687.77 1.8 2.7 2.5
PBEI 2,001.88 1,907.51 2,753.36 6.3 9.81 12.87
Other none ope. Exp.
- - - - - -
PBT 2,001.88 1,907.51 2,753.36 6.3 9.81 12.87
Provision for Tax
465.40 427.82 689.24 1.5 2.8 4.6
Net Profit 1,536.98 1,479.69 2,064.12 5.67 7.89 8.5

Cash flow Statement for the year ended 31 st March, 2011
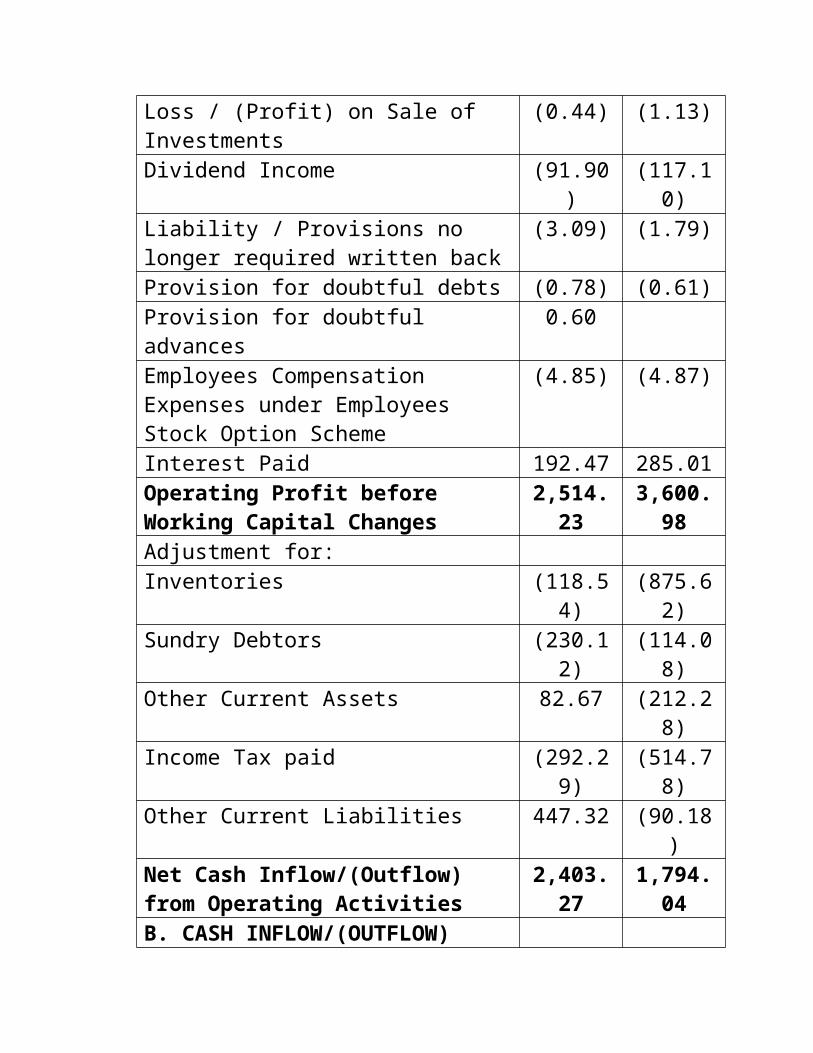
Particular 2010 2011NET PROFIT BEFORE TAX 1,907.50 2,753.36A. CASH INFLOW/(OUTFLOW) FROM OPERATING ACTIVITIESAdjustment for:Depreciation 512.16 687.77Premium on Investment written off 0.19 0.07Loss / (Profit) on Sale of Fixed Assets 2.37 0.27Loss / (Profit) on Sale of Investments (0.44) (1.13)Dividend Income (91.90) (117.10)Liability / Provisions no longer required written back
(3.09) (1.79)
Provision for doubtful debts (0.78) (0.61)Provision for doubtful advances 0.60Employees Compensation Expenses under Employees Stock Option Scheme
(4.85) (4.87)
Interest Paid 192.47 285.01Operating Profit before Working Capital Changes
2,514.23 3,600.98
Adjustment for:Inventories (118.54) (875.62)Sundry Debtors (230.12) (114.08)Other Current Assets 82.67 (212.28)Income Tax paid (292.29) (514.78)Other Current Liabilities 447.32 (90.18)Net Cash Inflow/(Outflow) from Operating Activities
2,403.27 1,794.04
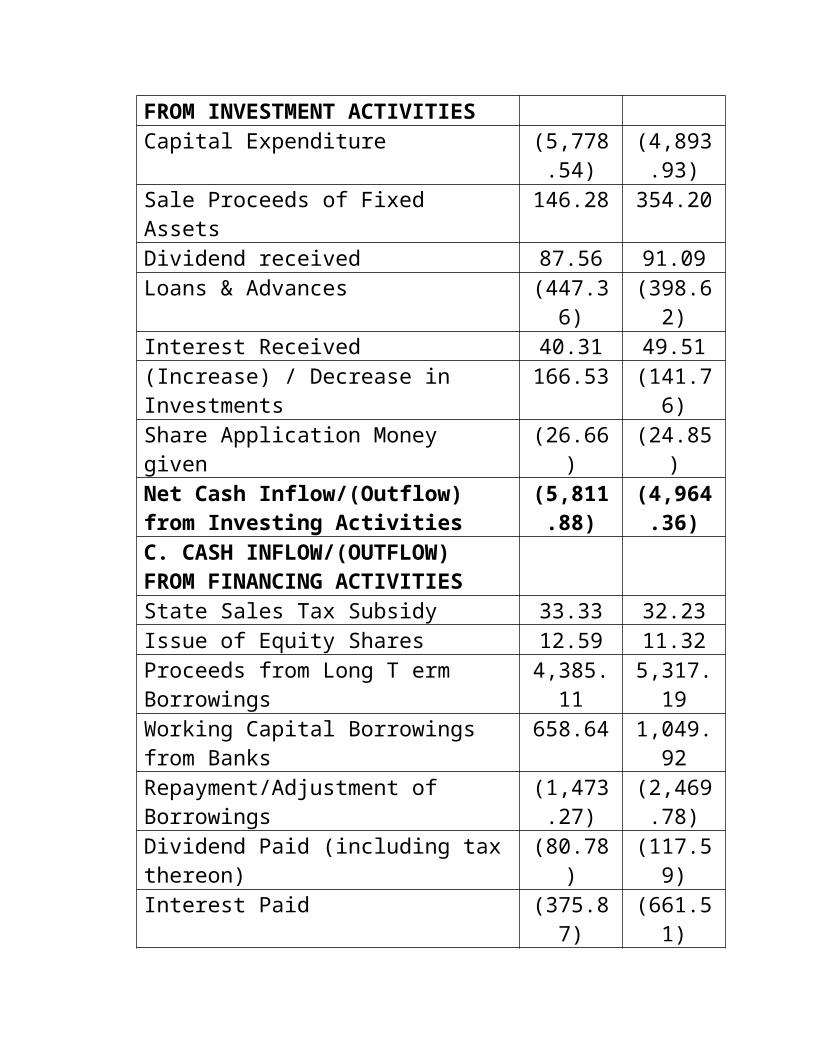
B. CASH INFLOW/(OUTFLOW) FROM INVESTMENT ACTIVITIESCapital Expenditure (5,778.54) (4,893.93)Sale Proceeds of Fixed Assets 146.28 354.20Dividend received 87.56 91.09

Loans & Advances (447.36) (398.62)Interest Received 40.31 49.51(Increase) / Decrease in Investments 166.53 (141.76)Share Application Money given (26.66) (24.85)Net Cash Inflow/(Outflow) from Investing Activities
(5,811.88) (4,964.36)
C. CASH INFLOW/(OUTFLOW) FROM FINANCING ACTIVITIESState Sales Tax Subsidy 33.33 32.23Issue of Equity Shares 12.59 11.32Proceeds from Long T erm Borrowings 4,385.11 5,317.19Working Capital Borrowings from Banks 658.64 1,049.92Repayment/Adjustment of Borrowings (1,473.27) (2,469.78)Dividend Paid (including tax thereon) (80.78) (117.59)Interest Paid (375.87) (661.51)Net Cash Inflow/(Outflow) from Financing Activities
3,159.75 3,161.78
Net Cash Inflow/(Outflow) from Financing Activities
(248.86) (8.54)
Cash & Cash equivalents (Opening Balance)
308.96 60.10
Cash & Cash equivalents (Closing Balance)
60.10 51.56
Leverage Analysis

Particular 2010 2011Sales 7,347.44 9,543.47-Variable Cost (4,852.49) (5,998.43)Contribution 2494.95 3545.04-Fixed Cost (724.91) (965.55)EBIT 1770.04 2579.49-Interest on debt (331.66) (483.22)EBT 1438.38 2096.27-Tax (427.78) (688.87)EAT 1010.6 1407.4-Pre. Share - -Earning to S/H 1010.6 1407.4
Operating Leverage: Contribution EBIT
Particular 2010 2011Contribution 2494.95 3545.04EBIT 1770.04 2529.49Operating Leverage 1.41 1.40
Financial Leverage: Earnings before interest and tax Earnings after tax
Particular 2010 2011EBIT 1770.04 2529.49EBT 1438.38 2096.27Financial Leverage 1.23 1.21
Combined Leverage:

Operating Leverage × Financial Leverage
Particular 2010 2011OL 1.41 1.40FL 1.23 1.21Combined Leverage 1.73 1.69
Earning to Equity Shareholder Per Share: Earning to Shareholder
No. of Equity Share
Particular 2010 2011Earning to S/H 1010.6 1407.4No. of Equity Share 93.12 93.43Earnings per Share 10.85 15.06
Stock Market Price in Comparison withBSE & NSE

For the year 2011
Equity ShareBSE NSE
High (Rs.) Low (Rs.) High (Rs.) Low (Rs.)January 728.75 710.40 728.90 709.10February 668.00 629.45 671.00 628.15March 676.00 661.00 675.50 660.35April 703.00 694.55 703.50 695.00May 679.80 647.35 681.05 646.70June 659.50 652.50 658.05 650.55July 657.00 643.60 657.45 645.00August 589.40 557.00 591.00 557.25September 524.90 496.65 526.10 496.35October 504.50 500.15 524.90 500.00November 563.10 545.10 564.05 545.55December 530.85 519.00 530.55 518.80
BSE Diagram:

Januar
y
Febru
ary
Mar
chApril
May
June
July
August
Septem
ber
October
November
Decem
ber0
100
200
300
400
500
600
700
800
Low (Rs)High (Rs)
NSE Diagram:
January
Febru
ary
March
AprilMay
JuneJuly
August
Septem
ber
October
November
December
0
100
200
300
400
500
600
700
800
Low (Rs)
High (Rs)
Low (Rs)High (Rs)

Social Responsibility of Company
Excellence at JSPL is not restricted to our business; it encompasses community partnership and respect for the environment.
JSPL is running co-educational school at Raigarh, Tammar,nalwa, Angul and Potrata where quality education is being imparted to over 10,000 students.
O.P.Jindal Globle University, it is a non-profit globleUniversity establish by the Haryana Private University Act, 2009
JSPL has a mobile wan and Hakeadeepa health center withX-ray and lab facility has been operated and about 12,609 person examined.
Product of Company Steel
Power Mining Infrastructure Sector
Conclusion
The company is committed to the application of best management practices. It is these value and guldens that will give a firm foundation for future growth of company.
Bibliography WWW.Google.Com (Search Engine)
WWW.Jindalsteelpower.Com WWW.Moneycontrol.com
Declaration I, hereby declare that the Project “Jindal Steel & Power Limited” is original to the best of my knowledge and has not been published
elsewhere. This is for the purpose of partial fulfillment of Gujarat University requirement for the award of the degree of Bachelor of Business Administration.
Parmar Bhargav G.Roll No.: 85Class: SY BBADivision: B