JICA CenterTokyo- Date: 5th June 2017eneken.ieej.or.jp/data/7388.pdf · Location: Located within...
25
JICA Center- Tokyo Date: 5 th June 2017 Prepared by: Nadia Obeydi IEEJ:July 2017 © IEEJ2017
Transcript of JICA CenterTokyo- Date: 5th June 2017eneken.ieej.or.jp/data/7388.pdf · Location: Located within...

JICA Center- Tokyo Date: 5th June 2017
Prepared by: Nadia Obeydi
IEEJ:July 2017 © IEEJ2017

1. Afghanistan at Glance. 2. Organization & role of Da Afghanistan Breshna Sherkat (DABS) 3. Energy reserves. 4. Current Energy Policy and Measures. 5. Past Energy Demand and Supply 6. Energy demands by sector 7. Energy Prices 8. Outlook of Energy demand and supply. 9. Major difficulties and bottlenecks currently faced. 10. Target/Expectation from this Training Program in Japan.
IEEJ:July 2017 © IEEJ2017

Location: Located within South Asia and Central Asia. Capital City: Kabul Currency: Afghani Provinces: 34 Provinces. Each province encompasses a number of districts and led by a governor who
is appointed by the president of Afghanistan. Population: 29.2 Million Estimated in the year 1395 (2016). Area: 652’864 sq KM (251’827 sq miles) Life expectancy: 59 years (men), 62 years (women) Major religion: More than 99 percent of Afghans are Muslims: 1 percent other
religions.
IEEJ:July 2017 © IEEJ2017

Major Sports: Cricket, Football, Boz Kashi etc. Major cities: Balkh, Herat, Nangarhar, Kandahar etc. Historical Places: Balkh,Bamyan, Helamad etc. President : Mohammad Ashraf Ghani Ahmadzai Climate: has four seasons ,beautiful Spring, with hot summer and very
cold winter
IEEJ:July 2017 © IEEJ2017
Average household: comprises 6.3 members. Education: In 2015, over 9.2 million students (39 percent female) and
(61 percent male) attended schools, according to the Education Ministry. However, there are still significant obstacles to education: lack of funding, unsafe school buildings, cultural norms, lack of qualified teachers.
Media: private TV stations, Radio, new papers, internet access.
IEEJ:July 2017 © IEEJ2017

The Gross Domestic Product (GDP) in Afghanistan was worth 19.30 billion US dollars in 2015. The GDP value of Afghanistan represents 0.03 percent of the world economy. GDP in Afghanistan averaged 5.88 USD Billion from 1960 until 2015, reaching an all time high of 20.54 USD Billion in 2012 and a record low of 0.54 USD Billion in 1960. Afghanistan GDP Last Previous Highest Lowest Unit
GDP Annual Growth Rate -2.40 2.20 28.60 -2.40 percent
GDP 19.30 20.05 20.54 0.54 USD Billion
GDP per capita 619.80 632.10 651.00 372.90 USD
GDP per capita PPP 1808.00 1844.00 1899.30 1088.00 USD
USD 19.3 billion
IEEJ:July 2017 © IEEJ2017
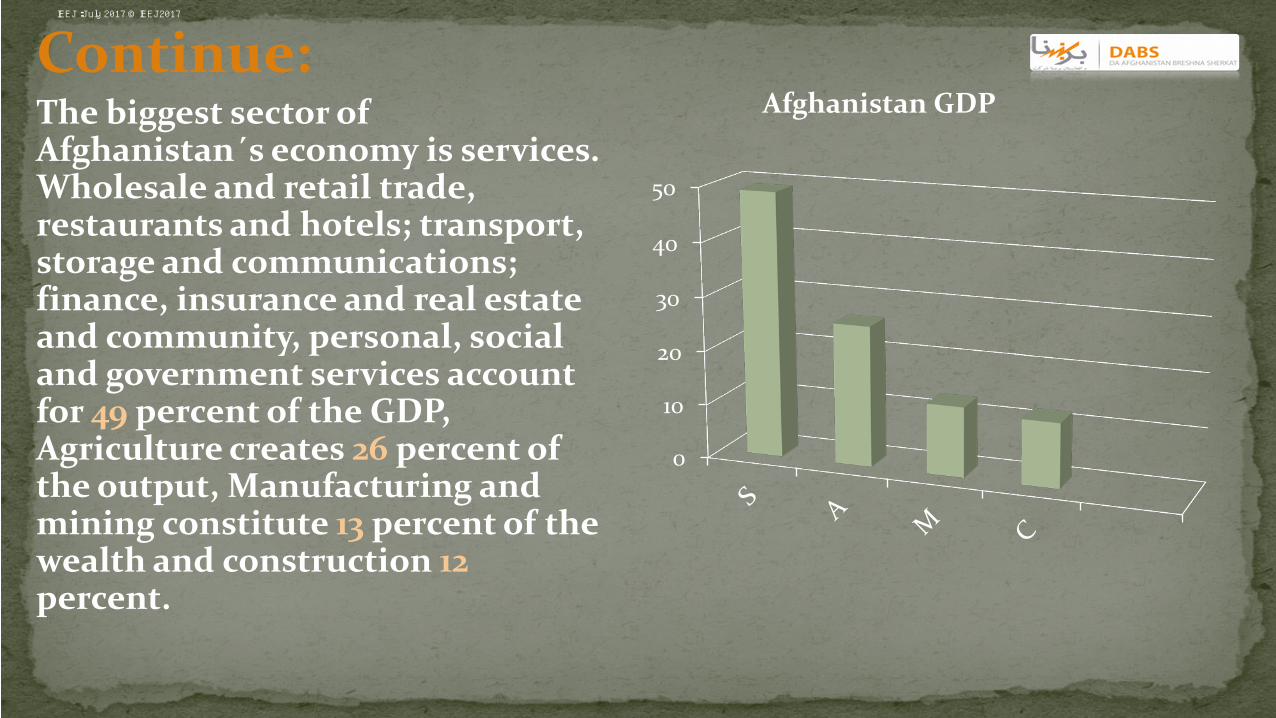
Continue: The biggest sector of Afghanistan´s economy is services. Wholesale and retail trade, restaurants and hotels; transport, storage and communications; finance, insurance and real estate and community, personal, social and government services account for 49 percent of the GDP, Agriculture creates 26 percent of the output, Manufacturing and mining constitute 13 percent of the wealth and construction 12 percent.
0
10
20
30
40
50
Afghanistan GDP
IEEJ:July 2017 © IEEJ2017

• The Government of Afghanistan corporatized the National Electricity Service Department Da AFGHANISTAN BRESHNA MOSSASA (DABM) into an independent state owned utility as such, all assets, staff and other Rights and Obligations of (DABM) were transferred to DA AFGHANISTAN BRESHNA SHERKAT (DABS).
• DABS is an independent and autonomous 100% State-owned corporation, incorporated on 4th May 2008 (15 Saur 1387). DABS has been established under The Corporations and Limited Liabilities Law of the Islamic Republic of Afghanistan (IROA). DABS have sole authority to run its operations and appoint the required staff according to its legal framework (Articles of Incorporation, Bylaws)
45%
35%
10% 10%
DABS SHARES ARE OWNED BY MINISTRIES Ministry of Finance
Ministry of Energy and Water
Ministry of Economy
Ministry of Urban Development Affairs
IEEJ:July 2017 © IEEJ2017

Afghanistan has rich reserves of coal in Takhar and Badkhshan Province.
Afghanistan has 3.8 billion barrels of oil in Balkh and jowzjan province
Solar and wind power.(10MW in Kandahar and 1MW in Bamyan)
Many natural rivers and reservoirs available in the country. Therefore Hydropower is widely used for generating of electricity.
IEEJ:July 2017 © IEEJ2017

Distributing of electricity to all over the country with reasonable price. To generate electricity at low cost by utilizing the water resources available in
the country. strengthening of Transmission & Distribution networks. To import electricity form neighborhood country with low cost. Tariff adjustments for variation in currency exchange rates and Cost of
purchasing electricity. Improve the quality and quantity of energy services. Distribution of electricity bills on fixed period of time Utilizing renewable Energy Economic growth and development as well as public welfare..
IEEJ:July 2017 © IEEJ2017

Duties and responsibilities of DABS. Having Valid License/work permit for generation, transmission, distribution
and import of electricity. Construction of Standard substations. Usage of DABS Property, lands, building the buildings and the equipment that
shall be used for generation, transmission and distribution of electricity energy.
Implementation and Publishing of approved Tariff. Non-discriminatory access of the electricity energy service providers to the market. Delivery of Payments to the Government Account. Violations and Disciplinary Actions. Regulation of electricity related affairs throughout the country.
IEEJ:July 2017 © IEEJ2017
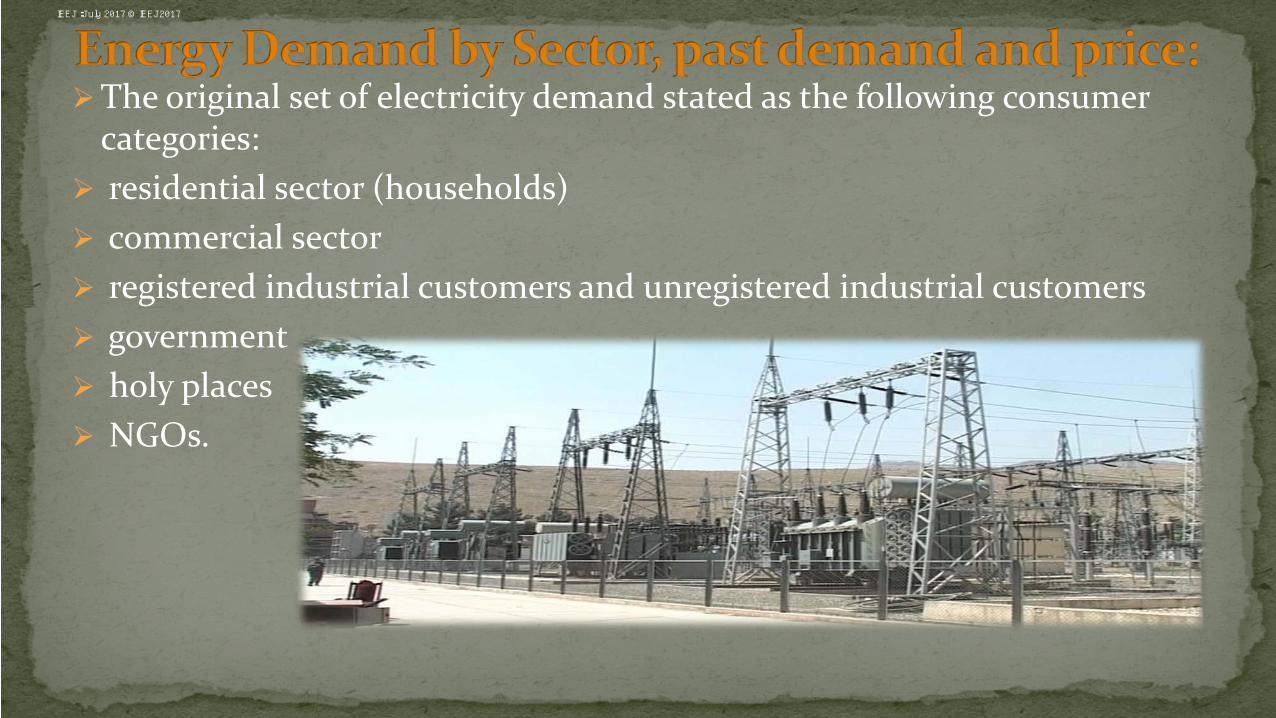
The original set of electricity demand stated as the following consumer categories:
residential sector (households) commercial sector registered industrial customers and unregistered industrial customers government holy places NGOs.
IEEJ:July 2017 © IEEJ2017

Descriptions Fiscal Year 2013 2014 2015 2016
Electric
Power Demand
(GWh)
Household 2328.25 2430.65 2386.65 2461.1 Agriculture 139.69 145.83 143.19 147.66 Commercial 1396.95 1458.39 1431.99 1476.66 Industries 791.6 826.421 811.46 836.77
Others Total 4656.5 4861.3 4773.3 4922.2
Maximum Peak Load (MW)[Date] 530 554 544 561 Annual Load Factor(%) 70 75 76 80
Transmission/Distribution Loss(%) 15/34 14/32 13/28 13/25
Power Supply Reserve Margin(%)
Generating Capacity
(MW)
Hydro-electric
Conventional 142 142 152 250
Pumped Storage 0 0 0 0
Sub-total 142 142 152 250
Thermal
Coal 0 0 0 0 Oil-Based 0 0 0 0
Gas Turbine 50 50 50 50
Combinedd 0 0 0 0 Diesel 285 297 308 314
Sub-total 335 347 358 364 Nuclear Power 0 0 0 0 Wind Power/solar 1 0 0 0 Geothermal 0 0 0 0 Others (Import) 368 381 405 424
Total 846 870 915 1038 Rural Electrification(%) 7 8 9 11 Number of Customers 1215000 1348500 1413000 1575000 Number of Employees 6500 7000 8500 9000 Average Power Rate(Yen/kWh)* 7 8 8 9
IEEJ:July 2017 © IEEJ2017

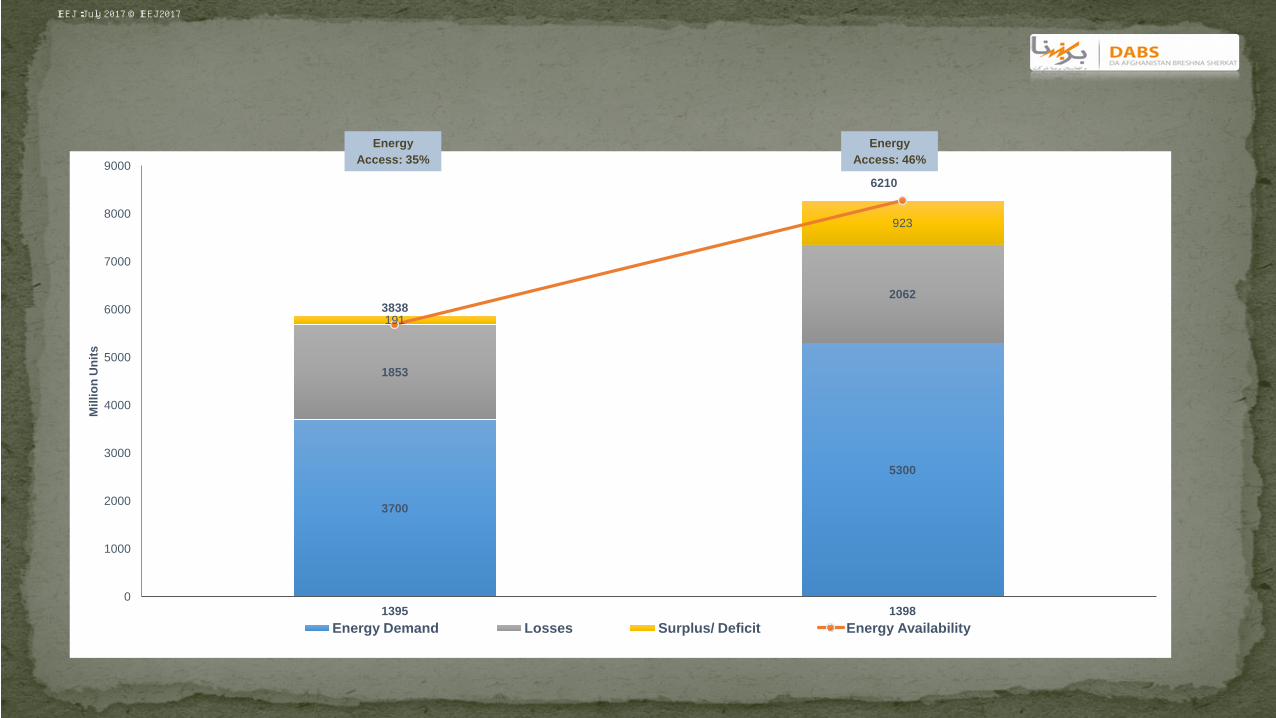
There is a greater demand for energy and the demand will still increase in the future. Capital investments for strengthening of Transmission & Distribution network coupled with Electrification of households will lead to 11% increase in energy access till year 1398. Power supply will significantly improve with construction of inter-regional transmission lines, new tie-ups for importing power and participation of private sector in domestic generation. Additional power availability along with increased network capacity will help DABS in meeting the demand currently constrained by power shortages and weak power system infrastructure.
IEEJ:July 2017 © IEEJ2017

14912 16284
17950 19786
0
5000
10000
15000
20000
25000
1395 1396 1397 1398
Potential Demand (MU)
IEEJ:July 2017 © IEEJ2017
3700
5300
1853
2062
191
923
3838
6210
0
1000
2000
3000
4000
5000
6000
7000
8000
9000
1395 1398
Mill
ion
Uni
ts
Energy Demand Losses Surplus/ Deficit Energy Availability
Energy Access: 35%
Energy Access: 46%
IEEJ:July 2017 © IEEJ2017

Electrical energy imports from below countries: Iran Tajikistan Turkmenistan Uzbekistan The table below shows system costs and average annual electricity costs.
The weighted average electricity cost for the complete planning period is estimated to 55.7 USD/MWh. The overall costs for electricity are significant higher as in the base variant between 2020 and
2026. This results in significant higher overall costs and higher average electricity costs.
IEEJ:July 2017 © IEEJ2017

A
nn
ual
el
ectr
icit
y ge
ner
atio
n
To
tal
elec
tric
ity
gen
erat
ion
Gen
erat
ion
capa
city
cos
t
O
PEX
dom
esti
c ge
ner
atio
n
C
oal
D
iese
l
N
atu
ral_
Gas
El
ectr
icit
y im
port
A
nn
ual
sys
tem
co
st
A
vera
ge
ann
ual
cos
t (i
ncl
udi
ng
gen
erat
ion
capa
city
A
vera
ge
ann
ual
cos
t (e
xclu
din
g ge
ner
atio
n ca
paci
ty
[GWh] [mioUSD] [mioUSD] [mioUSD] [mioUSD] [mioUSD] [mioUSD] [mioUSD] [USD/MWh] [USD/MWh] 2012 3881 0.0 17 0 30 10 86 144 37.0 37.0 2013 4337 0.0 19 0 49 11 101 179 41.3 41.3 2014 4827 0.0 20 0 80 11 116 227 47.1 47.1 2015 5335 0.0 22 0 114 11 132 279 52.2 52.2 2016 5594 0.0 21 0 102 11 144 278 49.8 49.8 2017 6620 28.8 27 0 144 22 162 384 58.1 53.7 2018 7297 52.1 27 0 25 31 200 335 45.9 38.8 2019 7833 52.1 28 0 43 32 220 376 48.0 41.4 2020 10839 284.1 62 17 0 78 196 638 58.8 32.6 2021 11388 284.1 65 24 7 79 214 673 59.1 34.1 2022 12091 306.8 56 1 3 80 264 710 58.8 33.4 2023 12799 306.8 59 4 5 81 294 751 58.6 34.7 2024 13472 306.8 60 8 9 81 326 791 58.7 35.9 2025 14191 306.8 63 16 2 81 357 826 58.2 36.6 2026 14909 306.8 66 22 17 81 386 879 59.0 38.4 2027 15685 543.3 78 16 3 72 239 950 60.6 26.0 2028 16492 543.3 84 23 22 75 258 1006 61.0 28.1 2029 20842 744.3 125 105 6 81 363 1423 68.3 32.6 2030 21725 744.3 133 125 8 81 390 1482 68.2 33.9 2031 22649 815.3 142 132 16 80 360 1545 68.2 32.2 2032 23617 836.5 151 148 44 80 377 1638 69.4 33.9
Optimistic hydro and coal - System costs and average electricity costs (master plan) IEEJ:July 2017 © IEEJ2017

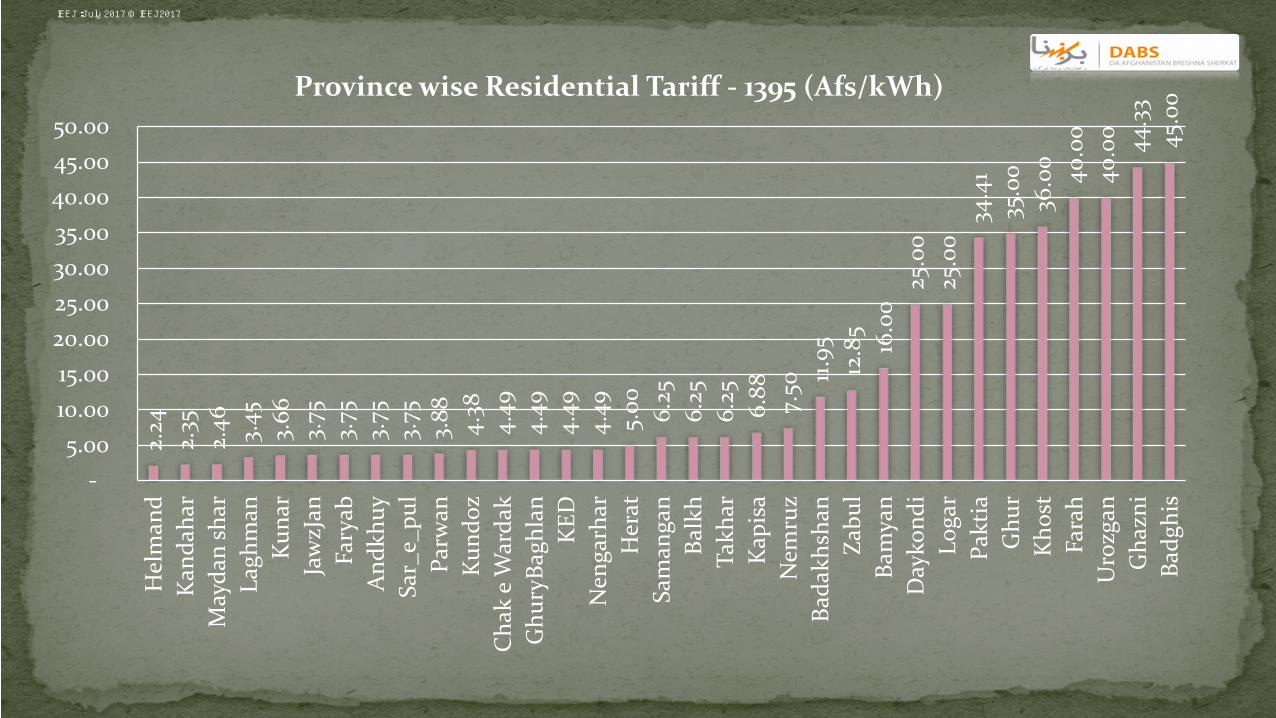
Household: (1-200)kWh/2.5 AFN. (201-400)kWh/3.75 AFN. (401-700)kWh/6.25. (701-2000)kWh/8.5 AFN. (2001-10000)kWh/10 AFN.
Commercial: (1-10000)kWh/12.5 AFN. Governmental: (1-10000)kWh/13.75 AFN NGO’s: (1-10000)kWh/12.50 AFN Industrial: (1-10000)kWh/ Registered 7.5 AFN Not Registered 12.5 Holy Places(Masjid) same as householder Note: US, Dollar 1=68 AFN
IEEJ:July 2017 © IEEJ2017
2.2
4
2.3
5
2.4
6
3.4
5
3.6
6
3.7
5
3.7
5
3.7
5
3.7
5
3.8
8
4.3
8
4.4
9
4.4
9
4.4
9
4.4
9
5.0
0
6.2
5
6.2
5
6.2
5
6.8
8
7.5
0
11.9
5
12.8
5
16.0
0 2
5.00
2
5.00
34.
41
35.
00
36.
00
40.
00
40.
00
44.
33
45.
00
- 5.00
10.00 15.00 20.00 25.00 30.00 35.00 40.00 45.00 50.00
Hel
man
d K
anda
har
May
dan
shar
La
ghm
an
Kun
ar
Jaw
zJan
Fa
ryab
A
ndkh
uy
Sar_
e_pu
l Pa
rwan
K
undo
z C
hak
e W
arda
k G
hury
Bagh
lan
KED
N
enga
rhar
H
erat
Sa
man
gan
Balk
h Ta
khar
K
apis
a N
emru
z Ba
dakh
shan
Za
bul
Bam
yan
Day
kond
i Lo
gar
Pakt
ia
Ghu
r K
host
Fa
rah
Uro
zgan
G
hazn
i Ba
dghi
s
Province wise Residential Tariff - 1395 (Afs/kWh)
IEEJ:July 2017 © IEEJ2017
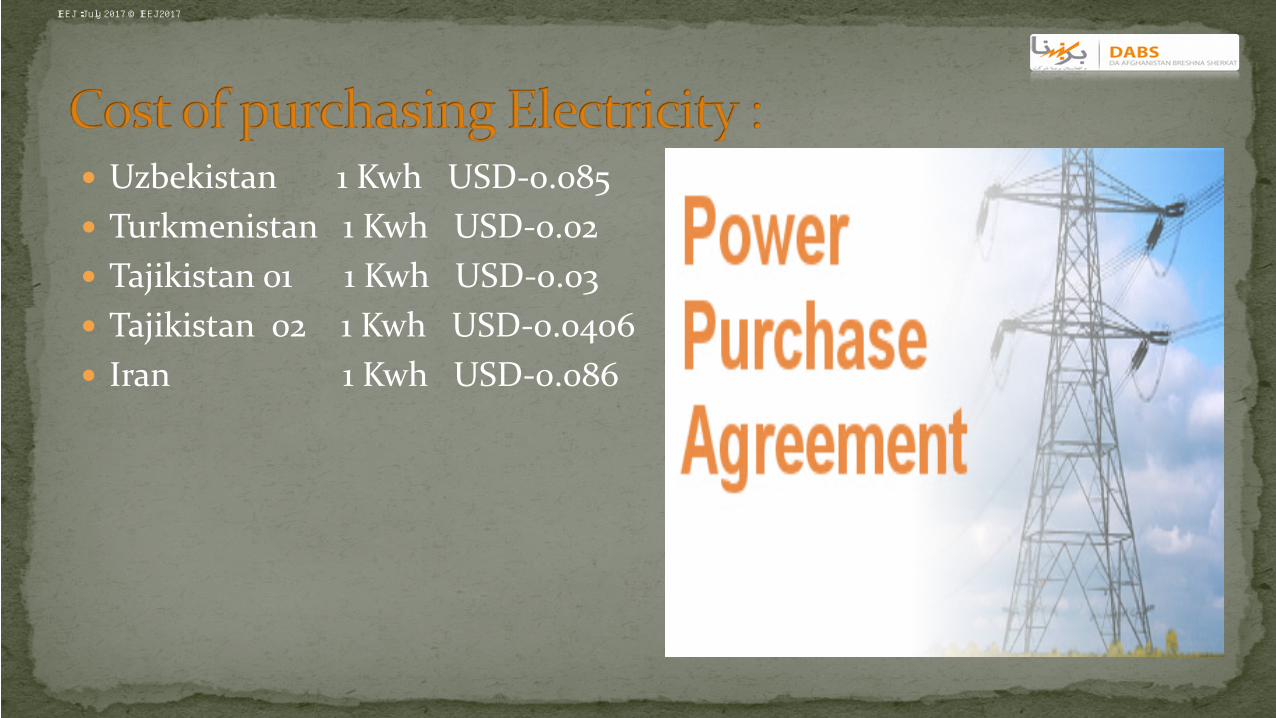
Uzbekistan 1 Kwh USD-0.085 Turkmenistan 1 Kwh USD-0.02 Tajikistan 01 1 Kwh USD-0.03 Tajikistan 02 1 Kwh USD-0.0406 Iran 1 Kwh USD-0.086
IEEJ:July 2017 © IEEJ2017

Increased dependence on imported energy. Lack of adequate generation capacity. Poor O&M of existing assets. Inadequate access to electricity. high network losses. Rampant theft. Poor quality and reliability of power. Unmetered supply. Lack of capacity, resources, and process of approving a new policy.
IEEJ:July 2017 © IEEJ2017

I would like to learn how to control the Theft, improve the network, bring efficient meter reading system and improve the existing energy policy. Establishing comprehensive energy policy. Energy Demand and Forecasting. Improving exiting policy. Learn from Japanese lecturers how they formulated their policy.
IEEJ:July 2017 © IEEJ2017
www.cso.gov.af www.mew.gov.af www.worldbank.org/en/country/afghanistan www.asiafundation.org DABS Master plan. DABS Energy Policy. DABS Business Plan DABS Tariff policy
IEEJ:July 2017 © IEEJ2017
Thank you
Visit us at: https://main.dabs.af/
Visit us at: https://main.dabs.af/
Thank you
IEEJ:July 2017 © IEEJ2017
Contact :[email protected]