Jerrold Oppenheim Nancy Brockway National Association of State Utility Consumer Advocates Mid-year...
30
Jerrold Oppenheim Nancy Brockway National Association of State Utility Consumer Advocates Mid-year meetings, June 10 2013 Seattle, Washington
-
Upload
madison-black -
Category
Documents
-
view
218 -
download
0
Transcript of Jerrold Oppenheim Nancy Brockway National Association of State Utility Consumer Advocates Mid-year...

Jerrold OppenheimNancy Brockway
National Association of State Utility Consumer Advocates
Mid-year meetings, June 10 2013Seattle, Washington

.
Future of Electric Industry Brockway/Oppenheim at NASUCA 2

Large customers demand competition.
Utilities ordered to interconnect.
Utilities fight change… Then embrace it, merge and diversify.
Regulators allow cost allocation and rate design to preserve legacy utility, so …
Future of Electric Industry Brockway/Oppenheim at NASUCA 3

Prices for captive legacy folks go up.
Regulation, competition, technology, etc. drive down prices of non-utility alternatives, so …
Usage moves away from legacy systems.
Utilities skimp on reliability, sell least attractive territories.
Future of Electric Industry Brockway/Oppenheim at NASUCA 4

At the extreme, a death spiral for the legacy industry (and for those stuck using its capital).
Future of Electric Industry Brockway/Oppenheim at NASUCA 5

Innovation.
Ultimate merger of telecom, TV, internet (the original vision of cable TV!).
Lower prices for large customers, telephone instruments, long distance, international calling.
Universal Service Fund.
Future of Electric Industry Brockway/Oppenheim at NASUCA 6

Low-price pay phones replaced by expensive cell phones with lower reliability.
Innovative phone sets that are cheap but low quality.
Sharp increases in landline local service price, with deteriorating reliability.
Loss of Bell Labs basic research.
Threat to common carriage (“net neutrality”).
Monopoly break-up replaced by oligopoly in many sectors.
Future of Electric Industry Brockway/Oppenheim at NASUCA 7

Can we learn from that experience: What to expect What strategies work or don’t How to come out at the other end with the
best deal for residential and low-income customers.
How to preserve social objectives such as low-income supports, environmental safety, innovation
Future of Electric Industry Brockway/Oppenheim at NASUCA 8

.
Future of Electric Industry Brockway/Oppenheim at NASUCA 9

Large customers demand generation competition, then T&D (e.g., microgrids).
Utilities ordered to interconnect (e.g., retail access, DG).
Mostly non-utility technology develops: EE, ESCOs, DR, PV, CHP, Self-gen, Storage, Other DG, EVs, Smart homes
Utilities fight change …
Then embrace it, change role, merge and diversify.
Regulators allow shifts in cost allocation (shift to res.) and rate design (e.g., decoupling) to preserve legacy utility.
Future of Electric Industry Brockway/Oppenheim at NASUCA 10
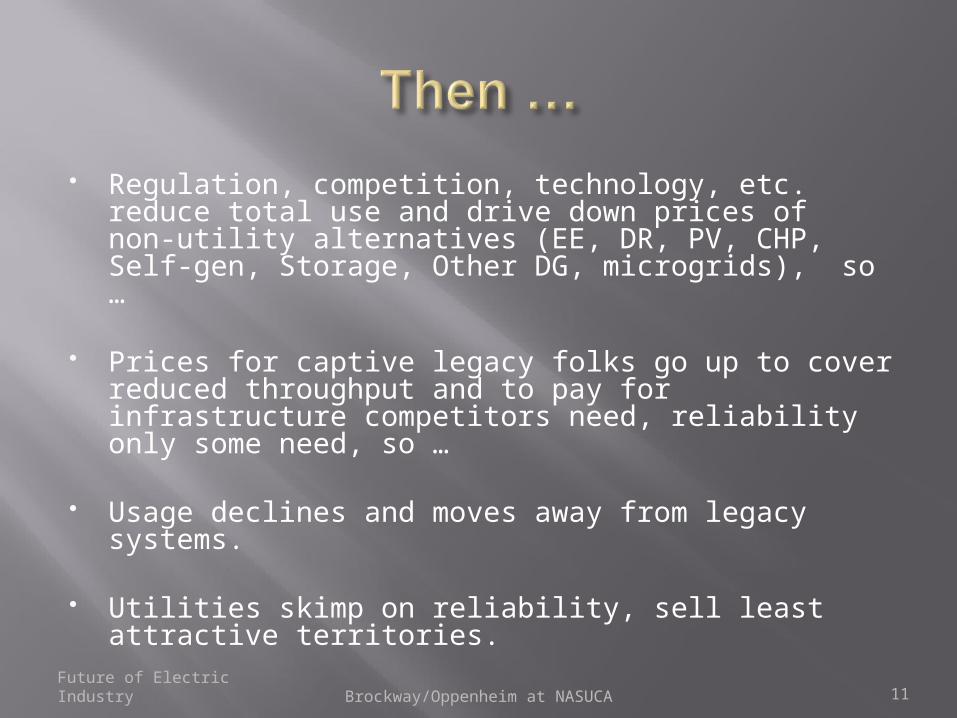
Regulation, competition, technology, etc. reduce total use and drive down prices of non-utility alternatives (EE, DR, PV, CHP, Self-gen, Storage, Other DG, microgrids), so …
Prices for captive legacy folks go up to cover reduced throughput and to pay for infrastructure competitors need, reliability only some need, so …
Usage declines and moves away from legacy systems.
Utilities skimp on reliability, sell least attractive territories.
Future of Electric Industry Brockway/Oppenheim at NASUCA 11

0%
10%
20%
30%
40%
50%
0
20
40
60
80
100
2000 2001 2002 2003 2004 2005 2006 2007 2008 2009 2010 2011 2012
Tota
l Ann
ual
Cap
acity
Ad
diti
ons
(G
W)
Wind Other Renewable Gas
Coal Other Non-Renewable Wind (% of Total)
Win
d Ca
paci
ty A
dditi
ons
(% o
f Tot
al A
nnua
l Cap
acity
Add
ition
s)
Source: Wiser and Bolinger (forthcoming).
12

• Starting in 2007, US cumulative PV capacity was ~500 MW. • Total installed capacity doubled by 2009, doubled again in
2010 and then doubled again in 2011• Annual growth rate of PV in the U.S. has exceed 30%/yr since
2001
0
500
1000
1500
2000
2500
3000
3500
4000
1998 1999 2000 2001 2002 2003 2004 2005 2006 2007 2008 2009 2010 2011
Installation Year
Cumulative Capacity (U.S. Total)
Cumulative Capacity (Data Sample)
Annual Capacity Additions (U.S. Total)
Annual Capacity Additions (Data Sample)
Gri
d-C
on
nec
ted
PV
Cap
acit
y (M
WD
C)
13
Source: Barbose et al. (2012)

No state incentives needed to compete at retail grid parity in some markets (third-party ownership flourishes)
Solar PPAs for 10 MW+ plants in Southwest now well below 10 cents/kWh
Source: Feldman et al. (2012)
14

• WECC-wide Behind-the-Meter DG: 19 GW of solar PV + 7 GW of CHP
• Distributed PV based on “interconnection potential” (no back-flow through feeders), with adjustments to reflect relative economics among states
• CHP additions represent a fixed percentage (~40%) of technical potential in each state
15
0%
5%
10%
15%
20%
25%
30%
AB AZ BC CA CO ID MT MX NV NM OR UT WA WY
CHP Solar PV Customer-Sited DG Additions in WECC High DSM Case(Percent of Peak Demand)
Source: E3 (2013).

Total electric & gas spending doubles to $9.5B in 2025 in the medium case(low: $6.5B, high: $15.6B)
Projected annual incremental savings rise to 0.76% per year by 2025 in medium case
Projected EE savings in the medium case would offset much of electric load growth forecasted by EIA
16
Projected Incremental Annual Electric EE Savings from Customer-Funded Programs
(Percent of Retail Sales)Projected Utility Customer Funding for
Electric and Gas EE Programs
Source: Barbose et al. (2013)


Automatic Ice Makers Battery Chargers and
External Power Supplies Ceiling Fans and Ceiling
Fan Light Kits Residential Boilers Set-Top Boxes Walk-In Coolers and
Freezers Commercial Furnaces Commercial Water Heaters Fans, Blowers, and Fume
Hoods Furnace Fans
High-Intensity Discharge (HID) Lamps
IRLs (Certain ER, BR, and Small Diameter)
Commercial Refrigeration Equipment
Electric Motors Commercial and
Industrial Pumps Commercial Packaged
A/C and Heat Pumps General Service
Fluorescent Lamps and IRLs

19
• Historical load growth in WECC: 1.6%/yr (1998-2010)• WECC 20-yr reference case forecast with current EE policies =
1.4%/yr, with growth <1% in 5 states• SPSC High EE case reduces load growth to 0.3%/yr (WECC-wide),
with 6 states projected to have negative load growth
-1.0%
0.0%
1.0%
2.0%
3.0%
4.0%
5.0%
AB AZ BC CA CO ID MT NV NM OR UT WA WY WECC
WECC Reference CaseSPSC High DSM Case
Compound Annual Growth Rates (Annual Energy, 2010-2032)
Source: LBNL and Itron (2013).

At the extreme, a death spiral for the legacy industry (and for those stuck using its capital).
Future of Electric Industry Brockway/Oppenheim at NASUCA 20

.
Future of Electric Industry Brockway/Oppenheim at NASUCA 21
.
Future of Electric Industry Brockway/Oppenheim at NASUCA 22

In case of declining industries, trickiest question is how long it will take?
Do we push for continued investment and legacy programs and policies, on theory that it will be a long time before the threat of the industry unraveling is real?
Do we try to get ahead of the curve, and put in place necessary protections for residential and low-income customers, the environment, other social objectives?
Or both?Future of Electric Industry Brockway/Oppenheim at NASUCA 23

Future of Electric Industry Brockway/Oppenheim at NASUCA 24

Maintain principles of affordability, prudence, used-and-useful, least-cost, cost-effectiveness, cost allocations and rate designs that match costs to beneficiaries of non-mandatory new services.
Recognize the very high low-income discount rate and so maintain supports as nonbypassable charges. [But how, in face of declining revenue?]
Continue to meet environmental objectives with tax policy. And mandatory utility policy, such as EE and grid purchases. [But how, in face of declining revenue?]
Future of Electric Industry Brockway/Oppenheim at NASUCA 25

Though some possible contraindications, e.g., EV, load controls (smart homes), increased plug loads.
Future of Electric Industry Brockway/Oppenheim at NASUCA 26

Still a work in progress, especially to protect the most vulnerable…
Level the playing field with truly universal system benefit charges, i.e., on all technologies.
Promote technologies and rate designs that will fairly protect legacy utility ratepayers, e.g., EVs, DR, and DLCs to increase load factors, EVs and efficient plug loads to increase throughput, demand charges for technologies that require grid investment (such as RE, DG, EV, DLC).
Increase targetted EE to protect environment and low-
income.
Apply least-cost principles to RE mandates.
DISCUSSIONFuture of Electric Industry Brockway/Oppenheim at NASUCA 27

Jerrold Oppenheim
+1-978-283-0897
www.DemocracyAndRegulation.co
m
Nancy Brockway
617-645-4018
Future of Electric Industry Brockway/Oppenheim at NASUCA 28

Jerrold Oppenheim is an independent consultant and attorney who has advised and represented low-income and other utility consumer advocates, government agencies, labor, and utilities across the country for more than 40 years. A graduate of Harvard College andBoston College Law School, he led utility litigation and argued precedent-setting cases for four Attorneys General in New York State and Massachusetts; for Legal Services in Boston, Chicago and New York City; and for the National Consumer Law Center. He is a member of the Center for Public Utilities Advisory Council, New Mexico State University, and has spoken and published on five continents, including Democracy And Regulation with Theo MacGregor and Greg Palast, published by Pluto Press (London) and winner of the ACLU Upton Sinclair Award.
Future of Electric Industry Brockway/Oppenheim at NASUCA 29

Future of Electric Industry Brockway/Oppenheim at NASUCA 30