EADING & TRAINING I LIFE SKILLS Jerome K. Jerome Three Men ...
Gray Swans:
Comparison of Natural and Financial Hazard Assessment and Mitigation
Jerome L. Stein1 and Seth Stein2
Even advanced technological societies are vulnerable to natural disasters, such as the
2011 Tohoku earthquake and tsunami, and financial disasters, such as the 2008 collapse
of the U.S. housing and financial markets. Both resulted from unrecognized or
underappreciated weaknesses in hazard assessment and mitigation policies. These
policies relied on models that proved inadequate for reasons including inaccurate
conceptualization of the problem, use of a too-short historic record, and neglect of
interconnections. Japanese hazard models did not consider the possibility of multiple
fault segments failing together, causing a much larger earthquake than anticipated, and
neglected historical data for much larger tsunamis than planned for. Mitigation planning
underestimated the vulnerability of nuclear power plants, due to a belief in nuclear safety.
U.S. economic models did not consider the hazard that would result if multiple
homeowners could not pay their mortgages, and assumed based on a short history that
housing prices could only continue rising rapidly. They did not anticipate the
vulnerability of the financial system to a drop in housing prices, due to belief that markets
functioned best without government regulation. Preventing both types of disasters from
recurring involves balancing the costs and benefits of mitigation policies. A crucial
aspect of this balancing is that the benefits must be estimated using models with
significant uncertainties to infer the probabilities of future events, as we illustrate using a
simple model for tsunami mitigation. Improving hazard models is important because
overestimating or underestimating the hazard leads to too much or too little mitigation.
Thus although one type of disaster has natural causes and the other has economic causes,
comparison provides insights for improving hazard assessment and mitigation policies.
Instead of viewing such disasters as unpredictable and unavoidable “black swan” events,
they are better viewed as “gray swans” that - although novel and outside recent
experience - can be better foreseen and mitigated.
1 Professor of Economics, Emeritus, Visiting Professor/Research, Division of Applied Mathematics, Box F, Brown University, Providence RI 02912 USA 2 Corresponding author. Department of Earth and Planetary Sciences, Northwestern University, Evanston IL 60208 USA, [email protected]
"The essence of the this-time-it's-different syndrome is simple. It is rooted in the firmly held belief that financial crises are things that happen to other people in other counties at
other times; crises do not happen to us, here, and now. We are doing things better, we are smarter, we have learned from past mistakes."
From: This Time Is Different
by C. Reinhart and K. Rogoff, 2009
1. Introduction
The first decades of the 21st century humbled two of the world's most advanced
societies, who thought their technological and organizational prowess had tamed the
danger of major disasters that had previously caused immense damage.
Japan, on the boundary between three major plates, had long been afflicted by
great earthquakes and the resulting tsunamis. Over a period of years, most recently in
2010, a government agency advised by some of Japan’s leading seismologists had
predicted what kinds of earthquakes could be expected in different parts of the country.
This forecast was used to produce a seismic hazard map predicting the probability that
the maximum ground acceleration (shaking) in any area would exceed a particular value
during the next 30 years (Figure 1), and to forecast the largest expected tsunami. To
reduce the nation's vulnerability, high sea walls were built along a third of Japan's
coastline, longer than the Great Wall of China (Onishi, 2011a). Systems were set up to
issue tsunami warnings so people in coastal areas could evacuate to higher ground.
Structures were designed to survive earthquake shaking.
This planning proved inadequate on March 11, 2011, when a magnitude 9
earthquake struck the Tohoku coast, generating a huge tsunami that caused over 15,000
deaths and enormous damage. The hazard map, which showed the Tohoku area as having
significantly lower hazard than other parts of Japan, significantly underpredicted the
shaking and tsunami that occurred. The tsunami overtopped sea walls, and nuclear power
plants proved to be much more vulnerable than anticipated. Although the warning system

Gray Swans: Comparison of Natural and Financial Disaster Mitigation 4/16/12 3
saved many lives (Ando et al., 2011), some people did not receive warnings and others
ignored them. Thus although mitigation efforts reduced the disaster significantly, the
need for improvement was evident.
Figure 1: Comparison of Japanese government hazard map to the locations of
earthquakes since 1979 that caused 10 or more fatalities, all of which are shown as having relatively low hazard (Geller, 2011).

Gray Swans: Comparison of Natural and Financial Disaster Mitigation 4/16/12 4
It has been argued that the earthquake and resulting tsunami should be viewed as
rare, unforeseeably large, events (Chang, 2011). These are termed "black swans" because
prior to Europeans' reaching Australia, all swans were thought to be white (Taleb, 2007).
However, as we will see, they are better viewed as “gray swans” that – although novel
and beyond recent experience - could have been foreseen and mitigated.
Only three years before the Tohoku earthquake, the U.S. economy suffered a
financial disaster, despite policies that were believed to have made such disasters
impossible (Stein, 2012). Similar events had occurred since 1792, when a severe panic
froze credit and nearly brought the young economy to its knees. Over the next 140 years,
financial crises struck roughly every twenty years. Some grew into full-scale disasters,
like the Great Depression of 1929.
Beginning in 1933, policies and regulations were adopted to prevent a similar
disaster. The changes worked well. Although crises arose in sectors of the economy, such
as the 1980's and 1990's agricultural crisis, savings and loan crisis, and the bursting of the
"dot.com" bubble in technology stocks, these crises had no serious effects upon the
financial system or the economy. After fifty years without a financial disaster—the
longest such stretch in the nation’s history— the Federal Reserve, Treasury Department,
and White House saw financial disaster as a ghost of the past.
This assumption proved disastrously wrong beginning in 2006 when housing
prices, that had been rising since 1975. collapsed. The collapse was initially not viewed
as having serious consequences, due to government officials’ confidence in economic
forecasting models (Appelbaum, 2012). “We think the fundamentals of the expansion
going forward still look good,” Timothy Geithner, president of the Federal Reserve Bank
of New York, told his colleagues in December 2006. This optimism proved incorrect.
Increased foreclosures led to the collapse of securities based on housing prices. Due to
interconnections among banks and security houses, one sector's failure infected the other.
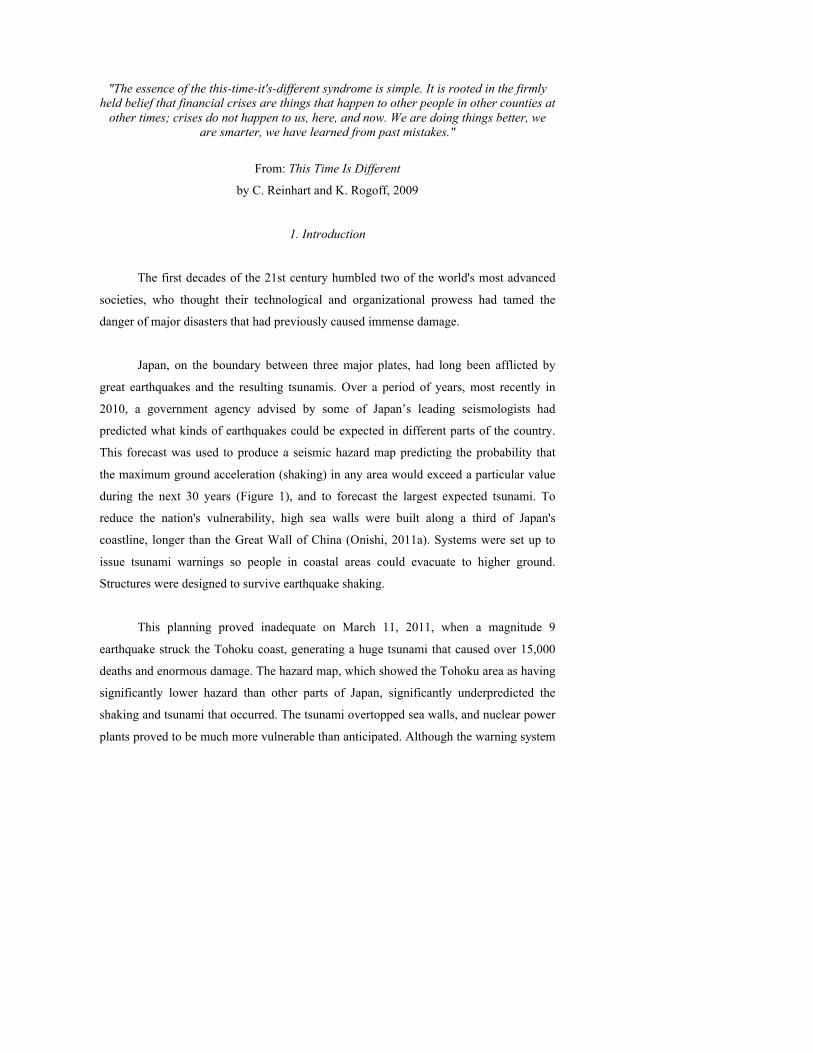
By 2008, the financial system was in crisis, as shown in Figure 2a by the Financial Stress
Index, a composite of financial indices including interest rates. A number of major
Gray Swans: Comparison of Natural and Financial Disaster Mitigation 4/16/12 5
financial institutions were bankrupt or illiquid, inducing government intervention.
Unemployment soared from less than 5% in 2007 to 10% in 2009, and remains above 8%
in 2012 (Figure 2b).
Figure 2: Financial Stress Index (top) and unemployment rate (bottom)
showing effects of the 2008 disaster. (Federal Reserve Bank of St. Louis)

Gray Swans: Comparison of Natural and Financial Disaster Mitigation 4/16/12 6
Officials responsible for economic policy have argued that this financial crisis
was unpredictable and unavoidable. Alan Greenspan, former chairman of the Federal
Reserve Board, wrote in 2008 “Those of us who have looked to the self-interest of
lending institutions to protect stockholders’ equity, myself included, are in a state of
disbelief”. However, we will see that this “black swan” view is incorrect.
2. Similarities
The Tohoku and financial disasters resulted from unrecognized or
underappreciated weaknesses in hazard assessment and mitigation policies. They have
thus prompted extensive analysis of how such hazards could be better assessed and
mitigated. Although the two disasters have been considered separately, this paper
considers some analogous aspects.
The first similarity is the difficulty of identifying vulnerabilies. In the natural
hazard literature, the term "hazard" describes the natural occurrence of earthquakes or
other phenomena, and "risk" describes the danger the hazard poses to life and property.
Although the hazard is an unavoidable geological fact, the risk is affected by human
actions, so the risk is the product of hazard and vulnerability (White, 1974). A disaster
occurs when - owing to high vulnerability - a natural event has major consequences for
society. Vulnerability is increased as populations grow in dangerous areas, and reduced
by mitigation measures such as disaster-resistant construction. Similarly, we consider
crises in specific sectors of the economy as hazards, and their consequences for disasters
that can affect the entire economy as risks. The structure of the economy and government
policies can increase or decrease the economy’s vulnerability.
The second similarity is that mitigation planning relies on models of anticipated
future effects to estimate the expected benefit of alternative mitigation strategies.
However, these models are often inadequate. Mitigation policies used to prepare for both
the Tohoku earthquake and the U.S. financial crisis were based on widely accepted
Jerome Stein � 4/15/12 4:48 PMComment:

Gray Swans: Comparison of Natural and Financial Disaster Mitigation 4/16/12 7
models that proved inadequate for reasons including inaccurate conceptualization of the
problem, use of a too-short historic record, and neglect of interconnections. The resulting
disasters illustrate the need to assess and significantly improve these models.
The third similarity is the challenge of balancing the costs and benefits of
mitigation policies. Natural disaster mitigation policy relies on strategies including
construction and land use planning. Because these divert resources from other uses that
could also do societal good, the issue is to assess the hazard and choose a level of
mitigation that makes economic sense. Similarly, government financial regulations that
minimize the economy's vulnerability can also inhibit desirable activity, so an appropriate
balance is crucial. Thus both natural and financial disaster mitigation involves optimizing
the difference between the known cost and the estimated future benefits, and thus
depends crucially on the assumed hazard model.
In discussing these similarities, we assume that readers are relatively more
familiar with natural disasters and compare them to aspects of financial disasters that we
believe are similar.
3. Hazards, Risks, and Vulnerability
Because a disaster often shows the society was more vulnerable than anticipated,
it is useful to explore why these vulnerabilities were underappreciated or inadequately
addressed by mitigation policies.
3.1 Vulnerability and Interconnections
Vulnerability often results from interconnections, in which one failure causes
others or several occur simultaneously. Thus events that were thought to be very unlikely
occur far more often than would have been expected by treating each portion of a system
as independent, such that the probability of all occurring is the product of the
probabilities of each occurring alone. This chain-reaction effect is common in
technological accidents (Chiles, 2002) but also occurs for natural disasters (Lomnitz and
Gray Swans: Comparison of Natural and Financial Disaster Mitigation 4/16/12 8
Castanos, 2007). It can be described by Murphy's Law that "anything that can go wrong,
will, at the worst time.” This is said to be named after Edward Murphy, one of a team in
1947 that used a rocket-powered sled to learn how much deceleration a pilot could
survive. When the measuring instruments in a test read zero because they were installed
backwards, Murphy made the observation bearing his name.
Planning for failure chains is hard, because it is often difficult to identify these
vulnerabilities in advance, as shown by the sinking of the ocean liner Andrea Doria in
1956 (Moscow, 1981). Such ships were considered unsinkable - invulnerable - for several
reasons. First, they could not collide, because radar let them see in night and fog.
Moreover, they were divided into watertight compartments and designed to float even if
multiple compartments flooded. Still, Murphy’s Law prevailed. On a foggy night, as the
Doria sped toward New York, the Swedish liner Stockholm rammed it. Apparently, one
or both crews misread poorly designed radar displays. When the Stockholm's strong bow,
designed to break through ice, hit the Doria, things went wrong. The bulkheads between
compartments were designed assuming that if the Doria took on water, it could not tip, or
list, more than 15°. However, these calculations assumed that once fuel tanks were
emptied, they would be filled with seawater that provided weight to keep the ship level.
In fact, because this required cleaning the tanks in port and disposing of the oily water, it
was not done. After the collision, water poured into one side's tanks, while the other's
stayed empty. Immediately, the ship listed 18°. Water from flooded compartments poured
over the tops of the bulkheads and knocked out the generators needed to power the
pumps, so flooding continued and the ship listed further. Lifeboat systems were also
designed for less than 15° list, so boats on the high side could not be launched. Those on
the low side were too far from the ship for people to get in, and so were lowered empty.
Thus only half the boats could be used, and people had to jump down to them.
Fortunately, the collision occurred on a calm summer night and other ships used their
boats to rescue the passengers and crew.
Similar failure chains often arise in natural disasters, making vulnerability greater
than anticipated. The fires after the 1906 San Francisco earthquake (Winchester, 2005),

Gray Swans: Comparison of Natural and Financial Disaster Mitigation 4/16/12 9
which are thought to have done more damage than the actual shaking, are a prime
example. Among the buildings that collapsed was a firehouse, in which the fire chief was
killed. Fires broke out as natural gas lines burst and cooking stoves toppled. Firemen
connected hoses to hydrants, but no water came out, because all but one of the water
mains had broken. Attempts to dynamite firebreaks produced more fires. The fires burned
for two days until stopped by a combination of rain, firefighting, and running out of
things to burn. When all was over, much of the city was in ruins.
3.2 Tohoku and the U.S. financial disaster
With the wisdom of hindsight, the Tohoku earthquake and U.S. financial disaster
illustrate vulnerabilities that could have been recognized and reduced. For example, a
significant component of the Tohoku disaster resulted from the destruction of the
Fukushima nuclear power plant. The plant was vulnerable because the seawall protecting
it was much lower than tsunami waves that could have been reasonably expected.
Although this vulnerability arose because of limited knowledge when the plant was
constructed in the 1960's, both the plant operator and government regulators ignored
warnings of the higher hazard showed by new scientific results (Nöggerath et al., 2011;
Onishi and Fackler, 2011). Moreover, emergency generators were sited such that they
were made inoperable by the tsunami. Measures with only moderate cost that could have
reduced these vulnerabilities were not taken due to the pervasive "safety myth,"
illustrated by a protest song:
"If you walk across this country, you’ll find 54 nuclear reactors
School textbooks and commercials told us they were safe.
It was always a lie, it’s been exposed after all
It was really a lie that nuclear power is safe.”
(Onishi, 2011d) .
Vulnerability is sometimes an unexpected consequence of mitigation. Residents
of Japan's coast were proud of their tsunami defenses (Onishi, 2011abc). Although the
sea walls cost billions of dollars and cut off ocean views, these were considered a small
Gray Swans: Comparison of Natural and Financial Disaster Mitigation 4/16/12 10
price to pay for eliminating the threat that had cost many lives over the past hundreds of
years. People rode bicycles, walked, and jogged on top of the impressive walls. A school
principal explained, "The sea wall was an asset, something we believed in. We felt
protected." However, this sense of safety discouraged some people from evacuating when
the tsunami warning was issued (Ando et al., 2011; Onishi, 2011a).
Analogous effects occurred in the U.S. financial disaster growing out of the
collapse of the housing market, as described by Stein (2012) and summarized here. From
1975 to 2007, housing prices grew steadily (Figure 3), and the rate of growth increased
dramatically from 1995 to 2007. This acceleration in the rate of growth, in excess of the
rate of interest, was not sustainable. It was a bubble, like the historical tulip, silver and
gold and other commodity price bubbles, in which prices rose rapidly and then collapsed.
The house price bubble was fueled by low interest rates and subprime loans,
mortgages issued to borrowers who had a high risk of default. Such borrowers were often
called “NINJA”s for “no income, no job or assets.” Borrowers were encouraged to lie
about their finances via “no-doc” applications that would not be checked. The share of
loans with full documentation decreased from 69% in 2001 to 45% in 2006.
Jerome Stein � 4/15/12 4:48 PMComment:

Gray Swans: Comparison of Natural and Financial Disaster Mitigation 4/16/12 11
Figure 3. U.S. house price index from 1975q1 - 2011q4.
The obvious hazard, discussed in section 4.2, was that housing prices might
collapse. The entire housing market was very vulnerable due to the risky loans, because
although it was recognized that many borrowers were unlikely to be able to make loan
payments from their income, it was assumed that the loans would be refinanced from the
appreciation of the houses' value. This could only work if housing prices continued to rise
in excess of the interest rate. About half of such subprime mortgages taken out in 2006
were to extract cash by refinancing an existing mortgage into a larger mortgage loan.
Government policies facilitated these risky loans. Borrowing to refinance without the
income to pay the loan was an unsustainable “free lunch”. Neither Washington nor Wall
Street recognized that it was like a Ponzi scheme, although without explicit fraud.
The vulnerability was produced by trillions of dollars of risky mortgages that were
embedded throughout the financial system, as mortgage related securities, known as
derivatives because their values depended on the mortgages, that were packaged,
repackaged, and sold to investors around the world. Funds held packages of derivatives
either directly or indirectly through investment in hedge funds. The purchases were

Gray Swans: Comparison of Natural and Financial Disaster Mitigation 4/16/12 12
financed by short-term bank loans. Neither the funds nor the banks worried about the
rising debt, because their equity was rising as home prices rose.
These vulnerabilities were ignored, as discussed in the report of the Financial
Crisis Inquiry Commission (2011). Charles Prince, the former CEO of Citigroup, told the
commission “As more and more subprime mortgages were created as raw material for the
securitization process, more and more of it was of lower and lower quality. At the end of
that process, the raw material going into it was actually of bad quality, it was toxic
quality, and that is what ended up coming out the other end of the pipeline. Wall Street
obviously participated in that flow of activity”.
Because derivatives were not traded on organized exchanges, their prices were not
transparent. This situation arose because of controversial government deregulation. In
1998 the Commodities Futures Trading Commission sought to regulate this trading, and
General Accounting Office concluded that “the sudden failure or withdrawal of any one
of these dealers could cause liquidity problems in the markets and could also pose risks to
the others, including federally insured banks and the system as a whole”. However,
Federal Reserve Board chairman Alan Greenspan, Secretary of the Treasury Robert
Rubin, and others opposed regulation. Greenspan said “…regulation of derivatives
transactions that are privately negotiated by professionals is unnecessary… By far the
most significant event in finance during the past decade has been the extraordinary
development and expansion of financial derivatives.”
Derivatives were not considered vulnerable due to an erroneous model. Securities
firms like Lehman Brothers and Merrill Lynch bought packages of mortgages and sliced
(tranched) them into successively riskier tranches. The income from the mortgages then
flows like a waterfall. The senior tranche had the first claim, the mezzanine had the next,
and the equity tranche got what if anything was left. The illusion was that this procedure
diversified risk, so relatively riskless tranches could be constructed from mortgages of
dubious quality.
Jerome Stein � 4/15/12 4:48 PMComment:

Gray Swans: Comparison of Natural and Financial Disaster Mitigation 4/16/12 13
When the house price bubble burst, these interconnected vulnerabilities became
apparent. Hundreds of billions of dollars in losses in mortgages and derivatives shook
markets. Financial institutions had financed their purchase of these assets with debt from
banks and money market funds. They were heavily leveraged in the sense that their assets
and corresponding debt were large multiples of their net worth, the difference between
assets and debt. Hence when asset values declined, the firms' net worth declined
dramatically. Some firms (e.g., Lehman Brothers) went bankrupt and others (e.g., Bear
Sterns) survived only via government bailouts.
Despite the view that the crisis could not have been foreseen or avoided, the FCIC
argued otherwise. Washington and Wall Street ignored the flow of toxic mortgages and
could have set prudent mortgage-lending standards. Government regulators had ample
power to protect the financial system, but chose not to use it.
4. Hazard Models
Hazard mitigation planning relies on models of anticipated future effects to
estimate the expected benefit of alternative mitigation strategies. However, these models
often prove inadequate. The effects of both the Tohoku earthquake and the U.S. financial
crisis were much greater than anticipated based on widely accepted models. In hindsight
the models proved inaccurate for various reasons, some of which are similar in the two
cases. These include use of a too-short historic record, inaccurate conceptualization of the
problem, and neglect of interconnections. The resulting disasters illustrate the importance
of carefully assessing models, recognizing the uncertainties involved, and improving
them.
4.1 Tohoku: much bigger than expected
The Japanese seismic hazard map proved inaccurate because it assumed that the
largest earthquakes off Tohoku would have magnitude below 8. The M 9 earthquake that
occurred thus produced a tsunami much larger than had been expected (Figure 4) that
overtopped 10-meter high seawalls. Such a giant earthquake was not anticipated due to

Gray Swans: Comparison of Natural and Financial Disaster Mitigation 4/16/12 14
several incorrect assumptions that reinforced each other, as summarized by Stein and
Okal (2011).
Figure 4: What went wrong at Tohoku. (a) Illustration of the fault dimensions, average fault slip, and average tsunami run-up for magnitude 8 and 9 earthquakes. (b) Data available in 1980, showing the largest earthquake known at various subduction zones. Magnitude 9 earthquakes occurred only where young lithosphere subducts rapidly. Diagonal lines show predicted maximum earthquake magnitude. (Ruff and Kanamori, 1980). (c) Interpretation of this result in terms of strong mechanical coupling and thus large earthquakes at the trench interface. (d) Data available today, updated from Stein and Okal (2007) by including 2011 Tohoku earthquake. (e) Earthquake history for the Nankai trough area (Ando, 1975) illustrating how multiple segments rupturing cause larger earthquakes. (Stein and Okal, 2011).
First, the short history considered was interpreted to show no record of such giant
earthquakes or tsunamis. However, historical data before 1900 showed the presence of
Gray Swans: Comparison of Natural and Financial Disaster Mitigation 4/16/12 15
tsunamis much higher than 10 meters. Second, it was assumed that magnitude 9
earthquakes would not occur because the subducting lithosphere was older than 80
million years. However, this model had been invalidated by the 2004 magnitude 9.3
Sumatra earthquake that generated the devastating Indian Ocean tsunami. Third, the
presumed absence of giant earthquakes was interpreted as indicating that much of the
subduction occurred aseismically, so most of the plate motion would not give rise to
earthquakes. However, GPS data were inconsistent with this assumption. Fourth, the
model ignored interconnections, by assuming that different segments of the trench would
not break simultaneously, so the largest earthquake on any would have magnitude 8.
However, four segments broke, giving a magnitude 9 earthquake. Although new data and
ideas would have changed the hazard map eventually, they had not yet been incorporated
in it.
Following the earthquake, debate has arisen over whether the earthquake and
resulting tsunami should be viewed as unforeseeably large events that should not be used
to judge the map as unsuccessful, or whether they indicate systemic difficulties with the
map. Geller (2011) favors the latter, noting that the map shows areas other than Tohoku
as much more dangerous: "The regions assessed as most dangerous are the zones of three
hypothetical 'scenario earthquakes' (Tokai, Tonankai and Nankai). However, since 1979,
earthquakes that caused 10 or more fatalities in Japan actually occurred in places
assigned a relatively low probability. This discrepancy -- the latest in a string of negative
results for the characteristic earthquake model and its cousin, the seismic-gap model --
strongly suggests that the hazard map and the methods used to produce it are flawed and
should be discarded."
Similar discrepancies have occurred around the world (Kossobokov and
Nekrasova, 2010; Stein et al., 2011). For example, the 2008 Wenchuan earthquake (M
7.9) in China occurred on a fault system assessed to have low hazard based on the lack of
recent seismicity. The 2010 M 7.1 Haiti earthquake similarly occurred on a fault mapped
in 2001 as having low hazard, producing ground motion far greater than the map
predicted. In some cases, the problem stemmed from considering a too-short historic

Gray Swans: Comparison of Natural and Financial Disaster Mitigation 4/16/12 16
record (Swafford and Stein, 2007). In others it stemmed from not using available data,
such as GPS data that show motion across the Longmenshan Fault that failed in the
Wenchuan earthquake (Meng et al, 2008).
Kerr (2011) described this situation as the "seismic crystal ball proving mostly
cloudy around the world." This situation is striking, given that earthquake hazard
mapping has become accepted and widely used to make major decisions with little
discussion among users of the uncertainties involved. Although there has been some
debate about how best to do it (Castanos and Lomnitz, 2002; Bommer, 2009; Panza et al.,
2010; Wang, 2011), there has been little assessment of the uncertainties in these maps or
objective testing of how well they predict future earthquake effects.
The situation is starting to change, with considerable discussion among
seismologists about how to improve hazard modeling. A number of researchers and
programs (GEM, 2012; CSEP, 2012) plan to address it. Stein et al. (2011) suggest two
approaches. First, the uncertainties in hazard map predictions should be assessed and
clearly communicated to potential users. Knowing the uncertainties would enable users to
decide how much credence to place in the maps, and thus make them more useful.
Second, hazard maps should undergo objective testing to compare their predictions to
those of null hypotheses, including ones based on uniform regional seismicity. Such
testing, which is common and useful in similar fields, will hopefully produce measurable
improvements.
The fact that hazard maps often do poorly is not surprising, because making them
is a difficult enterprise involving assumptions about where and when large earthquakes
will occur, how large they will be, and how much ground motion they will produce.
Given the complexities of the earthquake process and our limited knowledge of it, many
subjective choices are needed. As a result, maps depend heavily on their makers'
preconceptions about how the earth works and have large uncertainties in the sense that
plausible choices of key parameters predict quite different hazards (e.g., Newman et al.,
2001; Hebden and Stein, 2009). When the modelers' preconceptions prove correct, a map
Gray Swans: Comparison of Natural and Financial Disaster Mitigation 4/16/12 17
fares well. When they prove incorrect, a map does poorly. Predicting earthquake hazard
has thus been described as playing “a game of chance of which we still don't know all the
rules” (Lomnitz, 1989). Not surprising, nature often wins. The lesson of Tohoku is that
that the limitations of hazard models should be borne in mind when using them to
develop mitigation strategies.
4.2: The 2008 crash: genius fails again
The financial disaster of 2008 involved analogous problems. Since the 1970's,
sophisticated mathematical models were used to develop arcane new financial
instruments (Overbye, 2009, Salmon, 2009). Few within the industry beyond their
practitioners, termed "quants," understood how the models worked. Nonetheless, as
described by Fischer Black, a leader in developing them, their theoretical bases were
"accepted not because it is confirmed by conventional empirical tests, but because
researchers persuade one another that the theory is correct and relevant" (Derman, 2004).
This acceptance was illustrated by the award in 1997 of the Nobel Prize in economics to
Myron Scholes and Robert Merton for work based upon Black’s, who died a few years
earlier. Only a year later, Long Term Capital Management, a hedge fund whose directors
included Scholes and Merton, collapsed and required a $3.6 billion bailout.
Unfortunately, this collapse - described in Robert Lowenstein's (2000) book When
Genius Failed - did not lead to reassessment of the financial models, whose continued
use in developing mortgage backed securities contributed significantly to the 2008 crisis.
Three failings of the financial models (Stein, 2012) are analogous to those that
caused the failure of the Tohoku earthquake hazard mapping. First, it was assumed that
housing prices would continue to rise, based on the historic record from 1975 to 2006
(figure 3), so there was very little risk that house prices would fall. Real estate in the US
as a whole was considered a safe investment, though there would be regional and local
differences. Moreover, the ominous rise in the ratio of house price index/disposable
income to 2 – 3 standard deviations above the longer-run mean was discounted. As in all
bubbles, it was assumed that “this time is different” (Reinhart and Rogoff, 2009) - this
Gray Swans: Comparison of Natural and Financial Disaster Mitigation 4/16/12 18
boom was sustainable. The government and finance profession refused to second guess
the market, ignoring the unsustainability of the “free lunch”.
Second, models erroneously assumed that bundling or "tranching" mortgages into
derivatives made risky assets safe. The “apples in the basket" model assumed that one
rotten apple implies nothing about the others. Thus the probability that a few mortgages
going bad would cause the entire tranche to fail was small. Based on this model, credit
rating agencies gave high ratings to risky derivatives. However, the risk of default on
mortgages is not independent, because if housing prices stopped rising fast enough, or the
economy faltered, many borrowers would be unable to pay. Thus a better model is "bread
in the loaf "- one moldy slice implies that the next – or the rest of the loaf – is also.
Packages of toxic assets, rather than riskless, were actually very risky.
Third, policy makers ignored the vulnerability posed by interconnections in the
financial system and thus the possibility that the faltering housing market would impact
the broader economy. The problem was not a lack of information, but confidence in
models that proved incorrect.
The incorrect models had enormous consequences because those using them gave
little thought to their limitations. Derman (2004) argues that “the right way to engage
with a model is, like a fiction reader or a really great pretender, to suspend disbelief and
push it as far as possible. . . But then, when you’ve done modeling, you must remind
yourself that . . . although God’s world can be divined by principles, humanity prefers to
remain mysterious. Catastrophes strike when people allow theories to take on a life of
their own and hubris evolves into idolatry.”
5.0 Mitigation Costs and Benefits
Immediately following disasters, society's instinct is to ensure that a similar
disaster will not recur by adopting mitigation policies to reduce vulnerabilities that the
disaster illustrated. However, within a short time, the question of the costs and benefits of
Gray Swans: Comparison of Natural and Financial Disaster Mitigation 4/16/12 19
these mitigation measures arise, forcing society to confront the challenge of deciding how
much mitigation is appropriate. More mitigation can reduce losses in possible future
disasters, at increased cost. Less mitigation reduces costs, but can increase potential
losses. One difficult aspect of balancing the costs and benefits is that the benefits have to
be estimated using models - with the attendant uncertainties - to infer the probabilities of
future events. Another is that there are no unique or correct strategies, so society has to
make tough choices. Hence although mitigation measures differ for natural and financial
disasters, similar issues arise.
5.1 Rebuilding Tohoku
Natural disaster mitigation policy reduces vulnerability via strategies including
construction and land use planning. Because such policies have costs that divert resources
from other uses that could do more societal good, the issue is to assess the hazard and
choose a level of mitigation based on a complex set of political and economic criteria.
The situation following the Tohoku tsunami shows the challenge. Because the
tsunami overtopped 5-10 m high sea walls, the extent to which the seawalls and other
defenses should be rebuilt is a difficult and debated question. The issue is illustrated by
the city of Kamaishi (Onishi, 2011a). The city, although already declining after its steel
industry closed, was chosen for protection by a $1.6 billion breakwater. A song produced
by the government “Protecting Us for a Hundred Years” praised the structure “It protects
the steel town of Kamaishi, it protects our livelihoods, it protects the people’s future.”
However, the breakwater collapsed when struck by the tsunami. 935 people in the city
died, many of whom could have evacuated once warnings were given but did not,
believing they were safe. Although the breakwater is being rebuilt, critics argue that it
would be more efficient to relocate such communities inland, because their populations
are small and decreasing. Otherwise “in 30 years there might be nothing here but fancy
breakwaters and empty houses.”
Because building coastal defenses adequate to withstand tsunamis as large as
March’s is too expensive, those planned are about 12 m high, only a few meters higher

Gray Swans: Comparison of Natural and Financial Disaster Mitigation 4/16/12 20
than the older ones (Normille, 2012; Crynoski, 2012). These are planned to provide
protection for the largest tsunamis expected every 200-300 years, augmented with land-
use planning to provide some protection against much larger tsunamis. The defenses
should reduce economic losses, while improved warning and evacuations should reduce
loss of lives.
Although the policy issue is complicated and decided politically, its economic
aspects can be conceptualized by considering how high a seawall to construct. A simple
model, proposed by Stein and Stein (2012) and expanded here, based on economic
modeling approaches (Stein, 2012), illustrates a way to choose a strategy that optimally
minimizes a risk-averse sum of the expected property losses from tsunamis and the cost
of tsunami defenses.
At some point on the coast, we denote the cost of defense construction as C(n),
where n is the height of a seawall or another measure of increasing mitigation such as the
width of a no-construction zone. For a tsunami of height h, the predicted economic loss is
a function L(h-n), where h-n is the height to which a tsunami will overtop a seawall, or
otherwise exceed a design parameter. L(h-n) is zero for a tsunami smaller than the design
value n and increases for larger tsunamis. L includes both the damage itself and the
resulting indirect economic losses. The probability of a tsunami overtop of height h-n is
p(h-n), so the expected loss from a number of possible tsunamis over the life of the wall
is
Q(n) = E{L(n)} = Σh p(h-n)L(h-n)
the sum of losses from tsunamis of different heights weighted by their probabilities. Thus
p(h-n) describes the hazard, the occurrence of tsunamis of a certain size, and Q(n) reflects
the present value of the resulting risk, which also depends on the mitigation level n.
The economically optimum level of mitigation minimizes the total cost, the sum of
the expected loss and mitigation cost, where risk and uncertainty are taken into account.
Gray Swans: Comparison of Natural and Financial Disaster Mitigation 4/16/12 21
The term in brackets is the expected (mean) total cost, and R(n) is a term added to reflect
uncertainty in the predicted loss and aversion to risk
K(n*) = minn { [Q(n) + C(n)]+ R(n)}.
The cost of mitigation increases with the height of the seawall. Conversely, the
expected loss in future tsunamis decreases for taller walls. Thus the total cost, the sum of
the costs of mitigation and of the expected loss, has a minimum at n*, the economically
optimum level of mitigation (Figure 5a). More mitigation gives less expected damage but
higher total cost, whereas less mitigation decreases construction costs but increases the
expected damage and thus total cost.
Because the expected loss and mitigation cost vary along the coast, the optimal
mitigation level also varies. For sparsely populated areas, n* shifts leftward, implying
lower mitigation levels. Where expected losses are greater, such as urban areas or sites of
critical facilities, n* shifts rightward, justifying higher mitigation.
How this works can be seen by considering the derivatives of the functions
(Figure 5b). Because increasingly high levels of mitigation are progressively more costly,
the marginal cost function C’(n) increases with wall height. Similarly, –Q’(n) is the
marginal mitigation from a small increment of wall size. As the wall size rises, the gain in
mitigation decreases. The lines intersect at the optimal point n*, the highest level to
which it pays to build the wall. If the intersection occurs where n* is positive, it pays to
build a wall. However, if even when the wall height is zero the incremental cost of a wall
C’(0) is greater than the incremental gain in mitigation -Q’(0), it does not pay to build a
wall.
The cost K(n) reflects the mean value of the expected loss, but does not include the
variance due to its uncertainty. For a given mitigation n, the total cost could be higher or
lower than K(n) because the tsunami loss can be higher or lower than its expected value,
due largely to the uncertainty in the hazard model. In addition, we are risk averse in

Gray Swans: Comparison of Natural and Financial Disaster Mitigation 4/16/12 22
hazard mitigation planning. Risk aversion can be visualized using a game in which the
probability of winning or losing $1 is the same, but we place greater weight on avoiding
losing than on winning. Risk aversion is the ratio of the gain to the loss necessary to
induce the player to bet, which is greater than one.
The combined effects of uncertainty and risk aversion can be included by adding
a risk term (Stein, 2012) R(n) to the mitigation term Q(n). R(n) is the product of the risk
aversion and the variance of the estimated cost as a function of n. Greater risk aversion or
greater uncertainty increase R(n). Because the wall height should be increased as long as
the marginal mitigation and decline in risk term -[Q‘(n) + R’(n)] exceeds the
incremental cost of the wall, the optimum height increases from n* to n**.
Figure 5. a) Variation in total cost, the sum of expected loss and mitigation cost, as a function of mitigation level. The optimal level of mitigation, n*, minimizes the total cost. b) Same analysis shown by the derivatives. The optimal level of mitigation, n*, occurs when the gain in mitigation -Q’(n) equals the incremental construction costs C’(n). Including the effect of uncertainty and risk aversion, the optimal wall height n** occurs when the incremental cost equals the sum of the incremental mitigation and incremental decline in risk R’(n).
Jerome Stein � 4/15/12 4:48 PM
Jerome Stein � 4/15/12 4:48 PM
Comment:
Comment:

Gray Swans: Comparison of Natural and Financial Disaster Mitigation 4/16/12 23
Applying this approach requires various calculations. The first, the mitigation
cost, is straightforward. The second requires tsunami models and the present value of
predicted losses. The largest challenge involves calculating the probability of a tsunami
of a certain height. The fact that the March tsunami was much greater than predicted
showed that hazard models that predict the future occurrences of these events have large
uncertainties. Improvements should be forthcoming (Kanamori, 2012) from more
effective use of the earthquake history (McCaffrey, 2007), paleotsunami record (Minoura
et al., 2011; Nanayama et al., 2003), geodesy (Newman, 2011; Simons et al., 2011), and
other technologies. Even so, significant uncertainties will remain, but can be estimated
and included through the R(n) function. Thus this formulation can be used to explore
appropriate policies under alternative scenarios. It illustrates the importance of improving
hazard models, because overestimating or underestimating the hazard leads to too much
or too little mitigation.
Similar situations arise for other natural hazards including hurricanes and
earthquake ground shaking. The goal is to assess the hazard and chose a level of safety
that makes economic sense, because such mitigation diverts resources from other uses.
Ideally mitigation should not be too weak, permitting undue risks, or too strong, imposing
unneeded costs. Ultimately, decisions on natural hazard mitigation policy are made
through a political process also reflecting non-economic factors. Nonetheless, input from
combined geophysical and economic analysis can improve the decision making.
5.2 Avoiding the next crash
Government regulations designed to minimize the financial system's vulnerability
could have mitigated the 2008 U.S. financial disaster. The crucial variable in financial
vulnerability is a firm's leverage ratio L, defined as the ratio of its assets, A, to net worth,
X. Net worth is the difference between assets and debts, D, so
X=A-D L=A/X
Gray Swans: Comparison of Natural and Financial Disaster Mitigation 4/16/12 24
Over time, the fractional change in a firm's net worth is the difference between the return
on its investments and the cost of interest on its debt
dX/X = d(A-D)/X = dA/X - dD/X = (dA/A)(A/X) - (dD/D)(D/X) = RL - i(L-1)
where R= (dA/A) is the return on investments due to the productivity of the assets and the
capital gain due to the change in their value, and i=(dD/D) is the interest rate on the debt.
A drop in asset value, a negative R, can be viewed as a financial hazard due to
market changes, and the resulting drop in net worth is the risk to the firm. Because the
change in net worth depends on the change in asset value R times the leverage L, higher
leverage makes the firm more vulnerable to a drop in asset value. Thus risk =
(hazard)(vulnerability) = (drop in asset value)(leverage).
In 2007 the major investment banks - Bear Stearns, Goldman Sachs, Lehman
Brothers, Merrill Lynch and Morgan Stanley - were operating with leverage ratios as high
as 40. Thus a 3% drop in asset values would wipe out the firm. Such high leverage ratios
made the economy vulnerable and helped convert the subprime crisis in the housing
industry into widespread disaster.
Proposed new regulations would mitigate this hazard by reducing the
vulnerability due to excessive leveraging. The question is what is a desirable degree of
leverage? The debate centers on the Volcker rule, a proposed part of the Dodd-Frank
financial reform act, which would limit the liabilities of the largest banks. However,
without adequate leverage, financial markets do not provide a sufficiently high rate of
return to attract capital. Critics thus argue that the rule will raise the cost of credit for
companies wishing to invest in new plants, research and development, or increasing
employment. Society has to balance the costs of mitigation against their benefits, and
decide on the appropriate level of mitigation.

Gray Swans: Comparison of Natural and Financial Disaster Mitigation 4/16/12 25
6. Summary
Comparison of a major natural disaster and a major economic disaster illustrates
the presence of analogous aspects, such that studying one provide insights for the other.
Both disasters resulted from hazards that were inadequately assessed by existing models
and vulnerabilities that were unrecognized or underestimated. Preventing both types of
disasters from recurring involves the difficult task of balancing the costs and benefits of
mitigation policies, given that the benefits have to be estimated using models to infer the
probabilities of future events. Thus although one type of disaster has natural causes and
the other has economic causes, comparison between them provides useful insights for the
challenging tasks of improving hazard assessment and mitigation policies.
References
Ando, M., Source mechanisms and tectonic significance of historical earthquakes along the Nankai Trough, Japan, Tectonophysics, 27, 119-140, 1975. Ando, M., Ishida, M., Hayashi, Y., Mizuki, C., Interviews with survivors of Tohoku earthquake provide insights into fatality rate, Eos Trans. AGU, 46, 411, 2011. Appelbaum, B., Inside the Fed in 2006: a coming crisis and banter, New York Times January 12, 2012. Bommer, J., Deterministic vs. probabilistic seismic hazard assessment: an exaggerated and obstructive dichotomy, J. Earthquake Engineering, 6, 43-73, 2009. Castanos, H., and C. Lomnitz, PSHA: is it science?, Engineering Geology, 66, 315-317, 2002. Chang, K., Blindsided by ferocity unleashed by a fault, New York Times, March 21, 2011. Chiles, J., Inviting Disaster: Lessons from the Edge of Catastrophe, Harper Business, New York, 2002. Cyranoski, D., Rebuilding Japan, Nature, 483, 141-143, 2012. CSEP (Collaboratory for the Study of Earthquake Predictability) http://www.cseptesting.org/home, 2011.
Gray Swans: Comparison of Natural and Financial Disaster Mitigation 4/16/12 26
Derman, E., My Life As A Quant, Wiley, New York, 2004. Financial Crisis Inquiry Report, FCIC, Public Affairs, N.Y, 2011. Geller, R. J., Shake-up time for Japanese seismology, Nature, 472, 407-409, 2011. Hebden, J., and S. Stein, Time-dependent seismic hazard maps for the New Madrid seismic zone and Charleston, South Carolina areas, Seis. Res. Lett, 80, 10-20, 2009. Kanamori, H., Putting seismic research to most effective use, Nature, 483, 147-148, 2012. Kerr, R., Seismic crystal ball proving mostly cloudy around the world, Science, 332, 912-913, 2011. Kossobokov, V. G., and A. K. Nekrasova, Global seismic hazard assessment program maps are misleading (abstract), EOS Trans. AGU fall meeting, 2010. Lomnitz, C., Comment on "temporal and magnitude dependance in earthquake recurrence models" by C. A. Cornell and S.R. Winterstein, Bull. Seismol. Soc. Am., 79, 1662, 1989. Lomnitz, C. and H. Castaños, Disasters and maximum entropy production, in Continental Intraplate Earthquakes, edited by S. Stein and S. Mazzotti, pp. 193-224, GSA, Boulder, 2007. Lowenstein, R., When Genius Failed, Random House, New York, 2000. McCaffrey, R., The next great earthquake, Science, 315, 1675-1676, 2007. Meng, G., et al., Crustal deformation in western Sichuan region and implications for 12 May 2008 earthquake, Geochemistry, Geophysics, Geosystems, 9, doi:10.1029/2008GC002144, 2008. Minoura, K., F. Imamura, D. Sugawa, Y. Kono, and T. Iwashita, The 869 Jogan tsunami deposit and recurrence interval of large-scale tsunami on the Pacific coast of Northeast Japan, J. Natural Disaster Sci., 23, 83-88, 2001. Moscow, A., Collision Course, Putnam, New York, 1981. Nanayama, F., et al., Unusually large earthquakes inferred from tsunami deposits along the Kuril trench, Nature, 424, 660-663, 2003. Newman, A., Hidden depths, Nature, 474, 441-443, 2011.

Gray Swans: Comparison of Natural and Financial Disaster Mitigation 4/16/12 27
Newman, A., S. Stein, J. Schneider, and A. Mendez, Uncertainties in seismic hazard maps for the New Madrid Seismic Zone, Seis. Res. Lett., 72, 653-667, 2001. Nöggerath, J., R. J. Geller, and V. Gusiakov, Fukushima: The myth of safety, the reality of geoscience, Bull. Atomic Scientists, 67, 37-46, 2011. Normile, D., One year after the devastation, Tohoku designs its renewal, Science, 335, 1164-1166, 2012. Onishi, N., Japan revives a sea barrier that failed to hold, New York Times, November 2, 2011a. Onishi, N., Seawalls offered little protection against tsunami's crushing waves, New York Times, March 13, 2011b. Onishi, N., In Japan, seawall offered a false sense of security, New York Times, March 31, 2011c. Onishi, N., ‘Safety Myth’ Left Japan Ripe for Nuclear Crisis, New York Times, June 24, 2011d. Onishi, N., and M. Fackler, Japanese officials ignored or concealed dangers, New York Times, May 16, 2011. Overbye, D., They tried to outsmart Wall Street, New York Times, March 10, 2009. Panza, G. F. et al., Advanced seismic hazard assessment, Pageoph., 168, 1-9, 2010. Reinhart, C. and K. Rogoff, This Time Is Different: Eight Centuries of Financial Folly, Princeton, 2009. Ruff, L., and H. Kanamori, Seismicity and the subduction process, Phys. Earth Planet. Inter., 23, 240-252, 1980. Salmon, F., Recipe for disaster: the formula that killed Wall Street, Wired Magazine, February 23, 17.03, 2009. Simons, M., et al., The 2011 Tohoku-Oki earthquake, Science, 332, 1421-1425, 2011. Stein, J. L., Stochastic Optimal Control and the U.S. Financial Debt Crisis, Springer, New York, 2012. Stein, J. L., and S. Stein, Rebuilding Tohoku: a joint geophysical and economic framework for hazard mitigation, GSA Today, submitted, 2012.
Gray Swans: Comparison of Natural and Financial Disaster Mitigation 4/16/12 28
Stein, S., and E. A. Okal, Ultralong period seismic study of the December 2004 Indian Ocean earthquake and implications for regional tectonics and the subduction process, Bull. Seismol. Soc. Am., 87, S279-S295, 2007. Stein, S., and E. A. Okal, The size of the 2011 Tohoku earthquake needn't have been a surprise, Eos Trans. AGU, 92, 227-228, 2011. Swafford, L., and S. Stein, Limitations of the short earthquake record for seismicity and seismic hazard studies, in Continental Intraplate Earthquakes, edited by S. Stein and S. Mazzotti, pp. 49-58, GSA, Boulder, 2007. Taleb, N. N., The Black Swan, Random House, New York, 2007. Wang, Z., Seismic hazard assessment: issues and alternatives, Pure. Appl. Geophys., 168, 11-25, 2011. White, G. F., Natural Hazards, Oxford University Press, New York, 1974. Winchester, S., A Crack in the Edge of the World: America and the Great California Earthquake of 1906, Harper Collins, New York, 2005.