Jerker Andersson - D. Carnegie & Co Group · Jerker Andersson Born in Bollnäs in 1963. Painter,...
138
ANNUAL REPORT 2016
Transcript of Jerker Andersson - D. Carnegie & Co Group · Jerker Andersson Born in Bollnäs in 1963. Painter,...

ANNUAL REPORT 2016

Jerker AnderssonBorn in Bollnäs in 1963. Painter, draughtsman and printmaker. Attended the Gerlesborg Art School in Stockholm, but is otherwise self-taught. Jerker Anders-son enjoys painting folklore subjects and often seeks inspiration from events and ideas in the traditions of Hälsingland. In recent years, Jerker Andersson has also worked in granite, including large sculptures carved from a single piece of rock. Jerker Andersson’s work is represented in collections owned by Bollnäs Munici-pality, Folkparkernas Riksorganisation, the Swedish Public Employment Service in Bollnäs, Sankt Lars Kapell etc.
D. Carnegie & Co supports contemporary artists, preferably related to the Swedish “Million Programme” public housing project.

CONTENTS
The Year in brief
D. Carnegie & Co in brief
Statement from CEO 2
Strategy and market 4
Property portfolio 12
Renovation and improvement 16
Sustainable development 24
Share, shareholders and risks 30
Corporate governance 40
Board of Directors and auditors 48
Senior Management 50
FINANCIAL STATEMENTS 52
Directors’ Report 53
Consolidated Income Statement 60
Consolidated Statement of Comprehensive Income
60
Consolidated Balance Sheet 61
Consolidated Statement of Changes in Equity 62
Consolidated Cash Flow Statement 63
Parent Company Income Statement 64
Parent Company Balance Sheet 65
Parent Company Statement of Changes in Equity 66
Parent Company Cash Flow Statement 67
Notes 68
Audit Report 93
List of Properties 96
Definitions 132
Investor Information Calendar 133

Jan – Dec2016
Jan – Dec 2015
Jan – Dec 2014
Rental income, SEK m 1,284.3 1,217.4 608.7
Net operating income, SEK m 630.5 554.1 257.6
Surplus ratio, % 49.1 45.4 42.3
Income from property management, SEK m 269.4 186.2 42.4
After-tax profit, SEK m 1,678.3 1,139.1 233.1
Earnings per share SEK, before dilution 22.20 16.10 4.8
Earnings per share SEK, after dilution 21.93 13.50 4.3
Equity per share SEK 82.60 62.06 45.7
Adjusted equity (European Public Real Estate Association (EPRA) net asset value (NAV)) per share, SEK 101.96 73.50 51.99
Market value of investment properties, SEK m 16,997.9 13,826.4 11,520.80
Equity/assets ratio, % 33.8 28.2 25.4
Equity/assets ratio, adjusted, % 41.7 33.4 29.1
KEY FIGURES
The year in brief
Q1 Q2
Q3
Q4
Completes disposal of Gothenburg portfolio.
Entered into agreement regarding repayment of con-vertible debentures to improve net financial items and reduce dilution.
Acquires property in Uppsala and divests a property with a potential development right in Solna.
First building permit granted on the company’s own land. 40 new housing units at the Finnsta 1:17 property in Upplands-Bro municipality.
Purchases of property portfolios in Eskilstuna and Katrineholm.
Guldkupol educates D. Carnegie & Co tenants on energy efficiency measures.
Conducts directed share issue to new and current shareholders.
Announces investment pro-gram equivalent to SEK 900 million over the next five years
Issues bond amounting SEK 1,000 million
Blackstone through Vega Holdco S.à.r.l.* becomes the company’s new principal owner.
New renovation team in place with the long-term capacity to renovate over 1,000 apartments per year.
AIK Football team becomes a new collaborative partner. Four major social sustainability projects will be implemented together in the Stockholm suburbs where D. Carnegie & Co owns apartments, starting at the beginning of 2017.
* A company that is wholly owned by real estate funds, advised by an affiliate to Blackstone Group L.P.

NO. OF APARTMENTS
16,358 MARKET VALUE SEK16,998 m
RENTAL INCOME, ANNUAL RATE
SEK 1,379 m
NET OPERATING INCOME, ANNUAL RATE
SEK 734 m
BEFORE-TAX PROFIT
SEK 2,072 m
EARNINGS PER SHARE
SEK 22.20
D. Carnegie & Co owns and manages residential properties with focus on Stockholm. Property management close to the tenant in order to provide the highest possible level of service, and we coop-erate closely with the communities in order to make our properties a long-term good place to live.
D. Carnegie & Co shall focus on:
Managing and developing properties in-house
Improving its portfolio and creating increased cash flows and strong value growth through D. Carnegie & Co’s well-tested renovation process
Developing building rights across the existing portfolio
Read more about the Renometer on page 6
D. Carnegie & Co in brief
2015
START
2016
20172019
2018
2020
2022
2023
2024
2025
COMPLETED!
2021
10,000 apartments are to be renovated by
2025

STATEM ENT FROM THE C EO
In 2016, we invested SEK 1 billion and noted an increase in value of our properties by almost SEK 3 billion. Together with a 45 per cent rise in profit from property management, the company has thus further improved its financial results. This offers us favourable conditions to continue to renovate and develop our residential areas. We have continued with large scale apartment renovations, but have also invested in com-mon spaces and in surrounding areas as well as measures to improve safety and well-being. Being a resident in our properties should be an entirely positive and safe experience.
Improving and adding valueDuring 2016, we renovated 1,253 apartments, which far exceeds our aim to renovate 1,000 apartments each year. We also continued investments in façades, heating installations, laundry facilities etc., which reduces maintenance costs and to some extent contributes to higher rental income. In total, the renovations in 2016 have enabled an increase in rental income by 4.7 per cent for comparable properties, while operating costs were reduced by 3.5 per cent and repairs and maintenance costs were reduced by 23 per cent. This is reflected in an increase of net operating income exceeding 13 per cent for comparable properties, which explains most of the value increase for the year. Our healthy profits enable us to continue investing in apartment renovations and the outdoor environment in our areas. Our assessment is that we will have renovated our entire current portfolio by 2025.
An overall approach for better living conditionsCreating good living environments requires physical investments, but also a sustained commitment. D. Carnegie & Co invests a considerable amount of time and money in creating safe and attractive living
Investment rate remains high
2016 has involved continued strong growth for D. Carnegie & Co. Through significant investments in existing properties and new acquisitions, we have during the past year created a healthy growth in value. At the same time, we have further strengthened our operational capacity and reduced expenses by using more efficient processes. We have also continued major investments to improve all aspects of living in our neighbourhoods.
environments for our tenants. We have a number of employees who during the evening and night to help create a safe and secure neighbourhood. We have also supported several social projects involving people from our communities and we have supported sports clubs to hold local initiatives for children and young people. I am particularly proud when tenants themselves say that we are creating more attractive neighbourhoods.
Satisfied tenants are our reward and during the past year we have worked systematically to improve our fol-low-up of how tenants appraise our efforts. This enables us to quickly implement improvement measures. Our strong and sustained commitment towards good housing also promotes a high level of employee satisfaction. Our employees feel that we do more than simply manage the properties, which contributes to our good results.
OutlookThere are strong indications of significant potential in our areas. Maintaining and developing existing resi-dential areas, in attractive locations is profitable and sustainable in both socioeconomic and commercial terms. During the year, D. Carnegie & Co will continue to develop additional properties, invest and renovate in existing areas. We will also intensify work with devel-opments of building rights to increase the attractiveness of our areas. It is likely that we will start our first new build in 2017.
We are continuously looking for new acquisitions, within and close to the areas where we operate, and signed an acquisition agreement in February 2017 for almost 1,700 apartments, which should close in May 2017. We are very hopeful that we can complete additio-nal acquisitions during the current year. We will continue to reinvest the value we create and with our own method renovate the areas – on the terms
2 D. Carnegie & Co AB (publ) Annual Report 2016

STATEM ENT FROM THE C EO
D. Carnegie & Co invests a consi-derable amount of time and money in creating safe and attractive living environments for our tenants.
of our tenants. This applies to apartments, common spaces and surrounding areas. Our aim is to invest even more in 2017 than in the previous year. We will also continue our commitment to the community aspects of our residential areas.
The living situation in the regions where we operate remains challenging and creates an underlying demand for our properties. It also creates the preconditions to improve the living environment for many years to come.
Stockholm, April 2017
Ulf NilssonCEO, D. Carnegie & Co
Annual Report 2016 D. Carnegie & Co AB (publ) 3

The RenometerD. Carnegie & Co’s progress in its thorough renovation process. p. 6
Overall and financial targetsOur entire property portfolio is to be renovated within ten years. Read more about the company’s overall and financial targets.
p. 6
Rental apartments an important alternativeHigh demand for housing makes it possible to renovate our property portfolio. p. 8
4 D. Carnegie & Co AB (publ) Annual Report 2016

MissionD. Carnegie & Co acquires, owns and manages properties to provide better housing for everyone.
Vision To develop and improve the company’s property portfolio into attractive modern housing units through good property management and thorough renovation.
Our operation – step by step
Our storyWe are motivated by a strong belief in the oppor-tunity to develop and improve the environment in the so-called “Million Program” areas that were built in the 1960s and 1970s. Economic growth and high demand for apartments in the Stock-holm region make investments in older housing profitable. D. Carnegie & Co creates significant values in these areas through extensive invest-ments. Values that benefit residents and the community, and that contribute to continued renewal and development.
We take a long-term approach to ownership, and our objective is for all of our properties to be renovated within a ten-year period. Apartments are modernised and improved only when tenants move voluntarily. Our commitment even extends to the development of the area, and we invest in the outdoor environ-ment, in communal spaces and complementary new building. Through our presence and commitment, we create an environment that invokes pride and satisfaction among residents, which is a positive force for the surrounding community.
D. Carnegie & Co’s modernisation and improvement process builds on three steps – Renovation, Improvement and New development.
Renovation Improvement New development
STR ATEGY AND MAR KE T
Annual Report 2016 D. Carnegie & Co AB (publ) 5

2015
START
2016
20172019
2018
2020
2022
2023
2024
2025
COMPLETED!
2021
“The Renometer” D. Carnegie & Co’s objective is for an acquired prop-erty to be renovated within ten years. This means that over 10,000 apartments should be renovated by 2025. D. Carnegie & Co had renovated 2,000 apartments in total by year-end, 1,253 of them in 2016, with more satisfied tenants as a result. D. Carnegie & Co’s model
of renovating apartment by apartment allows the company to avoid costly relocations and interruptions in rent. This benefits both the company and its tenants. D. Carnegie & Co’s “Renometer” shows the progress of the renovation work on a continual basis.
10,000 apartments are to be
renovated by
2025
15% completed in 2016
1,253 apartments renovated in 2016
STR ATEGY AND MAR KE T
Overall targets • All apartments are to be renovated within ten years of
D. Carnegie & Co acquiring a given property
Results in 2016 1,253 refurbished apart ments in 2016
In total SEK 1,039 million invested in current properties
6 D. Carnegie & Co AB (publ) Annual Report 2016

The flow for better housing D. Carnegie & Co’s renovation strategy produces gradually increased operating income, which in turn increases the company’s ability to continue its rapid improvement and investment approach. This becomes possible through both higher cash flow and higher property values which produce greater borrowing opportunities. More renovated apartments produce more satisfied tenants, and at the same time greater
scope for investment which generates continued renovations and investments in the outdoor environ-ment. This is a long-term sustainable model where the company’s profits continuously benefit tenants and the surrounding community. The company invested over SEK 1 billion last year, which is equivalent to 250 per cent of its income from property management, in renovations.
Improvement/Renovation
Acquired properties
Renovated properties
Funds for renovation
+ Higher operating income
+ Increased value of the property portfolio
STR ATEGY AND MAR KE T
Financial targetsD. Carnegie & Co has the following long-term financial targets:
• 10 per cent annual growth in the value of its existing portfolio per cent
• A maximum 65 per cent loan-to-value ratio
• Equity ratio of at least 30 per cent
Results in 2016
Growth in value of 12.9 per cent
LTV of 54 per cent
Equity ratio of 33.8 per cent
Annual Report 2016 D. Carnegie & Co AB (publ) 7

Rental apartments – an important alterna-tive in Stockholm, which is suffering from a housing shortage
A growing population increases demand for housingAt year-end the population of Stockholm County was nearly 2.3 million inhabitants, which corresponds to an increase of about 33,000 new Stockholmers last year. The urbanisation trend is predicted to continue in the next few years, and Stockholm County is expected to grow to 2.6 million inhabitants by 2025, which corre-sponds to an annual growth rate of 1.6 per cent. The
0
10,000
20,000
30,000
40,000
New building – Stockholm County
1975 1980 1985 1990 1995 2000 2005 2010 2015
Population growth – Stockholm County
Housing needs (estimated to 680 apartments per 1 000 inhabitants)
Population growth higher than new construction
capital region’s high population growth is increasing demand for housing in a market that already suffers from a severe housing shortage in its current state.
According to the Swedish National Housing Board, there is a need to build 710,000 new housing units in Sweden by 2025. The annual need for new production in Stockholm County is estimated at 21,000 new apart-
STR ATEGY AND MAR KE T
8 D. Carnegie & Co AB (publ) Annual Report 2016

0
100,000
200,000
300,000
400,000
500,000
600,000
700,000
Housing queue Stockholm Apartments transferred relative to housing queue
20152014201320122011201020092008200720062005 20160%
1%
2%
3%
4%
5%
6%
7%
Two apartments transferred per 100 in the queue
ments per year until 2030. This is a significant increase relative to the pace of new production in recent years, which has been around 12,000 new housing units per year. The high demand for housing and historically low levels of new production have had an obvious impact on both the price level of housing and the size of the housing queue.
Two apartments transferred per 100 in the queueIn 2016, the average waiting time for a rental apartment in the Stockholm region was nine years, and at the end of the year 556,000 people were in the housing queue. The housing queue has increased by 420,000 people since 2005. At the same time, the number of apartments transferred annually only increased by 4,000, from approximately 8,000 apartments transferred in 2005 to approximately 12,000 apartments in 2016. In 2016, only two apartments were transferred per 100 people waiting in Stockholm’s housing queue.
Rental apartments meet the need for mobilityGreater access to rental apartments improves flexibility in the housing market and creates improved prospects for growth through simplified moving processes and lower transaction costs when moving to new housing.
In 2016 the aver-age waiting time for a rental apartment in the Stockholm region was nine years, and at the end of the year 556,000 people were in the housing queue.
As the cost of tenant-owner apartments rises, rental apartments become an increasingly important require-ment as the need for mobility continues to increase. The renovation of existing portfolios and new production are two important methods to increase access to attractive rental apartments.
Renovation of the existing property portfolio is fur-thermore an important part of Sweden’s sustainability strategy: taking advantage of existing buildings is more sustainable in the long term than demolishing them and building new ones. In D. Carnegie & Co’s view, this fact will become increasingly important in the future. The Million Programme, which consists of proper-ties constructed between 1965 and 1975, is well-built, generally has good transportation connections and is located close to green areas. Responsible improvement and reinvestments to restore the areas to new condition
STR ATEGY AND MAR KE T
Annual Report 2016 D. Carnegie & Co AB (publ) 9

are an important part of the solution to how Sweden is to continue growing.
High demand also makes renovation possibleThe housing shortage, combined with low interest rates, also affects the financial conditions for financing thor-ough renovations. Due to low interest rates, investors who require low risk such as pension companies and other institutions have found it increasingly difficult to receive reasonable returns on their investments. Since the widespread housing shortage has minimised the risk of vacancies in the housing stock, especially in the Stockholm region, these investors have become increas-ingly interested in housing. Higher demand combined with extremely low vacancy risk has reduced yield requirements and raised prices for residential properties all over the country.
Of course, higher values are positive for the property owners, but they are also positive for tenants since they make it possible to thoroughly renovate the housing units. When the properties are improved, their value rises further, and as a result, the owners of the properties can invest more in the properties than the surplus from property management actually produces. Increases in value are calculated in the profit/loss in the company’s accounts, which produces a positive net effect from thorough renovations.
The current situation is important to D. Carnegie & Co in making such thorough uplift of its portfolio.
STR ATEGY AND MAR KE T
10 D. Carnegie & Co AB (publ) Annual Report 2016

Meeri Wasberg – Social Democratic local government commissioner in Haninge
About Meeri WasbergSocial Democratic local government commissioner in Haninge after the 2014 election, previously a member of parliament. Background as an employment adviser.
About HaningeLocated south of Stockholm, with a population of about 85,000. Governed by the Social Democratic, Green and Centre Parties since 2014. There are several large residential areas in the municipality built in the 1960s and 1970s, including Brandbergen and Jordbro.
How would you describe the housing in the Million Programme areas?In many ways, these areas provide exactly what the modern city dweller demands. The housing is relatively dense providing an urban atmosphere, while at the same time it is close to green areas, both within the area and beyond its borders. In addition, there is often good access to public transport. In general, the buildings are well constructed and the apartments are thoughtfully planned for both families with children and smaller households. I lived for a while in Jordbro myself, and I really appreciated the lovely car-free areas between buildings.
But don’t certain of these areas have a bad reputation?I think this is undeserved. Many of the people who live here like it and stay for a long time. On the other hand, it has not been possible to take good care of every location. Mainte-nance of both properties and the outdoor environment has been neglected in many areas. This is partly because there have been too many property owners who lacked a long-term perspective and did not understand the value of taking care of their investment.
How do you view the future for these areas?In the first place, I think we should stop saying bad things about the Million Programme areas. We need to upgrade the rental apartments as a form of housing instead. This is necessary if we are to cope with rapid in-migration to the
metropolitan areas and increasing mobility. I would like to see additional densification, both vertically and horizontally. A lot of the infrastructure is already in place.
In the second place, I hope there will be more property owners who dare to engage in long-term thinking. Investing and putting effort into active property management, close to the residents, is a win-win for long-term companies, res-idents and society. Many of the areas that were built in the 60s and 70s have great potential to be attractive housing in our growth areas. But players who are willing to devote attention to both the buildings and the people who live there are needed.
STR ATEGY AND MAR KE T
Annual Report 2016 D. Carnegie & Co AB (publ) 11

Geographical distribution of the stock and level of renovationDiscover where D. Carnegie & Co’s dwelling stock is situated and how large part that is renovated. p. 13
Model for value assessmentProperty value is an important factor in D. Carnegie, revise how it is being calculated. p. 14
12 D. Carnegie & Co AB (publ) Annual Report 2016

PROPERT Y PORTFOL IO
Property portfolio
Population increase raises the demand for propertiesD. Carnegie & Co’s property portfolio consists mainly of residential properties in Greater Stockholm and growth areas in Mälardalen. The portfolio consists to a large extent of residential properties built in the 1960s and 1970s and which are part of the so-called Million Program. Property located in growing metropolitan areas, strategically located along railways, close to green areas and with well-planned apartments are built with quality and excellence. However, they are more often described in terms of social, environmental and eco-nomic problems.
Of the company’s total property portfolio, over 60 per cent is located in Greater Stockholm, in areas such as Jord-bro, Husby, Rinkeby and Södertälje. D. Carnegie & Co is a long-term owner that in parallel with renovation, environ-mental improvement and management is also working systematically on measures to raise the prestige of the areas with both the residents and the public at large.
Comparisons in brackets refer to amounts for the equivalent period in the previous year.
City/Neighborhood Lettable areaNumber of
apartmentsPercentage
renovatedFair value, 31
December 2016
Greater Stockholm
Kista/Husby 110,324 1,528 18.3% 1,616,000
Bromsten/Rinkeby 111,616 1,281 20.2% 1,531,350
Sollentuna 33,730 454,000 11.0% 505
Flemingsberg 40,413 573,000 9.2% 534
Vårby/Vårberg 66,858 863,000 7.0% 799
Jordbro 157,840 1,954 13.1% 1,921,000
Södertälje 159,964 2,110 11.7% 2,429,770
Bro 43,752 540,000 9.3% 541
Märsta 57,105 693,000 7.8% 748
Total Greater Stockholm 781,602 9,996 13.1% 10,625,576
Uppsala 75,507 968,000 9.7% 1,026,800
Eskilstuna 145,741 1,964 10.9% 1,849,960
Strängnäs 35,477 411,000 11.9% 512
Norrköping 172,735 2,301 14.6% 2,219,300
Katrineholm 61,128 718,000 1.7% 723
Total other locations 490,588 6,362 11.1% 6,331,247
Other (land, building rights, etc) 2,632 - - 41
Total 1,274,822 16,358 12.3% 16,997,923
D. Carnegie & Co´s property portfolio December 31, 2016
Annual Report 2016 D. Carnegie & Co AB (publ) 13

Apartment Renovations and investmentsA total of 1,942 (686) apartments in D. Carnegie & Co’s current holdings have been renovated since 2014, of which 1,253 apartments were renovated in 2016 (527). Overall, SEK 1,039 million (491) was invested in existing properties during the year, which also includes the renovation of the common areas and the external environment. Investing in local neighbourhoods is an integral part of D. Carnegie & Co’s renovation strategy that gives more satisfied tenants and also influences property values positively.
Acquisitions and divestmentsSEK 780 million (955) of the total investment of SEK 1,819 million (1,446) was spent on the acquisition of new properties. During the year, four properties were sold during the period (January-December) at a market value of SEK 586 million (447).
Property valuesAt 31 December 2016, D. Carnegie & Co’s property portfolio was valued at a market value of SEK 16,998 million. The property holding has been valued according to the methodology described below where 100 per cent of the stock was valued by a third party. The external property valuations have been carried out by Savills. The numbers within parenthesis regards the same item but previous year.
Model for the valuationThe valuation is based on cash flow analysis, meaning that the value of the property is based on the present value of projected cash flows during the calculation period of five years plus residual value.
The yield on the constituent valuation units varies from 3.76 per cent to 8.00 per cent with an average total of 4.31 per cent compared with 4.84 at the end of the year, 2015. The assumption regarding the future cash flows is based on the analysis of:
• Market / immediate vicinity future development
• The property market’s conditions and market position
• Market rental conditions
• Operation and maintenance costs of similar properties in comparison with those in the current property
On the basis of the analysis, the result of the net operating income during the calculation period (2017-2021) and a residual value at the end of the calculation period have been subsequently discounted with the estimated discount rate in the range of 5.84 to 10.16 per cent. The average
discount rate used for the period was 6.40 per cent (6.94). The value-influencing parameters used in the valuation correspond to the external valuer’s interpretation of how a prospective buyer in the market would reason and the sum of the present value of net operating income and residual value is the market value.
Potential building rights have been valued on the basis of location price studies and location in the planning process. The building rights have been valued at SEK 250-8,000 per square meter gross total area upon completion plan. Deductions from these values are made to reflect the estimated location in the detailed planning process. The total area of potential development rights with value, is estimated at 232,300 m2 gross total area. The potential development rights have per 31 December 2016 been valued at a market value of SEK 311 million – the valuation of the building rights was unchanged during 2016. Only potential building rights that progressed far enough in the planning process were assigned market value. The total change in value of the pro-perty portfolio during the period was 12.9 per cent (10.4).
PROPERT Y PORTFOL IO
14 D. Carnegie & Co AB (publ) Annual Report 2016

Annual Report 2016 D. Carnegie & Co AB (publ) 15

Renovations in practiceThis is the process in three steps. p. 18
In-house property managementD. Carnegie & Co is devoted to providing local property management in order to increase satisfac-tion and security.
p. 19
How to create an attractive housing environmentIt is extremely important to create residential areas where residents are satisfied and feel secure. Read more about examples of partnerships in the areas of culture, sport and other social activities.
p. 20
16 D. Carnegie & Co AB (publ) Annual Report 2016

RENOVAT ION AND I M PROVEM ENT
A well-proven renovation process
As a property owner with a portfolio that was primarily built in the 1960s and 1970s, D. Carnegie & Co is facing the same opportunities as many other housing owners, driven by the potential to renovate apartments and areas to a modern standard. D. Carnegie & Co does not do what others do – instead of vacating and renovating entire floors or properties, renovations are performed apartment by apartment as relocations naturally take place. A process that produces higher-quality, lower costs and higher rental income, as well as giving residents freedom of choice.
The rental apartments in D. Carnegie & Co’s property portfolio often have good light and are well-planned with good layouts, but they are often in need of reno-vation. The same applies to communal spaces and the outdoor environment. D. Carnegie & Co’s objective is to renovate over 1,000 apartments every year – which means that the company begins four to five new apart-ment renovations every working day. The natural annual relocation rate in the company’s property portfolio is between 7 and 8 per cent. This makes D. Carnegie & Co’s renovation process possible – renovations are performed apartment by apartment as tenants move or choose to have their apartment renovated. This means that the company avoids expensive relocation initiatives, which would mean inconvenience and stress for the res-
D. Carnegie & Co’s objective is to renovate at least 1,000 apartmentsevery year.
idents as well. Moreover, the relocation rate is increased by offering existing tenants the opportunity to move within the portfolio to a renovated apartment, an option that is highly appreciated and utilised.
Annual Report 2016 D. Carnegie & Co AB (publ) 17

renovation process, lower property management costs and higher rents – as a result of higher utility value and a better standard.
It’s important for the company to retain control over the renovation process in order to be able to manage the renovation work according to its own procedures and to accumulate lessons and experience. Procedures are continually updated in order to streamline the process. The systematic approach and procedures also play an important role during the property management phase – once the renovation of the apartment is complete, the equipment in the apartment and their makes and models are all documented. When something needs to be fixed or replaced, it’s easy for the repair person to know which materials will be needed in that particular apartment.
D. Carnegie & Co’s process and model for reno-vations are the key to understanding the company’s approach and how it addresses the needs across its portfolio.
A holistic view of the renovation processD. Carnegie & Co is attentive to the whole, and the company’s objective is to create residential environments that are at least as secure and attractive as entirely newly-
RENOVAT ION AND I M PROVEM ENT
1Natural relocationWhen a tenant terminates their lease in order to move, the three-month notice period is used to plan the renovation of the apartment in detail. Materials are ordered and contractors are engaged.
2Apartment renovationOnce the notice period is over and the tenant has left the apartment, the building contractor and construction managers can immediately begin renovating the apartment according to a detailed plan. The renovation period ordinarily lasts for about six weeks and follows clear procedures and processes in order to avoid downtime and delays. The materials are of high quality, and they are chosen in order to achieve low maintenance costs and good sustainability.
3LettingWhile renovation is in progress, the apartment is offered first to D. Carne-gie & Co’s queue for newly renovated apartments. The higher standard means a higher utility value, which justifies a higher rent level.
Demand for the newly renovated apartments is high, and the majority are let to people who are already tenants of D. Carnegie & Co and who voluntarily choose to pay higher rent for a better standard.
Higher revenues and lower mainte-nance costs mean higher net operat-ing income, which improves cash flow and raises property values, which in turn enables further renovations.
This is the process in practice:
Advantageous to both the tenant and the property ownerThe guiding principle of D. Carnegie & Co’s renovation model is to consistently choose high-quality materials and equipment with quality sustainable design. The basic idea is that everyone would like to have high qual-ity and an attractive place to live. This is made possible through cost-effective purchases, strict control of the
18 D. Carnegie & Co AB (publ) Annual Report 2016

produced areas. In order to achieve this, the company renovates all communal spaces, exteriors and outdoor environments in addition to apartments. Even unseen features such as heating systems and pipes are replaced, which reduces costs and creates housing that is sustainable in the long term. Over the last year, D. Carnegie & Co has invested half of the billion SEK on renovations out-side the apartments. By making large-scale purchases and through efficient procurement, D. Carnegie & Co succeeds in achieving profitability even in these invest-ments. Despite the fact that they often do not entail raising the rent initially they imply cost reductions and raise the long-term value of the area and thus of the properties.
In order to make its properties secure and attractive, the company also invests in soft values such as invest-ments in local sports initiatives for children and adoles-cents, initiatives to help isolated women enter the labour market, support and participation in Neighbourhood Watch groups, etc.
D. Carnegie & Co also develops its property portfo-lio by driving the creation of new detailed development plans that makes new housing units possible adjacent to the existing ones. This new production will mean new
tenants and attractive environments that contribute to the whole.
Taken together, these comprehensive measures will create considerably better housing while at the same time the areas’ value potential is realised and the compa-ny’s investments become sustainably profitable.
Local in-house property managementD. Carnegie & Co is devoted to providing local property management and offering its tenants a high standard and service-level, both in the apartments and in the area where they are located. With over 16,000 apartments, D. Carnegie & Co is one of the largest private players in the residential property field. Tenants must feel that they get full value for their rent with D. Carnegie & Co. This means satisfaction and security, which in turn means attractive areas.
The company’s in-house management has been built up as the property portfolio has expanded. D. Carnegie & Co prioritises daily contact with tenants through its own presence in the residential area. This produces better quality, knowledge, trust and security.
Today, over 150 employees in the property manage-ment organisation work on site in the residential areas
RENOVAT ION AND I M PROVEM ENT
Therese Afram – Letting coordinator in Södertälje
What is a typical day like for you?There are no typical days here – every day is different! But that’s what’s fun about this job. There are always new challenges and you learn new things every day. If problems arise you need to dare to think outside the box. It's important to have a positive attitude and work together with your co-workers. That's how it is at D. Carnegie & Co!
What’s important to tenants’ satisfaction?Personal contact. We’ve been having what we call “floor meetings”. We invite the tenants from several floors, serve coffee and cake and listen to what they have to say. It’s good that we can exchange thoughts and ideas and hear the tenants’ views on the area and what we can develop together. What are you most proud of in your work?Being able to work at a property company that renovates apartments, fixes up outdoor environments and provides security for residents. This year, 15 young people worked here during their Christmas holiday. It’s great to be able to give them the opportunity to have their first job. And it has positive effects – the improvements to the outdoor environment are noticeable, and other tenants have noticed this as well. The initiative was much appreciated!
What’s your best memory from 2016?We worked hard on pressing down our vacancy costs for renovated apart-ments, and it has produced results. I hope to continue these efforts in 2017.
Annual Report 2016 D. Carnegie & Co AB (publ) 19

– property caretakers, operating personnel, adminis-trative assistants and workmen – who all have personal responsibility, know their area and know the residents. The organisation is divided into seven geographic regions that each constitute a separate profit centre and are led by a regional director. Through a daily presence in the areas, everyday relationships are established with the tenants and the company rapidly receives current information about events that affect property man-agement and can often deal with problems before they become large ones, which in turn is cost-effective as well as improving quality for the tenants.
Safety hosts build securityLike many other property companies, D. Carnegie & Co has occasionally encountered social unrest, damage and other issues that have meant a sense of insecurity and dissatisfaction for tenants. It is important to turn around such situations in order to fulfil the compa-ny’s ambition of raising the standard in the areas. One example is Järva, where the company has replaced the security car that circulated in the area with two locally employed safety hosts who have lived in similar areas for a long time themselves. They move among the residents both day and night, know “everyone”, know what’s happening and can speak with young people and others moving about the neighbourhood in a way that inspires confidence. Security grows while damage and thereby repair costs are reduced through the activity of the field workers. The positive experiences from Järva are now being applied to other areas.
Cooperation with tenantsD. Carnegie & Co’s strategy is built on close coopera-tion with the residents. In negotiations with the local tenants’ association, discussion concerns not only rent trends, but also renovations, improvement of outdoor environments, communal premises and service. The company’s view is that a knowledgeable and responsible local tenants’ association is an important representative of the company’s tenants. Therefore the tenants’ associ-ation functions as a partner that enables the company to meet tenants’ needs and wishes.
D. Carnegie & Co also cooperates with players such as the property owner associations and municipalities in order to create a better residential environment. Together with these players and with the tenants, the company sup-ports and cooperates in Neighbourhood Watch groups to increase security and satisfaction in the areas.
How to create an attractive housing environmentD. Carnegie & Co’s ambition is to create residential areas where residents are highly satisfied. Efforts to achieve this are focused on activities that have a direct impact on tenants’ residential environment, whether it comes to culture, sport or hiring committed people with local connections. Examples of projects implemented during the year are “Ice hockey for everyone”, “Let’s shake hands against vandalism” and “Role models in the suburbs”.
RENOVAT ION AND I M PROVEM ENT
20 D. Carnegie & Co AB (publ) Annual Report 2016
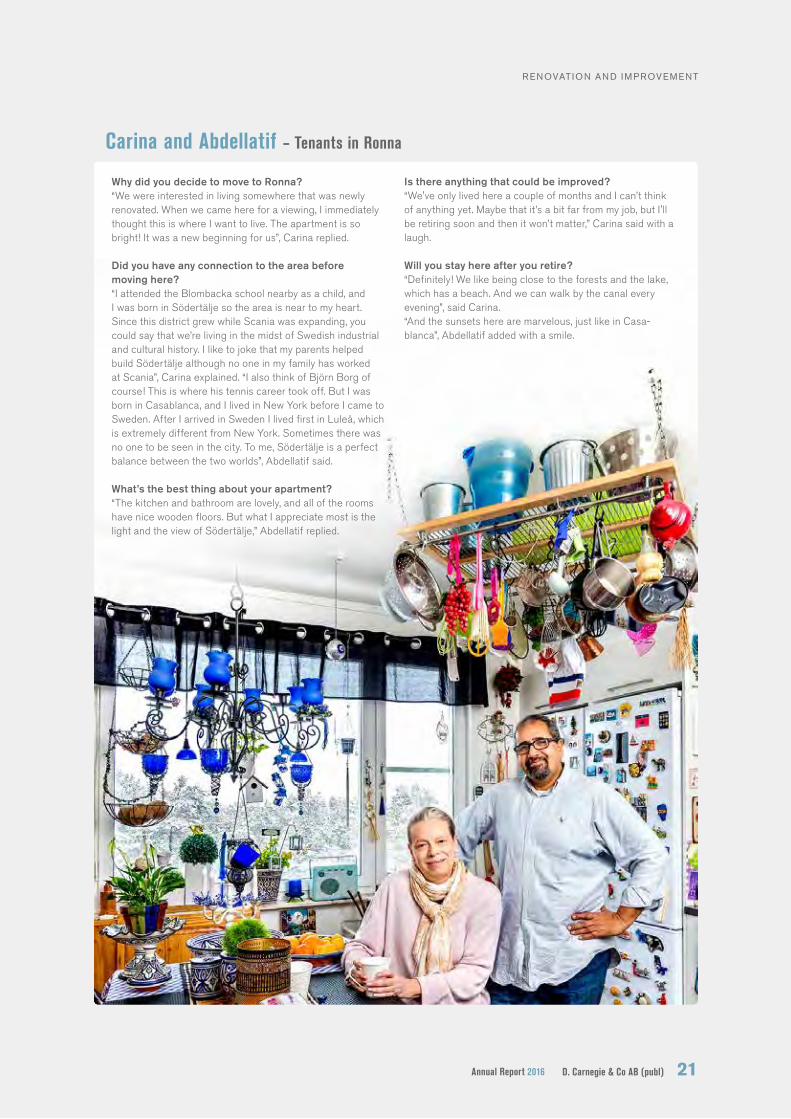
Carina and Abdellatif – Tenants in Ronna
RENOVAT ION AND I M PROVEM ENT
Why did you decide to move to Ronna?“We were interested in living somewhere that was newly renovated. When we came here for a viewing, I immediately thought this is where I want to live. The apartment is so bright! It was a new beginning for us”, Carina replied.
Did you have any connection to the area before moving here?“I attended the Blombacka school nearby as a child, and I was born in Södertälje so the area is near to my heart. Since this district grew while Scania was expanding, you could say that we’re living in the midst of Swedish industrial and cultural history. I like to joke that my parents helped build Södertälje although no one in my family has worked at Scania”, Carina explained. “I also think of Björn Borg of course! This is where his tennis career took off. But I was born in Casablanca, and I lived in New York before I came to Sweden. After I arrived in Sweden I lived first in Luleå, which is extremely different from New York. Sometimes there was no one to be seen in the city. To me, Södertälje is a perfect balance between the two worlds”, Abdellatif said. What’s the best thing about your apartment?“The kitchen and bathroom are lovely, and all of the rooms have nice wooden floors. But what I appreciate most is the light and the view of Södertälje,” Abdellatif replied.
Is there anything that could be improved?“We've only lived here a couple of months and I can’t think of anything yet. Maybe that it’s a bit far from my job, but I'll be retiring soon and then it won’t matter,” Carina said with a laugh.
Will you stay here after you retire?“Definitely! We like being close to the forests and the lake, which has a beach. And we can walk by the canal every evening”, said Carina.“And the sunsets here are marvelous, just like in Casa-blanca”, Abdellatif added with a smile.
Annual Report 2016 D. Carnegie & Co AB (publ) 21

Many children of D. Carnegie & Co’s tenants began their summer holidays with a free football school. Children from Husby, Rinkeby and Tensta had the opportunity to attend football training with professional coaches from Akropolis IF. The children also received football uniforms, and lunch was served every day. The site was the pitch at Akalla Farm.
An invitation was sent to all of the tenants in the 3,000 apartments man-aged by D. Carnegie & Co in Husby, Rinkeby and Tensta. 45 young people participated in 2016. The initiative was successful and well received.
D. Carnegie & Co’s partnership with Akropolis IF began in 2016, and this was the first time the football school was offered. Akropolis IF plays its home matches with its first team at the Spånga playing field, but it runs youth activities in both northern and southern Stockholm, including Vårby. D. Carnegie & Co has several properties in the area, and expanded cooperation with football schools in Järva and Vårby is planned for 2017.
On a beautiful sunny winter day with temperatures a bit below freezing, over 100 young people and their parents met to go skating. Some of the partic-ipants had tried skating before, but for others it was the first time.
D. Carnegie & Co organised a skating day for its tenants in the Stockholm region for the second year in a row. A partnership with Hammarby Bandy makes this activity possible. Several people from Hammarby Bandy’s youth and first teams participated as teachers for the more inexperienced skaters.
Skating day in cooperation with Hammarby Bandy
Football school with Akropolis IF
The entire event was free of charge and there were skates available to borrow. A light lunch was offered during the day. D. Carnegie & Co also arranged for buses so that it was easy for the participants to get to the Zinkendamm playing field.
RENOVAT ION AND I M PROVEM ENT
22 D. Carnegie & Co AB (publ) Annual Report 2016

Neighbourhood Watch is familiar to people who live in areas with single-family homes, and D. Carnegie & Co in co-operation with the municipality, tenant’s association and the police wishes to help improve security by using the same principles in its residential area in Sollentuna. A neighborhood watch network was started in autumn 2016 at D. Carnegie & Co’s initiative.
The network consists of 22 floor coordinators who handle various issues such as rubbish pickup, graffiti and minor damage. The network also cooperates with the police, with whom they discuss what’s happening in the area, and they also receive guidance in order to help them further increase security. The floor coordinators in the network also have a rolling schedule for night patrols.
In addition to increasing security through their presence, the neighbourhood watch network is also a meeting place for neighbours. The ten-ants have the chance to get better acquainted. The philosophy is that close relationships with neighbours increase security and cooperation.
Response to the initiative has been positive, and several tenants are interested in its prog-ress and its work in the future. The company aims to have similar networks in all of its residential areas, and the next step is to initiate a similar project in Carnegie & Co’s property area in Visättra.
Skating day in cooperation with Hammarby Bandy
Football school with Akropolis IF Neighbourhood Watch
RENOVAT ION AND I M PROVEM ENT
Annual Report 2016 D. Carnegie & Co AB (publ) 23

Consumption of electricity, water and heatingThe company’s greatest environmental impact is through consumption of electricity, water and heating. Its overall energy goal is to reduce its environmental impact by making its energy consumption more efficient.
p. 26
A diverse organisationOver 15 languages are spoken at D. Carnegie & Co. Read more about the company’s organisation. p. 28
24 D. Carnegie & Co AB (publ) Annual Report 2016

Social aspects are key
D. Carnegie & Co’s sustainability efforts focus on tenants, as well as its own staff. They also encom-pass efforts to continuously reduce the company’s environmental impact. The company’s local efforts contribute to the socially, environmentally and economically sustainable development of society as a whole.
The company performs its work based on a holistic, long-term perspective on sustainable development, as well as with the support of clearly defined guidelines for the responsible and ethical behaviour of its staff. These guidelines are based on the UN Global Compact. The guidelines, together with several policy documents and documented procedures, serve as a framework for the entire business. The most recent versions of the various documents are available at www.dcarnegie.se/hallbar-het (in Swedish). More indicators will be defined and applied in 2017.
Social conditions and human rightsHousing and residential environments
It is fundamental to D. Carnegie & Co’s business to continuously develop its properties and the residential environment, leading to satisfaction and security as well as place identification.
A survey is conducted on a quarterly basis in order to measure tenants’ satisfaction with D. Carnegie & Co as a property owner. The survey covers issues such as problem reports, contact with area staff and the quality of maintenance and caretaking. The results are passed on to local property managers. By comparing assessments from different areas with one another, the company can identify successful approaches as well as areas where there is a potential to improve and develop things. The objective is to achieve higher scores with every survey.
Verification of suppliers’ compliance with laws and healthy working conditions
D. Carnegie & Co purchases both goods and services to renovate, manage and develop its property portfo-lio. All suppliers are obliged to follow the company’s Code of Conduct in order to ensure compliance with laws and regulations as well as ethical guidelines. A check is performed which consists of a checklist with 21 points divided into three areas: pre-procurement check, information from contractor, and requirements in the subcontractor’s agreement. The information from the contractor category includes a list of personnel, infor-mation on applicable collective agreements, copies of employment contracts (where wage conditions should be equivalent to the level prescribed by relevant collective agreements), proof of insurance, work environment pol-icy and work environment programme. Subcontractors’ agreements are checked to ensure that the site is proper and that all legal requirements are being met.
SUSTA INAB LE DE VELOPM ENT
It is fundamental to D. Carnegie & Co’s busi-ness to continually develop its properties and the residential environment, leading to satisfaction and security as well as site identification.
Annual Report 2016 D. Carnegie & Co AB (publ) 25
SUSTA INAB LE DE VELOPM ENT
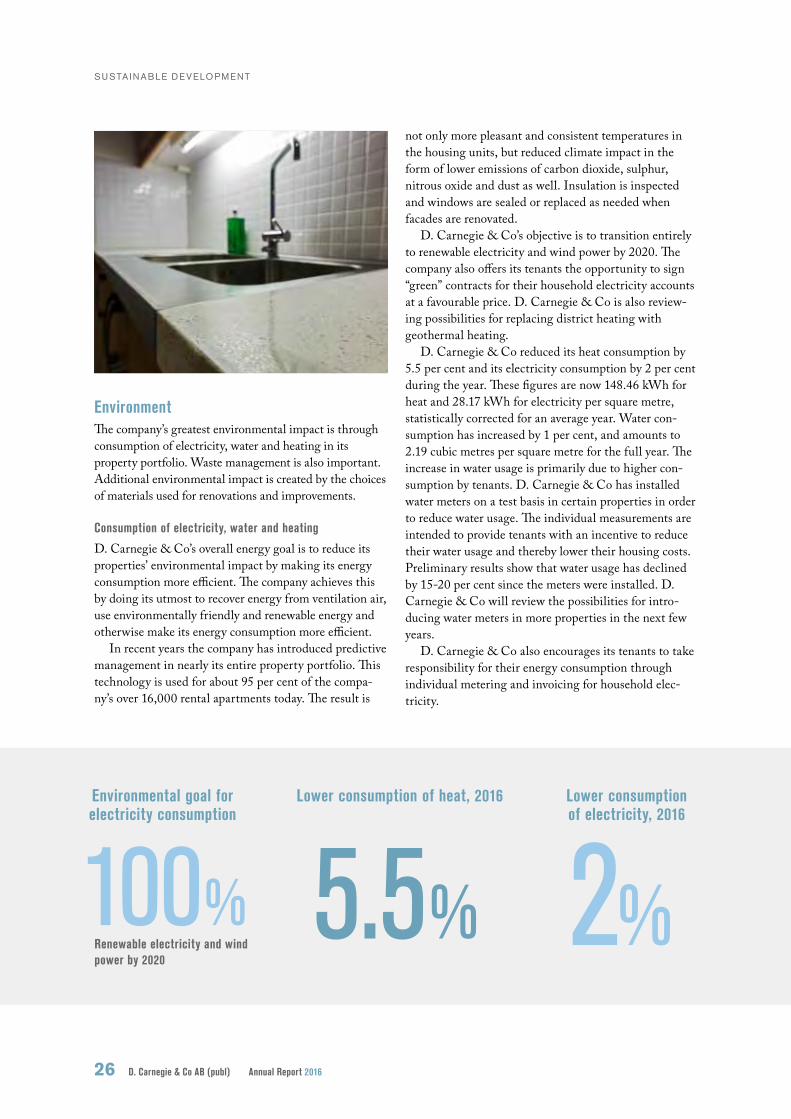
EnvironmentThe company’s greatest environmental impact is through consumption of electricity, water and heating in its property portfolio. Waste management is also important. Additional environmental impact is created by the choices of materials used for renovations and improvements.
Consumption of electricity, water and heating
D. Carnegie & Co’s overall energy goal is to reduce its properties’ environmental impact by making its energy consumption more efficient. The company achieves this by doing its utmost to recover energy from ventilation air, use environmentally friendly and renewable energy and otherwise make its energy consumption more efficient.
In recent years the company has introduced predictive management in nearly its entire property portfolio. This technology is used for about 95 per cent of the compa-ny’s over 16,000 rental apartments today. The result is
not only more pleasant and consistent temperatures in the housing units, but reduced climate impact in the form of lower emissions of carbon dioxide, sulphur, nitrous oxide and dust as well. Insulation is inspected and windows are sealed or replaced as needed when facades are renovated.
D. Carnegie & Co’s objective is to transition entirely to renewable electricity and wind power by 2020. The company also offers its tenants the opportunity to sign “green” contracts for their household electricity accounts at a favourable price. D. Carnegie & Co is also review-ing possibilities for replacing district heating with geothermal heating.
D. Carnegie & Co reduced its heat consumption by 5.5 per cent and its electricity consumption by 2 per cent during the year. These figures are now 148.46 kWh for heat and 28.17 kWh for electricity per square metre, statistically corrected for an average year. Water con-sumption has increased by 1 per cent, and amounts to 2.19 cubic metres per square metre for the full year. The increase in water usage is primarily due to higher con-sumption by tenants. D. Carnegie & Co has installed water meters on a test basis in certain properties in order to reduce water usage. The individual measurements are intended to provide tenants with an incentive to reduce their water usage and thereby lower their housing costs. Preliminary results show that water usage has declined by 15-20 per cent since the meters were installed. D. Carnegie & Co will review the possibilities for intro-ducing water meters in more properties in the next few years.
D. Carnegie & Co also encourages its tenants to take responsibility for their energy consumption through individual metering and invoicing for household elec-tricity.
100% 5.5% 2%
Environmental goal for electricity consumption
Lower consumption of heat, 2016 Lower consumption of electricity, 2016
Renewable electricity and wind power by 2020
26 D. Carnegie & Co AB (publ) Annual Report 2016

SUSTA INAB LE DE VELOPM ENT
Waste management
The majority of properties contain so-called environ-mental buildings or environmental rooms for sorting waste, outdoor containers for household rubbish and management of bulky waste. The environmental build-ings and rooms are located so that large refuse lorries do not need to drive inside the areas. A waste vacuum sys-tem has been installed in one of the company’s property areas. The waste vacuum system consists of a nearly 3 km long piping system that is connected to several prop-erties, which pumps waste to a central location outside the area where it is subsequently sorted.
Environmentally hazardous substances
Radon is present in part of the portfolio. Measurements have been performed in the majority of the portfolio, and in cases where established thresholds are exceeded this is addressed. This mostly comes from soil radon, but radon is also present in building materials in certain properties. PCBs have appeared in joints in some of the early areas. Remediation is performed in accordance with regulatory requirements. Asbestos occurs in some pipe insulation and in joints, as well as in some floor mats. D. Carnegie & Co identifies locations where it occurs and seals what cannot be removed.
Anti-corruptionD. Carnegie & Co has had an established business eth-ics policy for several years. It serves as a guide for issues including generally accepted business practices in the industry, what can be considered to be a bribe, appro-priate and inappropriate benefits and policies for study tours, visits to trade fairs or similar invitations from external contacts.
Off-the-books contracts and brokering procedures
D. Carnegie & Co’s policy in the Stockholm area is to always turn over available rental apartments to the Stockholm housing agency. Apartments are brokered via D. Carnegie & Co’s own rental queues or relevant third parties in smaller portfolios outside Stockholm.
Trading in off-the-books contracts is common in Sweden, especially in the Stockholm area. D. Carnegie & Co has procedures to combat these types of contracts. This means that two people from the company must sign when a head lease is signed for the first time in order to prevent it from being sold to a tenant.
Staff and organisationD. Carnegie & Co’s organisation is structured to successfully cope with developing and renovating the company’s over 16,000 apartments. The company’s comprehensive property management organisation is considered to be strategically important to guaranteeing a good residential environment. It is also important for employees to have local connections, and therefore the
D. Carnegie & Co reduced its heat con-sumption by 5.5 per cent and its electricity con-sumption by 2 per cent during the year.
Annual Report 2016 D. Carnegie & Co AB (publ) 27

company hires young people who work during their hol-idays in the residential areas where they live. A personal commitment that results in continual development of residential environments while producing positive social side effects at the same time.
An attentive and diverse local organisation
Property management is divided into seven regions with regional directors who drive daily work and take care of D. Carnegie & Co’s tenants, along with admin-istrative assistants, operating technicians and property caretakers. All of D. Carnegie & Co’s staff are covered by collective agreements except for employees of the parent company whose contracts are similar to collective agreements. The company is able to act locally and create good relationships by offering about 50 young people holiday work in their own residential areas.
The diversity of the tenants is an asset, and reflecting this diversity is a given for D. Carnegie & Co. Therefore the company is proud that over 25 per cent of its staff are foreign-born, and that over 15 different languages are spoken within the organisation. The company aims to
have equal gender distribution. Today 37 per cent of the company’s managers are women.
The organisation is additionally reinforced by departments including one that primarily manages and performs renovations. In addition a department that works solely with new construction has been created. This department gathers necessary knowledge and skills and makes decision paths more efficient. A new pur-chasing manager who will be responsible for defining and establishing goals for making purchasing socially and environmentally sustainable was also hired during the year.
Felix Hagström – Property caretaker in Visättra
What’s the atmosphere like at work?We eat breakfast together every morning. We try not to talk about work then, even if it’s hard to avoid. We're a tight-knit group that has a great time together, and everyone likes working with people.
What does D. Carnegie & Co symbolise to you?We’re a property company that develops all of our areas. It’s exciting to be part of all of the improvements being made. The company invests in its people, and we get to attend several courses that are relevant to us in our daily jobs.
Do the tenants show appreciation?Definitely. They usually wave to us when we drive by in our car with the company logo , and sometimes they bring coffee and biscuits to the office. When we’re in the tenants’ apartments in order to take care of something, they often offer us coffee. Unfortunately we don’t have time to sit down and have coffee with them, but it’s very nice that they offer.
Can you think of a fun memory to share?We met our budget last year, and we’ll do so this year as well. But a mem-ory that’s probably a bit more fun is that just before Christmas, we helped a man change the tyre on his car, even if that’s not our job. Later we each received a box of chocolates with a note that said “I couldn’t have done it without you!”.
All of D. Carnegie & Co’s staff are covered by collective agreements.
SUSTA INAB LE DE VELOPM ENT
28 D. Carnegie & Co AB (publ) Annual Report 2016

Personal development and enhancing skills
An organisation that is well staffed with managers lays the groundwork for productive dialogue between managers and employees, and is intended to benefit the personal development of every employee. D. Carnegie & Co’s goal is for no manager to have more than ten employees reporting to him or her. This enables man-agers to provide feedback at regular status meetings, as well as to follow up on performance and goal fulfilment through annual performance reviews.
Customised courses in rental law and customer service were offered in 2016 in order to meet the need for certain skills within the company. This was also a chance for staff from all over the country to meet. This is an example of initiatives to enhance skills that simulta-neously strengthen the shared values of the organisation and improve the dialogue between employees which streamlines and simplifies daily work.
The annual employee survey is important to D. Carn-egie & Co, which is – and wants to be – an organisation with satisfied and committed employees. The survey is used as the basis for developing work environment and relationship issues, while at the same time making it possible to form a consensus view of D. Carnegie & Co. The average Swedish result from the Satisfied Employee Index is 71. D. Carnegie & Co has ranked far above the average for a long time and in 2016 the company rose even further, from 77 in the 2015 survey to 80 in 2016.
192
Number of employees
35%
65%
37%
63%
Per centage Managerial positions
Satisfied employees
43
Average age
Property upkeepProperty management, operations and environmentAccounting and ITManagement and other staff
Distribution of assignments
SUSTA INAB LE DE VELOPM ENT
Opinion on the company as an employer
80
Annual Report 2016 D. Carnegie & Co AB (publ) 29

The share and ShareholdersRead more about the share’s development during the year and D. Carnegie & Co’s shareholders. p. 31
Risks and risk managementOverview of the major company risks and risk management. p. 34
Earning capacityD. Carnegie & Co’s earning capacity for current and comparable portfolio. p. 36
Financing p. 37
30 D. Carnegie & Co AB (publ) Annual Report 2016

SHARE , SHAREHOLDERS AND R ISKS
The share
D. Carnegie & Co’s class B shares had a strong performance in 2016. The share price increased by 67 per cent during the year. At the end of 2016, the share price had thus increased by 179 per cent since the company’s shares were listed on Nasdaq First North on 14 April, 2014. Vega Holdco S.à.r.l., an entity wholly owned by real estate funds advised by affiliates of The Blackstone Group L.P., became the major shareholder in D. Carnegie & Co during the year.
The total fair value of the Company’s shares as of December 31, 2016 was approximately SEK 7.8 bil-lion (4.4). D. Carnegie & Co strives to ensure that the company’s shares achieve a competitive total return in relation to risk. All actions must be based on a long-term perspective and D. Carnegie & Co shall provide regular reporting and other communications to share-holders, the capital and credit markets, and the media. In the long term, the company aims to be one of the larger listed dedicated residential real estate companies in Sweden.
The Company’s class B shares have been traded on Nasdaq Stockholm MidCap since May 12, 2015. At the end of 2015 there were a total 5,369,866 ordinary shares of class A, each of which carries five (5) votes per share in the company and 71,938,910 ordinary shares of class B, each of which carries one (1) vote per share in the company, for a total of 77,308,776 shares and 98,778,240 votes. The market price as of December 31, 2016 was SEK 109 per class B share (67). At the end of 2016, the share capital amounted to SEK to 985,095,432.
Proposed dividendThe Board of Directors proposes that the shareholders’ meeting not declare any dividend for the sharehol-ders for the 2016 operating year. The company is in an expansive phase during which it is intended to invest any surplus in the property portfolio, primarily in the form of renovations.
The long-term net asset value (EPRA NAV) can be calculated at SEK 101.96 per share.
ShareholdersAt the end of the year the company had 7,538 (8,297) shareholders. The company had two shareholders, Vega Holdco S.à r.l. and Kvalitena AB (publ), with sharehol-dings exceeding 10 per cent of the votes. The ten largest shareholders together represented 71.9 per cent of total share capital at the end of the year. Shareholders registe-red abroad cannot be distinguished in terms of directly
0
2 000
4 000
6 000
8 000
10 000
12 000
14 000
Omsatt antal aktier i 1000-tal per månad
201620152014
40
50
60
70
80
90
100
110
120
Carnegie Real Estate Return IndexSIX Return Index
D. Carnegie & Co B (Totalavkastning)
The share
Annual Report 2016 D. Carnegie & Co AB (publ) 31

SHARE , SHAREHOLDERS AND R ISKS
D. CARNEGIE & CO’S LARGEST SHAREHOLDERS December 31, 2016
Holdings, A-shares Holdings, B-shares Capital, % Votes, %
Vega Holdco S.à.r.l.* 3,775,533 31,753,253 45,96 51,25**
Länsförsäkringar Fastighetsfond 0 5,338,521 5,10 5,40
Kvalitena AB 1,594,333 2,347,801 6,91 10,45**
Didner & Gerge Småbolag 0 3,184,575 4,12 3,22
Frasdale Int. BV 0 2,845,107 3,68 2,88**
Svenskt Näringsliv 0 1,600,000 2,07 1,62
Livförsäkringsaktiebolaget Skandia 0 896,386 1,16 0,91
Fjärde AP-fonden 0 893,984 1,16 0,91
Per Josefsson via bolag 0 750,000 0,97 0,76
State Street BK-West Client 0 592,843 0,77 0,60
KBC Select Immo (UCITS) 0 582,143 0,75 0,59
Länsförsäkringar Småbolag Sverige 0 532,596 0,69 0,54
Skagen M2 Verdipapirfond 0 516,251 0,67 0,52
SSB CLIENT OMNIBUS AC OM07 (15 PCT) 0 470,182 0,61 0,48
JP Morgan Chase 0 453,567 0,59 0,46
Humle Småbolagsfond 0 450,000 0,58 0,46
SKANDIA SVERIGE 0 444,503 0,57 0,45
Cancerfonden 0 438,500 0,57 0,44
LANCELOT AVALON 0 421,905 0,55 0,43
ADVISOR VÄRLDEN 0 396,000 0,51 0,40
BNYMSANV RE GCLB RE BNY GCM CLIENT 0 377,985 0,49 0,38
FÖRSÄKRINGSAKTIEBOLAGET, AVANZA PENSION 0 370,583 0,48 0,38
Others 0 16,282,225 21,06 16,48
Total 5,369,866 71,938,910 100,00 100
*Vega Holdco S.à.r.l., an entity wholly owned by real estate funds advised by affiliates of The Blackstone Group L.P.** Vega Holdco S.à.r.l. controls the marked voting rights, totaling 64.58 per cent of the votes in D. Carnegie & Co AB.
held and nominee-registered shares, except in cases where the shareholder is required to report such holding.
Stock market contactsStock market contacts are based primarily on quarterly financial reporting, press releases in conjunction with major business events, and presentations of the company and shareholder meetings. In addition, supplemental market and financial information is provided on the group’s website at www.dcarnegie.se.
Reduction of the share capitalIt was resolved at an extraordinary general meeting of the shareholders held on March 17, 2014 to reduce the share capital by retiring class PI preference shares.
Warrants programD. Carnegie & Co has three warrants programs carry-ing an entitlement to subscribe for class B shares.
Warrants program no. one
Warrants program no. one, which was issued in 2014, covers 1,473,000 warrants, corresponding to 1.9 per cent of the number of outstanding ordinary shares. Each warrant entitles the holder to subscribe for one new class B ordinary share in D. Carnegie & Co. The warrants may be exercised to subscribe for shares commencing January 1, 2017 up to and including June 30, 2017. The subscription price for class B ordinary shares pursuant to the warrants is SEK 48.50 kronor. The warrants program is directed at the CEO and CFO of D. Carnegie & Co AB, the CEO of Bosystem Nordic AB, and all staff who were employed at Slottsfabriken Egendomsförvaltning AB at the time D. Carnegie & Co was listed on Nasdaq First North (April 9, 2014). Market-based pricing was applied in conjunction with the warrants offering.
Warrants program no. two
Warrants program no. two, which was issued in 2015 and covers 998,200 warrants, corresponding to 1.3 per
32 D. Carnegie & Co AB (publ) Annual Report 2016

SHARE , SHAREHOLDERS AND R ISKS
The share capital development
Date EventChange in number
of class A sharesChange in number
of class B sharesTotalt numberA + B shares
Change inshare capital Total
Apr-16 New issue - 6,539,900 77,308,776 83,333,688 985,095,432
Jul-14 New issue/at acquisition - 26,000,000 70,768,876 331,301,084 901,761,744
Maj-14 New issue - 2,307,692 44,768,876 29,405,418 570,460,660
Apr-14 New issue - 15,384,615 42,461,184 196,036,139 541,055,242
Mar-14 Set-off issue 5,369,866 21,479,459 27,076,569 342,123,480 345,019,103
Mar-14Redemption of preferece shares - - 227,244 -98,893 2,895,623
Dec-13 Reverse share split 2 000 / 1 - 227,244 227,244 - 2,994,516
Sept-13 New issue - 376,010,360 454,488,000 2,395,613 2,994,516
Sept-09 New issue preferential shares - - 78,477,640 98,903 598,903
Juni-09 Reduction - - 78,477,640 -156,457,912 500,000
Juni-07 New issue - 146,754 78,477,640 1,870,000 156,957,912
cent of the number of outstanding shares. The warrants carry an entitlement to subscribe for new class B ordinary shares in D. Carnegie & Co. The warrants may be exer-cised to subscribe for shares commencing May 21, 2018 up to and including August 31, 2018. The subscription price for class B ordinary shares pursuant to the warrants is SEK 72.84 kronor. The warrants program is directed at all staff who were permanently employed by the D. Carnegie & Co Group on May 12, 2015. Market-based pricing was applied in conjunction with the warrants offering.
Warrants program no. three
Warrants program no. three was issued in 2016 and covers 807,000 warrants, corresponding to 1.0 per cent of the number of outstanding shares. The warrants carry an entitlement to subscribe for new class B ordinary sha-res in D. Carnegie & Co. The warrants may be exercised to subscribe for shares commencing May 21, 2019 up to and including August 30, 2019. The subscription price for class B ordinary shares pursuant to the warrants is SEK 113.50 kronor. The warrants program is directed at all staff who were permanently employed by the D. Carnegie & Co Group on May 12, 2016. Marketbased pricing was applied in conjunction with the warrants offering.
If all of the warrants are exercised properties in all three of the warrants programs (2014, 2015 and 2016), the number of ordinary class B shares would increase by 3,287,200, which corresponds to 4.2 per cent of the number of outstanding ordinary shares.
After completion of its mandatory tender offer, Vega Holdco S.à.r.l. owns 1,460,000 warrants from warrants program no. one, 756,200 warrants from warrants program no. two and 600,000 warrants from warrants program no. three.
Share issueDuring the period, D. Carnegie & Co AB have repaid the convertible subordinated loans (see description below) and, carried out a private placement of new class B shares of totalling 6,539,900 shares at a subscription price of 72.50 per share, subscribed by approximately 60 Swedish and international institutional investors.
Repayment of Convertible subordinated loans The three convertible subordinated loans, each amoun-ting to SEK 340 million with a yearly interest rate of 5.0 per cent held by Svensk Bolig Holding AB, issued in connection with the acquisition of Hyresbostäder i Sve-rige II AB, were repaid June 30, 2016 at the total cost of SEK 1,157 million, whereas SEK 137 million represent payment for option value for the convert option. In the event of full conversion, 16,266,230 shares in D. Carnegie & Co would have been issued. The repayment have partly been paid by the private placement of new class B shares of totalling 6,539,900 shares, and partly by the new bond of SEK 1,000 million issued during the period. Due to the repayment of the convertible subordinated loans the conversion is avoided, and the earnings increase by SEK 11 million, due to decreased interest costs.
Annual Report 2016 D. Carnegie & Co AB (publ) 33

Risks and risk management
All business activities are associated with risks that may affect the company negatively, but also cre-ate opportunities. D. Carnegie & Co works actively and systematically to identify risk areas and limit the company’s risk exposure.
Changes in macroeconomic factors The real estate industry is impacted by macroecono-mic factors such as general economic trends, growth, employment, construction rate for new residential and commercial buildings, changes in infrastructure, population growth and structure, inflation and interest rates. Growth in the economy affects the employment rate, which is a key component of supply and demand in the rental market and thus affects vacancy rates and rent levels. Expectations regarding inflation policy govern interest rates and thus affect D. Carnegie & Co’s net financial items. Interest expenses on liabilities at credit institutions is D. Carnegie & Co’s single largest expense item. In the longterm, changes in interest rates will have a substantial effect on D. Carnegie & Co’s financial performance and cash flow. Inflation also affects D. Carnegie & Co’s costs. In addition, changes in interest rates and inflation also impact return requirements and thus the fair values of the properties.
Property development To develop new and existing through investments is a way to increase returns. The project risks are in the assessments concerning the rental market development, but also in the design of the product and the actual implementation of the project. Risks are limited to investments made only in markets where D. Carnegie & Co has good market knowledge, and where there is strong demand for housing and commercial premises. Quality Assured internal processes and excellence in project organisation ensures that both the implementa-tion and product has high quality and meet sustainabi-lity requirements. In the construction of new buildings it is always a requirement that the majority of the property to be leased out before the investment commences. Most of the current projects have a high occupancy rate.
The value of D. Carnegie & Co’s properties may change D. Carnegie & Co’s investment properties are repor-ted in the balance sheet at fair value and changes in value are reported in the income statement. The value of the properties is affected by a number of factors, both property-specific, such as vacancy rates, rents and operating expenses, and market-specific, such as yield requirements and cost of capital derived from compa-rable transactions in the property market. Both proper-ty-specific impairments, such as higher vacancy rates and lower rents, and market-specific impairments, such as higher yield requirements and cost of capital, can lead to negative realized and unrealized changes in value that could have a negative impact on D. Carnegie & Co’s financial position and earnings.
The value of derivative financial instruments may change D. Carnegie & Co has some loans with short fixed-inte-rest terms and, as part of its strategy to manage interest rate risk, D. Carnegie & Co uses interest-rate derivatives, mainly swaps. Interest-rate derivatives are reported at fair value in the balance sheet with changes in value reported in the income statement. As market rates change, the inte-rest-rate derivatives develop a theoretical surplus or deficit that does not affect cash flow. D. Carnegie & Co has used interest-rate derivatives to hedge against higher interest rates. If market rates fall, the fair value of D. Carnegie & Co’s interest-rate derivatives will decline, which could have a negative effect on D. Carnegie & Co’s earnings.
SHARE , SHAREHOLDERS AND R ISKS
34 D. Carnegie & Co AB (publ) Annual Report 2016

Refinancing may prove impossible or beassociated with significantly higher costs D. Carnegie & Co’s interest-bearing liabilities on December 31, 2016 amounted to SEK 10,060 million, of which SEK -69 million was reported as a prepaid structuring cost. SEK 1,240 million, corresponding to 12 per cent, falls due for renegotiation or repayment within one year and SEK 8,820 million, corresponding to 88 per cent, falls due within one to five years. During the financial crisis, volatility and disruptions in the financial and credit markets were extremely large, with an unprecedented reduction in liquidity and increased credit risk premiums for many credit institutions. There is still some uncertainty on the financial markets and if D. Carnegie & Co is unable to refinance its loans, or can only do so on worse terms, interest expenses may be higher.
Operational risks D. Carnegie & Co is exposed to operational risks in the shape of inadequate procedures or other irregularities. Since the company’s strategy is to renovate and increase the standard of the company’s property portfolio it is crucial to establish good internal controls, effec-tive administrative systems and ongoing professional development which helps to reduce operational risks and their potential negative impact on the company’s ongoing operations and the planned renovation rate.
Environmental risksD. Carnegie & Co has adopted and is actively working to identify and limit the environmental risks arising from the company operating the property management and real estate development. According to the Swedish Environmental Code, those who engaged in an activity that has contributed to environmental pollution also responsible for the after treatment. If the operator can carry out or pay for remediation of a contaminated pro-perty, the purchaser of the property, and the acquisition knew or should have detected pollution, is responsible. As D. Carnegie & Co’s property portfolio consists primarily of residential property the environmental risks to be limited.
SHARE , SHAREHOLDERS AND R ISKS
Annual Report 2016 D. Carnegie & Co AB (publ) 35

Earning capacity
Current earning capacity for comparable portfolioThe table below reflects D. Carnegie & Co’s earning capacity on a 12-month basis as of January 1, 2017. It is important to note that the current earning capacity is not to be equated with a forecast for the coming twelve months. For example, the earning capacity does not include any assessment of rent trends, vacancies, or changes in interest rates. The figures for the com-parable portfolio are adjusted, which means that the divested properties during the period January 1, 2016 January 1, 2017, are eliminated as well as the acquired properties during the year. Furthermore, D. Carnegie & Co’s income statement is affected by changes in the value of investment properties as well as future property
acquisitions and/or property divestments. Additional items affecting earnings include changes in the value of derivative instruments. None of the foregoing factors have been taken into account in the current earning capacity. The current earning capacity also does not take into consideration the effects of future rent changes for renovated apartments. The rental value is based on the property portfolio’s invoicing list on January 1, 2017, assessed budgeted property expenses for the coming 12 months, and central administration costs. Net finan-cial items were calculated based on interest-bearing liabilities and assets as of December 31, 2016, and with consideration given to the interest rate terms applicable on that date.
SHARE , SHAREHOLDERS AND R ISKS
Current earning capacity
Current portfolio Comparable portfolio*
Amounts in SEK thousand 1 Jan 2017 1 Jan 2017 30 Sep 2016 30 June 2016 31 Mar 2016 1 Jan 2016
Rental income 1,379,337 1,291,287 1,282,647 1,256,873 1,244,575 1 244 575
Other income 0 0 0 0 0 0
Operating expenses -529,060 -503,230 -504,520 -504,520 -504,520 -504,520
Maintenance expenses -74,924 -71,169 -93,979 -93,979 -93,979 -93,979
Property tax -26,245 -24,648 -23,745 -23,745 -23,745 -23,745
Ground rent -15,318 -15,318 -14,717 -14,717 -14,717 -14,717
Net operating income 733,790 688,317 654,326 645,686 619,912 607,614
Central administration -82,972 -77,723 -61,486 -61,486 -61,486 -61,486
Net financial items -177,518 -166,987 -163,900 -161,460 -161,820 -162,158
Financial cost bonds -77,500 -77,500 -77,500 -77,500 -88,500 -88,500
Income from property managment 395,800 366,107 351,440 345,240 308,106 295,470
* Reported values in the table relating to “Comparable portfolio”, is throughout 2016 eliminated for what relates to the Gothenburg portfolio and the Solna Nord portfolio, divested in Q1 2016. Of the acquisitions made in 2016 the Katrineholm portfolio and Valsätra portfolio, Uppsala, are eliminated from Q2, 2016 and a portfolio in Eskilstuna from Q3 2016.
36 D. Carnegie & Co AB (publ) Annual Report 2016

Financing
D. Carnegie & Co strives to achieve a balance between debt financing and equity. During 2016, D. Carnegie & Co refinanced a large part of its loan portfolio in order to take advantage of the low inte-rest rates during the year, issued a bond and repayed the convertible subordinated loans which were issued in 2014. The average term to maturity on loans owed to credit institutions is 3.64 years after the refinancing. D. Carnegie & Co’s average interest rate on loans from credit institutions at the end of the year was 2.20 per cent.
CREDIT MARKETThe Riksbank has during 2016 kept its policy rate, the repo rate, unchanged at -0.5 per cent. Access to liquidity in the banking market continued to be good during the year. 2016 was characterized by low, both short-term and long-term, interest rates.
FINANCE FUNCTIONThe finance function is charged with supporting the company’s core business by minimizing the cost of debt capital over the long term. This function is responsible for managing existing debt, providing new borrowing for investments and acquisitions, streamlining cash management and limiting financial risks. The work is regulated and governed by the financial policy establis-hed by the Board of Directors once a year. The finance policy clarifies the responsibilities in financial matters
and the rules for reporting, monitoring andcontrol. Financial issues of strategic importance are addressed by D. Carnegie & Co’s Board of Directors.
RAISING CAPITALRunning a real estate company is capital intensive. The total asset base, which is essentially the same as the value of the properties, is financed by equity, debt and other capital. The distribution between these three components depends on various factors such as the cost of the various forms of financing, the focus of the property portfolio and the risk aversion of shareholders and creditors.
D. Carnegie & Co’s assets onDecember 31, 2016 amounted to SEK 18,904 million (15,563). These assets include equity of SEK 6,385 million (4,392), debt capital SEK 9,991 million (9,238) and other capital SEK mil-lion 2,528 (1,934).
SHARE , SHAREHOLDERS AND R ISKS
CAPITAL ALLOCATION 31/12 2016 FINANCING 31/12 2016
Equity
Interest bearing liabilities
Other liabilities
Bank financing
Bond financing
34%
53%
13%
80%
20%
Annual Report 2016 D. Carnegie & Co AB (publ) 37

SHARE , SHAREHOLDERS AND R ISKS
Equity
Equity is the difference between assets and liabilities.Shareholders have a per centage of equity based on their shareholdings. D. Carnegie & Co has one class of sha-res; ordinary shares are divided into class A shares and class B shares with different voting rights.
D. Carnegie & Co’s equity ratio (the proportion of equity in relation to total capital) is 34 per cent (28).
Debt capital
Debt capital comprises interest-bearing liabilities. At yearend, interest-bearing liabilities accounted for 53 per cent (61) of total financing. Loan to value (LTV), interest-bearing liabilities with properties as collateral in relation to the fair value of the properties at the end of the period, amounted to 47 per cent (52). Interest-be-aring liabilities not secured by properties comprises two bonds totaling SEK 2,000 In order to limit interest rate risk, D. Carnegie & Co has chosen to enter into swap-agreements for 34 per cent (32) of the interest-be-aring liabilities, SEK 3,401 million (3,401), against a fixed rate with a long maturity. During the year D. Carnegie & Co entered into interest rate cap agreements amounting to SEK 1,500 million, with approximately 6 years duration and with an agreed rate cap of Stibor 3 per cent. During the year, the company borrowed SEK 615 million (568) in new loans. All financing is deno-minated in SEK. At yearend cash and cash equivalents totalled SEK 679 million (479).
Other capital
Other capital primarily comprises deferred tax liabili-ties, accounts payable, deferred income, derivatives and
accrued expenses. Total financing from other capital amounted to SEK 2,516 million (1,933) and accounted for 13 per cent (12) of D. Carnegie & Co’s total funding as of December 31 2016.
AVERAGE INTEREST RATE ANDFIXED-INTEREST TERMD. Carnegie & Co’s average borrowing rate for inte-rest-bearing liabilities at year-end amounted to 2.5 per cent (2.7). The average fixed interest term at year-end taking interest rate derivatives into account was 2.2 years (4.3).
MATURITYAt year-end the average maturity was 3.3 years (5.7). In 2017, credit facilities will mature for a total of SEK 1,240 million (1,155).
DERIVATIVESD. Carnegie & Co uses derivatives to reduce interest rate risk and to achieve the desired fixed interest term. D. Carnegie & Co has two types of derivatives: interest rate swaps and interest rate caps. The interest rate swaps included a total of SEK 3,401 million (3,401) at year-end, representing 34 per cent (32) of the interest-bearing liabilities. An interest rate swap is an agreement between two parties to exchange interest payments with each other. D. Carnegie & Co has chosen to swap variable interest rates for fixed rates in all of its swap agreements. Floating Stibor rates are obtained for the swaps, prefe-rably with a three-month maturity and a fixed interest rate, which varied at year-end between 0.5 and 1.4 per cent. No premium is paid for the interest rate swaps. The
0
500
1 000
1 500
2 000
2 500
3 000MSEK
2017 2018 2019 2020 2021 2022 20250
500
1 000
1 500
2 000
2 500
3 000
2017 2018 2019 2020 2021 2022 2025
MSEK
LOAN MATURITY DECEMBER 31, 2016
INTEREST-BEARING LIABILITIES TO CREDIT INSTITUTIONS
INTEREST RATE TERM AND LOAN MATURITY DECEMBER 31, 2016 TOTAL INTEREST-BEARING LIABILITIES
38 D. Carnegie & Co AB (publ) Annual Report 2016

SHARE , SHAREHOLDERS AND R ISKS
counterparties for the swaps are Deutsche Pfandbrief-bank and Swedbank. During the year D. Carnegie & Co entered into interest rate cap agreements amounting to SEK 1,500 million, with approximately 6 years dura-tion and with an agreed rate cap of Stibor 3 per cent.
Valuation of derivatives
The value of swaps and interest rate caps changes with the market interest rates and when maturity is redu-ced. At maturity, the value is always zero. In 2016, the change in value change of the interest rate swaps was SEK -85 million (5) and the value change for the interest rate caps SEK -3 million (-). Consequently, the actual value at year-end amounted to SEK -145 million (-60) for the interest rate swaps and to SEK 7 million (-) for the interest rate caps. Hedge accounting has not been applied.
LENDERS AND COLLATERALThe loan portfolio is divided among five credit institu-tions: Deutsche Pfandbriefbank, Landesbank Hes-sen-Thüringen, Nykredit, SBAB and Swedbank. Real estate mortgages in the amount of SEK 8,503 million (7,694) were provided as collateral for the majority of interest-bearing liabilities to credit institutions. In
addition, D. Carnegie & Co has pledged collateral in the form of shares in property-owning subsidiaries as well as a parent company guarantee from D. Carnegie & Co AB (publ).
COVENANTS AND RISK-TAKINGD. Carnegie & Co’s financial risk-taking and financial position can be inferred from key figures such as the equity ratio, the interest coverage ratio and the LTV ratio. Credit agreements with banks and credit insti-tutions sometimes set limits, known as covenants, for these three key ratios. Those banks that have a covenant for the equity ratio have set a minimum limit of 15-30 per cent. D. Carnegie & Co’s target is that the interest coverage ratio should be at least 1.5 times, which is in line with the banks’ requirements. The banks’ requi-rements vary between 60 and 80 per cent depending on factors such as the collateral. D. Carnegie & Co meets all of the banks’ targets and requirements as of the balance sheet date and expects to continue to do so in 2017. The equity ratio was 34 per cent (28), adjusted equity ratio was 42 per cent (33), the interest coverage ratio was 2.0 times (1.8), the loan-to-value ratio was 54 per cent (61) and the loan-to-value ratio for properties was 47 per cent (52).
INTEREST RATE TERM AND LOAN MATURITY DECEMBER 31, 2016 INTEREST-BEARING LIABILITIES TO CREDIT
Interest maturity Capital maturity
Maturity SEKm InterestPer cen-
tage SEKmPer cen-
tage
2017 3,474 1,2% 43% 1,240 15%
2018 - - - 1,233 15%
2019 381 1,6% 5% 381 5%
2020 1,062 2,1% 13% 1,062 13%
2021 537 2,0% 7% 1,267 16%
2022 2,606 3,7% 32% 2,606 32%
2025 - - - 270 3%
Total/Average 8,060 2,20% 100% 8,060 100%
Prepaid arrangement fee -69 -69
Total 7,991 7,991
DERIVATIVES DECEMBER 31, 2016
Counterparty Amount, SEK million Remaining term, years Interest rate, % Fair value, SEK m
Nominal interest rate swaps 3,401 4.7 - -145
Interest rate caps 1,500 5.4 3% 7
INTEREST RATE TERM AND LOAN MATURITY DECEMBER 31, 2016, TOTAL INTEREST-BEARING LIABILITIES
Interest maturity Capital maturity
Maturity SEKm InterestPer cen-
tage SEKmPer cen-
tage
2017 5,474 2,2% 54% 1,240 12%
2018 - - - 2,233 22%
2019 381 1,6% 4% 1,381 14%
2020 1,062 2,1% 11% 1,062 11%
2021 537 2,0% 5% 1,267 13%
2022 2,606 3,7% 26% 2,606 26%
2025 - - - 270 3%
Total/Average 10,060 2,54% 100% 10,060 100%
Prepaid arrangement fee -69 -69
Included equity 0 0
Total 9,991 9,991
Annual Report 2016 D. Carnegie & Co AB (publ) 39

Board of Directors, management and AuditorsRead more about D. Carnegie & Co’s Board of Directors, Management and Auditors. p. 48
40 D. Carnegie & Co AB (publ) Annual Report 2016

C ORPOR ATE GOVERNANC E
Corporate Governance Report
Corporate governance is an important instrument in the work carried out to create long-term value for the shareholders. With a clear and transparent framework for the allocation of responsibilities, reporting, and follow-up, D. Carnegie & Co AB focuses on the most important matters and thus limits the risks in the operations. The corporate governance report reports how the Company was managed in 2016.
Corporate governance at D. Carnegie & Co Corporate governance at the Company is long-term and describes the decision-making system with which the owners, directly or indirectly, manage the Company and handle its risks. The Company has corporate gover-nance routines which fulfil the requirements imposed by, among other provisions, the Swedish Companies Act, the Annual Accounts Act, the Swedish Corporate Governance Code (the Code) and Nasdaq Stockholm’s rules for issuers. The Company applies the corporate governance principles adopted by the annual general meeting and which are set forth in the Articles of Asso-ciation and in the instructions for the nominations com-mittee. These documents are available on the Company’s website. In addition to these, a series of instructions adopted by the Board of Directors for corporate gover-nance are applied, including the rules of procedure for the board, the instructions for the CEO, instructions for financial reporting to the Board of Directors, financial and communications policies, etc. The Company’s values
regarding accessibility and commitment characterize the work approach of the employees as well as the gover-nance, management and supervision of the Company.
Application of the Code Corporate governance has been developed through legislation, recommendations, the Code, and through self-regulation. The Code is applicable to all Swedish companies whose shares are listed for trading on a regu-lated market. In accordance with the Code’s principle of ”comply or explain”, the Company reports any devia-tions from the Code and explains such deviations in the annual corporate governance report. The Swedish Cor-porate Governance Code is administered by the Swedish Corporate Governance Board and is available at www.bolagsstyrning.se where a description is also provided of the Swedish model for corporate gover-nance. The Company complies with the Code, the pur-pose of which is to create sound conditions for exercising an active and responsible ownership role. The Company did not deviate from any provision of the Code in the 2016 operating year.
Shareholders and shares OnDecember 31, 2016, the share capital amounted to SEK 985,095,432 allocated over 5,369,866 class A shares each of which entitles the holder to five (5) votes in the Company and 71,938,910 class B shares each of which entitles the holder to one (1) vote. Since May 12, 2015, D. Carnegie & Co has been listed on the Stockholm (Nasdaq Stockholm) MidCap List. Prior to this, the shares had been traded since April 9, 2014 on Nasdaq First North. There were 7,538 sharehol-ders at year-end. The Company has two shareholders, Vega Holdco S.à r.l.1 and Kvalitena AB, each of which has shareholdings in excess of 10 per cent of the share capital. The 10 largest shareholders together represented
Overall structure for corporate governance at D. Carnegie & Co AB
Auditors
Shareholders via the shareholders
meeting
Board of directors
CEO
Senior management
Nominations committee
1 An entity wholly owned by real estate funds advised by affiliates of The Blacks-tone Group L.P.
Annual Report 2016 D. Carnegie & Co AB (publ) 41

C ORPOR ATE GOVERNANC E
71.9 per cent of the total share capital at the end of the year. More information regarding shares in the Com-pany and a list of the largest shareholders is provided on the Company’s website.
Annual general meeting The influence of the shareholders in the Company is exercised through the annual general meeting which is the Company’s highest decision-making body and which must be held within six months of the close of the finan-cial year. The annual general meeting addresses issues set forth in the Company’s Articles of Association and the Swedish Companies Act. Notice to attend general meetings of the shareholders are given pursuant to the Company’s Articles of Association. The shareholders’ meeting takes decisions in accordance with the majority requirements set forth in the Swedish Companies Act.
The most recent annual general meeting was held on May 12, 2016.
77 shareholders were represented at the sharehol-ders’ meeting and they represented 57.2 per cent of the votes. The annual general meeting approved the annual accounts for 2015 and granted the Board of Directors and CEO a release from liability for their management of the Company in 2015. Among other things, the following resolutions were adopted at the annual general meeting held on May 12, 2016:
• Resolution regarding disposition of the Company’s earnings according to the adopted balance sheet – that the Company’s earnings would be carried forward and that no dividend would be paid.
• Determination of the fees for the directors and audi-tors.
• Re-election of directors Knut Pousette, Ranny Davi-doff, Mats Höglund and Eva Redhe. Knut Pousette was re-elected as chairman of the Board of Directors.
• Re-election of authorized public accountants Ingemar Rindstig and Mikael Ikonen, both at EY.
• Resolution regarding the nominations committee.
• Approval of guidelines for compensation to senior management.
• Resolution regarding long-term incentive program.
• Resolution regarding authorization for the board of directors to resolve to issue new shares.
• Resolution regarding authorization for the board of directors to resolve to repurchase and transfer own shares.
Minutes and other documents from the annual gene-
ral meeting held on May 12, 2016 are available on the Company’s website.
Extraordinary general meeting on October 14, 2016The Board of Directors summoned to an extraordi-nary general meeting further to the shareholder Vega HoldCo S.à.r.l., an entity wholly owned by real estate funds advised by affiliates of The Blackstone Group L.P., at the time representing 28.61 per cent of the total number of outstanding shares in the Company, having requested an extraordinary general meeting in order to resolve on election of board members, election of chairman and remuneration to the board of directors in the Company.
The general meeting of the Company resolved that the number of board members of the Company shall continue to be five ordinary board members, without any deputies. Furthermore, the general meeting resolved, in accordance with the proposal from Vega HoldCo S.à.r.l., that the remuneration to the board of directors of the Company shall remain unchanged, with the exception that the chairman of the board shall not receive remu-neration for his assignment. The remuneration to the newly appointed and resigned board members shall be divided on a pro rata basis based on the period each board member has served as board member. The general meeting further resolved that James Seppala and Svein Erik Lilleland shall replace Ranny Davidoff and Terje Nesbakken as board members, for the period until the end of the next annual general meeting. In addition, the general meeting resolved that James Seppala shall replace Knut Pousette as chairman of the board of directors, for the period until the end of the next annual general meeting.
Nominations committeeThe nominations committee submits proposals for the election of a chairperson of the annual general meeting, the Board of Directors and its chairperson, and fees and other compensation for the directors. The nomina-tions committee also submits proposals for the election of auditors and fees for the auditors. In its work, the nominations committee is charged with protecting the interests of all of the shareholders.
It was resolved at the annual general meeting held on May 12, 2016 that the nominations committee serving until the 2017 annual general meeting shall consist of representatives of the Company’s three largest
42 D. Carnegie & Co AB (publ) Annual Report 2016

C ORPOR ATE GOVERNANC E
shareholders in terms of votes on September 30, 2016. The following persons were elected to the nominations committee: James Seppala, chairman of the Board of Directors and representing Vega HoldCo S.à.r.l., Johannes Wingborg, representing Länsförsäkringar Fondförvaltning and Seth Lieberman, chairman of the nominations committee and representing Kvalitena AB. Shareholders who wish to submit proposals to the nomi-nations committee may do so on the Company’s website. The proposals of the nominations committee, as well as a statement explaining the reasons for the proposals, are published on the Company’s website not later than the time of the issuance of notice to attend the annual general meeting
The nominations committee thoroughly considers any requirements for expertise, experience and background which may be imposed on the Board of Directors as well as the requirements and criteria set forth in the new rules and guidelines. The nominations committee considers the composition of the Board of Directors and its size based upon the expectations which may be imposed on the Board of Directors of D. Carnegie & Co regarding, for example, industry experience, expertise, knowledge, and time available. In addition, the nomina-tions committee considers gender equality and diversity perspectives based upon the belief that these are impor-tant to the composition of the Board of Directors. The nominations committee has commenced long-term work for the purpose of highlighting gender equality and diversification issues in the Board of Directors.
The Board of Directors
The choice of the directors serving on the Board of Directors is made in order to actively and efficiently be able to support management in its development of the Company. In addition, the Board of Directors is charged with monitoring and supervising the business operations. Expertise and experience from, among other things, the property industry, financing, business development and capital market issues is therefore of particular importance to the Board of Directors.
According to the Articles of Association, the Board of Directors shall consist of not less than three and not more than six directors. The members of the Board of Directors are appointed at the annual general meeting to serve until the close of the next annual general meeting. The composition of the Board of Directors fulfils the requirements of the Code and the table below sets forth the directors, when they were first elected to the Board of Directors, and whether they are independent of the Company and/or the major shareholders.
The work of the Board of Directors
The Board of Directors is the Company’s highest decision-making body after the general meeting of the shareholders. According to the Swedish Companies Act, the Board of Directors is responsible for the manage-ment and organisation of the Company, entailing that the Board of Directors is responsible, among other things, for establishing targets and strategies, ensuring routines and systems for the evaluation of established targets, regularly evaluating the Company’s earnings and financial position, and evaluating the operative management. The financial reporting is regularly evalu-
THE BOARD OF DIRECTOR’S COMPOSITION BETWEEN MAY 12, 2016 UNTIL THE EXTRAORDINARY GENERAL MEETING ON OCTOBER 14, 2016
Independent in relation to
Name Position Director since The Company and management Principal shareholder
Knut Pousette Chairman 2013 Yes No
Mats Höglund Director 2009 Yes Yes
Ranny Davidoff Director 2014 Yes Yes
Terje Nesbakken Director 2015 Yes No
Eva Redhe Director 2015 Yes Yes
THE BOARD OF DIRECTOR’S COMPOSITION FROM OCTOBER 14, 2016
Independent in relation to
Name Position Director since The Company and management Principal shareholder
James Seppala Chairman 2016 Yes No
Knut Pousette Director 2013 Yes No
Mats Höglund Director 2009 Yes Yes
Svein Erik Lilleland Director 2016 Yes No
Eva Redhe Director 2015 Yes Yes
Annual Report 2016 D. Carnegie & Co AB (publ) 43

ated at the board meeting during the operating year. The Board of Directors is also responsible for ensuring that the annual report and interim reports are prepared in a timely fashion. In addition, the Board of Directors appoints the Company’s CEO.
According to the Code, the chairman of the Board of Directors is elected by the annual general meeting and has particular responsibility for leading the Board of Directors’ work and for ensuring that the Board of Directors’ work is well-organized and performed effi-ciently.
The Board of Directors follows written rules of pro-cedure which are revised on an annual basis and adopted at the first meeting of the Board of Directors each year. The rules of procedure govern, among other things, the Board of Directors’ practices, functions and allocation of work between the directors and the CEO. At the initial meeting of the Board of Directors, the board also adopts instructions for the CEO including financial reporting
The board evaluates the the work of the Board of Directors through a systematic and structured procedure for the purpose of developing the board’s work methods and efficiency. The results of the evaluation are reported to the nominations committee. In addition, the Board of Directors regularly evaluated the work carried out by the CEO.
The Board of Directors convenes according to a schedule adopted annually. In addition to these board meetings, additional board meetings may be convened in order to address issues which cannot be referred to an ordinary meeting of the board. In addition to the meetings of the directors, the chairman of the Board of Directors and the CEO engage in a regular dialogue regarding the management of the Company. The Com-pany has resolved not to have an audit committee or a remuneration committee. Instead, auditing, accounting, and compensation questions will be addressed by the Board of Directors.
The responsibility of the Board of Directors
The Board of Directors is responsible for ensuring that the Company complies with the Swedish Companies Act, the rules applicable to stock market companies, including the Code and other regulations and legi-slation, the Articles of Association and the internal governance instruments. The Board of Directors decides issues regarding strategies and targets, internal gover-nance instruments, major purchases and sales of proper-ties, other major investments, and financing. The Board of Directors is responsible for regularly following up the business operations and ensuring that guidelines and organisation and management are appropriate and that the internal controls are sound. The Board of Directors is also responsible for evaluating the operative manage-ment and plans for replenishment of management.
The Board of Directors endeavours to ensure a high and even level of quality in the financial reporting. This takes place, among other things, through instruc-tions for the financial reporting given to the Board of Directors, that the question is regularely evaluated at the board meeting during the operating year, through the communications policy, and through consideration of any observations, recommendations or proposals by the management group and the organisation. The annual report and all interim reports are before publishing addressed and approved by the Board of Directors. The Board of Directors has delegated to Company mana-gement the task of ensuring the quality of the financial presentations and press releases.
The responsibility of the chairman of the Board of Directors
The chairman of the Board of Directors leads the work conducted by the board and is responsible for ensuring that resolutions adopted by the Board of Directors are implemented. The chairman also represents the Com-pany in owner-related issues. The chairman engages in
C ORPOR ATE GOVERNANC E
Compensation to the board
Name Position Board meetings Board fee (SEK)
James Seppala Chairman 5 out of 5 0
Knut Pousette Director (former chairman) 24 out of 25 283,333
Mats Höglund Director 24 out of 25 200,000
Svein Erik Lilleland Director 5 out of 5 116,667
Eva Redhe Director 23 out of 25 200,000
Terje Nesbakken Director (until October 2016) 19 out of 20 83,333
Ranny Davidoff Director (until October 2016) 20 out of 20 83,333
Total 966,666
44 D. Carnegie & Co AB (publ) Annual Report 2016

a regular dialogue with the CEO and is responsible for ensuring that the other directors receive any information and documentation necessary in order to be able to take well-founded decisions.
The work of the board in 2016
The Board of Directors met 25 times in 2016. The matters addressed by the Board of Directors included the Company’s strategy, targets, business plan, market, purchase and sale of properties, investments in existing properties, taking of loans and other financing issues, and adopting sales mandates, incoming bid for the shares in the Company and principles for variable compensa-tion. The Company’s CEO, CFO, Chief Legal Officer, who is also the secretary of the Board of Directors, were also present at the meetings of the Board of Directors.
Compensation to the board
Fees are payable to the Board of Directors according to a resolution adopted at the annual general meeting and the extraordinary general meeting in October 2016. The table set forth below shows the fees which the directors elected at 2016 annual general meeting and the extra-ordinary general meeting in October 2016 will receive for the period of time until the 2017 annual general meeting. During the financial year, a total of SEK 667 thousand was earned in board fees which will be paid out during the 2017 financial year.
Group management/Business management Currently, the group’s senior executives are as follows:
• Ulf Nilsson, CEO - Responsible according to the instructions to the CEO.
• Per-Axel Sundström, CFO (Chief Financial Officer) - Responsible for the group’s accounting, financing and reporting.
• Jenny Wärmé, Legal Counsel - Responsible for legal matters, secretary of the Board of Directors and legal support to others in the group.
• Tommy Jansson, Head of Property Management - Responsible for managing the group’s properties.
• Jonas Andersson, Chief Investment Officer & Head of Financing. Responsible for financing, transactions, analysis and valuation.
• Fredrik Brunnberg, Chief Business Development Officer - Responsible for new development in the Group.
• Christian Tapper, Head of Property Development &
Refurbishment process. Responsible for development and implementation of the Renovation & Refurbish-ment process of the group’s properties.
• Marie Persson, HR Manager – Responsible for per-sonnel issues.
• Björn Sundberg, Head of Investor Relations and Head of Communications – Responsible for commu-nications and Investor relations.
These people make up the Company’s management group. The management group meets regularly (currently monthly). The members of the management group are responsible for their respective areas within the Company and work with the CEO to prepare reports for the board. The CEO takes decisions on operating activities that fall within the scope of the instructions for the CEO, after consultation with the business management team.
Chief Executive Officer
The CEO reports to the Board of Directors and is responsible for the Company’s day-to-day manage-ment and operations. The allocation of work between the Board of Directors and the CEO is stated in the rules of procedure for the Board of Directors and the instructions for the CEO. The CEO is also responsible for preparing reports and compiling information from management prior to meetings of the board and presents the materials at the board meetings.
According to the instructions for financial reporting, the CEO is responsible for financial reporting at the Company and must therefore ensure that the Board of Directors receives sufficient information in order to be able to regularly evaluate the Company’s financial position.
The CEO is charged with continuously keeping the board informed of developments in the Company, the sales, the Company’s earnings and financial position, liquidity and credit situation, important events and other events, circumstances, or conditions which can be assumed to be of material significance to the Company’s shareholders.
Ulf Nilsson has been the CEO of the Company since 2013.
Remuneration to senior management
Guidelines were adopted at the 2016 annual general meeting for compensation to senior management. The Company will offer the levels of compensation and employment terms and conditions as are required in order to be able to recruit and maintain management with a high level of expertise and the capacity to achieve
C ORPOR ATE GOVERNANC E
Annual Report 2016 D. Carnegie & Co AB (publ) 45

the established targets. The forms of compensation must provide an incentive for management to do its utmost in order to protect the interests of the shareholders.
Consequently, the forms of compensation must be on market terms and simple, long-term and measura-ble. In addition to a fixed annual salary, it must also be possible to offer senior management variable salaries which, for the CEO, shall be based on the group’s earnings per share and, for other senior management, on improvements within each person’s area of respon-sibility with respect to earnings-per-share, sales, net operating earnings, and the rate of capital turnover, as well as the results of individual action plans. A pension right shall apply not earlier than 62 years of age. The CEO is also covered by a premium-based plan accor-ding to which the agreed allocation for premiums may not exceed 35 per cent of the basic salary. Other senior management personnel are covered by the ITP plan, in addition to which a certain premium-based supplement may be payable. The Board of Directors shall consider each year whether or not to propose a share price-related incentive program to the shareholders meeting. During 2016 five members of management have been given compensation in return for ot being able to participate in the 2016 warrant program. The compensation has been granted on the grounds that these people due to special circumstances and insider rules could not deal with the financial instruments of the Company at the time of the incentive program.
The table set forth below shows the fees to the CEO and other senior management for the 2016 financial year.
AuditThe auditor shall audit the Company’s annual report and accounts as well as the management by the Board of Directors and CEO. Following the close of each finan-cial year, the auditor shall submit an auditors’ report as well as an auditors’ report for the group to the annual general meeting.
According to the Company’s Articles of Association, the Company shall have not less than one and not more than two authorized public accountants. The Company’s auditor is Ernst & Young AB, with Ingemar Rindstig and Mikael Ikonen as the responsible auditors.
In 2016, the total compensation paid to the Com-pany’s auditors amounted to approximately SEK 3.8 million.
Internal controls and risk managementInternal controls are important in order to ensure that the adopted targets and strategies provide the desired results, that laws and rules are complied with, and that the risk for undesirable events and errors in reporting are minimized. The Company encounters risks on a daily basis which may affect its business operations and its ability to achieve established targets. In order to mini-mize the impact of the risks, sound internal manage-ment and controls are required.
Set forth below is a description of how the internal controls regarding the financial reporting are organized.
Control environment
According to the Swedish Companies Act and the Swedish Corporate Governance Code, it is ultimately the Board of Directors that is responsible for ensuring that the Company possesses good internal management and controls, with routines that ensure that the financial reporting corresponds to the established requirements. Annual and all quartely reports are evaluate and appro-ved by the Board of Directors prior to being published.
The controls environment and controls measures ensure efficiency in the Company and constitute the basis for the internal controls. The controls environment must provide an understanding of the Company’s values at the same time as it secures compliance with policies and the achievement of targets. The formal decision-ma-king procedure is based upon the allocation of responsi-bility between the Board of Directors and the CEO and covers the rules of procedure and the CEO instructions. Overall policy is updated on a regular basis and adopted by the Board of Directors once a year. On an annual basis, the Board of Directors adopts a Finance Policy, IT Policy, Information Security Policy, Insider Policy, and Risk Management Policy. Significant processes, beyond the financial reporting, which include among other things the accounting instructions and project and
C ORPOR ATE GOVERNANC E
Remuneration to senior management
SEK thousands Base salary Variable salary Other benefits Pension costs Total
Ulf Nilsson, CEO 2,023 1,270 76 714 4,083
Other senior management 6,464 5,080 179 1,532 13,255
Total 8,487 6,350 255 2,246 17,388
46 D. Carnegie & Co AB (publ) Annual Report 2016

rent administration are prepared in separate documents within the scope of the Financial Handbook and are evaluated and developed on a regular basis following changes in the law, recommendations, IFRS changes, risks and routines. The documents act as support and guidance in the decision-making processes for each individual employee and cover both decision-making channels as well as the allocation of responsibility, the approach, and authority.
Risk assessment and control activities
The Company continuously and actively works with the identification, assessment and management of the risks to which the Company is exposed in its financial reporting. An assessment of the risk of error in the financial reporting is carried out on an annual basis for each line in the income statement, report of financial position, and cash flow analysis. For those items which are significant and/or entail an increased risk of error, there are processes designed to minimize this risk. The processes apply not only to the actual financial processes but also include, among other things, business mana-gement and business planning processes as well as IT systems.
The scope and assessment of the Company’s risk management overall, and the financial reporting in particular, is carried out regularly by the Company’s management, the Board of Directors, and the auditors. The accounts department and the property management department work sideby-side regularly carrying out follow-ups, analyses on a group, subsidiary, and property level and on an income, balance sheet, and verification level in order to ensure that guidelines are complied with. A limited number of people are authorized to sign on behalf of the Company and there is an attestation procedure.
The group’s operations, finances, and management are audited by the Company’s auditors who report observations and any comments directly to the Board of Directors. The Company’s IT environment maintains a high standard with respect to security, accessibility, and efficiency. Principles for accounting, reporting, and audit comments are reviewed in conjunction with the regular audit of the annual accounts.
The Company has designed its internal controls so as to ensure that control activities are regularly carried out on an overall level, or in the alternative are of a more process-oriented nature. An example of overarching controls are regular earnings analyses based upon the operative and legal group structure and an analysis of
key ratios. Formal reconciliations, attestations, and similar controls are examples of routine-oriented or process-oriented controls intended to prevent, discover and correct errors and deviations. The control activities have been designed in order to handle the material risks of the financial reporting.
Information and communication
External information is handled based upon the com-munications policy which is adapted based upon Nasdaq Stockholm’s Rules and Regulations and the Swedish Code of Corporate Governance and are communica-ted via press releases and the Company’s website. The Company ensures that information which may have an impact on the share price is provided to the market via press releases. Press releases are provided to the market at a time when no trading is taking place. All informa-tion is provided to the market simultaneously in Swedish and English. The CEO and CFO are the designated spokespersons for financial issues.
The Company management’s internal communica-tions consist primarily of the meetings of the mana-gement group at which minutes are taken. Communi-cations within the Company take place, among other things, through regular conferences and meetings with the persons responsible for each business unit and other managers. Relevant information, both external as well as internal, is provided on a regular basis to the relevant employees. The internal information is largely provided via the Company’s intranet. The primary purpose of the intranet is to provide the employees with a structured overall impression of the business and acts as an easily accessible platform for obtaining current information and documentation.
Follow-up
The Company’s Board of Directors has the overall responsibility for following up the internal controls and the financial reporting. Financial follow-up of all regions and companies as well as the Group takes place on a regular basis on the basis of the budget and fore-casts according to a well-established model. The results are analysed by property managers, the property and accounts department, and the regional manager respon-sible for results. The reporting is provided to Company management, the Board of Directors and auditors. The internal controls are believed to be sound and appro-priate for an organisation the size of the Company and therefore the Board of Directors and management do not see any need for an internal audit function.
C ORPOR ATE GOVERNANC E
Annual Report 2016 D. Carnegie & Co AB (publ) 47

Board of Directors
James SeppalaChairman of the boardBorn: 1979. Chairman of the board since 2016.
Education: Bachelor of Arts, Harvard College.
Other current assignments: Senior Managing Director in Blackstone’s Real Estate Group and the Head of Acquisitions Europe. Member of the Blackstone Real Estate Investment Committee. Supervisory Board Member of Multi Corporation (since 2013), and certain subsidiaries. Supervisory Board member of OfficeFirst AG.
Previous assignments: Board Member of Obligo Holding AS.
Shareholding in the company: The Director is considered independent of the Company and its management, but not independent in relation to major shareholders in the Company. James Seppala owns no shares in the Company.
Svein Erik LillelandBoard memberBorn: 1971. Board Member since 2016.
Education: Master in Business Administration, London Business School.
Other current assignments: Head of Corporate Finance for Obligo Investment Management. Board member of Global Skipholding 2 AS, Global Skipholding 2 AB, Global Skipholding Norden 2 AS and Subsea Chokes International AS.
Previous assignments: Managing Director at Wunderlich Securities, Vice President at Roxar ASA and CorrOcean ASA.
Shareholding in the company: The Director is considered independent of the Company and its management, but not independent in relation to major shareholders in the Company. Svein Erik Lilleland owns no shares in the Company.
Mats HöglundBoard memberBorn: 1948. Board Member since 2009.
Education: Master of politics, Uppsala University.
Other current assignments: Chair of the Board of Paydrive AB and Bliwa Livförsäkring, mutual; board member of KM Höglund Konsult & Förvaltning AB as well as deputy for Bar- och restaurantkonsult Norr AB and Akium AB.
Previous assignments: Senior management positions for 25 years in various companies in the insurance/finance. Chairman of the Board for Bliwa Skadeförsäkring AB and Solid Försäkringsaktiebolag as well as board member for Resurs Holding AB, Försäkringsaktiebolaget Assuran-sinvest MF and other companies.
Shareholding in the company: Independence: The Director is conside-red independent of the Company and its management as well as major shareholders in the Company. Mats Höglund does not own any Class B shares in the Company.
Knut PousetteBoard memberBorn: 1972. Board member since 2013.
Education: Business Administration degree, Lund University.
Other current assignments: CEO of Kvalitena AB (publ.), director for Stendörren Fastigheter AB. Chairman of the Board Agora.
Previous assignments: CEO and director of Storholmen Förvaltning Aktiebolag and Klaraberg Business Advisors AB.
Shareholding in the company: Independence: The Director is consi-dered independent of the Company and its management, but not inde-pendent in relation to major shareholders in the Company. Knut Pousette owns 360,000 Class B shares in the Company.
Eva RedheBoard memberBorn: 1962. Board member since 2015.
Education: Bsc Business Administration.
Other current assignments: Chairman of the board Ftrack AB and Spago Nanomedical AB. Board member PledPharma AB, Probi AB, Starbreeze AB, Axel Christiernsson International AB, Temaplan Asset Management Holding AB and Första AP-fonden.
Previous assignments: CEO and chairman of the board Erik Penser Fondkommission AB. Corporate finance and Head of investor relations at Investor AB.
Shareholding in the company: Independence: The Director is conside-red independent of the Company and its management as well as major shareholders in the Company. Eva Redhe does not own any Class B shares in the Company.
AuditorsMikael Ikonen – authorized public accountantsBorn: 1963 Auditor since: 2013
Other current auditor assignments: NCC, Bonava, Corem, Hemsö, Slättö Förvaltning, Amasten Holding och Specialfast-igheter.
Ingemar Rindstig – authorized public accountantsBorn: 1949 Auditor since: 2013
Other current auditor assignments: Atrium Ljungberg, Corem, Familjebostäder, JM, Kungsleden, Oscar Properties,
Heimstaden, Magnolia och Stendörren Fastigheter.
C ORPOR ATE GOVERNANC E
48 D. Carnegie & Co AB (publ) Annual Report 2016

Mats Höglund James Seppala
Knut Pousette
Svein Erik Lilleland
Eva Redhe
C ORPOR ATE GOVERNANC E
Mikael Ikonen Ingemar Rindstig
Annual Report 2016 D. Carnegie & Co AB (publ) 49

Management
Ulf NilssonCEO. Responsible according to the instructions to the CEO.Born: 1958. Employed since 2013.
Education: Master of Laws, Uppsala University
Other current assignments: Board member Amasten Holding, Board member for Överstyrelsen Stockholms Brandkontor, board member, Hyresbostäder i Sverige II AB, Holmiensis Bostäder AB.
Previous assignments: Chairman of the board of Loudden Bygg och Fastighetsservice AB and board member, CEO Savills Sweden AB and Partner Ernst & Young.
Shareholding in the company: Owns 235,000 Class B shares and 100,000 warrants in in the company.
Jonas AnderssonChief Investment Officer (CIO) & Head of Financing. Responsible for financing, transactions, analysis and valuation.Born: 1980. Employed since 2015.
Education: M.Sc in Engineering, industrial finance, Linköping Institute of Technology.
Previous assignments: Director Mengus – Corporate Finance Macqua-rie Capital and ABN AMRO – management consultant Capacent.
Shareholding in the company: Owns 0 shares in in the company.
Fredrik BrunnbergChief Business Development Officer (CBDO) Responsible for new development residential in the Group.Born: 1969. Employed since 2015.
Education: Business degree in real estate, Royal Institute of Technology.
Other current assignments: Board member of Trosse Invest AB and Falkberget Fastighet AB. Lecturer real estate finance and project finance - BFAB, STF Engineering program.
Previous assignments: Aberdeen Property Investors – Head Of Transactions, PwC - Corporate Finance, Newsec - Transactions, project development, WASA Fastighet – real estate manager, Royal Institute of Technology – lecturer real estate finance. Board member of Hyresfastig-heter Holding 2 AB and Boligutleie Holding 2 AS.
Shareholding in the company: Owns 0 shares in in the company.
Tommy JanssonHead of Property Management. Responsible for managing the Group´s properties.Born: 1968. Employed since 2015.
Education: Kvalificerad Fastighetsförvaltning, BFAB.
Other current assignments: Board member Hyresnämnden i Stockholm.
Previous assignments: Head of negotiations Wallenstam AB, Rental manager Wallenstam AB, Area manager Wallenstam AB.
Shareholding in the company: Owns 3,000 B series shares, and 100,000 warrants in in the company.
Marie PerssonResponsible for HR related matters for the Group.Born: 1958. Employed since 2014.
Education: Business Administration degree, University of Stockholm
Other current assignments: Board member Rotary Stockholm-Kungs-holmen, District Secretary of Rotary district 2350.
Previous assignments: HR Manager Graflunds, Administrative mana-ger Markarydsbostäder Holding AB, owner and CFO Vision International A.S. (Turkey), Export Service manager, Alfa-Laval Agri AB, president Rotary Stockholm-Kungsholmen.
Shareholding in the company: Owns 0 shares in in the company.
Björn SundbergHead of Investor Relations and Head of Communications. Internal and external communication. Brand development. Social sustainability and Public affairs. PR and Media contacts.Born: 1956
Education: Media and communications science, Brunnsvik FHSK.
Other current assignments: -Previous assignments: Public affairs- and communications adviser on PR-agencies Stairway PR and Springtime PR. Communications director at various companies and organisations.
Shareholding in the company: Owns 0 shares in in the company.
Per-Axel SundströmCFO. Responsible for accounting, financing and reporting.Born: 1956. Employed since 2014.
Education: Business Administration degree, Uppsala University.
Other current assignments: Board member of PAX Consulting AB, KEPRI AB.
Previous assignments: CFO European Drug Testing Service, CFO International Marine Group, CFO Investment AB Karlsvik, CFO Per-mascand Laser (Akzo Nobel).
Shareholding in the company: Owns 150,000 Class B shares in in the company.
Christian TapperHead of Property Development & Refurbishment process. Responsible for development and implementation of the Renovation & Refurbish-ment process of the Group’s properties.Born: 1964. Employed since 2016.
Education: Gymn. educ. Peab’s internal educ program Business deve-lopment.
Other current assignments: Director of Tapper and Tapper AB Sports Management, Consulting.
Previous assignments: PEAB - Head of Property Estate issues, Mall of Scandinavia. ÄTA Financial Economy process , Mall of Scandinavia. Chief Coordinator Property, Mall of Scandinavia.
Shareholding in the company: Owns 0 shares in in the company.
Jenny WärméLegal Counsel. Responsible for legal matters and secretary for the Board of Directors.Born: 1978. Employed since 2014.
Education: Master of Laws, Stockholm University.
Other current assignments: Non Executive Board Member Stendörren Fastigheter.
Previous assignments: Court clerk at Norrtälje district court, lawyer at Mannheimer Swartling Advokatbyrå.
Shareholding in the company: Owns 0 shares inin the company.
C ORPOR ATE GOVERNANC E
50 D. Carnegie & Co AB (publ) Annual Report 2016

X X X X X XC ORPOR ATE GOVERNANC E
Ulf Nilsson
Tommy Jansson
Per-Axel Sundström
Fredrik Brunnberg
Björn Sundberg
Christian Tapper
Jonas Andersson
Marie Persson
Jenny Wärmé
Annual Report 2016 D. Carnegie & Co AB (publ) 51

52 D. Carnegie & Co AB (publ) Annual Report 2016

F INANC IAL REPORT ING
Annual Report 2016 D. Carnegie & Co AB (publ) 53
The Board of Directors and Chief Executive Officer of D. Carnegie & Co AB (publ), company reg. no. 556498-9449, hereby submit the following annual report and consolidated accounts for 2016. Information in brackets refers to the previous year.
THIS IS D. CARNEGIE & COD. Carnegie & Co is a real estate company that owns, refur-bishes and develops properties and projects, specializing in homes in the Greater Stockholm region and other growth areas.
The property portfolio, which consists of over 16,300 apartments, is valued at approximately SEK 17 billion and consists of about 1.27 million square meters of lettable area. The Company manages the portfolio since February 2016 under the singe trademark D. Carnegie & Co, former Gra-flunds. D. Carnegie & Co has a proven refurbishment model to gradually and efficiently refurbish the individual apart-ments and the remaining parts of the buildings.
BUSINESS MODELThe business model is to own and manage properties while gradually updating apartments as and when tenants natural-ly move out. This can be done quickly and cost-effectively thanks to the tried and true renovation method. Both tenants and the Tenants’ Association appreciate this renova-tion model since the apartments are attractively renovated and no one is forced to move out against their will.
BUSINESS AND ORGANISATION D. Carnegie & Co has its registered office in Stockholm. The Group had 192 employees as of 31 December 2016, of which 68 were women and 124 men.
D. Carnegie & Co’s properties are managed by the Group’s management organisation, which has a history that dates back to the 1950s. D. Carnegie & Co’s property management orga-nisation has approximately 160 employees and is primarily located out in the individual property holdings. The property holdings are broken down into seven regions with local offices in the individual property holdings. Through its in-house pro-perty management organisation, D. Carnegie & Co handles all property management, including property services, pro-blem reporting, accounting and reporting.
D. Carnegie & Co’s property portfolio consists of residential properties with development potential, especially in the growth areas in Stockholm and the Mälaren region, as well as in Norrköping. The fair value as of 31 December 2016 was
SEK 16,998 million and the total rental value is deemed to be SEK 1,379 million. The financial occupancy rate is high, with almost non-existent vacancies in the housing. After the end of the period D. Carnegie & Co has entered into an agreement to acquire residential property portfolios in Arboga, Köping and Tranås.
The aim is to double the value of the existing portfolio within ten years by refurbishing the properties and the surrounding environment to mint condition, which benefits shareholders, tenants and employees. The company intends to continue to acquire residential property that meets demands for both loca-tion and quality.
SIGNIFICANT EVENTS DURING THE FINANCIAL YEAR D. Carnegie & Co has completed the sale of Hammarkullen in Gothenburg. The completed transaction entails that D. Carnegie & Co has strengthened its cash on account by SEK 281 million. The sale is fully in line with the company’s busi-ness focus on the Greater Stockholm and Mälardalen regions.
D. Carnegie & Co has entered into an agreement with Svensk Bolig Holding regarding the repayment of convertible deben-tures which reduces the dilution effect and improves net financial items. In order to finance the repurchase, D. Carne-gie & Co is carrying out a new issue of class B shares and issu-ing a bond.
D. Carnegie & Co has completed the acquisition of properties in Uppsala with an underlying property value of SEK 78 mil-lion, and at the same time completed the sale of potential building rights in Solna with an underlying value of SEK 49 million.
Through an extraordinary general meeting of the sharehol-ders, D. Carnegie & Co has authorized the board of directors to carry out a private placement of class B shares for the pur-pose of financing the repurchase of convertible debentures.
D. Carnegie & Co has carried ot a private placement of 6,539,900 class B shares, contributing SEK 474 million to the shareholder’s equity, prior to issue expenses.
D. Carnegie & Co has acquired a property portfolio in Katri-neholm with an agreed property value of SEK 618 million. D. Carnegie & Co thereby assumes Lundbergs entire proper-ty portfolio in Katrineholm.
Directors’ Report

F INANC IAL REPORT ING
54 D. Carnegie & Co AB (publ) Annual Report 2016
D. Carnegie & Co has acquired a property portfolio in Eskil-stuna with an agreed property value of SEK 116 million.
D. Carnegie & Co has issued an unsecured bond amounting to SEK 1,000 million in order to secure part of the financing for the repayment of the convertible subordinated loans held by Svensk Bolig Holding AB.
D. Carnegie & Co’s share has been included in three new indices: the Morgan Stanley MSCI Global Small Cap Index, the Nasdaq Nordic VINX Benchmark Index (based on mar-ket value and share liquidity) and the EPRA European Index (based on share liquidity and size of the free-float).
D. Carnegie & Co has recruited Pär Westin as commercial lessor of the commercial premises of 90,000 square meters, Pär Westin joins D. Carnegie & Co from the property consultant Colliers International.
D. Carnegie & Co has completed the acquisition of the pro-perty portfolio in Eskilstuna, amounting to SEK 116 million.
Vega Holdco S.à.r.l., an entity wholly owned by real estate funds advised by affiliates of The Blackstone Group L.P., has entered into agreements with Kvalitena AB, Svensk Bolig Holding AB and Frasdale Int. BV regarding an acquisition of shares at a price of SEK 100 per share and a transfer of Kvali-tena AB’s and Frasdale Int. BV’s remaining voting rights.
An extraordinary general meeting on 14 October 2016 has resolved to replace the board members Ranny Davidoff and Terje Nesbakken with James Seppala and Svein Erik Lille-land and to replace Knut Pousette with James Seppala as chairman of the board.
Christian Tapper has been appointed to Head of Property Refurbishments with responsibility for D. Carnegie & Co’s refurbishment process.
Vega Holdco S.à.r.l., an entity wholly owned by real estate funds advised by affiliates of The Blackstone Group L.P., has on 7 December completed the mandatory tender offer in cash amounting to SEK 100 per share to the shareholders and war-rant holders in D. Carnegie & Co which was announced on 17 October 2016. After completing the tender offer Vega Holdco S.à.r.l. owns 46 per cent of the shares and controls 65 per cent of the votes in D. Carnegie & Co.
CONSOLIDATED RESULTS The earnings figures set forth below relate to the period January – December 2016. Comparison items set forth in parentheses relate to amounts for the corresponding period in the preceding year. The current operations carried out in D. Carnegie & Co began in 2014. The amounts for the cor-responding period in the preceding year are thus not directly
comparable. Profit after tax in 2016 amounted to SEK 1,678 (1,139), which corresponds to a profit per ordinary share of SEK 22.20 (16.10) prior to dilution, SEK 21.93 (13.50) after full dilution. Rental incomeRental income during the period increased to SEK 1,284 million (1,217). Other operating income amounted to SEK 0 million (3). During the period, 1,253 (527) apartments were refurbished, with the rent on these renovated proper-ties going from an initial average of SEK 1,028 /m² to SEK 1,465 /m².
Operating costs and net operating incomeProperty expenses amounted to SEK -654 million (-667), yielding a net operating income, i.e. total income minus bad debt losses, operating and maintenance costs, propertyadmi-nistration, rents on leasehold interest in government owned land, and property taxes, of SEK 630 million (554). The gross margin was 49.1% (45.4). The industry specific key figure, net operating income, is reported as it shows the results from property management.
Management and administrative expensesManagement and administrative expenses amounted to SEK -102 million (-97). The cost of central administrationconsists primarily of personnel costs and other costs for group-wide functions, marketing and sales costs. Non-re-curring costs primarily consists of legal assistance in due dil-ligence processes, and a compensation uring the period to five members of management in return for not being able to participate in the 2016 warrant program. The company has also paid fees to banks for advice in connection to the bid by Vega Holdco S.à.r.l.. These activities resulted in non-recur-ring expenses of a total of SEK -36 million during the peri-od. These non-recurring expenses are not expected to appear on a regular basis. The previous year non-recurring expenses amounted to SEK -31 million, primarily relating to the stock market listing process and temporarily increasingthe size of the organisation. Financial income and expensesFinancial income amounted to SEK 16 million (17) and financial expenses to SEK -275million (-288), includinginterest expenses of SEK -198 million (-213).
Income from property managementIncome from property management (i.e. profit beforechanges in value and taxes) for the period amounted toSEK 269 million (186). The industry specific key figure,income from property management, is reported as itshows the company’s results excluding changes in value.
Growth in valueChanges in value in the property holdings during the period affected earnings in the amount of SEK 1,938 million

F INANC IAL REPORT ING
Annual Report 2016 D. Carnegie & Co AB (publ) 55
(1,307). The changes in value primarily were reflected positi-vely by the rental increase during the period which resulted in a higher net operating income and a lower average return requirement of 4.31% (4.84). The total increase in the rental value during the period amounts to just over SEK 72 million on an annual basis. During the period, value-increasing investments were made in a total value of SEK 1,039 million (491). The changes in value of derivatives and shares/inte-rests amounted to SEK -87 million (-11). The changes in value in the group’s shareholdings during the period amoun-ted to SEK -78 million (-).
Profit before taxProfit before taxes amounted to SEK 2,072 (1,422).
Tax The tax cost for the period amounted to SEK -394 million (-282), of which SEK -564 million (-375) consists of deferred tax related to temporary differences on investment properties; SEK 19 million (1) consists of changes in value for derivatives; SEK 16 million (-) consists of deferred tax temporary differen-ces on shares; and SEK 135 million (90) consists of loss carry-forwards. The effective tax rate for the period is 19.0 (19.9) per-cent. The low effective tax rate can be explained by taxfree sales of companies.
ProfitThe profit for the period after tax amounted to SEK 1,678 mil-lion (1,139), which corresponds to SEK 22.20 (16.10) per ordi-nary share before dilution, and SEK 21.93 (13.50) per share after full dilution.
OPERATING SEGMENTSD. Carnegie & Co focuses on residential properties and no other segments. D. Carnegie & Co focuses its investments on the Greater Stockholm region and Mälardalen to ensure that there is a high demand for their homes. The company looks for growth areas within a reasonable distance of Stockholm to take advantage of the population growth in the capital. With this focus on Stockholm and Mälardalen, the company’s business is not divided into regions relevant for monitoring purposes.
The only operating segment is residential properties.
PROPERTY VALUATIONAs of 31 December 2016, D. Carnegie & Co’s property portfolio was valued at an estimated fair value of SEK 16,998 million. The valuation is based on the methodology described below, where 100 percent of the portfolio was valued independently. The independent property valuations were carried out by Savills. Comparative figures in parent-heses relate to amounts for the corresponding period of last year.
The valuation is based on a cash flow analysis whereby the property’s value is based on the present value of forecast cash flows and the residual value during the calculation period of five years.
The return requirements on units included in the valuation varies from 3.76 percent to 8.0 percent, with an average of 4.31 (4.84) percent.
The assumption regarding the future cash flows is based on the analysis of:• Future development of the market and the local vicinity• The market conditions and market position of the
property• Rent terms and conditions in line with the market• Operating and maintenance costs of similar properties in
comparison with those in the property in question
Based on the analysis, the resulting net operating income during the calculation period (2017-2021) and the residual value at the end of the calculation period were subsequently discounted applying an estimated cost of capital in the range of 5.84 - 10.16 %. The average cost of capital for the period was 6.40% (6.94). The parameters that influence value and are used in the valuation correspond to the external apprai-ser’s interpretation of how a prospective buyer in the market would reason, and the sum of the present value of net opera-ting income and the residual value can thus be taken as an expression of the fair value.
Potential building rights have been valued based on market comparison studies and the status inthe planning process. The building rights have beenvalued at SEK 250 – 8,000 per square meter GFA at thetime of a final detailed zoning plan. Deductions from thesevalues are made to reflect the estimated status in thedetailed zoning plan process. The total area for potentialbuilding rights with value is estimated at 232,300 m²GFA (gross area). The potential building rights werevalued on December 31, 2016 at a market value of SEK311 million - the valuations of the building rights wereunchanged during 2016. Only potential building rightsthat have progressed far enough in the planning processhave been assessed a fair value.The total change in value in the property portfolio duringthe period January to December was 12.9 per cent (10.4). This change in value takes into consideration acquisition of properties carried out during the year, investments in exis-ting properties, and elimination of properties sold.

F INANC IAL REPORT ING
56 D. Carnegie & Co AB (publ) Annual Report 2016
CONSOLIDATED STATEMENT OF FINANCIAL POSITIONNon-current assetsThe Group’s non-current assets, primarily relating to mana-gement properties, amounted to a total of SEK 16,998 mil-lion (13,826) on 31 December 2016. At the end of the peri-od, goodwill amounted to SEK 630 million (686), a value which arose in conjunction with the acquisition of Hyres-bostäder i Sverige II AB in 2014, which is reported as a busi-ness combination.
Investment properties are reported at their fair value based on a valuation of the entire property portfolio as of 31 December 2016.
There were no long-term receivables at the end of theperiod (7).
Current assetsCurrent assets at the end of the period amounted to SEK 262 million (412) and consist mainly of a claim under a pro-missory note, investments in equities, accounts receivable and prepaid expenses. The group’s cash and cash equivalents on the balance sheet date amounted to SEK 679 million (479). Cash onaccount was strengthened by sales of companies duringthe period amounting to SEK 384 million (243), andissue of shares amount to SEK 461 million (1). The cash and cash equivalents will be used for continued acquisitions and the continued high rate of apartment refurbishments.
Changes in equityOn 31 December 2016, consolidated shareholders’ equity was SEK 6,358 million (4,392). The equity ratio was 33.8% (28.2). Shareholders’ equity per ordinary share was SEK 82.60 (62.06) and adjusted equity (EPRA NAV) per ordina-ry share was SEK 101.96 (73.50).
Changes in shareholders’ equity are largely attributable to the profit for the period of SEK 1,678 million (1,139) and the issue of 6,539,900 class B shares, which added SEK 474 million to the shareholders’ equity, before costs of issuing
Deferred taxDeferred tax receivable amounted to SEK 303 million
(148) and primarily relate to loss carryforwards. The deferred tax liability amounts to SEK 1,983 million (1,435) and is the difference between the fair value and the tax residual value of properties
Liabilities to credit institutionsD. Carnegie & Co.’s total interest-bearing liabilities at the end of the accounting period amounted to SEK 9,991 mil-lion (9,238). SEK 9,991 million is adjusted for prepaid arrangement fees of SEK 69 million (65). In 31 December 2016, interest-bearing liabilities to credit institutions amounted to SEK 8,060 (7,160) million, corresponding to an LTV of approximately 47 percent (52). LTV (Loan-to-Value) refers to the key ratio that describes interest-bearing liabilities to credit institutions in relation to the fair value of investment properties. In addition to liabilities to credit institutions, there are senior unsecured bonds amounting to SEK 2 billion (1). The Group’s total short term interest-bea-ring liabilitiesto credit institutions amounted to SEK 1,258 million (1,244). These consist primarily of so-called revol-ving loans which are expected to be extended on a conti-nuous basis.
The average interest rate on liabilities to credit institutions is 2.2% (2.3). The credit facilities are subject to customary covenants which in certain cases limits the subsidiaries’ pos-sibility of paying a dividend. The yearly interest rate on the bond issued in April 2015 was in the period 3.75 per cent. The yearly interest rate on the bond issued in April 2016 was in the period 4.00 per cent
D. Carnegie & Co uses derivatives in order to secure the loan maturity structure. Interest-rate derivatives are a flexi-ble and cost-efficient way of achieving the desired fixed-inte-rest term. In accordance with the IAS 39 reporting rules, the interest-rate derivatives are valued at fair market value. In the event the agreed interest rate deviates from the market rate, irrespective of the credit margin, a theoretical surplus or deficit value arises for the interest-rate derivatives where the change in value not affecting cash flow is reported in the income statement. On 31 December 2016, the fair market value of the interest-rate derivatives portfolio, consisting of interest rate swaps and interest rate caps, was SEK -138 mil-lion (-60).
Other current liabilitiesOther current liabilities amounted to SEK 400 million (435) and consist primarily of accounts payable and accrued expenses and accrued income.
CHANGE IN REPORTED VALUE OF PROPERTIES
Amount in SEK
Property holdings atbeginning of period
2016 01 jan
2015 01 jan
Existing properties 13,826,439 11,520,820
Acquisitions 780,147 955,000
Investments in existing properties,apartments and other realestate investments 1,039,204 490,702
Reclassifications - -
Divestments -586,157 - 446,875
Change in value ofinvestment properties, unrealized 1,938,290 1,306,792
Property portfolio at end of period 16,997,923 13,826,439
MARKET VALUATION INVESTMENT PROPERTIES

F INANC IAL REPORT ING
Annual Report 2016 D. Carnegie & Co AB (publ) 57
RISKS RELATED TO THE COMPANY
Changes in macroeconomic factors The real estate industry is heavily impacted by macroecono-mic factors such as general economic trends, growth, employment, construction rate for new residential and com-mercial buildings, changes in infrastructure, population growth and structure, inflation and interest rates. Growth in the economy affects the employment rate, which is a key component of supply and demand in the rental market and thus affects vacancy rates and rent levels. Expectations regarding inflation policy govern interest rates and thus affect D. Carnegie & Co’s net financial items. Interest expenses on liabilities at credit institutions is D. Carnegie & Co’s single largest expense item. In the long-term, changes in interest rates will have a substantial effect on D. Carnegie & Co’s financial performance and cash flow. Inflation also affects D. Carnegie & Co’s costs. In addition, changes in interest rates and inflation also impact return requirements and thus the fair values of the properties.
The value of D. Carnegie & Co’s properties may changeD. Carnegie & Co’s investment properties are reported in the balance sheet at fair value and changes in value are reported in the income statement.
The value of the properties is affected by a number of factors, both property-specific, such as vacancy rates, rents and operating expenses, and market-specific, such as yield requirements and cost of capital derived from comparable transactions in the property market.
Both property-specific impairments, such as higher vacan-cy rates and lower rents, and market-specific impairments, such as higher yield requirements and cost of capital, can lead to negative realized and unrealized changes in value that could have a negative impact on D. Carnegie & Co’s financial position and earnings.
The value of derivative financial instruments may changeD. Carnegie & Co has some loans with short fixed-interest terms and, as part of its strategy to manage interest rate risk, D. Carnegie & Co uses interest-rate derivatives, mainly swaps. Interest-rate derivatives are reported at fair value in the balance sheet with changes in value reported in the inco-me statement. As market rates change, the interest-rate deri-vatives develop a theoretical surplus or deficit that does not affect cash flow. D. Carnegie & Co has used interest-rate derivatives to hedge against higher interest rates. If market rates fall, the fair value of D. Carnegie & Co’s interest-rate derivatives will decline, which could have a negative effect on D. Carnegie & Co’s earnings. During the year D. Carne-gie & Co has entered into interest rate cap agreements amounting to SEK 1,500 million, with a maturity of app-roximately 6 years and with an agreed cap rate (Stibor) of 3 percent.
Refinancing may prove impossible or be associated with significantly higher costsD. Carnegie & Co’s interest-bearing liabilities on 31 December 2016 amounted to SEK 10,060 million (9,313), of which SEK -69 million (-65) was reported as a prepaid structuring cost . SEK 1,240 million, corresponding to 12 percent, falls due for renegotiation or repayment within one year and SEK 8,549 million, corresponding to 85 percent, falls due within one to five years. During the financial crisis, volatility and disruptions in the financial and credit markets were extremely large, with an unprecedented reduction in liquidity and increased credit risk premiums for many credit institutions. There is still some uncertainty on the financial markets and if D. Carnegie & Co is unable to refinance its loans, or can only do so on worse terms, interest expenses may be higher.
Other risksCarnegie conducts extensive renovation activitiesand bulk purchasing of building materials and there are risks related to the environmental risks of building materials and regulatory changes.
WORK OF THE BOARD OF DIRECTORS DURING THE YEARD. Carnegie & Co’s Board of Directors consists of 5 directors. The board held 25 meetings during the year at which minutes were taken, in addition to regular contacts. The most important duty of the Board of Directors is to decide on strategic issues. In general, the board addresses matters of material significance to the Group. The main iss-ues during the year involved the refinancing of the converti-ble debenture of SEK 1,020 million, the directed issue of class B-shares and the bond issue conducted in order to refi-nance the convertible debenture repayment, the public bid from Vega Holdco S.à.r.l. and property and company trans-actions. For more information about the work of the Board of Directors, please see the section on Corporate Governan-ce, pp 39-47.
THE BOARD OF DIRECTORS’ PROPOSAL FOR GUIDELINES FOR COMPENSATION TO SENIOR MANAGEMENTThe company shall offer compensation levels and employ-ment terms and conditions as are required in order to be able to recruit and retain management with a high level of exper-tise and the capacity to achieve the goals established. The forms of compensation shall motivate management to do its utmost in order to secure the interests of the shareholders. Consequently, the forms of compensation must be on market terms and simple, long-term and measurable. In addition to a fixed annual salary, senior management may also receive variable salary, which for the CEO shall be based on the

F INANC IAL REPORT ING
58 D. Carnegie & Co AB (publ) Annual Report 2016
group’s earnings per share and for other senior management personnel on improvements within the area of responsibility of each individual with respect to earnings-per-share, sales, operating net earnings and the rate of capital turnover, as well as the results of individual action plans. A right to a pension shall apply from the age of 62 at the earliest. The CEO is covered by a premium-based plan according to which the contractual premium provision may not be more than 35% of the base salary. Other senior management are covered by the ITP plan, on top of which a certain premi-um-based supplement may be payable. The Board of Directors shall consider each year whether a share price-re-lated incentive program shall be proposed to the sharehol-ders’ meeting. No share price-related incentive programs may be applied without the approval of the shareholders meeting.
CURRENT EMPLOYMENT CONTRACTS FOR CHIEF EXECUTIVE OFFICER AND SENIOR EXECUTIVESDecisions on current remuneration levels and other terms of employment for the company’s Chief Executive Officer and other senior executives were taken by the board in accordan-ce with the existing remuneration policy adopted by the board. All of the decisions on individual remuneration for senior executives fall within the approved remuneration policy. Where possible, pension agreements should be based on fixed premiums and formulated in accordance with the levels, practices and collective agreements applicable in the country where the senior executive is employed. For executi-ves resident in Sweden, a notice period of six months applies for both the employee and the employer.
RELATED-PARTY TRANSACTIONSKvalitena AB; In connection with the acquisition ofHyresbostäder i Sverige II AB, a related-party transactiontook place between Kvalitena AB and MarkarydsbostäderHolding AB, a subsidiary of Hyresbostäder i SverigeII AB. The transaction consisted of a claim under apromissory note whereby Markarydsbostäder HoldingAB had a claim against Kvalitena AB in the amount ofSEK 150 million. SEK 100 million under this promissorynote became due and payable on 31 October 2015 whichhad pursuant to a resolution adopted by the board ofdirectors extended to 31 August 2016. The remainingSEK 50 million would have fallen due on 31 October2016, but had pursuant to a resolution adopted by theboard of directors been brought forward to 31 August2016. The average rate of interest during the period was6.75 per cent, and SEK 6 million was paid in interestduring the period. Sörmlandsporten AB, a companywhich is 50 per cent owned by Kvalitena AB, has througha transfer assumed a SEK 15 million loan to D. Carnegie
& Co. An additional loan, amounting to SEK 40 million,was issued to Kvalitena AB, which has pursuant to a resolu-tion adopted by the board of directors be solved at 31August 2016. This loan has been issued on market terms.All loans to the Kvalitena-group were repaid in fullduring the fourth quarter.Svensk Bolig Holding; SEK 200 million of the purchaseprice in connection with the acquisition of HyresbostäderII i Sverige AB comprised a vendor note. This note washeld by the seller of Hyresbostäder i Sverige II AB,Svensk Bolig Holding AB. On 4 July 2015, SEK 67 millionwas repaid on the note, and on 30 June 2016 the restSEK 133 was repaid, meaning that none of this vendornote remains outstanding at the end of the second quarter.The note carried interest at an annual rate of rate of 3per cent. In addition to the repayment of the vendor note,interest was paid affecting the financial costs during theperiod amounting to SEK 4 million. Bosystem Nordic AB; During the period, the D. Carnegie& Co Group made purchases worth SEK 49.3 millionfrom Bosystem Nordic AB, a company which is 50 percentowned by Kvalitena AB.
PARENT COMPANYThe operations conducted in D. Carnegie & Co consist of group functions. No properties are directly owned by the parent company. The parent company’s revenue in 2016 amounted to SEK 23 million (10) and the profit after tax was SEK -114 million (-116). The revenue mainly relates to pay-ment for services rendered. Non-recurring costs of SEK -36 million (31) for sponsoring, social activities and legal assis-tance in due dilligence processes, non-recurring compensa-tion to five members of management in return for not being able to participate in the 2016 warrant program and fees to banks for advice in connection to the bid by Vega Holdco S.à.r.l.. These non-recurring expenses are not expected to appear on a regular basis. Financial income of SEK 34 mil-lion (18) consists of short-term lending, while financial expenses of SEK -137 million (-117) consists mainly of inte-rest-bearing costs for convertible debentures and bonds. Cash and cash equivalents at the end of the period amounted to SEK 169 million (238).
EVENTS AFTER THE END OF THE REPORTING PERIODD. Carnegie & Co has entered into an agreement withFastighets AB Balder (publ) to acquire residentialproperty portfolios in Arboga, Köping and Tranås. Theproperty portfolios comprises 42 properties and 1,681apartments. The property value is SEK 1,420 millionand the agreed share purchase price amounts to SEK1,040 million. The transaction is a share deal withclosing scheduled for May 2017.

F INANC IAL REPORT ING
Annual Report 2016 D. Carnegie & Co AB (publ) 59
THE FUTURED. Carnegie & Co controls its activities through business plans. At the end of the period, there was a business plan in place which the board had adopted on 18 December 2014, and which was adjusted with respect to LTV on 11 April 2015. The business plan describes the business concept, which is to take a long-term approach to acquire, manage and refurbish the property portfolio.
D. Carnegie & Co focuses on the Greater Stockholm regi-on and Mälardalen to ensure a high demand for its homes.
D. Carnegie & Co intends to continue renovating all pro-perties to achieve a strong, even growth in value. In ten years, D. Carnegie & Co expects the entire existing portfo-lio will be modernized.
D. Carnegie & Co expects to achieve annual growth of about 10 percent through growth in value and another 10 percent through acquisitions. However, the latter depends on market conditions and may be either higher or lower.
D. Carnegie & Co has the following financial targets: • Equity ratio of at least 30% • Gross margin exceeding 50%• Annual growth in value of the existing portfolio of 10%• Loan-to-value ratio (LTV) on properties of a maximum
of 65%
The equity ratio at year-end was 33.8% (28.2), which is abo-ve the financial target. The gross margin was 49.1% (45.4) during 2016, which is below the long-term financial target. The long-term target gross margin is expected bo be reached during 2017.Over the first two–three years, D. Carnegie & Co will haveto finance part of the investments in the existing portfoliothrough external debt, but the loans will account for a decli-ning percentage of assets because of the faster increase in the value of the holdings. D. Carnegie & Co will subsequently generate a cash flow surplus.The loan-to-value ratio (LTV) amounted to 47.3% (51.8) at the year end, which is in-line with the financial target.
The investments in the existing properties provide a good return, so there is no intention to pay any dividend to the shareholders over the next few years. The company will pay dividends when it is not possible to invest the entire surplus in this way.
THE SHARESAt the end of the year, D. Carnegie & Co had 7,5328 (8,297) shareholders. The market capitalization was SEK 7,841 (4,618) million. D. Carnegie & Co has two classes of shares, class A and class B ordinary shares. In 2015, the shares were relisted and have been listed on Nasdaq Stockholm MidCap since May 12, 2015. In total, there are 5,369,866 class A shares and 71,938,910 class B shares outstanding, or a total
of 77,308,776 ordinary shares. The share price rose by 62.1% in 2016 (42.7) and has risen by 179.4% since listing on Nas-daq First North on April 9, 2014.
DIVIDEND AND DIVIDEND POLICYThe company is in an expansive phase during which any surplus will be invested in the property portfolio, prima-rily in the form of refurbishments. Since investments in the existing properties provide a good return, it is not planned to pay any dividend to the shareholders over the next few years. The company will pay dividends when there is no possibility to invest the entire surplus in this way. In the long run, the company intends to pay a divi-dend of between 30 – 50% of the group’s net earnings.
PROPOSED ALLOCATION OF UNAPPROPRIATED EARNINGSThe following funds are at the disposal of the Annual General Meeting:
The board proposes that no dividend be paid for financial year 2016.
Consolidated equity has been calculated in accordance with the EU-adopted IFRS standards and interpretations (IFRIC), as well as in accordance with Swedish law, inclu-ding application of Swedish Financial Reporting Board recommendation RFR1. The parent company’s equity has been calculated in accordance with Swedish law and applica-tion of RFR2. The proposal to not pay a dividend is in line with the board’s established dividend policy.
Retained earnings -174,498,491
Share premium reserve 2,448,858,519
Repayment convertible debenture -145,199,985
Profit/loss for the year -113,623,657
SEK 2,015,536,386
To the shareholders 0
Carried forward 2,015,536,386
SEK 2 015 536 386

F INANC IAL REPORT ING
60 D. Carnegie & Co AB (publ) Annual Report 2016
Amounts in SEK thousand NOTE 2016 2015
Rental income etc. 2.4 1,284,282 1,217,356
Other operating income 2 187 3,459
Operating costs 3,4,6,23,25 -522,563 -496,163
Maintenance costs -89,942 -131,149
Property tax -25,972 -23,935
Site leasehold rent -15,526 -15,445
Net operating income 630,466 554,123
Central administration 3,5,6,23,25 -101,673 -96,779
Costs related to acquisition of business
Financial income 7 16,068 16,970
Financial expenses 7 -275,477 -288,072
Income from property management 269,384 186,242
Dividend 99,214
Realised changes in value, investment properties 10 1,938,290 1,306,792
Change in value, investment properties -14,236 -45,507
Change in value, financial instruments 7, 20 -165,189 -10,999
Write-down of goodwill 9 -54,979 -15,004
Profit/loss before tax 2,072,484 1,421,524
Current tax 8,25 -880 1,563
Deferred tax 8,25 -393,340 -283,952
Profit/loss for the year 1,678,264 1,139,135
Other comprehensive income - -
Total other comprehensive income 0 0
PROFIT/LOSS FOR THE YEAR 1,678,264 1,139,135
Profit/loss for the year 1,678,264 1,139,135
Other comprehensive income 0 0
TOTAL PROFIT/LOSS FOR THE YEAR 1,678,264 1,139,135
Profit attribute to:
Parent company shareholders 18 1,678,264 1,138,559
Non-controlling interests 0 576
TOTAL COMPREHENSIVE INCOME FOR THE 1,678,264 1,139,135
PERIOD
Profit after tax per share (SEK), basic 18 22.20 16.10
Profit after tax per share (SEK), diluted 21.93 13.50
Consolidated Income Statement
CONSOLIDATED STATEMENT OFCOMPREHENSIVE INCOME

F INANC IAL REPORT ING
Annual Report 2016 D. Carnegie & Co AB (publ) 61
Amounts in SEK thousand NOTE 31 DEC 2016 31 DEC. 2015
ASSETS
Non-current assets
Goodwill 9 630,165 685,728
Investment properties 10 16,997,923 13,826,439
Equipment 11 5,972 4,661
Stocks and shares 13 19,950 558
Non-current receivables - 6,662
Interest rate derivatives 8 6,517 -
Deferred tax assets 302,579 148,135
Total non-current assets 17,963,106 14,672,183
Current assets
Accounts receivable 12 5,792 6,410
Current investments 13,20 182,459 178,245
Other receivables 14,25 39,376 197,642
Tax receivables 9,980 -
Prepaid expense and accrued income 15 24,153 29,837
Cash and cash equivalents 16 679,370 478,524
Total current assets 941,130 890,658
TOTAL ASSETS 18,904,236 15,562,841
EQUITY AND LIABILITIES
Shareholders’ equity
Share capital 17 985,095 901,762
Additional paid-in capital 2,506,023 2,128,631
Retained earnings 1,215,995 222,060
Profit for the year 1,678,264 1,139,135
Shareholders’ equity 6,385,377 4,391,588
Non-current liabilities
Non-current interest-bearing liabilities 19,20,25 8,733,018 7,587,332
Other non-current liabilities 1,103 3,143
Deferred tax liability 8 1,982,826 1,435,043
Interest-rate derivatives 20 144,694 60,487
Total non-current liabilities 10,861,641 9,086,005
Current liabilities
Current interest-bearing liabilities 19,20,25 1,257,659 1,650,286
Accounts payable 81,934 108,509
Current tax liabilities - 4,181
Other current liabilities 21 35,764 18,660
Accrued expenses and prepaid income 22 281,861 303,612
Total current liabilities 1,657,218 2,085,248
TOTAL EQUITY AND LIABILITIES 18,904,236 15,562,841
Consolidated Balance Sheet
For information about the Group’s pledged assets and contingent liabilities, see note 24.

F INANC IAL REPORT ING
62 D. Carnegie & Co AB (publ) Annual Report 2016
Changes in Consolidated Equity
Amounts in SEK thousand Share capital Otheradditional
paid-incapital
Retainedearnings,
including profit/loss for the year
Equityattributable to
Parent Companyshareholders
Noncontrollinginterests
Total equityattributable toshareholders
Equity, 31 Dec. 2014 901,762 2,084,892 222,060 3,210,308 41,147 3,251,455
Profit/loss for the year - 42,741 1,139,135 1,180,282 -41,147 1,139,135
Other comprehensive income - - - 0 - 0
Net changes,excluding transactions withshareholders 0 42,741 1,139,135 1,180,282 -41,147 1,139,135
-
Other contributed capital, warrants - 998 - 998 - 998
Dividend paid onordinary shares - - - 0 - 0
Dividend on preferred shares - - - 0 - 0
Total transactions withshareholders 0 998 0 998 0 998
Equity, 31 Dec. 2015 901,762 2,128,631 1,361,195 4,391,588 0 4,391,588
Profit/loss for the year - - 1,678,264 1,678,264 - 1,678,264
Other comprehensive income - - - 0 - 0
Net changes, excluding transac-tions with shareholders 0 0 1,678,264 1,678,264 0 1,678,264
Directed share issue 83,333 376,585 - 459,918 - 459,918
Other contributed capital, warrants - 807 - 807 - 807
Equity component convertible subordi-nated loan - - -145,200 -145,200 - -145,200
Dividend paid onordinary shares - - - 0 - 0
Dividend on prefered shares - - - 0 - 0
Total transactions withshareholders 83,333 377,392 -145,200 315,525 0 315,525
Equity, 31 Dec. 2016 985,095 2,506,023 2,894,259 6,385,377 0 6,385,377
Reporting of shareholders’ equity according to IFRS And the Swedish
Companies Act
Shareholders equity is allocated to assets related to the parent company’s
shareholders and holdings without a controlling influence. Transfers of value
in the form of, among other things, dividends paid by the parent company
and the group must be based on a statement prepared by the Board of
Directors regarding the proposed dividend. This report must take into consi-
deration the prudence rule which is set forth in the law in order to avoid the
payment of a dividend for which there is not coverage.
Changes in shareholders’ equity
Changes in shareholders’ equity consist primarily of the comprehensive
income for the year, the issuance of warrants programs to the employees
and effect on adjusted equity for the repayment of the convertible debenture ..
Share capital
On 31 December 2016 the registered share capital covered 5,369,855
class A shares and 71,938,910 class B shares. The shares have a quotient
value of 12.742349. Each class A shares entitles the holder to 5 votes and
each class B share entitles the holder to 1 vote.
Other contributed capital
Means shareholders’ equity contributed by the shareholders. This item
includes set-off issues, new issues, settlement of issue costs in conjunction
with the IPO, and acquired shareholders’ equity in conjunction with the
acquisition of affiliated companies.
Retained profits including profit for the year
This item includes profits earned in the parent company and its subsidiaries
and affiliated companies.

F INANC IAL REPORT ING
Annual Report 2016 D. Carnegie & Co AB (publ) 63
Amounts in SEK thousand NOTE 2016 2015
Operating activities
Income from property management 269,384 186,242
Adjustment for items not included in cash flow 27 -862 18,074
Tax paid -11,072 -1,891
Cash flow from operating activitiesbefore change in working capital 257,450 202,425
Changes in operating receivables/liabilities -136,215 76,032
Total change in working capital -136,215 76,032
Cash flow from operating activities 121,235 278,457
Investment activities
Investments in existing properties 10 -1,039,205 -490,702
Acquisition of Group companies/properties,business combination 10 - -
Acquisition of Group companies/properties,asset acquisition 10 -652,325 -372,785
Acquisition of tangible non-current assets 11 -3,333 -2,103
Sales of Group companies/properties 384,493 243,154
Change in financial assets 215,750 -107
Share and participations, net - -
Cash flow from investment activities -1,094,620 -622,543
Financing activities
New share issue 460,725 998
Change in interest-bearing liabilities, new loans 2,396,606 5,316,247
Change in interest-bearing liabilities, amortized loans -1,782,314 -4,747,803
Realized changes in value, derivatives - -
Dividend 99,214 -
Cash flow from financing activities 1,174,231 569,442
TOTAL CASH FLOW 200,846 225,356
Opening cash and cash equivalents 478,524 253,168
CLOSING CASH AND CASH EQUIVALENTS 16 679,370 478,524
Consolidated Statement of Cash Flows

F INANC IAL REPORT ING
64 D. Carnegie & Co AB (publ) Annual Report 2016
Amounts in SEK thousand NOTE 2016 2015
Net sales 2,25 22,836 10,284
Cost of goods sold 3,6,23,25 -20,487 -6,327
Gross profit 2,349 3,957
Central administration 3,5,6,23,25 -65,929 -53,815
Operating profit/loss -63,580 -49,858
Financial income 7 33,742 17,967
Financial expenses 7 -136,930 -117,289
Profit/loss from property management -166,768 -149,180
Received dividends 99,214 -
Write-downs -37 -
Value changes of financial instruments -77,776 -
Profit/loss before tax -145,367 -149,180
Current taxes - -
Deferred taxes 8 31,743 32,741
Profit/loss for the year -113,624 -116,439
Other comprehensive income 8 - -
Total other comprehensive income 0 0
TOTAL PROFIT/LOSS FOR THE YEAR -113,624 -116,439
PARENT COMPANY STATEMENTOF COMPREHENSIVE INCOME
Profit/loss for the year -113,624 -116,439
Other comprehensive income - -
TOTAL PROFIT/LOSS FOR THE YEAR -113,624 -116,439
Parent Company – Income Statement

F INANC IAL REPORT ING
Annual Report 2016 D. Carnegie & Co AB (publ) 65
Amounts in SEK thousand NOTE DEC. 31 2016 DEC. 31, 2015
ASSETS
Non-current assets
Equipment 11 1,431 1,838
Shares and participations in subsidiaries 26 4,827,870 4,827,870
Shares and participations 250 252
Non-current receivables from Group companies 25 58,711 57,611
Interest rate derivatives 6,517 -
Deferred tax assets 8 86,695 54,952
Total non-current assets 4,981,474 4,942,523
Current assets
Accounts receivable 12 44 -
Current receivables from Group companies 25 1,641,780 922,464
Short term investments 13 98,270 104,405
Other receivables 14, 25 9,587 19,047
Tax receivables 211 -
Prepaid expense and accrued income 15 473 734
Cash and cash equivalents 16 169,281 237,842
Total current assets 1,919,646 1,284,492
TOTAL ASSETS 6,901,120 6,227,015
EQUITY AND LIABILITIES
Restricted equity
Share capital 17 985,095 901,762
Non-restricted equity - -
Share premium reserve 2,448,678 2,071,286
Retained earnings -319,698 -58,059
Loss for the year -113,624 -116,439
Shareholders’ equity 3,000,451 2,798,550
Non-current liabilities
Interest-bearing liabilities 19 1,980,951 1,722,787
Total non-current liabilities 1,980,951 1,722,787
Current liabilities
Current interest-bearing liabilities 19,25 0 406,750
Accounts payable 1,460 1,619
Current liabilities Group companies 25 1,883,288 1,268,186
Other current liabilities 21 4,328 927
Accrued expenses and prepaid income 22 30,642 28,196
Total current liabilities 1,919,718 1,705,678
TOTAL EQUITY AND LIABILITIES 6,901,120 6,227,015
Parent Company – Balance Sheet
For information about the parent company’s pledged assets and contingent liabilities, see note 24.
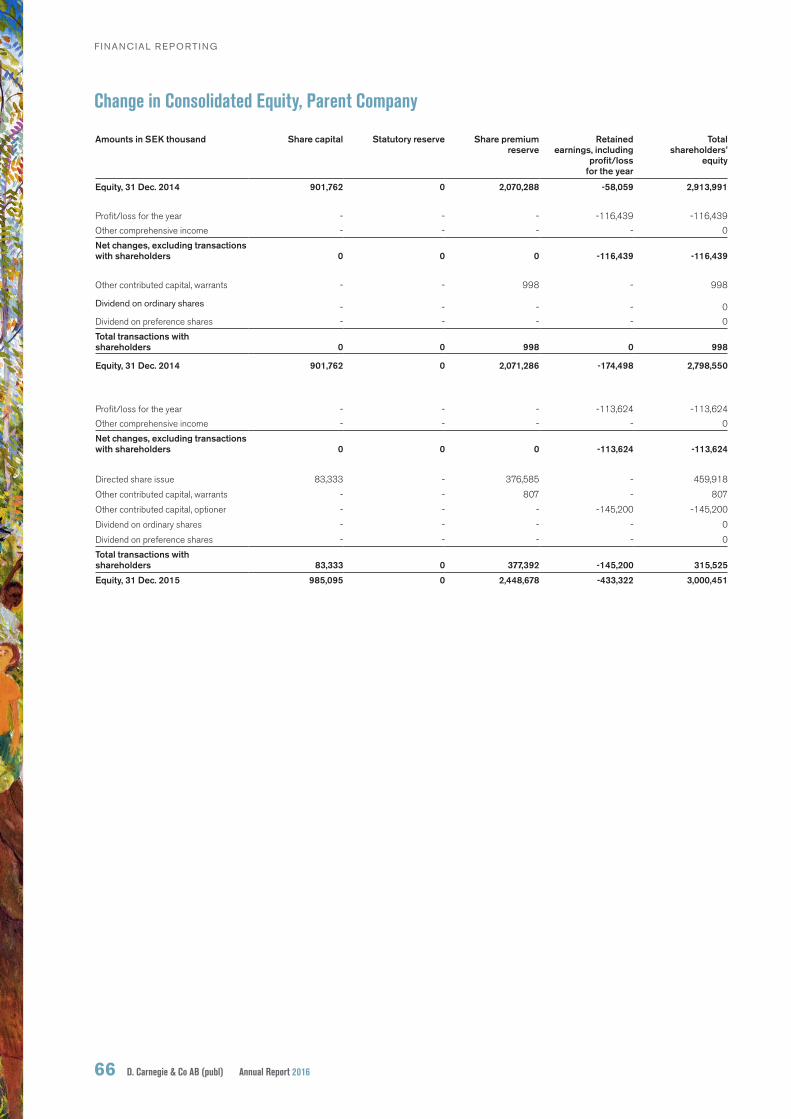
F INANC IAL REPORT ING
66 D. Carnegie & Co AB (publ) Annual Report 2016
Change in Consolidated Equity, Parent Company
Amounts in SEK thousand Share capital Statutory reserve Share premiumreserve
Retainedearnings, including
profit/lossfor the year
Total shareholders’
equity
Equity, 31 Dec. 2014 901,762 0 2,070,288 -58,059 2,913,991
Profit/loss for the year - - - -116,439 -116,439
Other comprehensive income - - - - 0
Net changes, excluding transactionswith shareholders 0 0 0 -116,439 -116,439
Other contributed capital, warrants - - 998 - 998
Dividend on ordinary shares - - - - 0
Dividend on preference shares - - - - 0
Total transactions withshareholders 0 0 998 0 998
Equity, 31 Dec. 2014 901,762 0 2,071,286 -174,498 2,798,550
Profit/loss for the year - - - -113,624 -113,624
Other comprehensive income - - - - 0
Net changes, excluding transactionswith shareholders 0 0 0 -113,624 -113,624
Directed share issue 83,333 - 376,585 - 459,918
Other contributed capital, warrants - - 807 - 807
Other contributed capital, optioner - - - -145,200 -145,200
Dividend on ordinary shares - - - - 0
Dividend on preference shares - - - - 0
Total transactions withshareholders 83,333 0 377,392 -145,200 315,525
Equity, 31 Dec. 2015 985,095 0 2,448,678 -433,322 3,000,451

F INANC IAL REPORT ING
Annual Report 2016 D. Carnegie & Co AB (publ) 67
Statement of Cash Flows, Parent Company
Amounts in SEK thousand NOTE 2016 2015
Operating activities
Profit/loss before tax -145,367 -149,180
Adjustment for items not included in cash flow 27 4,013 11,282
Tax paid - -
Cash flow from operating activitiesbefore change in working capital -141,354 -137,898
Changes in operating receivables/liabilities -82,207 221,358
Total change in working capital -82,207 221,358
Cash flow from operating activities -223,561 83,460
Investment activities
Acquisition of subsidiaries - -
Acquisition of tangible non-current assets 11 -379 -314
Acquisition financial assets -11,008 -1,900
Sale of non-current assets -4,250 -
Cash flow from investing activities -15,637 -2,214
Financing activities
New share issue 460,725 998
Change in interest-bearing liabilities, new loans 1,000,000 1,000,000
Change in interest-bearing liabilities, amortized loans -1,290,088 -867,000
Dividend - -
Cash flow from investment activities 170,637 133,998
TOTAL CASH FLOW -68,561 215,244
Opening cash and cash equivalents 237,842 22,598
CLOSING CASH AND CASH EQUIVALENTS 16 169,281 237,842

NOTE 1 Accounting principles
F INANC IAL REPORT ING
68 D. Carnegie & Co AB (publ) Annual Report 2016
GENERAL INFORMATIOND. Carnegie & Co AB (publ), company reg. no. 556498-9449, is a
Swedish registered limited liability Company with its registered office in
Stockholm, Sweden. The parent company’s shares are registered on the
Nasdaq Stockholm MidCap list. These consolidated financial statements for
2015 are for the parent and all of its subsidiaries, jointly referred to as the
Group. The Board of Directors approved for publication the annual report
and consolidated accounts on 10 April 2017. The consolidated income sta-
tement and balance sheet and the parent company’s income statement and
balance sheet will be submitted to the Annual General Meeting for adoption
on 10 May 2017.
COMPLIANCE WITH STANDARDS AND LEGISLATIONThe Group’s consolidated financial statements have been prepared in
accordance with the International Financial Reporting Standards (IFRS) as
adopted by the International Accounting Standard Board (IASB) as well as
the interpretations issued by the International Financial Reporting Interpre-
tations Committee (IFRIC) as adopted within the EU, and the Annual
Accounts Act. In addition, the consolidated financial statements have been
prepared in accordance with Swedish law by applying the Swedish Financial
Reporting Board’s recommendation RFR 1 Supplementary Accounting
Rules for Groups. The parent company applies the same accounting poli-
cies as the Group except in the cases described under ”Parent Company
accounting policies”. The differences arising between the parent company
and the Group’s accounting principles are attributable to limitations on the
ability to apply IFRS in the parent company as a result of the Swedish
Annual Accounts Act, and in certain cases due to current tax rules.
BASIS OF PREPARATION OF THE CONSOLIDATEDAND PARENT COMPANY FINANCIAL STATEMENTSThe parent company’s functional currency is Swedish kronor (SEK), which
is also the reporting currency for the parent company and for the Group. All
amounts are rounded to the nearest thousand, unless stated otherwise.
Assets and liabilities are reported at historical cost, apart from certain finan-
cial assets, liabilities, and investment properties, which are reported at fair
value in the consolidated balance sheet. Financial assets and liabilities
reported at fair value consist of derivatives and securities reported at fair
value in the consolidated income statement. Investment properties are
reported at fair value in accordance with IAS 40. The Group’s accounting
policies have been applied consistently in reporting and consolidation of the
parent company and subsidiaries.
CHANGE IN ACCOUNTING PRINCIPLESThe changes in standards and interpretation statements which were applied
commencing 1 January 2016 are of very limited scope and have not had
any material impact on D. Carnegies & Co’s financial reports.
NEW AND CHANGED STANDARDS AND INTERPRETATIONS WHICH HAVE NOT YET ENTERED INTO FORCE The International Accounting Standards Board (IASB) has issued some
changes in standards which enter into force in 2017. None of these are
expected to have any material impact on D. Carnegies & Co’s financial
reports.
• IFRS 9 Financial Instruments. This standard will replace IAS 39 Financial
instruments: Recognition and Measurement. This contains rules for classifi-
cation and valuation of financial assets and liabilities, write-downs of finan-
cial instruments and reporting of hedging. The standard will be applied com-
mencing in 2018 and has been approved by the EU. D. Carnegies & Co
does not believe that the new standard will have a material impact on the
financial reports.
• IFRS 15 Revenue from Contracts with Customers. This standard addres-
ses the reporting of revenues from contracts and sales of non-financial
assets. It will replace IAS 11 Construction Contracts and IAS 18 Revenue,
and related interpretations. The standard will be applied commencing in
2018 and is approved by the EU. The standard does not cover reporting of
leasing agreements but may have some impact on the reporting of supple-
mental services that are provided to D. Carnegies & Co’s tenants.
• IFRS 16 Leases. This standard requires that lessees report assets and
liabilities related to all leasing agreements, with the exception of agre-
ements with a term of less than 12 months and/or which involve small
amounts. The reporting obligations for the lessor will, in all material res-
pects, remain unchanged. The standard replaces IAS 17 Leases, and rela-
ted interpretations. The standard will be applied commencing in 2019 but
has not yet been approved by the EU.
CLASSIFICATIONNon-current assets and non-current liabilities of the parent company and
the Group consist only of amounts expected to be recovered or settled later
than twelve months after the balance sheet date, while current assets and
current liabilities of the parent company and Group consist only of amounts
expected to be recovered or settled within twelve months from the balance
sheet date.
Input data for fair value measurement
Level 1 – Listed, unadjusted prices on active markets for identical assets
and liabilities that D. Carnegie & Co has access to on the valuation date.
Level 2 – inputs other than listed prices included in Level 1 that are directly
or indirectly observable for assets and liabilities.
Level 3 – Inputs at Level 3 are unobservable inputs for assets and liabilities.
PRINCIPLES OF CONSOLIDATION
Subsidiaries
Subsidiaries are companies over which the parent company D. Carnegie &
Co has a controlling influence. Subsidiaries are all entities (including special
purpose entities) over which the Group has the right to decide financial and
operating strategies in a way which is usually a result of a shareholding of
more than half of the voting rights. The existence and effect of potential
voting rights that can currently be exercised or converted are taken into
account when assessing whether the Group exercises a controlling influ-
ence over another company. Subsidiaries are consolidated as of the date
when the controlling influence is achieved and consolidation ends on the
date when the controlling influence terminates. Upon acquisition of a com-
pany, the Group assesses whether the acquisition concerns business com-
binations or assets (property). Business combinations entail acquisitions
relating to the purchase of one or several companies with properties inclu-
ding takeover of staff and internal processes. The Group applies the pur-
chase method when reporting business combinations where appropriate.
The surplus that comprises the difference between the transferred conside-
ration and the fair value of the Group’s share of identifiable acquired net
NOTES Amounts stated in SEK thousand unless specified otherwise.

F INANC IAL REPORT ING
Annual Report 2016 D. Carnegie & Co AB (publ) 69
assets is reported as goodwill. When acquisitions of subsidiaries involve the
acquisition of assets, the cost of the acquired assets and liabilities is based
on their fair values at the acquisition date. Accounting policies of subsidiaries
have been changed where necessary to ensure consistency with the policies
adopted by the Group.
Classification of acquisitions and goodwill
On acquisition of businesses, an analysis is made of how the acquisition is to
be reported based on the following criteria: The existence of employees and
the complexity of internal processes. Furthermore, the number of activities
and the existence of agreements with various degrees of complexity are
taken into consideration. If these criteria are present to a great extent, the
acquisition is classified as a business combination and if they are present to
a small extent as an asset acquisition .
In the case of business combinations, full deferred tax is payable on the tem-
porary differences between the fair value of properties and their tax residual
value. Goodwill mainly arises because deferred tax is calculated according to
standard accounting rules and not based on the value ascribed to deferred
tax between parties in transactions. For accounting purposes, deferred tax is
calculated on the difference between the fair value and the tax value. In con-
junction with transactions, deferred tax is commonly measured based on the
probability that it will become due and payable and a time factor of when any
payment will take place. Impairment testing of goodwill is performed annually.
When acquisitions of subsidiaries involve the acquisition of assets that are
not a business combination, the cost of the individual assets and liabilities is
based on their fair values at the acquisition date. Properties and financial
instruments are valued at their fair value. Other items have not been
revalued. Deferred tax is not recognized on the initial temporary differences.
Full deferred tax is reported on temporary differences arising after the acqui-
sition.
In 2016, all acquisitions were reported as acquisitions of assets.
Transactions eliminated on consolidation
Intra-group receivables and liabilities, income and expense, and unrealized
gains or losses arising from intragroup transactions are eliminated in full
when preparing the consolidated financial statements.
REVENUE
Rental income
Rental income from investment properties is reported in the income state-
ment based on the terms of the leases.
Other income
Other income consists of income from external property management
assignments, which is recognized in the period in which the assignment is
conducted, as well as insurance compensation.
Income from property sales
Income from property sales is usually recognized on the date of possession,
unless the risks and rewards have been transferred to the buyer at an earlier
time. Control of the asset may have been transferred at an earlier time than
the closing date and if so, the property sale is recognized as income on that
earlier date. When establishing the date of revenue recognition, considera-
tion is given to what has been agreed by the parties concerning risks and
benefits, and commitment in the management of the asset. In addition,
circumstances are taken into account that may affect the result of the trans-
action, which are outside the control of the seller and/or purchaser. The rea-
lized change in value of properties sold is based on the difference between
the fair value of the properties in the most recent financial statements and
the price for which the properties have been sold. Worked-up unrealized
changes in value from previous years are included in the properties’ fair
value and are therefore not visible in the realized change in value.
REPORTING OF SEGMENTSThe results are for the operating activities which includes properties acquired
and investments made during the year. An operating segment is a component
of the Group that engages in business activities from which it may generate
revenues and incur expenses, and for which discrete financial information is
available.
D. Carnegie & Co only conducts business within one segment, management
of residential property, where the business model is to own and manage
apartments in the “Million Homes Programmes.” Accounting is therefore done
within the same segment. D. Carnegie & Co focuses its investments on the
Greater Stockholm region and Mälardalen to ensure that there is a high
demand for their homes. The company looks for growth areas within reasona-
ble distance of Stockholm to take advantage of the growth in the capital. With
this focus on Stockholm and Mälardalen, the company’s business is not divi-
ded into regions relevant for monitoring purposes. The only operating seg-
ment is residential properties.
D. Carnegie & Co acquires new residential properties based solely on the
quality of the property, the opening value per m2, and the potential to reno-
vate the apartments in order to increase rental income.
From a monitoring perspective, the region in which the residential property is
located is not of interest, but that the material factors fall within the business
concept. Moreover, there are no appointed managers with responsibility for
the financial performance in different regions, nor is following the financial
performance in different regions of interest. Properties considered for invest-
ment must be built between 1965 and 1975 within the framework of the Mil-
lion Homes Programme. In addition, it must be possible to renovate one apart-
ment at a time, including replacement of plumbing apartment by apartment.
Monitoring the financial performance of properties located in different areas
is not of interest, because the performance does not depend on their location.
For the above-stated reasons, D. Carnegie & Co only has one operating seg-
ment which is interesting to follow up, and from a follow-up perspective
there is no breakdown which is meaningful.
OPERATING EXPENSES AND FINANCIALINCOME AND COSTS
Property expenses
Consists of expenses relating to operation, caretaking, letting, management
and maintenance of the property holdings.
Central administration
Consists of costs for Group functions and ownership of the Group’s subsidiaries.
Financial income and expenses
Financial income and expenses comprise interest income from bank depo-
sits and receivables, as well as interest on loans. Interest expenses and inte-
rest income are recognized using the effective interest method. The effective
interest rate equals the present value of expected future cash flows over the
expected life of the financial instrument and thus includes accrued amounts
of issuance costs and similar direct transaction costs to raise loans. Dividend
income is recognized when the right to receive payment has been establis-
hed. Realized and unrealized gains and losses on financial investments and
derivatives used in financial operations are reported as changes in value
under a separate heading in the income statement.

F INANC IAL REPORT ING
70 D. Carnegie & Co AB (publ) Annual Report 2016
INCOME FROM PROPERTY MANAGEMENTOperating income minus operating expenses for investment properties, cen-
tral administration and financial expenses, before changes in value and
taxes.
TAXESTax expenses for the period comprise both current tax due and deferred
income tax. Tax is recognized in the income statement, except where it refers
to items that are recognized in other comprehensive income or directly in
equity. In such cases the tax is also recognized in other comprehensive
income or equity respectively.
Current income tax
Current tax assets and tax liabilities for current and previous periods are
defined as the amount that is expected to be received back from or paid to
the Swedish Tax Agency. The tax rates and tax laws applied in calculating the
amount are those which have been adopted or announced at the balance
sheet date.
Deferred income tax
Deferred tax is recognized on the balance sheet date using the balance
sheet method based on temporary differences between reported and taxa-
ble values of assets and liabilities. The tax rates and tax laws applied in cal-
culating the amount are those which have been adopted or announced at
the balance sheet date. For acquisition of a business combination including
property, deferred tax is reported at the nominal amount under temporary dif-
ferences. In those cases where the acquisition of assets (property) is carried
out, no deferred tax is reported at the time of acquisition. Deferred tax assets
and deferred tax liabilities are offset if there is a legally enforceable right to
set off current tax assets against current tax liabilities and the deferred tax is
attributable to the same entity in the Group and the same taxation authority.
Current tax and deferred tax were calculated using the applicable tax rate of
22 percent.
FINANCIAL INSTRUMENTS
Financial instruments reported under assets in the balance sheet include
cash and cash equivalents, accounts receivable and other receivables, as
well as derivatives and securities. Liabilities include accounts payable, loans
and other liabilities, as well as derivatives. The company does not apply
hedge accounting. Financial instruments are initially recognized at cost, cor-
responding to the instrument’s fair value at the time of acquisition plus trans-
action costs, apart from financial assets, which are reported at fair value in
the income statement. Subsequent reporting depends on the category in
which they are classified, as stated below.
A financial asset or liability is reported in the balance sheet when the com-
pany becomes a party to the instrument’s contractual terms. Accounts recei-
vable are reported in the balance sheet when the invoice has been sent. A
liability is reported when the counterparty has performed and there is a con-
tractual obligation to pay, even if an invoice has not yet been received.
Accounts payable are recognized when invoices are received. A financial
asset and a financial liability may be offset and the net amount presented in
the balance sheet when, and only when, the company has a legally enforcea-
ble right to set off the recognized amounts and the company intends either
to settle on a net basis, or to realise the asset and settle the liability simulta-
neously. A financial asset is derecognized when the rights in the agreement
are realized, fall due or the company loses control over them. This also app-
lies to parts of financial assets. A financial liability is derecognized when the
duty in the contract is performed or otherwise extinguished. The same app-
lies to a part of a financial liability. At each reporting date, the company
assesses whether there is objective evidence that a financial asset or group
of financial assets is impaired. Derivatives are measured at fair value in the
consolidated financial statements with changes in value recognized in the
income statement. The following derivatives occur: interest rate swaps and
interest rate caps. The company does not apply hedge accounting .
The financial assets or liabilities that the Company has classified in the cate-
gory of financial assets or financial liabilities at fair value through profit or
loss are assets and liabilities which initially are classified as such or financial
assets and liabilities held for trading, including derivatives for which hedge
accounting is not applied.
Financial assets classified as investments held to maturity are financial
assets that are not derivatives with fixed or determinable payments and fixed
maturities that the Company has the intention and ability to hold to maturity.
Such investments are reported at amortized cost.
Financial assets classified in the category Loans and receivables are finan-
cial assets that do not constitute derivatives with fixed or determinable pay-
ments. Loans and receivables are measured at amortized cost.
Financial assets classified in the category Financial assets available for sale
are reported at fair value in other comprehensive income, except for impair-
ment losses, foreign exchange gains and losses. Investments in equity
instruments that do not have a quoted market price in an active market and
whose fair value can not be reliably measured are recognized at cost.
STATEMENT OF CASH FLOWSThe statement of cash flows is prepared using the indirect method.
CASH & CASH EQUIVALENTS AND BLOCKEDACCOUNTCash and cash equivalents consist of cash as well as demand deposits with
banks and similar institutions. Amounts in blocked accounts are funds that
serve as collateral for repayment of loans or financing of investments in real
estate and reported as other receivables .
NON-CURRENT RECEIVABLES AND OTHERRECEIVABLESNon-current receivables and other receivables are receivables held with no
intention of conducting trade in the receivable. If the expected holding period
is longer than one year, they are non-current receivables, and if it is shorter,
they are current receivables.
LOAN RECEIVABLES AND ACCOUNTS RECEIVABLELoan receivables and accounts receivable are recognized at the amounts
expected to be received after deductions for doubtful receivables, which are
assessed on a case-by-case basis. Accounts receivable are assessed for
impairment when there is a risk that all or part of the claim will not be recei-
ved. The estimated term of the accounts receivable is short and consequ-
ently the value is reported at the nominal amount without discounting.
Impairment of accounts receivable is recognized in operating expenses .
LIABILITIESLiabilities relate to loans and operating liabilities. Loans are recognized at
cost. Operating liabilities are recognized when the counterparty has delive-
red the goods or services, regardless of whether or not an invoice has been
received. Accounts payable have a short expected term and are valued at the
nominal value without discounting.

F INANC IAL REPORT ING
Annual Report 2016 D. Carnegie & Co AB (publ) 71
PROPERTY, PLANT AND EQUIPMENTProperty, plant and equipment in addition to investment properties are physi-
cal assets used in the Group’s business that have an expected useful life
exceeding one year. All property, plant and equipment is carried at cost, less
accumulated depreciation and impairment, if any. Depreciation and amortiza-
tion are linear over the estimated useful life and begin when the asset is
ready for use. When property, plant and equipment are reported, the residual
values of the asset is taken into account when the depreciable amount is set.
Property, plant and equipment consist of more than two essential elements
and their components have different useful lives, they are recognized sepa-
rately, known as component depreciation. Subsequent costs are added to
the carrying amount only when it is probable that future economic benefits
associated with the asset will benefit the Company. All other subsequent
expenditure is expensed in the period in which they arise. The critical factor
in determining when subsequent expenditure is to be added to the carrying
amount is whether the subsequent expenditure refers to the replacement of
identified components or parts thereof; if so, the subsequent expenditure is
capitalized. In cases in which a new component is created, it is recognized
separately.
Property, plant and equipment is derecognized upon disposal, or if it cannot
be expected to bring any economic benefits in the future, either through their
use or sale. Gains and losses are calculated as the difference between the
sale price and the carrying amount of the asset. Gains or losses are recogni-
zed in the statement of comprehensive income in the accounting period
when the asset is disposed of, as other expenses or other income. The resi-
dual value of the assets, as well as their useful life and depreciation method,
are examined at the end of each financial year and adjusted if required with
future effect. Standard costs for maintenance and repair are expenses as
they occur, but costs for significant renovation and improvements are recog-
nized in the balance sheet and depreciated over the remaining useful life of
the original asset.
Leases
Finance leases, where the Group essentially assumes all risks and benefits
associated with ownership of the leased object, are recognized in the State-
ment of financial position at the lower of the fair value of the leased property
or the present value of the minimum lease payments. Lease payments are
recognized as financing costs and repayment of the debt. Assets held under
a finance lease are written off over their expected useful lives. The Group
does not have any assets held under finance lease at this time. Leases in
which the lessor substantially retains all risks and rewards incident to
ownership are classified as operating leases. Lease payments are expensed
in profit and loss over the lease term on a straight-line basis. Consideration is
given initially to any incentives received when signing the lease.
Depreciation principles, machinery and equipment
Depreciation takes place on a linear basis over the estimated useful life of
the asset. Estimated useful lives:
- Machinery and equipment three to ten years. The residual value of the
asset and its useful life are assessed annually.
Investment properties
Investment properties are properties held with a view to obtaining rental
income or an increase in value or a combination of these purposes. Invest-
ment properties are initially recognized at cost, including expenses directly
attributable to the acquisition. Investment properties are recognized in the
consolidated balance sheet at fair value; see note 10. Each quarter, D. Car-
negie & Co assesses the value of 100 percent of the property portfolio;
20–30 percent of the properties are externally assessed and the rest
in-house.
Consequently, every property in the portfolio is valued externally over a rolling
twelve-month period. Both the external appraisers and D. Carnegie & Co use
a yield-based valuation model according to the cash flow model. The fair
value of the property before deduction for selling expenses is calculated
from the outcome in the cash flow method. Both realized and unrealized
changes in value are recognized in the income statement. Rental income and
income from property sales are recognized in accordance with the principles
described in the section on revenue recognition. Subsequent expenditure
that enhances value is capitalized. All other subsequent expenditure is
expensed in the period in which they arise. Repairs and maintenance are
expensed as incurred. In larger projects, interest expense is capitalized
during the construction period.
Reporting of borrowing costs
The Group does not activate interest in the acquisition value of the assets
with the exception of larger projects where the interest is activated. In other
cases, the borrowing costs are reported in the period in which they arise.
REPURCHASE OF OWN SHARESAcquisition of own shares is recognized as a deduction from equity. Payments
for divestments of these equity instruments are reported as an increase in
equity. Transaction expenses, if any, are reported directly against equity.
DIVIDENDSDividends are reported as a liability after the Annual General Meeting/
Extraordinary General Meeting of shareholders has approved the dividend.
Anticipated dividends are reported by the recipient as financial income.
EMPLOYEE COMPENSATIONPensions are classified as defined contribution or defined benefit plans.
D. Carnegie & Co’s pensions are considered to be defined contribution plans.
Obligations regarding payments to defined contribution pension plans are
recognized as an expense in the income statement when incurred.
PROVISIONSProvisions are recognized in the balance sheet when the Group has a pre-
sent legal or constructive obligation as a result of past events, and it is more
likely than not that an outflow of resources will be required to settle the obli-
gations and the amount can be estimated reliably. Where the effect of when
in time payment is made is significant, provisions are calculated through dis-
counting the expected future cash flow at an interest rate before tax that
reflects current market assessments of the time value of money and, if appli-
cable, the risks associated with the debt.
FOREIGN CURRENCYTransactions in foreign currency are translated into Swedish kronor at the
exchange rate at the time of the transaction. Monetary assets and liabilities
are translated at the closing day rate.
PARENT COMPANY ACCOUNTING PRINCIPLESThe parent company has prepared its annual accounts according to the
Annual Accounts Act (1995:1554) and the Swedish Financial Reporting
Board recommendation RFR 2 Reporting for Legal Entities. The Swedish
Financial Reporting Board’s statements for listed companies are also app-
lied. RFR 2 requires the parent company, as a legal entity, to prepare its
annual financial statements in compliance with all IFRS and IFRIC interpre-
tations adopted by the EU, to the extent possible within the framework of the
Swedish Annual Accounts Act and taking into account the relationship
between accounting and taxation. The recommendation states which excep-
tions from and additions to IFRS shall be observed. The following accounting
policies for the parent company were applied consistently in all periods
shown in the parent company’s financial reports.

NOTE 2 Distribution of income
NOTE 3 Personnel and board of directors
F INANC IAL REPORT ING
72 D. Carnegie & Co AB (publ) Annual Report 2016
Percentage Percentage Average number of employees 2016 women, % 2016 women, %
Parent company 15 13 10 20
Subsidiaries 175 37 147 39
Group total 190 35 157 38
All are employed in Sweden
Gender distribution in executive management
Average number2016 Percentage
women, %2016 Percentage
women, %
Parent company 8 13 7 14
Board of Directors 6 17 6 17
Group total 9 22 7 14
Board of Directors 6 17 6 17
Property, plant and equipment
Machinery and equipment in the parent company are recognized at cost less
accumulated depreciation and any impairment in the same manner as the
Group but increased by any revaluations.
Group contributions, dividends and shareholder contributions for
legal entities
Group contributions from subsidiaries are recognized according to the same
policies as dividends in the parent company. Consequently, Group contribu-
tions
Property, plant and equipment
Machinery and equipment in the parent company are recognized at cost less
accumulated depreciation and any impairment in the same manner as the
Group but increased by any revaluations.
Group contributions, dividends and shareholder contributions for
legal entities
Group contributions from subsidiaries are recognized according to the same
policies as dividends in the parent company. Consequently, Group contribu-
tions are recognized as financial income. Dividends are reported as a liability
after the Annual General Meeting approves the dividend. Anticipated divi-
dends are reported by the recipient as financial income. Shareholder contri-
butions are recognized directly in equity by the recipient and capitalized as
shares and participations by the issuer, to the extent no impairment loss is
identified.Rental income Group refers to operating leases that have no end date, but
continue indefinitely.
2016 2015
Group
Rental income 1,271,380 1,201,591
Insurance compensation 1,038 1,006
Other operating income 12,051 18,218
Total 1,284,469 1,220,815
Parent company
Management feesubsidiaries 22,836 10,284
Other income - -
Total 22,836 10,284
Contingent liabilities
A contingent liability is recognized when a possible obligation arises from
past events whose existence will be confirmed only by the occurrence or
non-occurrence of one or more uncertain future events, or when there is an
obligation which is not recognized as a liability or provision because it is not
probable that an outflow of resources will be required to settle the obligation
.

F INANC IAL REPORT ING
Annual Report 2016 D. Carnegie & Co AB (publ) 73
Group Group Parent ParentSalaries, wages and benefits 2016 2015 2016 2015
Chairman of the Board, James Seppala (Nov - Dec) 0 - 0 -
Chairman of the Board, Knut Pousette (Jan - Oct) 317 266 317 266
Other Directors (5 people)
Ronald Bengtsson Jan - April 67 226 67 226
Mats Höglund 200 203 200 203
Bjarne Eggesbo - 64 - 64
Knut Pousette Nov - Dec 42 - 42
Ranny Davidoff Jan - Oct 125 196 125 196
Eva Redhe 200 132 200 132
Terje Nesbakken Jan - Oct 158 132 158 132
Svein Erik Lilleland Nov - Dec 42 - 42 -
Chief Executive Officer
Base salary 2,023 2,035 2,023 2,035
Variable remuneration 1,270 600 1,270 600
Benefits 76 - 76 -
Other senior management, 9 individuals
Base salary 6,464 9,461 5,674 4,950
Variable remuneration 5,080 1,750 5,080 1,750
Benefits 179 188 112 80
Other employees
Base salary 64,784 53,592 5,194 1,192
Variable remuneration 0 1,182 0 50
Benefits 679 548 226 8
Total 81,706 70,575 20,806 11,884
Contractual pension costs
Chief Executive Officer 714 590 714 590
Other senior executives 1,532 2,169 1,532 1,153
Other employees 4,778 4,644 513 152
Total 7,024 7,403 2,759 1,895
Statutory social security contributions, incl. payroll tax
Chief Executive Officer 971 971 971 971
Other senior executives 3,761 3,761 2,335 2,335
Total 4,732 4,732 3,306 3,306
The Parent Company has 8 (7) senior executives (incl. the CEO), of
whom one is a woman (1). Ulf Nilsson is CEO. Per-Axel Sundström is CFO
and Jenny Wärmé is Legal Counsel. Tommy Jansson is Head of Property
Management (Aug-Dec), Jonas Andersson is Chief Investment Officer &
Head of Financing, Fredrik Brunnberg is Chief Business Development Offi-
cer, Christian Tapper is Head of Property Development (Nov-Dec) and Björn
Sundberg is Head of Investor Relations and Head of Communications. Other
senior executives in the group include the HR manager, Marie Persson.
At the end of 2016, the Board of Directors of the parent company had five
members (6) of whom one is a woman (-). James Seppala is Chairman of
the Board (Oct-Nov). The directors include Knut Pousette, Svein Erik Lille-
land (Oct-Dec), Eva Redhe and Mats Höglund. An extraordinary general
meeting on 14 October 2016 has resolved to replace the board members
Ranny Davidoff and Terje Nesbakken with James Seppala and Svein Erik Lil-
leland and to replace Knut Pousette with James Seppala as chairman of the
board.
Remuneration
Principles for remuneration to and benefits for the CEO and executive mana-
gement are decided upon by the Annual General Meeting in accordance
with the company’s guidelines for remuneration to senior executives. The
Board of Directors proposes and decides on remuneration and benefits for
other senior executives. A fee is paid to the Chairman of the Board and
directors according to a decision reached at the Annual General Meeting.
Senior executives shall receive competitive wages in line with market rates,
as well as other terms of employment that are commensurate with their
responsibility, authority, expertise and experience. In addition to fixed salary,
the management may also receive variable remuneration, which for the CEO
shall be based on the Group’s earnings per share and for other senior execu-
tives on improvements in each person’s area of responsibility in terms of ear-
nings per share, sales, operating earnings and capital turnover rate, as well
as the outcome of individual activity plans.
NOTE 3 Cont. Personnel and board of directors

NOTE 4 Profit/loss by property segment and region
NOTE 5 Fees and disbursements to auditors
F INANC IAL REPORT ING
74 D. Carnegie & Co AB (publ) Annual Report 2016
Group Parent
2016 2015 2016 2015
Ernst & Young AB
Audit services 3,810 3,336 3,810 5,806
Tax consulting 16 - 16 -
Other services - 356 - 356
Total 3,826 3,692 3,826 6,162
KPMG
Audit services 125 - - -
Tax consulting - - - -
Other services - - - -
Total 125 0 0 0
Other services, other accounting firm 0 -19 - -
Total 3,951 3,673 3,826 6,162
The result shows current operations, including properties acquired and
investments made during the year. D. Carnegie & Co reports only one
operating segment, management of residential properties.
Variable salary shall be equal to 50 percent of the fixed annual salary for the
CEO and a maximum of between 30 and 70 percent of the fixed annual
salary for other senior executives. The notice of termination period under
employment contracts between the company and senior management is six
months and severance compensation equals 18 times the monthly salary
(base salary) for the CEO and 12 times the monthly salary (base salary) for
other senior management. The earliest time for receiving pension benefits is
62 years of age. The CEO is covered by a defined-contribution plan under
which the contractual premium provision may not exceed 35 percent of base
salary. Other senior executives resident in Sweden are covered by the ITP
plan, beyond which some premium-based supplement may be paid. Each
year the Board shall consider whether or not a share-based incentive pro-
gram should be proposed to the AGM. Share-related incentive programs that
are not resolved by the AGM are not permitted. If a director is employed by
the Company, remuneration to such directors is paid according to these gui-
delines, for which reason separate remuneration for the duties as director
shall not be paid. If a director carries out duties for the Company that are not
board duties, compensation will be paid that is market-based and with consi-
deration taken to the nature and performance of the assignment. The gui-
delines apply to agreements entered into after a resolution by the 2015
Annual General Meeting, and in the event that changes are made to existing
agreements after this point in time. The Board will be entitled to diverge from
the guidelines if there are particular reasons to do so in an individual case,
provided that this is reported and subsequently justified.
Warrants program
Warrants program D. Carnegie & Co has three warrants programs carrying
an entitlement to subscribe for class B shares.
Warrants program no. one, which was issued in 2014, covers 1,473,000 war-
rants, corresponding to 1.9 per cent of the number of outstanding ordinary
shares. Each warrant entitles the holder to subscribe for one new class B
ordinary share in D. Carnegie & Co. The warrants may be exercised to sub-
scribe for shares commencing 1 January 2017 up to and including 30 June
2017. The subscription price for class B ordinary shares pursuant to the war-
rants is SEK 48.50 kronor. The warrants program is directed at the CEO and
CFO of D. Carnegie & Co AB, the CEO of Bosystem Nordic AB, and all staff
who were employed at Slottsfabriken Egendomsförvaltning AB at the time
D. Carnegie & Co was listed on NASDAQ OMX First North (9 April 2014).
Market-based pricing was applied in conjunction with the warrants offering.
Warrants program no. two, which was issued in 2015 and covers 998,200
warrants, corresponding to 1.3 per cent of the number of outstanding shares.
The warrants carry an entitlement to subscribe for new class B ordinary sha-
res in D. Carnegie & Co. The warrants may be exercised to subscribe for
shares commencing 21 May 2018 up to and including 31 August 2018. The
subscription price for class B ordinary shares pursuant to the warrants is
SEK 72.84 kronor. The warrants program is directed at all staff who were
permanently employed by the D. Carnegie & Co Group on 12 May 2015.
Market-based pricing was applied in conjunction with the warrants offering.
Warrants program no. three was issued in 2016 and covers 807,000 war-
rants, corresponding to 1.0 per cent of the number of outstanding shares.
The warrants carry an entitlement to subscribe for new class B ordinary sha-
res in D. Carnegie & Co. The warrants may be exercised to subscribe for
shares commencing 21 May 2019 up to and including 30 August 2019. The
subscription price for class B ordinary shares pursuant to the warrants is
SEK 113.50 kronor. The warrants program is directed at all staff who were
permanently employed by the D. Carnegie & Co Group on 12 May 2016.
Marketbased pricing was applied in conjunction with the warrants offering.
If all of the warrants are exercised in all three of the warrants programs
(2014, 2015 and 2016), the number of ordinary class B shares would
increase by 3,287,200, which corresponds to 4.2 per cent of the number of
outstanding ordinary shares.
After completion of its mandatory tender offer, Vega Holdco S.à.r.l. owns
1,460,000 warrants from warrants program no. one, 756,200 warrants from
warrants program no. two and 600,000 warrants from warrants program no.
three.
The market price of the stock option programs have been carried out by an
independent party on the basis of the Black-Scholes method, the essential
parameters taken into account in the valuations are D. Carnegie & Co’s quo-
ted share price, volatility, the warrants’ exercise price and the risk free rate.
Defined contribution plans
The Group’s employees are covered by defined contribution pension plans
that are paid for in full by the company. Payment is made on current account
according to established rules.

NOTE 6 Operating expenses by type
NOTE 7 Net financial items
F INANC IAL REPORT ING
Annual Report 2016 D. Carnegie & Co AB (publ) 75
Group Parent
2016 2015 2016 2015
Operating costs
Electricity, heating -210,559 -198,699 - -
Management and caretaking -81,791 -85,329 -67 -
Personnel costs -84,332 -67,304 -13,525 -3,863
Other property expenses -145,881 -144,831 -6,895 -2,464
Total -522,563 -496,163 -20,487 -6,327
Central administration
Personnel costs -42,404 -37,274 -21,896 -13,272
Advisory services -6,492 -4,797 -6,192 -4,444
Management and caretaking -7,555 - - -
Audit expenses -3,810 -3,673 -3,810 -6,162
Other expenses -41,412 -51,035 -34,031 -29,937
Total -101,673 -96,779 -65,929 -53,815
Financial income* 2016 2015
Group
Income from other investments - -
Other interest income 16,068 16,970
Total 16,068 16,970
Parent company
Income from other investments - -
Interest income, Group companies 26,743 13,656
Other interest income 6,999 4,311
Total 33,742 17,967
Financial expenses
Group
Other interest expenses** -198,134 -213,010
Interest paid, derivatives -58,666 -47,619
Other financial expenses** -18,677 -27,443
Total -275,477 -288,072
Parent company
Other interest expenses -94,263 -86,501
Other financial expenses -11,913 -21,251
Interest expenses, Group companies -30,754 -9,537
Total -136,930 -117,289
*Financial income relate to fincial posts valued at amortized cost.
**Relate primarily to interest expenses on loans and bonds.
All expenses, except related to derivatives related to financial assets measu-
red at amortized cost.
Derivatives are classified as financial assets at fair value through profit or
loss, in the category held for trading.
Stocks and and share are reported at cost in the category Financial assets
available for sale.
Changes in value financial instru-ments 2016 2015
Group
Changes in value, stocks and shares - -481
Changes in value, derivatives - swaps -84,207 -939
Changes in value, derivatives - caps -3,391 -
Changes in value short-term invest-ments -77,591 -9,579
Total -165,189 -10,999
Parent company
Changes in value, stocks and shares - -
Changes in value, derivatives - swaps - -
Changes in value, derivatives - caps -3,391 -
Changes in value short-term invest-ments -74,385 -
Total -77,776 0

NOTE 8 Taxes
F INANC IAL REPORT ING
76 D. Carnegie & Co AB (publ) Annual Report 2016
CONSOLIDATED INCOME STATEMENT
2016 2015
Tax calculation, Group Current taxBasis
Deferred taxBasis
Current taxBasis
Deferred taxBasis
Profit/loss before tax 2,072,484 - 1,421,524 -
Deductions for tax purposes - - - -
depreciation -96,719 -96,302 -93,477 -93,477
investments -870,517 -870,517 -447,543 -447,543
Non-taxable changes in value, properties -1,938,289 -1,938,289 -1,306,792 -1,306,792
Non-taxable changes in value, derivatives 87,598 87,598 4,912 4,912
Non-taxable changes in value, securities 71,890 71,890 - -
Acquired temporary differences - - -359,054 -
Tax effect, property and company sales 13,101 338,304 287,091 120,220
Non-deductible expenses 5,240 - 62,612 -
Non-taxable revenues -113 - -6,953 -
Other adjustments for tax purposes 41,767 4,893 20,328 14,637
Total operating profit/loss -613,558 -2,402,423 -417,352 -1,708,043
Loss carryforward, applied -591,925 - -182,329 -
New deficits 1,214,124 614,514 599,681 417,352
Adjustment for loss carryforwards, company divestments - - - -
Adjustments for acquired loss carryforwards - - - -
Adjustments for effects from divested properties - - - -
Adjustment for acquired temporary differences -4,750 - - -
Total taxable profit/loss 3,891 -1,787,909 0 -1,290,691
Tax on profit/loss, 22% -856 -393,340 - -283,952
Adjustment relating to prior years -24 1,563 -
Current tax/Deferred tax -880 -393,340 1,563 -283,952
CONSOLIDATED BALANCE SHEET
Deferred tax asset
Opening amount - 148,135 - 55,094
Acquired deductions for losses carried forward - -21 - 2,930
Change in value, derivatives - 19,272 - -1,027
Change during the year - 135,193 - 91,138
Deferred tax assets at year-end 0 302,579 0 148,135
Deferred tax liability, temporary differences,properties
Opening amount - -851,001 - -513,099
Change during the year - -496,969 - -337,902
Temporary differences at year-end 0 -1,347,970 0 -851,001
Acquired temporary differences, properties
Opening amount - -585,325 - -542,727
Change for the year through acquisitions and sales - -66,797 - -42,598
Amount at year-end 0 -652,123 0 -585,325
Temporary differences, derivatives and financial assets
Opening amount - 1,283 - -5,121
Change during the year - 15,983 - 6,404
Temporary differences at year-end 0 17,266 0 1,283
Total deferred tax liability
Opening amount - -1,435,043 - -1,060,947
Change during the year - -547,783 - -374,096
Total deferred tax assets at year-end 0 -1,982,826 0 -1,435,043
Effective tax rate is 15% (24)

NOTE 9 Goodwill in business
F INANC IAL REPORT ING
Annual Report 2016 D. Carnegie & Co AB (publ) 77
PARENT COMPANY – INCOME STATEMENT
2016 2015
Tax calculation for parent company
BasisCurrent tax
BasisDeferred tax
BasisCurrent tax
BasisDeferred tax
Profit/loss before tax -145,366 - -149,180 -
Deductible expenses - - - -
depreciation - - - -
investments - - - -
Non-taxable changes in value, properties - - - -
Non-taxable changes in value, derivatives 3,391 -3,391 - -
Non-taxable changes in value, shares 68,685 -68,685 - -
Non-deductible expenses 1,086 - 358 -
Other adjustments for tax purposes -4 - -2 -
Total operating profit/loss -72,208 -72,076 -148,824 -
Loss carryforward, applied 249,783 - 100,957 -
New deficits -177,575 -72,208 47,867 -148,824
Adjustment for acquired temporary differences - - - -
Total taxable profit/loss 0 -144,284 0 -148,824
Including 22% deferred taxes - 31,743 - 32,741
Deferred tax recognized in equity - - -
Current tax/Deferred tax 0 31,743 0 32,741
Effective tax rate is 22% (35)
PARENT COMPANY - BALANCE SHEET
Deferred tax asset
Opening amount - 54,952 - 22,211
Change during the year - 31,743 - 32,741
Deferred tax asset at year-end 0 86,695 0 54,952
On July 4, 2014, D. Carnegie acquired Hyresbostäder i Sverige II AB.
D. Carnegie & Co owns 100% of the share capital and the voting capital in
Hyresbostäder i Sverige II AB. in conjunction with the acquisition, and as a
part of the purchase price, a directed issue of 26 million shares was made to
the seller. The issue price of the shares was set at SEK 46.20 per share and
based on the average price for the three trading days immediately preceding
the acquisition on July 4, 2014. The company was included in the group as
of July 4, 2014.
the acquisition has been reported as a business combination. The properties
in financial instruments are valued at the fair value. The difference between
the actual and the book values for other assets and liabilities is not conside-
red to be material.
Goodwill mainly arises because deferred tax is calculated according to stan-
dard accounting rules and not based on the value ascribed to deferred tax
between parties in transactions. For accounting purposes, deferred tax is cal-
culated at a nominal tax rate of 22% on the difference between the fair value
and the tax value. In conjunction with transactions, deferred tax is normally
negotiated based on the probability that it will become due and payable and
a time factor for when any payment will be made. Acquisition-related fees
in the amount of SEK -15.3 million were incurred in conjunction with the
acquisition.
Acquired net assets, SEK thousand 2014
Investment properties 6,601,732
Deferred tax claim 11,207
Other assets 456,506
Interest-bearing liabilities -2,866,694
Derivatives liabilities -50,939
Other liabilities -148,023
Reported deferred tax liability at closing -296,611
Additional deferred tax liability according to preliminary Acquisition analysis -666,954
Acquired net assets 3,040,224
Purchase price paid in cash -1,317,421
Cash and cash equivalents in acquired subsidiaries 135,902
Changes in the group’s cash and cash equivalents upon acquisition -1,181,519
Calculation of goodwill, SEK thousand
Purchase price:
Cash payment 1,317,421
Shareissue in conjunction with the acquisition 1,201,200
Vendor note 200,000
Convertible debentures in the acquisition 1,020,000
Purchase price for HBS II shares, 100% of the shares 3,738,621
Acquired net assets -3,040,224
Goodwill 698,397

NOTE 10 Investment properties valuation of property holdings
F INANC IAL REPORT ING
78 D. Carnegie & Co AB (publ) Annual Report 2016
VALUATION METHODD. Carnegie & Co uses yield valuation according to the cash flow model for
external valuations. The same valuation method has been used for all of
D. Carnegie & Co’s properties except for building rights; see Building rights
below for the valuation methods used for them. The fair value of the property
before deductions for sales expenses is calculated from the outcome in the
cash flow method.
VALUATION MODEL+ Rent payments
– Operating payments
= Net operating income
– Deduction for investments
= Property’s cash flow
Sensitivity analysis
A property valuation is an estimate of the value that an investor is willing to
pay for the property at a given time. The valuation is made on the basis of
generally accepted models and certain assumptions regarding various para-
meters. The fair value of a property can only be reliably established in a tran-
saction between two independent parties. An uncertainty range is stated in
the property valuation and is between +/– 5 –10 percent in a normal mar-
ket. A changed property valuation of +/– 5 percent affects D. Carnegie &
Co’s property value by +/– SEK 850 million.
Fair value calculation
• The cash flow of the property is discounted to present-day value each year
using the cost of capital/discount rate.
• The property’s residual value is assessed by perpetual capitalization
whereupon the direct yield is used. The residual value is then discounted to
current-day value with the cost of capital.
Group 2016 2015
Opening fair value Jan. 1 13,826,439 11,520,820
Cost during the year, acquired properties 780,147 955,000
Investments in properties 1,039,204 490,703
Reclassifications - -
Sales revenues, sold properties -586,157 -446,876
Changes in value 1,938,290 1,306,792
Closing fair value Dec. 31 16,997,923 13,826,439
Tax assessment
Group 2016 2015
Tax assessment, buildings 7,534,576 6,756,196
Tax assessment, land 2,910,992 2,404,404
Total tax assessment 10,445,568 9,160,600
PROPERTY HOLDINGS AND VALUATION, FAIR VALUE, AS OF DECEMBER 31, 2015
Investment properties are accounted for using the fair value method; all such
properties were valued using valuation hierarchy 3. No properties were transfer-
red between different valuation hierarchies. D. Carnegie & Co carries out an
external appraisal each quarter of the entire property portfolio. D. Carnegie &
Co’s entire property portfolio has been appraised as of 31 December 2016.
The valuations used a yield-based cash-flow model (forecasts based on future
cash flows). The yield level was determined based on the unique risk of the pro-
perties, as well as transactions carried out in each city using comparative mar-
ket analysis. Changes during the period in the unobservable inputs applied in
the valuations are analyzed at each year-end by management in relation to
information available in-house, completed or planned transactions and informa-
tion from the external appraisers. All external valuations were carried out accor-
Summary
Valuation date 31 December 2016
Fair value SEK 16,998 million
Calculation period five years
Yield,assessment of residual value Between 3.8 and 8.0 percent
Cost of capital/discount rate Between 5.8 and 10.2 percent
Long-term vacancy On average 1.0 percent, (economic vacancy)
Inflation 2.0 percent (Riksbank inflation target)
In conjunction with the preparation of the acquisition calculations and the
classification of the acquisition as a business combination, an adjustment of
the deferred tax liability in the balance sheet has been carried out. Goodwill
mainly arises because deferred tax is calculated according to standard
accounting rules and not based on the value ascribed to deferred tax
between parties in transactions. For accounting purposes, deferred tax is cal-
culated on the difference between the fair value and the tax value.
Goodwill is reviewed for impairment regularly by comparing recognized
goodwill with the remaining temporary differences from the acquisition.
2016 2015
Opening balance 685,728 698,397
Business combinations - 2,919
Write-down of goodwill for the year -584 -584
Write-down related to changes in values and properties - -2,385
Write-down related to sold properties -54,979 -12,619
Closing balance 630,165 685,728
ding to international valuation standards. The external valuations were carried
out by Savills.
Impairment of goodwill occurs when these temporary differences no longer
exist, mainly because the properties were sold or the carrying amount is less
than the acquisition value .

F INANC IAL REPORT ING
Annual Report 2016 D. Carnegie & Co AB (publ) 79
• The value of any building rights and undeveloped land is added to the
present-day value.
• The normal calculation period is five years.
• Inflation has been assessed at two percent (Riksbank inflation target).
BASIS FOR VALUATIONEach assumption about a property is individually assessed based on the
material available about the property, as well as the market information and
experience-based assessments of the external appraisers. The valuations
considered the highest and best use of the properties. The external valua-
tions are carried out according to RICS’s and IVSC’s recommendations in
order to result in the fair value according to the internationally accepted defi-
nition published by these organisations.
Rent payments
The relevant leases, as well as known lettings and tenants vacating premises,
form the basis for assessment of the property’s rent payments. The external
appraisers, in collaboration with D. Carnegie & Co’s managers, have carried out
an individual assessment of the market rent for vacant premises, as well as
leased units at the end of the lease term. The external appraisers also assess
the long-term vacancy rate of each property. Operating payments Operating
payments consist of payments for the normal operation of the property.
Operating payments
Operating payments consist of payments for the normal operation of the pro-
perty, including property taxes, repairs and maintenance, ground rent and pro-
perty administration. The assessment of operating payments is based on the
budgets and outcomes of the properties over the years that D. Carnegie & Co
has owned them, as well as the external appraisers’ knowledge of compara-
ble properties. The maintenance level of the properties is assessed based on
their current state, ongoing and budgeted maintenance measures and
assessment by the external appraisers of future maintenance requirements.
Investment needs
The external appraisers assess the investment needs of the property based
on the condition of the property. Properties with high vacancy rates often
have a higher investment needs.
Yield requirement and cost of capital
The direct yield requirement of the properties has been assessed on the basis
of the unique risk of each property and can be divided into two components: a
general market risk and a specific property risk. Market risk is associated with
the general economic trends and is affected by factors such as the priority
given by investors to different asset classes and financing opportunities. Spe-
cific property risk is affected by the location of the properties, type of property,
efficient use of space, standard, quality of installations, site leasehold, type of
tenant and nature of the lease. From a theoretical standpoint, the cost of capi-
tal is assigned by adding inflation expectations to a risk-free real interest rate
and a risk factor. The cost of capital is assessed for each property. The return
requirement on units included in the valuation varies from 3.76 per cent to
8.00 per cent, with an average of 4.31 per cent, to be compared with 4.84 per
cent at the end of 2015. The average cost of capital for the period was 6.40
per cent (6.94).
Residual value
Residual value consists of net operating income during the remaining eco-
nomic lifetime, based on the year after the last calculation year. Residual
value is calculated for each property by perpetual capitalization of the esti-
mated market-based net operating income and the estimated market yield
requirement for the respective property. The yield requirement consists of
the risk-free interest rate and each property’s unique risk. The unique risk of
the properties is assessed based on the external appraiser’s market databa-
ses, experience and transactions carried out using comparative market ana-
lysis in the respective market. The cost of capital/discount rate is used to
discount the residual value of the properties to present value.
Calculation periods
Calculation periods are primarily five years. Exceptions are properties with
major leases where the remaining term exceeds five years. In these cases, a
calculation period corresponding to the remaining term of the lease plus at
least one year has been chosen.
Building rights and building sites
Properties with available building rights and building sites are valued based on
a comparative market analysis, or present value based on the estimated fair
value upon development of the building rights and building sites. All values of
building rights and lots have been assessed by the external appraisers. The
total potential building rights of value are estimated at 232,300 m² GFA (gross
area). On 31 December 2016, the potential building rights were valued at a
fair value of SEK 311 million. The valuations of the building rights were
unchanged during 2016. Only potential building rights that have progressed
far enough in the planning process have been assessed a fair value.
Property inspections
All properties are inspected by external appraisers within a three-year period.
The external appraisers make new inspections where major renovations have
been carried out, tenants have moved in, or other circumstances have occur-
red that may affect the value.
INTERNAL PROPERTY VALUATIONSAll properties are valued extarnally each quarter, hence no internal valuations are
carried out.
CHANGES IN VALUEThe fair value for D. Carnegie & Co’s properties on 31 December 2016 was
SEK 16,998 million (13,826). Changes in value for 2016 totalled SEK
1,938 million (1,307). As of 31 December 2016, D. Carnegie & Co’s pro-
perty portfolio was valued at an average return requirement of 4.31 percent
(4.84).
TAX RESIDUAL VALUEThe tax residual value of the properties totaled SEK 4,645 (4,637) million on
31 December 2016.

NOTE 11 Machinery and equipment
NOTE 13 Short-term investments
NOTE 14 Other receivables
NOTE 12 Accounts
F INANC IAL REPORT ING
80 D. Carnegie & Co AB (publ) Annual Report 2016
2016 2015
Group
Investments in listed shares 143,359 101,048
Investments in unlisted shares 39,100 77,197
Total 182,459 178,245
2016 2015
Parent company
Investments in listed shares 59,170 26,670
Investments in unlisted shares 39,100 77,735
Total 98,270 104,405
D. Carnegie & Co evaluates its accounts receivable each quarter and makes
individual assessments of all accounts receivable exceeding 30 days. Provi-
sions are made for doubtful receivables and claims are recognized as bad
debts in the event of bankruptcy or other bad debts. All new tenants undergo
a credit check. Accounts receivable in the Group are recognized after taking
into account bad debts during the year, which totalled SEK -9 million (-11)
including a deduction for recovered bad debts of SEK 6 million (6), corres-
ponding to 0.5 percent (0.5) of sales. Actual bad debts amounted to SEK 6
million (6). The parent company has no bad debts.
Days 2016 2015
0-29 2,535 2,619
30-89 1,113 1,568
90- 11,051 12,991
Doubtful receivables -8,907 -10,768
Total 5,792 6,410
Doubtful receivables 2016 2015
Doubtful receivables, opening balance -10,768 -9,555
Subsidiaries acquired - -1,261
Divested subsidiaries 316
Provision for anticipatedbad debts 2 -11
Recovery of bad debts 5,925 5,974
Established bad debts -4,382 -5,915
Doubtful receivables, closing balance -8,907 -10,768
2016 2015
0-29 21 -
30-59 23 -
Total 44 0
ACCOUNTS RECEIVABLE GROUP
ACCOUNTS RECEIVABLEPARENT COMPANY
2016 2015
Group
Settlement taxes and fees 3,703 3,198
Short-term note - 165,000
Pre-paid expenses to suppliers 11,249 -
Insurance claims 8,132 -
Claims acquired companies 5,502 -
Claims divested companies 2,800 -
Claims, value-added tax 2,604 -
Other current receivables 5,386 29,444
Total 39,376 197,642
2016 2015
Parent company
Settlement taxes and fees 1,064 264
Short-term note 15,000
Other current receivables 3,860 3,783
Total 4,663 19,047
2016 2015
Group Parent Group Parent
Accumulated cost
Opening balance 17,303 1,838 25,076 1,524
Acquisitions 3,333 380 2,103 314
Acquisition of subsidiaries 50 - - -
Reclassifications - - - -
Disposals -953 -750 -9,876 -
Total 19,733 1,468 17,303 1,838
Accumulated depreciation/amortization
Opening balance -12,642 - -20,900 -
Impairment losses for the year -1,222 -37 -1,159 -
Acquisition of subsidiaries -50 - - -
Reclassifications - - - -
Disposals 153 - 9,417 -
Total -13,761 -37 -12,642 0
Carrying amount at year-end 5,972 1,431 4,661 1,838

Parent company 2016 2015
Non-current interest-bearing liabilities 2,000,000 1,722,787
Prepaid loan fees -19,049 -
Total 1,980,951 1,722,787
Current liabilities
Current interest-bearing liabilities - 406,750
Total 0 406,750
NOTE 16 Cash and cash equivalents
NOTE 17 Equity
NOTE 18 Earnings per shareNOTE 15 Prepaid expenses and accrued income
NOTE 20 Financial instruments and financial risks
NOTE 19 Interest-bearing liabilities
F INANC IAL REPORT ING
Annual Report 2016 D. Carnegie & Co AB (publ) 81
2016 2015
Group
Cash and bank balances 679,370 478,524
Total 679,370 478,524
Parent company
Cash and bank balances 169,281 237,842
Total 169,281 237,842
Group 2016 2015
Non-current interest-bearing liabilities 8,802,028 7,652,360
Prepaid loan fees -69,010 -65,028
Total 8,733,018 7,587,332
Current liabilities
Current interest-bearing liabilities 1,257,659 1,650,286
Total 1,257,659 1,650,286
2016 2015
Profit/loss for the year attributable toparent company shareholders 1,678,264 1,139,135
Number of outstanding class A shares 5,370 5,370
Number of outstanding class B shares 71,939 65,399
Number of outstanding ordinary shares 77,309 70,769
Number of outstanding preferenceshares - -
Earnings per share (SEK), basic 22.20 16.10
Earnings per share (SEK), basic 21.93 13.50
2016 2015
Group
Accrued property expenses 6,153 2,792
Prepaid insurance 11,667 7,789
Prepaid site leasehold rent 1,932 4,048
Accrued financial income - 12,826
Other accrued income 1,159 1,358
Other prepaid expenses 3,242 1,024
Total 24,153 29,837
2016 2015
Parent company
Accrued property expenses 351 196
Accrued financial income - 371
Other prepaid expenses 122 167
Total 473 734
Earnings per ordinary share have been calculated for 2016 based on net
profit for the year attributable to shareholders of the parent company and
amount to SEK 1,678 million (1,139). All earnings are divided into 77.3 mil-
lion ordinary shares. The company redeemed all outstanding preference sha-
res in 2014.
The number of shares after dilution is calculated as 76,524,425, where war-
rant 1 contributes 662,328 shares, warrant 2 contributes 366,487 shares
and warrat 3 contributes 0 shares.
D. Carnegie & Co manages capital, representing consolidated equity. The
purpose is to give D. Carnegie & Co’s shareholders a high total return. Return
on equity was 31.1 percent (29.8) in 2016. D. Carnegie & Co’s ambition is to
maintain a balanced asset and capital structure over time tailored to the
Company’s property management business. The target for 2016 was to
achieve an equity ratio of at least 30 percent. The actual outcome was 33.8
percent (28.2). The target for 2017 is an equity ratio of at least 30%. The
equity ratio target is a simplified consequence of a more in-depth analysis,
where equity has been allocated in relation to the various risk profiles that
the investment properties have in the balance sheet. Share capital consists
of one class of share, ordinary shares, divided into class A shares which carry
5 votes per share and class B shares, which carry 1 vote, each with a par
value of SEK 12.742349 per share.
Dividend
The Board of Directors of D. Carnegie & Co proposes to the Annual General
Meeting that no dividend be paid for the 2016 financial year.
DUE DATE STRUCTURE
PROFIT/LOSS FOR THE YEAR ATTRIBUTABLE TOPARENT COMPANY SHAREHOLDERS
The Group is exposed to various kinds of financial risk in its business opera-
tions. Financial risks refer to fluctuations in the company’s profits and cash
flow as a result of changes in interest rates, for example. D. Carnegie & Co
is mainly exposed to liquidity risk, funding risk, interest rate risk and credit
risk. Reporting of the Group’s financial risks and financial position is made
to the Board and CEO on regular basis.

NOTE 20 Cont. Financial instruments and financial risks
F INANC IAL REPORT ING
82 D. Carnegie & Co AB (publ) Annual Report 2016
For acquisitions special financing decisions are taken by the Board. The
finance department’s operations are conducted within the framework esta-
blished in the finance policy established by the Board. The finance policy
regulates the handling of financial risks and provides a framework of guideli-
nes and rules that serve as risk mandates and limits on financial activities.
The Group’s financial transactions and financial risks is handled centrally by
the parent company’s finance function. The overarching objective of the
finance function is to provide cost-effective financing and to minimize nega-
tive effects on the Group’s earnings due to market fluctuations. Financial iss-
ues of strategic importance are addressed by the Board of ctors. Additional
information is available in the section on Financing on pages 37-39.
Group, FInancial assets
Financial assets/ debts valued at fair value in profit
or loss *
Receivables and current
assets
Divestable financial
assets
Other financial
debt Total
Shares and stocks - - 19,950 - 19,950
Derivatives 6,517 - - - 6,517
Customer recievables - 5,792 - - 5,792
Short-term investments 182,459 - - - 182,459
Other receivables - - - - 0
Accrued income - - - - 0
Cash and cash equivalents - 679,370 - - 679,370
188,976 685,162 19,950 0 894,088
Financial liabilities
Non-current interest bearing liabilities, liabilities to credit institutions - - - 6,733,018 6,733,018
Non-current interest bearing debt, bonds - - - 2,000,000 -
Other non-current liabilities - - - 1,103 1,103
Interest rate derivatives 144,694 - - - 144,694
Current interest-bearing liabilities - - - 1,257,659 1 257,659
Accounts payable - - - 81,934 81,934
Other short-term liabilities - - - - 0
Accrued costs - - - 43,687 43,687
144,694 0 0 10,117,392 8,262,086
*Sub-category is held for trading purposes
The fair value is consistent in all material respects with the carrying amount. For fixed rate loans amounting to SEK 1,595 m the fair value is calculated to SEK 1,588 m.
Group, Financial assets
Financial assets/ debts valued at fair value in profit
or loss *
Receivables and current
assets
Divestable financial
assets
Other financial
debt Total
Shares and stocks - - 558 - 558
Derivatives - - - - 0
Customer recievables - 6,410 - - 6,410
Short-term investments 178,245 - - - 178,245
Other receivables - - - - 0
Accrued income - 12,826 - - 12,826
Cash and cash equivalents - 478,524 - - 478,524
178,245 497,760 558 0 676,563
Financial liabilities
Non-current interest bearing liabilities, liabilities to credit institutions - - - 6,587,332 6,587,332
Non-current interest bearing debt, bonds - - - 1,000,000 -
Other non-current liabilities - - - 3,143 3,143
Interest rate derivatives 60,487 - - - 60,487
Current interest-bearing liabilities - - - 1,650,286 1,650,286
Accounts payable - - - 108,509 108,509
Other short-term liabilities - - - - 0
Accrued costs - - - 60,713 60,713
60,487 0 0 9,409,983 8,470,470
*Sub-category is held for trading purposes
The fair value is consistent in all material respects with the carrying amount. For fixed rate loans per 31 December 2015 no fair value has been calculated .
FINANCIAL ASSETS AND LIABILITIES AS OF 31 DECEMBER 2016
FINANCIAL ASSETS AND LIABILITIES AS OF 31 DECEMBER 2015

F INANC IAL REPORT ING
Annual Report 2016 D. Carnegie & Co AB (publ) 83
Fair value
The table below shows financial instruments measured at fair value,
based on the classification in the fair value hierarchy. The different levels
defined as follows:
Level 1 - Quoted prices (unadjusted) in active markets for identical
assets or liabilities.
Level 2 - Observable inputs for the asset or liability than quoted
prices included in Level 1, either directly (i.e. as prices) or
indirectly (i.e. derived from prices).
Level 3 - Inputs for the asset or liability that are not based on observable
market data (i.e. unobservable inputs).
31 December 2016 Level 1 Level 2 Level 3 Sum
Financial assets
Derivatives - 6,517 - 6,517
Short-term investments 143,359 39,100 - 182,459
143,359 45,617 0 188,976
Financial liabilities
Derivatives - 144,694 - 144,694
0 144,694 0 144,694
31 December 2015 Level 1 Level 2 Level 3 Sum
Financial assets
Derivatives
Short-term investments 101,048 77,197 - 178,245
101,048 77,197 0 178,245
Financial liabilities
Derivatives - 60,487 - 60,487
0 60,487 0 60,487
Fair value calculation
The carrying values on the balance sheet does not differ materially from fair
value. For the Company’s long term debt at fixed interest rates is however, a
fair value is determined, see below.
Stocks and shares
Shares and holdings consist of investments that are not quoted in an active
market and whose fair value can not be reliably measured, which means that
holdings have been valued at cost.
It is estimated that the fair value of these stocks and shares equal the
carrying value.
Interest rate derivatives
Derivatives are, in the consolidated financial statements, carried at fair value
with changes reported over the income statement. To determine the fair
value of interest rate derivatives market rates are used for each term listed
on the closing date and generally accepted calculation methods, which
means that the fair value is determined according to level 2 of IFRS 13. D.
Carnegie & Co values all derivatives by reconciliation with the counterparty.
The interest swaps have been valued by Deutsche Pfandbriefbank, Landes-
bank Hessen-Thüringen and Swedbank by discounting future cash flow to
present value. The interest rate caps have been valued by Swedbank, Han-
delsbanken, SEB and Danske Bank.
Short term investments
Short-term investments consist of shares listed on an active
market and a smaller percentage that are not quoted in an active market. An
assessment has been made that the fair value can be measured reliably;
which means that all holdings have been valued at fair value. Shares that not
quoted are valued in accordance with level 2, IFRS 13.
Long-term interest-bearing liabilities
For disclosure purposes an estimated a fair value of long term debt with
fixed interest rates is determined by discounting the future cash flows of the
principal and interest discounted at the current market rate. In the calcula-
tion an assessment has been made regarding the credit spread and the con-
ditions that the Group would receive per reporting date.
Short-term receivables and liabilities
For current receivables and liabilities, such as accounts receivable and
accounts payable and short-term interest-bearing debt, with a maturity of
less than one year, the carrying amount reflects the fair value. Changes in
value as well as income and expenses from financial instruments are disclo-
sed in Note 7, Net financial items and fair value of financial instruments and
Note 12, Accounts receivables.

NOTE 20 Cont. Financial instruments and financial risks
F INANC IAL REPORT ING
84 D. Carnegie & Co AB (publ) Annual Report 2016
Liquidity and funding risk
Liquidity risk refers to the risk of insufficient liquidity to meet future payment
obligations. Internal liquidity forecasts are drawn up in connection with the
quarterly reports for the coming twelve months, where all items affecting
cash flows are analyzed in aggregate form. The purpose of the liquidity fore-
cast is to verify the need for capital. D. Carnegie & Co has a number of fun-
ding sources, and believes that short-term loans can be extended with cur-
rent lenders. Further see pages 37-39.
Funding risk is the risk that financing cannot be obtained at all, or is only
available at greatly increased costs. To manage this risk, the finance policy
contains rules on spreading of maturities for the loan stock and the size of
investments. According to the finance policy, the average remaining maturity,
the fixed-rate term, on the loan stock should be 3-5 years, and at most 35
percent of the loan stock should mature during any single year. As of 31
December 2016, the average remaining term of the loan portfolio was 3.6
years (5.7). Cash and cash equivalents at this time totalled SEK 679 million
(479).
Maturity
Creditagreements,SEK million
Utilized,SEK million
2017 1,240 1,240
2018 1,233 1,233
2019 381 381
2020- 5,205 5,205
Total 8,060 8,060
Maturity
Creditagreements,SEK million
Utilized,SEK million
2017 1,240 1,240
2018 2,233 2,233
2019 1,381 1,381
2020- 5,205 5,205
Total 10,060 10,060
MATURITY, CREDIT INSTITUTIONS
MATURITY, ALL INTEREST-BEARING LIABILITES
This table relates to credit institutions and not total interest-bearing liabilities.The amounts do not include loan fees capitalized for accounting purposes.
This table relates to credit institutions and not total interest-bearing liabilities. The amounts do not include loan fees capitalized for accounting purposes.
31 December 2016
Term analysis financial liabilities, SEKm 2017 2018-2019 2020-2021 2022-
Non-current interest bearing liabilities, credit institutitions 99 1,792 2,442 2,890
Non-current interest bearing liabilities, bonds 78 2,071 - -
Other non-current liabilities - 1 - -
Interest rate derivatives 62 123 105 7
Current interest bearing liabilities 1,264 - - -
Accounts payable 82 - - -
Accrued liabilities 44 - - -
1,628 3,987 2,547 2,897
31 December 2016
Term analysis financial liabilities, SEKm 2016 2017-2018 2019-2020 2021-
Non-current interest bearing liabilities, credit institutitions 99 2,847 1,205 3,902
Non-current interest bearing liabilities, bonds 38 1,049 - -
Other non-current liabilities - 3 - -
Interest rate derivatives 62 123 910 65
Current interest bearing liabilities 774 - - -
Current interest bearing liabilities, convertible debentures 1,046 - - -
Accounts payable 109 - - -
Accrued liabilities 61 - - -
2,187 4,022 2,115 3,967
Interest rate risk
The interest rate risk can consist of changes in fair value resulting from
changes in interest rates, known as price risk, as well as changes in cash
flow, cash flow risk. The fixed-interest term is an important factor affecting
the interest rate risk. Long periods of fixed interest entail a higher price risk,
while shorter periods of fixed interest entail a higher cash flow risk. Of the
total interest-bearing liabilities of SEK 10,060 million (9,313), 54 percent
(33) had variable interest and the average fixed-interest term was 2.7 years
(5.0) at year-end.
The Group’s contractual and undiscounted interest payments and repay-
ments of financial liabilities are disclosed in the table below. Financial instru-
ments with variable interest rates have been calculated using the rate that
existed at the balance sheet date. Liabilities are included in the period when
the earliest repayment may be required.
MaturityAverage interest
rate, %Volume,
SEKmPercentage,
%
2017 1,2% 3 474 43%
2018 - - -
2019 1,6% 381 5%
2020- 3,5% 4 205 52%
Total 2,2% 8 060 100%
INTEREST RATE TERM, CREDIT INSTITUTIONS
This table relates to credit institutions and not total interest-bearing liabilities.

F INANC IAL REPORT ING
Annual Report 2016 D. Carnegie & Co AB (publ) 85
INTEREST RATE DERIVATIVES
TypeAmount
SEK millionRemainingterm, years
Interest rate %
Fair valueSEK m
Nominal interest rate swaps 3,401 3.3-5.2 - -60
Interest rate caps 1,500 5.4 3.0 7
Counterparty, DerivativesMax
durationNominal limit
per counterparty
Swedish banks with wholly ownedsubsidiaries 10 years SEK 4,000 million
Foreign banks with a rating of atleast A- from Standard & Poor’s orA3 from Moody’s 10 years SEK 4,000 million
Netting
The Group performs gross accounting for all financial instruments.
Credit risks
Credit risk refers to the risk that a counterparty or issuer cannot fulfil its obli-
gations to D. Carnegie & Co. D. Carnegie & Co is exposed to credit risk to
the extent that surplus liquidity is to be invested and through its holdings of
derivatives in the form of interest rate caps and interest rate swaps.
D. Carnegie is also exposed to credit risks in receivables, further see Note
12. In order to limit credit risk in investments, the financial policy contains
special counterparty rules where the maximum credit exposure to various
counterparties is as follows:
Quantification of credit risk exposure as of December 31, 2016
The Group has, in order to reduce counterparty risk in derivative instruments,
signed standardized netting agreements (ISDA) agreements.
The Group receives or makes no guarantees regarding derivatives.
Derivatives may only be acquired hedge the interest rate risk. Permitted deri-
vatives: interest rate swaps, interest rate caps. The term for caps and swaps
may not exceed ten years.
Counterparties regarding derivative transactions.
Credit risk exposure is measured as, at the time, the fair value of financial
assets.
The Group’s maximum exposure to credit risk from financial instruments is
the carrying values of financial assets according to the table Financial assets
and liabilities as of 31 December 2016.
Credit quality is assumed to be good for financial assets that are not yet due
nor impaired. The Group had at the end of the period not received any colla-
teral for credit risk exposure
Counterparty, Short term placings Max term
Limit
Swedish state and governmentagencies with 100% governmentguarantee 3 months Unlimited
Swedish banks with wholly-ownedsubsidiaries 3 months
Maximum ofSEK 500 million
per group
Other Swedishmortgage institutions 3 months
Maximum ofSEK 100 million
per company
Foreign banks with a rating of atleast A- from Standard & Poor’s orA3 from Moody’s 3 months
Maximum ofSEK 50 million
per group
31 December 2016 31 December 2015
Informaton regarding netting- Financial instruments Financial assets Financial liabilities Financial assets Financial liabilities
Gross amount of financial instruments that may be netted 13,746 16,946 12,031 2,911
Amounts which have been netted - - - -
Reported in balance sheet 13,746 16,946 12,031 2,911
Amounts covered by netting agreements, derivatives -13,746 -13,746 -2,911 -2911
Net amount after netting agreements 0 3,200 9,120 0
According to the finance policy, the average remaining term for interest rate
caps and swaps should be 3 – 5 years and at year-end it was 4.9 years (4.3).
At year-end D. Carnegie & Co had fixed-rate loans from credit institutions
(primarily through swaps) for a total of SEK 4,901 million (3,401). Further
see Note 7.
MaturityAverage interest
rate, %Volume,
SEKmPercentage,
%
2017 2,2% 5 474 54%
2018 - - -
2019 1,6% 381 4%
2020- 3,5% 4205 42%
Total 2,5% 10 060 100%
INTEREST RATE TERM, TOTAL INTEREST BEARING DEBTS
This table relates to credit institutions and not total interest-bearing liabilities.
According to the finance policy, cash flow risk is limited as follows: at least
30% of the total loan volume should be with fixed interest or be covered by
an interest rate cap. Swapped volumes are classified as corresponding to
fixed loans.

NOTE 21 Other liabilities
F INANC IAL REPORT ING
86 D. Carnegie & Co AB (publ) Annual Report 2016
2016 2015
Group
Vehicle leases 6,422 4,460
Total 6,422 4,460
Parent company
Vehicle leases 2,064 433
Total 2,064 433
2016 2015
Group
Prepaid rent for firstquarter 100,705 93,735
Accrued expenses properties 124,645 139,126
Accrued interest expenses 43,678 60,713
Accrued personnel costs 12,833 10,038
Other items - -
Total 281,861 303,612
Parent company
Accrued interest expenses 15,083 22,135
Accrued personnel costs 5,220 2,514
Accrued consultancy costs 6,198 -
Accrued audit costs 1,713 -
Other items 2,428 3,547
Total 30,642 28,196
Other current liabilities 2016 2015
Group
Employee withholding taxes and socialsecurity contributions 5,708 3,110
VAT - 2,841
Liability to Boverket 19,914 -
Deferred liabilities registered title deeds 7,256 7,256
Other items 2,886 5,453
Total 35,764 18,660
Parent company
Employee withholding taxes and socialsecurity contributions 4,328 1,254
VAT - -350
Other items - 23
Total 4,328 927
Covenants and risk-taking
D. Carnegie & Co’s financial risk-taking and financial position can be inferred
from key figures such as the equity ratio, the interest coverage ratio and the
LTV ratio. Credit agreements with banks and credit institutions sometimes
contain limits, known as covenants, for these three key ratios. D. Carnegie &
Co’s own targets are well in line with the banks’ requirements. D. Carnegie &
Co’s target for 2016 was to achieve an equity ratio of at least 30 percent.
The equity ratio target remains unchanged for 2016. Banks generally have a
lower limit of 25 percent. D. Carnegie & Co’s target is that the interest cover-
age ratio should be at least 1.5 times, which is in line with the banks’ require-
ments. D. Carnegie & Co’s upper limit for the loan-to-value ratio is a target of
65 percent. D. Carnegie & Co met all targets and fulfilled all requirements
with a good margin in 2016. The equity ratio was 33.8 percent, the interest
coverage ratio was 2.0 times, the loan-to-value ratio was 54 percent and the
loan-to-value ratio for properties was 47 percent.
Price risk for stocks and shares
The Group’s holdings in listed and unlisted shares are exposed to market
price risk. The Group’s holdings are specifically related to the real estate
industry.
A change in the market valuation of +/- 10 percentages would affect the
Group’s reported profit after tax and the Group’s equity of +20.2/-18.5 million.
Exchange rate risk
The Group has operations only in Sweden, and has no loans or holdings
which exposes the Group to currency risk.
Sensitivity analysis
In connection with the quarterly reports, an interest rate sensitivity analysis is
also prepared, measuring the effects of changes in short-term market inte-
rest rates on the borrowing rate and interest coverage ratio. A change in
short-term market interest rates of +/-1 percentage point at year-end would
have meant that D. Carnegie & Co’s average borrowing rate would have
changed by +/-1 percentage point, which would have been equivalent to a
change in interest expenses of SEK+21/2 million. The interest coverage
ratio, excluding changes in value, would have changed from the current 2.0
to 1.9/2.0 times. The changes in interest expenses are affected by the inte-
rest rate floor (Stibor) in the loan agreements. A change in market value of
derivatives due to changes in short-term interest rates is not expected to
have material impact on the Group’s reported net profits and financial position.
The calculations of the sensitivity analysis are based on the Group’s earnings
capacity and balance sheet as of 31 December 2016. The sensitivity analy-
sis shows the effect on the Group’s profit/loss for the year after full impact
of each of the parameters above.
NOTE 22 Accrued expenses and deferred income
NOTE 23 Operating leases
NOTE 20 Cont. Financial instruments and financial risks

F INANC IAL REPORT ING
Annual Report 2016 D. Carnegie & Co AB (publ) 87
Group 2016
Group 2015
Parent 2016
Parent 2015
Pledged assets
Shares and participations 605,755,780 336,452,438 836,926,136 898,537,781
Floating charges 7,561,000 7,561,000 - -
Property mortgages 8,502,777,418 7,693,377,900 - -
Total 9,116,094,198 8,037,391,338 836,926,136 898,537,781
Contingent liabilities
Guarantees on behalf of subsidiaries 2,626,227,332 2,872,578,338 906,732,500 1,007,970,000
Total 2,626,227,332 2,872,578,338 906,732,500 1,007,970,000
YearServices
sold Services
purchasedInterest
receivedInterest
paid Receivable Liability
Group
Related parties 2016 - -50,409 10,677 -2,056 - -
Related parties 2015 - -23,185 14,338 -5,052 162,311 -133,000
Parent company
Subsidiaries 2016 4,770 - 26,743 -30,754 1,700,491 -1,883,288
Subsidiaries 2015 3,509 - 13,656 -21,251 980,075 -1,268,186
Related parties 2016 - -1,085 2,485 -2,056 - -
Related parties 2015 - -2,782 3,334 -5,052 - -133,000
The parent company is a related party to its subsidiaries, see Note 26th.
Transactions with related parties are priced at market conditions.
In connection with the acquisition of Hyresbostäder i Sverige II AB, a rela-
ted-party transaction took place between Kvalitena AB and Markarydsbostä-
der Holding AB, a subsidiary of Hyresbostäder i Sverige II AB. The transac-
tion consisted of a claim under a promissory note whereby
Markarydsbostäder Holding AB had a claim against Kvalitena AB in the
amount of SEK 150 million. SEK 100 million under this promissory note
became due and payable on 31 October 2015 which had pursuant to a
resolution adopted by the board of directors extended to 31 August 2016.
The remaining SEK 50 million would have fallen due on 31 October 2016,
but had pursuant to a resolution adopted by the board of directors been
brought forward to 31 August 2016. The average rate of interest during the
period was 6.75 per cent, and SEK 6 million was paid in interest during the
period. Sörmlandsporten AB, a company which is 50 per cent owned by Kva-
litena AB, has through a transfer assumed a SEK 15 million loan to D. Car-
negie & Co. An additional loan, amounting to SEK 40 million, was issued to
Kvalitena AB, which has pursuant to a resolution adopted by the board of
directors be solved at 31 August 2016. This loan has been issued on market
terms. All loans to the Kvalitena-group were repaid in full during the fourth
quarter.
SEK 200 million of the purchase price in connection with the acquisition of
Hyresbostäder II i Sverige AB comprised a vendor note. This note was held
by the seller of Hyresbostäder i Sverige II AB, Svensk Bolig Holding AB. On
4 July 2015, SEK 67 million was repaid on the note, and on 30 June 2016
the rest SEK 133 was repaid, meaning that none of this vendor note remains
outstanding at the end of the second quarter. The note carried interest at an
annual rate of rate of 3 per cent. In addition to the repayment of the vendor
note, interest was paid affecting the financial costs during the period amoun-
ting to SEK 4 million.
During the period, the D. Carnegie & Co Group made purchases worth SEK
49.3 million from Bosystem Nordic AB, a company which is 50 percent
owned by Kvalitena AB.
The remuneration payable to the CEO, senior management, and the Board of
Directors is set forth in note 3.
Pledged assets relate to loans to credit institutions and not total interest-bearing liabilities. The parent company’s financial guarantee contracts consist
primarily of guarantees on behalf of subsidiaries.
D. Carnegie & Co is not a party to any disputes.
NOTE 24 Pledged assets
NOTE 25 Related parties

F INANC IAL REPORT ING
88 D. Carnegie & Co AB (publ) Annual Report 2016
31 Dec. 2016 31Dec. 2015
Accumulated cost
Opening balance 4,827,870 4,827,870
Acquisitions - -
Sales - -
Carrying amount at year-end 4,827,870 4,827,870
Accumulated shareholder contribution
Opening balance - -
Shareholder contribution for the year - -
Carrying amount at year-end - -
Total 4,827,870 4,827,870
NOTE 26 Shares in group companies

F INANC IAL REPORT ING
Annual Report 2016 D. Carnegie & Co AB (publ) 89
Subsidiary / Corp.ID.no / Registered office Number of shares Percentage Carrying amount
HYRESBOSTÄDER I SVERIGE II AB 556622-5990, STOCKHOLM 1 030 507 100% 3 753 897
Graflunds Fastighets AB, 556035-8524, Eskilstuna 1 074 100%
Graflunds Byggnads AB 556065-7438, Eskilstuna 4 000 100%
Graflunds Kommersiella Fastigheter AB 556678-4673, Eskilstuna 1 000 100%
Fastighetsbolaget Vaksam 8 AB 556726-1507, Eskilstuna 1 000 100%
Bronseri AB 556498-4937, Eskilstuna 1 000 100%
Kattgun AB 556498-4895, Eskilstuna 1 000 100%
Fastighetsförvaltningsaktiebolaget Friheten 11 556525-4645, Eskilstuna 1 000 100%
Veningen B AB 556764-6897, Stockholm 1 000 100%
Fastighetsbolaget Kullerstensvägen AB 55662-9027, Stockholm 1 000 100%
Fastighetsbolaget Kullerstensvägen KB 969673-3618, Stockholm - 100%
Fastighetsbolaget Sågenvägen AB 556662-9001, Stockholm 1 000 100%
Fastighetsbolaget Klena KB 969673-3717, Stockholm - 100%
Fastighets AB Linrepan 556706-3085, Stockholm 1 000 100%
Fastighetsbolaget Anelk AB 556662-5637, Stockholm 1 000 100%
Kungskatten Holding AB 556706-3739, Stockholm 1 000 100%
Fastighets AB Linrepan 556706-3085, Stockholm 1 000 100%
Fastighetsbolaget Anelk AB 556662-5637, Stockholm 1 000 100%
Kungskatten Holding AB 556706-3739, Stockholm 1 000 100%
Markarydsbostäder Holding AB 556602-1753, Stockholm 1 000 100%
Markarydsbostäder i Stockholm AB 556637-3676, Upplands-Bro 80 100 100%
Markarydsbostäder i Södertälje AB 556540-1659, Södertälje 20 100 100%
Fastighetsbolaget Lärdom AB 556726-1580, Eskilstuna 1 000 100%
Fatighetsbolaget Erganten AB 556725-8214, Eskilstuna 1 000 100%
Märtuna I AB 556790-2795, Stockholm 1 000 100%
Märtuna II AB 556791-4030, Stockholm 1 000 100%
Graflunds Holding AB 556706-4919, Stockholm 1 000 100%
Hyresfastigheter i Strängnäs AB 559064-1345, Stockholm 1 000 100%
Fastighets AB Bonden 559064-1352, Stockholm 50 100%
Fastighets AB Brunteglet 559064-1360, Stockholm 50 100%
Fastighets AB Läraren i Strängnäs 559064-1378, Stockholm 50 100%
Fastighets AB Träbalkongen 559064-1568, Stockholm 50 100%
Hyresbostäder i Katrineholm AB 559056-3762, Stockholm 50 100%
Fastighetsbolaget Nyfors AB 556555-8672, Stockholm 1 000 100%
A specification of the parent company’s directly-owned subsidiaries, and other group companies is set forth below.

F INANC IAL REPORT ING
90 D. Carnegie & Co AB (publ) Annual Report 2016
Subsidiary / Corp.ID.no / Registered office Number of shares Percentage Carrying amount
HOLMIENSIS BOSTÄDER AB 556943-4888, STOCKHOLM 50 000 100% 1 073 973
Flemingsberg Fastighetsförvaltning AB 556898-1582, Stockholm 833 333 100%
Provinsfastigheter i Visättrahem AB 556673-4298, Stockholm 1 000 100%
Provinsfastigheter i Vedboden 1 AB 556673-4645, Stockholm 1 000 100%
Provinsfastigheter i Magasinet 4 AB 556673-4579, Stockholm 1 000 100%
Provinsfastigheter i Stallet 3 AB 556673-4405, Stockholm 1 000 100%
Östgötaporten AB 556941-0151, Stockholm 50 000 100%
Östgötafastigheter i Norrköping AB 556916-0343, Stockholm 500 100%
Östgötafastigheter Hambon 1 AB 556945-1932, Stockholm 500 100%
Östgötafastigheter Hambon 2 AB 556945-1940, Stockholm 500 100%
Östgötafastigheter Tangon 1 AB 556945-1957, Stockholm 500 100%
Östgötafastigheter Gavotten 1 AB 556945-1890, Stockholm 500 100%
Östgötafastigheter Kadriljen 1 AB 556945-1908, Stockholm 500 100%
Östgötafastigheter Mazurkan 1 AB 556945-1916, Stockholm 500 100%
Östgötafastigheter Menuetten 1 AB 556945-1924, Stockholm 500 100%
Östgötatornen AB 556679-1736, Norrköping 100 000 100%
Kista Fastighetsförvaltning AB 556850-4772, Stockholm 505 899 100%
Kista Kommanditdelägare AB 556850-4780, Stockholm 50 000 100%
KB Bergen 1 969605-7620, Stockholm - 100%
KB Nidrosgatan 969605-7638, Stockholm - 100%
KB Telemark 969605-7554, Stockholm - 100%
KB Nordkapsgatan 4-19 969624-6546, Stockholm - 100%
KB Törnbergsgatan 1-15 969624-6694, Stockholm - 100%
Bromsten Fastighetsförvaltning AB 556923-9493, Stockholm 4 209 100%
Bredbykvarn Fastighets AB 556963-8082, Stockholm 500 100%
Bredbykvarn Garage AB 556963-8116, Stockholm 500 100%
Spånga Förvaltning AB 556675-3470, Stockholm 1 000 100%
Trojeborgs Fastigheter i Sverige AB 556558-0486, Stockholm 15 000 100%
Fastighets AB Turemalm 556974-0219, Stockholm 50 000 100%
Akalla Centrumfastigheter AB 556900-0010 500 100%
Stendörren Byggrätt Huddinge Fyra AB 556974-0235, Stockholm 50 000 100%
Jordbroförvaltnings AB 556764-2896, Stockholm 1 000 100%
Holmiensis Duvholmen 1 AB 559035-5979, Stockholm 50 000 100%
4 827 870

F INANC IAL REPORT ING
Annual Report 2016 D. Carnegie & Co AB (publ) 91
D. Carnegie & Co AB (publ), company reg. no. 556498-9449, is a Swedish
registered limited liability company with its registered office in Stockholm,
Sweden. The parent company’s shares are registered on Nasdaq Stockholm
Midcap. The head office is located at Engelbrektsplan 1, 114 34 Stockholm,
Sweden. These consolidated financial statements for 2016 are for the
Group consisting of the parent company and all subsidiaries.
The following funds are at the disposal of the Annual
General Meeting:
The board proposes that no dividend be paid for financial year 2016.
Adjustment for items not included in cash flow Group Group Parent Parent
2016 2015 2016 2015
Items not affecting cash flow at acquisition - - - -
Accrued unpaid interest -2,628 10,676 -5,118 5,657
Equity share convertible bond - 5,625 700 5,625
Amortization for the year on equipment 1,801 1,743 37 -
Capital gain/loss on equipment -35 30 - -
Changes in value on financial instruments - - 8,394 -
Total -862 18,074 4,013 11,282
The preparation of financial statements in conformity with IFRS requires the
Board of Directors and management to make assessments, estimates and
assumptions that affect the application of accounting principles and recogni-
zed amounts of assets and liabilities, income and expenses. Such estimates
and assumptions are based on historical experience and a number of other
factors which, under the prevailing circumstances, are deemed reasonable.
The results of these estimates and assumptions are then used to assess the
carrying amounts of assets and liabilities, which are otherwise not clearly
apparent from other sources. The actual outcome can deviate from these
estimates and assumptions. Estimates and assumptions are reviewed regu-
larly. Revisions to accounting estimates are recognized in the period in which
the estimate is revised if the revision affects only that period, or in the period
of the revision and future periods if the revision affects both current and
future periods. Judgments made by the Board and management in the appli-
cation of IFRS that have a significant impact on the financial statements, and
estimates with a significant risk of material adjustment in the next year’s
financial statements relate to valuation of investment properties, which are
described in greater detail in note 10.
D. Carnegie & Co has entered into an agreement with Fastighets AB Balder
(publ) to acquire residential property portfolios in Arboga, Köping and Tranås.
The property portfolios comprises 42 properties and 1,681 apartments. The
property value is SEK 1,420 million and the agreed share purchase price
amounts to SEK 1,040 million. The transaction is a share deal with closing
scheduled for May 2017.
NOTE 27 Statement of cash flows
NOTE 28 Events after the balance sheet date
NOTE 29 Critical accounting estimates and judgments
NOTE 30 Information about the Parent company
NOTE 31 Proposed allocation of unappropriated earnings
Retained earnings -174,498,491
Share premium reserve 2,448,858,519
Repayment convertible debenture -145,199,985
Profit/loss for the year -113,623,657
SEK 2,015,536,386
To the shareholders 0
Carried forward 2,015,536,386
SEK 2,015,536,386

F INANC IAL REPORT ING
92 D. Carnegie & Co AB (publ) Annual Report 2016
Stockholm April 10, 2017The Board of Directors of D. Carnegie & Co
Our Audit Report was submitted on April 10, 2017 Ernst & Young AB
The undersigned certify that the consolidated accounts and the annual accounts have been prepared in accordance with
International Financial Reporting Standards (IFRS), as adopted for use in the European Union, and generally accepted
accounting principles respectively, and give a true and fair view of the financial positions and results of the Group and the
parent company, and that the Report of the Directors for the Group and the parent company respectively gives a true and
fair review of the development of the operations, financial position and results of the Group and the parent company and
describes substantial risks and uncertainties faced by the companies in the Group..
James Seppala Chairman
Mikael Ikonen Authorized Public Accountant
Mats Höglund Director
Ingemar Rindstig Authorized Public Accountant
Svein Erik Lilleland Director
Eva RedheDirector
Knut Pousette Director
Ulf NilssonChief Executive Officer

F INANC IAL REPORT ING
Annual Report 2016 D. Carnegie & Co AB (publ) 93
To the general meeting of the shareholders of in D. Carnegie & Co AB ,
corporate identity number 556498-9449.
REPORT ON THE ANNUAL ACCOUNTS ANDCONSOLIDATED ACCOUNTS
Opinions
We have audited the annual accounts and consolidated accounts of D. Carne-
gie & Co AB (publ) except for the corporate governance statement on pages
41-51 for the year 2016. The annual accounts and consolidated accounts of
the company are included on pages 53-92 in this document.
In our opinion, the annual accounts have been prepared in accordance with the
Annual Accounts Act and present fairly, in all material respects, the financial
position of the parent company as of 31 December 2016 and its financial per-
formance and cash flow for the year then ended in accordance with the Annual
Accounts Act. The consolidated accounts have been prepared in accordance
with the Annual Accounts Act and present fairly, in all material respects, the
financial position of the group as of 31 December 2016 and their financial per-
formance and cash flow for the year then ended in accordance with Internatio-
nal Financial Reporting Standards (IFRS), as adopted by the EU, and the
Annual Accounts Act. Our opinions do not cover the corporate governance sta-
tement on pages 41-51. The statutory administration report is consistent with
the other parts of the annual accounts and consolidated accounts.
We therefore recommend that the general meeting of shareholders adopts the
income statement and balance sheet for the parent company and the group.
Basis for Opinions
We conducted our audit in accordance with International Standards on Auditing
(ISA) and generally accepted auditing standards in Sweden. Our responsibilities
under those standards are further described in the Auditor’s Responsibilities
section. We are independent of the parent company and the group in accor-
dance with professional ethics for accountants in Sweden and have otherwise
fulfilled our ethical responsibilities in accordance with these requirements.
We believe that the audit evidence we have obtained is sufficient and appropri-
ate to provide a basis for our opinions.
Key Audit Matters
Key audit matters of the audit are those matters that, in our professional judg-
ment, were of most significance in our audit of the annual accounts and conso-
lidated accounts of the current period. These matters were addressed in the
context of our audit of, and in forming our opinion thereon, the annual accounts
and consolidated accounts as a whole, but we do not provide a separate opi-
nion on these matters.
Valuation of investment properties
Investment properties amounts to 16 998 MSEK in the consolidated statement
of financial position for the group as of 31 December 2016. The investment
properties are accounted for using the fair value method at the reporting date
and all properties are valued at the year end at fair value by an external valua-
tion company. The fair value is an assessment of the market value for each pro-
perty individually and is affected by a number of different assumptions and
assessments such as rent payments, operating costs, investments, discount
rate and yield. The yield is specific for each property and is determined by analy-
sis of the performed transactions and the property’s market position.
Since the valuation involves a number of different assumptions and we have
deemed accounting and process for valuation of investment properties as key
audit matters.
The accounting principles for valuation of investment properties are disclosed in
note 10 on page 78.
In our audit we have assessed the external valuation company´s objectivity,
independence and competence. In our audit we have also evaluated the com-
pany’s process for performing the valuation of investment properties. We have
assessed the reasonableness of the assumption and assessments used in the
valuation which includes assessments made by the external valuation company
regarding rental development, vacancy, inflation and, operating costs. This has
been done with assistance from our own internal valuation specialists and by
making comparisons to known market data. We have, for a selection of invest-
ment properties, reviewed rental income and operating costs used in the exter-
nal valuation and compared this against the company’s accounting records. We
have also reviewed that the disclosures made are appropriate.
Other Information than the annual accounts and consolidated
accounts
This document also contains other information than the annual accounts and
consolidated accounts and is found on pages1-52 and 96-134. The Board of
Directors and the Managing Director are responsible for this other information.
Our opinion on the annual accounts and consolidated accounts does not cover
this other information and we do not express any form of assurance conclusion
regarding this other information.
In connection with our audit of the annual accounts and consolidated accounts,
our responsibility is to read the information identified above and consider
whether the information is materially inconsistent with the annual accounts and
consolidated accounts. In this procedure we also take into account our know-
ledge otherwise obtained in the audit and assess whether the information
otherwise appears to be materially misstated.
If we, based on the work performed concerning this information, conclude that
there is a material misstatement of this other information, we are required to
report that fact. We have nothing to report in this regard.
Responsibilities of the Board of Directors and the Managing Director
The Board of Directors and the Managing Director are responsible for the pre-
paration of the annual accounts and consolidated accounts and that they give a
fair presentation in accordance with the Annual Accounts Act and, concerning
the consolidated accounts, in accordance with IFRS as adopted by the EU. The
Board of Directors and the Managing Director are also responsible for such
internal control as they determine is necessary to enable the preparation of
annual accounts and consolidated accounts that are free from material missta-
tement, whether due to fraud or error.
Audit report
THIS IS A TRANSLATION FROM THE SWEDISH ORIGINAL
Appendix 1 Auditor’s report for a public limited liability parent company preparing its consolidated accounts in accordance with Inter-national Financial Reporting Standards as adopted by the EU and the Annual Accounts Act, Corporate Governance Statement review according to law

F INANC IAL REPORT ING
94 D. Carnegie & Co AB (publ) Annual Report 2016
In preparing the annual accounts and consolidated accounts, The Board of
Directors and the Managing Director are responsible for the assessment of the
company’s and the group’s ability to continue as a going concern. They disclose,
as applicable, matters related to going concern and using the going concern
basis of accounting. The going concern basis of accounting is however not
applied if the Board of Directors and the Managing Director intends to liquidate
the company, to cease operations, or has no realistic alternative but to do so.
Auditor’s responsibility
Our objectives are to obtain reasonable assurance about whether the annual
accounts and consolidated accounts as a whole are free from material missta-
tement, whether due to fraud or error, and to issue an auditor’s report that inclu-
des our opinions. Reasonable assurance is a high level of assurance, but is not
a guarantee that an audit conducted in accordance with ISAs and generally
accepted auditing standards in Sweden will always detect a material misstate-
ment when it exists. Misstatements can arise from fraud or error and are consi-
dered material if, individually or in the aggregate, they could reasonably be
expected to influence the economic decisions of users taken on the basis of
these annual accounts and consolidated accounts.
As part of an audit in accordance with ISAs, we exercise professional judgment
and maintain professional skepticism throughout the audit. We also:
• Identify and assess the risks of material misstatement of the annual
accounts and consolidated accounts, whether due to fraud or error, design
and perform audit procedures responsive to those risks, and obtain audit evi-
dence that is sufficient and appropriate to provide a basis for our opinions.
The risk of not detecting a material misstatement resulting from fraud is hig-
her than for one resulting from error, as fraud may involve collusion, forgery,
intentional omissions, misrepresentations, or the override of internal control.
• Obtain an understanding of the company’s internal control relevant to our
audit in order to design audit procedures that are appropriate in the circum-
stances, but not for the purpose of expressing an opinion on the effective-
ness of the company’s internal control.
• Evaluate the appropriateness of accounting policies used and the reasona-
bleness of accounting estimates and related disclosures made by the Board
of Directors and the Managing Director.
• Conclude on the appropriateness of the Board of Directors’ and the Mana-
ging Director’s use of the going concern basis of accounting in preparing
the annual accounts and consolidated accounts. We also draw a conclusion,
based on the audit evidence obtained, as to whether any material uncerta-
inty exists related to events or conditions that may cast significant doubt on
the company’s and the group’s ability to continue as a going concern. If we
conclude that a material uncertainty exists, we are required to draw attention
in our auditor’s report to the related disclosures in the annual accounts and
consolidated accounts or, if such disclosures are inadequate, to modify our
opinion about the annual accounts and consolidated accounts. Our conclu-
sions are based on the audit evidence obtained up to the date of our audi-
tor’s report. However, future events or conditions may cause a company and
a group to cease to continue as a going concern.
• Evaluate the overall presentation, structure and content of the annual
accounts and consolidated accounts, including the disclosures, and whether
the annual accounts and consolidated accounts represent the underlying
transactions and events in a manner that achieves fair presentation.
• Obtain sufficient and appropriate audit evidence regarding the financial
information of the entities or business activities within the group to express
an opinion on the consolidated accounts. We are responsible for the direc-
tion, supervision and performance of the group audit. We remain solely
responsible for our opinions.
We must inform the Board of Directors of, among other matters, the planned
scope and timing of the audit. We must also inform of significant audit findings
during our audit, including any significant deficiencies in internal control that we
identified.
We must also provide the Board of Directors with a statement that we have
complied with relevant ethical requirements regarding independence, and to
communicate with them all relationships and other matters that may reasonably
be thought to bear on our independence, and where applicable, related
safeguards.
From the matters communicated with the Board of Directors, we determine
those matters that were of most significance in the audit of the annual accounts
and consolidated accounts, including the most important assessed risks for
material misstatement, and are therefore the key audit matters. We describe
these matters in the auditor’s report unless law or regulation precludes disclo-
sure about the matter or when, in extremely rare circumstances, we determine
that a matter should not be communicated in the auditor’s report because the
adverse consequences of doing so would reasonably be expected to outweigh
the public interest benefits of such communication.
REPORT ON OTHER LEGAL AND REGULATORY REQUIREMENTS
Opinions
In addition to our audit of the annual accounts and consolidated accounts, we
have also audited the administration of the Board of Directors and the Mana-
ging Director of D. Carnegie & Co AB (publ) for the year 2016 and the propo-
sed appropriations of the company’s profit or loss.
We recommend to the general meeting of shareholders that the profit be app-
ropriated in accordance with the proposal in the statutory administration report
and that the members of the Board of Directors and the Managing Director be
discharged from liability for the financial year.
Basis for Opinions
We conducted the audit in accordance with generally accepted auditing stan-
dards in Sweden. Our responsibilities under those standards are further descri-
bed in the Auditor’s Responsibilities section. We are independent of the parent
company and the group in accordance with professional ethics for accountants
in Sweden and have otherwise fulfilled our ethical responsibilities in accordance
with these requirements.
We believe that the audit evidence we have obtained is sufficient and appropri-
ate to provide a basis for our opinions.
Responsibilities of the Board of Directors and the Managing Director
The Board of Directors is responsible for the proposal for appropriations of the
company’s profit or loss. At the proposal of a dividend, this includes an assess-
ment of whether the dividend is justifiable considering the requirements which
the company’s and the group’s type of operations, size and risks place on the
size of the parent company’s and the group’s equity, consolidation requirements,
liquidity and position in general.
The Board of Directors is responsible for the company’s organisation and the
administration of the company’s affairs. This includes among other things conti-
nuous assessment of the company’s and the group’s financial situation and
ensuring that the company’s organisation is designed so that the accounting,
management of assets and the company’s financial affairs otherwise are con-
trolled in a reassuring manner. The Managing Director shall manage the ong-
oing administration according to the Board of Directors’ guidelines and instruc-
tions and among other matters take measures that are necessary to fulfill the
company’s accounting in accordance with law and handle the management of
assets in a reassuring manner.
Auditor’s responsibility
Our objective concerning the audit of the administration, and thereby our opi-
nion about discharge from liability, is to obtain audit evidence to assess with a
reasonable degree of assurance whether any member of the Board of
Directors or the Managing Director in any material respect:

F INANC IAL REPORT ING
Annual Report 2016 D. Carnegie & Co AB (publ) 95
• has undertaken any action or been guilty of any omission which can give rise
to liability to the company, or
• in any other way has acted in contravention of the Companies Act, the
Annual Accounts Act or the Articles of Association.
Our objective concerning the audit of the proposed appropriations of the com-
pany’s profit or loss, and thereby our opinion about this, is to assess with reaso-
nable degree of assurance whether the proposal is in accordance with the
Companies Act.
Reasonable assurance is a high level of assurance, but is not a guarantee that
an audit conducted in accordance with generally accepted auditing standards
in Sweden will always detect actions or omissions that can give rise to liability to
the company, or that the proposed appropriations of the company’s profit or loss
are not in accordance with the Companies Act.
As part of an audit in accordance with generally accepted auditing standards in
Sweden, we exercise professional judgment and maintain professional skepti-
cism throughout the audit. The examination of the administration and the pro-
posed appropriations of the company’s profit or loss is based primarily on the
audit of the accounts. Additional audit procedures performed are based on our
professional judgment with starting point in risk and materiality. This means that
we focus the examination on such actions, areas and relationships that are
material for the operations and where deviations and violations would have par-
ticular importance for the company’s situation. We examine and test decisions
undertaken, support for decisions, actions taken and other circumstances that
are relevant to our opinion concerning discharge from liability. As a basis for our
opinion on the Board of Directors’ proposed appropriations of the company’s
profit or loss we examined the Board of Directors’ reasoned statement and a
selection of supporting evidence in order to be able to assess whether the pro-
posal is in accordance with the Companies Act.
The auditor’s examination of the corporate governance statement
The Board of Directors is responsible for that the corporate governance
statement on pages 41-51 has been prepared in accordance with the Annual
Accounts Act.
Our examination of the corporate governance statement is conducted in accor-
dance with FAR´s auditing standard RevU 16 The auditor´s examination of the
corporate governance statement. This means that our examination of the cor-
porate governance statement is different and substantially less in scope than
an audit conducted in accordance with International Standards on Auditing and
generally accepted auditing standards in Sweden. We believe that the examina-
tion has provided us with sufficient basis for our opinions.
A corporate governance statement has been prepared. Disclosures in accor-
dance with chapter 6 section 6 the second paragraph points 2-6 of the Annual
Accounts Act and chapter 7 section 31 the second paragraph the same law are
consistent with the other parts of the annual accounts and consolidated
accounts and are in accordance with the Annual Accounts Act.
Stockholm April 10 2017
Ernst & Young AB
Mikael Ikonen Ingemar Rindstig
Authorized Public Accountant Authorized Public Accountant

96 D. Carnegie & Co AB (publ) Annual Report 2016

Annual Report 2016 D. Carnegie & Co AB (publ) 97
Summary of property portfolio
City/NeighborhoodLettable
areaNumber of
apartementsPercentage renovated
Fair value December 31, 2016
Greater Stockholm
Kista/Husby 112,947 1,528 18.3% 1,616,000
Bromsten/Rinkeby 111,616 1,281 20.2% 1,531,350
Sollentuna 33,730 454 11.0% 505,400
Flemingsberg 40,413 573 9.2% 534,000
Vårby/Vårberg 66,858 863 7.0% 799,000
Jordbro 157,840 1,954 13.1% 1,921,000
Södertälje 159,964 2,110 11.7% 2,429,770
Bro 43,752 540 9.3% 541,056
Märsta 57,105 693 7.8% 748,000
Total Greater Stockholm 781,602 9,996 13.1% 10,625,576
Uppsala 75,507 968 9.7% 1,026,800
Eskilstuna 145,741 1,964 10.9% 1,849,960
Strängnäs 35,477 411 11.9% 512,175
Norrköping 172,735 2,301 14.6% 2,219,300
Katrineholm 61,128 718 1.7% 723,012
Total other locations 490,588 6,362 11.1% 6,331,247
Other (land, building rights, etc) 2,632 - - 41,100
Total 1,274,822 16,358 12.3% 16,997,923
Focus on the Stockholm Region
D. Carnegie & Co’s property portfolio consists primarily of refurbishable residential properties in the Stockholm region’s growth areas. The fair value of the portfolio on 31 December 2016 was SEK 16,998 million.

PROPERT Y PORTFOL IO
Breakdown of space Refurbished / Not refurbished Residential / Commercial
Kista/Husby, Akalla
Kista and Husby are located about 10 kilometers north of downtown Stockholm. A broad initiative has been underway here for several years to promote positive social and economic development in the area - known as the “Järva lift” (Järvalyftet). Many people and business want to move here because of the good communications and the proximity to the Järvafältet nature reserve. The area also has one of Europe’s largest IT clusters with world-leading companies and a wide range of culture, sports, shops and services. Many of the residential buildings in Kista and Husby were built as part of the Million Homes Programme in the 1960s and 1970s.
Nr Property designation Title Year built Number of
apartments
Percentage of refurbished apartments Residential
Miscella-neous
Undeveloped land
Tax value (SEK 000)
Building rights*
1 Bergen 1 Leasehold 1976 427 23,0% 20,668 2,127 14,616 197,320 8,000
2 Halden 3 Leasehold 1976 291 17,2% 21,852 716 21,158 280,602 7,200
3 Holmenkollen 1 Leasehold 1976 130 16,2% 10,010 611 8,767 123,406 0
4 Telemark 1 Leasehold 1974 403 18,6% 30,410 2,235 30,559 389,067 13,600
5 Tönsberg 2 Leasehold 1977 277 12,3% 20,865 821 20,183 263,983 1,200
6 Mariehamn 1 Leasehold 1975 0 0% 0 2,632 3,717 12,546 0
TOTAL 1 528 18,3% 103,805 9,142 99,000 1,266,942 30,000
* Currently being produced
Summary of property portfolioArea (m2)
Refurbished 18%
Not refurbished 82%
Residential 8%
Commercial 92%
Studio 3%
1B 33%
2B 39%
3B 13%
4B/larger 4%
Other 8%
98 D. Carnegie & Co AB (publ) Annual Report 2016

PROPERT Y PORTFOL IO
Kista
Sollentuna
Upplands Väsby
Märsta
Bro
Täby
SolnaLidingö
TumbaSödertälje
Huddinge
Haninge
Kista
Husby
Helenelund
Tensta
Akalla
STOCKHOLM
1
34
2
13
4
6
2
5
5
E4275
E18
E18
E18
E4
E4
Hanstavägen
Kista
Husby
Husby
KistaGalleria
VictoriaTower
Annual Report 2016 D. Carnegie & Co AB (publ) 99

Bromsten/Rinkeby, Spånga
Bromsten, Rinkeby and Spånga are located just 10 kilometers northwest of downtown Stockholm. The area is a mix of apartment buildings, townhouses/terrace houses and single-family homes, with several forests and recreation areas. The range of leisure activities and sports is large and there are many centers with libraries, grocery stores, shops and other amenities. It takes 10 to 18 minutes to get to central Stock-holm by subway and commuter train. Many of the residential buildings in Bromsten, Rinkeby and Spånga were built as part of the Million Homes Programme in the 1960s
Summary of property portfolio
Nr Property designation Title Year built Number of
apartments
Percentage of refurbished apartments Residential
Miscella-neous
Undeveloped land
Tax value (SEK 000)
Building rights*
1 Tensta 4:10 Leasehold - - - - - 5 147 -
2 Lättinge 1 Leasehold 1970 213 22,1% 16,919 1,060 13,737 132,172
3 Kvarnskvaltan 1 Leasehold - - - - - 2,085 0
4 Kvarnhjulet 1 Leasehold 1970 111 12,6% 8,784 796 5,515 71,806
5 Kvarnaxeln 1 Leasehold 1970 142 14,8% 11,232 424 8,836 89,949
6 Kvarnrännan 1 Leasehold 1970 83 26,5% 6,546 286 8,834 53,390
7 Kvarnkammaren 1 Leasehold 1970 166 22,9% 12,801 2,184 10,659 106,820
8 Skvaltkvarnen 1 Leasehold 1970 101 23,8% 8,496 338 8,514 -
9 Skvaltkvarnen 2 Leasehold 1970 60 20,0% 4,557 - 4,907 -
10 Skvaltkvarnen 3 Leasehold - - - - - 2,266 -
11 Rinkeby 2:14 Leasehold - - - - - 839 -
12 Fotkvarnen 1 Leasehold 1970 76 17,1% 8,986 300 9,788 246,129
13 Fotkvarnen 2 Leasehold - - - - - 1,922 -
14 Rinkeby 2:13 Leasehold - - - - - 670 -
15 Hjulkvarnen 1 Leasehold 1970 63 20,6% 5,216 564 6,332 -
16 Hjulkvarnen 2 Leasehold 1970 64 62,5% 5,474 526 6,580 -
17 Hjulkvarnen 3 Leasehold - - - - - 1,918 -
18 Rinkeby 2:1 Leasehold - - - - - 780 -
19 Handkvarnen 3 Leasehold 1970 117 - 9,429 634 12,590 95,501
20 Kvarnen 1 Leasehold 1969 85 9,4% 6,183 867 4,900 44,908
21 Vattenkvarnen 1 Leasehold 1969 - - - - - 1,643
TOTAL 1 281 20,2% 104,623 7,979 111,672 842,318
* Fotkvarnen 1-2, Hjulkvarnen 1-3, Skvaltkvarnen 1-3, Rinkeby 2:1, 2:13 and 2:14 are jointly-taxed at a total tax value of SEK 192.7 million.
** Currently being produced
Area (m2)
PROPERT Y PORTFOL IO
100 D. Carnegie & Co AB (publ) Annual Report 2016

KistaRinkeby
Sollentuna
Upplands Väsby
Märsta
Bro
Täby
SolnaLidingö
TumbaSödertälje
Huddinge
Haninge
Kista
Rinkeby
Spånga Bromsten
Tensta
STOCKHOLM
3
21
2019
1214
1517
8910
16 18
13 21
65
7
3
65
1 2
7
2120
1412
8910
1113
17
191816
4
4
279
E18
E18
E18
E4
E4
11
15
279
E18
Rinkeby
Tensta
Akalla
HusbyKista
Rinkebysvängen
PROPERT Y PORTFOL IO
Annual Report 2016 D. Carnegie & Co AB (publ) 101

279
Kymlingelänken
Arenastaden
E18Rinkeby
Rinkebysvängen
RinkebyBollplan
Bromsten/Rinkeby, Spånga
Breakdown of space Refurbished / Not refurbished Residential / Commercial
Refurbished 20%
Not refurbished 80%
Residential 93%
Commercial 7%
Studio 2%
1B 15%
2B 49%
3B 22%
4B/larger 5%
Other 7%
PROPERT Y PORTFOL IO
102 D. Carnegie & Co AB (publ) Annual Report 2016

PROPERT Y PORTFOL IO
Annual Report 2016 D. Carnegie & Co AB (publ) 103

Sollentuna
Sollentuna Municipality, with approximately 68,000 inhabitants, is just north of Stock-holm. Business and commercial centers are interspersed with natural green areas and a variety of cultural activities. Sollentuna is steadily growing thanks to its attractive location for both residents and businesses, as well as its proximity to the center of Stockholm and Arlanda Airport. The municipality has several major shopping centers, efficient services and proximity to beautiful nature. Several residential areas in the municipality were built as part of the Million Homes Programme in the late 1960s.
Summary of property portfolio
Nr Property designation Title Year built Number of
apartments
Percentage of refurbished apartments Residential
Miscella-neous
Undeveloped land
Tax value (SEK 000)
Building rights*
1 Traktören 5 Freehold 1971 454 11,0% 25,670 8,060 19,994 385,000
TOTAL 454 11,0% 25,670 8,060 19,994 385,000
* Currently being produced
Area (m2)
Breakdown of space Refurbished / Not refurbished Residential / Commercial
Refurbished 11%
Not refurbished 89%
Residential 76%
Commercial 24%
Studio 10%
1B 26%
2B 37%
3B 0%
4B/larger 3%
Other 24%
PROPERT Y PORTFOL IO
104 D. Carnegie & Co AB (publ) Annual Report 2016

Kista
Sollentuna
Upplands Väsby
Märsta
Bro
Täby
SolnaLidingö
TumbaSödertälje
Huddinge
Haninge Kista
Sollentuna
STOCKHOLM
1
1
E18
E18
E4
E4
E4
Sollentuna
Sollentuna C
Edsviken
Turebergs Torg
AttundaRättscentrum
ScandicStar
PROPERT Y PORTFOL IO
Annual Report 2016 D. Carnegie & Co AB (publ) 105

Flemingsberg
Flemingsberg is located in southwest Stockholm. Stockholm County Council, Huddinge Municipality and Botkyrka Municipality have formulated a development plan – Vision Flemingsberg 2030 – for the area. The aim is for Flemingsberg to become one of the most important centers for education, knowledge-intensive industry, science and business creation in the Greater Stockholm region. The plan is that by 2030 Flemings-berg will have become a city and center for 70,000 people. The central location and excellent living environment will make Flemingsberg attractive to many people in the
Summary of property portfolio
Nr Property designation Title Year built Number of
apartments
Percentage of refurbished apartments Residential
Miscella-neous
Undeveloped land
Tax value (SEK 000)
Building rights*
1 Vedboden 1 Freehold 1971 172 9,3% 11,678 145 15,220 86,390 8000
2 Magasinet 4 Freehold 1970 231 7,8% 16,043 1,941 29,443 135,546 24000
3 Stallet 3 Freehold 1970 170 10,6% 10,420 186 27,116 76,509 16000
TOTAL 573 9,2% 38,141 2,272 71,779 298,445 48000
* Currently being produced
Area (m2)
PROPERT Y PORTFOL IO
Breakdown of space Refurbished / Not refurbished Residential / Commercial
Refurbished 9%
Not refurbished 91%
Residential 94%
Commercial 6%
Studio 7%
1B 35%
2B 41%
3B 11%
4B/larger 0%
Other 6%
106 D. Carnegie & Co AB (publ) Annual Report 2016

3
2
1
Kista
Upplands Väsby
Märsta
Bro
Täby
Lidingö
TumbaSödertälje
Flemingsberg
Haninge
Visättra
Flemingsberg
STOCKHOLM
21
3
E18
E18
E4
E4
Sollentuna
Solna 226
226
Flemingsberg Station Rättscentrum
SödertörnKarolinskaHuddinge
PROPERT Y PORTFOL IO
Annual Report 2016 D. Carnegie & Co AB (publ) 107

Vårby/Vårberg
Vårby is a part of Huddinge Municipality and is part of the Stockholm metropolitan area. Vårberg lies immediately north of Vårby in the southwestern part of the munici-pality of Stockholm. Apartment buildings dominate both areas which are close to Lake Mälaren with recreational areas and beaches easily accessible. Public transport in the areas is excellent with a subway station on the line in to the city of Stockholm and the E4 highway close by. Skärholmen Center is also close by as well as the Kungens Kurva shopping area.
Summary of property portfolio
Nr Property designation Title Year built Number of
apartments
Percentage of refurbished apartments Residential
Miscella-neous
Undeveloped land
Tax value (SEK 000)
Building rights*
1 Bäckgården 1-7 Leasehold 1972/73 695 6,6% 47,215 4,366 73,757 381,076
2 Duvholmen 1 Leasehold 1968 168 0,6% 13,304 1,974 23,441 123,271
TOTAL 863 7,0% 60,519 6,340 97,198 504,347
* Currently being produced
Area (m2)
PROPERT Y PORTFOL IO
Breakdown of space Refurbished / Not refurbished Residential / Commercial
Refurbished 5%
Not refurbished 95%
Residential 91%
Commercial 6%
Studio 3%
1B 31%
2B 38%
3B 19%
4B/larger 0%
Other 9%
108 D. Carnegie & Co AB (publ) Annual Report 2016
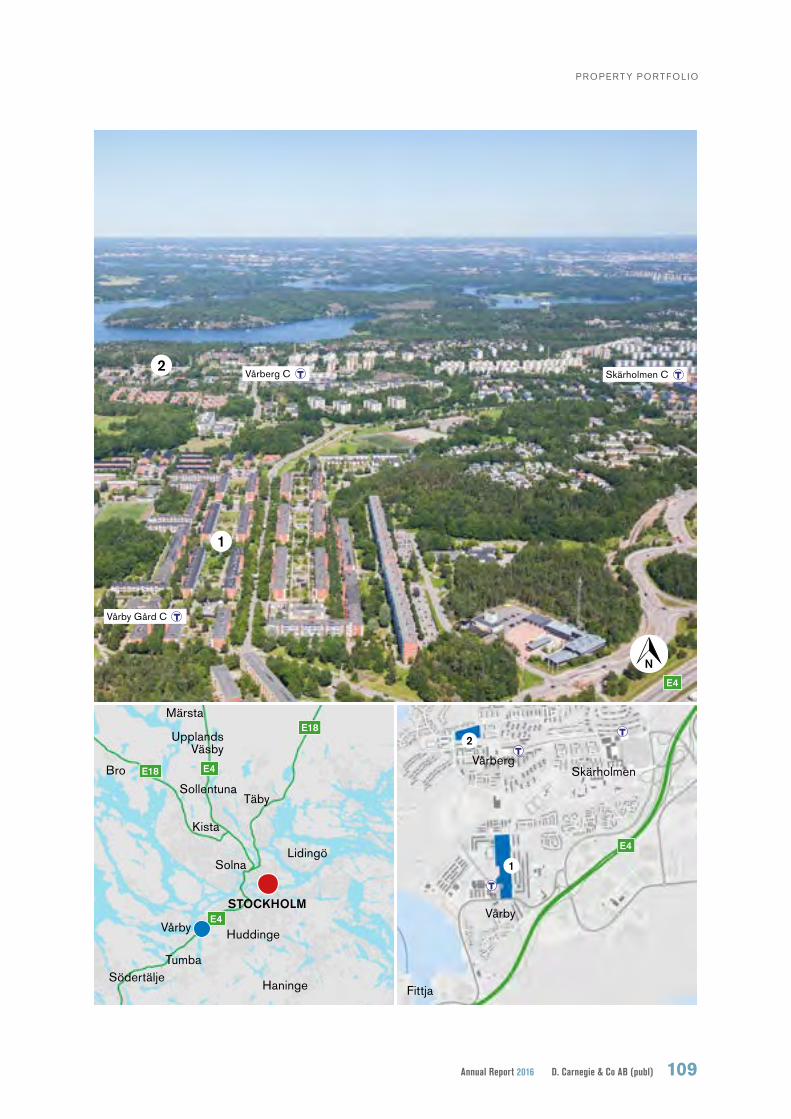
1
2
Kista
Upplands Väsby
Märsta
Bro
Täby
Lidingö
TumbaSödertälje
Vårby
Haninge
Vårby
Fittja
SkärholmenVårberg
STOCKHOLM
1
E18
E18
E4
E4
Sollentuna
Solna
Huddinge
E4
E4
2
Vårby Gård C
Vårberg C Skärholmen C
PROPERT Y PORTFOL IO
Annual Report 2016 D. Carnegie & Co AB (publ) 109

Jordbro
Jordbro is a municipal district in Haninge Municipality, Stockholm County, with about 9,500 inhabitants. The community offers efficient public and commercial services, a well-developed child care system and elementary schools, as well as a vibrant busi-ness community. Efficient communications include the commuter train to Stockholm and a modern highway network. Jordbro also offers scenic surroundings, nature reserves and sports facilities. Apartment buildings built in the 1950s, 1960s and 1970s dominate the south end of Jordbro, while the northern part consists mainly of single-family homes.
Summary of property portfolio
Nr Property designation Title Year built Number of
apartments
Percentage of refurbished apartments Residential
Miscella-neous
Undeveloped land
Tax value (SEK 000)
Building rights*
1 Kalvsvik 1:6 Freehold 1967 417 13,4% 34,778 5,011 68,184 306,229
2 Kalvsvik 11:4 Freehold 1970/71 425 12,0% 36,937 1,591 83,989 302,518
3 Kalvsvik 11:18 Freehold 1970 162 10,5% 11,277 246 25,885 95,094
4 Kalvsvik 11:23 Freehold 1970/71 228 10,5% 16,827 1,543 39,282 145,389
5 Kalvsvik 11:35 Freehold 1972 349 14,3% 23,616 889 46,787 207,052
6 Kalvsvik 11:1083 Freehold 211 19,0% 13,813 212 26,822 118,990
7 Kalvsvik 11:1084 Freehold 162 10,5% 10,582 514 24,696 91,039
TOTAL 1 954 13,1% 147,830 10,006 315,645 1,266,311
* Currently being produced
Area (m2)
PROPERT Y PORTFOL IO
Breakdown of space Refurbished / Not refurbished Residential / Commercial
Refurbished 13%
Not refurbished 87%
Residential 94%
Commercial 6%
Studio 4%
1B 27%
2B 47%
3B 12%
4B/larger 4%
Other 6%
110 D. Carnegie & Co AB (publ) Annual Report 2016

Kista
Upplands Väsby
Märsta
Bro
Täby
Lidingö
TumbaSödertälje
Jordbro
JordbroSTOCKHOLM
E18
E18
E4
E4
Sollentuna
Solna
Huddinge
73
73
Haninge
34
57
62
1
259
1
3
5
67
4
2
Jordbro Station
Jordbro Kyrka
PROPERT Y PORTFOL IO
Annual Report 2016 D. Carnegie & Co AB (publ) 111

Södertälje
Södertälje Municipality, with approximately 92,000 inhabitants, is strategically located in the Mälardalen and Greater Stockholm regions. There are many sports and cultural clubs, a vibrant commercial center, a strong business community and an efficient infrastructure, all within commuting distance to Stockholm. The Sörmland countryside also offers many green recreational areas. Two major enterprises in Sweden – Scania and Astra Zeneca – are located in Södertälje.
Summary of property portfolio
Nr Property designation Title Year built Number of
apartments
Percentage of refurbished apartments Residential
Miscella-neous
Undeveloped land
Tax value (SEK 000)
Building rights*
1 Åkervenen 3 Strandrågen 4 Rödvenen 4 Svingeln 2
Freehold 1968 596 11,2% 41,880 900 115,490 355,647
2 Vårbrodden 2 Freehold - - - - - 1,945 -
3 Grindstugan 1 Freehold 1968 131 12,2% 8,804 242 15,387 80,336
4 Topasen 6 Freehold 1972 237 13,9% 16,231 702 20,621 127,950
5 Sjöboden 1 Fäboden 3Hemmanet 4
Freehold 1969 752 11,7% 55,637 3,878 85,462 512,444
6 Gården 2 Freehold 1970 394 10,9% 29,349 2,340 38,725 258,440
7 Risevid 1:8** Freehold - - - - - 66,507 1,237
TOTAL 2,110 11,7% 151,901 8,062 277,630 1,334,817
* Currently being produced
** The property is located in Trosa (outside of the area pictured)
Area (m2)
PROPERT Y PORTFOL IO
Breakdown of space Refurbished / Not refurbished Residential / Commercial
Refurbished 12%
Not refurbished 88%
Residential 95%
Commercial 5%
Studio 6%
1B 28%
2B 39%
3B 19%
4B/larger 3%
Other 5%
112 D. Carnegie & Co AB (publ) Annual Report 2016

Kista
Upplands Väsby
Märsta
Bro
Täby
Lidingö
TumbaSödertälje
Flemingsberg
Haninge
Ronna
GenetaSÖDERTÄLJE
Fornhöjden
STOCKHOLM
1
2
3
5
6
4
E18
E18
E20E4
E4
E4
E4
Sollentuna
Solna
35
41 2
6
E4Södertälje C
Strängnäsvägen
PROPERT Y PORTFOL IO
Annual Report 2016 D. Carnegie & Co AB (publ) 113

Bro
Upplands-Bro is located in the heart of Mälardalen and is sometimes described as one of Stockholm’s most scenic municipalities. There are 130 kilometers of shoreline along Lake Mälaren and an archipelago with about 50 islands, creating opportunities for high-quality living. This location is popular among families with children, seniors and students. Thanks to a growing industry and business community, fewer and fewer of the municipality’s approximately 25,000 residents have to commute from the municipality for work. Upplands-Bro is investing in improving the business environment and continually attracting new people and businesses to the community.
Summary of property portfolio
Nr Property designation Title Year built Number of
apartments
Percentage of refurbished apartments Residential
Miscella-neous
Undeveloped land
Tax value (SEK 000)
Building rights*
1 Finnsta 1:11-1:12 Freehold 1973 187 11,8% 13,348 738 32,333 119,714
2 Finnsta 1:13 Freehold 1974 353 7,9% 27,164 1,221 83,381 241,681
3 Finnsta 1:14-1:17 Freehold 1975 - - - 1,281 5,458 5,161
TOTAL 540 9,3% 40,512 3,240 121,172 366,556
* Currently being produced
Area (m2)
PROPERT Y PORTFOL IO
Breakdown of space Refurbished / Not refurbished Residential / Commercial
Refurbished 9%
Not refurbished 91%
Residential 97%
Commercial 3%
Studio 1%
1B 30%
2B 46%
3B 15%
4B/larger 2%
Other 7%
114 D. Carnegie & Co AB (publ) Annual Report 2016

Kista
Upplands Väsby
Märsta
Bro
Täby
Lidingö
Tumba
Flemingsberg
Haninge
STOCKHOLM3
12
E18
E18
E4
E4
Sollentuna
Solna
Södertälje
E18
E18
1
3
2
Bro
Bro Station
Bro Centrum
PROPERT Y PORTFOL IO
Annual Report 2016 D. Carnegie & Co AB (publ) 115

Märsta
Märsta is the main community of Sigtuna Municipality, Stockholm County, located halfway between Uppsala and Stockholm. People have lived and worked here for over 1,000 years, and today Sigtuna is a central location for business and cultural initiati-ves. About 24,000 people live here. Good communications include proximity to Arlanda Airport, the E4 highway and the railway station. Proximity to both Uppsala and Stockholm have contributed to the town’s expansion and make the municipality ideal for start-up companies. Sigtuna Municipality is in fourth place in terms of number of nights spent in hotels in Sweden.
Summary of property portfolio
Nr Property designation Title Year built Number of
apartments
Percentage of refurbished apartments Residential
Miscella-neous
Undeveloped land
Tax value (SEK 000)
Building rights*
1 Märsta 1:167 Freehold 1962 362 7.5% 23,776 3,143 50,108 214,006
2 Valsta 3:8 Freehold 1967 331 8.2% 25,999 4,344 49,415 233,643
TOTAL 693 7.8% 49,775 7,487 99,523 447,649
* Currently being produced
Area (m2)
PROPERT Y PORTFOL IO
Breakdown of space Refurbished / Not refurbished Residential / Commercial
Refurbished 8%
Not refurbished 92%
Residential 87%
Commercial 13%
Studio 6%
1B 25%
2B 40%
3B 16%
4B/larger 1%
Other 13%
116 D. Carnegie & Co AB (publ) Annual Report 2016

Kista
Upplands Väsby
Märsta
Täby
Lidingö
Tumba
Flemingsberg
Haninge
STOCKHOLM 2
1
E18
E18
E4
E4
E4
Sollentuna
Solna
Södertälje
E18
Bro
1
2
Märsta
E4
263
Märsta Station
Arlanda
Midgårdsvallen
PROPERT Y PORTFOL IO
Annual Report 2016 D. Carnegie & Co AB (publ) 117

Uppsala
Uppsala is Sweden’s fourth largest municipality with over 200,000 inhabitants. The population is continuously growing – in recent years at a rate of 3,000 to 4,000 people per year. With its proximity to Stockholm (67 kilometers) and Arlanda (35 kilometers), Uppsala occupies a strategic geographical position. The city offers a wide range of cultural, sports, services and commercial amenities. Uppsala is one of the world’s foremost science hubs, with two highly ranked universities and University Hospital, which is the regional hospital. These facilities have created opportunities for advanced research, resulting in a number of successful companies in fields such as biomedicine and IT.
Summary of property portfolio
Nr Property designation Title Year built Number of
apartments
Percentage of refurbished apartments Residential
Miscella-neous
Undeveloped land
Tax value (SEK 000)
Building rights*
1 Valsätra 33:1 Freehold 1970 297 8,1% 21,458 2,393 49,322 153,586
2 Valsätra 19:1, 34:1 Freehold 1969 162 9,3% 12,479 347 30,054 81,724
3 Valsätra 36:3 Freehold 1971 32 0,0% 2,154 1,805 4,039 0
4 Valsätra 34:3, 40:1 Freehold 1970 174 10,9% 11,808 702 29,182 79,871
5 Valsätra 36:1, 36:2, 36:4 Freehold 1971 303 11,9% 19,450 2,913 43,132 139,498
TOTAL 968 9,7% 67,349 8,160 155,729 454,679
* Currently being produced
Area (m2)
PROPERT Y PORTFOL IO
Breakdown of space Refurbished / Not refurbished Residential / Commercial
Refurbished 10%
Not refurbished 90%
Residential 91%
Commercial 9%
Studio 4%
1B 31%
2B 36%
3B 21%
4B/larger 0%
Other 9%
118 D. Carnegie & Co AB (publ) Annual Report 2016

Valsätra
UPPSALA
24
51
3
E4
1
5
4 3
2
Uppsala C
Valsätraskolan
Gottsunda C ➔
PROPERT Y PORTFOL IO
Annual Report 2016 D. Carnegie & Co AB (publ) 119

Strängnäs
Strängnäs is centrally located in the expanding Mälardalen region. Residents enjoy both small-town charm and proximity to the collective range of opportunities of the Greater Stockholm region. Many people and businesses are attracted to Strängnäs because of its central location. Its rich and diverse economy includes an array of small businesses and pharmaceutical companies, as well as the electronics industry and more traditional industries. Strängnäs is also ranked as one of Sweden’s best logistics hubs with shipping to Mälardalen and the Greater Stockholm region.
Summary of property portfolio
Nr Property designation Title Year built Number of
apartments
Percentage of refurbished apartments Residential
Miscella-neous
Undeveloped land
Tax value (SEK 000)
Building rights*
1 Bonden 12-14 Freehold 1976/77 101 8,9% 6,514 4,708 10,573 92,118
2 Läraren 11 Freehold 1986 42 0,0% 2,910 512 4,104 29,213
3 Åkern 1-5 Freehold 1980 76 18,4% 5,438 433 7,212 59,694
4 Åkern 16 Freehold 1977 30 6,7% 2,297 332 2,629 24,330
5 Järpen 1, 3, 4 Freehold 1966/70 162 12,3% 10,717 1,630 24,743 94,556
TOTAL 411 11,9% 27,876 7,615 49,261 299,911
* Currently being produced
Area (m2)
PROPERT Y PORTFOL IO
Breakdown of space Refurbished / Not refurbished Residential / Commercial
Refurbished 7%
Not refurbished 93%
Residential 79%
Commercial 21%
Studio 10%
1B 24%
2B 25%
3B 16%
4B/larger 4%
Other 21%
120 D. Carnegie & Co AB (publ) Annual Report 2016

STRÄNGNÄS
1
4
3
2
5
4 2 13
5
E20
Strängnäs Station
SträngnäsDomkyrka
Visholmen
PROPERT Y PORTFOL IO
Annual Report 2016 D. Carnegie & Co AB (publ) 121

Eskilstuna
Eskilstuna is located about 110 kilometers of Stockholm in the heart of Söderman-land. With approximately 100,000 inhabitants and a strong industrial tradition, Eskil-stuna is one of Mälardalen’s fastest growing cities. This growth places high demands on new and attractive housing for both current and new residents. The area includes a college, efficient infrastructure, a well-developed business community and a good cooperative climate. Eskilstuna also offers a wide range of services, culture, sports, and commercial amenities as well as scenic areas. Summary of property portfolio
Nr Property designation Title Year built Number of
apartments
Percentage of refurbished apartments Residential
Miscella-neous
Undeveloped land
Tax value (SEK 000)
Building rights*
1 Notarien 7 Leasehold 1965 160 12,5% 12,340 184 10,732 89,329
2 Notarien 8 Leasehold 1966 56 8,9% 4,924 157 3,459 35,748
3 Notarien 9 Leasehold 1966 104 14,4% 7,418 90 8,491 52,820
4 Notarien 11 Leasehold 1966 104 15,4% 7,417 397 11,595 54,664
5 Notarien 12 Leasehold 1966 103 9,7% 8,242 501 8,642 61,001
6 Navigatören 2 Leasehold 1964 80 11,3% 5,484 172 6,479 39,634
7 Navigatören 3 Leasehold 1964 80 13,8% 5,503 141 6,503 38,648
8 Nålsögat 3 Freehold 0 0 0 0 0 22,432 5,000 30 000
9 Nybyggaren 9 Freehold 1981 60 3,3% 4,292 265 3,236 37,108
10 Nybyggaren 10 Freehold 1978 62 11,3% 4,838 531 3,415 42,628
11 Nybyggaren 11 Freehold 1979 86 3,5% 6,423 481 5,666 56,697
12 Serganten 8 Freehold 1937/87 18 11,1% 1,088 90 1,319 10,132
13 Venus 8-9 Freehold 1929/82 28 0,0% 1,611 268 1,859 14,412
14 Granaten 2 Freehold 1937 15 0 1,069 8 1,254 6,521
15 Granaten 3 Freehold 1937 13 0 1,112 0 1,309 6,708
16 Vaksamheten 8 Freehold 1987 29 0,0% 2,101 3,338 2,516 48,561
17 Flintan 14 Freehold 1978 40 15,0% 2,420 80 2,140 20,342
18 Fäktaren 1 Freehold 1979 25 16,0% 2,074 92 1,223 15,756
19 Fäktaren 3 Freehold 1961/93 21 19,0% 1,580 1,267 1,077 15,023
20 Fäktaren 4 Freehold 1955/93 22 0,0% 1,526 103 966 13,931
21 Fäktaren 5 Freehold 1955/80 15 6,7% 1,064 0 940 9,194
22 Fäktaren 6 Freehold 1958 30 16,7% 1,633 73 1,106 12,873
23 Fakiren 7 Freehold 1970 176 11,9% 10,316 296 4,038 82,622
24 Friheten 5 Freehold 1945/86 25 20,0% 1,686 150 890 14,264
25 Friheten 11 Freehold 1974 305 13,4% 16,078 1,953 9,020 133,538
26 Favören 1 Freehold 1975 82 17,1% 4,663 264 2,904 38,199
27 Fuxen 11 Freehold 1940 80 0 4,162 2,099 7,931 43,721
28 Forsbomsvreten 16&20 Freehold 1963 36 16,7% 2,677 111 3,533 22,052
29 Forsbomsvreten 21 Freehold 1964 12 8,3% 876 107 1,456 7,244
30 Forsbomsvreten 22 Freehold 1968 48 12,5% 3,963 467 5,458 33,070
31 Frimuraren 8 Freehold 1991 21 0,0% 1,630 226 3,230 15,253
32 Taggsvampen 15 Freehold 1944 12 0 516 71 645 3,742
33 Taggsvampen 19 Freehold 1950 8 0 449 25 561 3,380
34 Taggsvampen 20 Freehold 1950 8 0 519 35 649 3,870
TOTAL 1,964 10,9% 131,694 14,041 146,674 1,087,685 30 000
Area (m2)
* Currently being produced
PROPERT Y PORTFOL IO
122 D. Carnegie & Co AB (publ) Annual Report 2016

ESKILSTUNA
6
1
89
12
31
32
26
16
13
1415
17222120
1918
2325
30 2928
24
27
11 10
23 4
57
12
31
32
3334
10811
61
171415
181921 25
13
30292824
16
27
202322 26
2 3 4 57 9
E20
3433
Eskilstuna CTunavallen
PROPERT Y PORTFOL IO
Breakdown of space Refurbished / Not refurbished Residential / Commercial
Refurbished 11%
Not refurbished 89%
Residential 90%
Commercial 10%
Studio 8%
1B 32%
2B 36%
3B 21%
4B/larger 0%
Other 9%
Annual Report 2016 D. Carnegie & Co AB (publ) 123

Katrineholm
Katrineholm is an attractive municipaltiy situated in Södermanland with less than an hour commute by train to central Stockholm and two hours to Gothenburg. The communications are very good as the west and south main train lines connect here.
In combination with the connection to the highway network makes Katrineholm perfect from a transport and commuting view. Positively affecting the municipality’s attractivenes. Katrineholm had a total of 33,000 inhabitants in 2016.
Summary of property portfolio
Nr Property designation Title Year built Number of
apartments
Percentage of refurbished apartments Residential
Miscella-neous
Undeveloped land
Tax value (SEK 000)
Building rights*
1. Syrenen 8 Freehold 1961 93 1,1% 5,731 599 6,628 31,167
2. Vinrankan 4 Freehold 1952 21 0% 1,641 186 3,611 8,559
3. Vinrankan 8 Freehold 1955 30 3,3% 1,917 414 3,843 10,754
4. Linden 22 Freehold 1962 70 1,4% 4,067 1,216 4,290 27,682
5. Oliven 3 Freehold 1976 15 0% 1,148 0 1,074 6,122
6. Hagtornen 11 Freehold 1964 49 2,0% 3,342 0 2,721 18,252
7. Apeln 5 Freehold 1970 54 0% 3,501 43 4,207 18,957
8. Pionen 4 Freehold 1992 36 0% 3,158 1,764 2,182 32,930
9. Humlen 1 Freehold 1927 7 0% 1,059 876 1,101 7,443
10. Katrineholm 5:8&5:9 Freehold 18 0% 1,352 2,639 2,243 22,082
11. Nejlikan 4 Freehold 0 0% 0 651 912 1,765
12. Nejlikan 16&17 Freehold 57 0% 3,855 2,551 4,019 38,600
13. Prästkragen 28 Freehold 1968 102 1,0% 7,578 721 12,107 41,345
14. Hämplingen 3 Freehold 1940 4 0% 224 0 754 1,232
15. Hämplingen 18 Freehold 1970 77 2,0% 5,806 137 9,122 29,665
16 Sädesärlan 11 Freehold 1987 0 0% 0 133 1,055 214
17. Nålen 5 Freehold 1966 84 3,6% 5,857 133 11,850 26,143
TOTAL 718 1,7% 50,318 10,809 71,719 335,659
* Currently being produced
Area (m2)
PROPERT Y PORTFOL IO
Breakdown of space Refurbished / Not refurbished Residential / Commercial
Refurbished 2%
Not refurbished 98%
Residential 82%
Commercial 18%
Studio 7%
1B 22%
2B 40%
3B 12%
4B/larger 2%
Other 18%
124 D. Carnegie & Co AB (publ) Annual Report 2016

KATRINE-HOLM
1
4
32
5
68
10 1314
1516
17
12
11
9
7
12
348
10
1112
13
141516
9
67
17 Ligger i sydvästra Katrineholm (utanför bild) .
Katrineholm Station
PROPERT Y PORTFOL IO
Annual Report 2016 D. Carnegie & Co AB (publ) 125

Norrköping
D. Carnegie & Co has strong confidence in the real estate market in Östergötland. The property portfolio consists of approximately 1,900 apartments and a limited number of premises in the Hageby, Inner City and Marielund neighborhoods, which makes the Company one of the largest private property companies in Norrköping. Östergötland is a growing region where the city of Norrköping has much to offer. It is home to large industrial and commercial enterprises, as well as a growing university, and its strate-gic location includes Stockholm within commuting distance.
Summary of property portfolio
Nr Property designation Title Year built Number of
apartments
Percentage of refurbished apartments Residential
Miscella-neous
Undeveloped land
Tax value (SEK 000)
Building rights*
1 Plysaren 13 Freehold 1968 223 17,5% 18,298 242 2,046 159,108
2 Röken 22 Freehold 1967 119 30,3% 9,250 1,700 3,262 92,121
3 Porten 10 Freehold 115 19,1% 8,158 236 0 76,443
4 Porten 16 Freehold 470 17,4% 36,313 619 80,853 339,015
5 Valvet 1 Freehold 1960 367 12,5% 20,641 0 15,066 188,355
6 Dörren 12 & 14 Freehold 721 11,8% 46,873 600 98,021 428,249
7 Hambon 1 Freehold 1971 92 10,9% 9,388 20 29,716 85,074
8 Hambon 2 Freehold 1971 59 15,3% 6,051 0 42,000 54,800
9 Gavotten 1 Freehold 1972 18 0,0% 1,944 0 5,135 16,331
10 Kadriljen 1 Freehold 1972 27 25,9% 2,946 0 7,336 25,649
12 Mazurkan 1 Freehold 1972 27 18,5% 2,940 0 7,336 25,075
13 Menuetten 1 Freehold 1972 18 5,6% 1,950 0 7,419 16,944
11 Tangon 1 Freehold 1971 44 15,9% 4,468 76 15,632 41,770
TOTAL 2,300 14,6% 169,220 3,493 313,822 1,548,934
* Currently being produced
Area (m2)
PROPERT Y PORTFOL IO
Breakdown of space Refurbished / Not refurbished Residential / Commercial
Refurbished 15%
Not refurbished 85%
Residential 98%
Commercial 2%
Studio 5%
1B 23%
2B 42%
3B 19%
4B/larger 9%
Other 2%
126 D. Carnegie & Co AB (publ) Annual Report 2016

NORRKÖPING
Hageby 6
7 8910131311
1
2
5 34
6
7 910121311
8
3
1
5
2
4
Located in central Norrköping (North of the area pictured) .
Located in central Norrköping (North of the area pictured) .
E22 MirumGalleria
PROPERT Y PORTFOL IO
Annual Report 2016 D. Carnegie & Co AB (publ) 127

PROPERTY SPECIFICATION MUNICIPALITY TOTAL LEASEHOLD BUILDING SITE
Vaksamheten 8 Eskilstuna 1987 2,101 3,345 5,446
Nybyggaren 10 Eskilstuna 1978 4,838 531 5,369
Sergeanten 8 Eskilstuna 1937/87 1,088 90 1,178
Nålsticket 2 Eskilstuna 1994 - - -
Nybyggaren 11 Eskilstuna 1979 6,423 481 6,904
Nybyggaren 9 Eskilstuna 1981 4,292 265 4,557
Fäktaren 1 Eskilstuna 1979 2,074 92 2,166
Friheten 5 Eskilstuna 1945/86 1,686 150 1,836
Flintan 14 Eskilstuna 1978 2,420 80 2,500
Fäktaren 3 Eskilstuna 1961/93 1,580 1,267 2,847
Fäktaren 4 Eskilstuna 1955/93 1,526 103 1,629
Fäktaren 5 Eskilstuna 1955/80 1,064 0 1,064
Fäktaren 6 Eskilstuna 1958 1,633 73 1,706
Friheten 11 Eskilstuna 1974 16,078 1,953 18,031
Fakiren 7 Eskilstuna 1970 10,316 295 10,611
Favören 1 Eskilstuna 1975 4,663 264 4,927
Venus 8 Eskilstuna 1929/82 1,074 40 1,114
Venus 9 Eskilstuna 1929/82 537 228 765
Navigatören 2 Eskilstuna 1964 5,484 172 5,656 T
Navigatören 3 Eskilstuna 1964 5,503 141 5,644 T
Notarien 7 Eskilstuna 1965 12,340 184 12,524 T
Notarien 8 Eskilstuna 1966 4,924 157 5,081 T
Notarien 9 Eskilstuna 1966 7,418 90 7,508 T
Notarien 11 Eskilstuna 1966 7,417 397 7,814 T
Notarien 12 Eskilstuna 1966 8,242 501 8,743 T
Forsbomsvreten 16 Eskilstuna 1963 1,789 111 1,900
Forsbomsvreten 20 Eskilstuna 1963 888 0 888
Forsbomsvreten 21 Eskilstuna 1964 876 107 983
Forsbomsvreten 22 Eskilstuna 1968 3,963 467 4,430
Frimuraren 8 Eskilstuna 1991 1,630 226 1,856
Fuxen 11 Eskilstuna 1940 4,162 2,099 6,261
Granaten 2 Eskilstuna 1937 1,069 8 1,077
Granaten 3 Eskilstuna 1937 1,112 0 1,112
Taggsvampen 15 Eskilstuna 1944 516 71 587
Taggsvampen 19 Eskilstuna 1950 449 25 474
Taggsvampen 20 Eskilstuna 1950 519 35 554
Syrenen 8 Katrineholm 1961 5,731 5,731
Linden 22 Katrineholm 1962 4,067 1,216 5,283
Hagtornen 11 Katrineholm 1964 3,341 3,341
Nålen 5 Katrineholm 1966 5,857 133 5,990
Prästkragen 28 Katrineholm 1968 7,578 7,578
Apeln 5 Katrineholm 1970 3,501 43 3,544
Oliven 3 Katrineholm 1976 1,148 1,148
Hämplingen 3 Katrineholm 1940 224 224
Hämplingen 18 Katrineholm 1970 5,806 137 5,943
Pionen 4 Katrineholm 1992 3,158 1,764 4,922
Nejlikan 16 Katrineholm 1956/1959 1,956 951 2,907
Nejlikan 17 Katrineholm 1956/1959 1,899 1,699 3,598
BUILDING YEAR/ LETTABLE AREA, M² RENNOVATION RESIDENTIAL MISC.
PROPERTY SPECIFICATION
128 D. Carnegie & Co AB (publ) Annual Report 2016

PROPERTY SPECIFICATION MUNICIPALITY TOTAL LEASEHOLD BUILDING SITE
Nejlikan 4 Katrineholm 1938/1945 651 651
Sädesärlan 11 Katrineholm 0
Humlen 1 Katrineholm 1927 1,059 875 1,934
Katrineholm 5:8 Katrineholm 1920/1975/1977 1,352 1,442 2,794
Katrineholm 5:9 Katrineholm 1920/1975/1977 84 1,298 1,382
Vinrankan 4 Katrineholm 1952 1,641 186 1,827
Vinrankan 8 Katrineholm 1955 1,917 414 2,331
Bonden 12 Strängnäs 1976 3,854 564 4,418
Bonden 13 Strängnäs 1977 911 1,413 2,324
Bonden 14 Strängnäs 1977 1,749 2,731 4,480
Åkern 16 Strängnäs 1977 2,297 332 2,629
Läraren 11 Strängnäs 1986 2,910 512 3,422
Åkern 1 Strängnäs 1980 1,015 155 1,170
Åkern 3 Strängnäs 1979 3,116 109 3,225
Åkern 5 Strängnäs 1979 1,308 169 1,477
Järpen 1 Strängnäs 1966 3,638 1,401 5,039
Järpen 3 Strängnäs 1966 3,437 177 3,614
Järpen 4 Strängnäs 1970 3,642 52 3,694
Nålsticket 1 Eskilstuna - - - -
Nålsögat 3 Eskilstuna - - - -
Hällby-Ökna 1:46 Eskilstuna - - - -
Sättra Krog 1:3 Strängnäs - - - -
Risevid 1:8 Trosa - - - -
Flensby 6:98 Flen - - - -
Valsätra 33:1 Uppsala 1970 21,458 2,393 23,850
Valsätra 19:1 Uppsala 1969 - - - Garage and Parking
Valsätra 34:1 Uppsala 1969 12479 347 12,826
Valsätra 34:3 Uppsala 1970 11808 702 12,510
Valsätra 40:1 Uppsala 1970 - - - Garage and Parking
Valsätra 36:1 Uppsala 1971 18,613 2,913 21,526
Valsätra 36:2 Uppsala Leased - - -
Valsätra 36:4 Uppsala 1971 837 0 837
Valvet 1 Norrköping 1960 20,641 0 20,641
Dörren 12 Norrköping 1963/1968 42,361 600 42,961
Dörren 14 Norrköping 1963/1968 4,512 0 4,512
Röken 22 Norrköping 1967 9,250 1,700 10,950
Plysaren 13 Norrköping 1968 18,298 242 18,540
Porten 16 Norrköping 1967/1994 36,313 619 36,932
Hambon 1 Norrköping 1971 9,388 20 9,408
Hambon 2 Norrköping 1971 6,051 0 6,051
Tangon 1 Norrköping 1971 4,468 76 4,544
Gavotten 1 Norrköping 1972 1,944 0 1,944
Kadriljen 1 Norrköping 1972 2,946 0 2,946
Mazurkan 1 Norrköping 1972 2,940 0 2,940
Menuetten 1 Norrköping 1972 1,950 0 1,950
Porten 10 Norrköping 1968/1996 8,180 236 8,416
Märsta 1:167 Sigtuna 1962/1963 23,776 2,986 26,762
Valsta 3:8 Sigtuna 1977 25,995 4,344 30,343
BUILDING YEAR/ LETTABLE AREA, M² RENNOVATION RESIDENTIAL MISC.
Annual Report 2016 D. Carnegie & Co AB (publ) 129
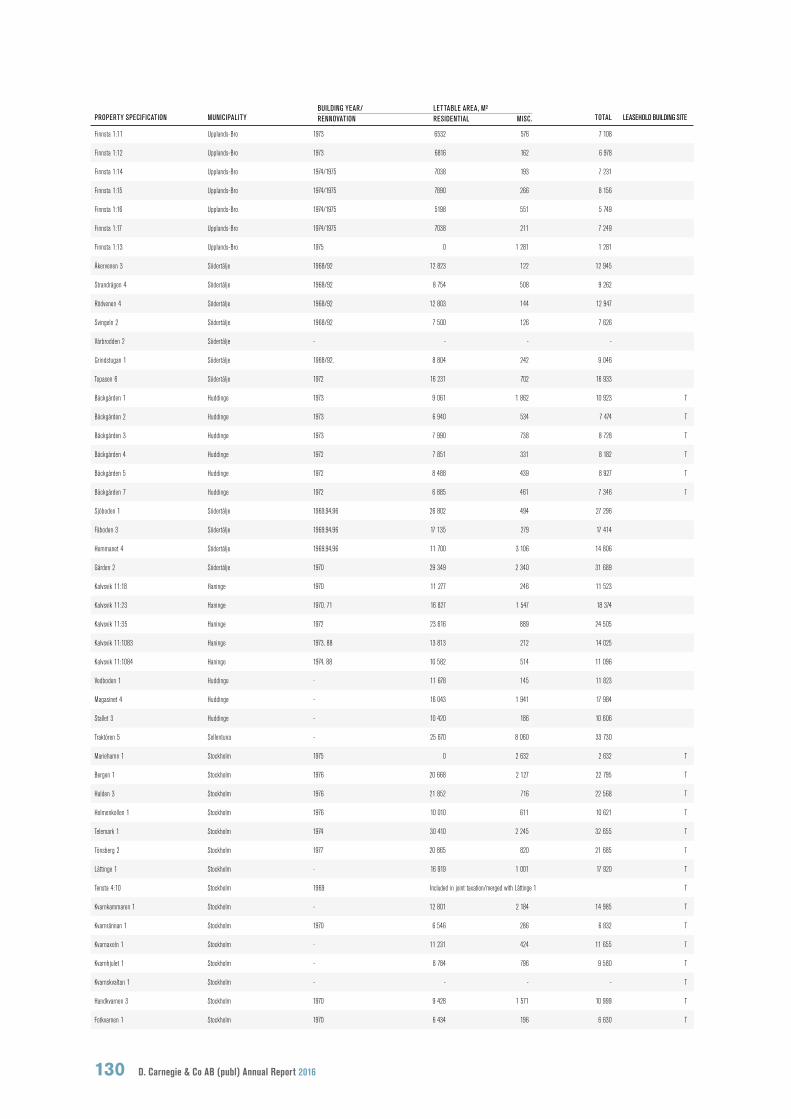
PROPERTY SPECIFICATION MUNICIPALITY TOTAL LEASEHOLD BUILDING SITE
Finnsta 1:11 Upplands-Bro 1973 6532 576 7 108
Finnsta 1:12 Upplands-Bro 1973 6816 162 6 978
Finnsta 1:14 Upplands-Bro 1974/1975 7038 193 7 231
Finnsta 1:15 Upplands-Bro 1974/1975 7890 266 8 156
Finnsta 1:16 Upplands-Bro 1974/1975 5198 551 5 749
Finnsta 1:17 Upplands-Bro 1974/1975 7038 211 7 249
Finnsta 1:13 Upplands-Bro 1975 0 1 281 1 281
Åkervenen 3 Södertälje 1968/92 12 823 122 12 945
Strandrågen 4 Södertälje 1968/92 8 754 508 9 262
Rödvenen 4 Södertälje 1968/92 12 803 144 12 947
Svingeln 2 Södertälje 1968/92 7 500 126 7 626
Vårbrodden 2 Södertälje - - - -
Grindstugan 1 Södertälje 1968/92, 8 804 242 9 046
Topasen 6 Södertälje 1972 16 231 702 16 933
Bäckgården 1 Huddinge 1973 9 061 1 862 10 923 T
Bäckgården 2 Huddinge 1973 6 940 534 7 474 T
Bäckgården 3 Huddinge 1973 7 990 738 8 728 T
Bäckgården 4 Huddinge 1972 7 851 331 8 182 T
Bäckgården 5 Huddinge 1972 8 488 439 8 927 T
Bäckgården 7 Huddinge 1972 6 885 461 7 346 T
Sjöboden 1 Södertälje 1969,94,96 26 802 494 27 296
Fäboden 3 Södertälje 1969,94,96 17 135 279 17 414
Hemmanet 4 Södertälje 1969,94,96 11 700 3 106 14 806
Gården 2 Södertälje 1970 29 349 2 340 31 689
Kalvsvik 11:18 Haninge 1970 11 277 246 11 523
Kalvsvik 11:23 Haninge 1970, 71 16 827 1 547 18 374
Kalvsvik 11:35 Haninge 1972 23 616 889 24 505
Kalvsvik 11:1083 Haninge 1973, 88 13 813 212 14 025
Kalvsvik 11:1084 Haninge 1974, 88 10 582 514 11 096
Vedboden 1 Huddinge - 11 678 145 11 823
Magasinet 4 Huddinge - 16 043 1 941 17 984
Stallet 3 Huddinge - 10 420 186 10 606
Traktören 5 Sollentuna - 25 670 8 060 33 730
Mariehamn 1 Stockholm 1975 0 2 632 2 632 T
Bergen 1 Stockholm 1976 20 668 2 127 22 795 T
Halden 3 Stockholm 1976 21 852 716 22 568 T
Holmenkollen 1 Stockholm 1976 10 010 611 10 621 T
Telemark 1 Stockholm 1974 30 410 2 245 32 655 T
Tönsberg 2 Stockholm 1977 20 865 820 21 685 T
Lättinge 1 Stockholm - 16 919 1 001 17 920 T
Tensta 4:10 Stockholm 1969 Included in joint taxation/merged with Lättinge 1 T
Kvarnkammaren 1 Stockholm - 12 801 2 184 14 985 T
Kvarnrännan 1 Stockholm 1970 6 546 286 6 832 T
Kvarnaxeln 1 Stockholm - 11 231 424 11 655 T
Kvarnhjulet 1 Stockholm - 8 784 796 9 580 T
Kvarnskvaltan 1 Stockholm - - - - T
Handkvarnen 3 Stockholm 1970 9 428 1 571 10 999 T
Fotkvarnen 1 Stockholm 1970 6 434 196 6 630 T
BUILDING YEAR/ LETTABLE AREA, M² RENNOVATION RESIDENTIAL MISC.
130 D. Carnegie & Co AB (publ) Annual Report 2016

FASTIGHETSBETECKNING KOMMUN TOTALT TOMTRÄTT
Fotkvarnen 2 Stockholm - Included in joint taxation/merged with Fotkvarnen 1, Hjulkvarnen 1-3, Rinkeby 1:2, 2:13, 2:14, Skvaltkvarnen
1-3 –
Hjulkvarnen 1 Stockholm 1970 5 215 763 5 978 T
Hjulkvarnen 2 Stockholm 1970 5 474 971 6 445 T
Hjulkvarnen 3 Stockholm - Included in joint taxation/merged with Fotkvarnen 1, Hjulkvarnen 1-3, Rinkeby 1:2, 2:13, 2:14, Skvaltkvarnen
1-3 T
Rinkeby 2:1 Stockholm - Included in joint taxation/merged with Fotkvarnen 1, Hjulkvarnen 1-3, Rinkeby 1:2, 2:13, 2:14, Skvaltkvarnen
1-4 T
Rinkeby 2:13 Stockholm - Included in joint taxation/merged with Fotkvarnen 1, Hjulkvarnen 1-3, Rinkeby 1:2, 2:13, 2:14, Skvaltkvarnen
1-5 T
Rinkeby 2:14 Stockholm - Included in joint taxation/merged with Fotkvarnen 1, Hjulkvarnen 1-3, Rinkeby 1:2, 2:13, 2:14, Skvaltkvarnen
1-6 T
Skvaltkvarnen 1 Stockholm 1970 8 496 453 8 949 T
Skvaltkvarnen 2 Stockholm 1970 4 557 36 4 593 T
Skvaltkvarnen 3 Stockholm - Included in joint taxation/merged with Fotkvarnen 1, Hjulkvarnen 1-3, Rinkeby 1:2, 2:13, 2:14, Skvaltkvarnen
1-6 T
Kvarnen 1 Stockholm 1969 6 183 867 7 050 T
Vattenkvarnen 1 Stockholm 1969 - - - T
BUILDING YEAR/ LETTABLE AREA, M² RENNOVATION RESIDENTIAL MISC.
Annual Report 2016 D. Carnegie & Co AB (publ) 131

FinanceRETURN ON EQUITY, per cent
Profit for the year in relation to average shareholders’ equity.
LOAN-TO-VALUE RATIO (LTV), per cent
Interest-bearing liabilities including net reported vendor notes after deductions for market value on listed share-holdings and cash and cash equivalents in relation to the fair value of the properties at the close of the period.
LOAN-TO-VALUE RATIO PROPERTIES (LTV), per cent
Interest-bearing liabilities with security in properties in relation to the fair value of the properties at the close of the period.
INTEREST COVERAGE RATIO, times
Income from property management plus financial costs (EBIT) in relation to financial costs.
EQUITY RATIO, per cent
Reported shareholders’ equity in relation to reported total assets at the close of the period.
EQUITY RATIO, ADJUSTED, per cent
Reported shareholders’ equity adjusted for the value of derivatives, goodwill and deferred tax liabilities.
PropertyDIRECT RETURN, per cent
Net operating income recalculated on an annual basis in relation to the average market value of themanagement properties during the period.
NET OPERATING INCOME, SEK ‘000
Total income minus bad debt losses, operating and maintenance costs, property administration, rents on leasehold interest in government owned land, and property taxes. The industry specific key figure, net ope-rating income, is reported as it shows the results from property management.
INCOME FROM PROPERTY MANAGEMENT, SEK ‘000
Profit before changes in value and taxes. The industry specific key figure, income from property management, is reported as it shows the company’s results excluding changes in value.
CHANGES IN VALUE IN MANAGEMENT PROPERTIES, SEK ‘000
Change in the fair value after deductions for investments made.
TOTAL RETURN, percent
Profit before tax in relation to market value of the pro-perty portfolio.
REALISED CHANGES IN VALUE IN MANAGEMENT PROPER-TIES, SEK ‘000
Property sales carried out after deductions for themost recent reported fair value of the properties and costs in conjunction with sale.
GROSS MARGIN, per cent
Net operating income as a percentage of total income.
SharesSHAREHOLDERS’ EQUITY PER SHARE, SEK
Shareholders’ equity in relation to the number of out-standing ordinary shares on the balance sheet date.
ADJUSTED SHAREHOLDERS’ EQUITY (EPRA NAV) PER SHARE, SEK
Reported shareholders’ equity adjusted for the value ofderivatives, goodwill and deferred tax liabilities, in relation to the number of outstanding ordinary shares on the balance sheet date.
PROFIT PER SHARE, SEK
Profit for the period after taxes in relation to the average number of outstanding ordinary shares prior to dilution.
PROFIT PER SHARE AFTER DILUTION, SEK
Profit for the period after tax in relation to the average number of outstanding ordinary shares, including full coverage and conversion of outstanding option program-mes and convertible subordinated loans. The convertible subordinated loans have been repaid 30June 2016. The calculation is performed in accordance with IAS 33.
From market practice regarding key figures, D. Carnegie & Co has selected the above key figures.
Definitions
132 D. Carnegie & Co AB (publ) Annual Report 2016

Q1 Report April 28, 2017
Annual general meeting May 10, 2017
Q2 Report July 14, 2017
Q3 Report October 27, 2017
Year-end report 2017 February 23, 2018
Calender 2017–2018
Annual Report 2016 D. Carnegie & Co AB (publ) 133

D. Carnegie & Co AB (publ) Engelbrektsplan 1 114 34 Stockholm dcarnegie.se
D. C
AR
NEG
IE & C
O Å
RS
RED
OV
ISN
ING
20
16