JEFFERIES 2012 GLOBAL ENERGY CONFERENCE · Relative Valuation Discount Market Share Growth ... both...
18
JEFFERIES 2012 GLOBAL ENERGY CONFERENCE November 29, 2012
Transcript of JEFFERIES 2012 GLOBAL ENERGY CONFERENCE · Relative Valuation Discount Market Share Growth ... both...

JEFFERIES 2012 GLOBAL ENERGY CONFERENCE
November 29, 2012
Forward-looking StatementsForward-looking Statements
2
Certain statements made over the course of this presentation may constitute forward-looking statements, including statements regarding the markets in which we operate, the demand for our products and services and the advantages of our services compared to others. Although we believe that the expectations reflected in the forward-looking statements are reasonable, we cannot guarantee future results, levels of activity, performance or other achievements. Actual results may differ materially from the results anticipated by these forward-looking statements, which apply only as of the date of this presentation, as a result of various important factors, including those described in Item 1A of our Annual Report filed on Form 10-K for the fiscal year ended December 31, 2011 and other reports filed with the Securities and Exchange Commission. If one or more of these factors materialize, or if any underlying assumptions prove incorrect, our actual results, performance or achievements may vary materially from any future results, performance or achievements expressed or implied by these forward-looking statements. We disclaim any obligation to update any forward-looking statement for subsequently occurring events or circumstances.
In addition to U.S. GAAP financials, this presentation includes certain non-GAAP financial measures. These non-GAAP measures are in addition to, not a substitute for or superior to, measures of financial performance prepared in accordance with GAAP. Definitions of these non-GAAP measures and reconciliations between certain GAAP and non-GAAP measures are included in the appendix to this presentation.

RigNet Investment HighlightsRigNet Investment Highlights
3
Strong Organic Growth within the Oil and Gas Industry
Growing and Attractive Market Runway
High Operating Leverage / Free Cash Flow
Relative Valuation Discount
Market Share Growth
Founded in 2001, RigNet (NASDAQ: RNET) is a leading provider of remote communications, systems integration and collaborative applications to the oil and gas industry, both offshore and onshore, around the world

Providing Reliable, Remote Communications for the Life of the Oil FieldProviding Reliable, Remote Communications for the Life of the Oil Field
4
Offshore Rigs
Offices
Onshore Rigs
Completion and
Production
Energy Maritime
Communications for the Life of the Oil Field The oil and gas industry is remote,
mobile and variable, with the
reliance on technology greater
than ever.
RigNet provides managed
communications services that free
customers to focus on finding and
producing oil and gas:
• Reliable communications
around the world, supporting
rig productivity, safety and
crew welfare
• Technology flexibility –
providing best-of-breed
solutions that best meet
customers’ needs
• Local customer support for
rapid deployment and
resolution

RigNet Business ModelRigNet Business Model
5
U.S.32%
International68%
Offshore82%
Onshore18%
• Provide mission critical remote communications services to the oil and gas industry, principally on offshore drilling rigs that are mobile and becoming increasingly remote in the search for oil and gas
• Majority of revenues from recurring, multi-tenant revenue model under long-term contracts
• Revenue growth from sites added as well as ARPU growth from secondary customers and industry-leading value-added services
• Provide managed services to 1,000+ sites in 30+ countries on six continents1
• Partner with our customers’ IT departments to serve remote end users, develop new services and allow customers to focus on finding and producing oil and gas
• Purposefully not as backward-integrated as others, which allows for best-of-breed solutions and success-based capex at the edge
• Low customer churn, stable end-user pricing and high barriers-to-entry
(1) As of September 30, 2012
Global, Diversified Presence
Note: As of December 31, 2011. Offshore represents Eastern and Western Hemispheres; onshore represents U.S. Land as reported in Company filings.
U.S. Service Centers

Growing and Attractive Market RunwayGrowing and Attractive Market Runway
RigNethas multiple
runways to grow in the remote
communications industry
IncreasePenetration of
Secondary Customers
Cu
mu
lative Retu
rn
Drillers
Operators
Service Companies
Pay-Per-Use
ExpandPenetration of Value Added
Services
Remote Video
TurboNet
Wi-Fi Hotspot
IncreaseHorizontal
Footprint of Drilling Rigs
Number of Rigs
Focus on Growing ARPU
Today Future
Extend intoAdjacentVerticals
Production / Vessels
General Maritime
Government / Military
Mining / Engineering / Construction
Mega-trends Driving Remote Communications
� Integrated operations� ERP applications at the edge� Crew welfare� Remote video� Heightened safety regulations
Leveraging Organic and Inorganic Opportunities to Grow

7
Bandwidth Needs Growing at the EdgeBandwidth Needs Growing at the Edge
Source: Various; Company analysis
Total Oil & Gas VSAT Market
2012 – 2017
Bandwidth: Gbps
Key drivers
• Video-related services
• Integrated operations• Overseeing and directing offshore activities from
onshore decision centers
• Safety focus / increased regulatory oversight• Aftermath of BP Macondo spill
• Crew welfare• Keeping crews happy in their off hours
• Ultra-deep water exploration• More remote, harsh and complex
• Average bandwidth per offshore rig expected
to increase from 1.0 Mbps in 2012 to 2.2
Mbps in 2017
• Favorable technology changes in downhole
communications and satellite backhaul
(high-throughput satellites)
2.6
3.0
3.4
4.1
5.3
7.0
2012 2013 2014 2015 2016 2017

Ultra-Deep Water (UDW) Markets Expanding, Driving the Need for Reliable Remote CommunicationsUltra-Deep Water (UDW) Markets Expanding, Driving the Need for Reliable Remote Communications
RigNet POP RigNet Network ConnectionRigNet Offices RigNet Teleport RigNet CoreHUB
(1) Current UDW activity defined as rigs with 7,500+ water depth capability and contracted as of November 26, 2012.(2) Visible supply includes rigs with 7,500+ water depth capability either currently under construction, planned or on order.Source: IHS-Petrodata RigBase Current Activity Data (November 26, 2012)
Future UDW Rig Supply2
39
34
178
8
3
3
2
2
1
Current UDW Activity1
• UDW drilling is more complex and remote with high safety, operational and
performance requirements
• Additional UDW markets are expanding, which requires robust, remote communications in new areas
• UDW rig supply growing to meet demand
127 127 127 127 127 127
2445 52 62 71
127
151
172179
189198
Delivered 2013 2014 2015 2016 2017
Delivered Visible SupplyExisting UDW
MarketsEmerging UDW
Markets
8

9
Market Runway Tripled with Nessco AcquisitionMarket Runway Tripled with Nessco Acquisition
Source: Various; Company analysis
300
300
500 1,100
Rigs Systems
Integration
Production Potential Market
Transaction Details
Acquisition Rationale and Synergies
• Nessco is a leader in telecommunications systems
integration (SI) for the oil and gas industry, an estimated
$300MM market with an 11% growth rate
• Nessco designs, builds, installs and commissions complex
telecommunications systems for offshore and onshore oil
and gas production facilities, providing RigNet a key entry
point into the offshore production vertical
• Nessco’s business to benefit from RigNet’s global footprint,
larger scale, customer relationships and access to capital
• RigNet strengthens its competitive position with systems
integration capabilities and a growth runway into the oil and
gas production market
• All cash purchase price of $48.9m (£31.1m) or 6.7x FY 2012
EBITDA
• Entered into an amended credit facility that provides both a
$66.4m term facility and $10.0m revolving facility
• Pro forma EBITDA leverage ratio is approximately 1.5x
On July 05, 2012, announced the acquisition of
Nessco Group Holdings Ltd (Nessco) in Aberdeen
US$ millions
Overview of Core Drilling Rig MarketOverview of Core Drilling Rig Market
10
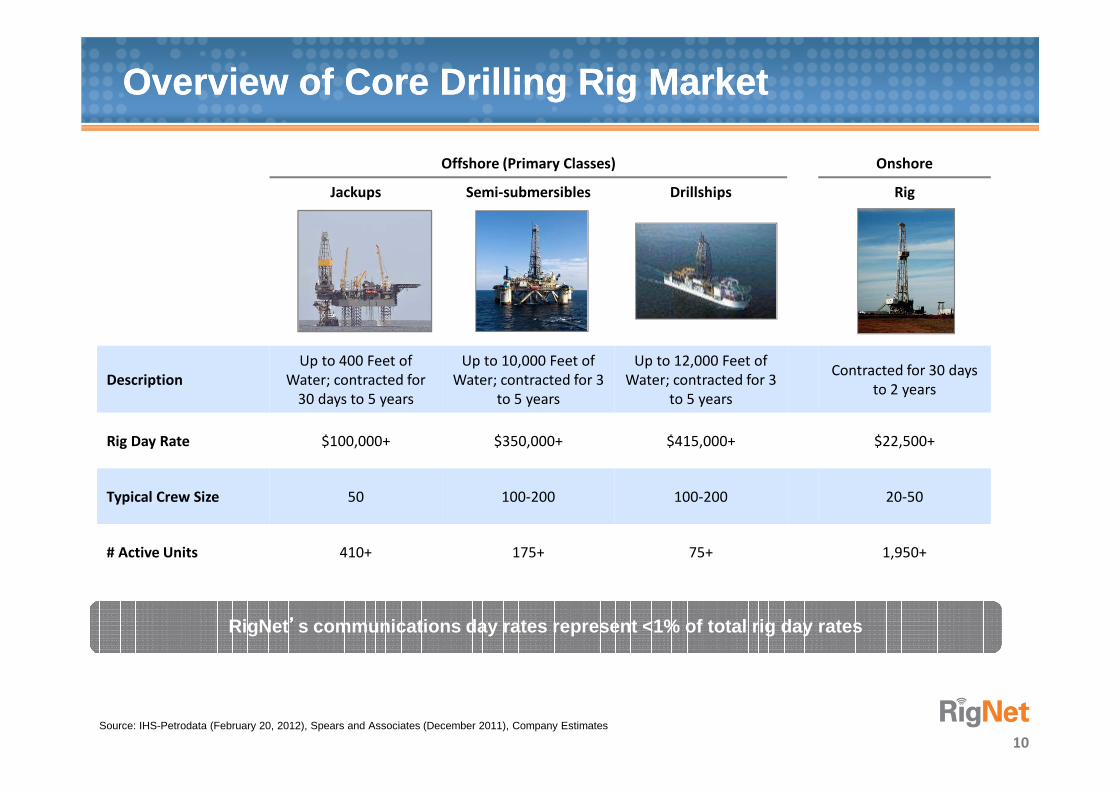
Offshore (Primary Classes) Onshore
Jackups Semi-submersibles Drillships Rig
Description
Up to 400 Feet of
Water; contracted for
30 days to 5 years
Up to 10,000 Feet of
Water; contracted for 3
to 5 years
Up to 12,000 Feet of
Water; contracted for 3
to 5 years
Contracted for 30 days
to 2 years
Rig Day Rate $100,000+ $350,000+ $415,000+ $22,500+
Typical Crew Size 50 100-200 100-200 20-50
# Active Units 410+ 175+ 75+ 1,950+
RigNet’’’’s communications day rates represent <1% of total rig day rates
Source: IHS-Petrodata (February 20, 2012), Spears and Associates (December 2011), Company Estimates

Overview of Oil and Gas Step-out MarketsOverview of Oil and Gas Step-out Markets
11
Production Energy Maritime International Land SOIL
Fixed Floating Vessels Rigs OFSCorporate
Networks
Description
Manned and
Unmanned
installations,
MOPU
FPSO/FSO,
TLP/Spars, Semis,
FLNG
Supply, Seismic,
Support and
Construction
Land based rigs
outside of the
United States
Man Camps,
Remote Offices,
Wireline Trucks,
etc.
Collaborative
Oil & Gas
Extranet
# Active Units 9,000+ 330+ 3,400+ 3,100+ N/A N/A
Customer
Value Proposition
Provide reliable communications to same
customers after the drilling campaign
Provide global
connectivity for
vessels that work
specifically in O&G
markets
Provide enterprise grade
communications anywhere our
customers drill
Allow secure,
reliable sharing
of information,
applications
Investor ImpactLong term contracts leveraging same
infrastructure and solutions
Leverage economies
of scale in highest
margin maritime
segment
Extend successful US Land model to
more stable market segment
Differentiated
offering
Source: IHS-Petrodata (September 2011), Baker Hughes (January 2012), Company estimates

Blue-chip Customer BaseBlue-chip Customer Base
12
Drilling Companies Operators Service Companies
Top 10 customers accounted for 37% of 2011 revenue
BruneiShell
Diverse customer base with no excessive concentration
History of Strong GrowthHistory of Strong Growth
13
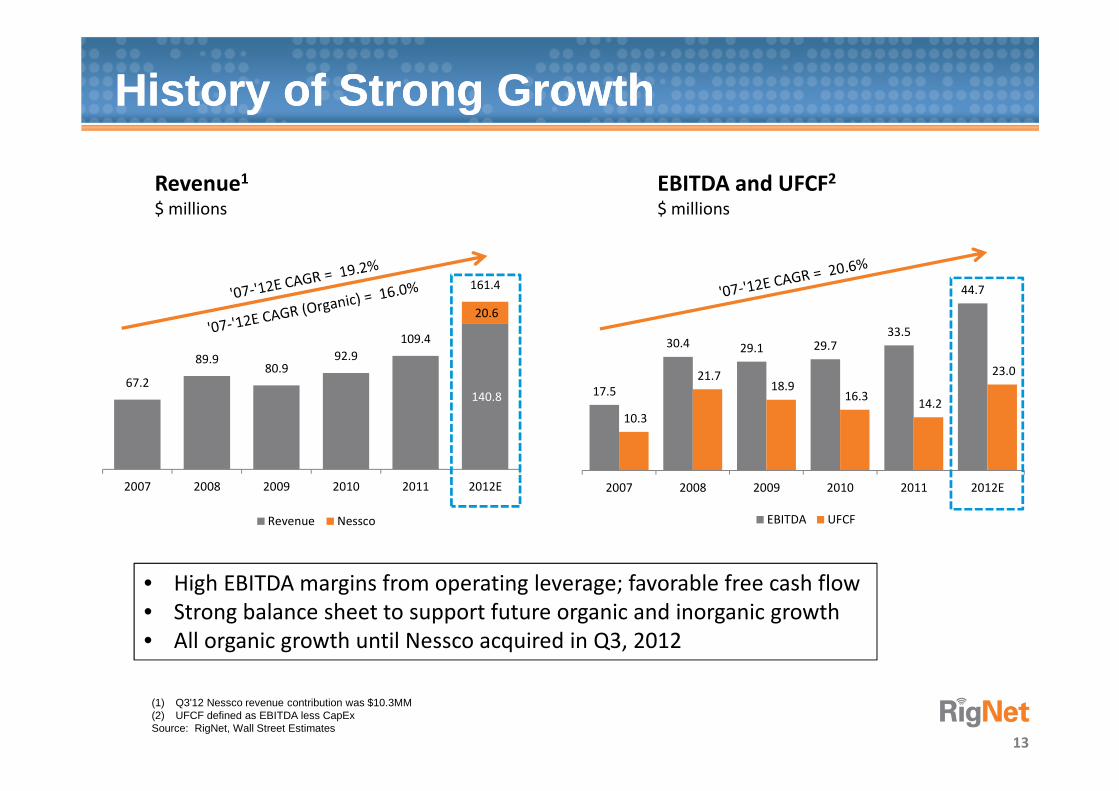
Revenue1
$ millions
(1) Q3'12 Nessco revenue contribution was $10.3MM(2) UFCF defined as EBITDA less CapExSource: RigNet, Wall Street Estimates
• High EBITDA margins from operating leverage; favorable free cash flow
• Strong balance sheet to support future organic and inorganic growth
• All organic growth until Nessco acquired in Q3, 2012
EBITDA and UFCF2
$ millions
140.8
20.6
67.2
89.9 80.9
92.9
109.4
161.4
2007 2008 2009 2010 2011 2012E
Revenue Nessco
17.5
30.4 29.1 29.7 33.5
44.7
10.3
21.7 18.9
16.3 14.2
23.0
2007 2008 2009 2010 2011 2012E
EBITDA UFCF

7%15%
22%30%
51%48%
45%43%
42% 37% 33% 27%
100% 100% 100% 100%
2005 2007 2009 2011
RigNet Harris CapRock Others
(15%)
(8%)
23%
Growth Driven by Market Share GainsGrowth Driven by Market Share Gains
14
Global Market Share – Offshore Rigs
2005 - 2011
• RigNet is the only major provider to have grown market share in offshore rigs over the
past few years – RigNet’s managed services model is preferred to transport providers
• RigNet delivers on criteria important to demanding oil and gas customers
• RigNet is the last remaining independent global provider of remote communications to
the oil and gas industry after recent provider consolidation wave
Source: Various; Company analysis
Industry Ranking vs. Key Success Criteria
Global Footprint Strong
Value-Added
SolutionsStrong
Network
ReliabilityStrong
Customer
SupportStrong
∆ ’05-’11

15
Valuation Upside PotentialValuation Upside PotentialEV / EBITDA 2013 Multiples
for Peer Groups
RigNet is being valued at a discount relative to peer groups, measured both as a multiple of
EBITDA and as a multiple of free cash flow
Note: numbers in parentheses next to peer groups denote number of companies
Source: FactSet
EV / FCF 2013 Multiples
for Peer Groups
5.4x
6.7x 6.2x
12.9x
16.8x
6.1x
RigNet Telecom
Services (4)
Oil Field
Services (6)
Infrastructure
as a Service (3)
Towers (3) Offshore
Drilling (6)
Peer Group Avg: 9.7x
18.9x
28.6x 28.0x
75.9x
41.5x
21.7x
RigNet Telecom
Services (4)
Oil Field
Services (6)
Infrastructure
as a Service (3)
Towers (3) Offshore
Drilling (6)
Peer Group Avg: 39.1x
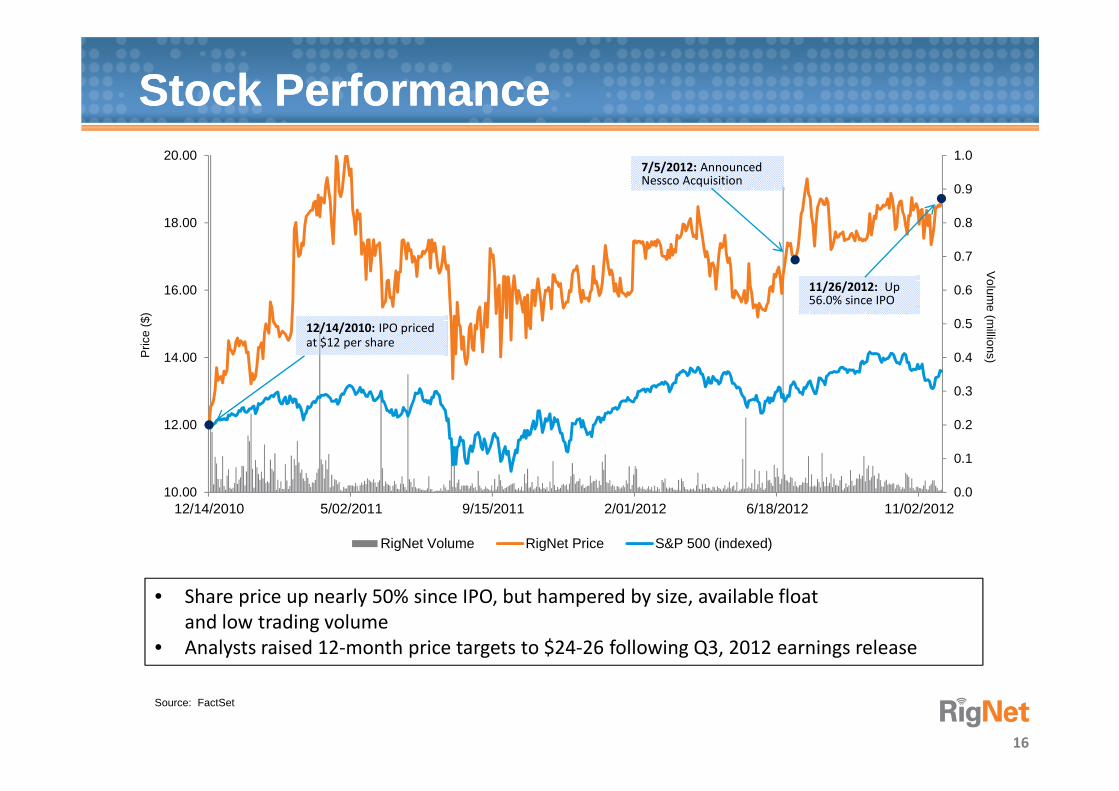
Stock PerformanceStock Performance
16
• Share price up nearly 50% since IPO, but hampered by size, available float
and low trading volume
• Analysts raised 12-month price targets to $24-26 following Q3, 2012 earnings release
Source: FactSet
0.0
0.1
0.2
0.3
0.4
0.5
0.6
0.7
0.8
0.9
1.0
10.00
12.00
14.00
16.00
18.00
20.00
12/14/2010 5/02/2011 9/15/2011 2/01/2012 6/18/2012 11/02/2012
Volum
e (millions)P
rice
($)
RigNet Volume RigNet Price S&P 500 (indexed)
12/14/2010: IPO pricedat $12 per share
11/26/2012: Up 56.0% since IPO
7/5/2012: Announced Nessco Acquisition

RigNet Investment HighlightsRigNet Investment Highlights
17
Strong Organic Growth within the Oil and Gas Industry
Growing and Attractive Market Runway
High Operating Leverage / Free Cash Flow
Relative Valuation Discount
Market Share Growth
Leading provider of managed and mission critical remote communications, systems integration and collaborative applications to the oil and gas industry, both offshore and onshore, around the world: RigNet (NASDAQ: RNET)

THANK YOUTHANK YOU
18