JEFFCO LEGISLATORS UPDATE – February 12, 2019...Jeffco Budget. BOND Proposed School Improvements....
33
Jason E. Glass, Ed.D., Superintendent & Chief Learner Kathleen Askelson, Chief Financial Officer | JEFFCO LEGISLATORS UPDATE – February 12, 2019
Transcript of JEFFCO LEGISLATORS UPDATE – February 12, 2019...Jeffco Budget. BOND Proposed School Improvements....
Jason E. Glass, Ed.D., Superintendent & Chief LearnerKathleen Askelson, Chief Financial Officer
| JEFFCO LEGISLATORS UPDATE – February 12, 2019

| AGENDA
2019/2020 Jeffco Budget
Information Items
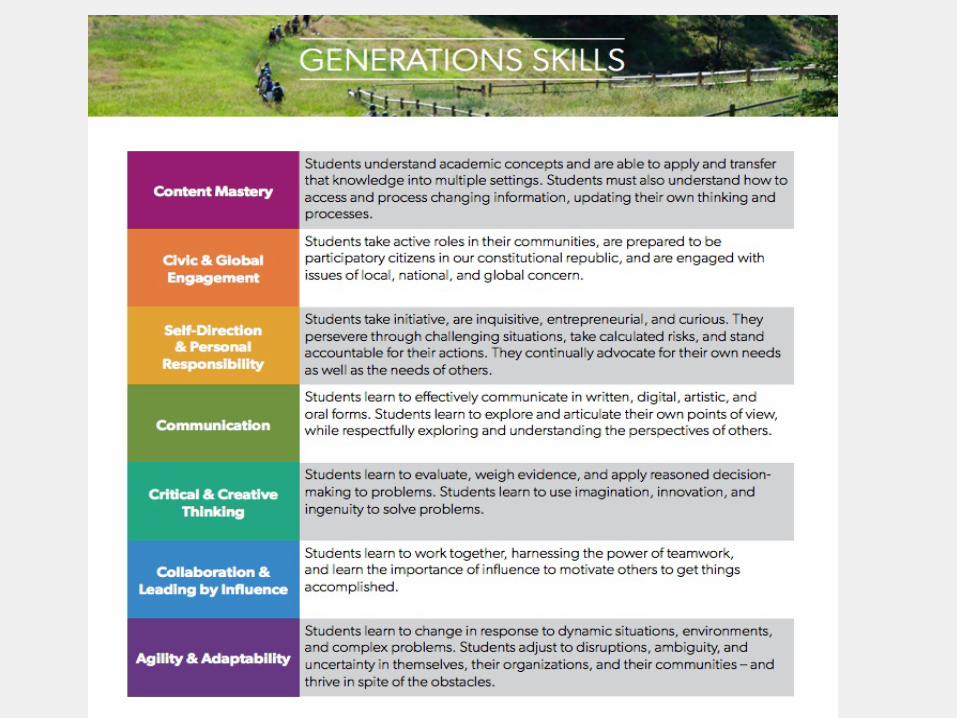
Jeffco Generations Demographics of Jeffco 2017-2018 State Assessment Highlights Comparisons to other districts/state
2019/2020 Jeffco Budget
Jeffco Budget
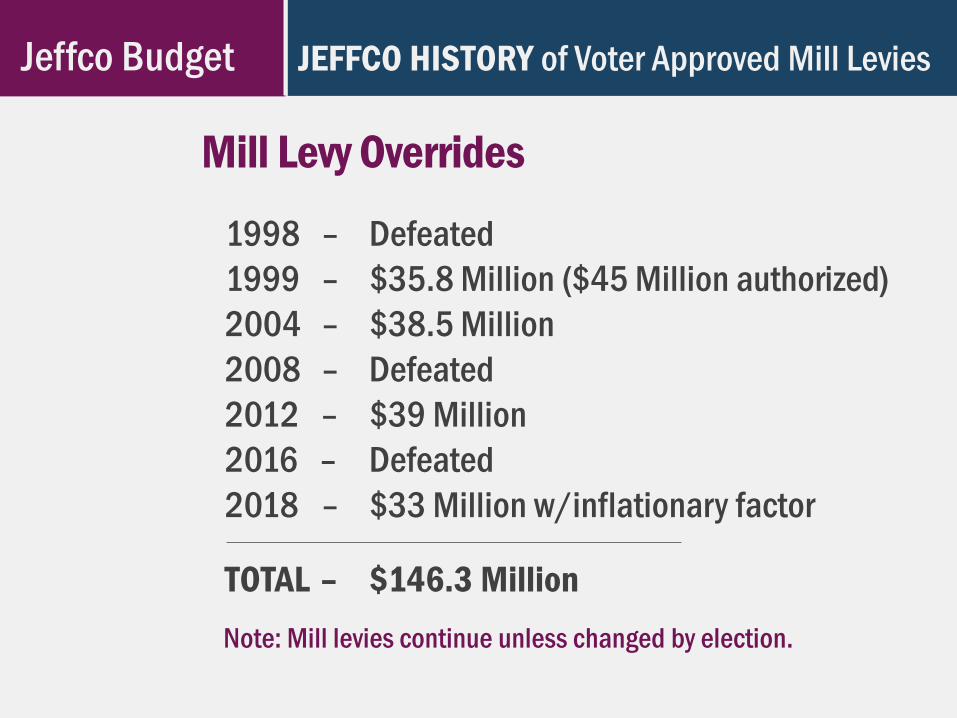
1998 – Defeated1999 – $35.8 Million ($45 Million authorized)2004 – $38.5 Million2008 – Defeated2012 – $39 Million2016 – Defeated2018 – $33 Million w/inflationary factor
TOTAL – $146.3 Million
Mill Levy Overrides
Note: Mill levies continue unless changed by election.
JEFFCO HISTORY of Voter Approved Mill Levies

Jeffco Budget 2018 5A MILL LEVY FUNDS –Current Board Direction
Compensation 50% ($15 million) –Attract and retain high quality teachers by ensuring the district is able to be competitive in compensation and benefits for teachers and staff;
Career Tech-Ed STEM 10% ($3 million) –Expanding programs in science, technology, engineering and math (STEM) and in career/technical education;
Classroom/Technology 10% ($3 million) –Updating aged and outdated instructional resources such as books, supplies and technology;
Safety and Mental Health Support 20% ($6 million) –Improving student safety by increasing mental health and counseling professionals to improve student mental health services, including suicide prevention and substance abuse counseling;
Early Education Program 10% ($3 million) –Increase early education programs.
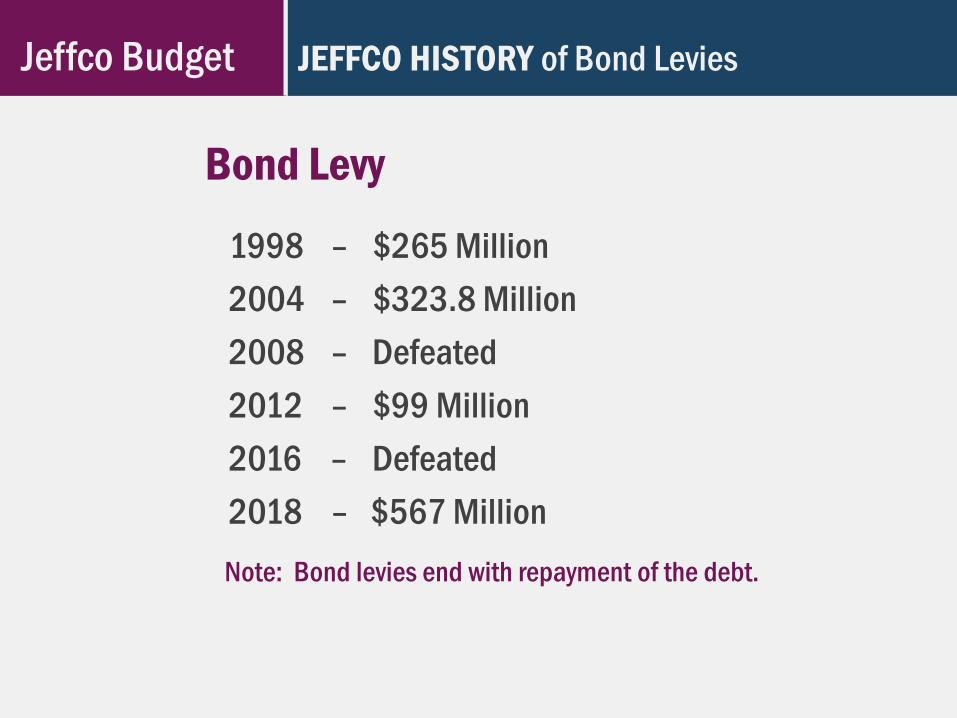
1998 – $265 Million2004 – $323.8 Million2008 – Defeated2012 – $99 Million2016 – Defeated 2018 – $567 Million
Bond Levy
Note: Bond levies end with repayment of the debt.
JEFFCO HISTORY of Bond LeviesJeffco Budget
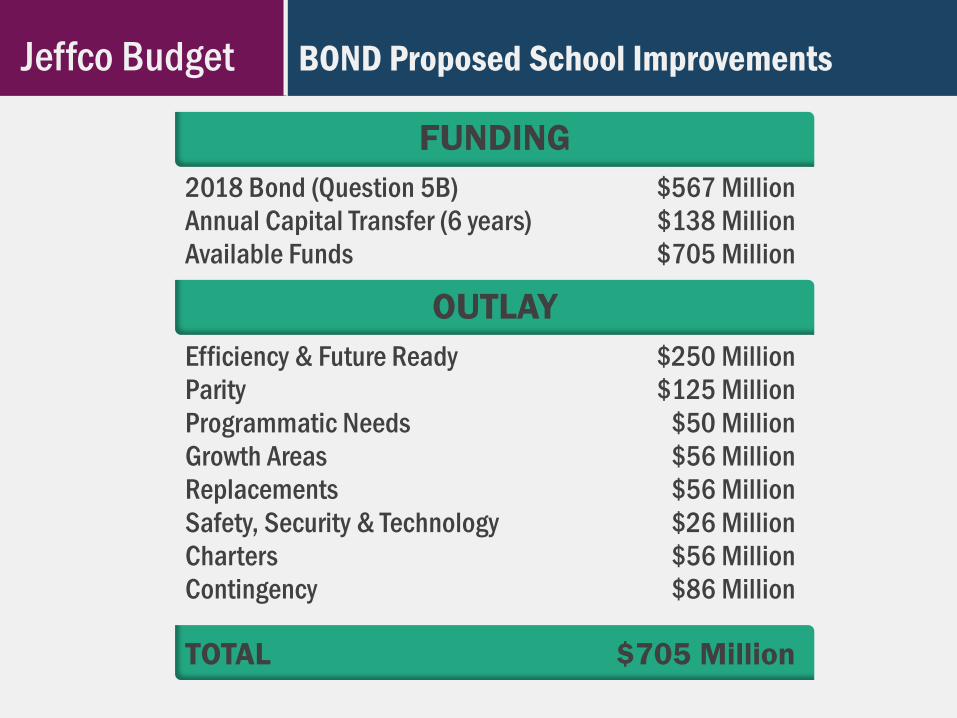
BOND Proposed School ImprovementsJeffco Budget
FUNDING2018 Bond (Question 5B) $567 MillionAnnual Capital Transfer (6 years) $138 MillionAvailable Funds $705 Million
OUTLAYEfficiency & Future Ready $250 MillionParity $125 MillionProgrammatic Needs $50 MillionGrowth Areas $56 MillionReplacements $56 MillionSafety, Security & Technology $26 MillionCharters $56 MillionContingency $86 Million
TOTAL $705 Million
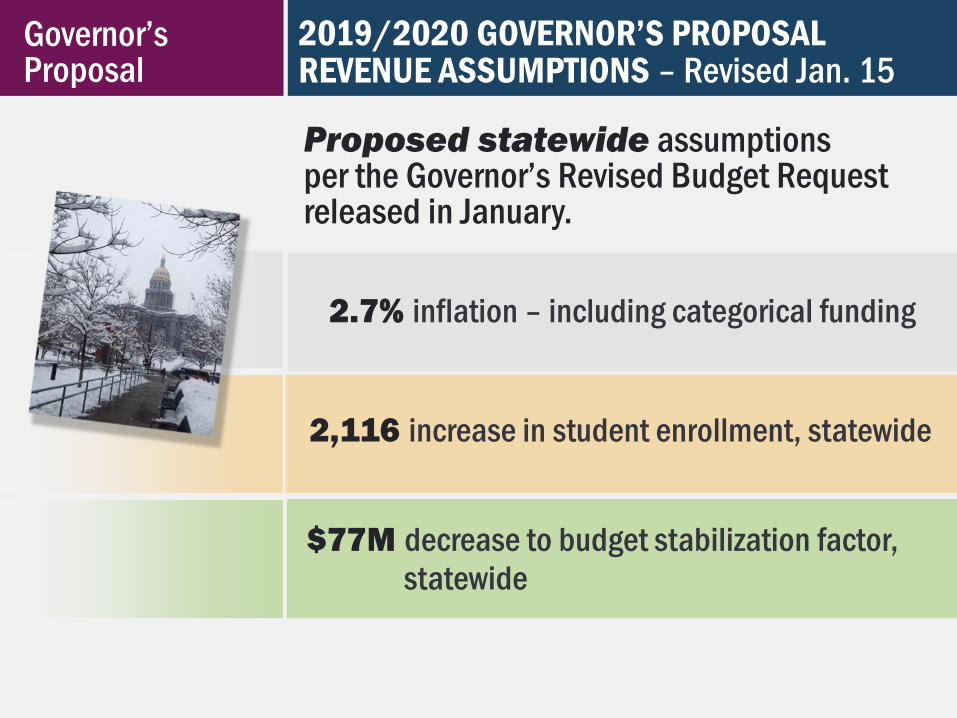
2.7% inflation – including categorical funding
2,116 increase in student enrollment, statewide
$77M decrease to budget stabilization factor, statewide
Proposed statewide assumptions per the Governor’s Revised Budget Request released in January.
2019/2020 GOVERNOR’S PROPOSAL REVENUE ASSUMPTIONS – Revised Jan. 15
Governor’s Proposal

Jeffco’s Funding Based on Governor’s
Request(as revised in
January)$22M
Jeffco’s Revised
Estimated Total
General Fund Increase$19.8M
Less Pass Through
to Charters$(2.2M)
2019/2020 STATE REVENUE ASSUMPTIONSJeffco Funding Update
Governor’s Proposal
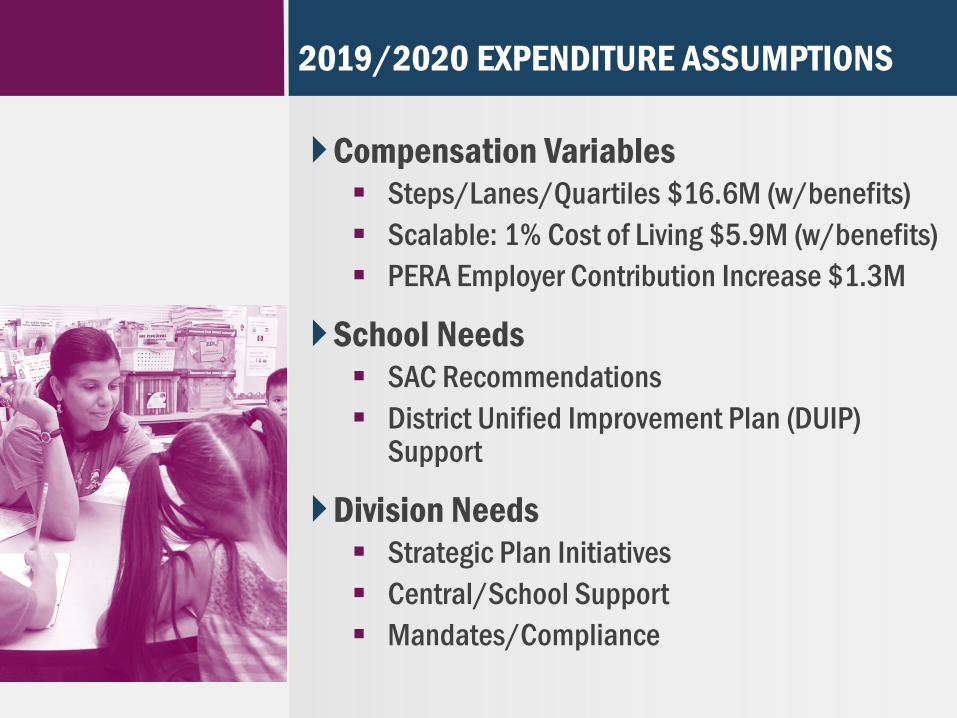
Compensation Variables Steps/Lanes/Quartiles $16.6M (w/benefits) Scalable: 1% Cost of Living $5.9M (w/benefits) PERA Employer Contribution Increase $1.3M
School Needs SAC Recommendations District Unified Improvement Plan (DUIP)
Support
Division Needs Strategic Plan Initiatives Central/School Support Mandates/Compliance
2019/2020 EXPENDITURE ASSUMPTIONS
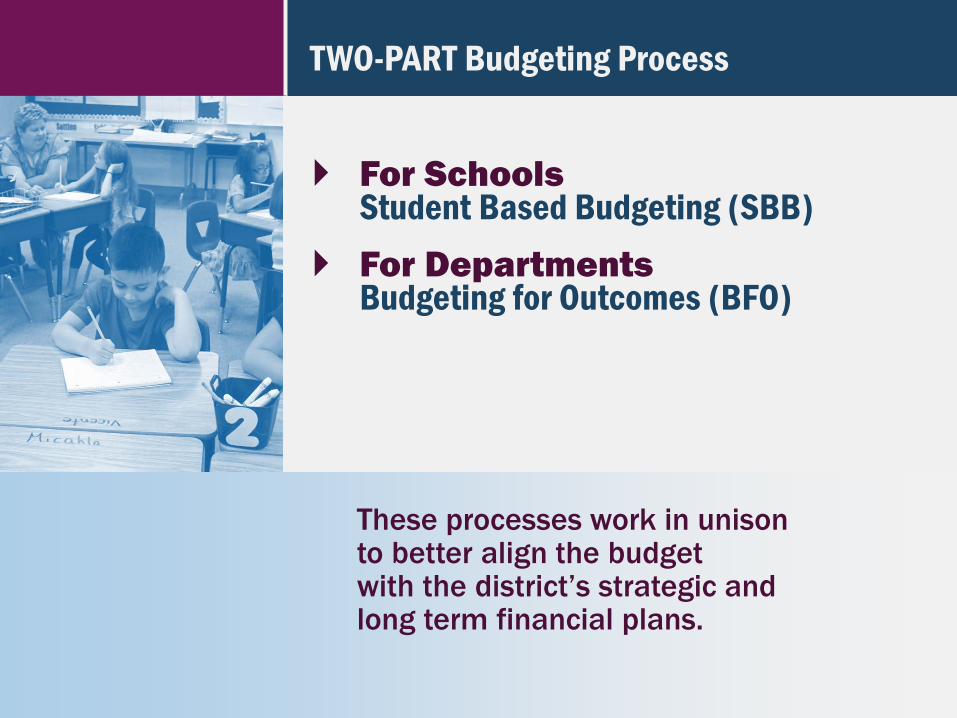
For SchoolsStudent Based Budgeting (SBB)
For DepartmentsBudgeting for Outcomes (BFO)
These processes work in unison to better align the budget with the district’s strategic andlong term financial plans.
TWO-PART Budgeting Process

The Student Based Budgeting (SBB) model was implemented for the majority of schools beginning with the 2015/2016 school year.
STUDENT BASED BUDGETING Background
Allocated resources to schools based on their student counts and factors such as at-risk.Directed funds to schools in support
of school-based decision-making. Provided equity as funds were allocated
in a uniform and consistent process based on the population each individual school serves. Provided flexibility for site-based decisions
for staffing and spending within limited parameters known as defined autonomy.
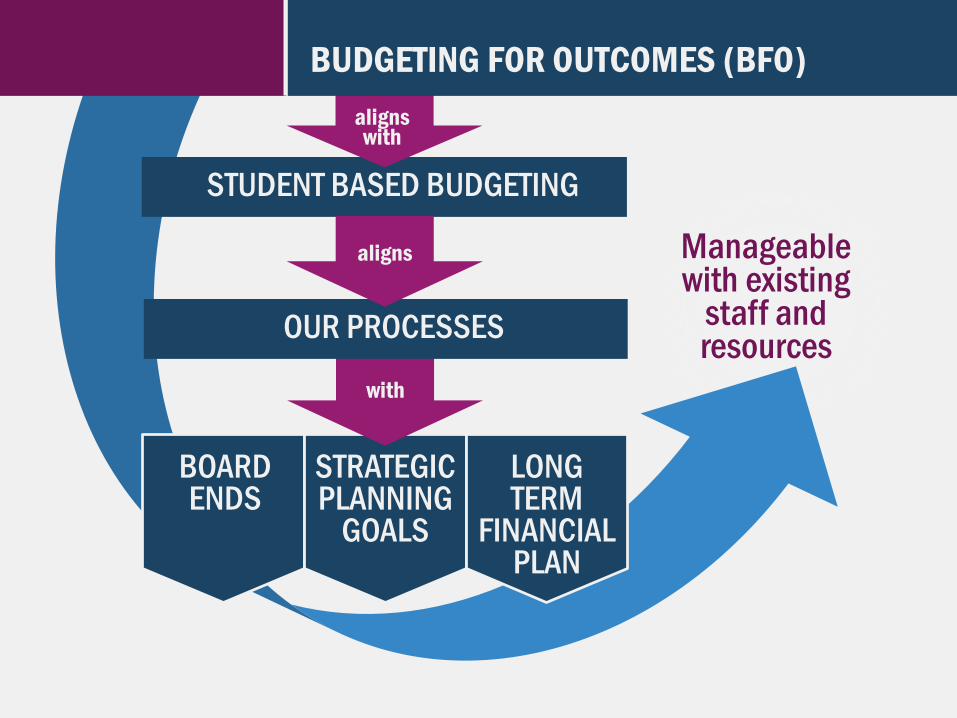
Manageable with existing
staff and resources
BOARDENDS
LONG TERM
FINANCIALPLAN
STRATEGICPLANNING
GOALS
with
STUDENT BASED BUDGETING
aligns with
OUR PROCESSES
aligns
BUDGETING FOR OUTCOMES (BFO)
Information Items
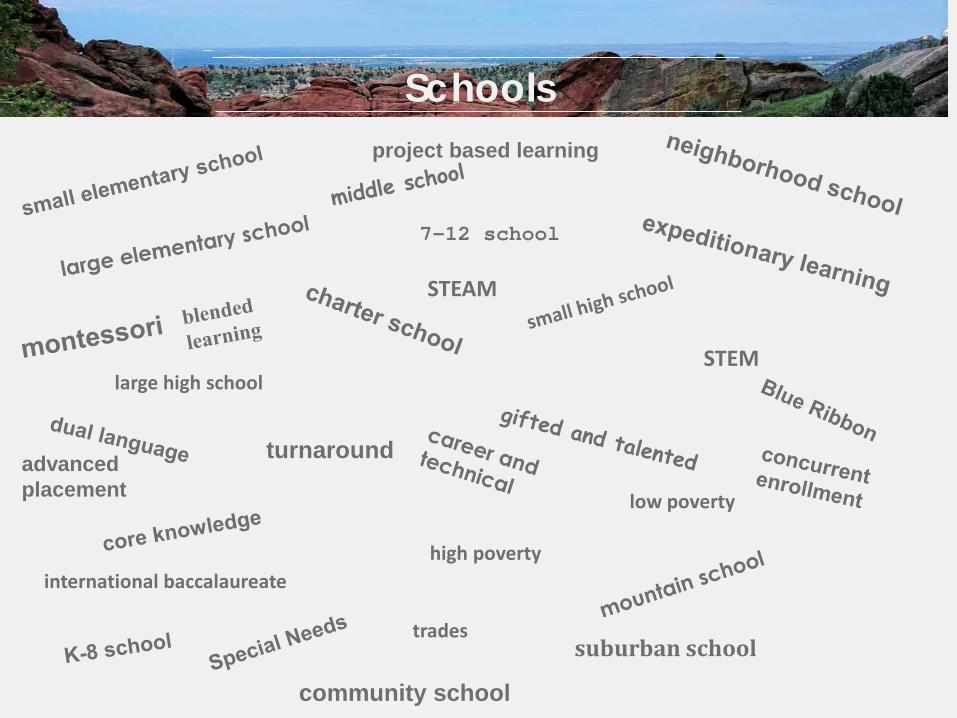
Schools
large high school
high poverty
STEM
international baccalaureate
trades
low poverty
suburban school
turnaround
7-12 school
community school
advanced placement
STEAM
project based learning

Schools to meet the needs of our learnersNeighborhood• “Home school” for students who live in the
attendance area • Follows Colorado Academic Standards and utilizes
Jeffco’s Bridge to Curriculum for core instruction• Might have specialized programming available, such as STEM,
PBL, GT, SSN, Dual Language• Meets the varied needs of students through differentiation• Students can choice in or out depending on space available

JEFFCO DEMOGRAPHICS

| The County & Jeffco Public Schools
Jeffco Public Schools • Membership 2018-2019: 84,631
• Employees: ~14,000
• 32.2% minority, mostly Hispanic but wide variety (17.5% in 2000)
• Free reduced lunch rate: 31.3% (14.8% in 2000)
Jefferson County, CO
• Population est.: 574,613
• Homes: 234,458
• 80.3% White, 14.24% Hispanic
• Median Household Income: $75,170

| More about Jeffco
• History: 39 school districts combined in 1950 to form R-1 Jefferson County Public School District with about 55 schools.
• Highest enrollment: 1998/1999 (88,793); there were 148 schools at that time.
• Jeffco: 162 Public Schools, 3 PK centers, 87 elementary, 5 K-8*, 17 middle, 2 Jr/Sr (7-12), 15 high, 10 option, 4 special, 16 charter, 1 online, 2 outdoor lab
• # in Jeffco traditional neighborhood schools: 70,749 (83.6%)• 262 special, 4568 option, 9052 charter• Choice: Overall 63% of kids stay at their neighborhood school,
but there is a huge range. Choice out from 10% to 77%; choice in from 7% to 74%.
*The Bradfords counted as 1 K-8, Jeffco Open counted as 1 Option, Jefferson Academy & Two Roads counted as 1 charter each.

Jeffco Public Schools
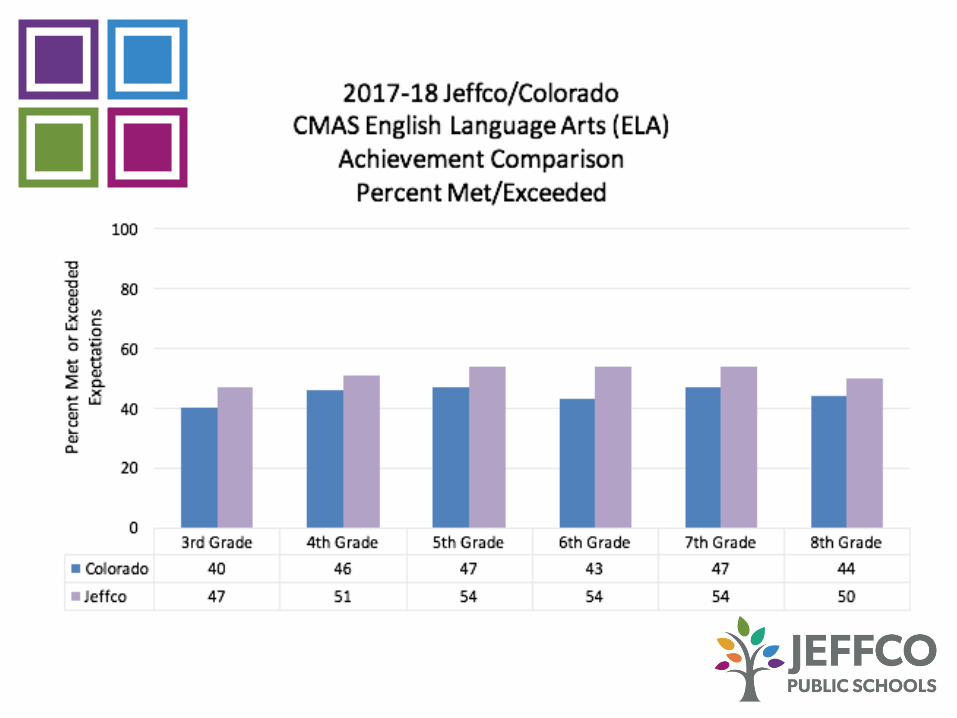
State Assessment Highlights
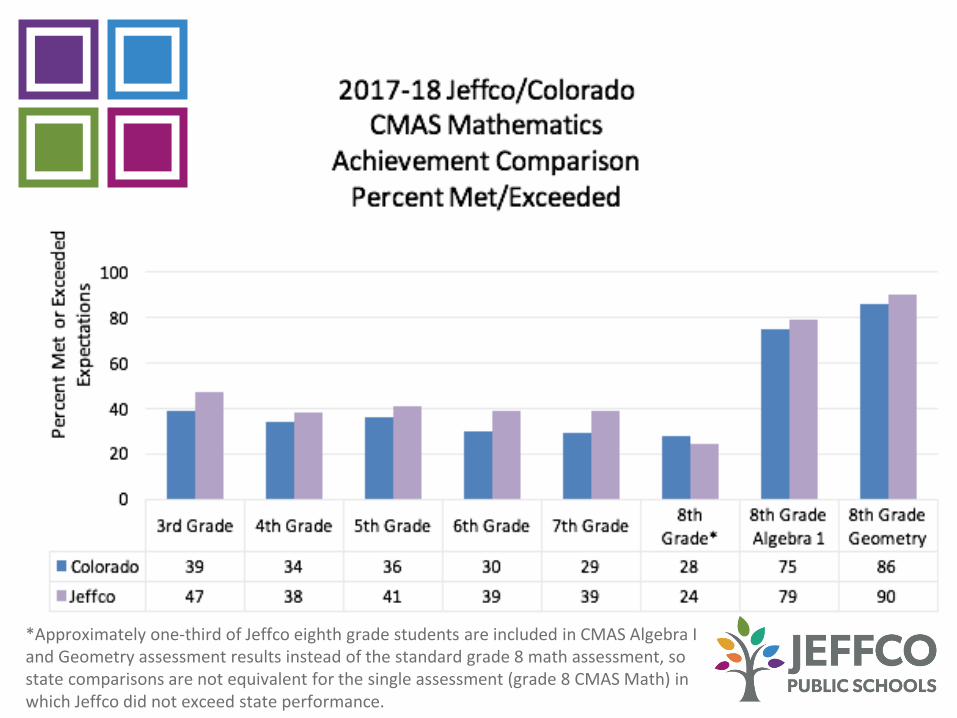
*Approximately one-third of Jeffco eighth grade students are included in CMAS Algebra I and Geometry assessment results instead of the standard grade 8 math assessment, so state comparisons are not equivalent for the single assessment (grade 8 CMAS Math) in which Jeffco did not exceed state performance.

5th Grade 8th Grade 11thGrade
Colorado 36% 31% 24%Jeffco 43% 40% 33%
0%
20%
40%
60%
80%
100%Pe
rcen
t Met
or E
xcee
ded
Expe
ctat
ions
2017-18 Jeffco/ColoradoCMAS Science
Achievement ComparisonPercent Met or Exceeded

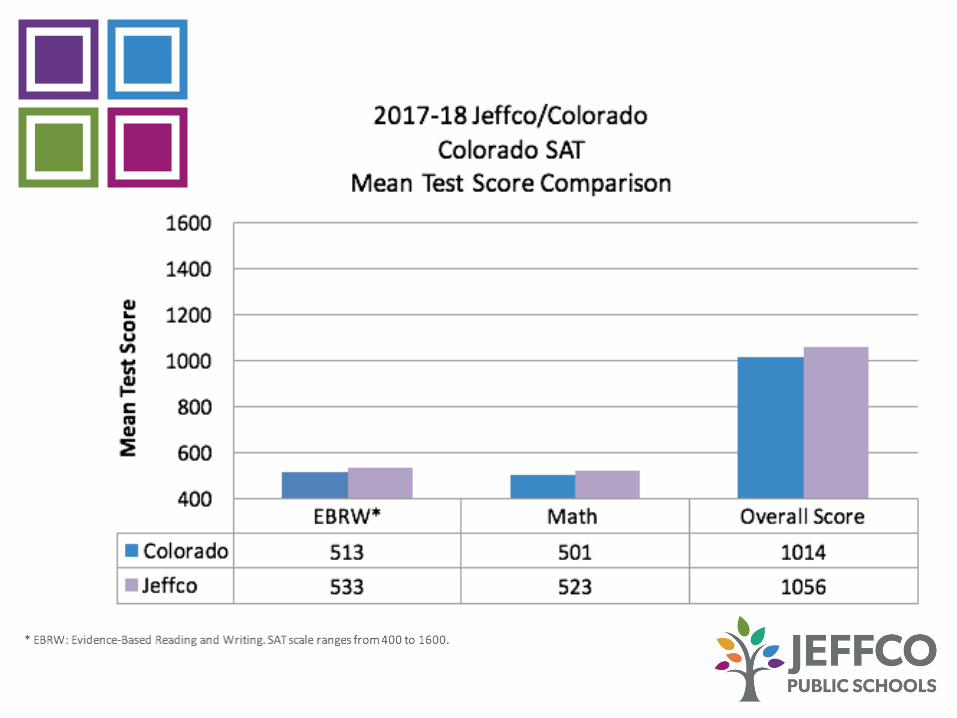
EBRW* Math Overall ScoreColorado 454 448 902Jeffco 471 469 940
240
440
640
840
1040
1240
1440
Mea
n Te
st S
core
2017-18 Jeffco/ColoradoColorado PSAT 9
Mean Test Score Comparison
* EBRW: Evidence-Based Reading and Writing. PSAT 9 scale ranges from 240 - 1440.

EBRW* Math Overall ScoreColorado 479 465 944Jeffco 496 486 983
320
520
720
920
1120
1320
1520
Mea
n Te
st S
core
2017-18 Jeffco/Colorado
Colorado PSAT 10Mean Test Score Comparison
* EBRW: Evidence-Based Reading and Writing. PSAT scale ranges from 320 to 1520.
Jeffco Comparisons

District # of Students
State Per Pupil Funding
17/18
Mill Levy Override Per Pupil 17/18
OutstandingBonds Per
Pupil 16/17
Denver 91,794 $7,925 $2,266 $20,585
Jeffco 86,112 (2nd)
$7,478 (4th)
$1,316 (5th)
$4,485 (6th)
Douglas 67,597 $7,396 $499 $4,513
Cherry Creek 55,657 $7,630 $2,048 $10,299
Boulder 31,282 $7,582 $2,217 $23,203
Littleton 15,643 $7,373 $1,842 $8,695
Comparisons Per Pupil Revenue, Mill Levy and Bond
COMPARISONS to Other DistrictsState FundingDistrict Finance

BILLION DOLLAR BUDGET − Comparison
District Total Budget Enrollment
Lee County, FL $1,484,709,538 91,309
Albuquerque, NM $1,349,158,362 90,566
Denver, CO $1,896,125,256 90,235
Prince William, VA $1,504,365,187 87,793
Fort Worth, TX $1,079,468,276 87,080
Jeffco Public Schools $1,004,844,315 86,731
Davidson County, TN $1,019,952,830 85,598
Baltimore City, MD $1,455,496,000 83,666
Austin, TX $1,614,305,259 83,648
Anne Arundel, MD $1,183,671,500 80,387
Long Beach, CA $1,182,020,011 77,812
District Finance
Sources: 2014 Data on national ranking by size from National Center for Education Statistics; total budget figures from each district’s respective website
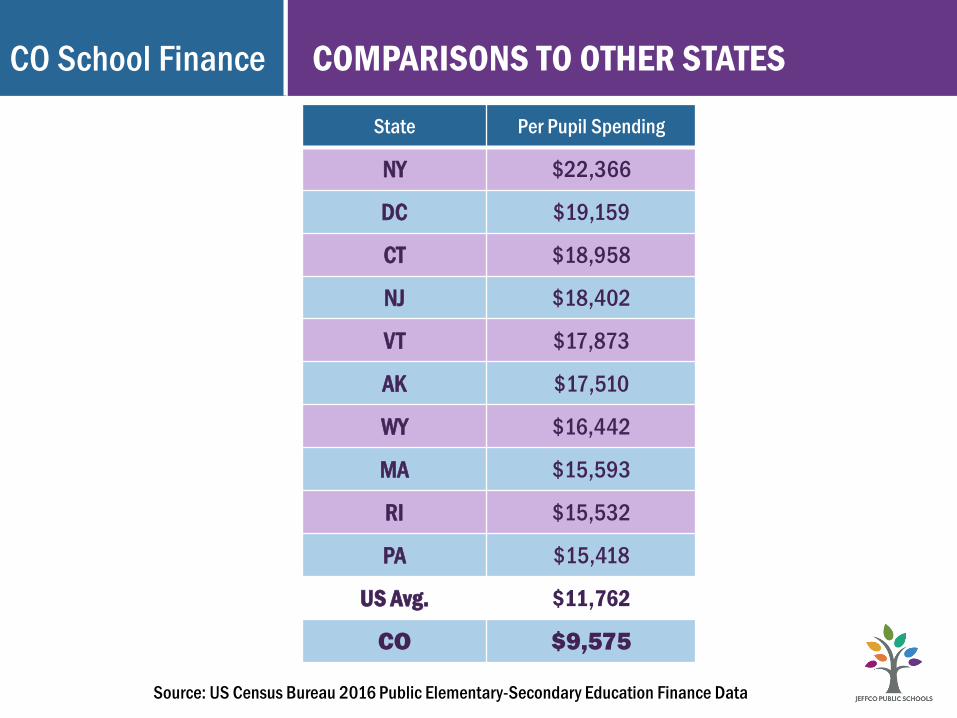
State Per Pupil Spending
NY $22,366
DC $19,159
CT $18,958
NJ $18,402
VT $17,873
AK $17,510
WY $16,442
MA $15,593
RI $15,532
PA $15,418
US Avg. $11,762
CO $9,575
COMPARISONS TO OTHER STATESCO School Finance
Source: US Census Bureau 2016 Public Elementary-Secondary Education Finance Data
Please contact us with any questions:
Jason Glass, Superintendent [email protected]
Kathleen Askelson, CFO [email protected]
QUESTIONS