SPE/IADC 163463 Extended Reach Drilling new solution with ...
Upload
jeff-lightseyCategory
view
79download
0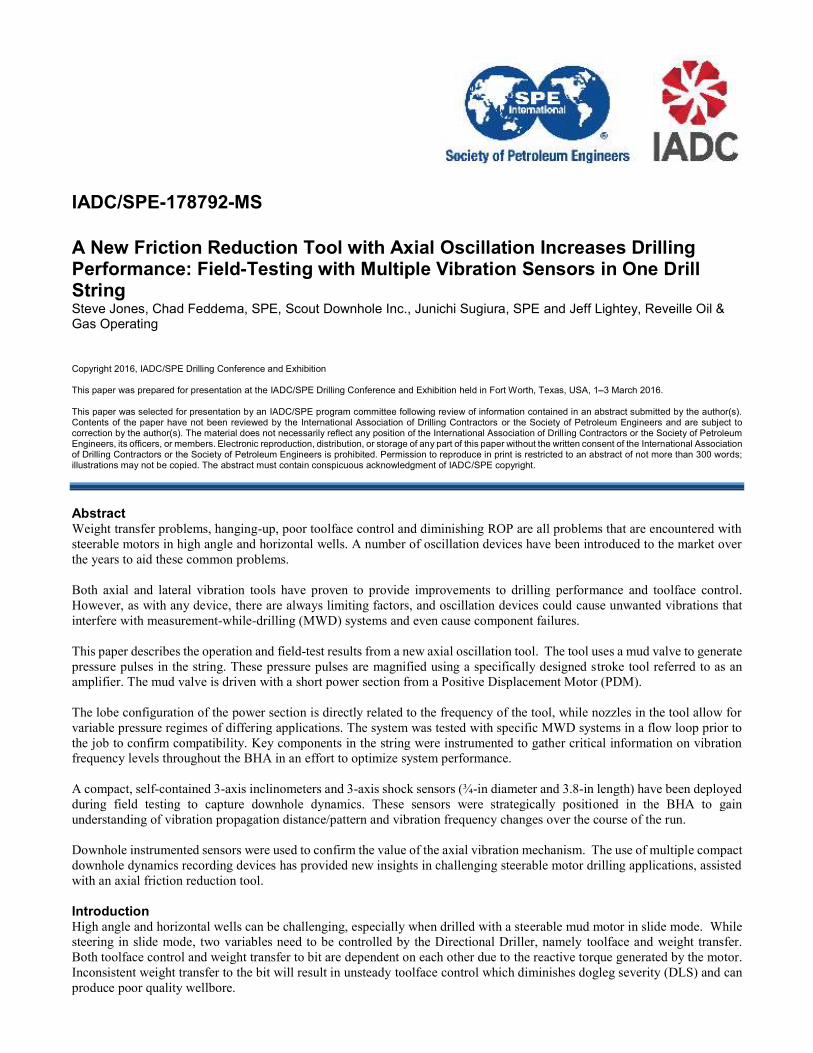
IADC/SPE-178792-MS A New Friction Reduction Tool with Axial Oscillation Increases Drilling Performance: Field-Testing with Multiple Vibration Sensors in One Drill String Steve Jones, Chad Feddema, SPE, Scout Downhole Inc., Junichi Sugiura, SPE and Jeff Lightey, Reveille Oil & Gas Operating
Copyright 2016, IADC/SPE Drilling Conference and Exhibition This paper was prepared for presentation at the IADC/SPE Drilling Conference and Exhibition held in Fort Worth, Texas, USA, 1 3 March 2016. This paper was selected for presentation by an IADC/SPE program committee following review of information contained in an abstract submitted by the author(s). Contents of the paper have not been reviewed by the International Association of Drilling Contractors or the Society of Petroleum Engineers and are subject to correction by the author(s). The material does not necessarily reflect any position of the International Association of Drilling Contractors or the Society of Petroleum Engineers, its officers, or members. Electronic reproduction, distribution, or storage of any part of this paper without the written consent of the International Association of Drilling Contractors or the Society of Petroleum Engineers is prohibited. Permission to reproduce in print is restricted to an abstract of not more than 300 words; illustrations may not be copied. The abstract must contain conspicuous acknowledgment of IADC/SPE copyright. Abstract Weight transfer problems, hanging-up, poor toolface control and diminishing ROP are all problems that are encountered with steerable motors in high angle and horizontal wells. A number of oscillation devices have been introduced to the market over the years to aid these common problems. Both axial and lateral vibration tools have proven to provide improvements to drilling performance and toolface control. However, as with any device, there are always limiting factors, and oscillation devices could cause unwanted vibrations that interfere with measurement-while-drilling (MWD) systems and even cause component failures. This paper describes the operation and field-test results from a new axial oscillation tool. The tool uses a mud valve to generate pressure pulses in the string. These pressure pulses are magnified using a specifically designed stroke tool referred to as an amplifier. The mud valve is driven with a short power section from a Positive Displacement Motor (PDM). The lobe configuration of the power section is directly related to the frequency of the tool, while nozzles in the tool allow for variable pressure regimes of differing applications. The system was tested with specific MWD systems in a flow loop prior to the job to confirm compatibility. Key components in the string were instrumented to gather critical information on vibration frequency levels throughout the BHA in an effort to optimize system performance. A compact, self-contained 3-axis inclinometers and 3-axis shock sensors (¾-in diameter and 3.8-in length) have been deployed during field testing to capture downhole dynamics. These sensors were strategically positioned in the BHA to gain understanding of vibration propagation distance/pattern and vibration frequency changes over the course of the run. Downhole instrumented sensors were used to confirm the value of the axial vibration mechanism. The use of multiple compact downhole dynamics recording devices has provided new insights in challenging steerable motor drilling applications, assisted with an axial friction reduction tool. Introduction High angle and horizontal wells can be challenging, especially when drilled with a steerable mud motor in slide mode. While steering in slide mode, two variables need to be controlled by the Directional Driller, namely toolface and weight transfer. Both toolface control and weight transfer to bit are dependent on each other due to the reactive torque generated by the motor. Inconsistent weight transfer to the bit will result in unsteady toolface control which diminishes dogleg severity (DLS) and can produce poor quality wellbore.
2 IADC/SPE-178792-MS
The effects of poor toolface control and weight transfer accumulates over the length of the well, compounding the problem as the well gets deeper. This leads to high torque and drag which ultimately reduces drilling performance, even in rotary mode. Seve These devices involve either axial oscillation or lateral vibration (Gee et al. 2015; Shor et al. 2015). Both methods could have negative effects on BHA component reliability due to the fact that oscillations and vibrations are being introduced to the BHA and drill string. The negative impact on reliability of electronic and mud pulse equipment results in non-productive time tripping for failed equipment. The use of friction reduction tools (FRT) with steerable motors has become commonplace in North America. The placement of the FRT in the BHA or string still appears to be based on trial and error or best results attained on previous wells. A more detailed systematic approach is required to understand how the oscillations and/or vibrations travel along the BHA and drill string. Understanding these functions can result in optimal placement of the FRT for friction reduction, BHA stability and equipment longevity. Friction Reduction Tool (FRT) The new FRT is shown in Fig. 1. 4 ¾-in, 5-in and 6 ½-in tool sizes are available. The tool is made up from a pulser section and an amplifier section. The pulser section contains a unique mud valve and power section. The amplifier section operates similar to a shock tool but has some unique features to optimize operation of the system. The valve section contains a stabilized pulsation mud valve that generates positive pressure pulses in the drill string. The valve is designed to generate a consistent mud pulse profile at controlled frequencies. This is achieved using a unique design where the valve is never subject to thrust loading. Radial and thrust bearings are strategically positioned in the system to ensure loads are isolated away from the valve. Isolating the valve from thrust loading means there is no variation in the pressure pulse due to wear and tear over the course of the run. Other systems on the market encounter changes in pressure drop over the course of a run due to wear on the thrust loaded valve plates. The mud valve is driven by a power section. The power section is made up from a short section of rotor and stator from a Positive Displacement Motor (PDM). Two different valve sizes are available to change the frequency of the tool. This optimizes the system for good performance and reliability with different MWD systems. The pressure pulses are magnified using an amplifier. The amplifier has been designed with features to optimize performance in conjunction with the pulsation section. The unique features include an enhanced sealing design to withstand high pressure, high frequency pressure pulses as well as increased piston areas to lower the pressure drop requirements. Other devices on the market typically use standard shock tool designs that have not been optimized to operate with the valve as a system. A downhole dynamics recording device has been embedded into the lower part of the amplifier tool. The sensor is housed behind a hatch cover on the mandrel that strokes in and out. The dynamics recording device has been designed to be very small so as to allow it to be embedded into multiple drilling tools without changing tool length or compromising mechanical integrity.
IADC/SPE-178792-MS 3
MWD Compatibility The FRT has been designed to operate within two pre-defined frequency ranges to ensure;
1. Compatibility with multiple MWD systems available on the market. 2. Pulse frequency remains within a controlled range where the frequency of the pulses and the axial displacement of the
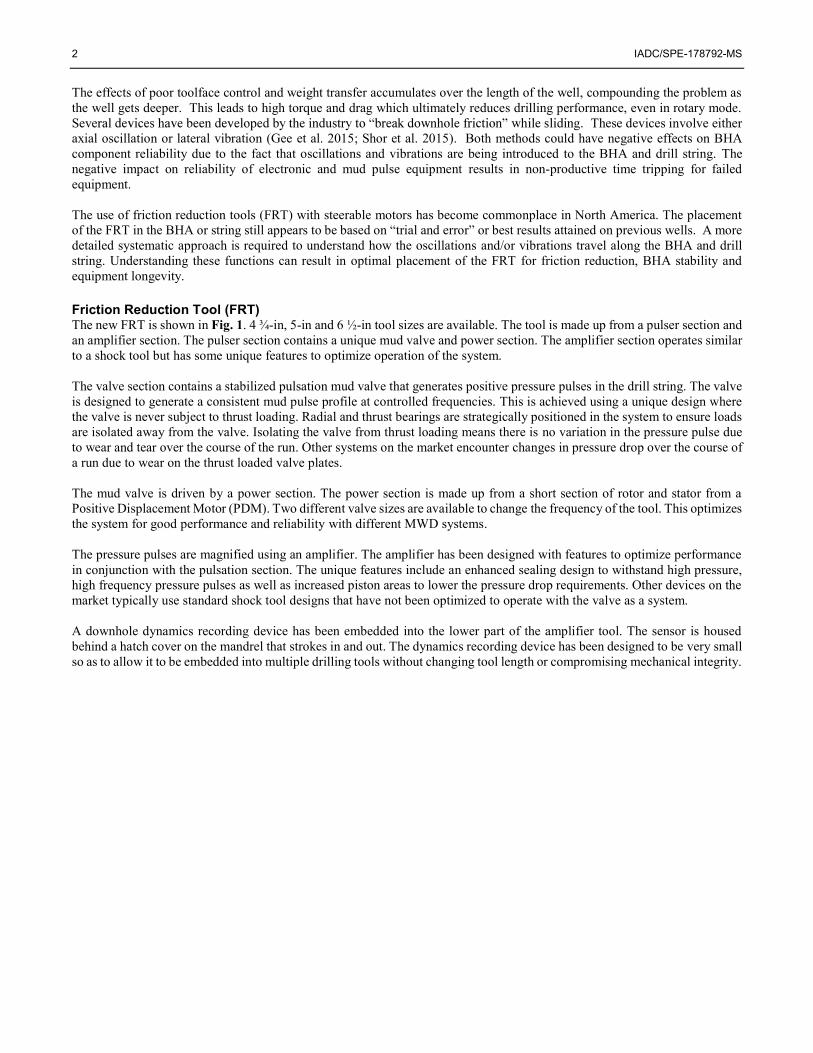
system work in unison and do not fall out of sync. The pressure pulse is tuned for each job to ensure compatibility with the MWD system. The FRT has been tested with multiple MWD systems on the flow loop to ensure compatibility pre-job. If any interference with MWD pulses was detected, the secondary frequency range was utilized. Fig. 2 shows the flow loop used during compatibility testing. Over the course of time multiple MWD systems have been qualified to operate with the FRT. This ensures no loss of MWD signal throughout the course of the run and allows operators to build confidence in the system.
Fig. 1 Friction reduction tool and amplifier
Sensor Hatch Cover
Fig. 2 Compatibility testing flow loop

4 IADC/SPE-178792-MS
Rig Configurable FRT The FRT can be adjusted on location to change pressure drop. This could be required for the following reasons;
1. Reduce pressure drop for Stand Pipe Pressure (SPP) limitations. 2. Increase pressure drop to increase the vibration strength of the tool.
Adjustment of the tool pressure drop is achieved by simply reconfiguring the nozzle total flow area (TFA) across the tool. This can be done in less than 20 minutes on the rig floor. The inclusion of strategically placed sensors in the BHA and string allows the system to be optimized for each application. The high-frequency measurements are used to verify vibration propagation distance/pattern and frequency response along hole. The data measured provided critical information to understand tool response characteristics under different drilling parameters, inclinations and conditions. FRT and Sensor Placement in BHA/String The effectiveness of the friction reduction tool depends on placement in the BHA or drill string. BHA modeling software typically does not have a feature to excite the BHA at the friction reduction tool. It is also hard to predict how far along the string and BHA the oscillations will travel. In an effort to understand the characteristics of this specific FRT, the BHA was instrumented with shock and vibration sensors. The sensors were placed at the tool and along the string/BHA. The long-term goal was to produce and validate an accurate model for FRT BHA placement. The main BHA used for the testing was configured with five sensors placed at strategic positions. The sensor positions were selected to allow optimal data for the performance analysis. The motor was fitted with sensors in the bit box and top sub. The FRT was fitted with a sensor in amplifier mandrel. Sensors were placed in subs 500ft above and below the FRT. Fig. 3 shows the placement of the shock and vibration measurement sensors in the BHA with relation to the FRT.
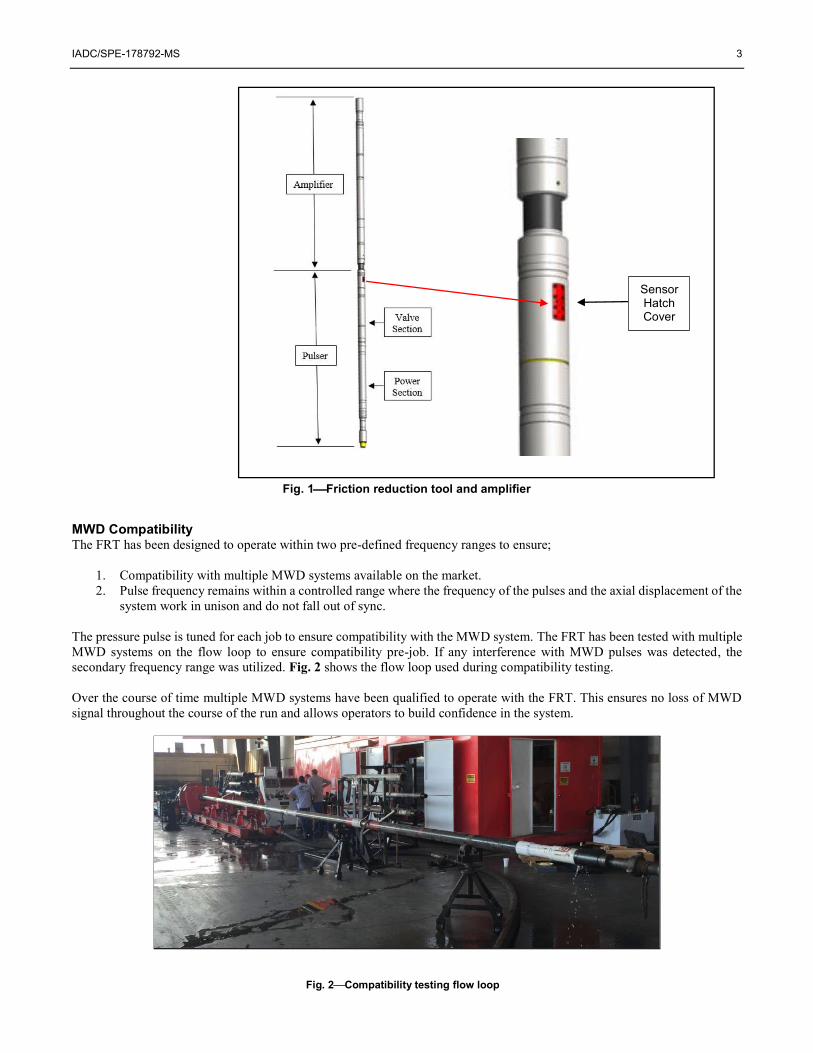
Downhole Instrumentation The downhole shock and vibration measurement sensor has been designed to be durable over long runs. The compact device with self-contained 3-axis inclinometers, 3-axis shock sensors and two temperature sensors can be housed into two different packages depending on the embedded position within the specific tool. This unique design allows the sensors to be embedded into existing tools without increasing tool length or compromising mechanical integrity. For installation under a hatch cover, the sensor package is housed within a ¾-in diameter and 3.8-in long pressure barrel as shown in Fig. 4.
Fig. 3 Sensor placement in BHA
Sensor in bit box Sensor in motor top sub Sensor in FRT
Sensor in sub 500ft below FRT Sensor in sub 500ft above FRT
2,500ft
IADC/SPE-178792-MS 5
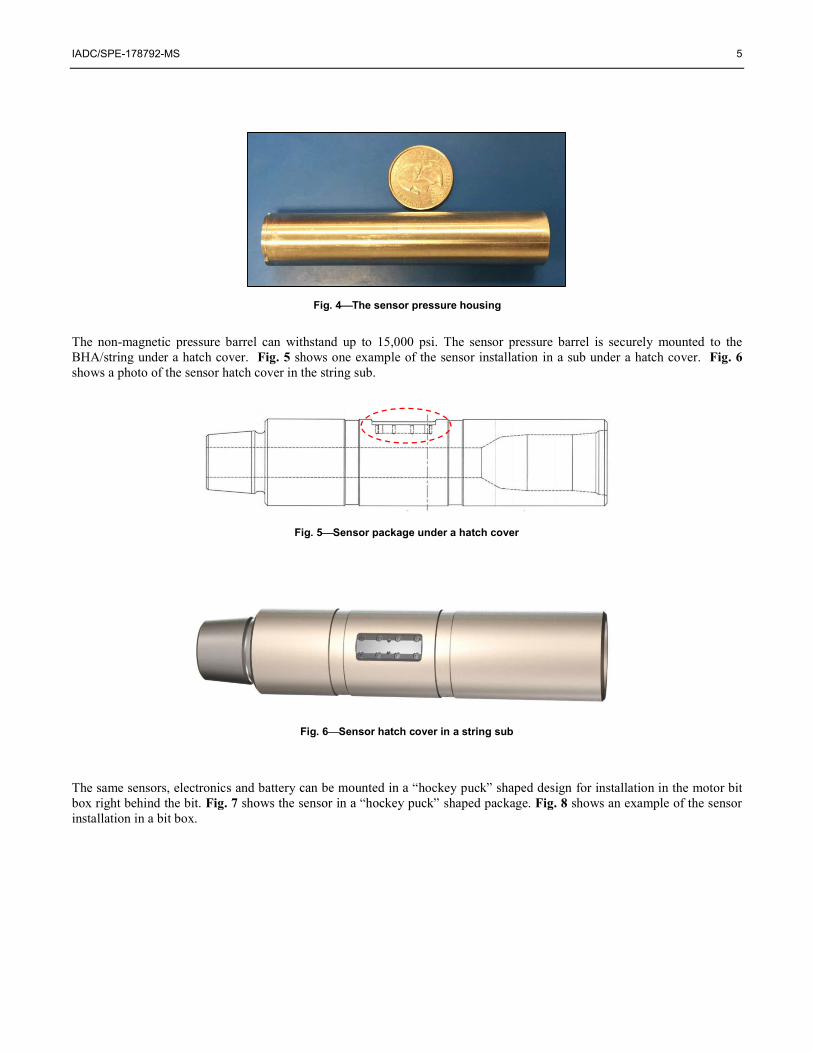
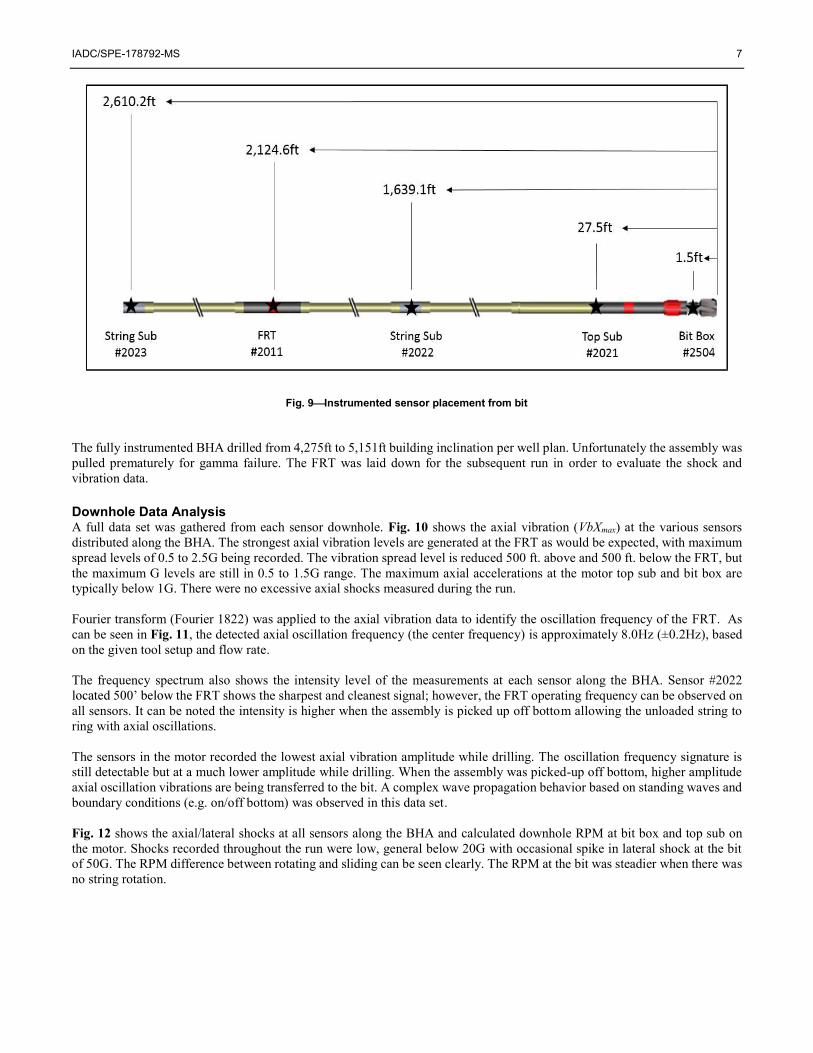
The non-magnetic pressure barrel can withstand up to 15,000 psi. The sensor pressure barrel is securely mounted to the BHA/string under a hatch cover. Fig. 5 shows one example of the sensor installation in a sub under a hatch cover. Fig. 6 shows a photo of the sensor hatch cover in the string sub.
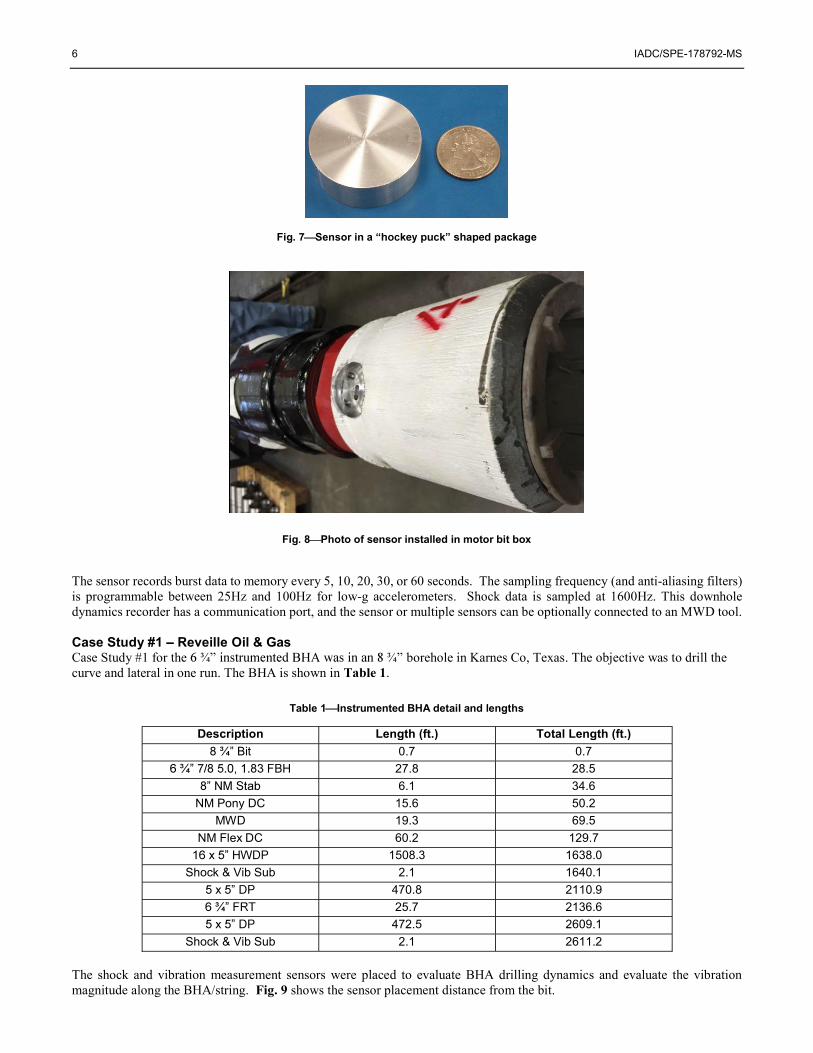
The same sensors, electronics and battery hockey puc for installation in the motor bit box right behind the bit. Fig. 7 shaped package. Fig. 8 shows an example of the sensor installation in a bit box.
Fig. 5 Sensor package under a hatch cover
Fig. 4 The sensor pressure housing
Fig. 6 Sensor hatch cover in a string sub
6 IADC/SPE-178792-MS
The sensor records burst data to memory every 5, 10, 20, 30, or 60 seconds. The sampling frequency (and anti-aliasing filters) is programmable between 25Hz and 100Hz for low-g accelerometers. Shock data is sampled at 1600Hz. This downhole dynamics recorder has a communication port, and the sensor or multiple sensors can be optionally connected to an MWD tool. Case Study #1 Reveille Oil & Gas Case Study #1 for the borehole in Karnes Co, Texas. The objective was to drill the curve and lateral in one run. The BHA is shown in Table 1.
Description Length (ft.) Total Length (ft.) Bit 0.7 0.7
27.8 28.5 6.1 34.6
NM Pony DC 15.6 50.2 MWD 19.3 69.5
NM Flex DC 60.2 129.7 1508.3 1638.0
Shock & Vib Sub 2.1 1640.1 470.8 2110.9 25.7 2136.6 472.5 2609.1
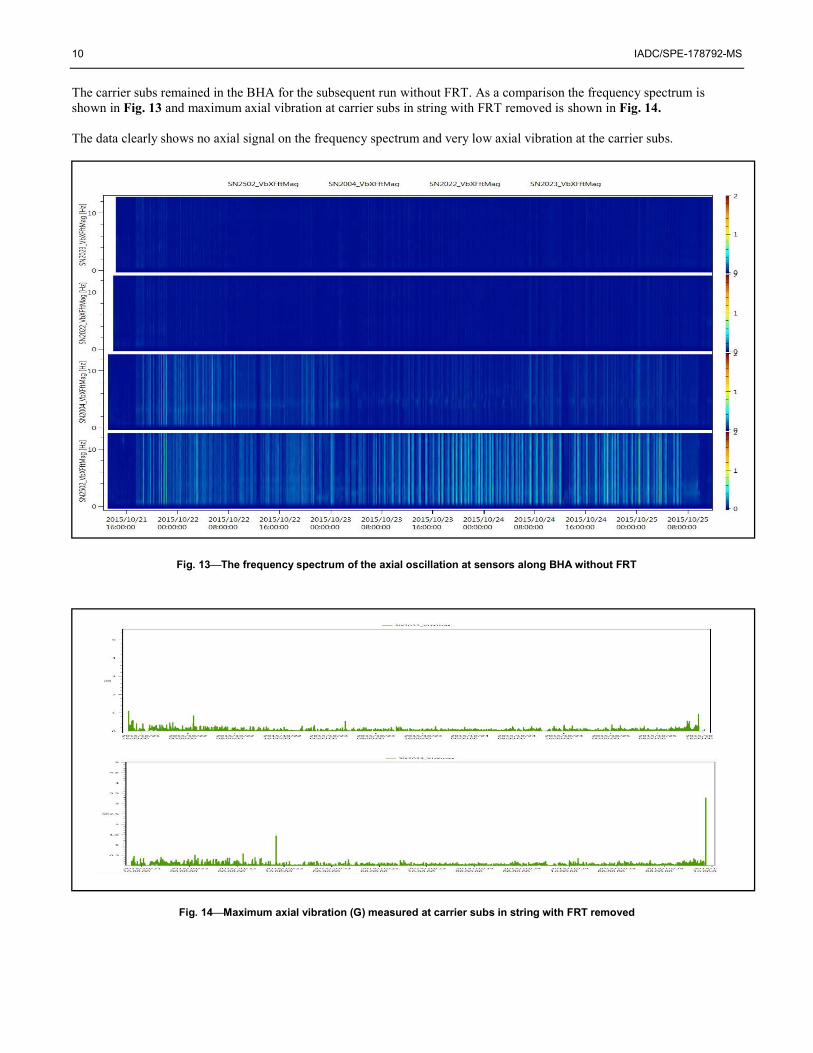
Shock & Vib Sub 2.1 2611.2 The shock and vibration measurement sensors were placed to evaluate BHA drilling dynamics and evaluate the vibration magnitude along the BHA/string. Fig. 9 shows the sensor placement distance from the bit.
Fig. 8 Photo of sensor installed in motor bit box
Fig. 7 Sensor in a package
Table 1 Instrumented BHA detail and lengths
IADC/SPE-178792-MS 7
The fully instrumented BHA drilled from 4,275ft to 5,151ft building inclination per well plan. Unfortunately the assembly was pulled prematurely for gamma failure. The FRT was laid down for the subsequent run in order to evaluate the shock and vibration data. Downhole Data Analysis A full data set was gathered from each sensor downhole. Fig. 10 shows the axial vibration (VbXmax) at the various sensors distributed along the BHA. The strongest axial vibration levels are generated at the FRT as would be expected, with maximum spread levels of 0.5 to 2.5G being recorded. The vibration spread level is reduced 500 ft. above and 500 ft. below the FRT, but the maximum G levels are still in 0.5 to 1.5G range. The maximum axial accelerations at the motor top sub and bit box are typically below 1G. There were no excessive axial shocks measured during the run. Fourier transform (Fourier 1822) was applied to the axial vibration data to identify the oscillation frequency of the FRT. As can be seen in Fig. 11, the detected axial oscillation frequency (the center frequency) is approximately 8.0Hz (±0.2Hz), based on the given tool setup and flow rate. The frequency spectrum also shows the intensity level of the measurements at each sensor along the BHA. Sensor #2022
he sharpest and cleanest signal; however, the FRT operating frequency can be observed on all sensors. It can be noted the intensity is higher when the assembly is picked up off bottom allowing the unloaded string to ring with axial oscillations. The sensors in the motor recorded the lowest axial vibration amplitude while drilling. The oscillation frequency signature is still detectable but at a much lower amplitude while drilling. When the assembly was picked-up off bottom, higher amplitude axial oscillation vibrations are being transferred to the bit. A complex wave propagation behavior based on standing waves and boundary conditions (e.g. on/off bottom) was observed in this data set. Fig. 12 shows the axial/lateral shocks at all sensors along the BHA and calculated downhole RPM at bit box and top sub on the motor. Shocks recorded throughout the run were low, general below 20G with occasional spike in lateral shock at the bit of 50G. The RPM difference between rotating and sliding can be seen clearly. The RPM at the bit was steadier when there was no string rotation.
Fig. 9 Instrumented sensor placement from bit

8 IADC/SPE-178792-MS
Fig. 10 Maximum axial vibration (G) measured at sensors along BHA

IADC/SPE-178792-MS 9
Fig. 11 The frequency spectrum of the axial oscillation at sensors along BHA
Fig. 12 Lateral/Axial Shocks from all sensors and RPM from bit box and top sub
10 IADC/SPE-178792-MS
The carrier subs remained in the BHA for the subsequent run without FRT. As a comparison the frequency spectrum is shown in Fig. 13 and maximum axial vibration at carrier subs in string with FRT removed is shown in Fig. 14. The data clearly shows no axial signal on the frequency spectrum and very low axial vibration at the carrier subs.
Fig. 14 Maximum axial vibration (G) measured at carrier subs in string with FRT removed
Fig. 13 The frequency spectrum of the axial oscillation at sensors along BHA without FRT
IADC/SPE-178792-MS 11
Case Study #2 Operator X Case S borehole in Dimmit Co, Texas. The objective was to drill the curve and lateral in one run. The BHA is shown in Table 2.
Description Length (ft.) Total Length (ft.) 1.00 1.00
4/5 7.0 29.04 30.04 NM Stab 4.85 34.89
NM Pony DC 15.27 50.16 NMDC 31.02 81.18
GAP SUB 3.58 84.76 NM Flex 29.78 114.54 NM Flex 29.15 143.69
X/O 3.83 147.52 20- STDS 5''DP 1894.04 2041.56 Shock & Vib Sub 2.14 2043.7 5- STDS 5'' DP 473.15 2516.85
11.57 2528.42 AMPLIFIER 14.42 2542.84
5- STDS 5'' DP 473.57 3016.41 Shock & Vib Sub 2.13 3018.54
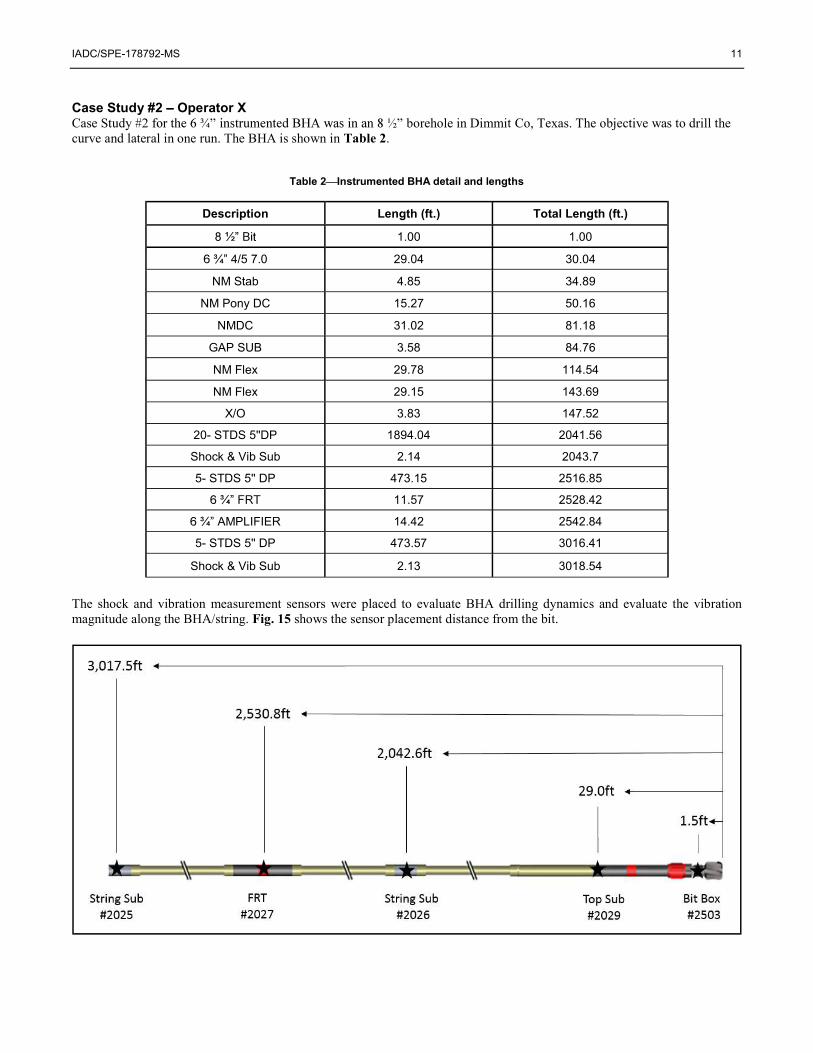
The shock and vibration measurement sensors were placed to evaluate BHA drilling dynamics and evaluate the vibration magnitude along the BHA/string. Fig. 15 shows the sensor placement distance from the bit.
Table 2 Instrumented BHA detail and lengths

12 IADC/SPE-178792-MS
The fully instrumented BHA drilled from 5,337ft to 15,843ft building inclination per well plan through the curve and along the lateral to TD (total depth). A total of 10,506ft was drilled in 53 hours with an average ROP of 198ft/hr. Downhole Data Analysis A full data set was gathered from each sensor downhole. Fig. 15 shows the axial vibration (VbXmax) at the various sensors distributed along the BHA. The data gathered from this well showed a spread of 0.2 to 0.8G (when pumping 570-590 GPM) at the FRT and carrier subs 500ft. above and below. Higher levels of axial vibration can be seen at the bit. There were no excessive axial shocks measured during the run. Fourier transform was applied to the axial vibration data to identify the oscillation frequency of the FRT. As can be seen in Fig. 16, the detected axial oscillation frequency (the center frequency) is approximately 8.0Hz (±0.2Hz), based on the given tool setup and flow rate. The frequency spectrum also shows the intensity level of the measurements at each sensor along the BHA. Sensor #2026
, however the FRT operating frequency can be observed on all sensors. It can be noted the intensity is higher when the assembly is picked up off bottom allowing the unloaded string to ring with axial oscillations. The sensors in the motor top sub recorded the lowest axial vibration amplitude while drilling. The oscillation frequency signature is still detectable but at a much lower amplitude while drilling. When the assembly was picked-up off bottom, higher amplitude axial oscillation vibrations are being transferred to the bit. A complex wave propagation behavior based on standing waves and boundary conditions (e.g. on/off bottom) was observed in this data set. Fig. 17 shows the axial/lateral shocks at all sensors along the BHA (top plot) and calculated downhole RPM at bit box and top sub on the motor. Shocks recorded throughout the run were low, generally less than 15G. High shocks were noted at the start of the run, with lateral peaks of 180G at the bit while drilling out shoe track/shoe and rathole. The RPM difference between rotating and sliding can be seen clearly in the bottom plot.
Fig. 15 Instrumented sensor placement from bit

IADC/SPE-178792-MS 13
Fig. 15 Maximum axial vibration (G) measured at sensors along BHA

14 IADC/SPE-178792-MS
Fig. 16 The frequency spectrum of the axial oscillation at sensors along BHA
Fig. 17 Lateral/Axial Shocks from all sensors and RPM from bit box and top sub

IADC/SPE-178792-MS 15
Overall Results The data retrieved from the downhole shock and vibration sensors provided valuable information on the FRT axial oscillations and their magnitude along the BHA/string while drilling and reaming. The frequency spectrum data showed that the tool was consistently providing approximately the 8Hz oscillation frequency throughout the runs and the only variance in oscillation frequency was due to changes in flowrate. The shock and vibration data showed that no excessive shock and vibration was being induced into the BHA and string from the FRT. The current FRT placement of 2,000ft to 2,500ft (depending on lateral length) behind the bit helped reduce toolface orientation time and increased slide and rotate drilling performance. The embedded sensors distributed through the BHA/string while testing the FRT were all securely collar mounted. These sensors give a more accurate measurement of the drilling shock and vibration functions that are being transmitted in the BHA. The ability to strategically place the sensors in the BHA/string allows measurements to be recorded at the points of interest for better definition, understanding and validation of the product. The drilling dynamics data provided information that can be used to optimize the BHA for different drilling applications. It was unfortunate that the FRT was laid out on Case Study 1, but this provided the opportunity to gather comparison measurements without the FRT in the string. The data set clearly shows the value of these measurements for BHA and drilling parameter optimization. Case Study 2 provided a better insight into the capability of the FRT while drilling a high-DLS curve and lateral section in one run. Embedded sensors and carrier subs continue to be run to better understand axial oscillation response in the BHA/string in different drilling environments and mud types. Conclusions The use of embedded collar mounted shock and vibration sensors distributed through the BHA confirmed that the FRT was effective in transmitting axial oscillations along the BHA without introducing any damaging effects to the BHA. The FRT produced constant axial oscillations throughout the runs. The oscillation amplitude measurements from the various sensors in the BHA will be used to optimize BHA designs for future wells. The embedded collar sensors recorded lower shock and vibration measurements compared to retrievable MWD system measurements. The shock and vibration sensors continue to be run in a variety of well profiles with the FRT. The data is being gathered to compile a database for FRT placement optimization. Torque and drag analysis will be used in the future to compliment the measurements obtained from these downhole sensors. Embedded shock and vibration sensors will become a standard part of the FRT to evaluate performance over the course of the run and field development. This information can be downloaded post-job to share with the operator as a quality check for system performance. Acknowledgments The authors would like to thank Turbo Drill Industries and Scout Downhole Inc. for their willingness to publish the data obtained with the FRT and downhole dynamics sensors. We are grateful to the management of Turbo Drill Industries and Scout Downhole Inc. for permitting the publication of this work. References Fourier, J. B. J. 1822. Théorie Analytique de la Chaleur, Paris: Chez Firmin Didot, père et fils Gee, R., Hanley, C., Hussain, R. et al. 2015. Axial Oscillation Tools vs. Lateral Vibration Tools for Friction Reduction What's the Best
Way to Shake the Pipe? Paper SPE 173024-MS presented at the IADC/SPE Drilling Conference and Exhibition, London, United Kingdom, 17 19 March.
Shor, R.J., Dykstra, M.W., Hoffmann, O.J. et al. 2015. For Better or Worse: Applications of the Transfer Matrix Approach for Analyzing Axial and Torsional Vibration. Paper SPE 173121-MS presented at the IADC/SPE Drilling Conference and Exhibition, London, United Kingdom, 17 19 March.