Jbi 33 4 oc - · PDF fileR.D.Sagarin and G.N.Somero:Complex patterns of expression of...
15
Journal of Biogeography Volume 33 Number 4 April 2006 Editor-in-Chief: Robert J. Whittaker ISSN 0305-0270
Transcript of Jbi 33 4 oc - · PDF fileR.D.Sagarin and G.N.Somero:Complex patterns of expression of...

Front cover: Nizamuddinia zanardinii (Schiffner) P.C. Silva, a monotypic brown alga endemic to the Arabian Sea. This key-stone species forms extensive macroalgal stands and has been used as a flagship to characterize the upwelling areas of thenorth-western Indian Ocean (see p. 560 in this Issue). Photo: Tom Schils.
0305-0270(200604)33:04;1-Ywww.blackwellpublishing.comThis journal is available online at Blackwell Synergy.Visit www.blackwell-synergy.com to search the articlesand register for table of contents e-mail alerts.
Journal ofBiogeography
Volume 33Number 4April 2006
Editor-in-Chief: Robert J. Whittaker
Journal of BiogeographyV
olu
me 33
Nu
mb
er 4A
pril 2006
Pages 549–760
ISSN 0305-0270Journal of Biogeography
Volume 33, Number 4, April 2006
Contents
Guest EditorialA. Alfredo Bueno-Hernández and J. E. Llorente-Bousquets: The other face of Lyell: historical biogeography in his Principlesof geology 549–559
Methodological developments and applicationsT. Schils: The tripartite biogeographical index: a new tool for quantifying spatio-temporal differences in distributionpatterns 560–572G. Stuart, C. Gries and D. Hope: The relationship between pollen and extant vegetation across an arid urban ecosystem andsurrounding desert in Southwest USA 573–591Y. Deng, M. Horrocks, J. Ogden and S. Anderson: Modern pollen–vegetation relationships along transects on theWhangapoua Estuary, Great Barrier Island, northern New Zealand 592–608J. A. Navarro Alberto and B. F. J. Manly: The generation of diversity in systems of patches and ranked dominance 609–621R. D. Sagarin and G. N. Somero: Complex patterns of expression of heat-shock protein 70 across the southernbiogeographical ranges of the intertidal mussel Mytilus californianus and snail Nucella ostrina 622–630
Long-term ecological changeJ. S. Sibold, T. T.Veblen and M. E. González: Spatial and temporal variation in historic fire regimes in subalpine forestsacross the Colorado Front Range in Rocky Mountain National Park, Colorado, USA 631–647S. L. Stephens and W. J. Libby: Anthropogenic fire and bark thickness in coastal and island pine populations from Alta andBaja California 648–652D. Goetze, B. Hörsch and S. Porembski: Dynamics of forest–savanna mosaics in north-eastern Ivory Coast from 1954 to2002 653–664B. Chauvel, F. Dessaint, C. Cardinal-Legrand and F. Bretagnolle: The historical spread of Ambrosia artemisiifolia L. in Francefrom herbarium records 665–673K. K. Karanth, J. D. Nichols, J. R. Sauer and J. E. Hines: Comparative dynamics of avian communities across edges andinteriors of North American ecoregions 674–682
On species richness and endemismT.-S. Ding, H.-W.Yuan, S. Geng, C.-N. Koh and P.-F. Lee: Macro-scale bird species richness patterns of the East Asianmainland and islands: energy, area and isolation 683–693J. Beck, I. J. Kitching and K. Eduard Linsenmair: Determinants of regional species richness: an empirical analysis of thenumber of hawkmoth species (Lepidoptera: Sphingidae) on the Malesian archipelago 694–706B. J. Richardson, M. Zabka, M. R. Gray and G. Milledge: Distributional patterns of jumping spiders (Araneae: Salticidae) inAustralia 707–719M. Biondi and P. D’Alessandro: Biogeographical analysis of the flea beetle genus Chaetocnema in the Afrotropical Region:distribution patterns and areas of endemism 720–730L. Huidobro, J. J. Morrone, J. L.Villalobos and F. Álvarez: Distributional patterns of freshwater taxa (fishes, crustaceans andplants) from the Mexican Transition Zone 731–741S. Bentz, N. D. Sinnappah-Kang, L.-H. S. Lim, B. Lebedev, C. Combes and O.Verneau: Historical biogeography ofamphibian parasites, genus Polystoma (Monogenea: Polystomatidae) 742–749R. A. Moreno, C. E. Hernández, M. M. Rivadeneira, M. A.Vidal and N. Rozbaczylo: Patterns of endemism in south-easternPacific benthic polychaetes of the Chilean coast 750–759
Erratum 760
Jbi_33_4_oc.qxd 3/14/2006 5:55 PM Page 1

ORIGINALARTICLE
The tripartite biogeographical index: anew tool for quantifying spatio-temporaldifferences in distribution patterns
Tom Schils*
Phycology Research Group, Biology
Department, Ghent University, Krijgslaan,
Ghent, Belgium
*Correspondence: Tom Schils, University
of Guam Marine Laboratory, UOG Station,
96923 Mangilao, Guam, USA.
E-mail: [email protected]
ABSTRACT
Aims First, to develop an index that quantifies biogeographical patterns based on
the basic descriptors of presence/absence distribution patterns (F, frequency; C,
connectivity; G, grouping). Second, to test the proposed biogeographical index on
a data set of macrophyte communities in the Arabian Sea using distribution data
of macro-algae and seagrasses throughout the Indian Ocean.
Location Arabian Sea (regional macrophyte community data) and the larger
Indian Ocean (oceanic distribution data).
Methods The proposed index is derived from the Tulloss tripartite similarity
index. The tripartite biogeographical index (TBI ¼ � F · C · G ) is calculated
for a specific taxon and incorporates several fundamental parameters of presence/
absence data in grid cell (block) patterns. TBI accounts for the relative abundance
of a taxon, the average grouping of its occurrences, the average of minimal
absence intervals between taxon presences and the largest coherent cluster of
taxon occurrences, and also incorporates dispersal aspects. The macrophytes from
the case study are among the best documented marine organisms in the Indian
Ocean. The regional distribution data from the Arabian Sea result from
exhaustive species lists from Masirah Island (Oman) and the Socotra
Archipelago (Yemen).
Results TBI values fit a linear scale corresponding to the proportional presence
and the distributional spread of taxa within a given geographical area. The three
functions that constitute TBI can be evaluated separately or in association with
TBI, to give detailed information on the important factors that characterize the
biogeographical distribution of a taxon (or larger entities consisting of multiple
taxa such as communities). The case study on Arabian macrophytes clarifies the
use and explanatory power of the index.
Main conclusions The biogeographical descriptors can be combined into an
index which accurately quantifies taxon occurrences and distribution types on a
single linear scale from rare/scattered to abundant/grouped. Together with its
three functions, the index allows for a non-arbitrary selection of taxa and taxon
groupings based on their distribution pattern. The analysis of TBI values for the
Arabian macrophyte communities confirms previous biogeographical findings
and enables more detailed statistical analyses of the distribution data.
Keywords
Arabian Sea, biogeography, connectivity, disjunct distributions, Indian Ocean,
landscape indices, macro-algae, marine macroecology, seagrasses, seaweeds.
Journal of Biogeography (J. Biogeogr.) (2006) 33, 560–572
560 www.blackwellpublishing.com/jbi ª 2006 The Authorsdoi:10.1111/j.1365-2699.2005.01416.x Journal compilation ª 2006 Blackwell Publishing Ltd

INTRODUCTION
Various approaches have been proposed for the analysis of
coarse-scale biogeographical patterns based on large species
inventories. Dealing with presence/absence data, grid cells are
commonly used as input data. Depending on the detail of
complete taxon inventories, these grid cells cover various areas
defined by geographical limits (e.g. degrees latitude and
longitude; O’Hara & Poore, 2000) to a priori defined
geographical units (Samyn & Tallon, 2005). Generally, these
data matrices are analysed using multivariate techniques and
traditional similarity indices. Hence the resulting biogeograph-
ical patterns are based solely on the common taxa within two
or more lists (similarities at the taxon level), and do not take
into account similarities in distribution patterns. Upwelling
areas of the Arabian Sea, for example, are characterized by
species with disjunct distributions that occur in Arabia, South
Africa and Western Australia. Different habitats within these
upwelling areas can harbour different macrophyte species. Yet
the biogeographical affinity of the macrophyte assemblages
from these habitats can be analogous, because their composite
species display similar distribution patterns within the Indian
Ocean. In this study, an alternative index that quantifies the
biogeographical spread of a single taxon is presented. In a
further step, the biogeographical indices of the taxa that
compose a community, a flora or a fauna can be averaged and
compared with others.
In our studies on the marine macrophyte communities of
the Arabian Sea (Schils & Coppejans, 2003a,b), an index was
required that revealed information on the basic descriptors
(Table 1) of nominal distribution patterns (presence/absence
matrix). The previously defined macro-algal communities
(Fig. 1) were correlated with the predominant environmental
parameters, particularly those linked with the seasonal upwel-
ling of cold, nutrient-rich water. Biogeographically, these
communities differ in the richness of widespread, disjunctly
distributed and endemic taxa. The differences in the overall
biogeographical signal can be visualized by using the Simpson
coefficient (SC; Schils & Coppejans, 2003a). The SC measures
the similarity between two lists of taxa as the ratio of common
taxa between both lists divided by the number of taxa in the
smaller of the two lists. Hence the SC is not sensitive to the
relative size of both data sets, which is a necessary requirement
if two consistently unequal data sets are compared unidirec-
tionally (e.g. regional macrophyte communities vs. macro-
phyte inventories on an oceanic scale). Thus the affinity
between a regional list of taxa and a biogeographical area
increases when the total number of taxa common to both the
smaller and larger list increase, and vice versa. This method
does not calculate similarities based only on the type of
distribution pattern, so further numerical analyses (descriptive
statistics) or a non-arbitrary selection of taxa based on
individual biogeographical patterns are not possible. To enable
these further investigations to be performed, the new index
must quantify both aspects that characterize the distribution of
a taxon (abundance and clustering) into a single linear scale
from rare/scattered to abundant/grouped. Application of the
new index is demonstrated using distribution data for
macrophytes of the Arabian Sea. Distribution records of
macro-algae and seagrasses within the Indian Ocean are among
the most complete relative to other major marine groups. One
weakness of these data is the low geographical resolution
(qualitative species lists at country and island level). This
disadvantage is largely countered by the high proportion of the
Indian Ocean shoreline that these nations possess and the large
number of species that are recorded in the database.
MATERIALS AND METHODS
Distribution patterns
The tripartite biogeographical index (TBI) uses nominal
distribution data in block patterns (grid cells). Certain blocks
may function only as connectivity (dispersal) blocks where the
settlement of a taxon is not possible, for example pelagic areas
serving as dispersal routes for tissue fragments, spores, seeds or
larvae, but inhospitable for the adult benthic organisms.
Connectivity blocks are excluded when counting the total
amount of cells that constitute the complete potential distri-
bution range, a value used in calculating TBI. Grid patterns are
not necessarily square matrices; areas that are unlikely for the
establishment of a taxon and which do not function as
connectivity blocks (e.g. dispersal barriers and inhospitable
regions) are excluded from the grid.
Definition of tripartite biogeographical index
The TBI is derived from the tripartite similarity index (TSI;
Tulloss, 1997). The TSI was developed to counter the
inconsistencies of the 20 most commonly used similarity
indices, inconsistencies that are mainly related to discrepancies
of size between two lists of taxa. Three requirements, identified
as potentially conflicting for the similarity index, have been
translated mathematically into three functions. The parameters
used for the calculation of TSI are denoted as follows (Hayek,
1994): a, number of entries common to both lists; b, number
of entries in the first list that are not in the second; c, number
of entries in the second list that are not in the first. The first
function:
U ¼log 1þ minðb;cÞþa
maxðb;cÞþa
� �log 2
ð1Þ
is sensitive to size differences between two lists of taxa. The larger
the size difference, the lower U and TSI. The second formula:
S ¼ffiffiffiffiffiffiffiffiffiffiffiffiffiffiffiffiffiffiffiffiffiffiffiffiffiffiffiffiffiffiffiffi
log 2
log 2þ minðb;cÞaþ1
� �vuut ð2Þ
reflects size differences between a subset of common taxa
between both lists and the smaller of the two lists. When this
difference increases, the value of TSI decreases and vice versa.
The tripartite biogeographical index
Journal of Biogeography 33, 560–572 561ª 2006 The Authors. Journal compilation ª 2006 Blackwell Publishing Ltd

The third function:
R ¼log 1þ a
aþb
� �� log 1þ a
aþc
� �log 2ð Þ2
ð3Þ
represents the number of taxa common to the two lists in
proportion to both the larger and smaller list. R and TSI
increase when the proportion of common taxa increases for
both lists. The three functions are based on logarithms base 2.
In the calculations, log functions are converted to log2
Table 1 Definitions of parameters used to
calculate the tripartite biogeographical index
(TBI)
TBI Tripartite biogeographical index: a linear scale to quantify distribution pat-
terns based on the frequency, connectivity and grouping of taxon occurrences.
TBI ¼ � F · C · G
F Frequency: number of areas (#PB) in which a taxon is detected, expressed as a
fraction of the total number of areas investigated (#B)
C Connectivity: measure of connectedness between distribution areas (or pop-
ulations) of a single taxon within a specific geographical region; C is a function
of isolation distance (ABG) and size of distribution areas (PBG)
G Grouping: spread of distribution areas of a single taxon in relation to the
geographical region under study (function of PBC and #PB) and the minimal
distance necessary to unite all separate distribution areas (function of ABC and
#PB)
B Block (grid cell) of a distribution grid
#B Total number of blocks within a specific distribution grid. Connectivity blocks
are not part of the potential distribution area for a specific taxon and thus are
excluded from the calculation of #B
AB Absence block: a grid cell where the taxon is not known to occur. Connectivity
blocks can count as absence blocks
#AB Total number of ABs for a specific grid pattern or a specified selection thereof
(e.g. ABG or ABC)
PB Presence block: a grid cell where the taxon occurs
#PB Total number of PBs for a specific grid pattern or a specified selection thereof
(e.g. PBG or PBC)
ABG Absence block group: a group of ABs that connect two PBGs. Only one set of
ABGs is utilized for the calculation of TBI. This set meets the following three
requirements:
(1) all ABGs together connect all PBGs
(2) total number of ABs of the set of ABGs is as low as possible
(3) of all potential ABG sets that fulfil the above two requirements, the
ultimate set consists of the highest number of ABGs possible (i.e. the
average #AB per ABG is the lowest possible).
#ABG Number of ABs in an ABG
PBG Presence block group: a group of PBs that form one unity without any absence
gaps (continuous distribution area). All PBs belong to a PBG, thus taxa that
occur in the studied region (distribution grid) have at least one PBG
#PBG Number of blocks (grid cells) within a PBG
ABC Absence block cluster: a selection of ABGs with three requirements –
(1) the selection of ABGs must connect all PBGs
(2) the selection of ABGs should include the lowest possible number of
absence blocks
(3) if different selections of ABGs meet both stipulations above, choose a
selection with the highest number of ABGs (consequently, the average
#ABG within the selection, ABC, is as low as possible)
#ABC Number of ABs in an ABC
PBC Presence block cluster: a continuous cluster of PBGs and ABGs. Further
requirements of such a cluster are:
(1) PBGs are linked by ABGs, when #AB of the ABG is smaller or equal to
#PB of each of the PBGs that are connected
(2) of all possible clusters of PBGs and ABGs for a specific distribution grid
that fulfil the above stipulation, the ultimate PBC contains the highest
net number of presence blocks (see #PBC)
#PBC Net amount of blocks in a PBC, being #AB of the PBC subtracted from
#PB of the PBC
T. Schils
562 Journal of Biogeography 33, 560–572ª 2006 The Authors. Journal compilation ª 2006 Blackwell Publishing Ltd

functions through a division of log 2. The multiplication of the
three functions generates the tripartite similarity index
(TSI ¼ � U · S · R ) representing the similarity between
two lists of taxa, thereby avoiding anomalies present in
other indices. Instead of being a similarity index between
two lists of taxa, TBI is a landscape index which quantifies
the spread between a number of distribution areas of a
single taxon in relation to the entire area investigated.
Analogous to the size differences between two lists of taxa or
subsets thereof, size differences between distribution para-
meters also need to be accounted for in TBI. The require-
ments and the resulting functions for TBI are similar to those of
TSI. The similarity parameters of TSI are replaced by landscape
parameters (Table 1) relevant to biogeographical distribution
patterns, as explained below. The TBI functions are also based
on logarithms base 2 and are computed in three steps.
The first function of TSI (Tulloss, 1997), U, quantifies the
difference in taxon numbers between two lists. In calculating
TBI, a similar function (F) is used to quantify the absolute
proportion of observed occurrences of a single taxon within a
given distribution grid (potential distribution range). Thus the
first function,F, is ameasure for the relative frequency of a taxon:
F ¼log 1þ #PB
#B
� �log 2
ð4Þ
In this function, #PB represents the total number of presence
blocks (grid cells where the taxon is observed); and #B
represents the total number of blocks where the taxon might
occur (potential distribution range of the studied organisms).
#B can differ from the total amount of blocks in a distribution
and connectivity pattern, when certain blocks are marked as
dispersal routes where the taxon cannot settle (connectivity
blocks). Hence connectivity blocks are not accounted for in #B.
F is £ 1 and > 0 (a zero value means the taxon does not occur
within the area investigated, so is not included in the analysis).
Figure 1 Macroalgal communities of (a) the Arabian Sea; (b) Masirah Island; (c) the Socotra Archipelago. Coasts investigated are
characterized by the dominant marine macrophyte communities according to Schils & Coppejans (2003a). Horizontally shaded areas
represent the upwelling communities of Masirah’s East Coast (MAS EC), and the south coasts of Socotra and the outer islands (S&O SC).
The upwelling sheltered shores at Masirah’s west coast (MAS WC) and the north coasts of Socotra and the outer islands (S&O NC) are
indicated by a sparse dot pattern. Socotra’s north coast (SOC NC) is a subentity of the latter community and is depicted by dense dot
patterns. Areas with extensive seagrass beds (MAS SG and SOC SG) are vertically shaded. Plate Carree map projection (equidistant
cylindrical map with 0� as standard parallel; Robinson et al., 2000).
The tripartite biogeographical index
Journal of Biogeography 33, 560–572 563ª 2006 The Authors. Journal compilation ª 2006 Blackwell Publishing Ltd

While the function S in TSI quantifies the proportion of
common taxa in relation to the smallest list of taxa, the
connectivity (C) of TBI represents the number of presences
vs. the number of gaps in discontinuous distributions. Thus
C measures the distances between the distribution areas for a
single taxon. The greater this distance is in relation to the size
of the distribution areas, the lower the value of C. As
multiple distance paths might be needed to link the
distribution areas, the isolation distances are squared and
thereafter averaged. A situation in which the total isolation
distance between distribution areas is equal, this will favour a
greater number of short distances over a smaller number of
long distances. As the value of C for a continuous distribu-
tion ¼ 1, the square root of the average squared distance is
multiplied by the total number of grid cells. In order to relate
the isolation distance to the size of the distribution, this
equation is then divided by the square root of the average
squared distribution areas. Thus C is a function of the
connectivity (the inverse of distance, defined by absence
blocks) between continuous distribution ranges (presence
block groups):
C ¼ffiffiffiffiffiffiffiffiffiffiffiffiffiffiffiffiffiffiffiffiffiffiffiffiffiffiffiffiffiffiffiffiffiffiffiffiffiffiffiffiffiffiffiffiffiffiffiffiffiffiffiffiffiffiffiffiffiffiffiffiffiffiffiffiffiffiffiffiffiffi
log 2
log 1þ
ffiffiffiffiffiffiffiffiffiffiffiffiffiffiffiffiffiffiffiffiffiffiffiffiffiffiffiffiffi 1þ
Pni¼1
ð#ABGiÞ2
n
vuut !�ð#BÞ
ffiffiffiffiffiffiffiffiffiffiffiffiffiffiffiffiffiffiffiffiffiPmi¼1
ð#PBGiÞ2
m
s0BBBBBB@
1CCCCCCA
vuuuuuuuuuuut
ð5Þ
In this equation, #PBG represents the maximal size of a
presence block group (adjacent presence blocks without
absence gaps), that is, the number of blocks composing a
continuous distribution range. An absence block group (ABG)
is defined as the minimal number of adjoining absence blocks
needed to link two or more PBGs, that is, the shortest path
between continuous distribution ranges. From all possible
ABGs, a selection of ABGs is chosen which connects all PBGs
of the distribution grid. A further requirement of the latter
selection is that the total number of blocks within this set of
ABGs is minimized. In case different sets of ABGs consist of
equally low numbers of absence blocks, the ultimate set
(termed the absence block cluster, ABC) should consist of
absence groups with the lowest average number of blocks per
group (the highest number of groups consisting of the lowest
total number of absence blocks). #ABC thus represents the
total number of absence blocks included in the ultimate set of
ABGs. #B accounts for the total number of grid cells (excluding
connectivity blocks). C also ranges from values > 0 to a
maximum of 1 (being omnipresent in a situation without
dividing connectivity barriers).
The third function of TSI (Tulloss, 1997), R, is a formula
based on the relative proportion of common taxa in both lists
of taxa. Grouping (G) is also defined by relative proportions. G
is high when the spread of taxon occurrences can be confined
to an area with a low number of discontinuous gaps (taxon
absences). Thus G is based on R where the similarity
parameters are replaced by two ratios of landscape parameters:
(1) the proportion of the largest presence block cluster to the
total grid; and (2) the compactness of clustering. Thus the
third function, G, is a measure of the degree of grouping
between continuous distribution areas allowing for small
absence gaps, which reduce G:
G ¼log 1þ #PBC
#PB
� �� log 1þ #PB
#PBþ#ABC
� �log 2ð Þ2
ð6Þ
In this equation #PBC is the highest count of presence
blocks that can be clustered by connecting them with ABGs:
the maximum number of presence blocks in a cluster minus
the minimal number of absence blocks in that cluster. A cluster
thus consists of a combination of PBGs and ABGs, where each
#ABG is smaller or equal to all the connected (flanking)
#PBGs. The remaining parameters (#PB and #ABC) for
calculating G are described above. G also varies from values
> 0 to a maximum of 1.
Analogous to the Tulloss index (Tulloss, 1997), the square
root scaling of the multiplication of the three functions results
in the tripartite biogeographical index:
TBI ¼ pF � C � G ð7Þ
Without scaling, TBI values could become disproportion-
ately small in comparison with the values of the three
functions. This suggests that more numbers are needed for
the decimal accuracy of TBI values in relation to those of the
composing functions. Third-order root scaling of the multi-
plied functions, on the other hand, yields higher TBI values,
but the range of values becomes too small.
Case study: macrophyte communities of the Arabian
Sea
This example illustrates the use of TBI for the distribution of
different taxa in a single spatial distribution index. The
biogeographical index was computed for the marine macro-
phyte communities around Masirah Island (Oman) and the
Socotra Archipelago (Yemen), as discussed by Schils &
Coppejans (2003a). In order to estimate connectivity and
grouping of species distributions within the Indian Ocean, a
simplified two-dimensional grid pattern (basically a linear
distribution pattern with interrelated dispersal connections)
was used in the study.
The distribution data of Indian Ocean algae was taken from
PhycoBase (Schils et al., 2004). PhycoBase is primarily based
on Silva et al. (1996) and supplemented with records from
omitted and recent sources: Dickie (1888); Holmes (1903);
Cordero (1993); Nizamuddin & Campbell (1995); Shaikh &
Shameel (1995); De Clerck & Coppejans (1996); Hayee-
Memon & Shameel (1996); Jupp et al. (1996); Sohrabi Pour &
Rabii (1996); Critchley et al. (1997); Kemp (1998); Spalding
et al. (1998); Wynne (1998); Wynne & Jupp (1998); Aliya &
Shameel (1999); De Clerck & Coppejans (1999); OSP (1999);
T. Schils
564 Journal of Biogeography 33, 560–572ª 2006 The Authors. Journal compilation ª 2006 Blackwell Publishing Ltd

Shameel (1999); Sohrabipour & Rabii (1999); Wynne
(1999a,b); Coppejans et al. (2000); Huisman (2000); Shameel
et al. (2000); Wynne (2000); Bandeira et al. (2001); Wynne
(2001a,b); Wynne & Leliaert (2001); Coppejans et al. (2002);
De Clerck et al. (2002); Huisman & Schils (2002); Schils &
Coppejans (2002); Shameel (2002); Wynne (2002a,b); Wynne
& de Jong (2002); Carvalho & Bandeira (2003); De Clerck
(2003); Green & Short (2003); Richards & Wynne (2003);
Schils et al. (2003a,b); Schils & Coppejans (2003a,b); Wynne
(2003a,b, 2003c); Coppejans et al. (2004); De Clerck et al.
(2004); Huisman et al. (2004); Leliaert (2004); Schils et al.
(2004); Wynne & Freshwater (2004); Wynne (2004); Guiry &
Nic Dhonncha (2005); Wynne (2005). The above references
encompass practically all macrophyte species records for the
Indian Ocean that have been published to date. The large
majority of these publications are written by experienced algal
taxonomists and are to some extent validated by Silva et al.
(1996).
Since distribution data of macro-algae within the Indian
Ocean have the highest resolution (information and detail) at
country level, grids are equated with the countries and islands
for which detailed species lists exist (Fig. 2). Although unequal
in size, these country blocks represent coherent aggregates of
coordinate grids and reflect oceanographic conditions at a
coarse scale. As this example examines biogeographical
affinities at a coarse scale (coastal areas within the Indian
Ocean), the use of these broadly defined grids suffices.
Furthermore, most macrophytes have high dispersal capacities,
making the assumption of connectivity between these large
grid cells plausible. It was not feasible to account for current
patterns, many varying seasonally in intensity and direction.
An analysis of this data set using the TBI should (1) confirm
the previous results; and (ideally) (2) reveal more detailed
information about the distribution patterns within the differ-
ent species assemblages.
In a first step, TBI was calculated for 189 taxa. These 189
macrophytes represent the marine flora of the sampled sites of
the Socotra Archipelago and Masirah Island (Schils &
Coppejans, 2003a). However, enigmatic algae (e.g. small
epiphytes and crustose algae) were excluded from this data
set, and Indian Ocean records of related taxa that might have
been misidentified were lumped. For clarification, the
distribution pattern of two species, the calculation parameters,
the computed functions and the TBI are presented in Fig. 3.
Thereafter, the linear scale of TBI was compared with two
descriptors (proportional presence and distributional spread)
that characterize different types of distribution pattern. The
moving averages of the latter two parameters have been
correlated with TBI. Moving averages (interval ¼ 10) were
chosen because: (1) the graphic representation is clearer as
several species contained the same TBI values; and (2) this
method evens out the inverse relationship between extremes of
the descriptors that compose TBI (proportional presence and
distributional spread). In these correlations the proportional
presence is defined as #PB/#B. The distributional spread has
been calculated using two independent methods and the
results have been compared. Analogous to the calculation of
TBI, one way of representing the distributional spread was
counting the minimal number of absence blocks that link all
presence clusters. The second approach consisted of measuring
the minimal total distance (km) that links the continuous
distribution ranges (plate carree map projection: equidistant
cylindrical map with 0� as standard parallel; Robinson et al.,
2000). These correlations also resulted in a TBI scale that could
be related to different types of distribution pattern. Subse-
quently, the average TBI values and the proportional
Figure 2 Macroalgal distribution data within the Indian Ocean. (a) Map showing the 17 countries and islands for which detailed species
lists are available. (b) Schematic representation of the 17 countries and islands of the Indian Ocean in a grid pattern for the calculation of
TBI. Shaded cells marked ‘C’ indicate connectivity blocks. Numbers correspond to following countries and islands: 1, South Africa (Indian
Ocean coast); 2, Mozambique; 3, Madagascar; 4, Reunion; 5, Mauritius; 6, Tanzania; 7, Kenya; 8, Seychelles; 9, Somalia; 10, Yemen; 11,
Oman; 12, Pakistan; 13, India; 14, Maldives; 15, Sri Lanka; 16, Indonesia; 17, Western Australia. Countries and islands included correspond
to the species distributions listed by Silva et al. (1996).
The tripartite biogeographical index
Journal of Biogeography 33, 560–572 565ª 2006 The Authors. Journal compilation ª 2006 Blackwell Publishing Ltd

distribution of taxa in four categories (TBI £ 0.25;
0.25 £ TBI £ 0.50; 0.50 £ TBI £ 0.75; 0.75 £ TBI) of the dif-
ferent communities were compared with their general bioge-
ographical affinity within the Indian Ocean, as computed by
Schils & Coppejans (2003a). Assumptions on the proportion of
endemic and disjunctly distributed species for two similar
communities were analysed by: (1) selecting the taxa with a
TBI £ 0.25 for each community (endemic and disjunctly
distributed taxa); and (2) analysing the functions of the species
selected.
RESULTS
On calculation of the TBI values and composing functions for
each of the 189 species, the relation between TBI and the
proportional presence (r ¼ 0.98; sr ¼ 0.02; P < 0.001) and the
distributional spread (r ¼ )0.73; sr ¼ 0.05; P < 0.001) were
analysed (Fig. 4a–c). Both relationships were linear and certain
TBI values were classified as outliers, allowing an interpret-
ation of the TBI scale. Species with TBI values ranging from
0.10 to 0.20 are characterized by a low number of presence
blocks, and high values of distributional spread (measured in
absence blocks, Fig. 4b, as well as kilometres, Fig. 4c:
r ¼ )0.70; sr ¼ 0.05; P < 0.001). The latter distribution
patterns can be described as rare and disjunctly distributed.
Species with a TBI value of 0.20 have exceptionally low values
for the proportional presence (one block) and the distribu-
tional spread (zero blocks or zero km). These are local endemic
species, known from only one grid cell within the Indian
Ocean. From 0.20 to 0.25 the proportional presence and
distributional spread increase, being species with an occasional
and disjunct or a scattered occurrence within the Indian
Ocean. The general pattern from 0.25 to 0.50 is an increase in
the proportional presence, while the distributional spread
decreases. At a TBI of 0.50, species occur frequently within the
Indian Ocean (98% of species with a TBI ‡ 0.500 occur in at
Figure 3 Distribution pattern of two
macroalgae with indication of the different
parameters (#B, #BP, #ABG, #ABG, #PBG,
#PBC), the computed functions (F, C, G),
and the tripartite biogeographical index
(TBI). Black blocks indicate species presence,
absence blocks are empty. Country numbers
and connectivity blocks are represented as in
Fig. 2. (a) Calliblepharis fimbriata (Greville)
Kutzing; (b) Duckerella ferlusii (Hariot)
Wynne.
T. Schils
566 Journal of Biogeography 33, 560–572ª 2006 The Authors. Journal compilation ª 2006 Blackwell Publishing Ltd

least 50% of the total distribution range) and display a
scattered distribution pattern. Species with higher TBI values
are typified by being more widespread and having a more
continuous distribution within the Indian Ocean. Of the
included species with a TBI of ‡ 0.75, 95% occurs in at least
85% of the total distribution range. Species with a TBI value of
1 occur in all 17 countries or islands investigated. Table 2
synthesizes the linear scale of TBI values and the corresponding
distribution pattern.
A comparison of both independent measures for distribu-
tional spread reveals that their linear relationship with respect
to TBI is similar. Measuring distance gaps between continuous
distribution ranges by counting absence blocks fits the linear
trend best (R2 ¼ 0.54; Fig. 4b). The method based on
geographical distances (km) shows a slightly larger spread
(R2 ¼ 0.49; Fig. 4c). Ungrouped distribution ranges are more
pronounced in the latter approach, as absence distances are
relatively larger. When the degree of distributional spread
relative to the total distribution range is correlated to TBI
(Fig. 5a,b), the geographical distance and the absence block
count show a similar fit to the exponential trend (r ¼ )0.76,P < 0.001). Furthermore, both graphs (Fig. 5a,b) show that
the most pronounced deviations from the general trend are to
be found at lower TBI values (< 0.25), being mainly species
with disjunct or scattered distribution patterns. Nevertheless,
both measurements of distributional spread are highly
correlated (r ¼ 0.99, sr ¼ 0.01; P < 0.001); have similar
responses to TBI; and reveal the same results. These findings
justify the use of the simplified grid.
Next, the average TBI of the composing species was
calculated for each community, which correlates well
(r ¼ 0.99; sr ¼ 0.08; P < 0.001) with the SC of these
communities as reported by Schils & Coppejans (2003a);
Table 3). Table 3 lists the communities according to their
average TBI values, and shows the proportional species
representation (percentage) in each of the four designated
TBI categories. The communities with a similar species
composition (TSI values in Schils & Coppejans, 2003a), such
as MAS EC and S&O SC, also show similar TBI values (see
Fig. 1 for definitions). The latter two communities are
characterized by a high proportion of species (‡ 50%) with a
TBI < 0.5. These upwelling communities contain a high
proportion of species with an endemic, disjunct and scattered
distribution. The TBI values of the upwelling protected
macrophyte communities of SOC NC and MAS WC still
contain a mixture of species that belong to TBI categories 1–2
(30.1 and 33.3%, respectively) and 3–4 (remaining percen-
tage), but with a marked dominance of widespread species.
0
10
20
30
40
50
60
70
80
90
100
0.0 0.1 0.2 0.3 0.4 0.5 0.6 0.7 0.8 0.9 1.0TBI
#PB
per
# B
(%
)
0
5
10
15
20
25
30
35
0.0 0.1 0.2 0.3 0.4 0.5 0.6 0.7 0.8 0.9 1.0TBI
Dis
trib
utio
nal s
prea
d:#A
B p
er #
B (
%)
0
1000
2000
3000
4000
5000
6000
7000
8000
0.0 0.1 0.2 0.3 0.4 0.5 0.6 0.7 0.8 0.9 1.0TBI
Dis
trib
utio
nal s
prea
d : k
m p
er #
B
Figure 4 Linear relationships between TBI and distribution
characteristics. (a) TBI vs. moving average (interval ¼ 10) of the
proportional presence (#PB/#B). (b) TBI vs. moving average
(interval ¼ 10) of the distributional spread (minimal number of
absence blocks linking all species occurrences). (c) TBI vs. moving
average (interval ¼ 10) of the distributional spread (minimum
distance linking all species occurrences).
Table 2 TBI values and general distribution patterns for macro-
algae within the Indian Ocean
TBI Distribution pattern
± 0.15 Rare, disjunctly distributed
± 0.20 Local endemics
± 0.25 Occasional, disjunct or scattered distribution
Regional endemics and onwards: increasing
presence and decreasing distributional spread
± 0.50 Frequent, scattered
± 0.65 Frequent, grouped
± 0.75 Abundant
1 Omnipresent
The tripartite biogeographical index
Journal of Biogeography 33, 560–572 567ª 2006 The Authors. Journal compilation ª 2006 Blackwell Publishing Ltd

Higher proportions of widespread tropical species (> 75% in
TBI categories 3–4) characterize the upwelling sheltered
communities of SOC SG, S&O NC and MAS SG.
Subsequently, attention is paid to the category TBI
£ 0.250 (Table 2) which contains the most particular species,
differentiating between the communities. Both upwelling
communities (MAS EC and S&O SC) are characterized by
the highest proportion of endemic and disjunctly distributed
species (TBI £ 0.250). The function values that constitute the
TBI of the two communities are listed in Table 4. The
average connectivity (C) does not differ between both
upwelling communities. The average frequency (F) and
especially the average grouping (G), on the other hand,
differ. MAS EC shows the lowest average F, where S&O SC
shows the lowest average G. This leads to the suspicion that
the former marine macrophyte community comprises more
endemic species, whereas the latter consists of a higher
proportion of species with a scattered distribution and a
slightly higher number of disjunctly distributed species
(equal average C). In order to verify this deduction, the
distribution patterns of the species belonging to TBI category
1 (£ 0.250) from both upwelling communities were analysed
and classified into three groups of distribution pattern
Dis
trib
utio
nal s
prea
d (#
AB
per
# P
B)
0
50
100
150
200
0.0 0.1 0.2 0.3 0.4 0.5 0.6 0.7 0.8 0.9 1.0TBI
Dis
trib
utio
nal s
prea
d (k
m p
er #
PB
)
0
200
400
600
800
1000
1200
1400
1600
1800
2000
2200
2400
0.0 0.1 0.2 0.3 0.4 0.5 0.6 0.7 0.8 0.9 1.0TBI
Figure 5 Exponential relationships between TBI and distribution
characteristics (a) TBI vs. moving average (interval ¼ 10) of the
ratio: distributional spread (minimal number of absence blocks
linking all species occurrences)/proportional presence (#PB). (b)
TBI vs. moving average (interval ¼ 10) of the ratio: distributional
spread (minimum distance linking all species occurrences)/pro-
portional presence (#PB).
Table 3 Biogeographical affinity within the
Indian Ocean (Simpson coefficient, SC;
Schils & Coppejans, 2003a); average TBI; and
proportion of species within the four TBI
categories for each of the marine macrophyte
communities from the Arabian Sea
Community*
SC
(%)
Average
TBI
TBI £ 0.25
(%)
0.25 > TBI
TBI £ 0.50
(%)
0.50 > TBI
TBI £ 0.75
(%)
0.75 > TBI
TBI £ 1
(%)
MAS EC 33.5 0.496 23.6 27.8 31.9 16.7
51.4 48.6
S&O SC 33.6 0.515 23.4 28.2 26.6 21.8
51.6 48.4
SOC NC 40.2 0.611 13.7 16.4 39.7 30.1
30.1 69.9
MAS WC 42.6 0.611 15.7 17.6 33.3 33.3
33.3 66.7
SOC SG 44.8 0.660 0.0 16.7 66.7 16.7
16.7 83.3
S&O NC 46.5 0.667 9.8 13.7 35.3 41.2
23.5 76.5
MAS SG 47.8 0.675 4.3 19.1 36.2 40.4
23.4 76.6
*For definitions see Fig. 1.
Table 4 Average TBI and average functions for both upwelling
communities of the Arabian Sea, based solely on species within
TBI category 1 (TBI £ 0.25)
Community*
Average
TBI F C G
MAS EC 0.195 0.218 0.451 0.517
S&O SC 0.198 0.257 0.452 0.426
*For definitions see Fig. 1.
T. Schils
568 Journal of Biogeography 33, 560–572ª 2006 The Authors. Journal compilation ª 2006 Blackwell Publishing Ltd
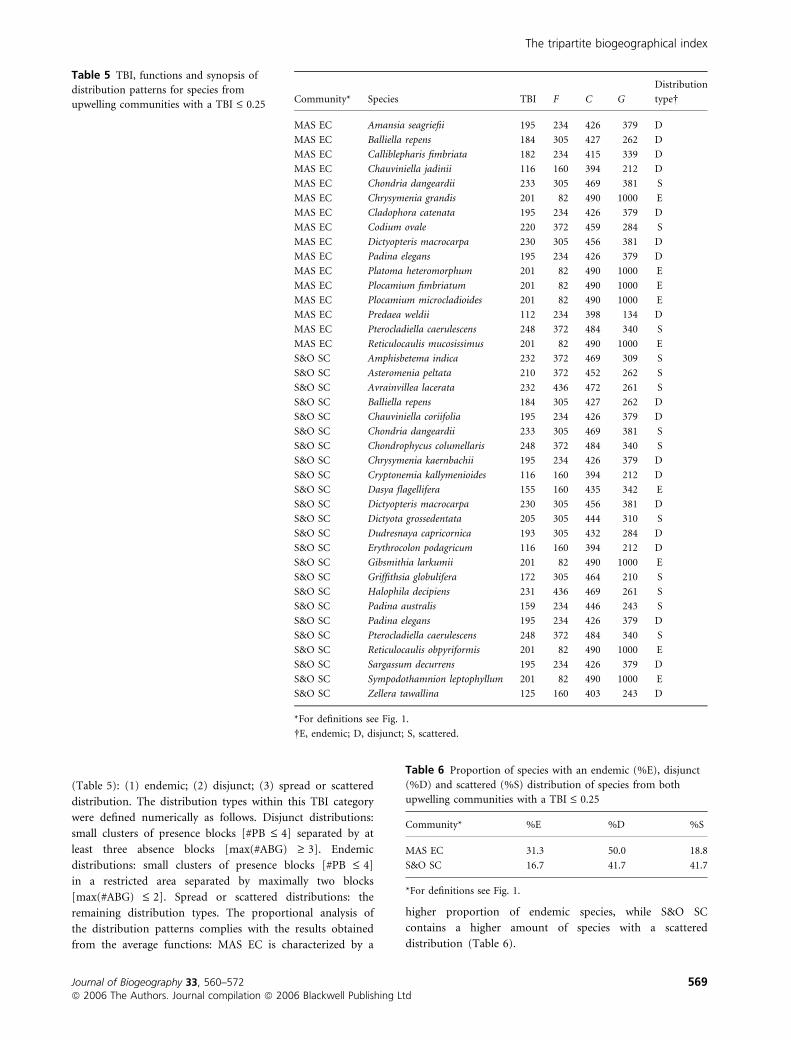
(Table 5): (1) endemic; (2) disjunct; (3) spread or scattered
distribution. The distribution types within this TBI category
were defined numerically as follows. Disjunct distributions:
small clusters of presence blocks [#PB £ 4] separated by at
least three absence blocks [max(#ABG) ‡ 3]. Endemic
distributions: small clusters of presence blocks [#PB £ 4]
in a restricted area separated by maximally two blocks
[max(#ABG) £ 2]. Spread or scattered distributions: the
remaining distribution types. The proportional analysis of
the distribution patterns complies with the results obtained
from the average functions: MAS EC is characterized by a
higher proportion of endemic species, while S&O SC
contains a higher amount of species with a scattered
distribution (Table 6).
Table 5 TBI, functions and synopsis of
distribution patterns for species from
upwelling communities with a TBI £ 0.25 Community* Species TBI F C G
Distribution
type�
MAS EC Amansia seagriefii 195 234 426 379 D
MAS EC Balliella repens 184 305 427 262 D
MAS EC Calliblepharis fimbriata 182 234 415 339 D
MAS EC Chauviniella jadinii 116 160 394 212 D
MAS EC Chondria dangeardii 233 305 469 381 S
MAS EC Chrysymenia grandis 201 82 490 1000 E
MAS EC Cladophora catenata 195 234 426 379 D
MAS EC Codium ovale 220 372 459 284 S
MAS EC Dictyopteris macrocarpa 230 305 456 381 D
MAS EC Padina elegans 195 234 426 379 D
MAS EC Platoma heteromorphum 201 82 490 1000 E
MAS EC Plocamium fimbriatum 201 82 490 1000 E
MAS EC Plocamium microcladioides 201 82 490 1000 E
MAS EC Predaea weldii 112 234 398 134 D
MAS EC Pterocladiella caerulescens 248 372 484 340 S
MAS EC Reticulocaulis mucosissimus 201 82 490 1000 E
S&O SC Amphisbetema indica 232 372 469 309 S
S&O SC Asteromenia peltata 210 372 452 262 S
S&O SC Avrainvillea lacerata 232 436 472 261 S
S&O SC Balliella repens 184 305 427 262 D
S&O SC Chauviniella coriifolia 195 234 426 379 D
S&O SC Chondria dangeardii 233 305 469 381 S
S&O SC Chondrophycus columellaris 248 372 484 340 S
S&O SC Chrysymenia kaernbachii 195 234 426 379 D
S&O SC Cryptonemia kallymenioides 116 160 394 212 D
S&O SC Dasya flagellifera 155 160 435 342 E
S&O SC Dictyopteris macrocarpa 230 305 456 381 D
S&O SC Dictyota grossedentata 205 305 444 310 S
S&O SC Dudresnaya capricornica 193 305 432 284 D
S&O SC Erythrocolon podagricum 116 160 394 212 D
S&O SC Gibsmithia larkumii 201 82 490 1000 E
S&O SC Griffithsia globulifera 172 305 464 210 S
S&O SC Halophila decipiens 231 436 469 261 S
S&O SC Padina australis 159 234 446 243 S
S&O SC Padina elegans 195 234 426 379 D
S&O SC Pterocladiella caerulescens 248 372 484 340 S
S&O SC Reticulocaulis obpyriformis 201 82 490 1000 E
S&O SC Sargassum decurrens 195 234 426 379 D
S&O SC Sympodothamnion leptophyllum 201 82 490 1000 E
S&O SC Zellera tawallina 125 160 403 243 D
*For definitions see Fig. 1.
�E, endemic; D, disjunct; S, scattered.
Table 6 Proportion of species with an endemic (%E), disjunct
(%D) and scattered (%S) distribution of species from both
upwelling communities with a TBI £ 0.25
Community* %E %D %S
MAS EC 31.3 50.0 18.8
S&O SC 16.7 41.7 41.7
*For definitions see Fig. 1.
The tripartite biogeographical index
Journal of Biogeography 33, 560–572 569ª 2006 The Authors. Journal compilation ª 2006 Blackwell Publishing Ltd

DISCUSSION
TBI and its underlying functions prove to be useful in
comparing and quantifying spatial (e.g. biogeographical
spread) distribution patterns. The index is particularly helpful
for selecting organisms with similar distribution types, this
being a shortcoming of previous biogeographical analyses. The
approach presented does not compute similarities in taxon
composition between two or more communities, but calculates
the similarity in distribution patterns. It is noteworthy that the
biogeographical analyses of distribution patterns presented
here are quite robust for data based on morphological–
anatomical identifications. The problem of cryptic diversity,
usually demonstrated in molecular population or phylogenetic
studies, is relatively minor since related and structurally similar
taxa have similar ecological requirements and physiological
traits, resulting in a high environmental biogeographical
affinity (Verbruggen et al., 2005). Furthermore, undetected
cryptic diversity in studies using traditional similarity indices
erroneously strengthens biogeographical affinities between
localities. Their influence is, however, minor in the approach
described here, as taxa with specific distribution patterns (e.g.
widespread taxa) can be filtered out using the three functions.
TBI and its underlying functions also serve as a filter to
focus on specific distribution patterns within large data sets,
for example in relation to the statement of Jetz & Rahbek
(2002), p. 1548): ‘Geographic patterns in species richness are
mainly based on wide-ranging species because their larger
number of distribution records has a disproportionate contri-
bution to the species richness counts.’ TBI and its functions
might be more suitable as quick and informative exploratory
tools for tracking changes in populations on a temporal scale
(e.g. habitat fragmentation). On a population level, the values
of connectivity (C) and grouping (G) are most relevant if the
size of the grid cells can be related to the dispersal capacities of
the organisms. Nevertheless, even if intrinsic dispersal capa-
cities are a lot smaller than the grid cells, TBI can show changes
in population demography and the potential connectivity of
populations by external factors. The comparison of TBI values
between taxa or taxon groupings (e.g. communities) is relevant
only if the total grid and its cells are of a similar size and
structure. TBI values that correspond to specific distribution
patterns (e.g. the scale from scarce and dispersed to abundant
and grouped distributions, as in the case study described here)
cannot be generalized, because the values depend on the
relative size of a grid cell in comparison with the maximum of
the potentially occupied area.
Future developments of TBI might focus on the weighting of
grid cells. Blocks that are more (or less) likely to serve as
dispersal blocks can be weighted accordingly. This is especially
useful for connectivity blocks in applications where streams,
rivers, birds, etc. serve as favourable vectors along specific
pathways within the distribution area (Fagan, 2002). Presence
blocks, on the other hand, might also be weighted depending
on the abundance, population size or biomass of the organisms
investigated. Other improvements might focus on standard-
ization of the index based on comparisons with randomized
distribution patterns for the specific grid. Application of the
index can also be expanded to combine statistical analyses of
quantitative data and TBI, related to nestedness analyses, or
coupled with taxonomic diversity measurements.
ACKNOWLEDGEMENTS
Thanks are expressed to Simon C. Wilson, Heroen Verbrug-
gen, David R. Bellwood, Robert J. Whittaker, and three
anonymous reviewers for their constructive comments on the
manuscript. Tom Schils is indebted to the Fund for Scientific
Research Flanders (FWO, Belgium) for his postdoctoral
research grant. Financial support was provided by the FWO
Research Project 3G014205.
REFERENCES
Aliya, R. & Shameel, M. (1999) Phycochemical evaluation of
four coenocytic green seaweeds from the coast of Karichi.
Pakistan Journal of Marine Biology, 5, 65–76.
Bandeira, S.O., Antonio, C.M. & Critchley, A.T. (2001) A
taxonomic listing, including new distribution records, for
benthic, intertidal seaweeds from Mecufi, northern Mo-
zambique. South African Journal of Botany, 67, 492–496.
Carvalho, M.A. & Bandeira, S.O. (2003) Seaweed flora of
Quirimbas Archipelago, northern Mozambique. Proceedings
of the XVIIth International Seaweed Symposium, Cape Town,
South Africa (ed. by A.R.O. Chapman, R.J. Anderson, V.J.
Vreeland and I.R. Davison), pp. 319–324. Oxford University
Press, Oxford, UK.
Coppejans, E., Leliaert, F. & De Clerck, O. (2000) Annotated
list of new records of marine macroalgae for Kenya and
Tanzania, since Isaac’s and Jaasund’s publications. Biologisch
Jaarboek Dodonaea, 67, 31–93.
Coppejans, E., Leliaert, F. & Schils, T. (2002) New records of
marine benthic algae for the Mozambican coast, collected
at Inhaca Island. South African Journal of Botany, 68,
342–348.
Coppejans, E., Leliaert, F., Verbruggen, H., De Clerck, O.,
Schils, T., De Vriese, T. & Marie, D. (2004) The marine
green and brown algae of Rodrigues (Mauritius, Indian
Ocean). Journal of Natural History, 38, 2959–3019.
Cordero Jr., P.A. (1993) The marine vegetation of Muscat area,
Sultanate of Oman. Proceedings of the 2nd Republic of the
Philippines – USA Phycology Symposium/Workshop, January,
1992, pp. 31–43. US National Science Foundation, Cebu
City, Philippines.
Critchley, A.T., Aken, M.E., Bandeira, S. & Kalk, M. (1997) A
revised list of seaweeds from Inhaca Island, Mozambique.
South African Journal of Botany, 63, 426–435.
De Clerck, O. (2003) The genus Dictyota in the Indian Ocean.
Opera Botanica Belgica, 13, 205.
De Clerck, O. & Coppejans, E. (1996) Marine algae of the
Jubail Marine Wildlife Sanctuary, Saudi Arabia. A marine
wildlife sanctuary for the Arabian Gulf, environmental
T. Schils
570 Journal of Biogeography 33, 560–572ª 2006 The Authors. Journal compilation ª 2006 Blackwell Publishing Ltd

research and conservation following the 1991 Gulf War oil spill
(ed. by F. Krupp, I.A. Abuzinada and A.H. Nader), pp. 199–
289. Riyadh, Saudi Arabia.
De Clerck, O. & Coppejans, E. (1999) Two new species of
Dictyota (Dictyotales, Phaeophyta) from the Indo-Malayan
region. Phycologia, 38, 184–194.
De Clerck, O., Engledow, H.R., Bolton, J.J., Anderson, R.J. &
Coppejans, E. (2002) Twenty marine benthic algae new to
South Africa, with emphasis on the flora of Kwazulu-Natal.
Botanica Marina, 45, 413–431.
De Clerck, O., Coppejans, E., Schils, T., Verbruggen, H.,
Leliaert, F., De Vriese, T. & Marie, D. (2004) The marine red
algae of Rodrigues (Mauritius, Indian Ocean). Journal of
Natural History, 38, 3021–3057.
Dickie, G. (1888) Algae. Botany of Socotra, Transactions of the
Royal Society of Edinburgh, Vol. 31 (ed. by I.B. Balfour), pp.
394–401. Robert Grant & Son, Edinburgh.
Fagan, W.F. (2002) Connectivity, fragmentation, and extinc-
tion risk in dendritic metapopulations. Ecology, 83, 3243–
3249.
Green, E.P. & Short, F.T. (2003) World Atlas of Seagrasses.
Prepared by the UNEP World Conservation Monitoring
Centre. University of California Press, Berkeley, CA, USA.
Guiry, M.D. & Nic Dhonncha, E. (2005) Algaebase: http://
www.algaebase.org (5 January 2005).
Hayee-Memon, A. & Shameel, M. (1996) A taxonomic study of
some red algae commonly growing on the coast of Karachi.
Pakistan Journal of Marine Sciences, 5, 113–137.
Hayek, L.C. (1994) Analysis of amphibian biodiversity data.
Measuring and monitoring biological diversity: standard
methods for amphibians (ed. by W.R. Heyer, M.A. Donnel-
ley, R.W. McDiarmid, L.C. Hayek and M.S. Foster), pp.
207–269. Smithsonian Institution Press, Washington, DC,
USA.
Holmes, E.M. (1903) Seaweeds of Abd-El-Kuri. The natural
history of Socotra and Abd-El-Kuri (ed. by H.O. Forbes), pp.
567–568. Young & Sons, Liverpool, UK.
Huisman, J.M. (2000) Marine plants of Australia. University of
Western Australia Press, Nedlands, Western Australia.
Huisman, J.M. & Schils, T. (2002) A re-assessment of the genus
Izziella Doty (Liagoraceae, Rhodophyta). Cryptogamie
Algologie, 23, 237–249.
Huisman, J.M., Harper, J.T. & Saunders, G.W. (2004) Phylo-
genetic study of the Nemaliales (Rhodophyta) based on
large-subunit ribosomal DNA sequences supports segrega-
tion of the Scinaiaceae fam. nov. and resurrection of
Dichotomaria Lamarck. Phycological Research, 52, 224–234.
Jetz, W. & Rahbek, C. (2002) Geographic range size and de-
terminants of avian species richness. Science, 297, 1548–1551.
Jupp, B.P., Durako, M.J., Kenworthy, W.J., Thayer, G.W. &
Schillak, L. (1996) Distribution, abundance, and species
composition of seagrasses at several sites in Oman. Aquatic
Botany, 53, 199–213.
Kemp, J.M. (1998) The occurrence of Nizamuddinia zanardinii
(Schiffner) P.C. Silva (Phaeophyta: Fucales) at the Socotra
Archipelago. Botanica Marina, 41, 345–348.
Leliaert, F. (2004) Taxonomic and phylogenetic studies in the
Cladophorophyceae (Chlorophyta). PhD thesis, Ghent Uni-
versity, Belgium.
Nizamuddin, M. & Campbell, A.C. (1995) Glossophorella, a
new genus of the family Dictyotaceae (Dictyotales – Phae-
ophyceae) and its ecology from the coast of the Sultanate of
Oman. Pakistan Journal of Botany, 27, 257–262.
O’Hara, T.D. & Poore, G.C.B. (2000) Patterns of distribution
for southern Australian marine echinoderms and decapods.
Journal of Biogeography, 27, 1321–1335.
OSP (1999) Oman Seaweed Project, Final Report to Ministry of
Agriculture & Fisheries, Marine Science & Fisheries Centre,
Sultan of Oman. Berardi & Associates, Rome, Italy.
Richards, G. & Wynne, M. (2003) Macroalgal biodiversity of
Oman. HTS Development Ltd, Hemel Hempstead, UK.
Robinson, J. A., Feldman, G. C., Kuring, N., Franz, B., Green,
E., Noordeloos, M., & Stumpf, R.P. (2000) Data fusion in
coral reef mapping: working at multiple scales with SeaWiFS
and astronaut photography. Proceedings of the 6th Interna-
tional Conference on Remote Sensing for Marine and Coastal
Environments, Vol. 2, pp. 473–483. Charleston, SC, USA.
Samyn, Y. & Tallon, I. (2005) Zoogeography of the shallow-
water holothuroids of the western Indian Ocean. Journal of
Biogeography, 32, 1523–1538.
Schils, T. & Coppejans, E. (2002) Gelatinous red algae of the
Arabian Sea, including Platoma heteromorphum sp. nov.
(Gigartinales, Rhodophyta). Phycologia, 41, 254–267.
Schils, T. & Coppejans, E. (2003a) Phytogeography of upwel-
ling areas in the Arabian Sea. Journal of Biogeography, 30,
1339–1356.
Schils, T. & Coppejans, E. (2003b) Spatial variation in subtidal
plant communities around the Socotra Archipelago and
their biogeographic affinities within the Indian Ocean.
Marine Ecology Progress Series, 251, 103–114.
Schils, T., De Clerck, O. & Coppejans, E. (2003a) The red-algal
genus Reticulocaulis from the Arabian Sea, including R. ob-
pyriformis sp. nov., with comments on the family Naccar-
iaceae. Phycologia, 42, 44–55.
Schils, T., Huisman, J.M. & Coppejans, E. (2003b) Chamae-
botrys erectus sp. nov. (Rhodymeniales, Rhodophyta)
from the Socotra Archipelago, Yemen. Botanica Marina, 46,
2–8.
Schils, T., Coppejans, E., Verbruggen, H., De Clerck, O. &
Leliaert, F. (2004) The marine flora of Rodrigues (Republic
of Mauritius, Indian Ocean): an island with low habitat
diversity or one in the process of colonization? Journal of
Natural History, 38, 3059–3076.
Shaikh, W. & Shameel, M. (1995) Taxonomic study of brown
algae commonly growing on the coast of Karachi, Pakistan.
Pakistan Journal of Marine Sciences, 4, 9–38.
Shameel, M. (1999) Melanothamnus afaqhusainii, a new red
alga from the coast of Karachi. Pakistan Journal of Botany,
31, 211–214.
Shameel, M. (2002) Occurrence of a new species of Chara
(Charophyceae) near Balochistan coast of Pakistan. Pakistan
Journal of Botany, 34, 93–100.
The tripartite biogeographical index
Journal of Biogeography 33, 560–572 571ª 2006 The Authors. Journal compilation ª 2006 Blackwell Publishing Ltd

Shameel, M., Khan, S.H. & Afaq-Husain, S. (2000) Biodiversity
of marine benthic algae along the coast of Balochistan,
Pakistan. Pakistan Journal of Marine Biology, 6, 69–100.
Silva, P.C., Basson, P.W. & Moe, R.L. (1996) Catalogue of the
benthic marine algae of the Indian Ocean. University of
California Publications in Botany, 79, 1–1259.
Sohrabi Pour, J. & Rabii, R. (1996) New records of algae for
Persian Gulf and flora of Iran. Iranian Journal of Botany, 7,
95–115.
Sohrabipour, J. & Rabii, R. (1999) A list of marine algae of
seashores of Persian Gulf and Oman Sea in the Hormozgan
Province. Iranian Journal of Botany, 8, 131–162.
Spalding, M., Phillips, R. & Linden, O. (1998) Mangroves and
seagrasses. An interactive tool for identification and distribu-
tion of mangroves and seagrasses in the Indian Ocean region.
CD-ROM. Biodiversity and taxonomy of the Indian Ocean,
World Conservation Monitoring Centre. Styrelsen for Inter-
nationellt Utvecklingssa marbete, Western Indian Ocean
Marine Science Association and University of Warwick.
Tulloss, R.E. (1997) Assessment of similarity indices for
undesirable properties and a new tripartite similarity index
based on cost functions. Mycology in sustainable develop-
ment: expanding concepts, vanishing borders (ed. by M.E.
Palm and I.H. Chapela), pp. 122–143. Parkway Publishers,
Boone, NC, USA.
Verbruggen, H., De Clerck, O., Schils, T., Kooistra, W.H.C.F.
& Coppejans, E. (2005) Evolution and phylogeography of
Halimeda section Halimeda. Molecular Phylogenetics and
Evolution, 37, 789–803.
Wynne, M.J. (1998) Champia gigantea and Lomentaria stru-
mosa (Rhodymeniales): two new red algae from the Sulta-
nate of Oman. Botanica Marina, 41, 571–580.
Wynne, M.J. (1999a) New records of benthic marine algae
from the Sultanate of Oman. Contributions from the Uni-
versity of Michigan Herbarium, 22, 189–208.
Wynne, M.J. (1999b) Pseudogrinnellia barrattiae gen. et sp.
nov., a new member of the red algal family Delesseriaceae
from the Sultanate of Oman. Botanica Marina, 42, 37–42.
Wynne, M.J. (2000) Further connections between the benthic
marine algal floras of the northern Arabian Sea and Japan.
Phycological Research, 48, 211–220.
Wynne, M.J. (2001a) New records of benthic marine algae
from the Sultanate of Oman, northern Arabian Sea. II. Nova
Hedwigia, 72, 347–374.
Wynne, M.J. (2001b) Stirnia prolifera gen. et sp. nov. (Rho-
dymeniales, Rhodophyta) from the Sultanate of Oman.
Botanica Marina, 44, 163–169.
Wynne, M.J. (2002a) A description of Plocamium fimbriatum
sp. nov. (Plocamiales, Rhodophyta) from the Sultanate of
Oman, with a census of currently recognized species in the
genus. Nova Hedwigia, 75, 333–356.
Wynne, M.J. (2002b) Turbinaria foliosa sp. nov. (Fucales,
Phaeophyceae) from the Sultanate of Oman, with a census
of currently recognized species in the genus Turbinaria.
Phycological Research, 50, 283–293.
Wynne, M.J. (2003a) Centroceras secundum sp. nov.
(Ceramiaceae, Rhodophyta) from the Sultanate of Oman.
Nova Hedwigia, 77, 125–137.
Wynne, M.J. (2003b) Jolyna furcata sp. nov. (Scytosiphonales,
Phaeophyceae) from the Sultanate of Oman. Cryptogamie
Algologie, 24, 51–61.
Wynne, M.J. (2003c) Leveillea major sp. nov. (Rhodomelaceae,
Rhodophyta) from the Sultanate of Oman. Botanica Marina,
46, 357–365.
Wynne, M.J. (2004) Myriogloea pedicellata sp. nov. (Chor-
dariaceae, Phaeophyceae) from the Sultanate of Oman,
Northern Arabian Sea. Cryptogamie Algologie, 25, 113–124.
Wynne, M.J. (2005) Two new species of Bryopsis (Ulvophy-
ceae, Chlorophyta) from the Sultanate of Oman, with a
census of currently recognized species in the genus. Con-
tributions from the University of Michigan Herbarium, 24,
229–256.
Wynne, M.J. & Freshwater, D.W. (2004) Gelidium omanense
sp. nov. (Gelidiaceae, Rhodophyta) from the Sultanate of
Oman. Botanica Marina, 47, 64–72.
Wynne, M.J. & de Jong, Y.S.D.M. (2002) Dipterocladia ara-
biensis sp. nov. (Dasyaceae, Rhodophyta) from the Sultanate
of Oman. Botanica Marina, 45, 77–86.
Wynne, M.J. & Jupp, B.P. (1998) The benthic marine algal
flora of the Sultanate of Oman: new records. Botanica
Marina, 41, 7–14.
Wynne, M.J. & Leliaert, F. (2001) Pedobesia simplex (Mene-
ghini) comb. nov. (Chlorophyta), an older name for
P. lamourouxii and its first report from the Indian Ocean.
Cryptogamie Algologie, 22, 3–14.
BIOSKETCH
Tom Schils is a researcher with the Fund for Scientific
Research at Ghent University, Belgium. His research interests
include the ecology, biogeography and taxonomy of marine
macrophytes, with current focus on the flora of the Arabian
Seas.
Editor: David Bellwood
T. Schils
572 Journal of Biogeography 33, 560–572ª 2006 The Authors. Journal compilation ª 2006 Blackwell Publishing Ltd

Front cover: Nizamuddinia zanardinii (Schiffner) P.C. Silva, a monotypic brown alga endemic to the Arabian Sea. This key-stone species forms extensive macroalgal stands and has been used as a flagship to characterize the upwelling areas of thenorth-western Indian Ocean (see p. 560 in this Issue). Photo: Tom Schils.
0305-0270(200604)33:04;1-Ywww.blackwellpublishing.comThis journal is available online at Blackwell Synergy.Visit www.blackwell-synergy.com to search the articlesand register for table of contents e-mail alerts.
Journal ofBiogeography
Volume 33Number 4April 2006
Editor-in-Chief: Robert J. Whittaker
Journal of BiogeographyV
olu
me 33
Nu
mb
er 4A
pril 2006
Pages 549–760
ISSN 0305-0270Journal of Biogeography
Volume 33, Number 4, April 2006
Contents
Guest EditorialA. Alfredo Bueno-Hernández and J. E. Llorente-Bousquets: The other face of Lyell: historical biogeography in his Principlesof geology 549–559
Methodological developments and applicationsT. Schils: The tripartite biogeographical index: a new tool for quantifying spatio-temporal differences in distributionpatterns 560–572G. Stuart, C. Gries and D. Hope: The relationship between pollen and extant vegetation across an arid urban ecosystem andsurrounding desert in Southwest USA 573–591Y. Deng, M. Horrocks, J. Ogden and S. Anderson: Modern pollen–vegetation relationships along transects on theWhangapoua Estuary, Great Barrier Island, northern New Zealand 592–608J. A. Navarro Alberto and B. F. J. Manly: The generation of diversity in systems of patches and ranked dominance 609–621R. D. Sagarin and G. N. Somero: Complex patterns of expression of heat-shock protein 70 across the southernbiogeographical ranges of the intertidal mussel Mytilus californianus and snail Nucella ostrina 622–630
Long-term ecological changeJ. S. Sibold, T. T.Veblen and M. E. González: Spatial and temporal variation in historic fire regimes in subalpine forestsacross the Colorado Front Range in Rocky Mountain National Park, Colorado, USA 631–647S. L. Stephens and W. J. Libby: Anthropogenic fire and bark thickness in coastal and island pine populations from Alta andBaja California 648–652D. Goetze, B. Hörsch and S. Porembski: Dynamics of forest–savanna mosaics in north-eastern Ivory Coast from 1954 to2002 653–664B. Chauvel, F. Dessaint, C. Cardinal-Legrand and F. Bretagnolle: The historical spread of Ambrosia artemisiifolia L. in Francefrom herbarium records 665–673K. K. Karanth, J. D. Nichols, J. R. Sauer and J. E. Hines: Comparative dynamics of avian communities across edges andinteriors of North American ecoregions 674–682
On species richness and endemismT.-S. Ding, H.-W.Yuan, S. Geng, C.-N. Koh and P.-F. Lee: Macro-scale bird species richness patterns of the East Asianmainland and islands: energy, area and isolation 683–693J. Beck, I. J. Kitching and K. Eduard Linsenmair: Determinants of regional species richness: an empirical analysis of thenumber of hawkmoth species (Lepidoptera: Sphingidae) on the Malesian archipelago 694–706B. J. Richardson, M. Zabka, M. R. Gray and G. Milledge: Distributional patterns of jumping spiders (Araneae: Salticidae) inAustralia 707–719M. Biondi and P. D’Alessandro: Biogeographical analysis of the flea beetle genus Chaetocnema in the Afrotropical Region:distribution patterns and areas of endemism 720–730L. Huidobro, J. J. Morrone, J. L.Villalobos and F. Álvarez: Distributional patterns of freshwater taxa (fishes, crustaceans andplants) from the Mexican Transition Zone 731–741S. Bentz, N. D. Sinnappah-Kang, L.-H. S. Lim, B. Lebedev, C. Combes and O.Verneau: Historical biogeography ofamphibian parasites, genus Polystoma (Monogenea: Polystomatidae) 742–749R. A. Moreno, C. E. Hernández, M. M. Rivadeneira, M. A.Vidal and N. Rozbaczylo: Patterns of endemism in south-easternPacific benthic polychaetes of the Chilean coast 750–759
Erratum 760
Jbi_33_4_oc.qxd 3/14/2006 5:55 PM Page 1