
Java Virtual Machine Guide - Oracle · Java Virtual Machine Guide Release 9 E68512-05 October 2017....
67
Java Platform, Standard Edition Java Virtual Machine Guide Release 9 E68512-05 October 2017
Transcript of Java Virtual Machine Guide - Oracle · Java Virtual Machine Guide Release 9 E68512-05 October 2017....
Java Platform, Standard EditionJava Virtual Machine Guide
Release 9E68512-05October 2017

Java Platform, Standard Edition Java Virtual Machine Guide, Release 9
E68512-05
Copyright © 1993, 2017, Oracle and/or its affiliates. All rights reserved.
This software and related documentation are provided under a license agreement containing restrictions onuse and disclosure and are protected by intellectual property laws. Except as expressly permitted in yourlicense agreement or allowed by law, you may not use, copy, reproduce, translate, broadcast, modify,license, transmit, distribute, exhibit, perform, publish, or display any part, in any form, or by any means.Reverse engineering, disassembly, or decompilation of this software, unless required by law forinteroperability, is prohibited.
The information contained herein is subject to change without notice and is not warranted to be error-free. Ifyou find any errors, please report them to us in writing.
If this is software or related documentation that is delivered to the U.S. Government or anyone licensing it onbehalf of the U.S. Government, then the following notice is applicable:
U.S. GOVERNMENT END USERS: Oracle programs, including any operating system, integrated software,any programs installed on the hardware, and/or documentation, delivered to U.S. Government end users are"commercial computer software" pursuant to the applicable Federal Acquisition Regulation and agency-specific supplemental regulations. As such, use, duplication, disclosure, modification, and adaptation of theprograms, including any operating system, integrated software, any programs installed on the hardware,and/or documentation, shall be subject to license terms and license restrictions applicable to the programs.No other rights are granted to the U.S. Government.
This software or hardware is developed for general use in a variety of information management applications.It is not developed or intended for use in any inherently dangerous applications, including applications thatmay create a risk of personal injury. If you use this software or hardware in dangerous applications, then youshall be responsible to take all appropriate fail-safe, backup, redundancy, and other measures to ensure itssafe use. Oracle Corporation and its affiliates disclaim any liability for any damages caused by use of thissoftware or hardware in dangerous applications.
Oracle and Java are registered trademarks of Oracle and/or its affiliates. Other names may be trademarks oftheir respective owners.
Intel and Intel Xeon are trademarks or registered trademarks of Intel Corporation. All SPARC trademarks areused under license and are trademarks or registered trademarks of SPARC International, Inc. AMD, Opteron,the AMD logo, and the AMD Opteron logo are trademarks or registered trademarks of Advanced MicroDevices. UNIX is a registered trademark of The Open Group.
This software or hardware and documentation may provide access to or information about content, products,and services from third parties. Oracle Corporation and its affiliates are not responsible for and expresslydisclaim all warranties of any kind with respect to third-party content, products, and services unless otherwiseset forth in an applicable agreement between you and Oracle. Oracle Corporation and its affiliates will not beresponsible for any loss, costs, or damages incurred due to your access to or use of third-party content,products, or services, except as set forth in an applicable agreement between you and Oracle.

Contents
Preface
Audience vi
Documentation Accessibility vi
Related Documents vi
Conventions vi
1 Java Virtual Machine Technology Overview
2 Compiler Control
Writing Directives 2-1
List of Compiler Control Options 2-2
Writing a Directives File 2-5
Writing a Compiler Directive 2-6
Writing a Method Pattern in a Compiler Directive 2-8
Writing an Inline Directive Option 2-9
Preventing Duplication with the Enable Option 2-9
Understanding Directives Better 2-11
What Is the Default Directive? 2-11
How Are Directives Applied to Code? 2-13
Compiler Control and Backward Compatibility 2-14
Commands to Work with Directive Files 2-15
Compiler Directives and the Command Line 2-15
Compiler Directives and Diagnostic Commands 2-16
Getting Your Java Process Identification Number 2-16
Adding Directives Through Diagnostic Commands 2-16
Removing Directives Through Diagnostic Commands 2-16
Printing Directives Through Diagnostic Commands 2-17
How Are Directives Ordered in the Directives Stack? 2-17
iii

3 Garbage Collection
4 Class Data Sharing
Overview of Class Data Sharing 4-1
Regenerating the Shared Archive 4-2
Manually Controlling Class Data Sharing 4-2
5 Java HotSpot Virtual Machine Performance Enhancements
Compact Strings 5-1
Tiered Compilation 5-2
Compressed Ordinary Object Pointer 5-2
Zero-Based Compressed Ordinary Object Pointers 5-3
Escape Analysis 5-3
6 Support for Non-Java Languages
Introduction to Non-Java Language Features 6-1
Static and Dynamic Typing 6-2
Statically-Typed Languages Are Not Necessarily Strongly-Typed Languages 6-3
The Challenge of Compiling Dynamically-Typed Languages 6-3
The invokedynamic Instruction 6-5
Defining the Bootstrap Method 6-6
Specifying Constant Pool Entries 6-6
Example Constant Pool 6-7
Using the invokedynamic Instruction 6-8
7 Signal Chaining
8 Native Memory Tracking
Key Features 8-1
Using Native Memory Tracking 8-1
Enabling NMT 8-1
Accessing NMT Data using jcmd 8-2
Obtaining NMT Data at VM Exit 8-2
iv

9 DTrace Probes in HotSpot VM
Using the hotspot Provider 9-1
VM Lifecycle Probes 9-1
Thread Lifecycle Probes 9-2
Classloading Probes 9-2
Garbage Collection Probes 9-3
Method Compilation Probes 9-4
Monitor Probes 9-5
Application Tracking Probes 9-6
Using the hotspot_jni Provider 9-7
Sample DTrace Probes 9-7
10
Fatal Error Reporting
Error Report Example 10-1
11
Java Virtual Machine Related Resources
Tools 11-1
v

Preface
This document provides information about the features supported by Java VirtualMachine technology.
AudienceThis document is intended for experienced developers who build applications usingthe Java HotSpot technology.
Documentation AccessibilityFor information about Oracle's commitment to accessibility, visit the OracleAccessibility Program website at http://www.oracle.com/pls/topic/lookup?ctx=acc&id=docacc.
Access to Oracle Support
Oracle customers that have purchased support have access to electronic supportthrough My Oracle Support. For information, visit http://www.oracle.com/pls/topic/lookup?ctx=acc&id=info or visit http://www.oracle.com/pls/topic/lookup?ctx=acc&id=trsif you are hearing impaired.
Related DocumentsSee Oracle JDK 9 Documentation for other Oracle Java Development Kit (JDK) 9guides.
ConventionsThe following text conventions are used in this document:
Convention Meaning
boldface Boldface type indicates graphical user interface elements associatedwith an action, or terms defined in text.
italic Italic type indicates book titles, emphasis, or placeholder variables forwhich you supply particular values.
monospace Monospace type indicates commands within a paragraph, URLs, codein examples, text that appears on the screen, or text that you enter.
Preface
vi

1Java Virtual Machine Technology Overview
This chapter describes the implementation of the Java Virtual Machine (JVM) and themain features of the Java HotSpot technology:
• Adaptive compiler: A standard interpreter is used to launch the applications. Whenthe application runs, the code is analyzed to detect performance bottlenecks, orhot spots. The Java HotSpot VM compiles the performance-critical portions of thecode for a boost in performance, but does not compile the seldom-used code(most of the application). The Java HotSpot VM uses the adaptive compiler todecide how to optimize compiled code with techniques such as inlining.
• Rapid memory allocation and garbage collection: Java HotSpot technologyprovides rapid memory allocation for objects and fast, efficient, state-of-the-artgarbage collectors.
• Thread synchronization: Java HotSpot technology provides a thread-handlingcapability that is designed to scale for use in large, shared-memory multiprocessorservers.
In Oracle Java Runtime Environment (JRE) 8 and earlier, different implementations ofthe JVM, (the client VM, server VM, and minimal VM), were supported forconfigurations commonly used as clients, servers, and for embedded systems. Asmost systems can now take advantage of the server VM, the Oracle Java RuntimeEnvironment (JRE) 9 provides only that VM implementation.
1-1

2Compiler Control
Compiler Control provides a way to control Java Virtual Machine (JVM) compilationthrough compiler directive options. The level of control is runtime-manageable andmethod specific.
A compiler directive is an instruction that tells the JVM how compilation should occur.A directive provides method-context precision in controlling the compilation process.Directives are a powerful tool for writing small, contained, JVM compiler tests becausetests can be run without restarting the entire JVM. Compiler Control is also very usefulfor creating workarounds for bugs in the JVM compilers.
You can specify a file that contains compiler directives while starting a programthrough the command line. You can also add or remove directives from an alreadyrunning program through diagnostic commands.
Compiler Control supersedes and is backward compatible with CompileCommand.
Topics:
• Writing Directives
– Writing a Directives File
– Writing a Compiler Directive
– Writing a Method Pattern in a Compiler Directive
– Writing an Inline Directive Option
– Preventing Duplication with the Enable Option
• Understanding Directives Better
– What Is the Default Directive?
– How Are Directives Applied to Code?
– Compiler Control and Backward Compatibility
• Commands to Work with Directive Files
– Compiler Directives and the Command Line
– Compiler Directives and Diagnostic Commands
– How Are Directives Ordered in the Directives Stack?
Writing DirectivesThis topic examines Compiler Control options and steps for writing directives fromthose options.
Topics:
• List of Compiler Control Options
2-1

• Writing a Directives File
• Writing a Compiler Directive
• Writing a Method Pattern in a Compiler Directive
• Writing an Inline Directive Option
• Preventing Duplication with the Enable Option
List of Compiler Control OptionsOptions are instructions for compilation. Options provide method-context precision.Available options vary by compiler and require specific types of values.
Table 2-1 Common Options
Option Description Value Type Default Value
Enable Hides a directive andrenders it unmatchableif it is set to false.This is useful forpreventing optionduplication. See Preventing Duplicationwith the EnableOption.
bool true
Exclude Excludes methodsfrom compilation.
bool false
BreakAtExecute Sets a breakpoint tostop execution at thebeginning of thespecified methodswhen debugging theJVM.
bool false
BreakAtCompile Sets a breakpoint tostop compilation at thebeginning of thespecified methodswhen debugging theJVM.
bool false
Log Places only thespecified methods in alog. You must first setthe command-lineoption -XX:+LogCompilation. Thedefault value falseplaces all compiledmethods in a log.
bool false
PrintAssembly Prints assembly codefor bytecoded andnative methods byusing the externaldisassembler.solibrary.
bool false
Chapter 2Writing Directives
2-2

Table 2-1 (Cont.) Common Options
Option Description Value Type Default Value
PrintInlining Prints which methodsare inlined, and where.
bool false
PrintNMethods Prints nmethods asthey are generated.
bool false
BackgroundCompilation
Compiles methods asa background task.Methods run ininterpreter mode untilthe backgroundcompilation finishes.The value falsecompiles methods asa foreground task.
bool true
ReplayInline Enables the sameCIReplay functionalityas the correspondingglobal option, but on aper-method basis.
bool false
DumpReplay Enables the sameCIReplay functionalityas the correspondingglobal option, but on aper-method basis.
bool false
DumpInline Enables the sameCIReplay functionalityas the correspondingglobal option, but on aper-method basis.
bool false
CompilerDirectivesIgnoreCompileCommands
Disregards allCompileCommands.
bool false
DisableIntrinsic Disables the use ofintrinsics based onmethod-matchingcriteria.
ccstr No default value.
inline Forces or preventsinlining of a methodbased on method-matching criteria. See Writing an InlineDirective Option.
ccstr[] No default value.
Table 2-2 C2 Exclusive Options
Option Description Value Type Default Value
BlockLayoutByFrequency
Moves infrequentexecution branchesfrom the hot path.
bool true
Chapter 2Writing Directives
2-3

Table 2-2 (Cont.) C2 Exclusive Options
Option Description Value Type Default Value
PrintOptoAssembly Prints generatedassembly code aftercompilation by usingthe externaldisassembler.solibrary. This requires adebugging build of theJVM.
bool false
PrintIntrinsics Prints which intrinsicmethods are used,and where.
bool false
TraceOptoPipelining Traces pipelininginformation, similar tothe correspondingglobal option, but on aper-method basis.This is intended forslow and fastdebugging builds.
bool false
TraceOptoOutput Traces pipelininginformation, similar tothe correspondingglobal option, but on aper-method basis.This is intended forslow and fastdebugging builds.
bool false
TraceSpilling Traces variablespilling.
bool false
Vectorize Performs calculationsin parallel, acrossvector registers.
bool false
VectorizeDebug Performs calculationsin parallel, acrossvector registers. Thisrequires a debuggingbuild of the JVM.
intx 0
CloneMapDebug Enables you toexamine the CloneMapgenerated fromvectorization. Thisrequires a debuggingbuild of the JVM.
bool false
IGVPrintLevel Specifies the pointswhere the compilergraph is printed inHotspot’s IdealGraphic Visualizer(IGV). A higher valuemeans highergranularity.
intx 0
Chapter 2Writing Directives
2-4

Table 2-2 (Cont.) C2 Exclusive Options
Option Description Value Type Default Value
MaxNodeLimit Sets the maximumnumber of nodes to beused during a singlemethod’s compilation.
intx 80000
A ccstr value type is a method pattern. See Writing a Method Pattern in a CompilerDirective.
The default directive supplies default values for compiler options. See What Is theDefault Directive?
Writing a Directives FileIndividual compiler directives are written in a directives file. Only directive files, notindividual directives, can be added to the stack of active directives.
1. Create a file with a .json extension. Directive files are written using a subset ofJSON syntax with minor additions and deviations.
2. Insert the following syntax as a template you can work from:
[ //Array of Directives { //Directive Block //Directive 1 }, { //Directive Block //Directive 2 },]
The components of this template are:
Array of Directives:
• A directives file stores an array of directive blocks, denoted with a pair ofbrackets ([]).
• The brackets are optional if the file contains only a single directive block.
Directive Block:
• A block is denoted with a pair of braces ({}).
• A block contains one individual directive.
• A file can contain any number of directive blocks.
• Blocks are separated with a comma (,).
• A comma is optional following the final block in the array.
Individual Directive:
• Each individual directive must exist within a directive block.
• Files can contain multiple directives when they contain multiple directiveblocks.
Comments:
Chapter 2Writing Directives
2-5

• Single-line comments are inserted with two slashes (//).
• Multiline comments are not allowed.
3. Add or remove directive blocks from the template to match the number ofdirectives you want in the file.
4. Fill in each directive block with one compiler directive. See Writing a CompilerDirective.
5. Reorder the directive blocks if necessary. The ordering of directives within a file issignificant. Directives written closer to the beginning of the array receive higherpriority. For more information, see How Are Directives Ordered in the DirectivesStack? and How Are Directives Applied to Code?
[ //Array of directives { //Directive Block //Directive 1 match: ["java*.*", "oracle*.*"], c1: { Enable: true, Exclude: true, BreakAtExecute: true, }, c2: { Enable: false, MaxNodeLimit: 1000, }, BreakAtCompile: true, DumpReplay: true, }, { //Directive Block //Directive 2 match: ["*Concurrent.*"], c2: { Exclude:true, }, },]
Writing a Compiler DirectiveCompiler directives must be written within a directives file. Repeat these steps for eachindividual compiler directive you want to write in a directives file.
An individual compiler directive is written within a directive block in a directives file.See Writing a Directives File.
1. Insert the following block of code, as a template you can work from, to write anindividual compiler directive. This block of code is a directive block.
{ match: [], c1: { //c1 directive options }, c2: { //c2 directive options }, //Directive options applicable to all compilers },
Chapter 2Writing Directives
2-6

2. Provide the match attribute with an array of method patterns. See Writing a MethodPattern in a Compiler Directive.
For example:
match: ["java*.*", "oracle*.*"],
3. Provide the c1 attribute with a block of comma-separated directive options. Ensurethat these options are valid for the c1 compiler.
For example:
c1: { Enable: true, Exclude: true, BreakAtExecute: true, },
4. Provide the c2 attribute with a block of comma-separated directive options. Thisblock can contain a mix of common and c2 exclusive compiler options.
For example:
c2: { Enable: false, MaxNodeLimit: 1000, },
5. Provide, at the end of the directive, options you want applicable to all compilers.These options are considered written within the scope of the common block.Options are comma-separated.
For example:
BreakAtCompile: true, DumpReplay: true,
6. Clean up the file:a. Check the ordering and potential duplication of directive options. If there is a
conflict, then the last occurrence of an option takes priority. Conflicts mostlikely occur between the common block and the c1 or c2 blocks, not betweenc1 and c2 blocks.
b. Avoid writing c2–exclusive directive options in the common block. Although thecommon block can accept a mix of common and c2–exclusive options, it’smisleading to structure a directive this way because c2–exclusive options inthe common block have no effect on the c1 compiler. Write c2–exclusiveoptions within the c2 block instead.
c. If either the c1 or c2 attribute has no corresponding directive options, then omitthe attribute-value syntax for that compiler.
The resulting directive, based on earlier examples, is:
{ match: ["java*.*", "oracle*.*"], c1: { Enable: true, Exclude: true, BreakAtExecute: true, }, c2: { Enable: false, MaxNodeLimit: 1000, },
Chapter 2Writing Directives
2-7

BreakAtCompile: true, DumpReplay: true, },
The JSON format of directive files allows certain deviations in syntax:
• Extra trailing commas are optional in arrays and objects.
• Attributes are strings and are optionally placed within quotation marks.
• If an array contains only one element, then brackets are optional.
Therefore, a valid example of a compiler directive is:
{ "match": "*Concurrent.*", c2: { "Exclude": true, } },
Writing a Method Pattern in a Compiler DirectiveA ccstr is a method pattern. It can be written precisely or generalized with wildcardcharacters. It specifies what best-matching Java code should have accompanyingdirective options applied, or what Java code should be inlined.
To write a method pattern:
1. Fill in the following syntax to format your method pattern: package/class.method(parameter_list). If you’re unable to be precise, see Step 2 for waysto generalize a method pattern with wildcard characters.
An example method pattern that uses this style of formatting is:
java/lang/String.indexOf()
Other formatting styles are available. This ensures backward compatibility withearlier ways of method matching such as CompileCommand. Valid formattingalternatives for the previous example include:
• java/lang/String.indexOf()
• java/lang/String,indexOf()
• java/lang/String indexOf()
• java.lang.String::indexOf()
You may find the last formatting style preferable because it matches the Hotspotoutput.
2. Insert a wildcard character (*) where you need to generalize part of the methodpattern.
The following are valid generalizations of the method pattern example from Step 1:
• java/lang/String.indexOf*
• *lang/String.indexOf*
• *va/lang*.*dex*
• java/lang/String.*
• *.*
Chapter 2Writing Directives
2-8

Increased generalization leads to decreased precision in these examples. This isrisky because more Java code becomes a potential match with the methodpattern. Therefore, it’s important to use the wildcard character (*) judiciously.
3. Modify the signature portion of the method pattern. Signatures are writtenaccording to the Java Specifications. Signature matches must be exact, otherwisea signature defaults to a wildcard character (*). Omitted signatures also default toa wildcard character. Signatures themselves cannot contain the wildcardcharacter.
4. Optional: If you’re writing a method pattern to accompany the inline directiveoption, then there are additional characters you must prefix the method patternwith. See Writing an Inline Directive Option.
Writing an Inline Directive OptionThe attribute for an inline directive option requires an array of method patterns withspecial commands prefixed. This indicates which method patterns should or shouldn’tinline.
1. Write inline: in the common block, c1, or c2 block of a directive.
2. Accompany this with an array of carefully ordered method patterns. The prefixedcommand on the first matching method pattern is executed. The remaining methodpatterns in the array are ignored.
3. Prefix a + to force inlining of any matching Java code.
4. Prefix a - to prevent inlining of any matching Java code.
5. Optional: If you need inlining behavior applied to multiple method patterns, thenrepeat these steps to write multiple inline statements. Don’t write a single arraythat contains all patterns.
Examples of inline directive options are:
• inline: ["+java/lang*.*", "-sun*.*"]
• inline: "+java/lang*.*"
Preventing Duplication with the Enable OptionThe Enable option hides aspects of directives. This option prevents duplicationbetween directives.
Here is an example directives file:
[ { match: ["java*.*"], c1: { BreakAtExecute: true, BreakAtCompile: true, DumpReplay: true, DumpInline: true, }, c2: { MaxNodeLimit: 1000, }, }, {
Chapter 2Writing Directives
2-9

match: ["oracle*.*"], c1: { BreakAtExecute: true, BreakAtCompile: true, DumpReplay: true, DumpInline: true, }, c2: { MaxNodeLimit: 2000, }, },]
The c1 attribute of both directives are identical. This undesirable code duplication isresolved with the Enable option. Enable hides a block directives and renders themunmatchable. This produces the example solution:
[ { match: ["java*.*"], c1: { Enable: false, }, c2: { MaxNodeLimit: 1000, }, }, { match: ["oracle*.*"], c1: { Enable: false, }, c2: { MaxNodeLimit: 2000, }, }, { match: ["java*.*", "oracle*.*"], c1: { BreakAtExecute: true, BreakAtCompile: true, DumpReplay: true, DumpInline: true, }, c2: { //Unreachable code }, },]
The Enable option provides an exception to this rule; the first matching directive isapplied to a method’s compilation. Any method that would be compiled by c1 in the firstor second directive is now compiled with the c1 block of the third directive. The c2block of the third directive is unreachable because the c2 blocks in the first and seconddirective take priority.
Chapter 2Writing Directives
2-10

Understanding Directives BetterThe following topic examines how directives behave and interact.
Topics
• What Is the Default Directive?
• How Are Directives Applied to Code?
• Compiler Control and Backward Compatibility
What Is the Default Directive?The default directive is a compiler directive that contains default values for all possibledirective options. It is at the bottom of the directives stack and matches every methodsubmitted for compilation.
When you design a new directive, you specify how the new directive differs from thedefault directive. The default directive becomes a template to guide your designdecisions.
Directive Option Values in the Default Directive
Printing an empty directive stack reveals the default directive’s matching criteria andvalues for all directive options:
Directive: (default) matching: *.* c1 directives: inline: - Enable:true Exclude:false BreakAtExecute:false BreakAtCompile:false Log:false PrintAssembly:false PrintInlining:false PrintNMethods:false BackgroundCompilation:true ReplayInline:false DumpReplay:false DumpInline:false CompilerDirectivesIgnoreCompileCommands:false DisableIntrinsic: BlockLayoutByFrequency:true PrintOptoAssembly:false PrintIntrinsics:false TraceOptoPipelining:false TraceOptoOutput:false TraceSpilling:false Vectorize:false VectorizeDebug:0 CloneMapDebug:false IGVPrintLevel:0 MaxNodeLimit:80000
c2 directives: inline: - Enable:true Exclude:false BreakAtExecute:false BreakAtCompile:false Log:false PrintAssembly:false PrintInlining:false PrintNMethods:false BackgroundCompilation:true ReplayInline:false DumpReplay:false DumpInline:false CompilerDirectivesIgnoreCompileCommands:false DisableIntrinsic: BlockLayoutByFrequency:true PrintOptoAssembly:false PrintIntrinsics:false TraceOptoPipelining:false TraceOptoOutput:false TraceSpilling:false Vectorize:false VectorizeDebug:0 CloneMapDebug:false IGVPrintLevel:0 MaxNodeLimit:80000
Note:
Although these printouts provide a thorough account of all directive optionsand their values, certain options are applicable exclusively to the c2 compiler.For a complete list, see Table 2-2.
Chapter 2Understanding Directives Better
2-11

Directive Option Values in New Directives
New directives must specify how they differ from the default directive. If a directiveoption is not mentioned, then that option retains the value from the default directive.
For example:
[ { match: ["*Concurrent.*"], c2: { MaxNodeLimit: 1000, }, Exclude:true, },]
When you add this directive to the directives stack, the default directive becomes thebottom-most directive of the stack. See How Are Directives Ordered in the DirectivesStack? for a description of this process. The printout from the resulting directives stackshows how only the directive options specified in the example differ from the valuesfound in the default directive:
Directive: matching: *Concurrent.* c1 directives: inline: - Enable:true Exclude:true BreakAtExecute:false BreakAtCompile:false Log:false PrintAssembly:false PrintInlining:false PrintNMethods:false BackgroundCompilation:true ReplayInline:false DumpReplay:false DumpInline:false CompilerDirectivesIgnoreCompileCommands:false DisableIntrinsic: BlockLayoutByFrequency:true PrintOptoAssembly:false PrintIntrinsics:false TraceOptoPipelining:false TraceOptoOutput:false TraceSpilling:false Vectorize:false VectorizeDebug:0 CloneMapDebug:false IGVPrintLevel:0 MaxNodeLimit:80000
c2 directives: inline: - Enable:true Exclude:true BreakAtExecute:false BreakAtCompile:false Log:false PrintAssembly:false PrintInlining:false PrintNMethods:false BackgroundCompilation:true ReplayInline:false DumpReplay:false DumpInline:false CompilerDirectivesIgnoreCompileCommands:false DisableIntrinsic: BlockLayoutByFrequency:true PrintOptoAssembly:false PrintIntrinsics:false TraceOptoPipelining:false TraceOptoOutput:false TraceSpilling:false Vectorize:false VectorizeDebug:0 CloneMapDebug:false IGVPrintLevel:0 MaxNodeLimit:1000
Directive: (default) matching: *.* c1 directives: inline: - Enable:true Exclude:false BreakAtExecute:false BreakAtCompile:false Log:false PrintAssembly:false PrintInlining:false PrintNMethods:false BackgroundCompilation:true ReplayInline:false DumpReplay:false DumpInline:false CompilerDirectivesIgnoreCompileCommands:false DisableIntrinsic: BlockLayoutByFrequency:true PrintOptoAssembly:false PrintIntrinsics:false TraceOptoPipelining:false TraceOptoOutput:false TraceSpilling:false Vectorize:false VectorizeDebug:0 CloneMapDebug:false IGVPrintLevel:0 MaxNodeLimit:80000
c2 directives: inline: -
Chapter 2Understanding Directives Better
2-12

Enable:true Exclude:false BreakAtExecute:false BreakAtCompile:false Log:false PrintAssembly:false PrintInlining:false PrintNMethods:false BackgroundCompilation:true ReplayInline:false DumpReplay:false DumpInline:false CompilerDirectivesIgnoreCompileCommands:false DisableIntrinsic: BlockLayoutByFrequency:true PrintOptoAssembly:false PrintIntrinsics:false TraceOptoPipelining:false TraceOptoOutput:false TraceSpilling:false Vectorize:false VectorizeDebug:0 CloneMapDebug:false IGVPrintLevel:0 MaxNodeLimit:80000
How Are Directives Applied to Code?A directive is applied to code based on a method matching process. Every methodsubmitted for compilation is matched with a directive in the directives stack.
The process of brokering a match between a method and the directives stack isperformed by the CompilerBroker.
The Method Matching Process
When a method is submitted for compilation, its fully qualified name is compared to thematching criteria in the directives stack. The first matching directive in the stack isapplied to the method. The remaining directives in the stack are ignored. If no othermatch is found, then the default directive is applied.
This process is repeated for all methods in a compilation. Therefore, more than onedirective could be applied in a compilation, while only one directive is applied permethod. All directives in the stack are considered active because they are potentiallyapplicable. The key differences between active and applied directives are:
• A directive is active if it’s present in the directives stack.
• A directive is applied if it’s affecting code.
Example 2-1 When a Match Is Found
Example of a method submitted for compilation:
public int exampleMethod(int x){ return x;}
Based on method-matching criteria, Directive 2 is applied from the following exampledirective stack:
Directive 2: matching: *.*example*Directive 1: matching: *.*exampleMethod*Directive 0: (default) matching: *.*
Example 2-2 When No Match Is Found
The following example method is submitted for compilation:
public int otherMethod(int y){ return y;}
Based on method-matching criteria in the following example directive stack, Directive0 (the default directive) is applied:
Chapter 2Understanding Directives Better
2-13

Directive 2: matching: *.*example*Directive 1: matching: *.*exampleMethod*Directive 0: (default) matching: *.*
Other Guidelines
• Carefully write the directives’ method-matching criteria. There’s no feedbackmechanism to verify which directive is applied to a given method. Instead, aprofiler such as JMX is used to measure the cumulative effects of applieddirectives.
• The CompilerBroker ignores directive options that create bad code, such asforcing hardware instructions on a platform that doesn't offer support. A warningmessage is displayed.
• Directive options have the same limitations as typical command-line flags. Forexample, instructions to inline code are followed only if the IntermediateRepresentation (IR) doesn’t become too large.
Compiler Control and Backward CompatibilityCompileCommand and command-line flags can be used alongside Compiler Controldirectives.
Although Compiler Control can replace CompileCommand for all use cases, backwardcompatibility is still provided. It’s possible to utilize both at the same time. CompilerControl receives priority. Conflicts are handled based on the following prioritization:
1. Compiler Control
2. CompileCommand
3. Command-line flags
4. Default values
Example 2-3 Mixing Compiler Control and CompileCommand
The following list shows a small number of compilation options and some ways ofassigning values to those options:
• Compiler Control:
– Exclude: true
– BreakAtExecute: false
• CompileCommand:
– BreakAtExecute: true
– BreakAtCompile: true
• Default values:
– Exclude: false
– BreakAtExecute: false
– BreakAtCompile: false
– Log: false
Chapter 2Understanding Directives Better
2-14

For the options and values in this example, the resulting effects on compilation aredetermined through the rules for handling backward compatibility conflicts:
• Exclude: true
• BreakAtExecute: false
• BreakAtCompile: true
• Log: false
Commands to Work with Directive FilesThis topic examines commands and the effects of working with completed directivefiles.
• Compiler Directives and the Command Line
• Compiler Directives and Diagnostic Commands
• How Are Directives Ordered in the Directives Stack?
Compiler Directives and the Command LineThe command line provides an interface to add and print compiler directives whilestarting a program.
Only one directives file is specifiable from the command line. All directives within thatfile are added to the directives stack and are immediately active as the program starts.This makes it possible to test the performance effects of directives during a program’searly stages. You’re also free to focus on debugging and developing your program.
Adding Directives Through the Command Line
The command-line option that specifies a directives file is:
XX:CompilerDirectivesFile=file
Include this command-line option when you start a Java program. This is shown in thefollowing example, which starts TestProgram:
java -XX:+UnlockDiagnosticVMOptions -XX:CompilerDirectivesFile=File_A.json TestProgram
• -XX:+UnlockDiagnosticVMOptions enables diagnostic options. You must enter thisbefore working with directives on the command line.
• -XX:CompilerDirectivesFile is a type of diagnostic option. It specifies onedirectives file to add to the directives stack.
• File_A.json is a directives file. It contains any number of directives, all of which areadded to the stack of active directives as the program starts.
• If File_A.json contains syntax errors or malformed directives, then an errormessage is displayed and TestProgram does not start.
Printing Directives Through the Command Line
It’s possible to automatically print the directives stack when a program starts or whenadditional directives are added through diagnostic commands. The command-lineoption to enable this behavior is:
Chapter 2Commands to Work with Directive Files
2-15

-XX:+CompilerDirectivesPrint
An example of including this diagnostic command on the command line is:
java -XX:+UnlockDiagnosticVMOptions -XX:+CompilerDirectivesPrint -XX:CompilerDirectivesFile=File_A.json TestProgram
Compiler Directives and Diagnostic CommandsDiagnostic commands provide an interface to manage which directives are active atruntime. You can add directives to or remove directives from a running programwithout restarting it.
Crafting a single perfect directives file may take some iteration and experimentation.However, diagnostic commands provide powerful mechanisms for testing differentconfigurations of directives in the directives stack. Diagnostic commands let you addor remove directives without restarting a running program’s JVM.
Getting Your Java Process Identification NumberThe first step in testing directives is to find the process identification (pid) number ofyour running program.
1. Open a terminal.
2. Enter the following: jcmd
This command returns a list of every Java process running on your machine, alongwith their pid numbers. For example, you may see the following information returnedabout TestProgram:
11084 TestProgram
Adding Directives Through Diagnostic CommandsAll directives in a file are added to the directives stack through a single diagnosticcommand.
Enter the following:
jcmd pid Compiler.directives_add file
An example is:
jcmd 11084 Compiler.directives_add File_B.json
The terminal reports the number of individual directives added. However, if thedirectives file contains syntax errors or malformed directives, then an error message isdisplayed, and no directives from the file are added to the stack. There are no changesto the running program.
Removing Directives Through Diagnostic CommandsThere are two diagnostic commands that remove directives.
To remove the top-most, individual directive from the directive stack, enter:
jcmd pid Compiler.directives_remove
Chapter 2Commands to Work with Directive Files
2-16
To clear every directive you added to the directives stack, enter:
jcmd pid Compiler.directives_clear
It’s not possible to specify an entire file of directives to remove, nor is there any otherway to remove directives in bulk.
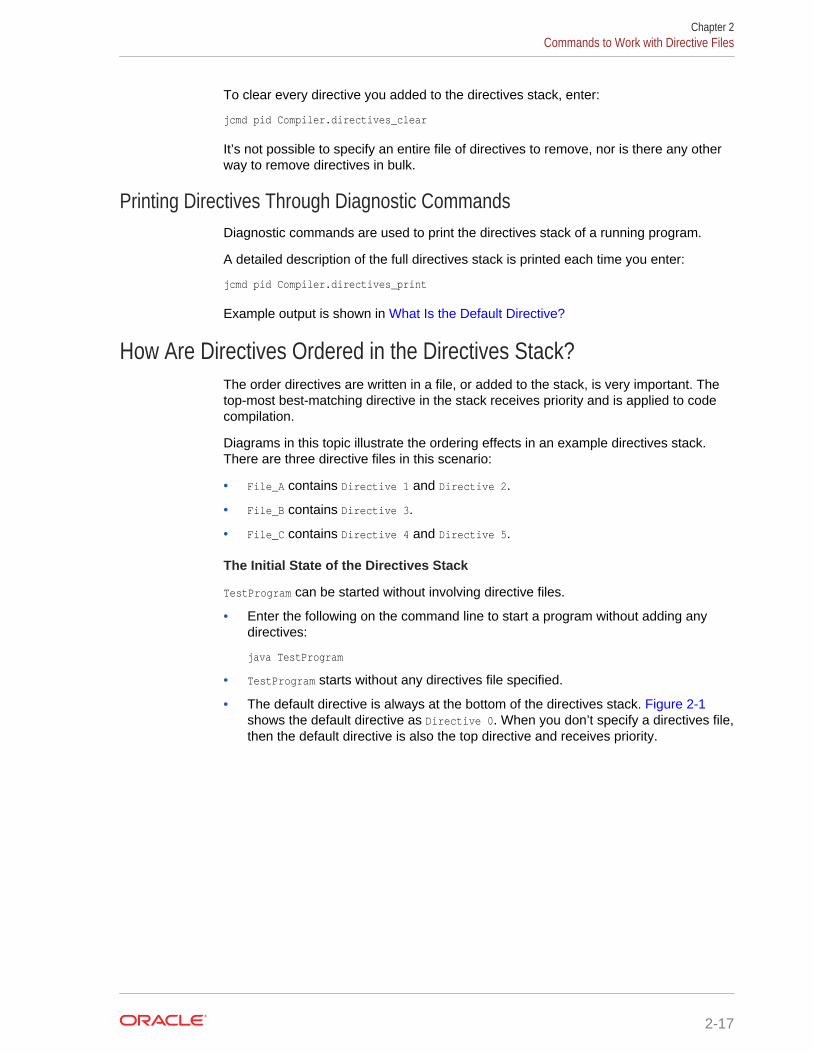
Printing Directives Through Diagnostic CommandsDiagnostic commands are used to print the directives stack of a running program.
A detailed description of the full directives stack is printed each time you enter:
jcmd pid Compiler.directives_print
Example output is shown in What Is the Default Directive?
How Are Directives Ordered in the Directives Stack?The order directives are written in a file, or added to the stack, is very important. Thetop-most best-matching directive in the stack receives priority and is applied to codecompilation.
Diagrams in this topic illustrate the ordering effects in an example directives stack.There are three directive files in this scenario:
• File_A contains Directive 1 and Directive 2.
• File_B contains Directive 3.
• File_C contains Directive 4 and Directive 5.
The Initial State of the Directives Stack
TestProgram can be started without involving directive files.
• Enter the following on the command line to start a program without adding anydirectives:
java TestProgram
• TestProgram starts without any directives file specified.
• The default directive is always at the bottom of the directives stack. Figure 2-1shows the default directive as Directive 0. When you don’t specify a directives file,then the default directive is also the top directive and receives priority.
Chapter 2Commands to Work with Directive Files
2-17

Figure 2-1 Starting a Program Without Directives
File_A
[ Directive 1 Directive 2
]
File_B
[ Directive 3
]
File_C
[ Directive 4 Directive 5
]
Directives Stack
Directive 0
java TestProgram
Alternatively, directives can be added to the directives stack when you startTestProgram:
• Enter the following on the command line to add all directives from File_A.json tothe directives stack:
java -XX:+UnlockDiagnosticVMOptions -XX:CompilerDirectivesFile=File_A.json TestProgram
• Directives are added to the stack in the reverse order they’re written. The top-mostdirective in the file becomes the top-most directive on the stack.
• Figure 2-2 shows that the order of directives in the stack, from top to bottom,becomes: [1, 2, 0].
Figure 2-2 Starting a Program with Directives
File_A
[ Directive 1 Directive 2
]
File_B
[ Directive 3
]
File_C
[ Directive 4 Directive 5
]
Directives Stack
Directive 2
Directive 0
Directive 1
-XX: CompilerDirectivesFile=File_A.json
Additions to the Directives Stack
If TestProgram is running, then you must supply additional directives through diagnosticcommands:
• Enter the following to add all directives from File_B to the directives stack:
jcmd 11084 Compiler.directives_add File_B.json
• Directive 3 is added to the top of the stack. This is the only directive found inFile_B.
Chapter 2Commands to Work with Directive Files
2-18

• Figure 2-3 shows that the order of directives in the stack becomes: [3, 1, 2, 0].
Figure 2-3 Adding a Directive to a Running Program
File_A
[ Directive 1 Directive 2
]
File_B
[ Directive 3
]
File_C
[ Directive 4 Directive 5
]
Directives Stack
Directive 3
Directive 2
Directive 0
Directive 1
Compiler.directives_add File_B.json
More directive files can be added through diagnostic commands if TestProgramcontinues running:
• Enter the following to add all directives from File_C to the directives stack.
jcmd 11084 Compiler.directives_add File_C.json
• Figure 2-4 shows that the order of directives in the stack becomes: [4, 5, 3, 1, 2,0].
Figure 2-4 Adding Many Directives to a Running Program
File_A
[ Directive 1 Directive 2
]
File_B
[ Directive 3
]
File_C
[ Directive 4 Directive 5
]
Directives Stack
Directive 4
Directive 5
Directive 3
Directive 2
Directive 0
Directive 1
Compiler.directives_add File_C.json
Removals from the Directives Stack
The top-most directive is removable through diagnostic commands:
• Enter the following to remove Directive 4 from the stack:
jcmd 11084 Compiler.directives_remove
• Top directives are removable one at a time by repeating this diagnostic commanduntil only the default directive remains. You can’t remove the default directive.
• Figure 2-5 shows that the order of directives in the stack becomes: [5, 3, 1, 2, 0].
Chapter 2Commands to Work with Directive Files
2-19

Figure 2-5 Removing One Directive from the Stack
File_A
[ Directive 1 Directive 2
]
File_B
[ Directive 3
]
File_C
[ Directive 4 Directive 5
]
Directives Stack
Directive 4
Directive 5
Directive 3
Directive 2
Directive 0
Directive 1
Compiler.directives_remove
There is one mechanism to bulk-remove directives from the directives stack:
• Enter the following to clear the directives stack:
jcmd 11084 Compiler.directives_clear
• All directives are removed at one time except the default directive. You can’tremove the default directive.
• Figure 2-6 shows that only Directive 0 remains in the stack.
Figure 2-6 Removing All Directives from the Stack
File_A
[ Directive 1 Directive 2
]
File_B
[ Directive 3
]
File_C
[ Directive 4 Directive 5
]
Directives Stack
Directive 5
Directive 3
Directive 2
Directive 0
Directive 1
Compiler.directives_clear
Chapter 2Commands to Work with Directive Files
2-20

3Garbage Collection
The Java HotSpot VM includes several garbage collectors that you can use to helpoptimize the performance of your application. A garbage collector is especially helpfulif your application handles large amounts of data (multiple gigabytes), has manythreads, and high transaction rates.
For descriptions of the available garbage collectors, see Garbage CollectionImplementation in the Java Platform, Standard Edition HotSpot Virtual MachineGarbage Collection Tuning Guide.
3-1

4Class Data Sharing
This chapter describes the class data sharing (CDS) feature that helps reduce thestartup time and memory footprints for Java applications.
Topics:
• Overview of Class Data Sharing
• Regenerating the Shared Archive
• Manually Controlling Class Data Sharing
Overview of Class Data SharingClass data sharing (CDS) offers dynamic sharing of data between multiple Java VirtualMachines (JVM), which helps to reduce the startup time and memory footprint.
When the JRE is installed using the installer, the installer loads a set of classes fromthe system Java Archive (JAR) file into a private internal representation, and dumpsthat representation to a file called a shared archive. If JRE installer is not being used,then you can generate the shared archive manually.
When the JVM starts, the shared archive is memory-mapped to allow sharing of read-only JVM metadata for these classes among multiple JVM processes. The startup timeis reduced thus saving the cost because restoring the shared archive is faster thanloading the classes.
Class data sharing is supported with the G1, serial, parallel, and parallelOldGCgarbage collectors. The shared string feature (part of class data sharing) supports onlythe G1 garbage collector on 64-bit non-Windows platforms.
The primary motivation for including CDS in Java SE is to decrease in startup time.The smaller the application relative to the number of core classes it uses, the largerthe saved fraction of startup time.
The footprint cost of new JVM instances has been reduced in two ways:
1. A portion of the shared archive on the same host is mapped as read-only andshared among multiple JVM processes. Otherwise, this data would need to bereplicated in each JVM instance, which would increase the startup time of yourapplication.
2. The shared archive contains class data in the form that the Java Hotspot VM usesit. The memory that would otherwise be required to access the original classinformation in the runtime modular image, is not needed. These savings allowmore applications to be run concurrently on the same system. In Windowsapplications, the footprint of a process, as measured by various tools, mightappear to increase, because more pages are mapped to the process’s addressspace. This is offset by the reduced amount of memory (inside Windows) that isneeded to hold portions on the runtime modular image. Reducing footprint remainsa high priority.
4-1

Regenerating the Shared ArchiveYou can regenerate the shared archive for all supported platforms.
The default class list contains only a small set of core library classes. You might wantto include other classes in the shared archive. To create a class list from the classloading tracing output or running applications, enter the following command to dumpall loaded library classes:
java -XX:DumpLoadedClassList=<class_list_file>
The class list created based on profiling should be used for generating the sharedarchive.
You can find the archive file along with the shared library for the JVM in the followinglocations:
• On Solaris, Linux, and macOS platforms, the shared archive is stored in /lib/[arch]/server/classes.jsa
• On Windows platforms, the shared archive is stored in /bin/server/classes.jsa
If the archive file exists, when you generate a new archive file, then it overwrites theexisting one. You don’t need to manually remove the old archive before you generatea new archive.
To regenerate the archive file , log in as the administrator. In networked situations, logon to a computer of the same architecture as the Java SE installation. Ensure that youhave permission to write to the installation directory.
To regenerate the shared archive by using a user defined class list enter the followingcommand:
java -XX:SharedClassListFile=<class_list_file> -Xshare:dump
Diagnostic information is printed when the archive is generated.
Manually Controlling Class Data SharingBy default, the class data sharing feature is enabled. You can manually enable anddisable this feature.
You can use the following command-line options for diagnostic and debuggingpurposes.
-Xshare:off
Disable class data sharing.
-Xshare:on
Require class data sharing to be enabled. If it could not be enabled for variousreasons, print an error message and exit.
-Xshare:auto
The default; enable class data sharing whenever possible.
Chapter 4Regenerating the Shared Archive
4-2

5Java HotSpot Virtual Machine PerformanceEnhancements
This chapter describes the performance enhancements in the Java HotSpot VirtualMachine technology.
Topics:
• Compact Strings
• Tiered Compilation
• Compressed Ordinary Object Pointer
• Zero-Based Compressed Ordinary Object Pointers
• Escape Analysis
Compact StringsCompact strings is a feature that introduces a space-efficient internal representationfor strings.
Data from different applications suggests that strings are a major component of Javaheap usage and that most java.lang.String objects contain only Latin-1 characters.Such characters require only one byte of storage. As a result, half of the space in theinternal character arrays of java.lang.String objects are not used. The compactstrings feature, introduced in Java SE 9 reduces the memory footprint, and alsoachieves reductions in garbage collection activity. The feature can be disabled if youobserve performance regression issues in an application.
The compact strings feature modifies the internal representation of thejava.lang.String class from a UTF-16 (two bytes) character array to a byte array withan additional field to identify character encoding. Other string-related classes, such asAbstractStringBuilder, StringBuilder, and StringBuffer are updated to use a similarinternal representation. The compact strings feature does not introduce new publicAPIs or interfaces, it purely modifies the internal representation of strings.
In Java SE 9, the compact strings feature is enabled by default. Therefore thejava.lang.String class stores characters as one byte per character, encoded asLatin-1. The additional character encoding field indicates which encoding is beingused. The HotSpot VM string intrinsics are updated and optimized to support theinternal representation.
The compact strings feature can be disabled by using the -XX:-CompactStrings flag withthe java command line. When the feature is disabled, the java.lang.String classstores characters as two bytes, encoded as UTF-16. This also reverts the HotSpot VMstring intrinsics to use UTF-16 encoding.
5-1

Tiered CompilationTiered compilation, introduced in Java SE 7, brings client VM startup speeds to theserver VM. Without tired compilation, a server VM uses the interpreter to collectprofiling information about methods that is sent to the compiler. With tieredcompilation, in addition to using the interpreter, the server VM uses the client compilerto generate compiled versions of methods that collect profiling information aboutthemselves. The compiled code is substantially faster than the interpreter, and theprogram executes with greater performance during the profiling phase. In many cases,the startup is faster than the client VM startup speed because the final code producedby the server compiler might be available during the early stages of applicationinitialization. The tiered compilation can also achieve better peak performance than aregular server VM because the faster profiling phase allows a longer period ofprofiling, which can yield better optimization.
Tiered compilation is enabled by default for the server VM. The 64-bit mode and Compressed Ordinary Object Pointer are supported. You can disable tieredcompilation by using the -XX:-TieredCompilation flag with the java command.
Compressed Ordinary Object PointerAn ordinary object pointer (oop) in Java Hotspot parlance, is a managed pointer to anobject. Typically, an oop is the same size as a native machine pointer, which is 64-biton an LP64 system. On an ILP32 system, maximum heap size is less than 4gigabytes, which is insufficient for many applications. On an LP64 system, the heapused by a given program might have to be around 1.5 times larger than when it is runon an ILP32 system. This requirement is due to the expanded size of managedpointers. Memory is inexpensive, but these days bandwidth and cache are in shortsupply, so significantly increasing the size of the heap and only getting just over the 4gigabyte limit is undesirable.
Managed pointers in the Java heap point to objects that are aligned on 8-byte addressboundaries. Compressed oops represent managed pointers (in many but not all placesin the Java Virtual Machine (JVM) software) as 32-bit object offsets from the 64-bitJava heap base address. Because they're object offsets rather than byte offsets, oopscan be used to address up to four billion objects (not bytes), or a heap size of up toabout 32 gigabytes. To use them, they must be scaled by a factor of 8 and added tothe Java heap base address to find the object to which they refer. Object sizes usingcompressed oops are comparable to those in ILP32 mode.
The term decode refer to the operation by which a 32-bit compressed oop is convertedto a 64-bit native address and added into the managed heap. The term encode refersto that inverse operation.
Compressed oops is supported and enabled by default in Java SE 6u23 and later. InJava SE 7, compressed oops is enabled by default for 64-bit JVM processes when -Xmx isn't specified and for values of -Xmx less than 32 gigabytes. For JDK releasesearlier than 6u23 release, use the -XX:+UseCompressedOops flag with the java commandto enable the compressed oops.
Chapter 5Tiered Compilation
5-2

Zero-Based Compressed Ordinary Object PointersWhen the JVM uses compressed ordinary object pointers (oops) in a 64-bit JVMprocess, the JVM software sends a request to the operating system to reservememory for the Java heap starting at virtual address zero. If the operating systemsupports such a request and can reserve memory for the Java heap at virtual addresszero, then zero-based compressed oops are used.
When zero-based compressed oops are used, a 64-bit pointer can be decoded from a32-bit object offset without including the Java heap base address. For heap sizes lessthan 4 gigabytes, the JVM software can use a byte offset instead of an object offsetand thus also avoid scaling the offset by 8. Encoding a 64-bit address into a 32-bitoffset is correspondingly efficient.
For Java heap sizes up to 26 gigabytes, the Solaris, Linux, and Windows operatingsystems typically can allocate the Java heap at virtual address zero.
Escape AnalysisEscape analysis is a technique by which the Java HotSpot Server Compiler cananalyze the scope of a new object's uses and decide whether to allocate the object onthe Java heap.
Escape analysis is supported and enabled by default in Java SE 6u23 and later.
The Java HotSpot Server Compiler implements the flow-insensitive escape analysisalgorithm described in:
[Choi99] Jong-Deok Choi, Manish Gupta, Mauricio Seffano, Vugranam C. Sreedhar, Sam Midkiff, "Escape Analysis for Java", Procedings of ACM SIGPLAN OOPSLA Conference, November 1, 1999
An object's escape state, based on escape analysis, can be one of the followingstates:
• GlobalEscape: The object escapes the method and thread. For example, an objectstored in a static field, stored in a field of an escaped object, or returned as theresult of the current method.
• ArgEscape: The object is passed as an argument or referenced by an argument butdoes not globally escape during a call. This state is determined by analyzing thebytecode of the called method.
• NoEscape: The object is a scalar replaceable object, which means that its allocationcould be removed from generated code.
After escape analysis, the server compiler eliminates the scalar replaceable objectallocations and the associated locks from generated code. The server compiler alsoeliminates locks for objects that do not globally escape. It does not replace a heapallocation with a stack allocation for objects that do not globally escape.
The following examples describe some scenarios for escape analysis:
• The server compiler might eliminate certain object allocations. For example, amethod makes a defensive copy of an object and returns the copy to the caller.
Chapter 5Zero-Based Compressed Ordinary Object Pointers
5-3
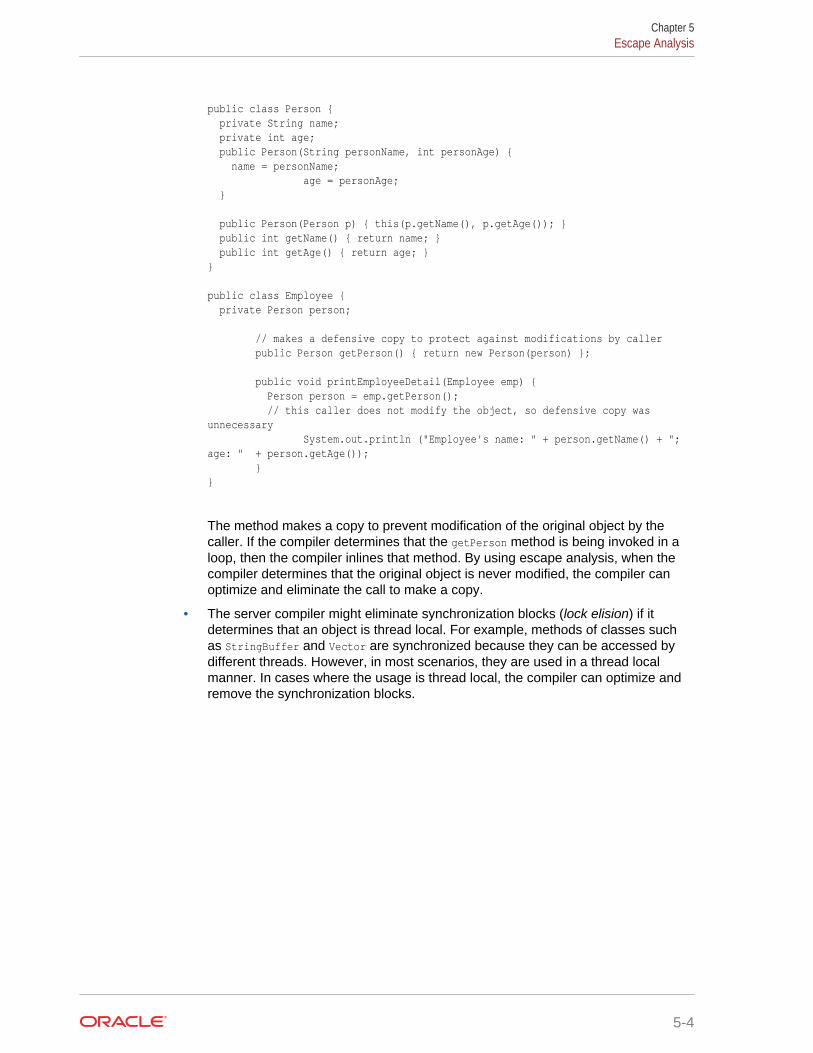
public class Person { private String name; private int age; public Person(String personName, int personAge) { name = personName; age = personAge; } public Person(Person p) { this(p.getName(), p.getAge()); } public int getName() { return name; } public int getAge() { return age; }}
public class Employee { private Person person; // makes a defensive copy to protect against modifications by caller public Person getPerson() { return new Person(person) }; public void printEmployeeDetail(Employee emp) { Person person = emp.getPerson(); // this caller does not modify the object, so defensive copy was unnecessary System.out.println ("Employee's name: " + person.getName() + "; age: " + person.getAge()); }}
The method makes a copy to prevent modification of the original object by thecaller. If the compiler determines that the getPerson method is being invoked in aloop, then the compiler inlines that method. By using escape analysis, when thecompiler determines that the original object is never modified, the compiler canoptimize and eliminate the call to make a copy.
• The server compiler might eliminate synchronization blocks (lock elision) if itdetermines that an object is thread local. For example, methods of classes suchas StringBuffer and Vector are synchronized because they can be accessed bydifferent threads. However, in most scenarios, they are used in a thread localmanner. In cases where the usage is thread local, the compiler can optimize andremove the synchronization blocks.
Chapter 5Escape Analysis
5-4

6Support for Non-Java Languages
This chapter describes the Non-Java Language features in the Java Virtual Machine.
Topics:
• Introduction to Non-Java Language Features
• Static and Dynamic Typing
• The Challenge of Compiling Dynamically-Typed Languages
• The invokedynamic Instruction
Introduction to Non-Java Language FeaturesThe Java Platform, Standard Edition (Java SE) enables the development ofapplications with the following features:
• Can be written once and run anywhere
• Can be run securely because of the Java sandbox security model
• Easy to package and deliver
The Java SE platform provides robust support in the following areas:
• Concurrency
• Garbage collection
• Reflective access to classes and objects
• JVM Tool Interface (JVM TI): A native programming interface for use by tools. Itprovides both a way to inspect the state and to control the execution ofapplications running in the JVM.
Oracle's HotSpot JVM provides the following tools and features:
• DTrace: A dynamic tracing utility that monitors the behavior of applications and theoperating system.
• Performance optimizations
• PrintAssembly: A Java HotSpot option that prints assembly code for bytecodedand native methods.
The Java SE 7 platform enables non-Java languages to use the infrastructure andpotential performance optimizations of the JVM. The key mechanism is theinvokedynamic instruction, which simplifies the implementation of compilers and runtimesystems for dynamically-typed languages on the JVM.
6-1

Static and Dynamic TypingA programming language is statically-typed if it performs type checking at compiletime. Type checking is the process of verifying that a program is type safe. A programis type safe if the arguments of all of its operations are the correct type.
Java is a statically-typed language. Type information is available for class andinstance variables, method parameters, return values, and other variables when aprogram is compiled. The compiler for the Java programming language uses this typeinformation to produce strongly typed bytecode, which can then be efficiently executedby the JVM at runtime.
The following example of a Hello World program demonstrates static typing. Types areshown in bold.
import java.util.Date;
public class HelloWorld { public static void main(String[] argv) { String hello = "Hello "; Date currDate = new Date(); for (String a : argv) { System.out.println(hello + a); System.out.println("Today's date is: " + currDate); } }}
A programming language is dynamically-typed if it performs type checking at runtime.JavaScript and Ruby are examples of dynamically typed languages. These languagesverify at runtime, rather than at compile time, that values in an application conform toexpected types. Typically, type information for these languages is not available whenan application is compiled. The type of an object is determined only at runtime. In thepast, it was difficult to efficiently implement dynamically-typed languages on the JVM.
The following is an example of the Hello World program written in the Rubyprogramming language:
#!/usr/bin/env rubyrequire 'date'
hello = "Hello "currDate = DateTime.nowARGV.each do|a| puts hello + a puts "Date and time: " + currDate.to_send
In the example, every name is introduced without a type declaration. The mainprogram is not located inside a holder type (the Java class HelloWorld). The Rubyequivalent of the Java for loop is inside the dynamic type ARGV variable. The body ofthe loop is contained in a block called a closure, which is a common feature indynamic languages.
Chapter 6Static and Dynamic Typing
6-2

Statically-Typed Languages Are Not Necessarily Strongly-TypedLanguages
Statically-typed programming languages can employ strong typing or weak typing. Aprogramming language that employs strong typing specifies restrictions on the types ofvalues supplied to its operations, and it prevents the execution of an operation if itsarguments have the wrong type. A language that employs weak typing would implicitlyconvert (or cast) arguments of an operation if those arguments have the wrong orincompatible types.
Dynamically-typed languages can employ strong typing or weak typing. For example,the Ruby programming language is dynamically-typed and strongly-typed. When avariable is initialized with a value of some type, the Ruby programming language doesnot implicitly convert the variable into another data type.
In the following example, the Ruby programming language does not implicitly cast thenumber 2, which has a Fixnum type, to a string.
a = "40"b = a + 2
The Challenge of Compiling Dynamically-Typed LanguagesConsider the following dynamically-typed method, addtwo, adds any two numbers(which can be of any numeric type) and returns the sum:
def addtwo(a, b) a + b;end
Suppose your organization is implementing a compiler and runtime system for theprogramming language in which the method addtwo is written. In a strongly-typedlanguage, whether typed statically or dynamically, the behavior of + (the additionoperator) depends on the operand types. A compiler for a statically-typed languagechooses the appropriate implementation of + based on the static types of a and b. Forexample, a Java compiler implements + with the iadd JVM instruction if the types of aand b are int. The addition operator is compiled to a method call because the JVMiadd instruction requires the operand types to be statically known.
A compiler for a dynamically-typed language must defer the choice until runtime. Thestatement a + b is compiled as the method call +(a, b), where + is the method name.A method named + is permitted in the JVM but not in the Java programming language.If the runtime system for the dynamically-typed language is able to identify that a and bare variables of integer type, then the runtime system would prefer to call animplementation of + that is specialized for integer types rather than arbitrary objecttypes.
The challenge of compiling dynamically-typed languages is how to implement aruntime system that can choose the most appropriate implementation of a method orfunction — after the program has been compiled. Treating all variables as objects ofObject type would not work efficiently; the Object class does not contain a methodnamed +.
Chapter 6The Challenge of Compiling Dynamically-Typed Languages
6-3

In Java SE 7 and later, the invokedynamic instruction enables the runtime system tocustomize the linkage between a call site and a method implementation. In thisexample, the invokedynamic call site is +. An invokedynamic call site is linked to amethod by means of a bootstrap method, which is a method specified by the compilerfor the dynamically-typed language that is called once by the JVM to link the site.Assuming the compiler emitted an invokedynamic instruction that invokes +, andassuming that the runtime system knows about the method adder(Integer,Integer),the runtime can link the invokedynamic call site to the adder method as follows:
IntegerOps.java
class IntegerOps {
public static Integer adder(Integer x, Integer y) { return x + y; }}
Example.java
import java.util.*;import java.lang.invoke.*;import static java.lang.invoke.MethodType.*;import static java.lang.invoke.MethodHandles.*;
class Example {
public static CallSite mybsm( MethodHandles.Lookup callerClass, String dynMethodName, MethodType dynMethodType) throws Throwable {
MethodHandle mh = callerClass.findStatic( Example.class, "IntegerOps.adder", MethodType.methodType(Integer.class, Integer.class, Integer.class));
if (!dynMethodType.equals(mh.type())) { mh = mh.asType(dynMethodType); }
return new ConstantCallSite(mh); }}
In this example, the IntegerOps class belongs to the library that accompanies runtimesystem for the dynamically-typed language.
The Example.mybsm method is a bootstrap method that links the invokedynamic call siteto the adder method.
The callerClass object is a lookup object, which is a factory for creating methodhandles.
The MethodHandles.Lookup.findStatic method (called from the callerClass lookupobject) creates a static method handle for the method adder.
Note: This bootstrap method links an invokedynamic call site to only the code that isdefined in the adder method. It assumes that the arguments given to the invokedynamic
Chapter 6The Challenge of Compiling Dynamically-Typed Languages
6-4

call site are Integer objects. A bootstrap method requires additional code to properlylink invokedynamic call sites to the appropriate code to execute if the parameters of thebootstrap method (in this example, callerClass, dynMethodName, and dynMethodType)vary.
The java.lang.invoke.MethodHandles class and java.lang.invoke.MethodHandle classcontain various methods that create method handles based on existing methodhandles. This example calls the asType method if the method type of the mh methodhandle does not match the method type specified by the dynMethodType parameter. Thisenables the bootstrap method to link invokedynamic call sites to Java methods whosemethod types don’t exactly match.
The ConstantCallSite instance returned by the bootstrap method represents a call siteto be associated with a distinct invokedynamic instruction. The target for aConstantCallSite instance is permanent and can never be changed. In this case, oneJava method, adder, is a candidate for executing the call site. This method does nothave to be a Java method. Instead, if several such methods are available to theruntime system, each handling different argument types, the mybsm bootstrap methodcould dynamically select the correct method, based on the dynMethodType argument.
The invokedynamic InstructionYou can use the invokedynamic instruction simplifies and potentially improvesimplementations of compilers and runtime systems for dynamic languages on theJVM. The invokedynamic instruction enables the language implementer to definecustom linkage. This contrasts with other JVM instructions such as invokevirtual, inwhich linkage behavior specific to Java classes and interfaces is hard-wired by theJVM.
Each instance of an invokedynamic instruction is called a dynamic call site. When aninstance of the dynamic call site is created, it is in an unlinked state, with no methodspecified for the call site to invoke. The dynamic call site is linked to a method bymeans of a bootstrap method. A dynamic call site's bootstrap method is a methodspecified by the compiler for the dynamically-typed language. The method is calledonce by the JVM to link the site. The object returned from the bootstrap methodpermanently determines the call site's activity.
The invokedynamic instruction contains a constant pool index (in the same format as forthe other invoke instructions). This constant pool index references aCONSTANT_InvokeDynamic entry. This entry specifies the bootstrap method (aCONSTANT_MethodHandle entry), the name of the dynamically-linked method, and theargument types and return type of the call to the dynamically-linked method.
In the following example, the runtime system links the dynamic call site specified bythe invokedynamic instruction (which is +, the addition operator) to the IntegerOps.addermethod by using the Example.mybsm bootstrap method. The adder method and mybsmmethod are defined in The Challenge of Compiling Dynamically Typed Languages(line breaks have been added for clarity):
invokedynamic InvokeDynamic REF_invokeStatic: Example.mybsm: "(Ljava/lang/invoke/MethodHandles/Lookup; Ljava/lang/String; Ljava/lang/invoke/MethodType;) Ljava/lang/invoke/CallSite;":
Chapter 6The invokedynamic Instruction
6-5

+: "(Ljava/lang/Integer; Ljava/lang/Integer;) Ljava/lang/Integer;";
Note:
The bytecode examples use the syntax of the ASM Java bytecodemanipulation and analysis framework.
Invoking a dynamically-linked method with the invokedynamic instruction involves thefollowing steps:
1. Defining the Bootstrap Method
2. Specifying Constant Pool Entries
3. Using the invokedynamic Instruction
Defining the Bootstrap MethodAt runtime, the first time the JVM encounters an invokedynamic instruction, it calls thebootstrap method. This method links the name that the invokedynamic instructionspecifies with the code to execute the target method, which is referenced by a methodhandle. The next time the JVM executes the same invokedynamic instruction, it doesnot call the bootstrap method; it automatically calls the linked method handle.
The bootstrap method's return type must be java.lang.invoke.CallSite. The CallSiteobject represents the linked state of the invokedynamic instruction and the methodhandle to which it is linked.
The bootstrap method takes three or more of the following parameters:
• MethodHandles.Lookup object: A factory for creating method handles in the contextof the invokedynamic instruction.
• String object: The method name mentioned in the dynamic call site.
• MethodType object: The resolved type signature of the dynamic call site.
• One or more additional static arguments to the invokedynamic instruction: Optionalarguments, drawn from the constant pool, are intended to help languageimplementers safely and compactly encode additional metadata useful to thebootstrap method. In principle, the name and extra arguments are redundantbecause each call site could be given its own unique bootstrap method. However,such a practice is likely to produce large class files and constant pools
See The Challenge of Compiling Dynamically Typed Languages for an example of abootstrap method.
Specifying Constant Pool EntriesThe invokedynamic instruction contains a reference to an entry in the constant pool withthe CONSTANT_InvokeDynamic tag. This entry contains references to other entries in theconstant pool and references to attributes. See, java.lang.invoke packagedocumentation and The Java Virtual Machine Specification.
Chapter 6The invokedynamic Instruction
6-6

Example Constant PoolThe following example shows an excerpt from the constant pool for the class Example,which contains the bootstrap method Example.mybsm that links the method + with theJava method adder:
class #159; // #47 Utf8 "adder"; // #83 Utf8 "(Ljava/lang/Integer;Ljava/lang/Integer;)Ljava/lang/Integer;"; // #84 Utf8 "mybsm"; // #87 Utf8 "(Ljava/lang/invoke/MethodHandles/Lookup;Ljava/lang/String;Ljava/lang/invoke/MethodType;) java/lang/invoke/CallSite;"; // #88 Utf8 "Example"; // #159 Utf8 "+"; // #166
// ...
NameAndType #83 #84; // #228 Method #47 #228; // #229 MethodHandle 6b #229; // #230 NameAndType #87 #88; // #231 Method #47 #231; // #232 MethodHandle 6b #232; // #233 NameAndType #166 #84; // #234 Utf8 "BootstrapMethods"; // #235 InvokeDynamic 0s #234; // #236
The constant pool entry for the invokedynamic instruction in this example contains threevalues:
• CONSTANT_InvokeDynamic tag
• Unsigned short of value 0
• Constant pool index #234.
The value, 0 refers to the first bootstrap method specifier in the array of specifiers thatare stored in the BootstrapMethods attribute. Bootstrap method specifiers are not in theconstant pool table. They are contained in this separate array of specifiers. Eachbootstrap method specifier contains an index to a CONSTANT_MethodHandle constant poolentry, which is the bootstrap method itself.
The following example shows an excerpt from the same constant pool that shows theBootstrapMethods attribute, which contains the array of bootstrap method specifiers:
[3] { // Attributes
// ...
Attr(#235, 6) { // BootstrapMethods at 0x0F63 [1] { // bootstrap_methods { // bootstrap_method #233; // bootstrap_method_ref [0] { // bootstrap_arguments } // bootstrap_arguments } // bootstrap_method }
Chapter 6The invokedynamic Instruction
6-7

} // end BootstrapMethods } // Attributes
The constant pool entry for the bootstrap method mybsm method handle contains thefollowing values:
• CONSTANT_MethodHandle tag
• Unsigned byte of value 6
• Constant pool index #232.
The value, 6 is the REF_invokeStatic subtag. See the next section, Using theinvokedynamic Instruction, for more information about this subtag.
Using the invokedynamic InstructionThe following example shows how the bytecode uses the invokedynamic instruction tocall the mybsm bootstrap method, which links the dynamic call site (+, the additionoperator) to the adder method. This example uses the + method to add the numbers 40and 2 (line breaks have been added for clarity):
bipush 40;invokestatic Method java/lang/Integer.valueOf:"(I)Ljava/lang/Integer;";iconst_2;invokestatic Method java/lang/Integer.valueOf:"(I)Ljava/lang/Integer;";invokedynamic InvokeDynamic REF_invokeStatic: Example.mybsm: "(Ljava/lang/invoke/MethodHandles/Lookup; Ljava/lang/String; Ljava/lang/invoke/MethodType;) Ljava/lang/invoke/CallSite;": +: "(Ljava/lang/Integer; Ljava/lang/Integer;) Ljava/lang/Integer;";
The first four instructions put the integers 40 and 2 in the stack and boxes them in thejava.lang.Integer wrapper type. The fifth instruction invokes a dynamic method. Thisinstruction refers to a constant pool entry with a CONSTANT_InvokeDynamic tag:
REF_invokeStatic: Example.mybsm: "(Ljava/lang/invoke/MethodHandles/Lookup; Ljava/lang/String; Ljava/lang/invoke/MethodType;) Ljava/lang/invoke/CallSite;": +: "(Ljava/lang/Integer; Ljava/lang/Integer;) Ljava/lang/Integer;";
Four bytes follow the CONSTANT_InvokeDynamic tag in this entry.
• The first two bytes form a reference to a CONSTANT_MethodHandle entry thatreferences a bootstrap method specifier:
Chapter 6The invokedynamic Instruction
6-8

REF_invokeStatic: Example.mybsm: "(Ljava/lang/invoke/MethodHandles/Lookup; Ljava/lang/String; Ljava/lang/invoke/MethodType;) Ljava/lang/invoke/CallSite;"
This reference to a bootstrap method specifier is not in the constant pool table. It iscontained in a separate array defined by a class file attribute namedBootstrapMethods. The bootstrap method specifier contains an index to aCONSTANT_MethodHandle constant pool entry, which is the bootstrap method itself.
Three bytes follow this CONSTANT_MethodHandle constant pool entry:
– The first byte is the REF_invokeStatic subtag. This means that this bootstrapmethod will create a method handle for a static method; note that thisbootstrap method is linking the dynamic call site with the static Java addermethod.
– The next two bytes form a CONSTANT_Methodref entry that represents themethod for which the method handle is to be created:
Example.mybsm: "(Ljava/lang/invoke/MethodHandles/Lookup; Ljava/lang/String; Ljava/lang/invoke/MethodType;) Ljava/lang/invoke/CallSite;"
In this example, the fully qualified name of the bootstrap method isExample.mybsm . The argument types are MethodHandles.Lookup, String, andMethodType. The return type is CallSite.
• The next two bytes form a reference to a CONSTANT_NameAndType entry:
+: "(Ljava/lang/Integer; Ljava/lang/Integer;) Ljava/lang/Integer;"
This constant pool entry specifies the method name (+), the argument types (twoInteger instances), and return type of the dynamic call site (Integer).
In this example, the dynamic call site is presented with boxed integer values, whichexactly match the type of the eventual target, the adder method. In practice, theargument and return types don’t need to exactly match. For example, theinvokedynamic instruction could pass either or both of its operands on the JVM stack asprimitive int values. Either or both operands could be untyped Object values. Theinvokedynamic instruction could receive its result as a primitive int value, or an untypedObject value. In any case, the dynMethodType argument to mybsm accurately describesthe method type that is required by the invokedynamic instruction.
The adder method could be given primitive or untyped arguments or return values. Thebootstrap method is responsible for making up any difference between thedynMethodType and the type of the adder method. As shown in the code, this is easilydone with an asType call on the target method.
Chapter 6The invokedynamic Instruction
6-9

7Signal Chaining
Signal chaining enables you to write applications that need to install their own signalhandlers. This facility is available on Solaris, Linux, and macOS.
The signal chaining facility has the following features:
• Support for preinstalled signal handlers when you create Oracle’s HotSpot VirtualMachine.
When the HotSpot VM is created, the signal handlers for signals that are used bythe HotSpot VM are saved. During execution, when any of these signals are raisedand are not to be targeted at the HotSpot VM, the preinstalled handlers areinvoked. In other words, preinstalled signal handlers are chained behind theHotSpot VM handlers for these signals.
• Support for the signal handlers that are installed after you create the HotSpot VM,either inside the Java Native Interface code or from another native thread.
Your application can link and load the libjsig.so shared library before the libc/libthread/libpthread library. This library ensures that calls such as signal(),sigset(), and sigaction() are intercepted and don’t replace the signal handlersthat are used by the HotSpot VM, if the handlers conflict with the signal handlersthat are already installed by HotSpot VM. Instead, these calls save the new signalhandlers. The new signal handlers are chained behind the HotSpot VM signalhandlers for the signals. During execution, when any of these signals are raisedand are not targeted at the HotSpot VM, the preinstalled handlers are invoked.
If support for signal handler installation after the creation of the VM is not required,then the libjsig.so shared library is not needed.
To enable signal chaining, perform one of the following procedures to use thelibjsig.so shared library:
– Link the libjsig.so shared library with the application that creates or embedsthe HotSpot VM:
cc -L libjvm.so-directory -ljsig -ljvm java_application.c
– Use the LD_PRELOAD environment variable:
* Korn shell (ksh):
export LD_PRELOAD=libjvm.so-directory/libjsig.so; java_application
* C shell (csh):
setenv LD_PRELOAD libjvm.so-directory/libjsig.so; java_application
The interposed signal() , sigset() , and sigaction() calls return the saved signalhandlers, not the signal handlers installed by the HotSpot VM and are seen by theoperating system.
7-1

Note:
The SIGQUIT, SIGTERM, SIGINT, and SIGHUP signals cannot be chained. If theapplication must handle these signals, then consider using the —Xrs option.
Enable Signal Chaining in macOS
To enable signal chaining in macOS, set the following environment variables:
• DYLD_INSERT_LIBRARIES: Preloads the specified libraries instead of the LD_PRELOADenvironment variable available on Solaris and Linux.
• DYLD_FORCE_FLAT_NAMESPACE: Enables functions in the libjsig library and replacesthe OS implementations, because of macOS’s two-level namespace (a symbol'sfully qualified name includes its library). To enable this feature, set thisenvironment variable to any value.
The following command enables signal chaining by preloading the libjsig library:
$ DYLD_FORCE_FLAT_NAMESPACE=0 DYLD_INSERT_LIBRARIES="JAVA_HOME/lib/libjsig.dylib"
java MySpiffyJavaApp
Note:
The library file name on macOS is libjsig.dylib not libjsig.so as it is onSolaris or Linux.
Chapter 7
7-2

8Native Memory Tracking
This chapter describes the Native Memory Tracking (NMT) feature. NMT is a JavaHotspot VM feature that tracks internal memory usage for a HotSpot VM. You canaccess NMT data by using the jcmd utility. NMT does not track memory allocations forthird-party native code and Oracle Java Development Kit (JDK) class libraries. NMTdoes not include NMT MBean in HotSpot for Java Mission Control (JMC).
Topics:
• Key Features
• Using Native Memory Tracking
– Enabling NMT
– Accessing NMT Data using jcmd
• Obtaining NMT Data at VM Exit
Key FeaturesWhen you use Native Memory Tracking with jcmd, you can track Java Virtual Machine(JVM) or HotSpot VM memory usage at different levels. NMT tracks only the memorythat the JVM or HotSpot VM uses, not the user's native memory. NMT doesn't givecomplete information for the memory used by the class data sharing (CDS) archive.
NMT supports the following features:
• NMT for HotSpot VM is turned off by default. You can turn on NMT by using theJVM command-line option. See java in the Java Platform, Standard Edition ToolsReference for information about advanced runtime options.
• You can access NMT using the jcmd utility. See Use jcmd to Access NMT Data.You can stop NMT by using the jcmd utility, but you can't start or restart NMT byusing the jcmd utilty.
• Generate summary and detail reports.
• Establish an early baseline for later comparison.
• Request a memory usage report at JVM exit with the JVM command-line option.See NMT at VM exit.
Using Native Memory TrackingYou must enable NMT and then use the jcmd utility to access the NMT data.
Enabling NMTTo enable NMT, use the following command-line options:
-XX:NativeMemoryTracking=[off | summary | detail]
8-1

Note:
Enabling NMT causes a 5% -10% performance overhead.
The following table describes the NMT command-line usage options:
Table 8-1 NMT Usage Options
NMT Options Description
off NMT is turned off by default.
summary Collect only memory usage aggregated by subsystem.
detail Collect the memory usage by individual call sites.
Accessing NMT Data using jcmdUse jcmd to dump the data that is collected and optionally compare the data to the lastbaseline.
jcmd <pid> VM.native_memory [summary | detail | baseline | summary.diff |
detail.diff | shutdown] [scale= KB | MB | GB]
Table 8-2 jcmd NMT Options
jcmd NMT Option Description
summary Print a summary, aggregated by category.
detail • Print memory usage, aggregated by category• Print virtual memory map• Print memory usage, aggregated by call site
baseline Create a new memory usage snapshot for comparison.
summary.diff Print a new summary report against the last baseline.
detail.diff Print a new detail report against the last baseline.
shutdown Stop NMT.
Obtaining NMT Data at VM ExitTo obtain data for the last memory usage at VM exit, when Native Memory Tracking isenabled, use the following VM diagnostic command-line options. The level of detail isbased on tracking level.
-XX:+UnlockDiagnosticVMOptions -XX:+PrintNMTStatistics
See Native Memory Tracking in the Java Platform, Standard Edition TroubleshootingGuide for information about how to monitor VM internal memory allocations anddiagnose VM memory leaks.
Chapter 8Obtaining NMT Data at VM Exit
8-2

9DTrace Probes in HotSpot VM
This chapter describes the DTrace support in Oracle’s HotSpot VM. The hotspot andhotspot_jni providers make available probes that are used to monitor JVM internalstate and activities as well as the Java application that is running. All of the probes areUSDT probes and are accessed using the process-id of the JVM process.
Topics:
• Using the hotspot Provider
– VM Lifecycle Probes
– Thread Lifecycle Probes
– Classloading Probes
– Garbage Collection Probes
– Method Compilation Probes
– Monitor Probes
– Application Tracking Probes
• Using the hotspot_jni Provider
• Sample DTrace Probes
Using the hotspot ProviderThe hotspot provider makes available probes that you can use to track the lifespan ofthe VM, thread start and stop events, garbage collector (GC) and memory poolstatistics, method compilations, and monitor activity. With a startup flag, additionalprobes are enabled that can be used to monitor the running Java program, such asmethod enter and return probes, and object allocations. The hotspot probes originatein the VM library (libjvm.so), so they are provided from programs that embed the VM.
Many of the probes in the provider have arguments for providing further details on thestate of the VM. Many of these arguments are opaque IDs which can be used to linkprobe firings to each other, however strings and other data are also provided. Whenstring values are provided, they are always present as a pair: a pointer to unterminatedmodified UTF-8 data (see JVM spec) , and a length value which indicates the extent ofthat data. The string data (even when none of the characters are outside the ASCIIrange) is not guaranteed to be terminated by a NUL character, and it is necessary touse the length-terminated copyinstr() intrinsic to read the string data.
VM Lifecycle ProbesThe following probes are available for tracking VM lifecycle activities. None have anyarguments.
9-1

Table 9-1 VM Lifecycle Probes
Probe Description
vm-init-begin Probe that starts when the VM initialization begins
vm-init-end Probe that starts when the VM initialization finishes, andthe VM is ready to start running application code
vm-shutdown Probe that starts as the VM is shuts down due toprogram termination or an error
Thread Lifecycle ProbesThe following probes are available for tracking thread start and stop events.
Probe Description
thread-start Probe that starts when a thread starts.
thread-stop Probe that starts when the thread has completed.
The following argument are available for the thread lifecycle probes:
Probe Arguments Description
args[0] A pointer to UTF-8 string data that contains the threadname.
args[1] The length of the thread name data (in bytes).
args[2] The Java thread ID. This value matches other HotSpotVM probes that contain a thread argument.
args[3] The native or OS thread ID. This ID is assigned by thehost operating system.
args[4] A boolean value that indicates whether this thread is adaemon or not. A value of 0 indicates a non-daemonthread.
Classloading ProbesThe following probes are available for tracking class loading and unloading activity.
Probe Description
class-loaded Probe that fires when a class is loaded
class-unloaded Probe that fires when a class is unloaded from thesystem
The following arguments are available for the classloading probes:
Probe Arguments Description
args[0] A pointer to UTF-8 string data that contains the name ofthe class that is loaded
Chapter 9Using the hotspot Provider
9-2

Probe Arguments Description
args[1] The length of the class name data (in bytes)
args[2] The class loader ID, which is a unique identifier for aclass loader in the VM. (This is the class loader thatloaded the class.)
args[3] A boolean value that indicates whether the class is ashared class (if the class was loaded from the sharedarchive)
Garbage Collection ProbesProbes are available that you can use to measure the duration of a system-widegarbage collection cycle (for those garbage collectors that have a defined begin andend). Each memory pool is tracked independently. The probes for individual poolspass the memory manager's name, the pool name, and pool usage information at boththe beginning and ending of pool collection.
The following probes are available for garbage collecting activities:
Probe Description
gc-begin Probe that starts when a system-wide collection starts.The one argument available for this probe, (arg[0]), is aboolean value that indicates whether to perform a FullGC.
gc-end Probe that starts when a system-wide collection iscompleted. No arguments.
mem-pool-gc-begin Probe that starts when an individual memory pool iscollected.
mem-pool-gc-end Probe that starts after an individual memory pool iscollected.
The following arguments are available for the memory pool probes:
Probe Arguments Description
args[0] A pointer to the UTF-8 string data that contains thename of the manager that manages this memory pool.
args[1] The length of the manager name data (in bytes).
args[2] A pointer to the UTF-8 string data that contains thename of the memory pool.
args[3] The length of the memory pool name data (in bytes).
args[4] The initial size of the memory pool (in bytes).
args[5] The amount of memory in use in the memory pool (inbytes).
args[6] The number of committed pages in the memory pool.
args[7] The maximum size of the memory pool.
Chapter 9Using the hotspot Provider
9-3

Method Compilation ProbesProbes are available to indicate which methods are being compiled and by whichcompiler, and to track when the compiled methods are installed or uninstalled.
The following probes are available to mark the beginning and ending of methodcompilation:
Probe Description
method-compile-begin Probe that starts when the method compilation begins.
method-compile-end Probe that starts when method compilation iscompleted. In addition to the following arguments, theargv[8] argument is a boolean value that indicateswhether the compilation was successful.
The following arguments are available for the method compilation probes:
Probe Arguments Description
args[0] A pointer to UTF-8 string data that contains the name ofthe compiler that is compiling this method.
args[1] The length of the compiler name data (in bytes).
args[2] A pointer to UTF-8 string data that contains the name ofthe class of the method being compiled.
args[3] The length of the class name data (in bytes).
args[4] A pointer to UTF-8 string data that contains the name ofthe method being compiled.
args[5] The length of the method name data (in bytes).
args[6] A pointer to UTF-8 string data that contains thesignature of the method being compiled.
args[7] The length of the signature data (in bytes).
The following probes are available when compiled methods are installed for executionor uninstalled:
Probe Description
compiled-method-load Probe that starts when a compiled method is installed.The additional argument, argv[6] contains a pointer tothe compiled code, and the argv[7] is the size of thecompiled code.
compiled-method-unload Probe that starts when a compiled method is uninstalled.
The following arguments are available for the compiled method loading probe:
Probe Arguments Description
args[0] A pointer to UTF-8 string data that contains the name ofthe class of the method being installed.
args[1] The length of the class name data (in bytes).
Chapter 9Using the hotspot Provider
9-4

Probe Arguments Description
args[2] A pointer to UTF-8 string data that contains the name ofthe method being installed.
args[3] The length of the method name data (in bytes).
args[4] A pointer to UTF-8 string data that contains thesignature of the method being installed.
args[5] The length of the signature data (in bytes).
Monitor ProbesWhen your Java application runs, threads enter and exit monitors, wait on monitors,and perform notifications. Probes are available for all wait and notification events, andfor contended monitor entry and exit events.
A contended monitor entry occurs when a thread attempts to enter a monitor whileanother thread is in the monitor. A contended monitor exit event occurs when a threadleaves a monitor while other threads are waiting to enter to the monitor. Thecontended monitor entry and contended monitor exit events might not match eachother in relation to the thread that encounters these events, athough a contended exitfrom one thread is expected to match up to a contended enter on another thread (thethread waiting to enter the monitor).
Monitor events provide the thread ID, a monitor ID, and the type of the class of theobject as arguments. The thread ID and the class type can map back to the Javaprogram, while the monitor ID can provide matching information between probe firings.
The existence of these probes in the VM causes performance degradation, and theystart only when the -XX:+ExtendedDTraceProbes flag is set on the Java command line.This flag is turned on and off dynamically at runtime by using the jinfo utility.
If the flag is off, the monitor probes are present in the probe listing that is obtainablefrom Dtrace, but the probes remain dormant and don’t start. Removal of this restrictionis planned for future releases of the VM, and these probes will be enabled with noimpact to performance.
The following probes are available for monitoring events:
Probe Description
monitor-contended-enter Probe that starts when a thread attempts to enter acontended monitor
monitor-contended-entered Probe that starts when a thread successfully enters thecontended monitor
monitor-contended-exit Probe that starts when a thread leaves a monitor andother threads are waiting to enter
monitor-wait Probe that starts when a thread begins a wait on amonitor by using the Object.wait(). The additionalargument, args[4] is a long value that indicates thetimeout being used.
monitor-waited Probe that starts when a thread completes anObject.wait() action.
Chapter 9Using the hotspot Provider
9-5

Probe Description
monitor-notify Probe that starts when a thread calls Object.notify()to notify waiters on a monitor.
monitor-notifyAll Probe that starts when a thread callsObject.notifyAll() to notify waiters on a monitor.
The following arguments are available for the monitor:
Probe Arguments Description
args[0] The Java thread identifier for the thread performing themonitor operation.
args[1] A unique, but opaque identifier for the specific monitorthat the action is performed upon.
args[2] A pointer to UTF-8 string data which contains the classname of the object being acted upon.
args[3] The length of the class name data (in bytes).
Application Tracking ProbesYou can use probes to allow fine-grained examination of Java thread execution. Theapplication tracking probes start when a method is entered or returned from, or when aJava object has been allocated.
The existence of these probes in the VM causes performance degradation, and theywill start only when the VM has the ExtendedDTraceProbes flag enabled. By default, theprobes are present in any listing of the probes in the VM, but are dormant without theappropriate flag. Removal of this restriction is planned in future releases of the VM,and these probes will be enabled no impact to performance.
The following probes are available for the method entry and exit:
Probe Description
method-entry Probe that starts when a method is being entered.
method-return Probe that starts when a method returns, either normallyor due to an exception.
The following arguments are available for the method entry and exit:
Probe Arguments Description
args[0] The Java thread ID of the thread that is entering orleaving the method.
args[1] A pointer to UTF-8 string data that contains the name ofthe class of the method.
args[2] The length of the class name data (in bytes).
args[3] A pointer to UTF-8 string data that contains the name ofthe method.
args[4] The length of the method name data (in bytes).
Chapter 9Using the hotspot Provider
9-6

Probe Arguments Description
args[5] A pointer to UTF-8 string data that contains thesignature of the method.
args[6] The length of the signature data (in bytes).
The following probe is available for the object allocation:
Probe Description
object-alloc Probe that starts when any object is allocated, providedthat the ExtendedDTraceProbes flag is enabled.
The following arguments are available for the object allocation probe:
Probe Arguments Description
args[0] The Java thread ID of the thread that is allocating theobject.
args[1] A pointer to UTF-8 string data that contains the classname of the object being allocated.
args[2] The length of the class name data (in bytes).
args[3] The size of the object being allocated.
Using the hotspot_jni ProviderIn order to call from native code to Java code, due to embedding of the VM in anapplication or execution of native code within a Java application, the native code mustmake a call through the Java Native Interface (JNI) interface. The JNI interfaceprovides a number of methods for invoking Java code and examining the state of theVM. DTrace probes are provided at the entry point and return point for each of thesemethods. The probes are provided by the hotspot_jni provider. The name of the probeis the name of the JNI method, appended with -entry for entry probes, and -return forreturn probes. The arguments available at each entry probe are the arguments thatwere provided to the function, with the exception of the Invoke* methods, which omitthe arguments that are passed to the Java method. The return probes have the returnvalue of the method as an argument (if available).
Sample DTrace Probes
provider hotspot { probe vm-init-begin(); probe vm-init-end(); probe vm-shutdown(); probe class-loaded( char* class_name, uintptr_t class_name_len, uintptr_t class_loader_id, bool is_shared); probe class-unloaded( char* class_name, uintptr_t class_name_len, uintptr_t class_loader_id, bool is_shared); probe gc-begin(bool is_full);
Chapter 9Using the hotspot_jni Provider
9-7

probe gc-end(); probe mem-pool-gc-begin( char* mgr_name, uintptr_t mgr_name_len, char* pool_name, uintptr_t pool_name_len, uintptr_t initial_size, uintptr_t used, uintptr_t committed, uintptr_t max_size); probe mem-pool-gc-end( char* mgr_name, uintptr_t mgr_name_len, char* pool_name, uintptr_t pool_name_len, uintptr_t initial_size, uintptr_t used, uintptr_t committed, uintptr_t max_size); probe thread-start( char* thread_name, uintptr_t thread_name_length, uintptr_t java_thread_id, uintptr_t native_thread_id, bool is_daemon); probe thread-stop( char* thread_name, uintptr_t thread_name_length, uintptr_t java_thread_id, uintptr_t native_thread_id, bool is_daemon); probe method-compile-begin( char* class_name, uintptr_t class_name_len, char* method_name, uintptr_t method_name_len, char* signature, uintptr_t signature_len); probe method-compile-end( char* class_name, uintptr_t class_name_len, char* method_name, uintptr_t method_name_len, char* signature, uintptr_t signature_len, bool is_success); probe compiled-method-load( char* class_name, uintptr_t class_name_len, char* method_name, uintptr_t method_name_len, char* signature, uintptr_t signature_len, void* code, uintptr_t code_size); probe compiled-method-unload( char* class_name, uintptr_t class_name_len, char* method_name, uintptr_t method_name_len, char* signature, uintptr_t signature_len); probe monitor-contended-enter( uintptr_t java_thread_id, uintptr_t monitor_id, char* class_name, uintptr_t class_name_len); probe monitor-contended-entered( uintptr_t java_thread_id, uintptr_t monitor_id, char* class_name, uintptr_t class_name_len); probe monitor-contended-exit( uintptr_t java_thread_id, uintptr_t monitor_id, char* class_name, uintptr_t class_name_len); probe monitor-wait( uintptr_t java_thread_id, uintptr_t monitor_id, char* class_name, uintptr_t class_name_len, uintptr_t timeout); probe monitor-waited( uintptr_t java_thread_id, uintptr_t monitor_id, char* class_name, uintptr_t class_name_len); probe monitor-notify( uintptr_t java_thread_id, uintptr_t monitor_id, char* class_name, uintptr_t class_name_len); probe monitor-notifyAll( uintptr_t java_thread_id, uintptr_t monitor_id, char* class_name, uintptr_t class_name_len); probe method-entry( uintptr_t java_thread_id, char* class_name, uintptr_t class_name_len, char* method_name, uintptr_t method_name_len, char* signature, uintptr_t signature_len);
Chapter 9Sample DTrace Probes
9-8

probe method-return( uintptr_t java_thread_id, char* class_name, uintptr_t class_name_len, char* method_name, uintptr_t method_name_len, char* signature, uintptr_t signature_len); probe object-alloc( uintptr_t java_thread_id, char* class_name, uintptr_t class_name_len, uintptr_t size);};
provider hotspot_jni { probe AllocObject-entry(void*, void*); probe AllocObject-return(void*); probe AttachCurrentThreadAsDaemon-entry(void*, void**, void*); probe AttachCurrentThreadAsDaemon-return(uint32_t); probe AttachCurrentThread-entry(void*, void**, void*); probe AttachCurrentThread-return(uint32_t); probe CallBooleanMethodA-entry(void*, void*, uintptr_t); probe CallBooleanMethodA-return(uintptr_t); probe CallBooleanMethod-entry(void*, void*, uintptr_t); probe CallBooleanMethod-return(uintptr_t); probe CallBooleanMethodV-entry(void*, void*, uintptr_t); probe CallBooleanMethodV-return(uintptr_t); probe CallByteMethodA-entry(void*, void*, uintptr_t); probe CallByteMethodA-return(char); probe CallByteMethod-entry(void*, void*, uintptr_t); probe CallByteMethod-return(char); probe CallByteMethodV-entry(void*, void*, uintptr_t);
probe CallByteMethodV-return(char); probe CallCharMethodA-entry(void*, void*, uintptr_t); probe CallCharMethodA-return(uint16_t); probe CallCharMethod-entry(void*, void*, uintptr_t); probe CallCharMethod-return(uint16_t); probe CallCharMethodV-entry(void*, void*, uintptr_t); probe CallCharMethodV-return(uint16_t); probe CallDoubleMethodA-entry(void*, void*, uintptr_t); probe CallDoubleMethodA-return(double); probe CallDoubleMethod-entry(void*, void*, uintptr_t); probe CallDoubleMethod-return(double); probe CallDoubleMethodV-entry(void*, void*, uintptr_t); probe CallDoubleMethodV-return(double); probe CallFloatMethodA-entry(void*, void*, uintptr_t); probe CallFloatMethodA-return(float); probe CallFloatMethod-entry(void*, void*, uintptr_t); probe CallFloatMethod-return(float); probe CallFloatMethodV-entry(void*, void*, uintptr_t); probe CallFloatMethodV-return(float); probe CallIntMethodA-entry(void*, void*, uintptr_t); probe CallIntMethodA-return(uint32_t); probe CallIntMethod-entry(void*, void*, uintptr_t); probe CallIntMethod-return(uint32_t); probe CallIntMethodV-entry(void*, void*, uintptr_t); probe CallIntMethodV-return(uint32_t); probe CallLongMethodA-entry(void*, void*, uintptr_t); probe CallLongMethodA-return(uintptr_t); probe CallLongMethod-entry(void*, void*, uintptr_t); probe CallLongMethod-return(uintptr_t); probe CallLongMethodV-entry(void*, void*, uintptr_t); probe CallLongMethodV-return(uintptr_t); probe CallNonvirtualBooleanMethodA-entry(void*, void*, void*, uintptr_t); probe CallNonvirtualBooleanMethodA-return(uintptr_t);
Chapter 9Sample DTrace Probes
9-9

probe CallNonvirtualBooleanMethod-entry(void*, void*, void*, uintptr_t); probe CallNonvirtualBooleanMethod-return(uintptr_t); probe CallNonvirtualBooleanMethodV-entry(void*, void*, void*, uintptr_t); probe CallNonvirtualBooleanMethodV-return(uintptr_t); probe CallNonvirtualByteMethodA-entry(void*, void*, void*, uintptr_t); probe CallNonvirtualByteMethodA-return(char); probe CallNonvirtualByteMethod-entry(void*, void*, void*, uintptr_t); probe CallNonvirtualByteMethod-return(char); probe CallNonvirtualByteMethodV-entry(void*, void*, void*, uintptr_t); probe CallNonvirtualByteMethodV-return(char); probe CallNonvirtualCharMethodA-entry(void*, void*, void*, uintptr_t); probe CallNonvirtualCharMethodA-return(uint16_t); probe CallNonvirtualCharMethod-entry(void*, void*, void*, uintptr_t); probe CallNonvirtualCharMethod-return(uint16_t); probe CallNonvirtualCharMethodV-entry(void*, void*, void*, uintptr_t); probe CallNonvirtualCharMethodV-return(uint16_t); probe CallNonvirtualDoubleMethodA-entry(void*, void*, void*, uintptr_t); probe CallNonvirtualDoubleMethodA-return(double); probe CallNonvirtualDoubleMethod-entry(void*, void*, void*, uintptr_t); probe CallNonvirtualDoubleMethod-return(double); probe CallNonvirtualDoubleMethodV-entry(void*, void*, void*, uintptr_t); probe CallNonvirtualDoubleMethodV-return(double); probe CallNonvirtualFloatMethodA-entry(void*, void*, void*, uintptr_t); probe CallNonvirtualFloatMethodA-return(float); probe CallNonvirtualFloatMethod-entry(void*, void*, void*, uintptr_t); probe CallNonvirtualFloatMethod-return(float); probe CallNonvirtualFloatMethodV-entry(void*, void*, void*, uintptr_t); probe CallNonvirtualFloatMethodV-return(float); probe CallNonvirtualIntMethodA-entry(void*, void*, void*, uintptr_t); probe CallNonvirtualIntMethodA-return(uint32_t); probe CallNonvirtualIntMethod-entry(void*, void*, void*, uintptr_t); probe CallNonvirtualIntMethod-return(uint3t); probe CallNonvirtualIntMethodV-entry(void*, void*, void*, uintptr_t); probe CallNonvirtualIntMethodV-return(uint32_t); probe CallNonvirtualLongMethodA-entry(void*, void*, void*, uintptr_t); probe CallNonvirtualLongMethodA-return(uintptr_t); probe CallNonvirtualLongMethod-entry(void*, void*, void*, uintptr_t); probe CallNonvirtualLongMethod-return(uintptr_t); probe CallNonvirtualLongMethodV-entry(void*, void*, void*, uintptr_t); probe CallNonvirtualLongMethodV-return(uintptr_t); probe CallNonvirtualObjectMethodA-entry(void*, void*, void*, uintptr_t); probe CallNonvirtualObjectMethodA-return(void*); probe CallNonvirtualObjectMethod-entry(void*, void*, void*, uintptr_t); probe CallNonvirtualObjectMethod-return(void*); probe CallNonvirtualObjectMethodV-entry(void*, void*, void*, uintptr_t); probe CallNonvirtualObjectMethodV-return(void*); probe CallNonvirtualShortMethodA-entry(void*, void*, void*, uintptr_t); probe CallNonvirtualShortMethodA-return(uint16_t); probe CallNonvirtualShortMethod-entry(void*, void*, void*, uintptr_t); probe CallNonvirtualShortMethod-return(uint16_t); probe CallNonvirtualShortMethodV-entry(void*, void*, void*, uintptr_t); probe CallNonvirtualShortMethodV-return(uint16_t); probe CallNonvirtualVoidMethodA-entry(void*, void*, void*, uintptr_t); probe CallNonvirtualVoidMethodA-return(); probe CallNonvirtualVoidMethod-entry(void*, void*, void*, uintptr_t); probe CallNonvirtualVoidMethod-return(); probe CallNonvirtualVoidMethodV-entry(void*, void*, void*, uintptr_t); probe CallNonvirtualVoidMethodV-return(); probe CallObjectMethodA-entry(void*, void*, uintptr_t); probe CallObjectMethodA-return(void*); probe CallObjectMethod-entry(void*, void*, uintptr_t);
Chapter 9Sample DTrace Probes
9-10

probe CallObjectMethod-return(void*); probe CallObjectMethodV-entry(void*, void*, uintptr_t); probe CallObjectMethodV-return(void*); probe CallShortMethodA-entry(void*, void*, uintptr_t); probe CallShortMethodA-return(uint16_t); probe CallShortMethod-entry(void*, void*, uintptr_t); probe CallShortMethod-return(uint16_t); probe CallShortMethodV-entry(void*, void*, uintptr_t); probe CallShortMethodV-return(uint16_t); probe CallStaticBooleanMethodA-entry(void*, void*, uintptr_t); probe CallStaticBooleanMethodA-return(uintptr_t); probe CallStaticBooleanMethod-entry(void*, void*, uintptr_t); probe CallStaticBooleanMethod-return(uintptr_t); probe CallStaticBooleanMethodV-entry(void*, void*, uintptr_t); probe CallStaticBooleanMethodV-return(uintptr_t); probe CallStaticByteMethodA-entry(void*, void*, uintptr_t); probe CallStaticByteMethodA-return(char); probe CallStaticByteMethod-entry(void*, void*, uintptr_t); probe CallStaticByteMethod-return(char); probe CallStaticByteMethodV-entry(void*, void*, uintptr_t); probe CallStaticByteMethodV-return(char); probe CallStaticCharMethodA-entry(void*, void*, uintptr_t); probe CallStaticCharMethodA-return(uint16_t); probe CallStaticCharMethod-entry(void*, void*, uintptr_t); probe CallStaticCharMethod-return(uint16_t); probe CallStaticCharMethodV-entry(void*, void*, uintptr_t); probe CallStaticCharMethodV-return(uint16_t); probe CallStaticDoubleMethodA-entry(void*, void*, uintptr_t); probe CallStaticDoubleMethodA-return(double); probe CallStaticDoubleMethod-entry(void*, void*, uintptr_t); probe CallStaticDoubleMethod-return(double); probe CallStaticDoubleMethodV-entry(void*, void*, uintptr_t); probe CallStaticDoubleMethodV-return(double); probe CallStaticFloatMethodA-entry(void*, void*, uintptr_t); probe CallStaticFloatMethodA-return(float); probe CallStaticFloatMethod-entry(void*, void*, uintptr_t); probe CallStaticFloatMethod-return(float); probe CallStaticFloatMethodV-entry(void*, void*, uintptr_t); probe CallStaticFloatMethodV-return(float); probe CallStaticIntMethodA-entry(void*, void*, uintptr_t); probe CallStaticIntMethodA-return(uint32_t); probe CallStaticIntMethod-entry(void*, void*, uintptr_t); probe CallStaticIntMethod-return(uint32_t); probe CallStaticIntMethodentry(void*, void*, uintptr_t); probe CallStaticIntMethodV-return(uint32_t); probe CallStaticLongMethodA-entry(void*, void*, uintptr_t); probe CallStaticLongMethodA-return(uintptr_t); probe CallStaticLongMethod-entry(void*, void*, uintptr_t); probe CallStaticLongMethod-return(uintptr_t); probe CallStaticLongMethodV-entry(void*, void*, uintptr_t); probe CallStaticLongMethodV-return(uintptr_t); probe CallStaticObjectMethodA-entry(void*, void*, uintptr_t); probe CallStaticObjectMethodA-return(void*); probe CallStaticObjectMethod-entry(void*, void*, uintptr_t); probe CallStaticObjectMethod-return(void*); probe CallStaticObjectMethodV-entry(void*, void*, uintptr_t); probe CallStaticObjectMethodV-return(void*); probe CallStaticShortMethodA-entry(void*, void*, uintptr_t); probe CallStaticShortMethodA-return(uint16_t); probe CallStaticShortMethod-entry(void*, void*, uintptr_t); probe CallStaticShortMethod-return(uint16_t);
Chapter 9Sample DTrace Probes
9-11

probe CallStaticShortMethodV-entry(void*, void*, uintptr_t); probe CallStaticShortMethodV-return(uint16_t); probe CallStaticVoidMethodA-entry(void*, void*, uintptr_t); probe CallStaticVoidMethodA-return(); probe CallStaticVoidMethod-entry(void*, void*, uintptr_t); probe CallStaticVoidMethod-return(); probe CallStaticVoidMethodV-entry(void*, void*, uintptr_t); probe CallStaticVoidMethodV-return(); probe CallVoidMethodA-entry(void*, void*, uintptr_t); probe CallVoidMethodA-return(); probe CallVoidMethod-entry(void*, void*, uintptr_t); probe CallVoidMethod-return(); probe CallVoidMethodV-entry(void*, void*, uintptr_t); probe CallVoidMethodV-return(); probe CreateJavaVM-entry(void**, void**, void*); probe CreateJavaVM-return(uint32_t); probe DefineClass-entry(void*, const char*, void*, char, uintptr_t); probe DefineClass-return(void*); probe DeleteGlobalRef-entry(void*, void*); probe DeleteGlobalRef-return(); probe DeleteLocalRef-entry(void*, void*); probe DeleteLocalRef-return(); probe DeleteWeakGlobalRef-entry(void*, void*); probe DeleteWeakGlobalRef-return(); probe DestroyJavaVM-entry(void*); probe DestroyJavaVM-return(uint32_t); probe DetachCurrentThread-entry(void*); probe DetachCurrentThread-return(uint32_t); probe EnsureLocalCapacity-entry(void*, uint32_t); probe EnsureLocalCapacity-return(uint32_t); probe ExceptionCheck-entry(void*); probe ExceptionCheck-return(uintptr_t); probe ExceptionClear-entry(void*); probe ExceptionClear-return(); probe ExceptionDescribe-entry(void*); probe ExceptionDescribe-return(); probe ExceptionOccurred-entry(void*); probe ExceptionOccurred-return(void*); probe FatalError-entry(void* env, const char*); probe FindClass-entry(void*, const char*); probe FindClass-return(void*); probe FromReflectedField-entry(void*, void*); probe FromReflectedField-return(uintptr_t); probe FromReflectedMethod-entry(void*, void*); probe FromReflectedMethod-return(uintptr_t); probe GetArrayLength-entry(void*, void*); probe GetArrayLength-return(uintptr_t); probe GetBooleanArrayElements-entry(void*, void*, uintptr_t*); probe GetBooleanArrayElements-return(uintptr_t*); probe GetBooleanArrayRegion-entry(void*, void*, uintptr_t, uintptr_t, uintptr_t*); probe GetBooleanArrayRegion-return(); probe GetBooleanField-entry(void*, void*, uintptr_t); probe GetBooleanField-return(uintptr_t); probe GetByteArrayElements-entry(void*, void*, uintptr_t*); probe GetByteArrayElements-return(char*); probe GetByteArrayRegion-entry(void*, void*, uintptr_t, uintptr_t, char*); probe GetByteArrayRegion-return(); probe GetByteField-entry(void*, void*, uintptr_t); probe GetByteField-return(char); probe GetCharArrayElements-entry(void*, void*, uintptr_t*); probe GetCharArrayElements-return(uint16_t*);
Chapter 9Sample DTrace Probes
9-12

probe GetCharArrayRegion-entry(void*, void*, uintptr_t, uintptr_t, uint16_t*); probe GetCharArrayRegion-return(); probe GetCharField-entry(void*, void*, uintptr_t); probe GetCharField-return(uint16_t); probe GetCreatedJavaVMs-eintptr_t*); probe GetCreatedJavaVMs-return(uintptr_t); probe GetCreateJavaVMs-entry(void*, uintptr_t, uintptr_t*); probe GetCreateJavaVMs-return(uint32_t); probe GetDefaultJavaVMInitArgs-entry(void*); probe GetDefaultJavaVMInitArgs-return(uint32_t); probe GetDirectBufferAddress-entry(void*, void*); probe GetDirectBufferAddress-return(void*); probe GetDirectBufferCapacity-entry(void*, void*); probe GetDirectBufferCapacity-return(uintptr_t); probe GetDoubleArrayElements-entry(void*, void*, uintptr_t*); probe GetDoubleArrayElements-return(double*); probe GetDoubleArrayRegion-entry(void*, void*, uintptr_t, uintptr_t, double*); probe GetDoubleArrayRegion-return(); probe GetDoubleField-entry(void*, void*, uintptr_t); probe GetDoubleField-return(double); probe GetEnv-entry(void*, void*, void*); probe GetEnv-return(uint32_t); probe GetFieldID-entry(void*, void*, const char*, const char*); probe GetFieldID-return(uintptr_t); probe GetFloatArrayElements-entry(void*, void*, uintptr_t*); probe GetFloatArrayElements-return(float*); probe GetFloatArrayRegion-entry(void*, void*, uintptr_t, uintptr_t, float*); probe GetFloatArrayRegion-return(); probe GetFloatField-entry(void*, void*, uintptr_t); probe GetFloatField-return(float); probe GetIntArrayElements-entry(void*, void*, uintptr_t*); probe GetIntArrayElements-return(uint32_t*); probe GetIntArrayRegion-entry(void*, void*, uintptr_t, uintptr_t, uint32_t*); probe GetIntArrayRegion-return(); probe GetIntField-entry(void*, void*, uintptr_t); probe GetIntField-return(uint32_t); probe GetJavaVM-entry(void*, void**); probe GetJavaVM-return(uint32_t); probe GetLongArrayElements-entry(void*, void*, uintptr_t*); probe GetLongArrayElements-return(uintptr_t*); probe GetLongArrayRegion-entry(void*, void*, uintptr_t, uintptr_t, uintptr_t*); probe GetLongArrayRegion-return(); probe GetLongField-entry(void*, void*, uintptr_t); probe GetLongField-return(uintptr_t); probe GetMethodID-entry(void*, void*, const char*, const char*); probe GetMethodID-return(uintptr_t); probe GetObjectArrayElement-entry(void*, void*, uintptr_t); probe GetObjectArrayElement-return(void*); probe GetObjectClass-entry(void*, void*); probe GetObjectClass-return(void*); probe GetObjectField-entry(void*, void*, uintptr_t); probe GetObjectField-return(void*); probe GetObjectRefType-entry(void*, void*); probe GetObjectRefType-return(void*); probe GetPrimitiveArrayCritical-entry(void*, void*, uintptr_t*); probe GetPrimitiveArrayCritical-return(void*); probe GetShortArrayElements-entry(void*, void*, uintptr_t*); probe GetShortArrayElements-return(uint16_t*); probe GetShortArrayRegion-entry(void*, void*, uintptr_t, uintptr_t, uint16_t*); probe GetShortArrayRegion-return(); probe GetShortField-entry(void*, void*, uintptr_t);
Chapter 9Sample DTrace Probes
9-13

probe GetShortField-return(uint16_t); probe GetStaticBooleanField-entry(void*, void*, uintptr_t); probe GetStaticBooleanField-return(uintptr_t); probe GetStaticByteField-entry(void*, void*, uintptr_t); probe GetStaticByteField-return(char); probe GetStaticCharField-entry(void*, void*, uintptr_t); probe GetStaticCharField-return(uint16_t); probe GetStaticDoubleField-entry(void*, void*, uintptr_t); probe GetStaticDoubleField-return(double); probe GetStaticFieldID-entry(void*, void*, const char*, const char*); probe GetStaticFieldID-return(uintptr_t); probe GetStaticFloatField-entry(void*, void*, uintptr_t); probe GetStaticFloatField-return(float); probe GetStaticIntField-entry(void*, void*, uintptr_t); probe GetStaticIntField-return(uint32_t); probe GetStaticLongField-entry(void*, void*, uintptr_t); probe GetStaticLongField-return(uintptr_t); probe GetStaticMethodID-entry(void*, void*, const char*, const char*); probe GetStaticMethodID-return(uintptr_t); probe GetStaticObjectField-entry(void*, void*, uintptr_t); probe GetStaticObjectField-return(void*); probe GetStaticShortField-entry(void*, void*, uintptr_t); probe GetStaticShortField-return(uint16_t); pro GetStringChars-entry(void*, void*, uintptr_t*); probe GetStringChars-return(const uint16_t*); probe GetStringCritical-entry(void*, void*, uintptr_t*); probe GetStringCritical-return(const uint16_t*); probe GetStringLength-entry(void*, void*); probe GetStringLength-return(uintptr_t); probe GetStringRegion-entry(void*, void*, uintptr_t, uintptr_t, uint16_t*); probe GetStringRegion-return(); probe GetStringUTFChars-entry(void*, void*, uintptr_t*); probe GetStringUTFChars-return(const char*); probe GetStringUTFLength-entry(void*, void*); probe GetStringUTFLength-return(uintptr_t); probe GetStringUTFRegion-entry(void*, void*, uintptr_t, uintptr_t, char*); probe GetStringUTFRegion-return(); probe GetSuperclass-entry(void*, void*); probe GetSuperclass-return(void*); probe GetVersion-entry(void*); probe GetVersion-return(uint32_t); probe IsAssignableFrom-entry(void*, void*, void*); probe IsAssignableFrom-return(uintptr_t); probe IsInstanceOf-entry(void*, void*, void*); probe IsInstanceOf-return(uintptr_t); probe IsSameObject-entry(void*, void*, void*); probe IsSameObject-return(uintptr_t); probe MonitorEnter-entry(void*, void*); probe MonitorEnter-return(uint32_t); probe MonitorExit-entry(void*, void*); probe MonitorExit-return(uint32_t); probe NewBooleanArray-entry(void*, uintptr_t); probe NewBooleanArray-return(void*); probe NewByteArray-entry(void*, uintptr_t); probe NewByteArray-return(void*); probe NewCharArray-entry(void*, uintptr_t); probe NewCharArray-return(void*); probe NewDirectByteBuffer-entry(void*, void*, uintptr_t); probe NewDirectByteBuffer-return(void*); probe NewDoubleArray-entry(void*, uintptr_t); probe NewDoubleArray-return(void*);
Chapter 9Sample DTrace Probes
9-14

probe NewFloatArray-entry(void*, uintptr_t); probe NewFloatArray-return(void*); probe NewGlobalRef-entry(void*, void*); probe NewGlobalRef-return(void*); probe NewIntArray-entry(void*, uintptr_t); probe NewIntArray-return(void*); probe NewLocalRef-entry(void*, void*); probe NewLocalRef-return(void*); probe NewLongArray-entry(void*, uintptr_t); probe NewLongArray-return(void*); probe NewObjectA-entry(void*, void*, uintptr_t); probe NewObjectA-return(void*); probe NewObjectArray-entry(void*, uintptr_t, void*, void*); probe NewObjectArray-return(void*); probe NewObject-entry(void*, void*, uintptr_t); probe NewObject-return(void*); probe NewObjectV-entry(void*, void*, uintptr_t); probe NewObjectV-return(void*); probe NewShortArray-entry(void*, uintptr_t); probe NewShortArray-return(void*); probe NewString-entry(void*, const uint16_t*, uintptr_t); probe NewString-return(void*); probe NewStringUTF-entry(void*, const char*); probe NewStringUTF-return(void*); probe NewWeakGlobalRef-entry(void*, void*); probe NewWeakGlobalRef-return(void*); probe PopLocalFrame-entry(void*, void*); probe PopLocalFrame-return(void*); probe PushLocalFrame-entry(void*, uint32_t); probe PushLocalFrame-return(uint32_t); probe RegisterNatives-entry(void*, void*, const void*, uint32_t); probe RegisterNatives-return(uint32_t); probe ReleaseBooleanArrayElements-entry(void*, void*, uintptr_t*, uint32_t); probe ReleaseBooleanArrayElements-return(); probe ReleaseByteArrayElements-entry(void*, void*, char*, uint32_t); probe ReleaseByteArrayElements-return(); probe ReleaseCharArrayElements-entry(void*, void*, uint16_t*, uint32_t); probe ReleaseCharArrayElements-return(); probe ReleaseDoubleArrayElements-entry(void*, void*, double*, uint32_t); probe ReleaseDoubleArrayElements-return(); probe ReleaseFloatArrayElements-entry(void*, void*, float*, uint32_t); probe ReleaseFloatArrayElements-return(); probe ReleaseIntArrayElements-entry(void*, void*, uint32_t*, uint32_t); probe ReleaseIntArrayElements-return(); probe ReleaseLongArrayElements-entry(void*, void*, uintptr_t*, uint32_t); probe ReleaseLongArrayElements-return(); probe ReleaseObjectArrayElements-entry(void*, void*, void**, uint32_t); probe ReleaseObjectArrayElements-return(); probe Releasey(void*, void*, void*, uint32_t); probe ReleasePrimitiveArrayCritical-return(); probe ReleaseShortArrayElements-entry(void*, void*, uint16_t*, uint32_t); probe ReleaseShortArrayElements-return(); probe ReleaseStringChars-entry(void*, void*, const uint16_t*); probe ReleaseStringChars-return(); probe ReleaseStringCritical-entry(void*, void*, const uint16_t*); probe ReleaseStringCritical-return(); probe ReleaseStringUTFChars-entry(void*, void*, const char*); probe ReleaseStringUTFChars-return(); probe SetBooleanArrayRegion-entry(void*, void*, uintptr_t, uintptr_t, const uintptr_t*); probe SetBooleanArrayRegion-return();
Chapter 9Sample DTrace Probes
9-15

probe SetBooleanField-entry(void*, void*, uintptr_t, uintptr_t); probe SetBooleanField-return(); probe SetByteArrayRegion-entry(void*, void*, uintptr_t, uintptr_t, const char*); probe SetByteArrayRegion-return(); probe SetByteField-entry(void*, void*, uintptr_t, char); probe SetByteField-return(); probe SetCharArrayRegion-entry(void*, void*, uintptr_t, uintptr_t, const uint16_t*); probe SetCharArrayRegion-return(); probe SetCharField-entry(void*, void*, uintptr_t, uint16_t); probe SetCharField-return(); probe SetDoubleArrayRegion-entry(void*, void*, uintptr_t, uintptr_t, const double*); probe SetDoubleArrayRegion-return(); probe SetDoubleField-entry(void*, void*, uintptr_t, double); probe SetDoubleField-return(); probe SetFloatArrayRegion-entry(void*, void*, uintptr_t, uintptr_t, const float*); probe SetFloatArrayRegion-return(); probe SetFloatField-entry(void*, void*, uintptr_t, float); probe SetFloatField-return(); probe SetIntArrayRegion-entry(void*, void*, uintptr_t, uintptr_t, const uint32_t*); probe SetIntArrayRegion-return(); probe SetIntField-entry(void*, void*, uintptr_t, uint32_t); probe SetIntField-return(); probe SetLongArrayRegion-entry(void*, void*, uintptr_t, uintptr_t, const uintptr_t*); probe SetLongArrayRegion-return(); probe SetLongField-entry(void*, void*, uintptr_t, uintptr_t); probe SetLongField-return(); probe SetObjectArrayElement-entry(void*, void*, uintptr_t, void*); probe SetObjectArrayElement-return(); probe SetObjectField-entry(void*, void*, uintptr_t, void*); probe SetObjectField-return(); probe SetShortArrayRegion-entry(void*, void*, uintptr_t, uintptr_t, const uint16_t*); probe SetShortArrayRegion-return(); probe SetShortField-entry(void*, void*, uintptr_t, uint16_t); probe SetShortField-return(); probe SetStaticBooleanField-entry(void*, void*, uintptr_t, uintptr_t); probe SetStaticBooleanField-return(); probe SetStaticByteField-entry(void*, void*, uintptr_t, char); probe SetStaticByteField-return(); probe SetStaticCharField-entry(void*, void*, uintptr_t, uint16_t); probe SetStaticCharField-return(); probe SetStaticDoubleField-entry(void*, void*, uintptr_t, double); probe SetStaticDoubleField-return(); probe SetStaticFloatField-entry(void*, void*, uintptr_t, float); probe SetStaticFloatField-return(); probe SetStaticIntField-entry(void*, void*, uintptr_t, uint32_t); probe SetStaticIntField-return(); probe SetStaticLongField-entry(void*, void*, uintptr_t, uintptr_t); probe SetStaticLongField-return(); probe SetStaticObjectField-entry(void*, void*, uintptr_t, void*); probe SetStaticObjectField-return(); probe SetStaticShortField-entry(void*, void*, uintptr_t, uint16_t); probe SetStaticShortField-return(); probe Throw-entry(void*, void*); probe ThrowNew-entry(void*, void*, const char*); probe ThrowNew-return(uint32_t); probe Throw-return(uint32_t); probe ToReflectedField-entry(void*, void*, uintptr_t, uintptr_t);
Chapter 9Sample DTrace Probes
9-16
probe ToReflectedField-return(void*); probe ToReflectedMethod-entry(void*, void*, uintptr_t, uintptr_t); probe ToReflectedMethod-return(void*); probe UnregisterNatives-entry(void*, void*); probe UnregisterNatives-return(uint32_t);};
Chapter 9Sample DTrace Probes
9-17

10Fatal Error Reporting
Fatal errors are errors such as native memory exhaustion, memory access errors, orexplicit signals directed to the process. Fatal errors can be triggered by native codewithin the application (for example developer-written Java Native Interface (JNI) code),third-party native libraries that the application or the JVM, or native code in the JVM. Ifa fatal error causes the process that is hosting the Java Virtual Machine (JVM) toterminate, the JVM gathers information about the error and writes a crash report.
The JVM tries to identify the nature and location of the error. If possible write detailedinformation about the state of the JVM and the process, at the time of the crash. Thedetails that are available can depend on the platform and the nature of the crash. Theinformation that is provided by this error-reporting mechanism enables you to moreeasily and efficiently debug your applications, or identify issues in third-party code.When an error message indicates a problem in the JVM code, you can submit a moreaccurate and helpful bug report. In some cases, crash report generation causessecondary errors that prevent full details from being reported.
Error Report ExampleThe following example shows the start of an error report (filehs_err_pid18240.log) for a crash in the native JNI code for an application:
## A fatal error has been detected by the Java Runtime Environment:## SIGSEGV (0xb) at pc=0x00007f0f159f857d, pid=18240, tid=18245## JRE version: Java(TM) SE Runtime Environment (9.0+167) (build 9-ea+167)# Java VM: Java HotSpot(TM) 64-Bit Server VM (9-ea+167, mixed mode, tiered, compressed oops, g1 gc, linux-amd64)# Problematic frame:# C [libMyApp.so+0x57d] Java_MyApp_readData+0x11## Core dump will be written. Default location: /cores/core.18240)## If you would like to submit a bug report, please visit:# http://bugreport.java.com/bugreport/crash.jsp# The crash happened outside the Java Virtual Machine in native code.# See problematic frame for where to report the bug.#
--------------- S U M M A R Y ------------
Command Line: MyApp
Host: Intel(R) Xeon(R) CPU X5675 @ 3.07GHz, 24 cores, 141G, Ubuntu 12.04 LTSTime: Fri Apr 28 02:57:13 2017 EDT elapsed time: 2 seconds (0d 0h 0m 2s)
--------------- T H R E A D ---------------
10-1

Current thread (0x00007f102c013000): JavaThread "main" [_thread_in_native, id=18245, stack(0x00007f10345c0000,0x00007f10346c0000)]
Stack: [0x00007f10345c0000,0x00007f10346c0000], sp=0x00007f10346be930, free space=1018kNative frames: (J=compiled Java code, A=aot compiled Java code, j=interpreted, Vv=VM code, C=native code)C [libMyApp.so+0x57d] Java_MyApp_readData+0x11j MyApp.readData()I+0j MyApp.main([Ljava/lang/String;)V+15v ~StubRoutines::call_stubV [libjvm.so+0x839eea] JavaCalls::call_helper(JavaValue*, methodHandle const&, JavaCallArguments*, Thread*)+0x47aV [libjvm.so+0x896fcf] jni_invoke_static(JNIEnv_*, JavaValue*, _jobject*, JNICallType, _jmethodID*, JNI_ArgumentPusher*, Thread*) [clone .isra.90]+0x21fV [libjvm.so+0x8a7f1e] jni_CallStaticVoidMethod+0x14eC [libjli.so+0x4142] JavaMain+0x812C [libpthread.so.0+0x7e9a] start_thread+0xda
Java frames: (J=compiled Java code, j=interpreted, Vv=VM code)j MyApp.readData()I+0j MyApp.main([Ljava/lang/String;)V+15v ~StubRoutines::call_stub
siginfo: si_signo: 11 (SIGSEGV), si_code: 1 (SEGV_MAPERR), si_addr: 0x0000000000000000
Chapter 10Error Report Example
10-2

11Java Virtual Machine Related Resources
The following related links are related to the JVM.
• java.lang.invoke package documentation
• The Da Vinci Machine Project
ToolsYou can control some operating characteristics of the Java HotSpot VM by usingcommand-line flags. For more information about the Java application launcher, see Commands to Monitor the JVM in the Java Platform, Standard Edition ToolsReference.
11-1