Java Platform Performance: Case Studies in Bottleneck ... · Java™ Platform Performance: Case...
54
Java™ Platform Performance: Case Studies in Bottleneck Identification and Removal Kumar Shiv, Intel Paul Hohensee, Sun Microsystems TS-6434
Transcript of Java Platform Performance: Case Studies in Bottleneck ... · Java™ Platform Performance: Case...

Java™ Platform Performance: Case Studies in Bottleneck Identification and Removal
Kumar Shiv, IntelPaul Hohensee, Sun MicrosystemsTS-6434
2008 JavaOneSM Conference | java.sun.com/javaone | 2
Trademarks And Abbreviations(to get them out of the way ...)
Java™ Platform, Standard Edition (Java SE)Java HotSpot™ Virtual Machine (HotSpot JVM™)

2008 JavaOneSM Conference | java.sun.com/javaone | 3
Who Are These Guys?
Kumar Shiv• Principal Performance Architect, Managed Runtimes• Intel, Hillsboro, OR
Paul Hohensee• Senior Staff Engineer, Hotspot JVM Tech Lead• Sun Microsystems, Burlington, MA

2008 JavaOneSM Conference | java.sun.com/javaone | 4
Learn how performance bottlenecks are found and fixed in application code, Java library code and the JVM machine.

2008 JavaOneSM Conference | java.sun.com/javaone | 5
Agenda
Methodology: Hardware, JVM Machine, Class Libraries, ApplicationsTools, Tools, ToolsCase Study 1: SPECjvm2008, FFT LargeCase Study 2: SPECjbb2005DemoPerformance Analysis TakeawaysJava Library and JVM Machine Performance Frontiers

2008 JavaOneSM Conference | java.sun.com/javaone | 6
Multi-tier Solution Deployments Are ComplexApp Server
App Server
RDBMS
OS
HW Platform
DB Server
Disk subsystem
Network switch
Any component can be a source of performance bottlenecks
FrameworkJVM
OS
Hardware Platform
Application
FrameworkJVM
FrameworkJVM
OS
Hardware Platform
Application
FrameworkJVM

2008 JavaOneSM Conference | java.sun.com/javaone | 7
Top-Down Approach
System
Application
Machine
System ConfigTopology
Network I/ODisk I/O
Database TuningOS
App DesignApp Server Tuning
DriversPersistence
Clustering
JVM machine SelectionJVM machine Tuning
JVM machine InternalsJIT Compilation
Cache ArchitectureSMP Scaling
2008 JavaOneSM Conference | java.sun.com/javaone | 8
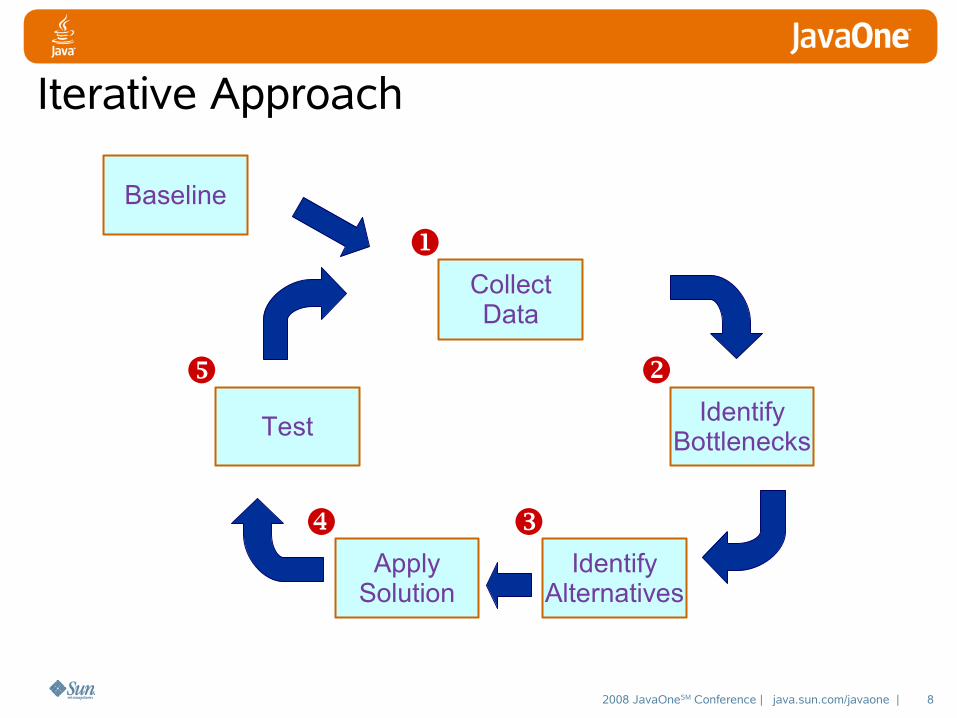
Iterative Approach
Baseline
CollectData
IdentifyBottlenecks
IdentifyAlternatives
ApplySolution
Test

2008 JavaOneSM Conference | java.sun.com/javaone | 9
Address one issue at a time
Max throughput at <100% CPU
points to bottleneck, e.g.,
queue sizes, I/O, network,
locks
Gradually work your way up the throughput
curve
High response time way
before max throughput points to
latency issues, e.g., disk
Key Tool: A Throughput Curve
“Production”operational zone
Injection Rate
CPU SaturationMax Throughput
Unacceptable RT
Res
pons
e Ti
me/
Thro
ughp
ut/%
CPU

2008 JavaOneSM Conference | java.sun.com/javaone | 10
Agenda
Methodology: Hardware, JVM Machine, Class Libraries, ApplicationsTools, Tools, ToolsCase Study 1: SPECjvm2008, FFT LargeCase Study 2: SPECjbb2005DemoPerformance Analysis TakeawaysJava Library and JVM Machine Performance Frontiers

2008 JavaOneSM Conference | java.sun.com/javaone | 11
Tools, Tools, ToolsSAR, iostat, other OS-supplied monitoring toolsJDump and thread dumps• Often overlooked, easy to analyze with targeted scripts
Dtrace: Solaris™ Operating System, OS X• http://www.sun.com/bigadmin/content/dtrace
NetBeans™ software Profiler: Windows, Linux, Solaris, OS X• http://www.netbeans.org
Project VisualVM: Windows, Linux, Solaris Operating System, Java HotSpot, JRockit™• https://visualvm.dev.java.net
BEA™ Mission Control: Windows, Linux• http://dev2dev.bea.com/jrockit/tools.html
Intel® VTune™ Performance Analyzer: Windows, Linux• http://www.intel.com/software/products/vtune
Sun Studio Analyzer: Linux, Solaris operating system• http://developers.sun.com/sunstudio

2008 JavaOneSM Conference | java.sun.com/javaone | 12
VTune Performance Analyzer
Helps identify and characterize performance issues by:• Collecting performance data from the system running your
application• Organizing and displaying the data in variety of interactive views
from system-wide down to source code or processor instruction perspective
• Identifying potential performance issues and suggesting improvements
Uses profiling APIs exposed by JVM machinesCan profile pure and mixed managed and unmanaged code

2008 JavaOneSM Conference | java.sun.com/javaone | 13
VTune: Process View, XML Parser

2008 JavaOneSM Conference | java.sun.com/javaone | 14
VTune: SamplingOccasionally interrupts the processor• Periodic: typically 1000 times per second• Event-Based: Triggered by the occurrence of a user definable
number of processor eventsCollects execution context• Execution memory address (Instruction Pointer)• OS process and thread ID• Executable module located at that address• If you have symbols for the module, post processing can identify
the function or method at the memory address• Line numbers from symbol file can direct you to the relevant line of
source codeSystem wide

2008 JavaOneSM Conference | java.sun.com/javaone | 15
VTune: JIT'ed Code, XML Parser, traverseNode

2008 JavaOneSM Conference | java.sun.com/javaone | 16
VTune: Call GraphTracks method entry and exit points in your code• Periodic: typically 1000 times per second• Event-Based: Triggered by the occurrence of a user definable
number of processor eventsDisplays program flow, critical functions and call sequencesCan use instrumentation and JVM machine profiling APIs• Mixed Mode – shows performance data for Java code and
underlying OS APIs• Pure – shows performance data only for Java code

2008 JavaOneSM Conference | java.sun.com/javaone | 17
VTune: Call Graph, XML Parser

2008 JavaOneSM Conference | java.sun.com/javaone | 18
Studio Analyzer: JVM Machine Threads, SPECjbb2005

2008 JavaOneSM Conference | java.sun.com/javaone | 19
Studio Analyzer: Transition, SPECjbb2005
2008 JavaOneSM Conference | java.sun.com/javaone | 20
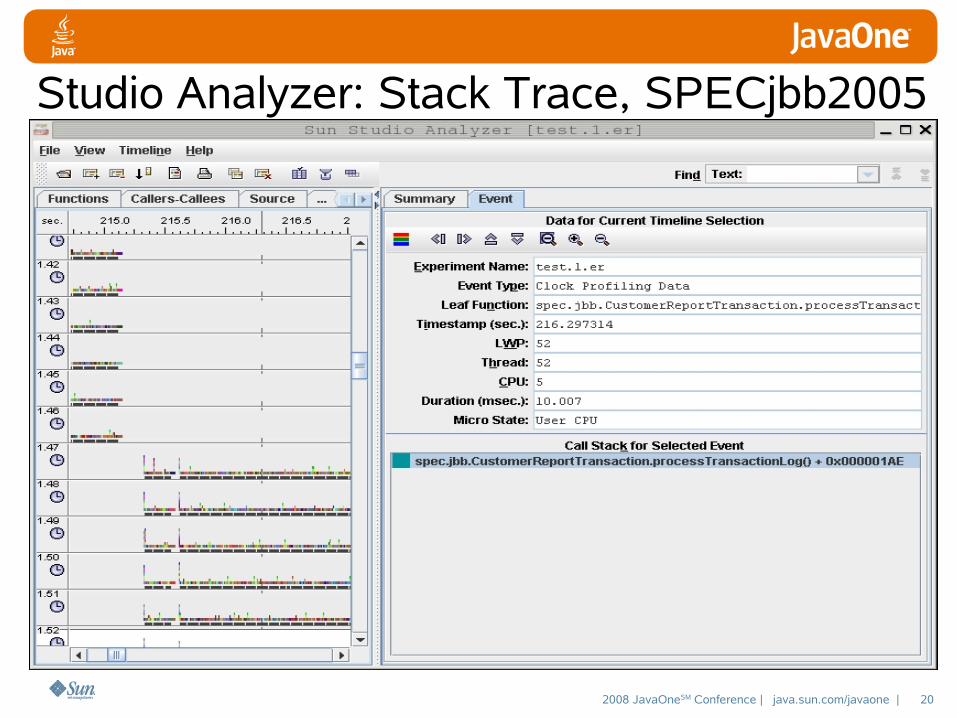
Studio Analyzer: Stack Trace, SPECjbb2005

2008 JavaOneSM Conference | java.sun.com/javaone | 21
Agenda
Methodology: Hardware, JVM Machine, Class Libraries, ApplicationsTools, Tools, ToolsCase Study 1: SPECjvm2008, FFT LargeCase Study 2: SPECjbb2005DemoPerformance Analysis TakeawaysJava Library and JVM Machine Performance Frontiers
2008 JavaOneSM Conference | java.sun.com/javaone | 22
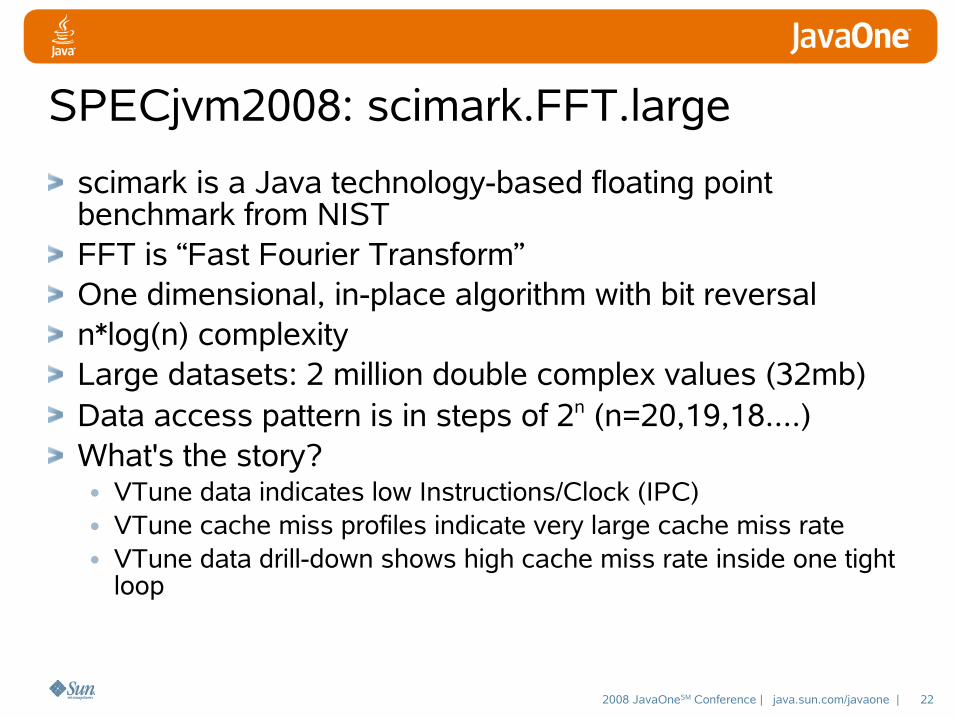
SPECjvm2008: scimark.FFT.largescimark is a Java technology-based floating point benchmark from NIST FFT is “Fast Fourier Transform”One dimensional, in-place algorithm with bit reversaln*log(n) complexityLarge datasets: 2 million double complex values (32mb)Data access pattern is in steps of 2n (n=20,19,18....)What's the story?• VTune data indicates low Instructions/Clock (IPC)• VTune cache miss profiles indicate very large cache miss rate• VTune data drill-down shows high cache miss rate inside one tight
loop
2008 JavaOneSM Conference | java.sun.com/javaone | 23
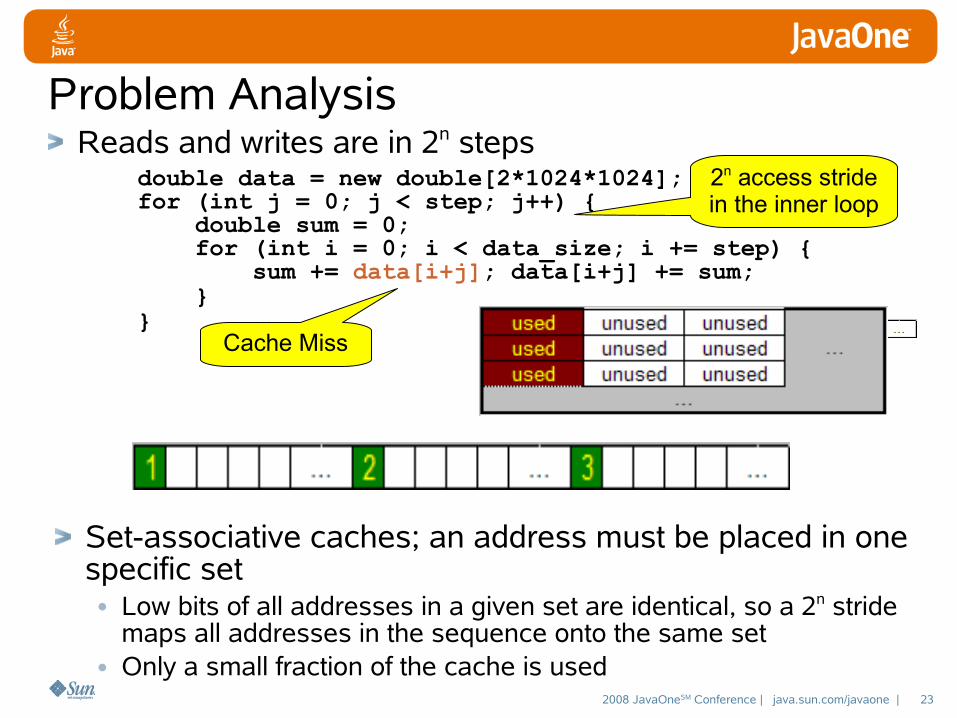
Problem AnalysisReads and writes are in 2n steps double data = new double[2*1024*1024]; for (int j = 0; j < step; j++) { double sum = 0; for (int i = 0; i < data_size; i += step) { sum += data[i+j]; data[i+j] += sum; } }
2n access stride in the inner loop
Cache Miss
Set-associative caches; an address must be placed in one specific set• Low bits of all addresses in a given set are identical, so a 2n stride
maps all addresses in the sequence onto the same set• Only a small fraction of the cache is used

2008 JavaOneSM Conference | java.sun.com/javaone | 24
Change the source codeOption 1: insert dummy element(s) into the array every k elements and change code to read/write from the new array correctly: ABCDEFGH => ABCDxEFGHx• new_index = old_index + floor(old_index / k)• Increases footprint as well as number of instructions executed per
operation but allows entire cache to be used
LKJIHGFEDCBA
JIXHGFEXDCBA

2008 JavaOneSM Conference | java.sun.com/javaone | 25
Change the source codeOption 2: move data items around in some pattern: ABCDEFGHIJKL.... => ABCDHEFGKLIJ....• More complex code necessary to correctly access needed element
=> many more instructions than option 1• Footprint unchanged
LKJIHGFEDCBA
JILKGFEHDCBA

2008 JavaOneSM Conference | java.sun.com/javaone | 26
Option 3: Loop Interchange + Scalar Promotion
double data = new double[2*1024*1024]; for (int j = 0; j < step; j++) { double sum = 0; for (int i = 0; i < data_size; i += step) { sum += data[i+j]; data[i+j] = sum; } }
From
To double data[] = new double[2*1024*1024]; double sum_array[] = new double[step]; for (int i = 0; i < data_size; i += step) { for (int j = 0; j < step; j++) { sum_array[j] += data[i+j]; data[i+j] = sum_array[j]; } }
Promote sum to an array
Interchange loops
Cache Miss
Cache Hit

2008 JavaOneSM Conference | java.sun.com/javaone | 27
Closing the Loop
Option 1 Option 2 Option 30
255075
100125150175200225250275300325350375400425450
1 thread16 threads
Per
cent
Impr
ovem
ent v
s. O
rigin
al C
ode
Source: Intel
4 chip, 16 core Tigerton 2.93GHz 1066MHz busMeasurements on other platforms show similar improvements
Option 3 is bestMinor footprint increase, smallest code change
2008 JavaOneSM Conference | java.sun.com/javaone | 28
Agenda
Methodology: Hardware, JVM Machine, Class Libraries, ApplicationsTools, Tools, ToolsCase Study 1: SPECjvm2008, FFT LargeCase Study 2: SPECjbb2005DemoPerformance Analysis TakeawaysJava Library and JVM Machine Performance Frontiers

2008 JavaOneSM Conference | java.sun.com/javaone | 29
SPECjbb2005Emulates a three-tier client/server warehouse management system, emphasizing the middle tierMeasures warehouse transaction rate, one thread per warehouseIn theory, “embarrassingly parallel”• Measures hardware, JVM machine and OS scalability• Single- and multi-JVM machine run modes• Single-JVM machine mode is the real test of scalability
Object allocation intensiveSpoiler: very memory system sensitive• The smaller the caches, the more sensitive• The longer the main memory latency, the more sensitive• The more NUMA the memory system, the more sensitive

2008 JavaOneSM Conference | java.sun.com/javaone | 30
SPECjbb2005: Studio Analyzer, Profile

2008 JavaOneSM Conference | java.sun.com/javaone | 31
SPECjbb2005: Studio Analyzer, -XX:-Inline

2008 JavaOneSM Conference | java.sun.com/javaone | 32
HashMap Organization: Integer Keys
HashMap is implemented as a chained hash tableChained hash tables have poor memory access localityEven if average chain length is one, could miss on every access: Bucket Array element, Entry, Key and Value objects
Integer(2)
key
value
nextInteger(n)
Integer(1)
Keys Bucket Array
......
hash()
Integer
Value
key
value
next
Integer
Value
...
Entry Chains
entry
entry
entry
entry
entry
Key / Value / Next Entry Triples

2008 JavaOneSM Conference | java.sun.com/javaone | 33
SPECjbb2005: HashMap.get(), Misses in Orangepublic V get(Object key) { int hash = hash(key.hashCode()); for (Entry<K,V> e = table[indexFor(hash,table.length)]; e != null; e = e.next) { Object k; if (e.hash == hash && ((k = e.key) == key || key.equals(k))) return e.value; // Possible miss } return null;}int index; HashMap table; ...; // Fill up tableValue value = table.get(index);// Many, many get()s!// But 'index' is auto-boxed, so the call// to get() is actuallyValue value = table.get(Integer.valueOf(index));

2008 JavaOneSM Conference | java.sun.com/javaone | 34
SPECjbb2005: Studio Analyzer, AssemblyBucket Array access• table[indexFor(hash,table.length)]
Chain Entry access• e.hash

2008 JavaOneSM Conference | java.sun.com/javaone | 35
SPECjbb2005: Studio Analyzer, AssemblyKey access• key.equals(k)
• key.class• key.value

2008 JavaOneSM Conference | java.sun.com/javaone | 36
HashMap Organization: Integer Keys
Where in memory are all these guys?
Integer(2)
key
value
nextInteger(n)
Integer(1)
Keys Bucket Array
......
hash()
Integer
Value
key
value
next
Integer
Value
...
Entry Chains
entry
entry
entry
entry
entry
Key / Value / Next Entry Triples

2008 JavaOneSM Conference | java.sun.com/javaone | 37
Byte Distance: Parent End to Child Start
0 >= 128 >= 409605
101520253035404550556065707580859095
100
jbb HashMap Entry/ Keyjbb String/ char[]209_db Hashtable Entry/ Key209_db String/ char[]
Distance in Bytes
Perc
ent
Source: Sun Microsystems
Percent of Object Instance Pairs a Given Distance Apart

2008 JavaOneSM Conference | java.sun.com/javaone | 38
Breadth-First GC Object Copying
B
A
D
C
AB D C
A B DC
Copy objectCopy all its childrenFor each child, copy all its children, ...
MissMiss
Hit

2008 JavaOneSM Conference | java.sun.com/javaone | 39
Depth-First GC Object Copying
B
A
D
C
AB D C
A B D C
Copy objectCopy first childCopy first child's first child, ...Copy second child, then second child's first child, ...
Hit Hit
Miss

2008 JavaOneSM Conference | java.sun.com/javaone | 40
Breadth-First Copying: HashMap
Bucket Array
Entries
Keys
Values
Breadth-First Order
Miss Miss Miss
Probable Hit

2008 JavaOneSM Conference | java.sun.com/javaone | 41
Depth-First Copying: HashMap
Bucket Array
Entries
Keys
Values
Depth-First OrderProbable Hit
Miss Miss
Hit

2008 JavaOneSM Conference | java.sun.com/javaone | 42
Byte Distance: Parent End to Child StartBreadth-First vs. Depth-First
B: 0 D: 0 B: >=128 D: >=128 B: >=4096D: >=40960
10
20
30
40
50
60
70
80
90
100
jbb HashMap Entry/ Keyjbb String/ char[]209_db Hashtable Entry/ Key209_db String/ char[]
Distance in Bytes
Perc
ent
Source: Sun Microsystems
Percent of Object Instance Pairs a Given Distance Apart

2008 JavaOneSM Conference | java.sun.com/javaone | 43
Breadth-First vs. Depth-First: SPECjbb2005

2008 JavaOneSM Conference | java.sun.com/javaone | 44
Breadth-First vs. Depth-First: SPECjbb2005
Source: Sun Microsystems
Intel Harper-town, 8 cores
Intel Clover-town, 8 cores
Sun SPARC US-IV+, 16 cores
Sun SPARC Niagara 1, 8/32 cores/threads
0
2
4
6
8
10
12
14
16
18
20
Perc
ent
Relative improvement, not absolute: see spec.org for the latterBenefit varies by platformNot just HashMap! TreeMap, String, etc. also benefit
Depth-First Percent Improvement Over Breadth-First, Single JVM Machine

2008 JavaOneSM Conference | java.sun.com/javaone | 45
Breadth-First vs. Depth-First
Any static policy will hurt some applications and help othersA common pattern in Java technology applications is object arrays pointing to nodesDepth-First is better for this patternLittle or no degradation with respect to breadth-first on all other performance benchmarks we can get our hands onMany, e.g. SPECjvm98's 209_db, are much faster with depth-first• Strings and their char[]'s are co-located 100% of the time

2008 JavaOneSM Conference | java.sun.com/javaone | 46
But Wait, There's More! Remember This?
There must be a better way!
Integer(2)
key
value
nextInteger(n)
Integer(1)
Keys Bucket Array
......
hash()
Integer
Value
key
value
next
Integer
Value
...
Entry Chains
entry
entry
entry
entry
entry
Key / Value / Next Entry Triples

2008 JavaOneSM Conference | java.sun.com/javaone | 47
Yes, There Is: Specialize for Integer KeysFront the whole business with an Integer -> Value array cache, punt to backing HashMap on missIf front cache is big enough, the backing HashMap will stay out of processor cache: copying order doesn't matter
Values
Value Array
Integer Keysindex []
Miss
Possible Hit
Possible Miss
Breadth or Depth-First Order

2008 JavaOneSM Conference | java.sun.com/javaone | 48
Breadth-First vs. Depth-First: SPECjbb2005
Source: Sun Microsystems
Intel Harpertown, 8 cores
Intel Clovertown, 8 cores
Sun SPARC US-IV+, 16 cores
Sun SPARC Ni-agara 1, 8/32 cores/threads
0
2
4
6
8
10
12
14
16
18
20
Without Front CacheWith Front Cache
Perc
ent
Depth-First Percent Improvement Over Breadth-First, Single JVM Machine
0%
Relative improvement, not absolute: see spec.org for the latterBenefit varies by platformNot just HashMap! TreeMap, String, etc. also benefit

2008 JavaOneSM Conference | java.sun.com/javaone | 49
Demo

2008 JavaOneSM Conference | java.sun.com/javaone | 50
Agenda
Methodology: Hardware, JVM Machine, Class Libraries, ApplicationsTools, Tools, ToolsCase Study 1: SPECjvm2008, FFT LargeCase Study 2: SPECjbb2005DemoPerformance Analysis TakeawaysJava Library and JVM Machine Performance Frontiers

2008 JavaOneSM Conference | java.sun.com/javaone | 51
Performance Analysis Takeaways
Incorporate performance monitoring and analysis into the development cycle• Including, to the extent possible, production
Use the available tools: they work really wellLearn and apply basic hardware design knowledgeThe memory system is not your friend• Most performance problems can be traced to its limitations
Results vary by platform• Optimizing cache utilization matters most when average memory
access time is high relative to processor speed• Test on as many platforms as possible• WORA => do your best to eliminate platform to platform variability

2008 JavaOneSM Conference | java.sun.com/javaone | 52
Agenda
Methodology: Hardware, JVM Machine, Class Libraries, ApplicationsTools, Tools, ToolsCase Study 1: SPECjvm2008, FFT LargeCase Study 2: SPECjbb2005DemoPerformance Analysis TakeawaysJava Library and JVM Machine Performance Frontiers

2008 JavaOneSM Conference | java.sun.com/javaone | 53
Java Library and JVM Machine Performance FrontiersCompletely dynamic and adaptive execution • Hardware-assisted always-on dynamic profiling• Adaptive garbage collection• Predictability and throughput goals• Real-time
Ergonomics writ large• Execution history recording and feedback
High performance computing• Photo-real graphics generation, speech analysis and generation,
financial analysis• Auto-vectorization and concurrentization• Massively parallel Java platform
Startup and footprint: minimize class loading overhead• Eliminate static variables and initializers, horizontal class dependencies• Minimize object allocation during startup
Memory-optimal data structures: wide-node TreeMap, B+Trees

2008 JavaOneSM Conference | java.sun.com/javaone | 54
Kumar Shiv, IntelPaul Hohensee, Sun MicrosystemsTS-6434