Java Garbage Collector - Overview and Tuning...15 Main tuning settings:-Xms (initial heap size) -Xmx...
42
Java Garbage Collector - Overview and Tuning Iris Baron IBM Java JIT on System Z [email protected] Session ID: 16181
Transcript of Java Garbage Collector - Overview and Tuning...15 Main tuning settings:-Xms (initial heap size) -Xmx...
InsertCustomSessionQR if Desired.
Java Garbage Collector -Overview and Tuning
Iris BaronIBM Java JIT on System Z [email protected]
Session ID: 16181

2
Language UpdatesJava 5.0
• New Language features:• Autoboxing• Enumerated types• Generics• Metadata
Java 6.0• Performance Improvements• Client WebServices Support
• Support for dynamic languages• Improve ease of use for SWING• New IO APIs (NIO2)• Java persistence API• JMX 2.x and WS connection for JMX
agents• Language Changes
Java 7.0
IBM Java RuntimesIBM Java 5.0 (J9 R23) •Improved performance
•Generational Garbage Collector•Shared classes support•New J9 Virtual Machine•New Testarossa JIT technology
•First Failure Data Capture•Full Speed Debug•Hot Code Replace•Common runtime technology
•ME, SE, EE
IBM Java 6.0 (J9 R24)•Improvements in
•Performance•Serviceability tooling•Class Sharing
•XML parser improvements•z10™ Exploitation
• DFP exploitation for BigDecimal• Large Pages• New ISA features
5.0
6.0
2005 2009
SE 5
.018
pla
tform
s
SE 6
.020
pla
tform
s
EE 5
WAS6.1
WAS7.0
2006 2008
WAS6.0
200704
EE 6.x
**Timelines and deliveries are subject to change.
2010 2011
IBM Java 6.0.1/Java7.0 (J9 R26)
•Improvements in•Performance•GC Technology
•z196™ Exploitation• OOO Pipeline• 70+ New Instructions
•JZOS/Security Enhancements
WAS8.5
2012 2013 2014
7.0
• Language improvements • Closures for simplified fork/join
Java 8.0**
SE60
1/ 7
.x>=
20
plat
form
s
IBM Java7.0SR3•Improvements in
•Performance•zEC12™ Exploitation
• Transactional Execution• Flash 1Meg pageable LPs• 2G large pages• Hints/traps
IBM Java7R1•Improvements in
•Performance•RAS•Monitoring
•zEC12™ Exploitation• zEDC for zip acceleration• SMC-R integration• Transactional Execution• Runtime instrumentation
•Hints/traps•Data Access Accelerator
Java Road Map

3
(Controlled measurement environment, results may vary)
Linux on System z - Multi-Threaded 64 bit Java Workload 16-Way ~12x Improvement in Hardware and Software
0
20
40
60
80
100
120
140
160
1 2 4 6 8 10 12 14 16 18 20 22 24 26 28 30 32
Threads
Nor
mal
ized
Thr
ough
put
zEC12 SDK 7 SR3 Aggressive + LP Code Cache zEC12 SDK 7 SR1
z196 SDK 7 SR1
z196 SDK 6 SR9
z10 SDK 6 SR4
z9 SDK 5 SR4 NO (CR or Heap LP)
Linux on System z and Java7SR3 on zEC12
~12x aggregate hardware and software improvement comparing Java5SR4 on z9 to Java7SR3 on zEC12• LP=Large Pages for Java heap • CR=Java compressed references• Java7SR3 using -Xaggressive + 1Meg large pages

4
(Controlled measurement environment, results may vary)
WAS on zLinuxAggregate HW, SDK and WAS Improvement: WAS 6.1 (Java 5) on z9 to WAS 8.5 (Java 7) on zEC12
4x aggregate hardware and software improvement comparing WAS 6.1 Java5 on z9 to WAS 8.5 Java7 on zEC12
J9R27 J9R27

5
19% improvement to ODM with IBM Java 7R1 compared to IBM Java 7
IBM Operational Decision Management zEC12 16-way
00.10.20.30.40.50.60.70.80.9
11.11.21.31.4
IBM Java 7 IBM Java 7R1
Thro
ughp
ut
(Nor
mal
ized
to IB
M J
ava
7 SR
4)
IBM Operational Decision Manager
(Controlled measurement environment, results may vary)
6
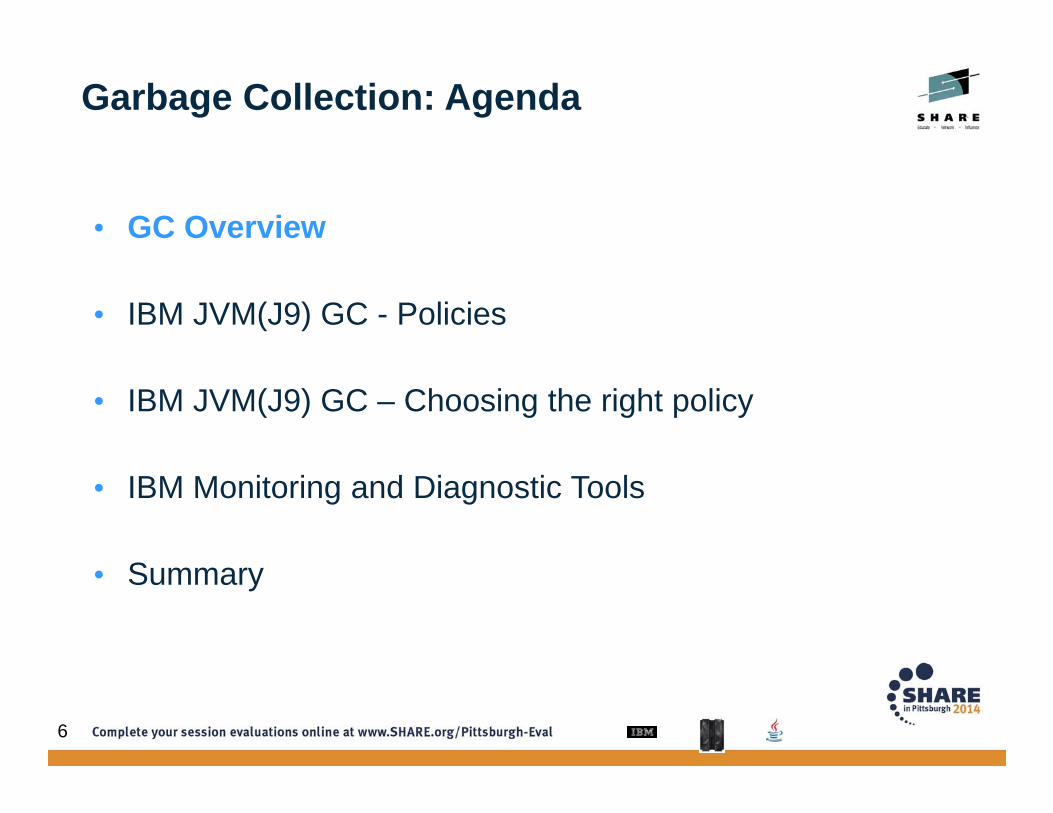
Garbage Collection: Agenda
• GC Overview
• IBM JVM(J9) GC - Policies
• IBM JVM(J9) GC – Choosing the right policy
• IBM Monitoring and Diagnostic Tools
• Summary

7
• Java is an Operating System (OS) processSome memory is used by the OS and C-language runtime
• Area left over is termed the “User Space” and is divided into:– Java Virtual Machine (JVM) runtime– Java Heap(s)– Native heap
OS and C-Runtime JVM Java Heap(s)
-Xmx
Native Heap
Garbage Collector: OverviewJava Memory Usage

8
• The GC works on the Java Heap memory• Responsible for allocation and freeing of:
�Java objects, arrays and classes• � Allocates objects using a contiguous section of Java heap
• � Ensures the object remains as long as it is in use (“live”)
• � Determines “liveness” based on a reference from another “live” object or from a known root
• � Reclaims objects that are no longer referenced
• � Ensures that any finalize method is run before the object is reclaimed
Garbage Collector: Overview

9
Two main GC technologies:
� Mark Sweep Collector– Mark: Find all live objects– Sweep: Reclaim unused heap memory– Compact: Reduce fragmentation (optional)
� Copy Collector
Garbage Collector: Overview
10
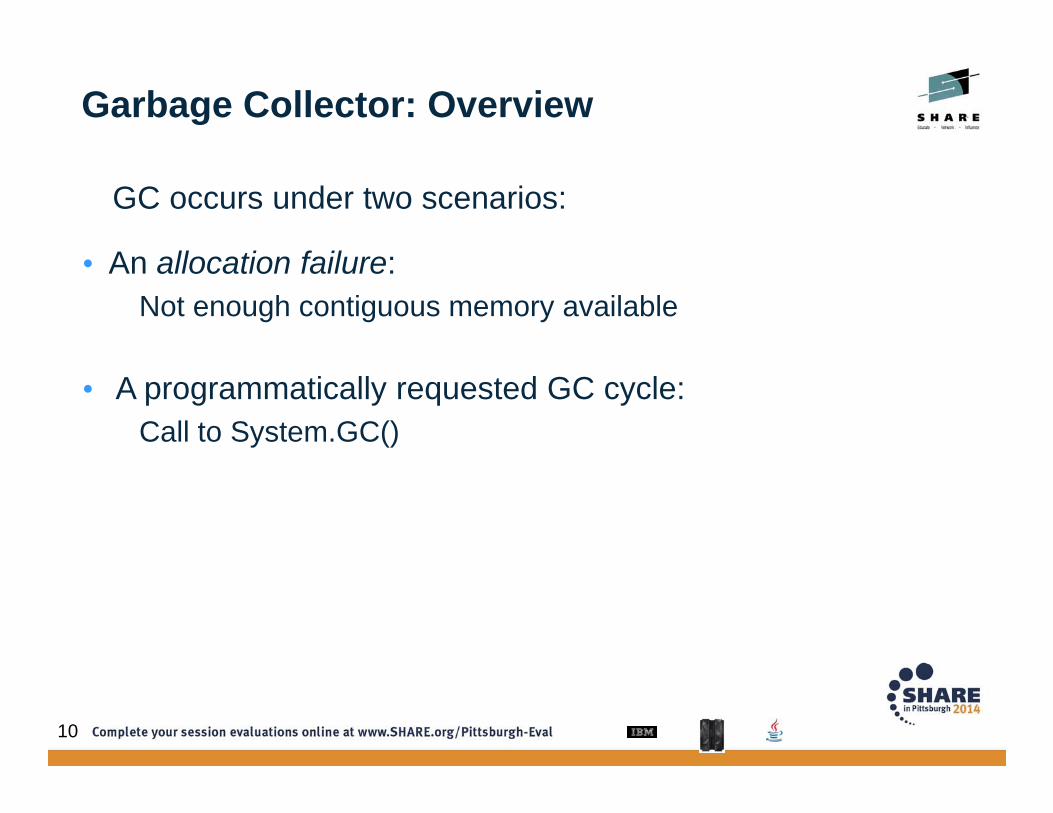
�GC occurs under two scenarios:
• An allocation failure: Not enough contiguous memory available
• A programmatically requested GC cycle: Call to System.GC()
Garbage Collector: Overview

11
Garbage Collector: OverviewPerformance Effect
• GC affects application's performance:• Pause times (responsiveness/Consistency)• Throughput• Footprint
• Typical tradeoffs:– Pause time vs. Throughput
• Tradeoff frequency and length of pauses vs. throughput– Footprint vs. Frequency
• Tradeoff smaller footprint vs. frequency of GC pauses/events

12
Policy Notes
optthruput default in Java5 and Java6
optavgpause
gencon default in Java601/Java7
balanced added in Java601/Java7
Garbage Collector: OverviewIBM J9 Garbage Collector Family
Why have many policies? Why not just the best?
• Cannot always dynamically determine what tradeoffs the user/application are willing to make
• Definition of a performance problem is user centric

13
Garbage Collection: Agenda
• GC Overview
• IBM JVM(J9) GC - Policies – optthruput
– optavgpause
– gencon
– balanced
• IBM JVM(J9) GC – Choosing the right policy
• IBM Monitoring and Diagnostic Tools
• Summary

14
• Global Mark and Sweep Garbage Collection• Uses “flat” heap
• Single stop-the-world (STW) phase– Application “pauses” while GC is done
• Parallel GC via use of “GC Helper Threads”– “Parked” set of threads that wake to share GC work– Configurable using -Xgcthreads
IBM J9 Garbage Collector: optthruput
Time
Thread 1Thread 2Thread 3
Thread n
GCApplication
Picture is only illustrative and doesn’t reflect any particular real-life application. The purpose is to show theoretical differences in pause times between GC policies.

15
Main tuning settings:-Xms (initial heap size) -Xmx (maximum heap size)
• Fixed heap size– Same values for -Xms and -Xmx – Best when memory usage is fairly constant and known
• Variable heap size– Different values for -Xms and -Xmx– GC adapts heap size – Best when memory usage varies over time or unknown– Provides flexibility and avoids OutOfMemoryErrors– Allows fine tuning of the heap usage
IBM J9 Garbage Collector: optthruputTuning: Fixed vs. Variable Heap Size

16
GC adapts heap size to keep occupancy between 40% and 70% using expansion and contraction:
• Occupancy over 70% causes frequent GC cycles – Which generally means reduced performance– Requires Expansion
• Occupancy below 40% means infrequent but longer GC cycles– Amount of live object might not change, but may have secondary effects– Requires more memory– Requires Contraction
IBM J9 Garbage Collector: optthruputImplementation: heap Expansion and Contraction
Long Garbage Collection Cycles
Too Frequent Garbage Collection
Memory
Heap Size
Heap Occupancy
70%
40%

17
• Heap expansion and contraction are relatively “cheap”
• GC (usually) optimizes heap occupancy at the cost of compaction cycles (“expensive”):
– Expansion: for some expansions, GC may have already compacted to try to allocate the object before expansion
– Contraction: GC may need to compact to move objects from the area of the heap being “shrunk”
IBM J9 Garbage Collector: optthruputImplementation: Compaction

18
Best when:• Application is optimized for throughput rather than short
GC pauses
• Pause time problems are not evident
“Batch” type applications
Was default in Java5 and Java6, but not in Java7
IBM J9 Garbage Collector: optthruputRecommended Deployment Scenarios

19
• Reduces pause time spent inside STW GC vs optthruput
• Results in more consistent pauses
• Slight overhead on application's throughput performance
• Uses Concurrent Marking and SweepingCarrying out some of the STW work while application is running
• Policy focuses on responsiveness criteria
ApplicationCollector
Time
ConcurrentKickoff
optthruput
optavgpause
IBM J9 Garbage Collector: optavgpause

20
Tenure SpaceNursery
IBM J9 Garbage Collector: gencon
Generational and Concurrent GC• Best of both worlds: Throughput and Small Pause Times
• Shown most value with customers
• Default policy in Java6.0.1/Java7
• Handles short- and long-lived objects differently: Heap is split into two areas:– Objects created in the nursery– Objects that survive a number of collections are promoted to
tenured area

21
• Most objects die young - focus on recently created objects
• Example: String concatenationResults in the creation of 3 objects:– String object, containing “String “– A StringBuffer, containing “String “, and with “Concatenated!” then appended– String object, containing the result: “String Concatenated!”
• Two of those three objects are no longer required!
• Other examples: transactions in banking /commerce, DB, web page request, GUI functions
IBM J9 Garbage Collector: genconMotivation
String str = new String ("String ");str += "Concatenated!";

22
Allocate Space Survivor Space
Nursery/Young Generation
Nursery
Survivor SpaceAllocate Space Tenure Space
IBM J9 Garbage Collector: genconNursery Space ImplementationNursery uses Copying GC :• Nursery is split into two spaces: – Allocate space: used for new allocations and objects that survived
previous collections– Survivor space: used for objects surviving this collection
• Collection causes live objects to be:– copied from Allocate space to survivor space– copied to the Tenured space if they have survived sufficient collections
Small but frequently collected areaReduces fragmentationImproves data localitySpeeds up future allocations

23
• A 50/50 split between Allocate and Survivor spaces is wasteful
• Survivor space is “unusable” heap– Survivor space can be smaller than Allocate space
• “Tilt Ratio” - ratio between nursery spaces– Tilt adjusts automatically between 50% and 90%
IBM J9 Garbage Collector: genconNursery Space Implementation
Allocate Space
Nursery
Survivor Space

24
Time
Global GCApplication
Scavenge GC
Picture is only illustrative and doesn’t reflect any particular real-life application. The purpose is to show theoretical differences in pause times between GC policies.
IBM J9 Garbage Collector: genconTenure Space Implementation
• Tenure space uses Concurrent Mark and Sweep GC (same as optavgpause)
• Less frequently collected
• Same tuning options as for optthruput/optavgpause
25
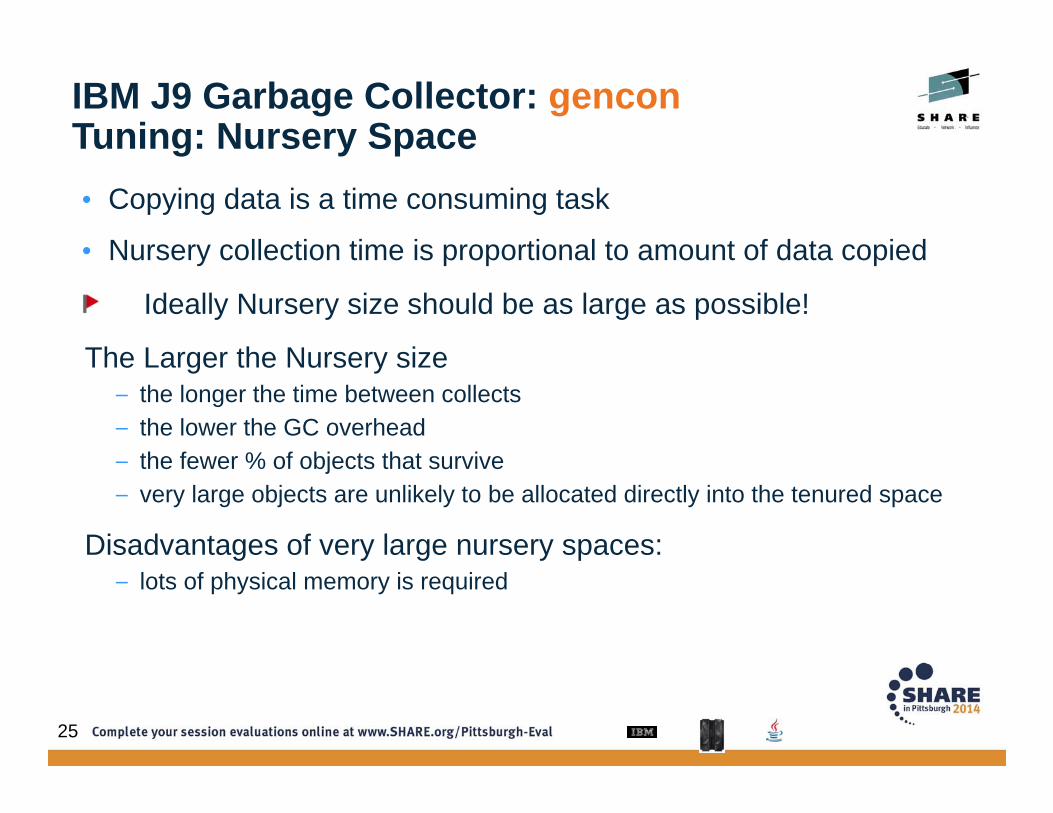
• Copying data is a time consuming task
• Nursery collection time is proportional to amount of data copied
Ideally Nursery size should be as large as possible!
The Larger the Nursery size– the longer the time between collects– the lower the GC overhead– the fewer % of objects that survive – very large objects are unlikely to be allocated directly into the tenured space
Disadvantages of very large nursery spaces:– lots of physical memory is required
IBM J9 Garbage Collector: genconTuning: Nursery Space

26
IBM J9 Garbage Collector: genconRecommended Deployment Scenarios
Best when:• Application allocates many short-lived objects
• Application is transaction-based
• The heap space is fragmented
There is a net increase in memory usage when migrating to gencon

27
IBM J9 Garbage Collector: balanced
Goal: Improve responsiveness• Reduced max pause times to achieve more consistent behaviour• Incremental collection targets best ROI areas of the heap
Expands platform exploitation possibilities• Virtualization : group heap data by frequency of access, direct OS
paging decisions• Dynamic reorganization of data structures to improve memory
hierarchy utilization (performance)

28
Best when:
• Large (>4GB) heaps – to reduce long GC pause
• Frequent global garbage collections
• Excessive time spent in global compaction
IBM J9 Garbage Collector: balancedRecommended Deployment Scenarios

29
Garbage Collection: Agenda
• GC Overview
• IBM JVM(J9) GC - Policies
• IBM JVM(J9) GC – Choosing the right policy
• IBM Monitoring and Diagnostic Tools
• Summary

30
• Typical configuration– Pick a policy based on desired application behaviour– Tune heap sizes (use tooling)– Helper threads (-Xgcthreads)– Lots of other tuning knobs, suggest try hard to ignore, to avoid over-tuning– Monitor and re-tune if needed
• Rule of thumb: If GC overhead is > 10%, you’ve most likely chosen the wrong policy
• Best practice:– Don’t use System.gc()– Avoid finalizers– Memory leaks are possible even with a garbage collector
IBM J9 Garbage Collector Choosing the right policy
31
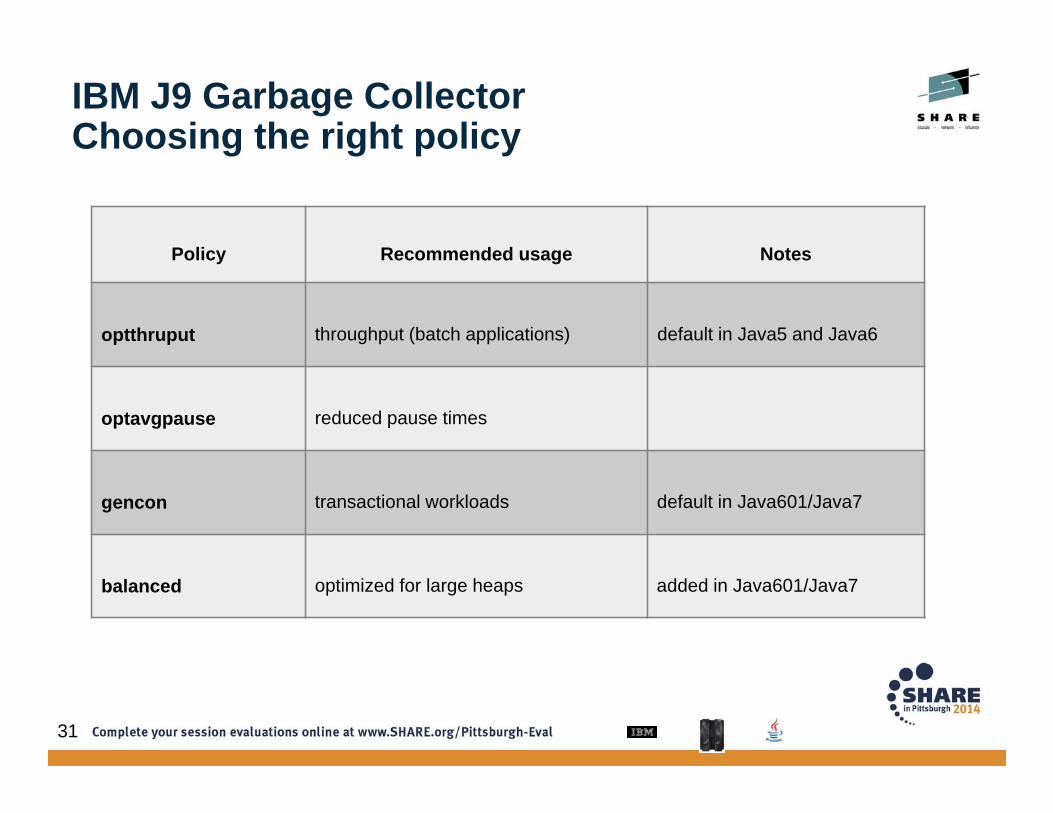
Policy Recommended usage Notes
optthruput throughput (batch applications) default in Java5 and Java6
optavgpause reduced pause times
gencon transactional workloads default in Java601/Java7
balanced optimized for large heaps added in Java601/Java7
IBM J9 Garbage Collector Choosing the right policy

32
Garbage Collection: Agenda
• GC Overview
• IBM JVM(J9) GC - Policies
• IBM JVM(J9) GC – Choosing the right policy
• IBM Monitoring and Diagnostic Tools– Health Center
– GCMV
– Memory Analyzer
• Summary
Session #16182:Java Monitoring and Diagnostic Tooling Thursday, Aug 7th, 4:15PM, room 304

33
Garbage CollectionIBM Monitoring and Diagnostic Tools for JavaHealth Center• Motivating questions:
– What is my JVM doing? Is everything ok?– Why is my application running slowly? – Why is it not scaling?– Am I using the right options?
• Overview– Lightweight live monitoring tool with very low overhead– Understand how your application is behaving, diagnose potential
problems with recommendations– Visualize garbage collection, method profiling, class loading, lock
analysis, file I/O and native memory usage – Suitable for all Java applications running on IBM’s JVM

34
Garbage CollectionIBM Monitoring and Diagnostic Tools for JavaHealth Center

35
Garbage CollectionIBM Monitoring and Diagnostic Tools for Java
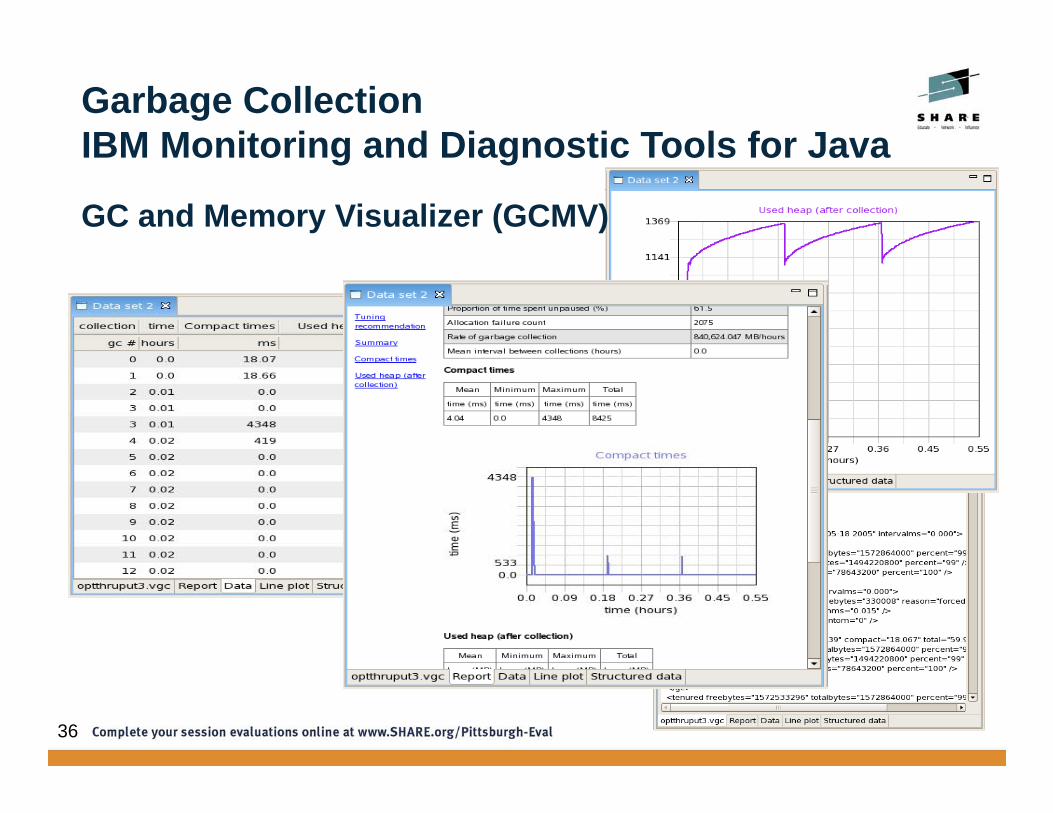
GC and Memory Visualizer (GCMV)• Motivating questions:
– How is the GC behaving? Can I do better?– How much time is GC taking?– How much free memory does my JVM have?
• Overview– Analyzes Java verbose GC logs, providing insight into application behaviour– Uses ps -p $PID -o pid,vsz,rss output to plot native footprint– Visualizes a wide range of GC data and Java heap statistics over time– Provides the ability to detect memory leaks and optimize GC – Recommends tuning options to improve performance
36
Garbage CollectionIBM Monitoring and Diagnostic Tools for Java
GC and Memory Visualizer (GCMV)

37
Memory Analyzer• Motivation questions:
– Why did I run out of Java memory?– What’s in my Java heap? How can
I explore it and get new insights?
Garbage CollectionIBM Monitoring and Diagnostic Tools for Java
• Overview– Tool for analyzing heap dumps and identifying memory leaks from JVMs– Works with IBM system dumps, heapdumps and Sun HPROF binary dumps– Provides memory leak detection, footprint analysis and insight into wasted
space– Provides SQL like object query language (OQL)
38
Garbage Collection: Summary
• Garbage Collector for Java
• IBM JVM(J9) GC - Policies– optthruput– optavgpause– gencon– balanced
• IBM JVM(J9) GC – Choosing the right policy
• IBM Monitoring and Diagnostic Tools for Java– Health Center– GCMV– Memory Analyzer
Session #16182:Java Monitoring and Diagnostic Tooling Thursday, Aug 7th, 4:15PM, room 304

40
© Copyright IBM Corporation 2012. All rights reserved. The information contained in these materials is provided for informational purposes only, and is provided AS IS without warranty of any kind, express or implied. IBM shall not be responsible for any damages arising out of the use of, or otherwise related to, these materials. Nothing contained in these materials is intended to, nor shall have the effect of, creating any warranties or representations from IBM or its suppliers or licensors, or altering the terms and conditions of the applicable license agreement governing the use of IBM software. References in these materials to IBM products, programs, or services do not imply that they will be available in all countries in which IBM operates. Product release dates and/or capabilities referenced in these materials may change at any time at IBM’s sole discretion based on market opportunities or other factors, and are not intended to be a commitment to future product or feature availability in any way. IBM, the IBM logo, Rational, the Rational logo, Telelogic, the Telelogic logo, and other IBM products and services are trademarks of the International Business Machines Corporation, in the United States, other countries or both. Other company, product, or service names may be trademarks or service marks of others.

41
Summary of Links
• Documentation• http://www.ibm.com/developerworks/java/jdk/docs.html• http://www.redbooks.ibm.com/redpapers/pdfs/redp3950.pdf
• zOS SDK• http://www.ibm.com/servers/eserver/zseries/software/java
• System z Linux SDK• http://www.ibm.com/developerworks/java/jdk/linux/download.html
• GC Tuning documentation• http://www.ibm.com/developerworks/views/java/libraryview.jsp?search_by=java+techn
ology+ibm+style:• http://www-01.ibm.com/support/docview.wss?uid=swg27013824&aid=1• http://www.ibm.com/developerworks/websphere/techjournal/1106_bailey/1106_bailey.h
tml#sec-ng• http://www.ibm.com/developerworks/websphere/techjournal/1108_sciampacone/1108_
sciampacone.html• IBM Support Assistant
• http://www.ibm.com/software/support/isa/

42
• Java 7• Project Coin
• https://www.ibm.com/developerworks/mydeveloperworks/blogs/javaee/entry/5_minute_guide_to_project_coin9?lang=en
• NIO.2• http://www.ibm.com/developerworks/java/library/j-nio2-1/index.html
• Fork/Join• http://www.ibm.com/developerworks/library/j-jtp11137/index.html
• WAS 8.5• What's new
• http://www.ibm.com/developerworks/websphere/techjournal/1206_alcott/1206_alcott.html• Using Java 7 in WAS 8.5
• http://pic.dhe.ibm.com/infocenter/wasinfo/v8r5/topic/com.ibm.websphere.installation.base.doc/ae/tins_installation_jdk7.html
• http://pic.dhe.ibm.com/infocenter/wasinfo/v8r5/topic/com.ibm.websphere.nd.multiplatform.doc/ae/rxml_managesdk.html
• Migration Tools• http://www.ibm.com/developerworks/websphere/downloads/migtoolkit/index.html
References