Japan’s Misguided Matryoshka M&A - custprd.coms Misguided Matryoshka MandA.pdf · HP...
18
P age | 1 www.custprd.com Hong Kong Tokyo Japan’s Misguided Matryoshka M&A Corporate altruism does not lead to much needed innovation 9 th December 2015 Intel has made more money in the last 25 years than Japan’s biggest 20 tech giants combined Michael Newman Let’s start with a cautionary tale. Intel vs. Top 20 Japanese tech giants – over 25 years which made more profit? In the last 25 years, Intel Corp on its own has managed to make 31% more net income than all 20 of Japan’s largest tech companies combined on a currency adjusted basis. That is right. Intel on its own has thumped the likes of Sony, Panasonic, Toshiba, Sharp, Mitsubishi Electric, NEC, Hitachi, Fujitsu, Fuji Film, Konica Minolta, Brother, Nidec, Kyocera, Canon, Olympus, TDK, TEL, Ricoh, Advantest and Nikon combined. Intel does one thing very well, commands huge market shares and ensures its product is needed in pretty much most electronic devices that matter. Many Japanese electronics companies are still stuck in highly competitive segments where even foreign brands like Samsung are no longer sneered at. Still corporate Japan thinks matryoshka style mergers are key to survival. However history on many occasions has proved otherwise. Source: Company data, Custom Products Research 151,348 43,065 15,076 14,240 12,414 9,832 6,187 5,772 4,921 4,648 4,254 4,030 3,147 3,101 2,404 1,979 1,911 1,723 -2,504 -3,957 -6,650 -20,000 - 20,000 40,000 60,000 80,000 100,000 120,000 140,000 160,000 Fig 1 :Intel vs Japan's Largest 20 Tech firms in the last 25 years (US$mn Net Profit)
Transcript of Japan’s Misguided Matryoshka M&A - custprd.coms Misguided Matryoshka MandA.pdf · HP...

P a g e | 1 www.custprd.com
Hong Kong Tokyo
Japan’s Misguided Matryoshka M&A
Corporate altruism does not lead to much needed innovation 9th December 2015
Intel has made more money in
the last 25 years than
Japan’s biggest 20 tech giants combined
Michael Newman
Let’s start with a cautionary tale.
Intel vs. Top 20 Japanese tech giants – over 25 years which made more profit?
In the last 25 years, Intel Corp on its own has managed to make 31% more net income than all
20 of Japan’s largest tech companies combined on a currency adjusted basis. That is right.
Intel on its own has thumped the likes of Sony, Panasonic, Toshiba, Sharp, Mitsubishi Electric,
NEC, Hitachi, Fujitsu, Fuji Film, Konica Minolta, Brother, Nidec, Kyocera, Canon, Olympus,
TDK, TEL, Ricoh, Advantest and Nikon combined. Intel does one thing very well, commands
huge market shares and ensures its product is needed in pretty much most electronic devices
that matter. Many Japanese electronics companies are still stuck in highly competitive
segments where even foreign brands like Samsung are no longer sneered at. Still corporate
Japan thinks matryoshka style mergers are key to survival. However history on many
occasions has proved otherwise.
Source: Company data, Custom Products Research
151,348
43,065
15,076 14,240
12,414 9,832
6,187
5,772
4,921 4,648
4,254
4,030 3,147
3,101
2,404
1,979
1,911 1,723
-2,504 -3,957
-6,650 -20,000
-
20,000
40,000
60,000
80,000
100,000
120,000
140,000
160,000
Fig 1 :Intel vs Japan's Largest 20 Tech firms in the last 25 years (US$mn Net Profit)

P a g e | 2 www.custprd.com
Hong Kong Tokyo
Toshiba & Fujitsu PC
merger?
Consolidation didn’t work for
Japanese handset makers
Toshiba & Fujitsu PC tie-up?
The latest news is that scandal-plagued Toshiba is in talks with Fujitsu to merge their loss
making PC units where the two share 6% of the global market. There is a lot of precedent
suggesting that this is a fruitless exercise. As one of my colleagues put it best, “two drowning
men together don’t make a swimmer”. One would hope that Toshiba’s revived sense of
corporate governance would see its board seek more severe action. The majority of directors
are supposed to be independent.
Source: Gartner, Custom Products Research
Lessons from the mobile handset maker mergers in Japan
Japanese mobile handset makers have consolidated. Toshiba teamed with Fujitsu (surely a
lesson in what a poor decision that has been), NEC with Casio and Hitachi, while Sony (albeit
teamed with Ericsson until they merged) has had a rear guard action. Sanyo sold its handset
business to Kyocera. Mitsubishi Electric just quit altogether in 2008. I remember a time when
Japanese clam-shell phones were amazing. Friends from foreign lands would marvel at the
designs, light weight and features versus the clunky Nokia and Motorola offerings of the time.
They also were stumped at how these devices could get so much battery life. Alas, Japan kept
them largely from overseas markets leaving them without the little scale efficiency from
expansion abroad.
Source: Gartner, Custom Products Research
0
5
10
15
20
HP Dell IBM/Lenovo Toshiba Fujitsu Acer Asus
Fig 2 : Global PC Market Share (%)
2001 2002 2003 2004 2005 2006 2007 2008 2009 2010 2011 2012 2013 2014
Samsung Apple MicrosoftLenovo/Motorola
LGElectroni
csHuawei
TCLComm
Xiaomi ZTE Sony Micromax
2013 24.6 8.3 13.9 3.7 3.8 2.9 2.7 0.7 3.3 2.1 1.4
2014 20.9 10.2 9.9 4.5 4.0 3.8 3.4 3.0 2.9 2.0 2.0
Q1 2015 21.3 13.1 7.2 4.2 4.3 4.0 3.1 3.2 2.7 1.7 1.8
0.0
5.0
10.0
15.0
20.0
25.0 Fig 3 : Global Handset Sales Market Share (%)
2013 2014 Q1 2015

P a g e | 3 www.custprd.com
Hong Kong Tokyo
Smartphones have left
Japanese handset
makers in the dust
Nokia’s Elop memo should be mandatory
reading for the tech sector in
Japan
Platform on fire
Unexpected decision
Multiple explosions
Intense
competition
Apple
Android
China’s speed to market
As smartphones have caught on, Japanese handset makers have been left further in the dust.
Sony has the highest global share among Japanese brands at 1.7% (Q1 2015), however even
in the domestic market, Apple and Samsung command the leading shares. Japan’s market
share in mobile phones globally has slid from 15% a decade ago to less than 4% in 2012.
Japanese maker’s global share of flat screen TVs slump from 45% to around 20% over the
same period. What magic can a Toshiba-Fujitsu PC alliance make?
Complacency is a killer. Nokia’s story should be read be all Japanese CEOs
Take Nokia’s then CEO Stephen Elop’s “Burning Platform” memo to staff. It is worth reading in
its entirety because it points straight to the heart of Japan’s woes. In essence Elop had to send
a warning shot across the bows of his own company to wake them up to the imperative to
innovate or die.
“There is a pertinent story about a man who was working on an oil platform in the North Sea. He woke up one night from a loud explosion, which suddenly set his entire oil platform on fire. In mere moments, he was surrounded by flames. Through the smoke and heat, he barely made his way out of the chaos to the platform’s edge. When he looked down over the edge, all he could see were the dark, cold, foreboding Atlantic waters.
As the fire approached him, the man had mere seconds to react. He could stand on the platform, and inevitably be consumed by the burning flames. Or, he could plunge 30 meters in to the freezing waters. The man was standing upon a “burning platform,” and he needed to make a choice.
He decided to jump. It was unexpected. In ordinary circumstances, the man would never consider plunging into icy waters. But these were not ordinary times – his platform was on fire. The man survived the fall and the waters. After he was rescued, he noted that a “burning platform” caused a radical change in his behaviour.
We too, are standing on a “burning platform,” and we must decide how we are going to change our behaviour.
Over the past few months, I’ve shared with you what I’ve heard from our shareholders, operators, developers, suppliers and from you. Today, I’m going to share what I’ve learned and what I have come to believe.
I have learned that we are standing on a burning platform.
And, we have more than one explosion – we have multiple points of scorching heat that are fuelling a blazing fire around us.
For example, there is intense heat coming from our competitors, more rapidly than we ever expected. Apple disrupted the market by redefining the smartphone and attracting developers to a closed, but very powerful ecosystem.
In 2008, Apple’s market share in the $300+ price range was 25 percent; by 2010 it escalated to 61 percent. They are enjoying a tremendous growth trajectory with a 78 percent earnings growth year over year in Q4 2010. Apple demonstrated that if designed well, consumers would buy a high-priced phone with a great experience and developers would build applications. They changed the game, and today, Apple owns the high-end range.
And then, there is Android. In about two years, Android created a platform that attracts application developers, service providers and hardware manufacturers. Android came in at the high-end, they are now winning the mid-range, and quickly they are going downstream to phones under €100. Google has become a gravitational force, drawing much of the industry’s innovation to its core.
Let’s not forget about the low-end price range. In 2008, MediaTek supplied complete reference designs for phone chipsets, which enabled manufacturers in the Shenzhen region of China to
P a g e | 4 www.custprd.com
Hong Kong Tokyo
2 years to overtake us
We are too slow
Symbian not competitive
Fighting with the wrong weapons
War of ecosystems
Ratings agencies
cutting outlook
Brand preference
slipped
We’ve poured gasoline on
our own platform
Must shift behaviour
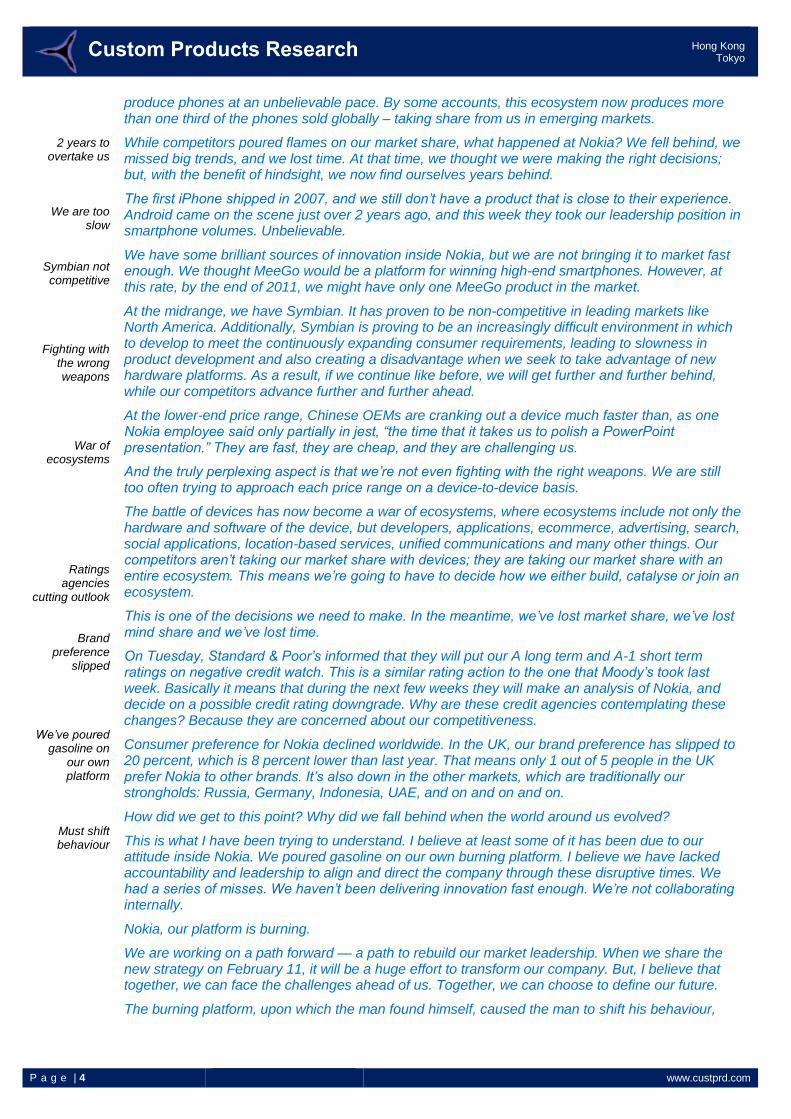
produce phones at an unbelievable pace. By some accounts, this ecosystem now produces more than one third of the phones sold globally – taking share from us in emerging markets.
While competitors poured flames on our market share, what happened at Nokia? We fell behind, we missed big trends, and we lost time. At that time, we thought we were making the right decisions; but, with the benefit of hindsight, we now find ourselves years behind.
The first iPhone shipped in 2007, and we still don’t have a product that is close to their experience. Android came on the scene just over 2 years ago, and this week they took our leadership position in smartphone volumes. Unbelievable.
We have some brilliant sources of innovation inside Nokia, but we are not bringing it to market fast enough. We thought MeeGo would be a platform for winning high-end smartphones. However, at this rate, by the end of 2011, we might have only one MeeGo product in the market.
At the midrange, we have Symbian. It has proven to be non-competitive in leading markets like North America. Additionally, Symbian is proving to be an increasingly difficult environment in which to develop to meet the continuously expanding consumer requirements, leading to slowness in product development and also creating a disadvantage when we seek to take advantage of new hardware platforms. As a result, if we continue like before, we will get further and further behind, while our competitors advance further and further ahead.
At the lower-end price range, Chinese OEMs are cranking out a device much faster than, as one Nokia employee said only partially in jest, “the time that it takes us to polish a PowerPoint presentation.” They are fast, they are cheap, and they are challenging us.
And the truly perplexing aspect is that we’re not even fighting with the right weapons. We are still too often trying to approach each price range on a device-to-device basis.
The battle of devices has now become a war of ecosystems, where ecosystems include not only the hardware and software of the device, but developers, applications, ecommerce, advertising, search, social applications, location-based services, unified communications and many other things. Our competitors aren’t taking our market share with devices; they are taking our market share with an entire ecosystem. This means we’re going to have to decide how we either build, catalyse or join an ecosystem.
This is one of the decisions we need to make. In the meantime, we’ve lost market share, we’ve lost mind share and we’ve lost time.
On Tuesday, Standard & Poor’s informed that they will put our A long term and A-1 short term ratings on negative credit watch. This is a similar rating action to the one that Moody’s took last week. Basically it means that during the next few weeks they will make an analysis of Nokia, and decide on a possible credit rating downgrade. Why are these credit agencies contemplating these changes? Because they are concerned about our competitiveness.
Consumer preference for Nokia declined worldwide. In the UK, our brand preference has slipped to 20 percent, which is 8 percent lower than last year. That means only 1 out of 5 people in the UK prefer Nokia to other brands. It’s also down in the other markets, which are traditionally our strongholds: Russia, Germany, Indonesia, UAE, and on and on and on.
How did we get to this point? Why did we fall behind when the world around us evolved?
This is what I have been trying to understand. I believe at least some of it has been due to our attitude inside Nokia. We poured gasoline on our own burning platform. I believe we have lacked accountability and leadership to align and direct the company through these disruptive times. We had a series of misses. We haven’t been delivering innovation fast enough. We’re not collaborating internally.
Nokia, our platform is burning.
We are working on a path forward — a path to rebuild our market leadership. When we share the new strategy on February 11, it will be a huge effort to transform our company. But, I believe that together, we can face the challenges ahead of us. Together, we can choose to define our future.
The burning platform, upon which the man found himself, caused the man to shift his behaviour,

P a g e | 5 www.custprd.com
Hong Kong Tokyo
Societally much to praise
in Japan
For listed business not
much to praise
Elpida went bust
and take a bold and brave step into an uncertain future. He was able to tell his story. Now, we have a great opportunity to do the same.
Stephen.
It is an exceptionally powerful message. No doubt the majority of Nokia’s employees
acknowledged such candour from their leader. It proves that high market shares are not always
defendable in the face of innovative new products. Complacency is a killer.
Is it misguided altruism that pervades among Japan Inc?
There is much to love about Japan’s selfless dedication to the preservation of its citizens. I’ve
often held that Japan is not capitalism with warts but communism with beauty spots. However
this misguided altruism sometimes leads to a situation much worse for the overall group than
were it surgically removed.
If we look realistically at Toshiba’s new found energy to resuscitate economic fortunes and
show a clean face on corporate governance with a majority of independent directors, how can
one possibly believe that things will change when they look to embark on a carbon copy of the
journey in PCs which failed so dismally.
Elpida Memory (cynically dubbed Hinomaru Semiconductor) was a typical Japan Inc merger
combining the ailing DRAM businesses of Hitachi and NEC in 1999 then adding Mitsubishi
Electric’s DRAM business in 2003. The company listed in 2004 and went bankrupt in 2012 with
debts in excess of $5.5bn. It finally was acquired by Micron Technology in 2013 for around
$2bn. Elpida had 18% market share but DRAM became so commoditised that the company
was more famous for capital raisings than from making inroads on the competition.
Source: Custom Products Research
-200,000
-150,000
-100,000
-50,000
0
50,000
100,000
FY
01
FY
02
FY
03
FY
04
FY
05
FY
06
FY
07
FY
08
FY
09
FY
10
Fig 4 : Elpida Net Profit (¥mn)
0
1000
2000
3000
4000
5000
6000
7000
11/2004 11/2006 11/2008 11/2010
Fig 5 :Elpida share price (¥)
P a g e | 6 www.custprd.com
Hong Kong Tokyo
Renesas
trades at 10% of its all-time
peak
Japan Display 60% off its
high
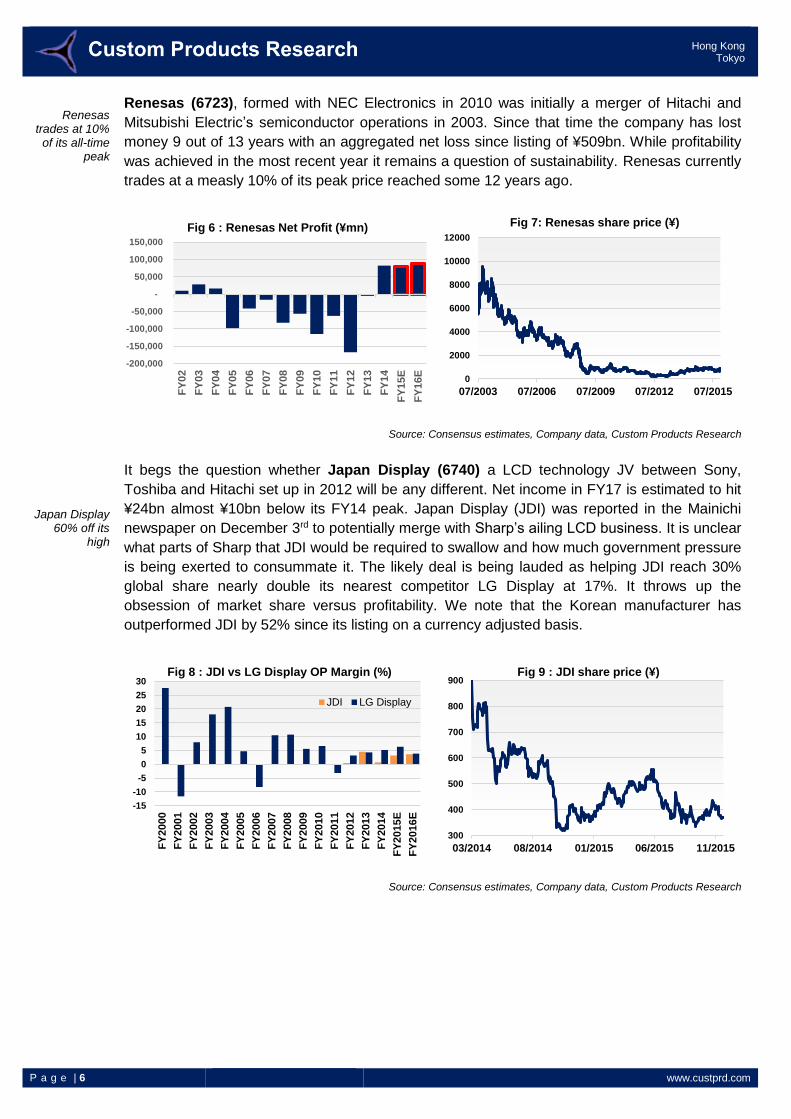
Renesas (6723), formed with NEC Electronics in 2010 was initially a merger of Hitachi and
Mitsubishi Electric’s semiconductor operations in 2003. Since that time the company has lost
money 9 out of 13 years with an aggregated net loss since listing of ¥509bn. While profitability
was achieved in the most recent year it remains a question of sustainability. Renesas currently
trades at a measly 10% of its peak price reached some 12 years ago.
Source: Consensus estimates, Company data, Custom Products Research
It begs the question whether Japan Display (6740) a LCD technology JV between Sony,
Toshiba and Hitachi set up in 2012 will be any different. Net income in FY17 is estimated to hit
¥24bn almost ¥10bn below its FY14 peak. Japan Display (JDI) was reported in the Mainichi
newspaper on December 3rd to potentially merge with Sharp’s ailing LCD business. It is unclear
what parts of Sharp that JDI would be required to swallow and how much government pressure
is being exerted to consummate it. The likely deal is being lauded as helping JDI reach 30%
global share nearly double its nearest competitor LG Display at 17%. It throws up the
obsession of market share versus profitability. We note that the Korean manufacturer has
outperformed JDI by 52% since its listing on a currency adjusted basis.
Source: Consensus estimates, Company data, Custom Products Research
-200,000
-150,000
-100,000
-50,000
-
50,000
100,000
150,000
FY
02
FY
03
FY
04
FY
05
FY
06
FY
07
FY
08
FY
09
FY
10
FY
11
FY
12
FY
13
FY
14
FY
15E
FY
16E
Fig 6 : Renesas Net Profit (¥mn)
0
2000
4000
6000
8000
10000
12000
07/2003 07/2006 07/2009 07/2012 07/2015
Fig 7: Renesas share price (¥)
-15
-10
-5
0
5
10
15
20
25
30
FY
2000
FY
2001
FY
2002
FY
2003
FY
2004
FY
2005
FY
2006
FY
2007
FY
2008
FY
2009
FY
2010
FY
2011
FY
2012
FY
2013
FY
2014
FY
2015
E
FY
2016
E
Fig 8 : JDI vs LG Display OP Margin (%)
JDI LG Display
300
400
500
600
700
800
900
03/2014 08/2014 01/2015 06/2015 11/2015
Fig 9 : JDI share price (¥)

P a g e | 7 www.custprd.com
Hong Kong Tokyo
3.6% OPM for 30% global
share
Sysmex 40% global share
Hoshizaki margins rising
Market share vs. profitability
The general view is that companies should have sustainably higher margins when dominant
market share arises because of the economies of scale. A look at Fig 8 reveals JDI’s projected
operating margin in FY16 is only 3.6%, hardly an achievement for 30% global share. Apple is
the largest customer of JDI and it is clearly exerting its influence over the company’s ability to
eke out higher margins. Many sell-side analysts have appealed that having Apple as a
customer is a good thing. However, the list of suppliers that have suffered margin compression
is long.
Sysmex (6869) is a good example of a Japanese corporation taking a 40% global market
share in hematology testing equipment and converting it to superior margins. A weaker yen has
helped the company which exports nearly three-quarters of its business.
Source: Consensus estimates, Company data, Custom Products Research
Hoshizaki Electric (6465) has been another example of a company that has seen a steady
improvement in margins over the last 8 years since listing. The company has seen success of
its Z-series low power consumption industrial fridges which hold the highest share domestically.
Source: Consensus estimates, Company data, Custom Products Research
7.7
7.2
9.3 10.0 1
1.8
12.2
12.6
13.6
13.5
13.5 14.7
14.3
15.0
17.8 2
0.1 21.4
22.1
5.0
7.0
9.0
11.0
13.0
15.0
17.0
19.0
21.0
23.0
25.0
FY
00
FY
01
FY
02
FY
03
FY
04
FY
05
FY
06
FY
07
FY
08
FY
09
FY
10
FY
11
FY
12
FY
13
FY
14
FY
15E
FY
16E
Fig 10 : Sysmex Operating margin (%)
0
1000
2000
3000
4000
5000
6000
7000
8000
9000
11/2000 11/2004 11/2008 11/2012
Fig 11 : Sysmex share price
5.48 5.50 5.45
8.17 8.16
9.229.76
11.5712.00
12.35
4
5
6
7
8
9
10
11
12
13
FY
07
FY
08
FY
09
FY
10
FY
11
FY
12
FY
13
FY
14
FY
15E
FY
16E
Fig 12: Hoshizaki Operating margins (%)
0
1000
2000
3000
4000
5000
6000
7000
8000
9000
10000
12/2008 12/2010 12/2012 12/2014
Fig 13 : Hoshizaki share price (¥)

P a g e | 8 www.custprd.com
Hong Kong Tokyo
Ricoh & Pentax
Japan should quit
businesses they have no
competitive advantage in
Seria in ¥100 stores
However making market share move from irrelevant to tiny isn’t advised
Copier and printer maker Ricoh (7752) announced in 2011 it would buy the Pentax camera
business from Japan’s Hoya (7741) to add to the company’s own sub 2% market share. Ricoh
paid ¥10bn for the Pentax camera business with hopes to get a firmer grip on the consumer
camera market dominated by the Big 3. Canon, Nikon & Sony held over 80% of the market in
the higher margin DSLR business. Ricoh’s net income over the last three years has been flat at
around ¥68bn, with consensus expectations for a similar number for the next two years despite
the softer yen. Canon has a similar story with net profitability expected to remain flat between
¥220 and ¥250bn. Nikon is expect to do around half of its FY2012 net profit in FY17.
We could go on with plenty more examples but the message is clear. Japanese companies
must realise that they should quit businesses they lack a competitive edge in. If Toshiba and
Fujitsu embark on a merger of PCs it will make absolutely no sense other than protecting jobs
for several more years. This will be at loggerheads with the Tokyo Stock Exchange (TSE) &
Financial Services Agency (FSA) trying to push a mantra of increasing global competitiveness
through shareholder returns outlined in the new corporate governance code. Although we do
not rule out the possibility of convoy investing with the encouragement of the state.
Japanese success stories are everywhere & generally don’t have fiddly M&A
In my former life as a sell-side analyst I was lucky to stumble over many fantastic small-mid cap
growth names. Looking back over the past few years I only wish that strict compliance hadn’t
hampered my ability to buy some of them. Note the following is not in any way endorsing a
recommendation to buy/sell the companies listed hereafter. I own none of these shares (sadly).
It is more to reminisce on the fun of finding these ‘diamonds in the rough’ as I liked to call them.
Note I had sell recommendations on a few of the below names on valuation grounds only.
Japanese ¥100 store player Seria (2782) has been the best performer among listed companies
in the space. It has grown its net income steadily post Lehman Shock, despite the weaker yen
and the consumption tax hike. The shares have responded strongly since that date. Seria is a
good example of a company executing well to a one product strategy.
Source: Consensus estimates, Company Data, Custom Products Research
0
1000
2000
3000
4000
5000
6000
7000
8000
9000
FY
01
FY
02
FY
03
FY
04
FY
05
FY
06
FY
07
FY
08
FY
09
FY
10
FY
11
FY
12
FY
13
FY
14
FY
15E
FY
16E
Fig 14 : Seria Net Income (¥mn)
0
1000
2000
3000
4000
5000
6000
7000
09/2003 09/2006 09/2009 09/2012 09/2015
Fig 15 : Seria share price (¥)
P a g e | 9 www.custprd.com
Hong Kong Tokyo
M3’s
expanding services
SMS
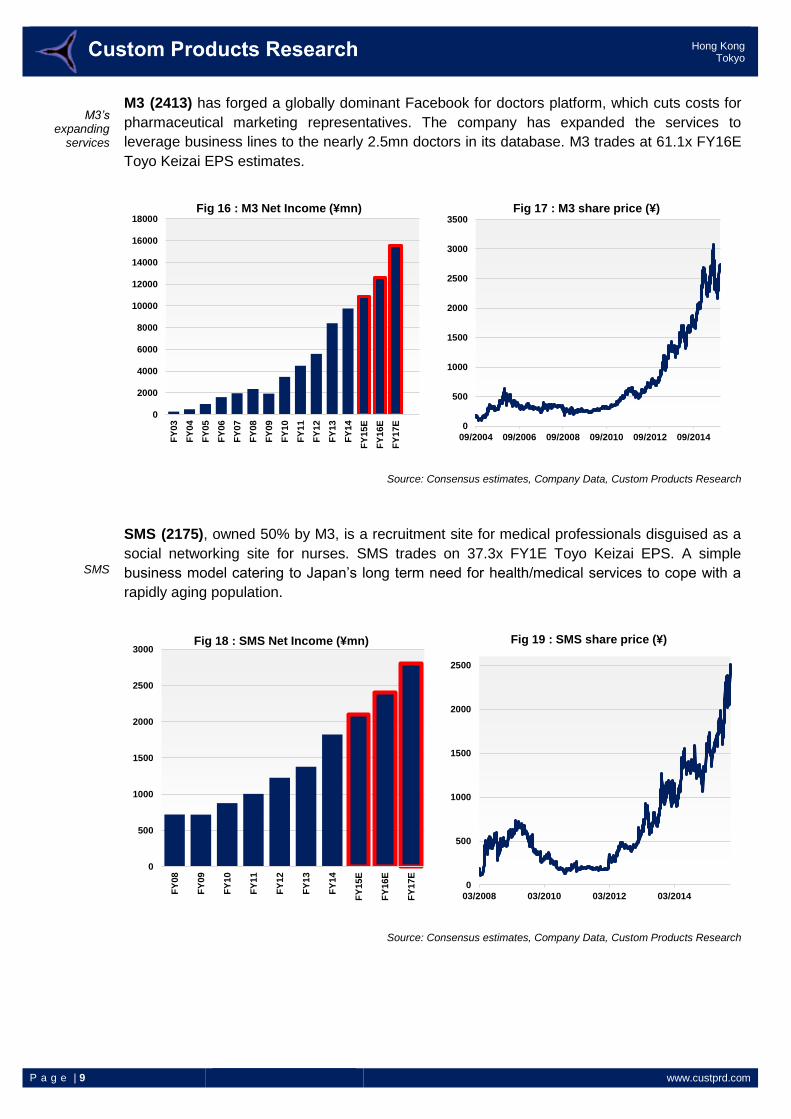
M3 (2413) has forged a globally dominant Facebook for doctors platform, which cuts costs for
pharmaceutical marketing representatives. The company has expanded the services to
leverage business lines to the nearly 2.5mn doctors in its database. M3 trades at 61.1x FY16E
Toyo Keizai EPS estimates.
Source: Consensus estimates, Company Data, Custom Products Research
SMS (2175), owned 50% by M3, is a recruitment site for medical professionals disguised as a
social networking site for nurses. SMS trades on 37.3x FY1E Toyo Keizai EPS. A simple
business model catering to Japan’s long term need for health/medical services to cope with a
rapidly aging population.
Source: Consensus estimates, Company Data, Custom Products Research
0
2000
4000
6000
8000
10000
12000
14000
16000
18000
FY
03
FY
04
FY
05
FY
06
FY
07
FY
08
FY
09
FY
10
FY
11
FY
12
FY
13
FY
14
FY
15E
FY
16E
FY
17E
Fig 16 : M3 Net Income (¥mn)
0
500
1000
1500
2000
2500
3000
3500
09/2004 09/2006 09/2008 09/2010 09/2012 09/2014
Fig 17 : M3 share price (¥)
0
500
1000
1500
2000
2500
3000
FY
08
FY
09
FY
10
FY
11
FY
12
FY
13
FY
14
FY
15E
FY
16E
FY
17E
Fig 18 : SMS Net Income (¥mn)
0
500
1000
1500
2000
2500
03/2008 03/2010 03/2012 03/2014
Fig 19 : SMS share price (¥)

P a g e | 10 www.custprd.com
Hong Kong Tokyo
MonotaRO
InfoMart has doubled margins
MonotaRO (3064) has driven an online industrial warehouse with same day delivery services.
The company has also seen strong net income growth, which has been reflected in share
prices. MonotaRO trades at 73x FY16E Toyo Keizai EPS estimates.
Source: Consensus estimates, Company Data, Custom Products Research
InfoMart (2492) has developed an innovative B2B e-commerce site for restaurants and hotels
which facilitates ordering between food suppliers. Operating profits have grown from ¥600mn in
FY06 with consensus expectations looking for ¥2.65bn in FY16. Revenues are expected to
double from ¥3.04bn to ¥6.74bn on the same metrics with OP margins growing from 19.7% to
38.9%. Effectively InfoMart is executing on one main service. InfoMart trades at 53.1x FY16E
Toyo Keizai EPS estimates.
Source: Toyo Keizai estimates. Company Data, Custom Products Research
0
1000
2000
3000
4000
5000
6000
7000
FY
09
FY
10
FY
11
FY
12
FY
13
FY
14
FY
15E
FY
16E
FY
17E
Fig 20 : MonotaRO Net Income (¥mn)
0
500
1000
1500
2000
2500
3000
3500
4000
12/2006 12/2008 12/2010 12/2012 12/2014
Fig 21 : MonotaRO share price (¥)
0
200
400
600
800
1000
1200
1400
1600
1800
FY
10
FY
11
FY
12
FY
13
FY
14
FY
15E
FY
16E
FY
17E
Fig 22 : InfoMart Net Income (¥mn)
0
200
400
600
800
1000
1200
1400
1600
1800
11/2009 11/2011 11/2013 11/2015
Fig 23 : Informart share price (¥)
P a g e | 11 www.custprd.com
Hong Kong Tokyo
Daikyo Nishikawa growth in
plastics for auto panels
Uber, Airbnb & Apple’s
assetlessness
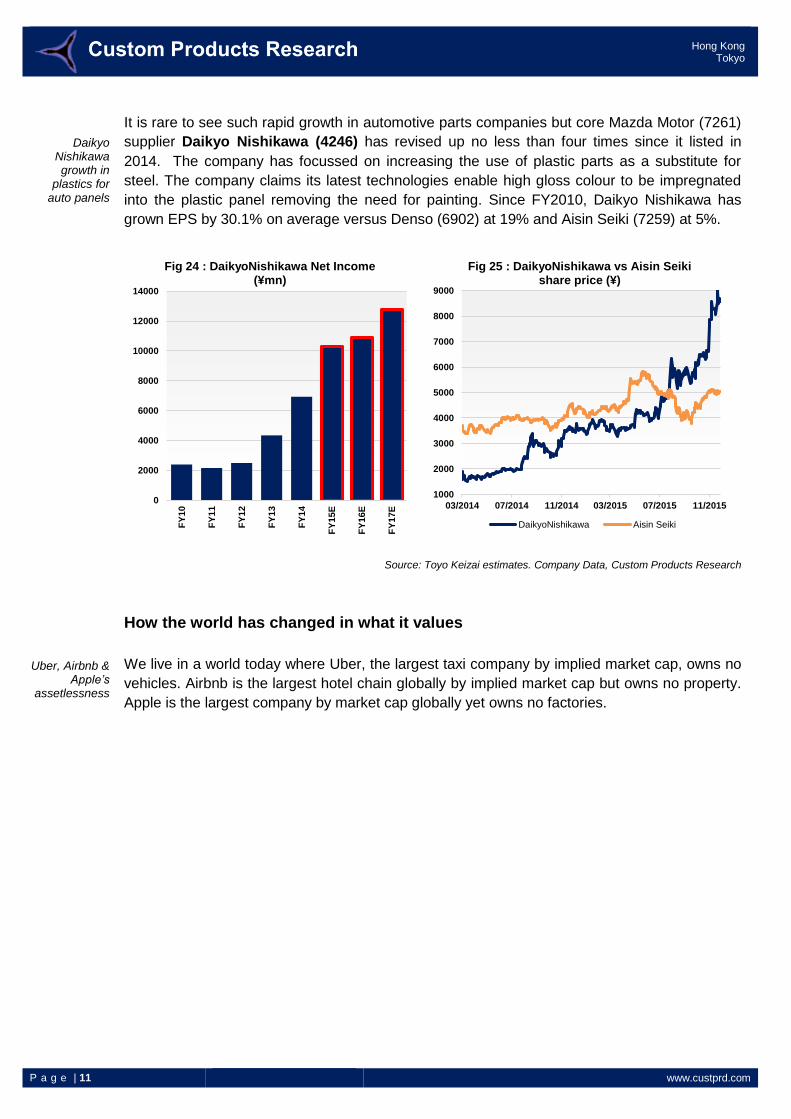
It is rare to see such rapid growth in automotive parts companies but core Mazda Motor (7261)
supplier Daikyo Nishikawa (4246) has revised up no less than four times since it listed in
2014. The company has focussed on increasing the use of plastic parts as a substitute for
steel. The company claims its latest technologies enable high gloss colour to be impregnated
into the plastic panel removing the need for painting. Since FY2010, Daikyo Nishikawa has
grown EPS by 30.1% on average versus Denso (6902) at 19% and Aisin Seiki (7259) at 5%.
Source: Toyo Keizai estimates. Company Data, Custom Products Research
How the world has changed in what it values
We live in a world today where Uber, the largest taxi company by implied market cap, owns no
vehicles. Airbnb is the largest hotel chain globally by implied market cap but owns no property.
Apple is the largest company by market cap globally yet owns no factories.
0
2000
4000
6000
8000
10000
12000
14000
FY
10
FY
11
FY
12
FY
13
FY
14
FY
15E
FY
16E
FY
17E
Fig 24 : DaikyoNishikawa Net Income (¥mn)
1000
2000
3000
4000
5000
6000
7000
8000
9000
03/2014 07/2014 11/2014 03/2015 07/2015 11/2015
Fig 25 : DaikyoNishikawa vs Aisin Seiki share price (¥)
DaikyoNishikawa Aisin Seiki

P a g e | 12 www.custprd.com
Hong Kong Tokyo
Taiko’s new product line
surging
Nippon Carbon’s
unique technology
Some names that seem to have innovative new technology
We looked at several names which have new technology but share prices that have not
reacted as some of the aforementioned names. Our studies show that liquidity (or lack thereof
is a hindrance to share price performance which we wrote about here.
Taiko Pharmaceutical (4574) has introduced a new product called Cleverin which removes
99% of viruses and bacteria (airborne and surface). The company claims to have made a leap
forward in producing chloride dioxide in industrial quantities. Sales of the product have doubled
since FY12 to ¥3.2bn and operating income surged 77-fold (44% OPM) over the same period
assisting the mainstay ‘Seirogan’ gastro business, Fig. 20. The Cleverin business also has
industrial applications. Taiko claims to have the number one share in both product fields.
Shares have traded around ¥282mn over the last 12 months. Taiko trades at 20.3x FY16E
Toyo Keizai EPS.
Source: Company Data, Custom Products Research
Nippon Carbon (5302) has teamed up with General Electric (GE) and Safran (SAF FP) to
increase production of its Hi-Nicalon advanced composite fibre 10-fold in coming years to keep
up with supply to CFM International. Hi-Nicalon is a patented ingredient to form the next
generation ceramic matrix composites (CMC) for use in the Leap-X turbine engine. GE is
talking of more of its engine families adopting the new material. Stock trading at 1.2x PBR.
Source: Toyo Keizai estimates. Company Data, Custom Products Research
1576
5085
18
2102
3204
5753
1394
2314
0
1000
2000
3000
4000
5000
6000
7000
InfectionControl
Business(Sales)
PharmaceuticalBusiness
(Sales)
InfectionControl
Business (OP)
PharmaceuticalBusiness (OP)
Fig 26 : Taiko Pharmaceutical (¥mn)
FY3/12 FY3/15
1000
1200
1400
1600
1800
2000
2200
2400
2600
2800
04/2013 10/2013 04/2014 10/2014 04/2015 10/2015
Fig 27 : Taiko Pharma share price (¥)
15000
20000
25000
30000
35000
40000
FY
00
FY
01
FY
02
FY
03
FY
04
FY
05
FY
06
FY
07
FY
08
FY
09
FY
10
FY
11
FY
12
FY
13
FY
14
FY
15E
FY
16E
Fig 28 : Nippon Carbon Revenue (¥mn)
0
100
200
300
400
500
600
700
800
900
11/2000 11/2003 11/2006 11/2009 11/2012 11/2015
Fig 29 : Nippon Carbon share price (¥)

P a g e | 13 www.custprd.com
Hong Kong Tokyo
Zuiko a leader on diaper
production equipment
JP Holdings leading in day-
care
Zuiko (6279) is a manufacturer of diaper production equipment, commanding an 80% market
share in Asia where the growth expected for adult diapers is driven by the aging populations of
China and Japan (population of those over 65 years old set to exceed 25% of the population by
2030). The company says its machines are custom built to client requirements. Unicharm
(8113) owns 3.4% of Zuiko’s outstanding shares. Shares trade on 15.8x FY16E Toyo Keizai
EPS.
Source: Toyo Keizai estimates. Company Data, Custom Products Research
JP Holdings (2749) is the largest individual provider of day-care centres in Japan. PM Abe has
called for 400,000 new day-care places by 2018 in order to get more women back into the
workforce to offset the declining working age population. The national government is funding c.
88% of the cost of construction in order to cut back on waiting lists. JP Holdings trades on
22.5x FY16E Toyo Keizai EPS.
Source: Toyo Keizai estimates. Company Data, Custom Products Research
5000
10000
15000
20000
25000
30000
35000
FY
04
FY
05
FY
06
FY
07
FY
08
FY
09
FY
10
FY
11
FY
12
FY
13
FY
14
FY
15E
FY
16E
FY
17E
Fig 30 : Zuiko Revenue (¥mn)
0
1000
2000
3000
4000
5000
6000
7000
8000
9000
8/11/2004 8/11/2007 8/11/2010 8/11/2013
Fig 31 : Zuiko Share Price (¥)
0
200
400
600
800
1000
1200
1400
1600
FY
01
FY
02
FY
03
FY
04
FY
05
FY
06
FY
07
FY
08
FY
09
FY
10
FY
11
FY
12
FY
13
FY
14
FY
15E
FY
16E
FY
17E
Fig 32 : JP Holdings Net Income
0
100
200
300
400
500
600
700
800
10/2002 10/2005 10/2008 10/2011 10/2014
Fig 33 : JP Holdings share price (¥)

P a g e | 14 www.custprd.com
Hong Kong Tokyo
Beauty Garage
Sony’s innovation has
been a strength if subsidiary
performance is looked at
Beauty Garage (3180) is similar to MonotaRO in business model but focuses exclusively on
the hairdressing, nail, massage and aesthetic salons. Its customers order consumables,
furniture and tools online. The company also offer services (financial, design, furniture, client
management systems to help new salons set up. The stock trades at 14.8x FY16E Toyo Keizai
EPS.
Source: Toyo Keizai estimates. Company Data, Custom Products Research
Sony once prided itself on innovation
The ingredient of ‘innovation’ coursed through Sony’s veins in the 1980s. It dazzled the world
with the ‘Walkman’. Now, Sony is cutting divisions as it seeks to rediscover its own sense of
purpose. Akio Morita would be rolling over in his grave if he saw what had happened. The irony
of it all was that Sony’s innovation didn’t die. It ended up in a lot of creative and profitable spin-
offs such as Sony Financial Holdings (8729) and M3 (2413). However the core business is
struggling to work out what it should be.
What many of the stocks included above show is that focused product lines in relatively
untapped sectors leads to sustained profitability.
Going back to our original study of Intel versus large cap tech companies in Japan we noted
that sales per employee (Fig. 36) numbers are not so far removed from Intel but profitability is a
different question. Figs. 37 & 38 show the large disparity at the operating and net profit levels.
Source: Custom Products Research
0
50
100
150
200
250
300
350
400
450
500
FY
09
FY
10
FY
11
FY
12
FY
13
FY
14
FY
15E
FY
16E
FY
17E
Fig 24: Beauty Garage Net Income (¥mn)
200
400
600
800
1000
1200
1400
1600
02/2013 08/2013 02/2014 08/2014 02/2015 08/2015
Fig 35 : Beauty Garage share price (¥)
-
500,000
1,000,000
1,500,000
2,000,000
2,500,000
Intel Toshiba Fujitsu M3 Seria MonotaRO InfoMart
Fig 36 : Revenue/Employee (US$)
FY09 FY10 FY11 FY12 FY13 FY14 Average
P a g e | 15 www.custprd.com
Hong Kong Tokyo
Source: Custom Products Research
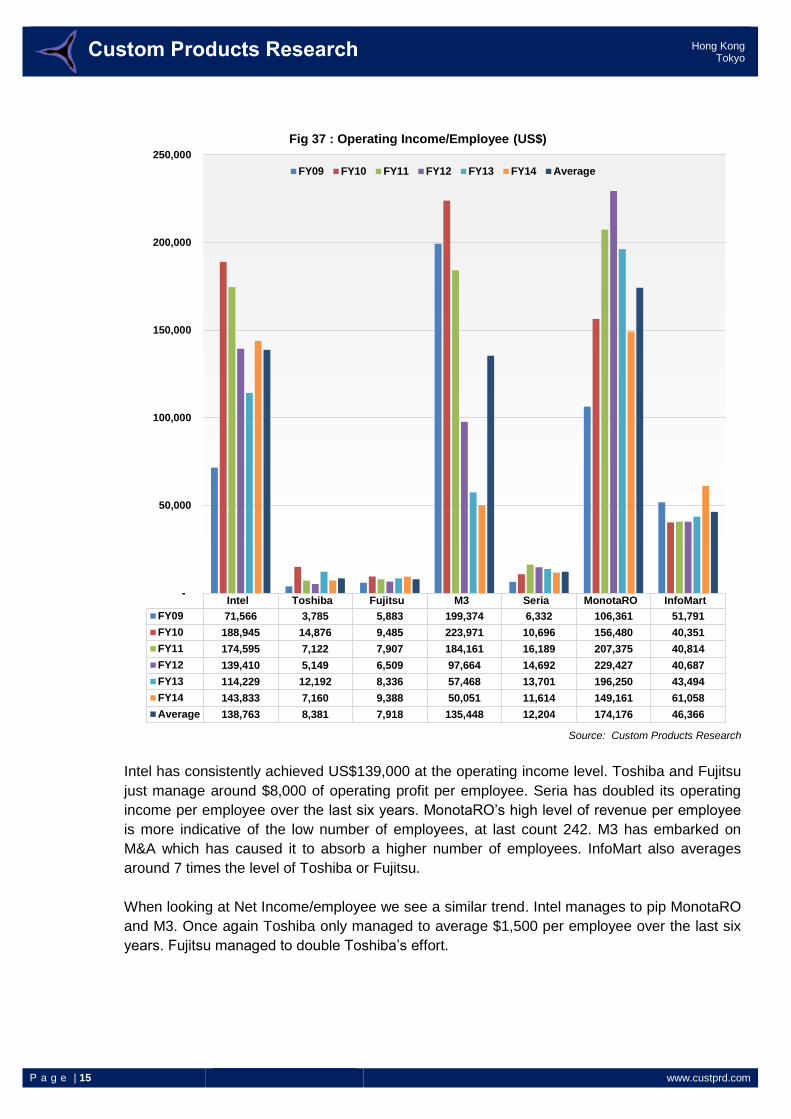
Intel has consistently achieved US$139,000 at the operating income level. Toshiba and Fujitsu
just manage around $8,000 of operating profit per employee. Seria has doubled its operating
income per employee over the last six years. MonotaRO’s high level of revenue per employee
is more indicative of the low number of employees, at last count 242. M3 has embarked on
M&A which has caused it to absorb a higher number of employees. InfoMart also averages
around 7 times the level of Toshiba or Fujitsu.
When looking at Net Income/employee we see a similar trend. Intel manages to pip MonotaRO
and M3. Once again Toshiba only managed to average $1,500 per employee over the last six
years. Fujitsu managed to double Toshiba’s effort.
Intel Toshiba Fujitsu M3 Seria MonotaRO InfoMart
FY09 71,566 3,785 5,883 199,374 6,332 106,361 51,791
FY10 188,945 14,876 9,485 223,971 10,696 156,480 40,351
FY11 174,595 7,122 7,907 184,161 16,189 207,375 40,814
FY12 139,410 5,149 6,509 97,664 14,692 229,427 40,687
FY13 114,229 12,192 8,336 57,468 13,701 196,250 43,494
FY14 143,833 7,160 9,388 50,051 11,614 149,161 61,058
Average 138,763 8,381 7,918 135,448 12,204 174,176 46,366
-
50,000
100,000
150,000
200,000
250,000
Fig 37 : Operating Income/Employee (US$)
FY09 FY10 FY11 FY12 FY13 FY14 Average

P a g e | 16 www.custprd.com
Hong Kong Tokyo
Source: Custom Products Research
In Summary
In conclusion, it is clear that Japanese companies must re-evaluate product line ups and staff
numbers. In today’s globally competitive landscape, Japanese corporations need to innovate.
New age companies that exploit gaps in the market by offering efficiencies without the need for
vast swathes of employees have rewarded shareholders well.
The juxtaposition for the small-mid cap companies is to get recognised by the investment
community. Staff numbers in the Japanese securities industry has halved since 2009, Fig 39.
This is putting even harsher conditions on sell-side securities firms to be able to ‘economically’
cover small-mid cap companies due to the relatively lower liquidity.
Intel Toshiba Fujitsu M3 Seria MonotaRO InfoMart
FY09 54,749 -2,844 5,803 80,469 2,854 57,888 28,929
FY10 138,958 9,632 3,941 129,466 4,880 90,021 23,533
FY11 129,291 198 3,207 108,182 8,998 118,551 22,662
FY12 104,810 751 -4,981 58,832 8,486 132,462 24,775
FY13 89,405 2,856 2,842 35,201 8,326 115,637 25,075
FY14 109,691 -1,589 7,359 30,412 7,418 87,769 36,965
Average 104,484 1,501 3,028 73,760 6,827 100,388 26,990
-20,000
-
20,000
40,000
60,000
80,000
100,000
120,000
140,000
160,000
Fig 38 : Net Income/Employee (US$)
FY09 FY10 FY11 FY12 FY13 FY14 Average

P a g e | 17 www.custprd.com
Hong Kong Tokyo
Source: Japan Banking Association
The irony is that many in the overseas investment community realise many high value small-
mid cap companies exist in Japan but the regulations (such as MiFID II) will force the
separation of trading and research commission. That will mean investment firms will need to
put a hard price on research reports. Companies such as ResearchPool & Research Exchange
aim to provide an Apple iTunes style platform which will allow investors to pay for individual
reports, Fig. 40. Any research house can list their financial research on these exchanges and
pay a percentage from the price they set.
Fig 40 : Independent Research Exchanges
Source: ResearchPool Limited
Japanese corporates will be forced into the position to look to sponsored/independent research
houses to improve chances of being discovered by institutional investors. While brokers have
tended to provide this service over the decades, onerous compliance costs, coupled with a lack
of liquidity in small-mid cap stocks will prevent companies gaining exposure. Although the costs
of getting coverage is tiny relative to the peace of mind it can provide not only to increasing
exposure but executing upon the corporate governance code to maximise shareholder returns.
Interesting times ahead and Japanese corporates should waste no time taking action.
0
2000
4000
6000
8000
10000
12000
14000
2009 2014
Fig 39: Japanese Securities Industry staff numbers

P a g e | 18 www.custprd.com
Hong Kong Tokyo
)
Important Disclosures:
This material was prepared for you and is for your information and use only. This material should only be distributed to other members of that organization on a need to know basis and should not be distributed or disseminated to any other person or entity.
This material is for information purposes only and it should not be regarded as an offer to sell or as a solicitation of an offer to buy the securities or other instruments mentioned in it. This material is based on current public information that Custom Products Group Limited ("Custom Products") considers reliable, but we make no representation that it is accurate or complete, and it should not be relied on as such. No investment opinion or advice is provided, intended, or solicited. Custom Products offers no warranty, either expressed or implied, regarding the veracity of data or interpretations of data included in this report. This material is provided with the understanding that Custom Products is not acting in a fiduciary capacity. Opinions expressed herein reflect the opinion of Custom Products and are subject to change without notice.
The products mentioned in this document may not be eligible for sale in some states or countries, and they may not be suitable for all types of investors. The value of and the income produced by products may fluctuate, so that an investor may get back less than they invested. Value and income may be adversely affected by exchange rates, interest rates, or other factors. Past performance is not necessarily indicative of future results. If a product is income producing, part of the capital invested may be used to pay that income. © 2015 Custom Products Group Limited. All rights reserved.
Hong Kong 15/F Langham Place 8 Argyle Street Mong Kok, Kowloon Hong Kong S.A.R.
Tokyo 17/F Roppongi Hills North Tower 6-2-31 Roppongi, Minato-ku, Tokyo Japan 106-0032
Office Locations
Hong Kong Simon Rigney
+852-3958-2394 (HK) +81-3-5786-3712 (Tokyo) [email protected]
Tokyo Robert Rowland
+81-3-5786-3711 [email protected]
Michael Newman
+81-3-5786-3713 [email protected]
Contacts
Salt Lake City Patrick Hansen
+852-8191-6925 (HK) +1-801-230-4796 (SLC) [email protected]
Salt Lake City 299 South Main Street Suite 1300 Salt Lake City, UT United States, 84111