
Japanese National Accounts: Estimation Methodology Account.pdf · – Commodity-flow method –...
27
1 Japanese National Accounts: Estimation Methodology NTA Project Workshop I, 19 October 2005 Nihon University Population Research Institute Kosuke SUZUKI Department of National Accounts Economic and Social Research Institute The views and opinions expressed in this paper are the author’s only; ESRI does not share them.
Transcript of Japanese National Accounts: Estimation Methodology Account.pdf · – Commodity-flow method –...

1
Japanese National Accounts: Estimation Methodology
NTA Project Workshop I, 19 October 2005Nihon University Population Research Institute
Kosuke SUZUKIDepartment of National Accounts
Economic and Social Research Institute
The views and opinions expressed in this paper are the author’s only; ESRI does not share them.
2
0. Introduction • What Are National Accounts?
– The most essential and comprehensive economic statistics
• Overall and detailed description of economic development• From flow to stock• Both in nominal, real, and price terms• Integration of basic source data
– Established world standards• Academic background• System of National Accounts 1993• Time-series, cross-country, and regional comparisons• Consistency with other economic statistics

3
0. Introduction (continued)• National Accounts in Japan
– A long history…started in the Meiji era.– High quality, greater detail, and timeliness– Widely used: policymaking, economic analyses, and
forecasts – Missions of Department of National Accounts
• Publication of annual estimates (contain approximately 70 different kinds of tables, some in both nominal and real terms; and some in both annual and quarterly terms)
• Publication of flash estimates (approximately six weeks later)• Other issues (research on satellite accounts, etc.)

4
1. National Accounts : Overview and Key Concepts
• Sequence of Accounts– Production, income, current and capital expenditure,
and stock• Sector Classification
– Households, general government, financial/non-financial corporations, NIPSH
• Price and Volume Measurement• Some Definitions
– Difference between consumption and investment
5
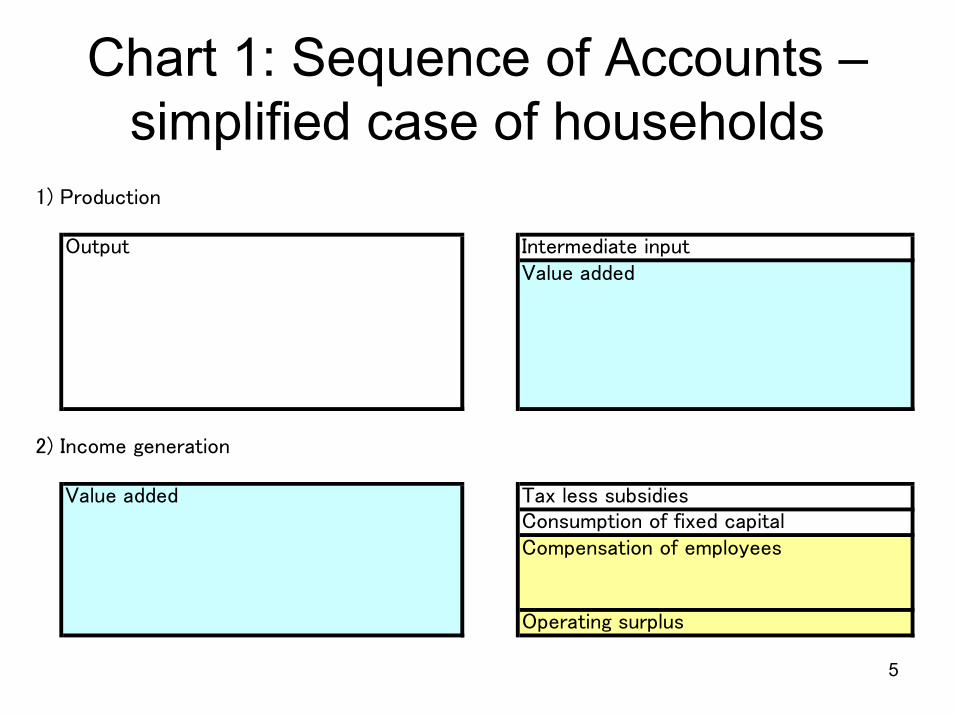
Chart 1: Sequence of Accounts –simplified case of households
1) Production
Output Intermediate inputValue added
2) Income generation
Value added Tax less subsidiesConsumption of fixed capitalCompensation of employees
Operating surplus

6
Chart 1 (continued)3) Income distribution
Compensation of employees Property income, payableTax on income, wealth, etc.Social contributions
Operating surplus Other current transfer, payableProperty income, receivable Disposable incomeSocial benefitsOther current transfers, receivable
4) Use of income
Disposable income Expenditure
Saving, net
7
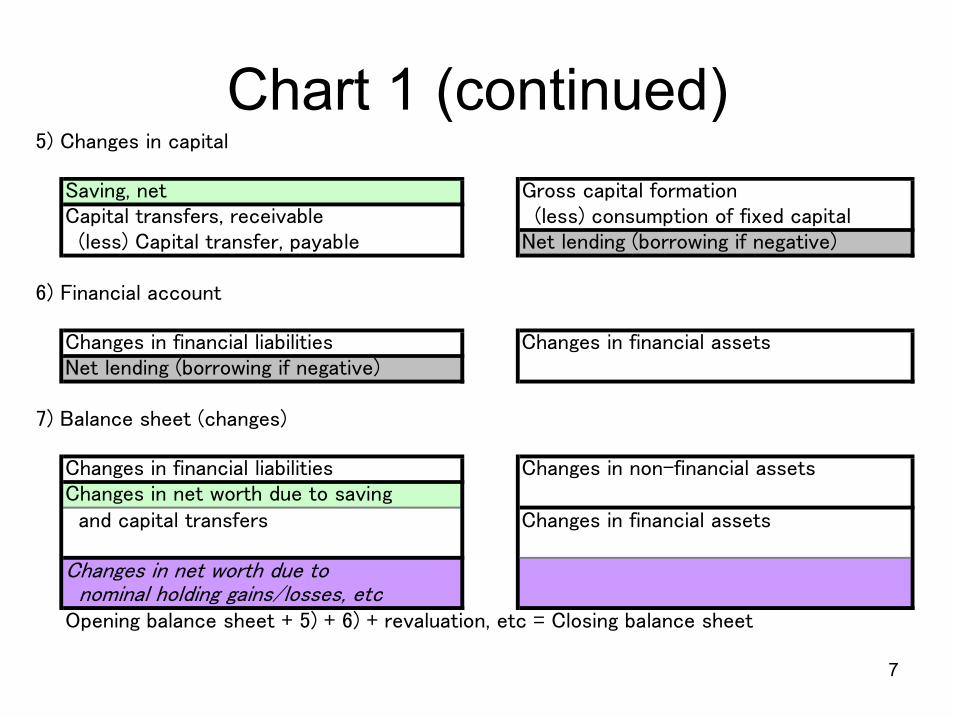
Chart 1 (continued)5) Changes in capital
Saving, net Gross capital formationCapital transfers, receivable (less) consumption of fixed capital (less) Capital transfer, payable Net lending (borrowing if negative)
6) Financial account
Changes in financial liabilities Changes in financial assetsNet lending (borrowing if negative)
7) Balance sheet (changes)
Changes in financial liabilities Changes in non-financial assetsChanges in net worth due to saving and capital transfers Changes in financial assets
Changes in net worth due to nominal holding gains/losses, etcOpening balance sheet + 5) + 6) + revaluation, etc = Closing balance sheet

8
Chart 2: Sectors in National Accounts
Sector Sub-sectorNon-financial Corporations Private NFC
Public NFCFinancial Corporations Private FC
Public FCGeneral Government Central Government
Local GovernmentsSocial Security Funds
Non-profit Institutions Serving HouseholdsHouseholds

9
2. Methodology I : Frameworks for Nominal Figures
• Benchmark Year Estimates – Most detailed information available– Input-Output tables, Population Census, and other
comprehensive surveys (available every five years)– Commodity-flow method
• Annual Estimates – Using detailed annual data with extrapolation– Commodity-flow method– Expenditure, production and income accounts

10
Chart 3: Input-Output and National Accounts
Intermediate Input Final Demand Outputitem 1, 2, … Consumption, Investment
item 1item 2
Inter- . GDEmediate .Input .
Value GDPAdded =GDI
Output
11
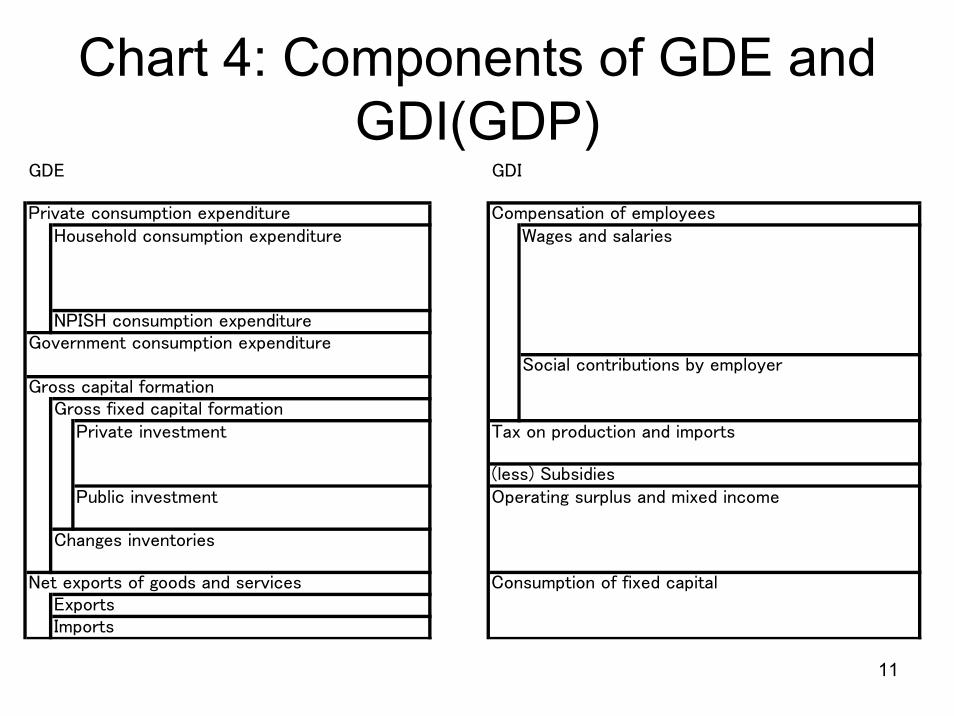
Chart 4: Components of GDE and GDI(GDP)
GDE GDI
Private consumption expenditure Compensation of employeesHousehold consumption expenditure Wages and salaries
NPISH consumption expenditureGovernment consumption expenditure
Social contributions by employerGross capital formation
Gross fixed capital formationPrivate investment Tax on production and imports
(less) SubsidiesPublic investment Operating surplus and mixed income
Changes inventories
Net exports of goods and services Consumption of fixed capitalExportsImports

12
Chart 5: Commodity-flow Method
Import Export
Intermediate Consumption
Household Consumption
Output Shipment Total Supply Fixed Capital Formation
InventoryInventory - wholesale/retail trade- finished goods- work-in-progress Trade/Transport Margins
are components of GDE
Inventory - materials /supplies

13
Chart 6: Production and Income
• GDP for (i)th industry: Y (i)– Y (i) = output (i) – intermediate input (i)
• Decomposition of GDI by industry– Operating surplus estimated as residual, alternatively
directly estimated from basic source data– Operating surplus (i) = Y (i) – CE (i) – TS (i) – CFC (i)– CE (i): Compensation of employees– TS (i): Tax less subsidies– CFC (i): Consumption of fixed capital

14
Chart 7: Annual Estimates and Benchmark Revision
GDPExtrapolation
Interpolation
Benchmarked
Year
15
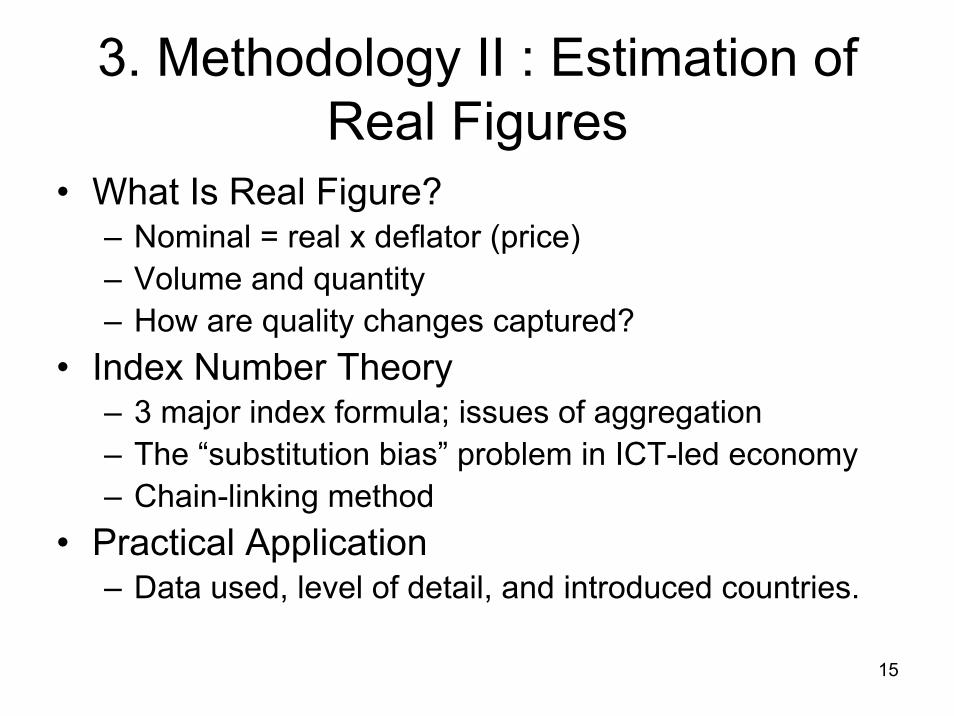
3. Methodology II : Estimation of Real Figures
• What Is Real Figure? – Nominal = real x deflator (price)– Volume and quantity– How are quality changes captured?
• Index Number Theory– 3 major index formula; issues of aggregation– The “substitution bias” problem in ICT-led economy– Chain-linking method
• Practical Application– Data used, level of detail, and introduced countries.
16
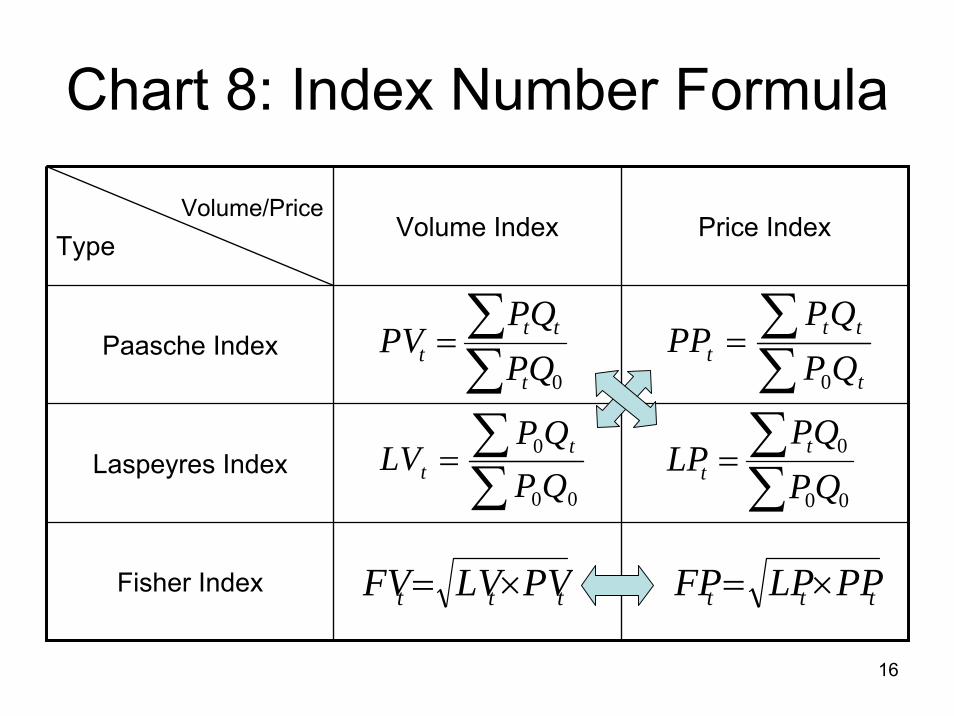
Chart 8: Index Number Formula
Volume/PriceType
Volume Index Price Index
Paasche Index
Laspeyres Index
Fisher Index
∑∑=
00
0
QPQP
LV tt ∑
∑=00
0
QPQP
LP tt
∑∑=
0QPQP
PVt
ttt ∑
∑=t
ttt QP
QPPP
0
ttt PVLVFV ×= ttt PPLPFP ×=

17
• Example: Laspeyres Volume IndexFixed-based
Chain-linking
Chart 9: Fixed-based and Chain-linking
∑∑∑ ⋅==
0,
,0,
0,0,
,0,
i
tii
ii
tiit Q
Qw
QPQP
LV
∑∑∑
−−−
−−
−− ⋅×=×=
1,
,1,1
1,1,
,1,1
ti
titit
titi
tititt Q
QwLV
QPQP
LVLV

18
Chart 10: Comparison of Fixed-based and Chain-linking Methods – e.g. GDP deflator –
-3.5
-3.0
-2.5
-2.0
-1.5
-1.0
-0.5
0.0
0.5
1.0
1.5
Q1
Q2
Q3
Q4
Q1
Q2
Q3
Q4
Q1
Q2
Q3
Q4
Q1
Q2
Q3
Q4
Q1
Q2
Q3
Q4
Q1
Q2
Q3
Q4
Q1
Q2
Q3
Q4
Q1
Q2
Q3
Q4
Q1
Q2
Q3
Q4
Q1
Q2
Q3
Q4
Q1
Q2
1995 1996 1997 1998 1999 2000 2001 2002 2003 2004 2005
Chain-linking
Fixed-based
(Year-on-year changes)

19
Digression : A Quiz
• Some Buzzwords in National Accounts; Do you know the meanings of the following words?– Contributions (how to calculate?)– Current/capital transfer– CFC– Gross and net (double meanings)– Accrual and cash accounting
• National Accounts as Statistics; What is the meaning of “estimation”?
20
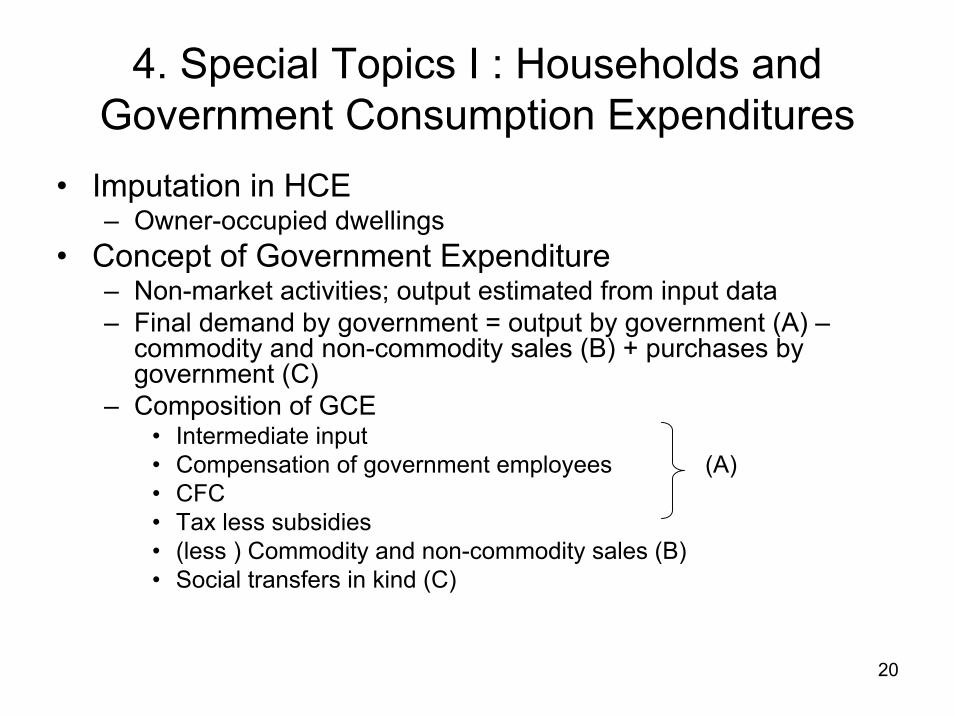
4. Special Topics I : Households and Government Consumption Expenditures
• Imputation in HCE– Owner-occupied dwellings
• Concept of Government Expenditure– Non-market activities; output estimated from input data– Final demand by government = output by government (A) –
commodity and non-commodity sales (B) + purchases by government (C)
– Composition of GCE• Intermediate input • Compensation of government employees (A)• CFC• Tax less subsidies• (less ) Commodity and non-commodity sales (B)• Social transfers in kind (C)

21
Chart 11: Estimation of Imputed Rents
• Composition of HCE– Domestic final consumption expenditure of
households: 274 trillion yen for 2003– Imputed rents: 53 trillion yen for 2003
• Estimation method of imputed rents– Unit rent in housing market (for equivalent category
(i)): UR (i) (yen/m2)– Floor space of owner-occupied dwellings: FSOD (i)
(m2)– Imputed rents: ΣIR (i) = UR (i) x FSOD (i)

22
Chart 12: Household and Government Consumption Expenditure
• Relationship Between Household Expenditure and Government Sales
• Treatment of Medical and Long-term Care Expenditures (Social transfers in kind)
intermediate input final demand outputgovernment HCE GCE
inter- medical Cmediateinput government B A
value added
output A

23
4. Special Topics II : Compensation of Employees, etc.
• Composition of Compensation of Employees– Compensation of employees = wage and
salaries + social contributions• Operating surplus and mixed income
– Operating surplus for owner-occupied dwellings
– Mixed income• Proprietors’ income = profit + wage
24
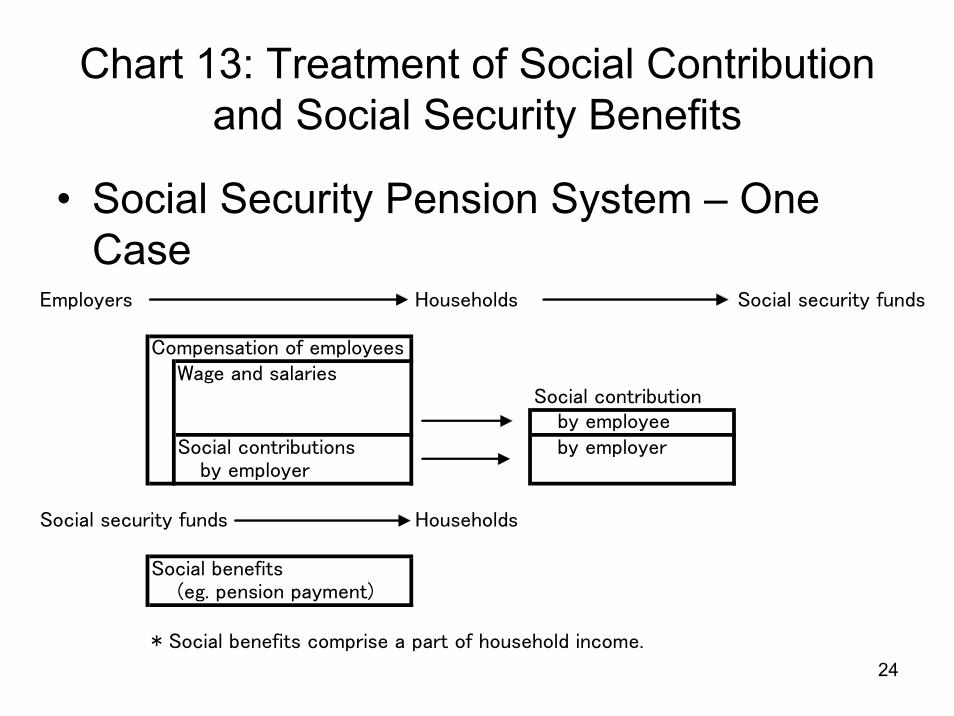
Chart 13: Treatment of Social Contribution and Social Security Benefits
• Social Security Pension System – One Case
Employers Households Social security funds
Compensation of employeesWage and salaries
Social contributionby employee
Social contributions by employerby employer
Social security funds Households
Social benefits(eg. pension payment)
* Social benefits comprise a part of household income.

25
Other Issues• Ongoing Benchmark Revision in Japan
– Quinquennial revision (to be published from this coming December)
– Major revisions under consideration (may be announced in the next month)
– Introduction of a chain index (introduced in advance)• SNA Update (revision in SNA93)
– Reflect economic development thereafter– More detailed explanation– Expansion of accounts incorporating recent academic
works– “Revision I” will be finalized in 2008.

26
References and SourcesReferences• “System of National Accounts 1993” (UN)
– Current world standard• “European System of Accounts 1995” (Eurostat)
– European standards, almost same as the SNA93• “Annual Report on National Accounts” (ESRI, Japan)
– Annual estimates of Japanese national accounts, with explanatory notesSources• http://www.esri.cao.go.jp/en/sna/menu.html
– Japanese SNA website in English.• http://www.oecd.org/topicstatsportal/0,2647,en_2825_495684_1_1_1_1_1,00.html
– Member countries’ national accounts database run by OECD.• http://unstats.un.org/unsd/snaama/Introduction.asp
– UN webpage on main aggregates by country.• http://dsbb.imf.org/Applications/web/sddsnsdppage/
– IMF’s Data Standard webpage; a short-cut of “jumping” to national accounts webpage of major member countries.

27
Thank you for your attention ☺


![[Japanese Culture] Japanese Fairy Tale](https://static.fdocuments.us/doc/165x107/577dab5a1a28ab223f8c5222/japanese-culture-japanese-fairy-tale.jpg)