Japanese Direct Foreign Investment: Patterns and...
67
INDUSTRY ANDENERGY DEPARTMENT WORKING PAPER INDUSTRY SERIES PAPER No.1 Japanese DirectForeign Investment: Patterns and Implications for Developing Countries February 1989 ThIolFakIds- and Energy- _ t , -PP- -R The World Bankindustry and Energy Department, PPR Public Disclosure Authorized Public Disclosure Authorized Public Disclosure Authorized Public Disclosure Authorized Public Disclosure Authorized Public Disclosure Authorized Public Disclosure Authorized Public Disclosure Authorized
Transcript of Japanese Direct Foreign Investment: Patterns and...
INDUSTRY AND ENERGY DEPARTMENT WORKING PAPERINDUSTRY SERIES PAPER No. 1
Japanese Direct Foreign Investment:Patterns and Implications forDeveloping Countries
February 1989
ThIolFakIds- and Energy- _ t , -PP- -R
The World Bank industry and Energy Department, PPR
Pub
lic D
iscl
osur
e A
utho
rized
Pub
lic D
iscl
osur
e A
utho
rized
Pub
lic D
iscl
osur
e A
utho
rized
Pub
lic D
iscl
osur
e A
utho
rized
Pub
lic D
iscl
osur
e A
utho
rized
Pub
lic D
iscl
osur
e A
utho
rized
Pub
lic D
iscl
osur
e A
utho
rized
Pub
lic D
iscl
osur
e A
utho
rized
JAPANESE DIRECT FOREIGN INVESTMENT:
PATTERNS AND IMPLICATIONS FOR
DEVELOPING COUNTRIES
by
Jung Taik Hyun
Katherine Whitmore
The World Bank
Copyright (c) 1989The World Bank1818 H Street, N.W.Washington, D.C' 20433U. S. A.
This paper is one of a series issued by the Industry and Energy Department forthe information and guidance of Bank staff. The paper may not be published orquoted as representing the views of the Bank Group, nor does the Bank groupaccept responsibility for its accuracy or completeness.
Japanese DFI has grown rapldly and is now the main globalsource of direct forelgn investment flows. It has undergone a struc-tural shift from labor-intensive manufacturing to technologicallysophistLcated, capital-intensive sectors, and from developing todeveloped countries. While large firm characterize Japanese DFI indeveloped countries, general trading companies and small and mediumfirms have been important participants and still play an Lmportant rolein developing countries.
The main objective of Japanese DFI is to expand sales, andthe main operating concern is macroeconomic stability, followed by hostcountry restrictions on operations. Japanese DFI performance indeveloping countries, characterized by a relatively high proportion ofminority owned firms and local market sales, has been as much a reflec-tion of host country policy as firm strategy. As Japanese DFI shifts toindustries characterized by rapid technological change, developingcountry bargaining power to impose restrictions and performance require-ments will diminish.
JAPANUSE DIRECT FOREIGN INVESTMENT
TABLE OF CONTENTS
Page No.
I. INTRODUCTION .... 1*. ... .. oo... .. e 1
II. OVERALL TRENDS OF JAPANESE DIRECT FOREIGN INVESTMENT ...... 3
A. Growth of Japanese DFI 3B. Japanese Share in VJorld DFI Flows 4.................. 4C. Future Prospects of Japanese DPI ..........-........... 5
III. SECTORAL AND REGIONAL DISTRIBUTION OF JAPANESE DFI ......... 8
A. Sectoral Distribution 8B. Regional Distribution . ................. ............ 12Co Conclusion ............................................ 21
IV. CHARACTERISTICS OF JAPANESE DFI ............................ 24
A. Nature of Investors ...... ..... .... ...... *..... 24B. Objectives of Japanese DFI ............................ 29C. Difficulties Perceived by Japanese Firms in
DFI Operation ..... ....... .................... 31D. Ownership Patterns of Japanese DFI .................... 31E. Market Destination of Japanese Manufacturing
Subsidary .............. *...... **..e.. *..**** .... 35F. Management Style of Japanese Subsidiaries ............. 37G. Japanese Government Influence on Private DFI .......... 38H. Conclusion ... .. *........ *...*.*..*... ... aa*.. 39
V. SUMMARY AND IMPLICATIONS FOR DEVELOPING COUNTRIES .......... 41
REFERENCES .................................. ***.*.*.*.*** 44
Table of Cont.nts (Continued)
LIST OF TALES IN TEXT
Table 11.1 Share of Japanese DEI in World FlowsTable 11.2 DFI Stocks as Proportion of National Economy, 1986
Table 11.3 Impact of Yen Appreclation on Japanese Firms'DFI Decisions, FY86
Table 11.4 Future Prospect of Japanese DFI GrowthTable 111.1 Sectoral Share of Japanese DFI FlowsTable 111.2 Japanese WDI Flows to North America (By Country)Table 111.3 Japanese DFI Flows to North America (By Sector)Table 111.4 Japanese DPI Flows to EuropeTable 111.5 Japanese DFI Flows to AsiaTable 111.6 Japanese OFI Composition in Selected Asian
CountriesTable 111.7 Regional Distribution of Japanese DFI Flows
By Sector, FY76 and FY86Table IV.l DFI by Major CorporationsTable IV.2 Share of Small and Medium Investors in
Japanese OFI, FY73-85Table IV.3 Number of Subsidiaries by Type of Parenc Company,
FY85Table IV.4 Share of Sales Subsidiaries Among Total
Subsidiaries of Japanese ManufacturingCompanies, FY85
Table IV.5 Japanese DFI Objectives by Region, FY87Table IV.6 Problems in DFI Operation by RegionTable IV.7 Ownership Pacterns Among Japanese DFI
Affiliates, FY85Table IV.8 Market Destination of Japanese and U.S.
Manufacturing Subsidiaries
LIST OF CHARTS IN TEXT
Chart 11.1 Trends in Japanese DF; Flows, 1951-87Chart III.1 Sectoral Distribution of Japanese and U.S.
DFI StockChart III.2 Percentage Share of Merchandise ExportsChart 111.3 Regional Japanese DFI Flows by PeriodChart 111.4 Japanese OFI Flows to Latin AmericaChart IV.1 Important Factors in Selecting Overseas SitesChart IV.2 Ownership Patterns of Japanese DFI BY
Country, FY86Chart IV.3 Market Destination of Japanese and U.S.
Subsidiaries by RegionChart IV.4 Return on Investment of Foreign Manufacturing
Subsidiaries in the U.S.Chart IV.5 Financing Source of Japanese DFI
Table of Contents (Continued)
APPENDICES
APPENDIX 1 Japaneso DPI Definition and IndustryClassification
APPENDIX 2 Japanese DFI Flow by Sector and Region, 1965-1987.
APPENDIX 3 Japaaese DFI Flow by Country, 1980-1987
APPENDIX 4-1 Geographical Distribution of U.S. DFI Stock,1959-1987
APPENDIX 4-2 Sectoral Distribution of U.S. DFI Stockby Region, 1977 and 1986
APPENDIX 5 Financial Incentives for Japanese DFI

I. INTRODUCTION
1.01 Within the past 20 years, Japan has becom the zost importantdynamic source of global direct foreign investment (DFI). In annual DFIflows, Japan has already taken the global lead. Excluding reinvestedearnings, Japanese DFI flows in 1987 totalled $33.4 billion, compared to$9.5 billion by the United States.1/ Japan has accumulated $139.3 billionin DPI stock, the second largest in the world, following the $308.8 billionstock of the U.S.
1.02 Major Incentives for rapid expansion of Japanese DFI are: theattractiveness of overseas, particularly dollar-based, investments in thewake of the yen revaluation; the enduring Japanese trade surplus, andthrect of protectionist measures against Japanese exports in key markets;and an evolving domestic industrial policy emphasiziag the structural andcost benefits of offshore production. As Japanese firms plan their globalproduction and distribution strategies around direct foreign investment,Japan could meet or exceed in twenty years the stock that took the U.S.more than eighty years to build.
1.03 Japanese firms have been participating in direct investmentabroad since the 1950s, with DPI concentrated on developing countries.About half of Japanese DFI went to developing countries in the 1970s,compared to 25X by the U.S. and 18% by the U.K. In the past decade,Japanese DFI has shifted to developed countries, notably the U.S. and theEuropean Community. A. pronounced sectoral shift has occurred from invest-ment in natural resources and light assembly to intermediace manufacturing,and more recently to commercial, financial and other services. EarlyJapanese DFI differed from western investmenr in the active role played byJapanese general trading companies, participation by small and mediumfirms, emphasis on long-term expansion of market share rather than maximiz-ing profits in the short run, and the influence of Japanese governmentpolicy. However, recent patterns of Japanese DFI have tended to convergewith DFI patterns from western sources.
1.04 This report examines patterns of Japanese DFI and its implica-tions for developing countries. It analyzes the driving forces behindregional and sectoral patterns, assesses potential Japanese DFI in develop-ing countries, and identifies the factors affecting this potential. Thereport identifies factors that have motivated Japanese DFI and describesthe problems investors have faced, with the purpose of helping countriesevaluate Japanese DPI. While there are both positive and negative aspects
1/ The 1987 U.S. net change in DFI position was US$49.2 billion. U.S.flow data (yearly change in net DFI position) include reinvested earn-ings, whereas Japanese data do not. Japanese statistics are based onnotifications and authorizations, not actual flows. Stock figures arecalculated by summing up notifications and auchorizations to a givenpoint in time. In contrast, U.S. official data are based on actualstock positions, and flows are derived from changes in stock. Thus,the two data sources are not strictly comparable, and care should betaken in their evaluation. See Appendix 1 for data and methodologicaldetails.
-2-
associated with OPI from the host country's perspective, the report doesnot attempt to evaluate the overall impact of Japanese DFI, such as income,employment, and technology transfer offects, in developing economies. Dataon DFI perforuance at the regional level, such as export performance, doprovide insight into general trends--some of which may be contrary toconventional wisdom.
1.05 Chapter 11 provides a historic overview of Japanese DPI flows,and Chapter III examines sectoral and regional patterns. The analysis inboth chapters relies on.official Japanese government statistics, the onlysource of detailed information on Japanese DPI. Chapter IV analyzesJapanese firms' motivation, management goals, and performance in DFI, basedon surveys by the Japanese government and private institutions. The roleof the Japanese government in private DPI also is analyzed. Chapter Vprovides a summary of findings and implications for developing countries.Appendixes contain methodological notes and caveats, and comprehensive dataon Japanese DFI.
(D-264c/2)

- 3 -
UI. OVERALL TRENDS OF JAPANESE DIRECT FOREIGN INVESTMENT
A. Growth of Japanese DFI
2.01 For 25 years after the Second World War, Japan concentrated itsavailable resources on domestic reconstruction. Japan's economy andforeign trade had the characteristics of a developing economy, and bo._ -X-Log abroad continued until the aid 1960se Japanese governmnt policiz. ondirect foreign investmnt were restrictive due to capital scarcity, concernabout capital outflow, and the possible negative foreign exchange impact ofoverseas activities.
2.02 As Japan's economy grew and the balance of payments improved, theGovernment took measures to encourage DFI in the late 1960. and early1970s. These policies and improved economic conditions helped Japanese OtIgrow rapidly (Chart 11.1). From 1971 to 1973, DFI flows exceeded all DPIstock ac.-amulated in previous years. Th4 pattern of growth was interruptedby the first oil price upheaval in 1974. In the 1980a, after recoveringfrom the second oil price shock, Japanese DPI experienced another upturn.In fiscal 1984, the annual flow of DPI exceeded US$10 billion for the firsttim. In 1986 it exceeded t'3$20 billion, and in 1987, DFI flows wereUS$33.4 billion. While the number of investments has increased modestly,the average investment amount has grown dramatically; between 1971 and1980, the average Japanese DFI was about US$2 million, by 1984 it was USS4million, and in 1987 almost US$8 million.
CHART 11.1 TRENDS IN JAPAN DFi fLOWS, 1951-1987
S billion S million
4-0 -10
35 _ ANNUAL DFI FLOWS (US 3 billion)_ - AVERAGE SIZE OF D1I (US S million) 8
30
25 6
204.
15
102
5
0 0
1951-70 71727374757677787980.81828384858687
Source: Public Finance and Financial Statistics. Ministry of Finance.
- 4-
s. Japanese Share in World DFI Flows
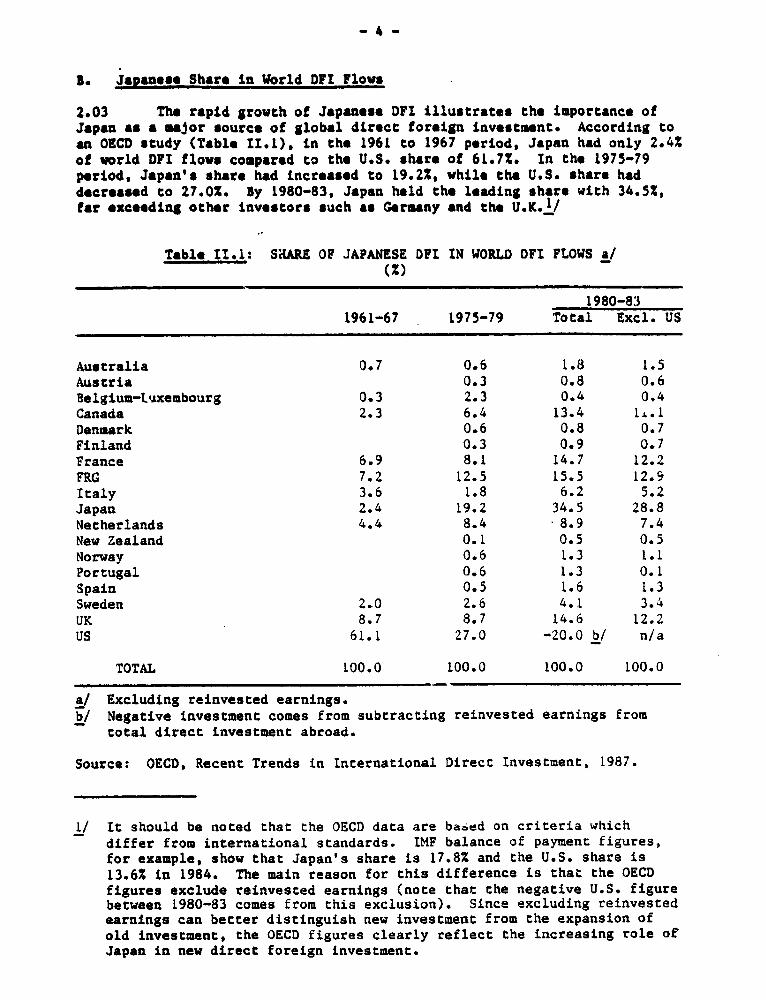
2.03 The rapid growth of Japanese DFI illustrates the importance ofJapan as a major source of global direct foreign investment. According toan OECD study (Table 1I.1), in the 1961 to 1967 period, Japan had only 2.4%of world DFI flovs compared to the U.S. share of 61.7%. In the 1975-79period, Japan's share had increased to 19.2%, while the U.S. share haddecreased to 27.0%. By 1980-83, Japan held the leading share with 34.5%,far *xceeding other investors such as Germany and the U.K.1/
Table 11.1: SHARE OF JAPANESE DPI IN WORLD DPI FLOWS a/(%)
1980-831961-67 1975-79 Total Excl. US
Australia 0.7 0.6 1.8 1.5Austria 0.3 0.8 0.6Belgium-tuxembourg 0.3 2.3 0.4 0.4Canada 2.3 6.4 13.4 1L.1Denmark 0.6 0.8 0.7Finland 0.3 0.9 0.7France 6.9 8.1 14.7 12.2ERG 7.2 12.5 15.5 12.9Italy 3.6 1.8 6.2 5.2Japan 2.4 19.2 34.5 28.8Netherlands 4.4 8.4 8.9 7.4New Zealand 0.1 0.5 0.5Norway 0.6 1.3 1.1Portugal 0.6 1.3 0.1Spain 0.5 1.6 1.3Sweden 2.0 2.6 4.1 3.4UK 8.7 8.7 14.6 12.2US 61.1 27.0 -20.0 b/ n/a
TOTAL 100.0 100.0 100.0 100.0
a/ Excluding reinvested earnings.b/ Negative investment comes from subtracting reinvested earnings from
total direct investmenc abroad.
Source: OECD, Recent Trends in International Direct Investment, 1987.
1/ It should be noted that the OECD data are based on criteria whichdiffer from international standards. IMF balance of payment figures,for example, show that Japan's share is 17.8% and the U.S. share is13.6% in 1984. The main reason for this difference is that the OECDfigures exclude reinvested earnings (note that the negative U.S. figurebetween 1980-83 comes from this exclusion). Since excluding reinvestedearnings can better distinguish new investment from the expansion ofold investment, the OECD figures clearly reflect the increasing role ofJapan in new direct foreign investment.
s
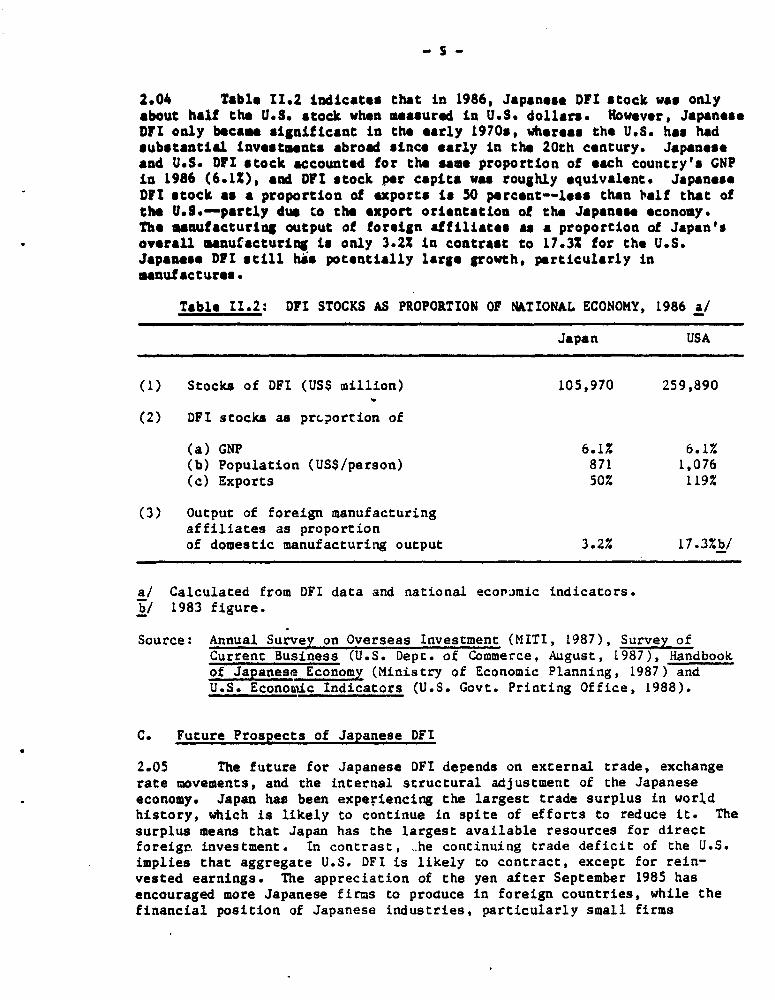
2.04 Table 11.2 indicates that in 1986, Japanese DFI stock was onlyabout half the U.S. stock when measured in U.S. dollars. However, JapaneseDJI only became significant in the early 1970s, whereas the U.S. has hadsubstantial investmsnts abroad since early in the 20th cantury. Japaneseand U.S. DFI stock accounted for the same proportion of each country's GNPln 1986 (6.1%), and DII stock per capita was roughly equivalent. JapaneseDFI stock as a proportion of exports is 50 percent--less than balf that ofthe U.S.--partly due to the export orientation of the Japanese economy.The manufacturing output of foreign affiliates as a proportion of Japan'soverall manufacturing is only 3.2% in contrast to 17.3% for the U.S.Japanese DFI still his potentially large growth, particularly inmanufactures.
Table 11.2: DFI STOCKS AS PROPORTION OF NATIONAL ECONOMY, 1986 a/
Japan USA
(1) Stocks of DFI (USS million) 105,970 259,890
(2) DFI scocks as prcporrion of
(a) GNP 6.1% 6.1%(b) Population (USS/person) 871 1,076(c) Exports 50% 119%
(3) Output of foreign manufacturingaffiliates as proportionof domestic manufacturing output 3.2% 17.3%b/
a/ Calculated from DFI data and national ecor'mic indicators.b/ 1983 figure.
Source: Annual Survey on Overseas Investment (MITI, 1987), Survey ofCurrent Business (U.S. Dept. of Commerce, August, 1987), Handbookof Japanese Economy (Ministry of Economic Planning, 1987) andU.S. EconotLic Indicators (U.S. Govt. Printing Office, 1988).
C. Future Prospects of Japanese DFI
2.05 The future for Japanese DFI depends on external trade, exchangerate movements, and the internal structural adjustment of the Japaneseeconomy. Japan has been experiencing the largest trade surplus in worldhistory, which is likely to continue in spite of efforts to reduce it. Thesurplus means that Japan has the largest available resources for directforeigr investment. In contrast, .he continuing trade deficit of the U.S.implies that aggregate U.S. DFI is likely to contract, except for rein-vested earnings. The appreciation of the yen after September 1985 hasencouraged more Japanese firms to proauce in foreign countries, while thefinancial position of Japanese industries, particularly small firms

Involved in export activities, has been deteriorating. Table 11.3 showsthe effect of the appreciation of the yen on Japanese firms' plans toLavest abroad. About 55Z of sampled firms say that the currency apprecia-tion will expedite their decision to go overseas. In processing andfabricating industries (e.g., electronics, transportation equipment, othermachinery), the impact of currency appreciation appears even stronger.
2.06 The Japanes sconoWy is In the process of substantial structuraladjustment. Japan, which has encouraged exports while restricting domesticconsumption, faces severe internal end external problems. A new program toencourage direct foreign investment was implemented in the aid 1980s. TheGovernment's Structural Adjustment Committee suggested in a report thatJapan should encourage DFI to promote dotestic efficiency and to reduce theexternal imbalance.
Table 11.3: IMPACT OF YEN APPRECIATION ON JAPANESE FIRMS'DFI DECISIONS, FY1986
(Survey result of Japanese firms)
Will Will ConsiderExpedite DFI Additional DFI NoDecisions After Analysis Influence
Total Manufacturing 55.5% 4.3% 40.5%Basic Materials 43.2% 3.8% 53.0%Processing/Fabrication 61.7% 4.8% 33.5%
Source: Annual Survey on Overseas investment (MITI, 1986).
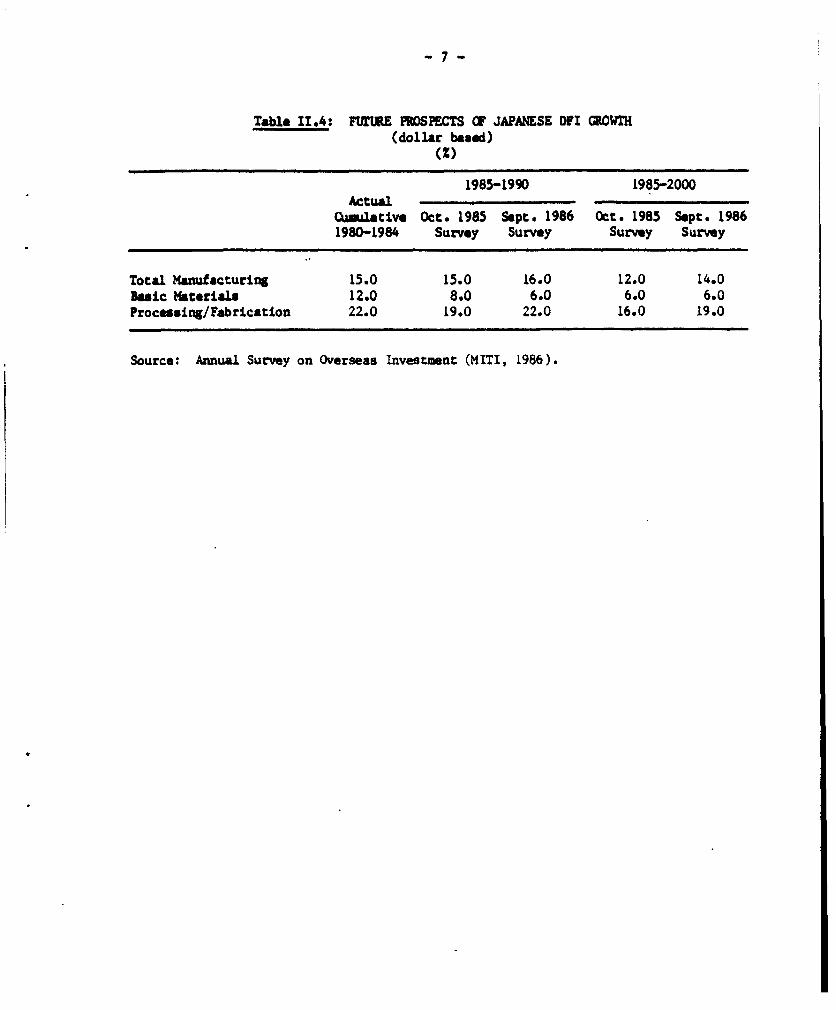
2.07 If external and internal conditions do not change, Japanese DFIis likely to maintain its growth. A survey of Japanese firms' expectationsof DFI growth supports this view in the short cerm (Table 11.4). The DFIgrowth rate for manufacturing in 1980-84 (15%) is expected to continue inthe 1985-90 period, mainly from growth in the processing and fabricatingindustries (19% to 22%). Reflecting longer-term uncertainties in theglobal economy, the projection for 1990-2000 shows slower growth rates inmanufacturing (12% to 14%), particularly in basic materials (6% to 8%).
- 7 -
Table 11.4: FUIURE FROSPECTS CF? JAPANESE DFI GROWTH(dollar based)
(x)
1985-1990 1985-2000Actualaumlative Oct. 1985 Sept. 1986 Oct. 1985 Sept. 1986
1980-1984 Survey Survey Survey Survey
Total Manufacturing 15.0 15.0 16.0 12.0 14.0Basic Materials 12.0 8.0 6.0 6.0 6.0Procesing/Fabrication 22.0 19.0 22.0 16.0 19.0
Source: Annual Survey on Overseas Investment (MITI, 1986).
- 8 -
III. SECTORAL AND REGIONAL DISTRIBUTION OF JAPANESE DFI
A. Sectoral Distribution
3.01 Before 1970, Japanese direct foreign investment was concentratedIn primary natural resources and, to a lesser extent, in labor intensivesecondary manufacturing. With few natural resources of its own, Japan hasbeen heavily dependent on securing resources abroad. MITI indicates thatJapan resains reliant on external sources for virtually all its rawmaterials, especially oil, iron ore, natural gas, copper, aluminum, andtin. By the mid-1960s, Japanese growth in natural resource-consumingindustries such as steel, shipbuilding and petrochemicals had advanced tothe point where arms-length imports alone could not assure a supply ofraw material. Direct foreign investment in raw materials was seen as anecessary element of a strategy to increase Japan's security in suppliesand as insurance against commodity import price fluctuations.
3.02 Japan also invested abroad in technologically standardized,labor-intensive industries such as textiles, metal products and other lightmanufactures. These investments reflected domestic labor shortages, whichbegan in the mid-1960s, and high wage costs relative to developingcountries. Early foreign ventures were initiated primarily by small andmedium manufacturing firms. These firms lacked the managerial skill andexpertise necessary to operate in foreign countries, and thus elected toform joint ventures with local or other foreign counterparts. In additionto the natural resource and labor-intensive manufacturing sectors, sometertiary commercial and service investment was made by general tradingcompanies, mainly to promote exports.
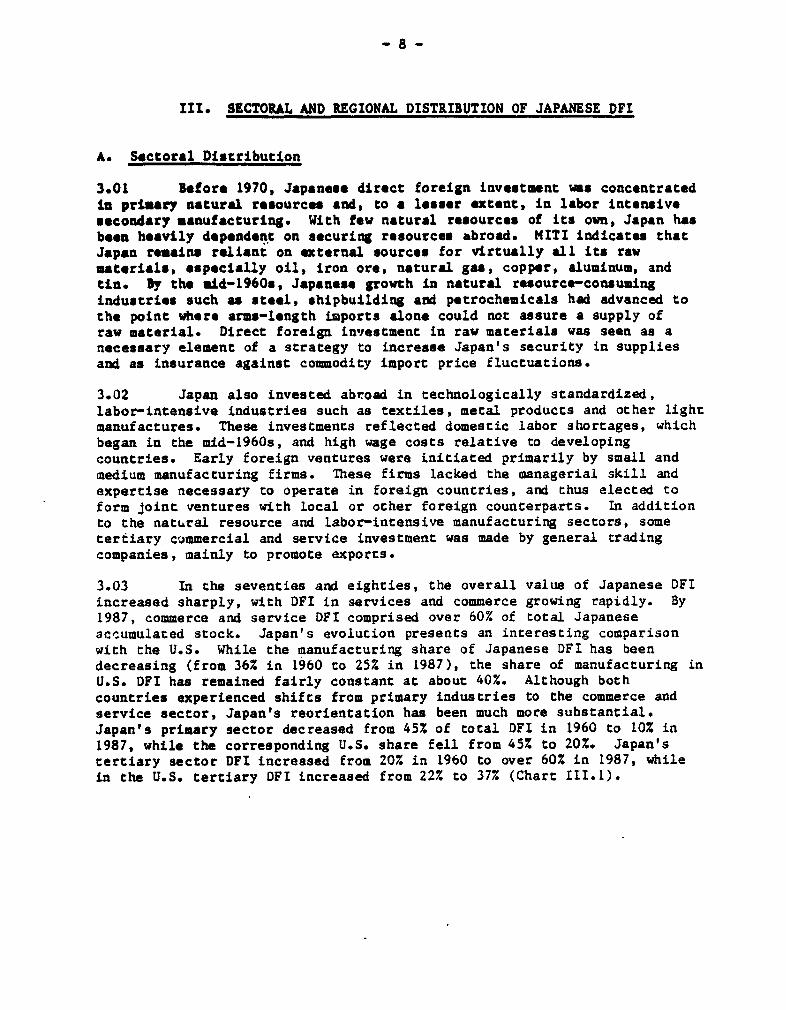
3.03 In the seventies and eighties, the overall value of Japanese DFIincreased sharply, with DFI in services and commerce growing rapidly. By1987, commerce and service DFI comprised over 60% of total Japaneseaccumulated stock. Japan's evolution presents an interesting comparisonwith the U.S. While the manufacturing share of Japanese DFI has beendecreasing (from 36% in 1960 to 25% in 1987), the share of manufacturing inU.S. DPI has remained fairly constant at about 40%. Although bothcountries experienced shifts from primary industries to the commerce andservice sector, Japan's reorientation has been much more substantial.Japan's primary sector decreased from 45% of total DFI in 1960 to 10% in1987, while the corresponding U.S. share fell from 45% to 20%. Japan'stertiary sector DFI increased from 20% in 1960 to over 60% in 1987, whilein the U.S. tertiary DFI increased from 22% to 37% (Chart II.1).
-9-
CHART 111.1 SECTORAL DISTRIBUTION OF JAPAN AND U.S. DFI STOCKSECTORAL PARTNERS SECTORAL PARTNERS
JAF"ANESE DFI U. O eF
80
20
20
60 65 70 75 80 83 84 85687 60657075 348586 87- PERCENT PRIMARY r PERCENT SECONOARY m PERCENT TERTIARY
- S ECTOR SECTOR 'iSECTOR
Note: Industry groups are defined as follows. Primary: agriculture,forestry, mining and fisheries. Secondary: manufacturing. Tertiary;commerce, financial services, real estate, transportation, miscellaneousservices.
Source: Ministry of Trade and Industry, Statistic on Direct ForeignInvestment. U.S. Department of Commerce, Survey of CurrentBusiness.
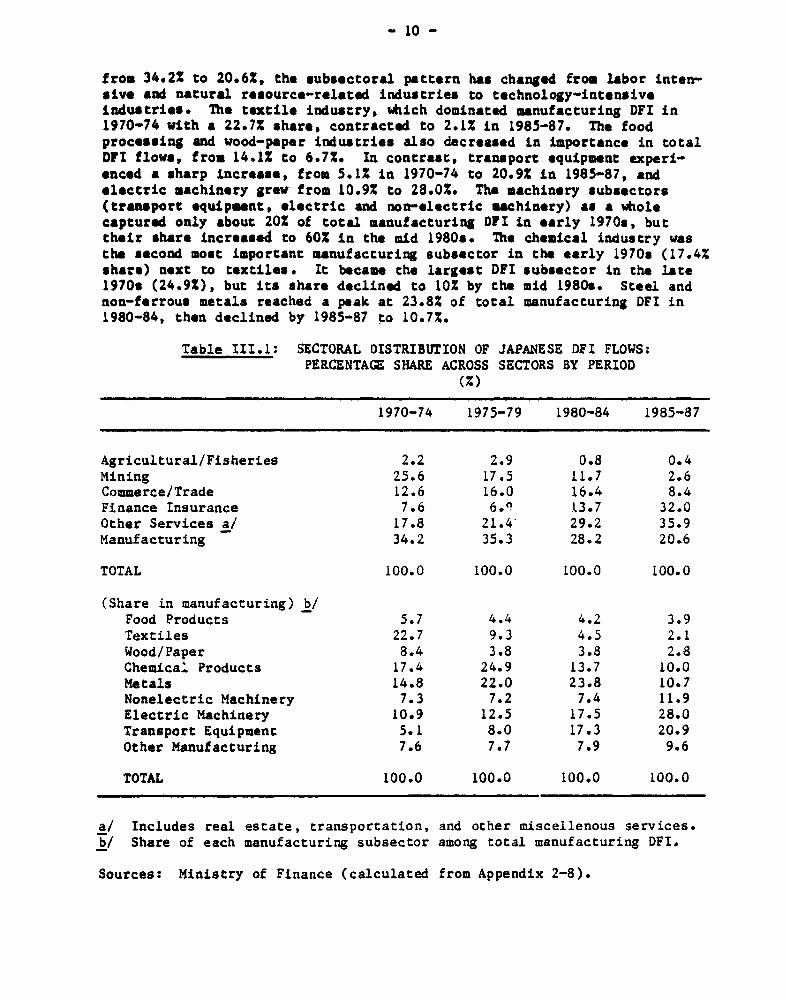
3.04 The dramatic shift in the sectoral distribution of Japanese DFIis more visible if examined in terms of subsectoral flows (Table III.1)1/The proportion of DEl devoted to mining plus agriculture and fisheryactivities dropped from 27.8% to 3.0% of total DFI between 1970-74 and1985-87, while commerce and trade remained roughly constant. The greatestproportional increase occurred in the finance and insurance sectors, whichgrew from 7.6% in 1970-74 to 32.0% of all OFI in 1985-87. Other services,including real estate and transportation also grew, from 17.8% in 1970-74to 35.9% of the 1985-87 total. In the manufacturing sector, which declined
1/ Note the difference between "flow" figures and "stock" figures.Throughout the chapter, flow figures are used to show dynamicallychanging patterns of DFI while stock figures are used to providecomparison with U.S. data (e.g., chart III.1). See Appendix 1 for acomparison of Japanese and U.S. DFI methodologies.
- 10 -
from 34.22 to 20.6%, the subsectoral pattern has changed from labor inten-sive and natural resource-related industries to technology-intensiveindustries. The textile industry, which dominated manufacturing DFI in1970-74 with a 22.7% share, contracted to 2.1% in 1985-87. The foodprocessing and wood-paper industries also decreased in importance in totalDFI flows, from 14X1X to 6.7%. In contrast, transport equipment experi-enced a sharp increase. from 5.1% in 1970-74 to 20.92 in 1985-87, andelectric machinery grew from 10.9% to 28.02. The machinery subsectors(transport equipment, electric and non-electric machinery) as a wholecaptured only about 202 of total manufacturing DPI in early 1970s, buttheir share increased to 60% in the mid 1980s. The chemical industry wasthe second most important manufacturing subsector in the early 1970s (17.4%share) next to textiles. It became the largest DFI subsector in the late1970s (24.92), but its share declined to 10% by the mid 1980t. Steel andnon-ferrous metals reached a peak at 23.8% of total manufacturing DFI in1980-84, then declined by 1985-87 to 10.7%.
Table III.1: SECTORAL DISTRIBUTION OF JAPANESE DFI FLOWS:PERCENTAGE SHARE ACROSS SECTORS BY PERIOD
(Z)
1970-74 1975-79 1980-84 1985-87
Agricultural/Fisheries 2.2 2.9 0.8 0.4Mining 25.6 17.5 11.7 2.6Commerce/Trade 12.6 16.0 16.4 8.4Finance Insurance 7.6 6.9 13.7 32.0Other Services a/ 17.8 21.4 29.2 35.9Manufacturing 34.2 35.3 28.2 20.6
TOTAL 100.0 100.0 100.0 100.0
(Share in manufacturing) b/Food Products 5.7 4.4 4.2 3.9Textiles 22.7 9.3 4.5 2.1Wood/Paper 8.4 3.8 3.8 2.8Chemical Products 17.4 24.9 13.7 10.0Metals 14.8 22.0 23.8 10.7Nonelectric Machinery 7.3 7.2 7.4 11.9Electric Machinery 10.9 12.5 17.5 28.0Transport Equipment 5.1 8.0 17.3 20.9Other Manufacturing 7.6 7.7 7.9 9.6
TOTAL 100.0 100.0 100.0 100.0
a/ Includes real estate, transportation, and other miscellenous services.b/ Share of each manufacturing subsector among total manufacturing DFI.
Sources: Ministry of Finance (calculated from Appendix 2-8).
- 11 -
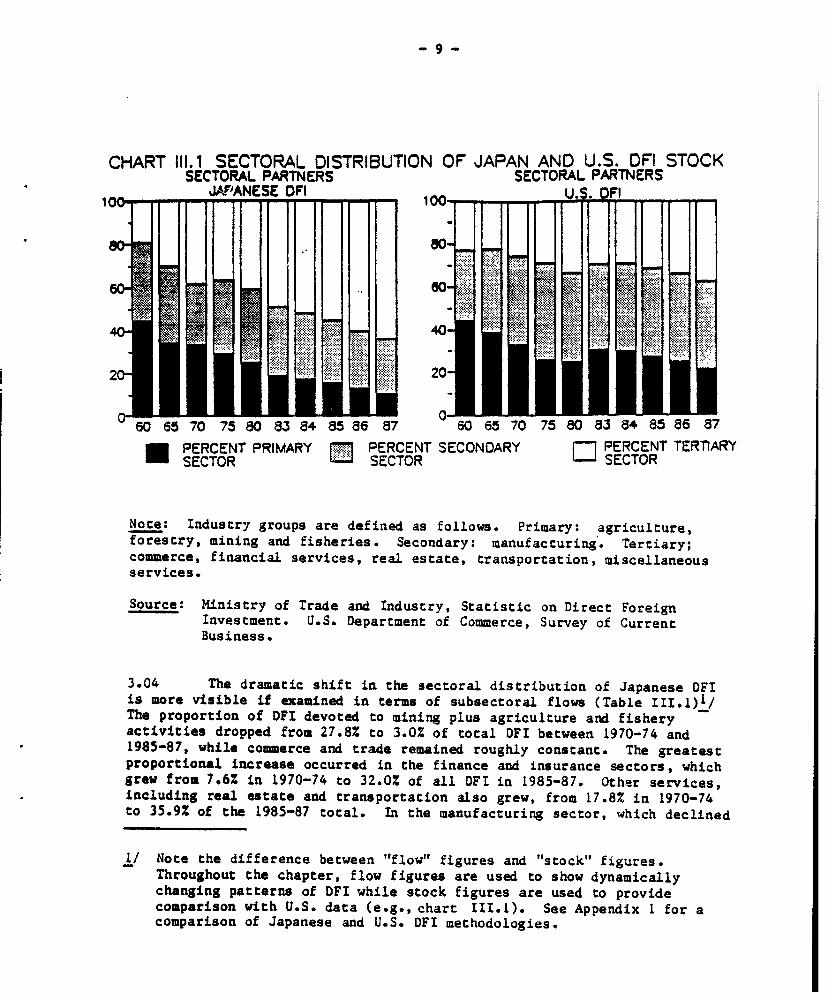
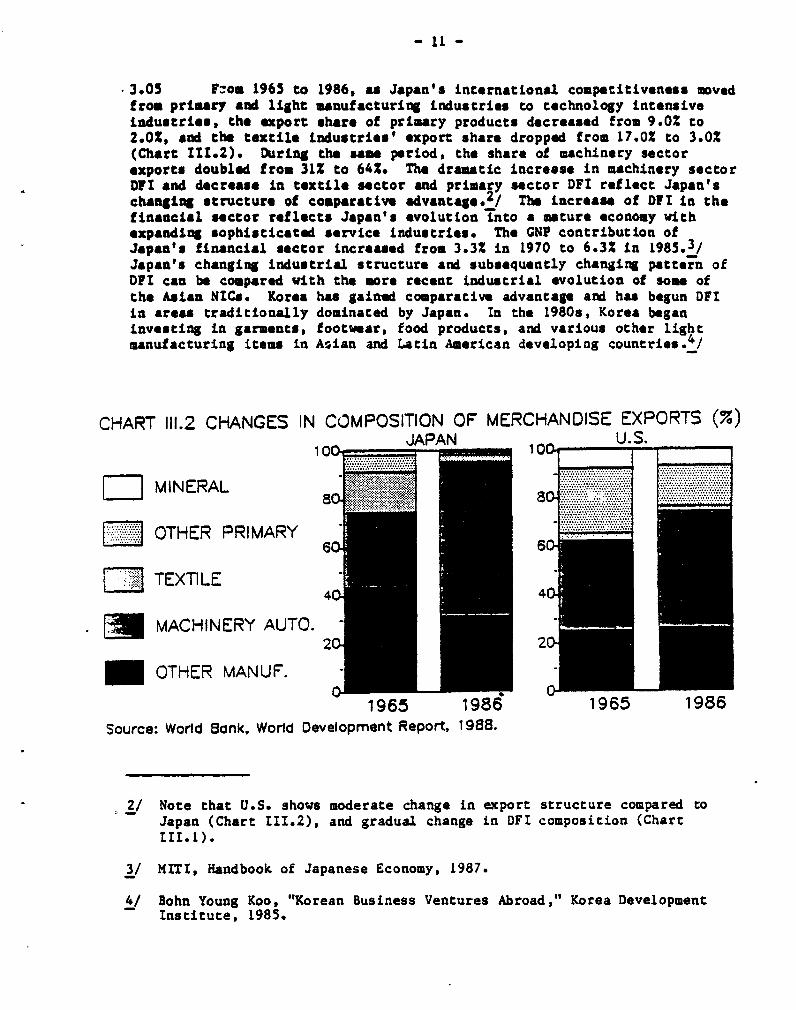
3.05 F-om 1965 to 1986, as Japan's international competitiveness movedfrom primary and light manufacturing Lndustries to technology intensiveindustries, the export share of primary products decreased from 9.0% to2.0%, and the textile industries' export share dropped from 17.0% to 3.0%(Chart 111.2). During the sme period, the share of machinery sectorexports doubled frou 312 to 64%. The draatic increase in machinery sectorDYI and decrease in textile sector and primary sector DFI reflect Japan'schanging structure of comparative advantage.2/ The increase of Oft in thefinancial sector reflects Japan's evolution into a mature economy withexpanding sophisticated service industries. The GNP contribution ofJapan's financial sector increased from 3.3% in 1970 to 6.3% in 1985.3/Japan's changing industrial structure and subsequently changing pattern ofOFI can be compared with the more recent industrial evolution of som ofthe Asian NICs. Korea has gain-d comparative advantage and has begun DFIin areas traditionally dominated by Japan. In the 1980s, Korea beganinvesting in garments, footwear, food products, and various other lightmanufacturing items in Asian and Latin American developing countries.4/
CHART 111.2 CHANGES IN COMPOSITION OF MERCHANDISE EXPORTS (%)10 ~ JAPAN 10.U.S.10C 10C
MINERAL
OTHER PRIMARY 66~~~~~~~
C TEXTILE
MACHINERY AUTO.
OTHER MANUF.
1965 1986 1965 1986Source: World Bank. World Development Report, 1988.
2/ Note that U.S. shows moderate change in export structure compared toJapan (Chart III.2), and gradual change in DFI composition (ChartIII.1).
3/ MITI, Handbook of Japanese Economy, 1987.
4/ Bohn Young Koo, "Korean Business Ventures Abroad," Korea DevelopmentInstitute, 1985.
- 12 -
B. RAgional Distribution
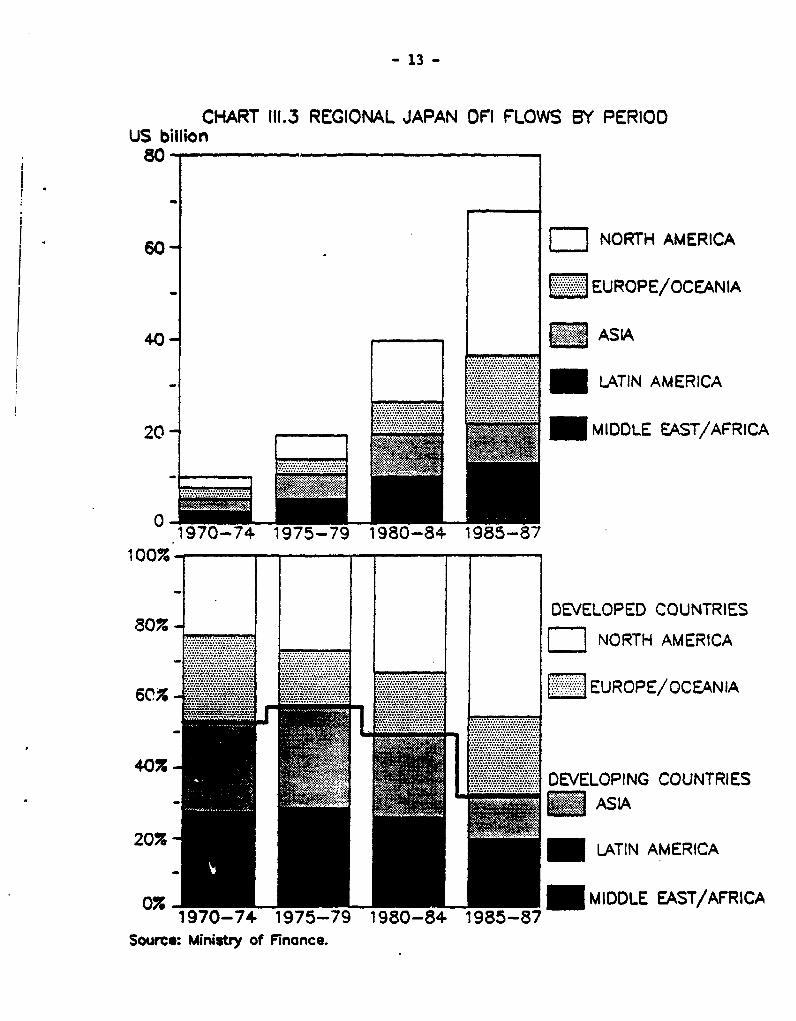
3.06 In the eighties, the trend of Japanese DFI flows has been awayfrom developing markets and into irdustrialized countries (Chart 111.3).The share of DFI flows to developing countries has fallen by almost 20%,from 52.32 in 1970-74 to 32.0% in 1985-87.5/ U.S. foreign investment, incontrast, has overwhelmingly favored developed countries (see Appendix 4,Table 1). The proportion of U.S. OFt in doveloping countries reached 44%in 1959, but by 1970 the share fell to 27% aud has not exceeded 25% since.In 1987, U.S. DFI to developing countries amounted to 23%, or US$71 billionout of a total stock of US$305 billion.
3.07 The bulk of Japanese DYI growth since 1970 has beon in NorthAmerica, which between 1985-87 accounted for 46% of Japanese global flows,double the 23% share in the 1970-74 period. The value of flow to NorthAmerica more than doubled, from US$13 billion in 1980-84 to US$31 billionin 1985-87. Europe, with 18% of the total in 1985-87, saw flows more thandouble between 1980-84 and 1985-87. Asia had a slight decrease in thevalue of flown but saw its global share drop by almost half, from 24% to13%. Latin America had a slight decrease in global share but experienced asignificant increase in flow value, from US$7 billion to US$12 billion.Oceania had Little change in share but a modest increase in flow value,while both Africa and the Middle East experienced serious erosion in bothglobal share and value of DFI flows during the 1980s.
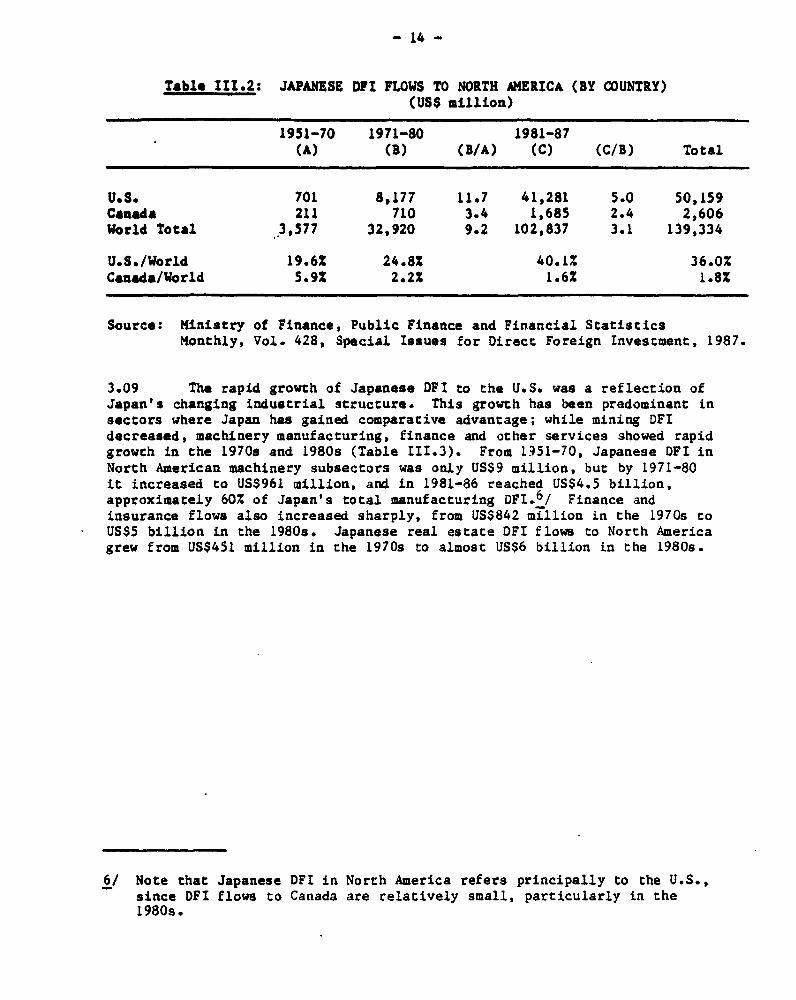
3.08 The vast majority of Japanese DFI destined for North America hasgone to the U.S. (Table II1.2). From 1951-87, the U.Sd- received USSS0billion, or 36% of global DPI flows, while Canada received only aboutUS$2.6 billion. Japanese DFI to the U.S. in the 1980s has been growing ata rate well above that of- Japanese DFI worldwide. The U.S. share of worldflows increased from 20% on average before 1970 to 40% in the 1980s; in1987 the share was 44% (see Appendix 3 for specific year flow figures bycountry). Canada was an important host country for Japanese DFI flows inthe earlier period (5.9% global share in 1951-70), but recently itsrelative attractiveness, based primarily on nacural.resources, hasdecreased (1.6% global DFI share in 1981-87).
5/ If DFI in offshore banking and flagship rights in the Caribbean andAfrica are excluded, developing countries share in 1985-87 dropped toless than 20% (see paragraph 3.13).
- 13 -
CHART 111.3 REGIONAL JAPAN DFI FLOWS BY PERIODUS billion
so-
NORTH AMERICA
- E: EUROPE/OCEANIA
40- C03ASIA
U .LATIN AMERICA
20 - MIDDLE EAST/AFRICA
1970-74 1975-79 1980-84 1985-87100% -I -
DEVELOPED COUNTRIES80%H o%W - NORTH AMERICA
_~~~~~~~~~~...... ....
I... ............ _.. EUROPE/OCEANIA
60%
.. DEVELOPING COUNTRIES
207_ LATIN AMERICA
0S _ - ~~~~~~~~MIDDLE EAST/AFRICA0x 1970-74 1975-79 1980-84 1985-87
Source: Ministry of Finance.
- 14 -
Table 111.2: JAPANESE DFI FLOWS TO NORTH AMERICA (BY COUNTRY)(US$ million)
1951-70 1971-80 1981-87(A) (B) (B/A) (C) (C/B) Total
U.S. 701 8,177 11.7 41,281 5.0 50,159Canada 211 710 3.4 1,685 2.4 2,606World Total 3,577 32,920 9.2 102,837 3.1 139,334
U.S./World 19.6% 24.8% 40.1% 36.0%Canada/World 5.92 2.22 1.6% 1.8%
Source: Ministry of Finance, Public Finance and Financial StatisticsMonthly, Vol. 428, Special Issues for Direct Foreign Investment, 1987.
3.09 The rapid growth of Japanese DFI to the U.S. was a reflection ofJapan's changing industrial structure. This growth has been predominant insectors where Japan has gained comparative advantage; while mining DFIdecreased, machinery manufacturing, finance and other services showed rapidgrowth in the 1970s and 1980s (Table 111.3). From 1351-70, Japanese DFI inNorth American machinery subsectors was only US$9 million, but by 1971-80it increased to US$961 million, and in 1981-86 reached US$4.5 billion,approximately 60% of Japan's total manufacturing DFI. 6 / Finance andinsurance flows also increased sharply, from US$842 million in the 1970s toUS$5 billion in the 1980s. Japanese real estate DFI flows to North Americagrew from US$451 million in the 1970s to almost US$6 billion in the 1980s.
6/ Note that Japanese DFI in North America refers principally to the U.S.,since DFI flows to Canada are relatively small, particularly in the1980s.

- 15 -
Table 111.3: JAPANESE DPI FLOWS TO NORTH AMERICA (BY SECTOR)(USS million)
1951-70 1971-80 1981-86 FY1951-86(A) (B) (B/A) (C) (C/B) Total
Manufacturing 217 2,211 10.2 7,477 3.4 9,915(Machinery) 9 961 106.8 4,503 4.7 5,473(Other Manufacturing) 208 1,250 4.5 2,974 2.4 4,432Mining 176 402 2.3 680 1.7 1,260Trade and Sales 306 3,189 10.4 4,974 1.6 8,479finance/Insurance 110 841 7.6 5,300 6.3 6,259Real Estate 34 451 13.3 5,755 12.8 6,253
Total 912 8,886 9.7 27,608 3.1 37,416
Source: Ministry of Finance (see Table 1114).
3.10 Two other factors have accelerated the rapid growth of JapaneseDFI in the U.S. First, a significant amount of manufacturing DFI was madeto reduce existing and potential trade friction caused by Japan's largetrade surplus with the U.S. In sectors particularly sensitive to protec-tionist pressures, such as automobiles, steel and electronics, productionin the U.S. market became a necessary strategy for many Japanese firmsconcerned with maintaining market share. Largely due to import quotas(referred to as voluntary restraint arrangements, or orderly marketingagreements) introduced by the U.S. in 1981, Japanese annual DFI in theautomobile sector increased from approximately USS20 million between1978-80 to US$200 million between 1981-83. In the steel sector, officialquotas imposed in 1984 led to a quadrupling of Japanese DFI. Similar traderestrictions resulted in increased Japanese DFI in the U.S. electronicssector, where many types of formal and informal trade arrangements existedbetween the U.S. and Japan in the 1970s and 1980s.
3.11 Second, the rapid appreciation of the yen against the dollar,beginning in 1985, created a strong incentive for investments in realestate and financial establishments. Investments in the banking, financialand insurance sectors facilitated the surge of Japanese portfolio anddirect foreign investment. Manufacturing investments also benefitted;Japanese firms made greenfield investments and stock acquisitions in U.S.companies to take advantage of the favorable exchange rate.
3.12 Europe, particularly the U.K., was a more important destinationthan North America for Japanese DFI during the 1950s and 1960s (Table111.4), with certain European countries receiving over 20% of globalJapanese DFI flows. DFI in these countries increased sharply during the1980s, influenced by the appreciation of the yen and increased tradefriction with European partners. The U.K. continued to be the principaltarget during the 1970s and 1980s, absorbing 5% of global Japanese DFIflows. Between 1986 and 1987, flows to the U.K. more than tripled,
- 16 -
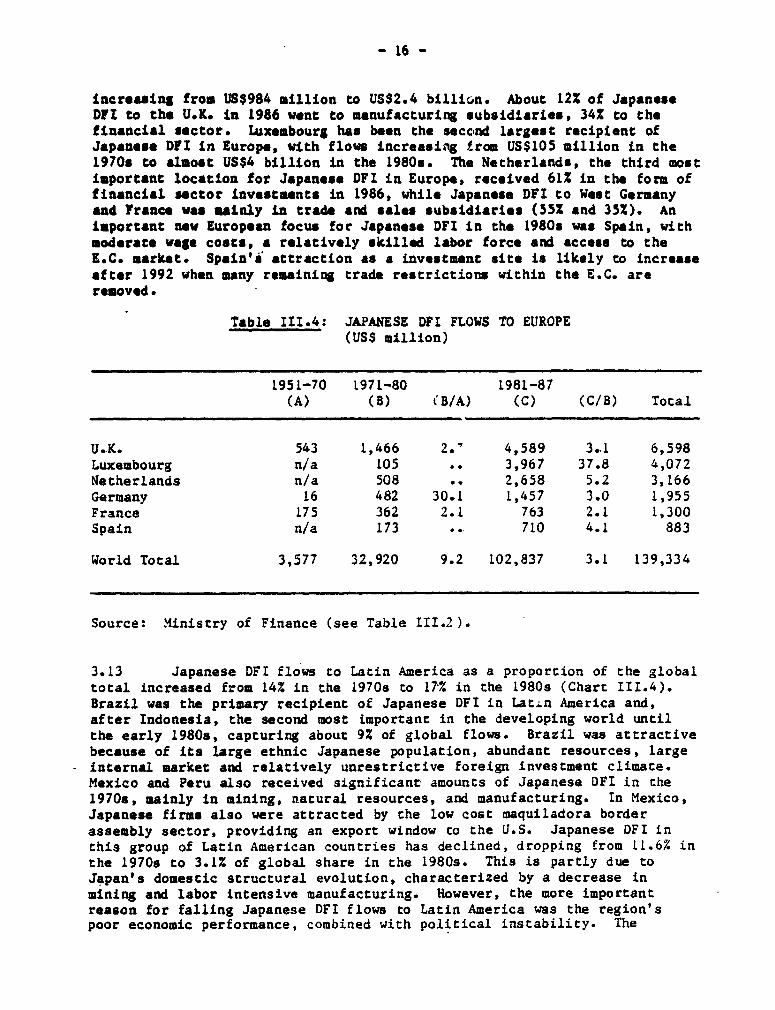
increasing from US$984 million to US$2.4 billion. About 12% of JapaneseDFI to the U.K. in 1986 went to manufacturing subsidiaries, 34% to chefinancial sector. Luxembourg has been the secc,nd largest recipient ofJapanese DFI in Europe, with flows increasing trom US$105 million in the1970s to almost US$4 billion in the 1980s. The Netherlands, the third mostimportant location for Japanese DFI in Europe, received 612 in the form offinancial sector investments in 1986, while Japanese DFI to West Germanyand France wa mainly ln trade and sales subsidiaries (35% and 352). Animportant new European focus for Japanese DFI in the 1980s was Spain, withmoderate wage costs, a relatively skilled labor force and access to theK.C. market. Spain'i attraction as a investment site is likely to increaseafter 1992 when many remaining trade restrictions within the E.C. areremoved.
Table III.4: JAPANESE OFI FLOWS TO EUROPE(USS million)
1951-70 [971-80 1981-87(A) (B) (B/A) (C) (C/B) Total
U.K. 543 1,466 2.' 4,589 3.,1 6,598Luxembourg n/a 105 . 3,967 37.8 4,072Netherlands n/a 508 2,658 5.2 3,166Germany 16 482 30.1 1,457 3.0 1,955France 175 362 2.1 763 2.1 1,300Spain n/a 173 710 4.1 883
World Total 3,577 32,920 9.2 102,837 3.1 139,334
Source: Ministry of Finance (see Table III.2).
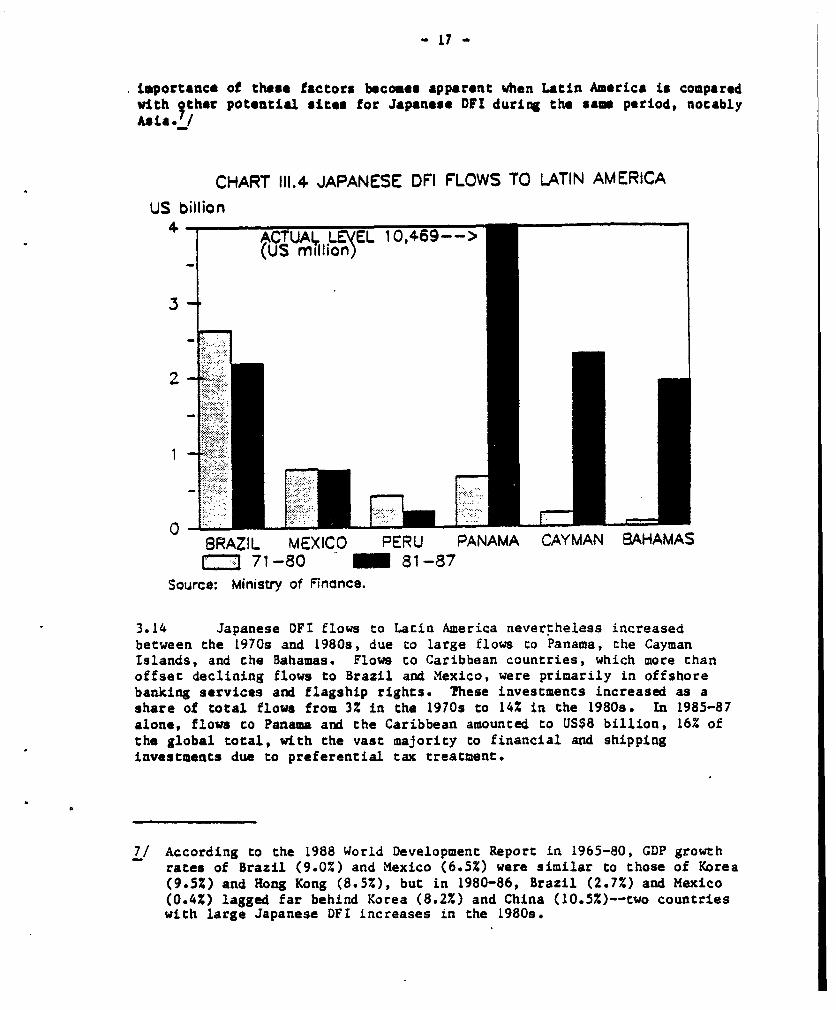
3.13 Japanese DFI flows to Latin America as a proportion of the globaltotal increased from 14% in the 1970s to 17% in the 1980s (Chart III.4).Brazil was the primary recipient of Japanese DFI in Latin America and,after Indonesia, the second most important in the developing world untilthe early 1980s, capturing about 9% of global flows. Brazil was attractivebecause of its large ethnic Japanese population, abundant resources, largeinternal market and relatively unrestrictive foreign investment climate.Mexico and Peru also received significant amounts of Japanese DFI in the1970s, mainly in mining, natural resources, and manufacturing. In Mexico,Japanese firms also were attracted by the low cost maquiladora borderassembly sector, providing an export window to the U.S. Japanese DFI inthis group of Latin American countries has declined, dropping from 11.6% inthe 1970s to 3.1% of global share in the 1980s. This is partly due toJapan's domestic structural evolution, characterized by a decrease inmining and labor intensive manufacturing. However, the more importantreason for falling Japanese DFI flows to Latin America was the region'spoor economic performance, combined with political instability. The
- 17 -
importance of these factors becomes apparent when Latin America is comparedwith gther potential sites for Japanese DFI during the same period, notablyAsia.
CHART 111.4 JAPANESE DFI FLOWS TO LATIN AMERICAUS billion
ACTUAL. L EL 10,469-->(US million
C --BAI E-'BRAZIL MEXICO PERU PANAMA CAYMAN BAHAMAS
71-80 81-87aource: Ministry of Finance.
3.14 Japanese DFI flows to Latin America nevertheless increasedbetween the 1970s and 1980s, due to large flows to Panama, the CaymanIslands, and the Bahamas. Flows to Caribbean countries, which more thanoffset declining flows to Brazil and Mexico, were primarily in offshorebanking services and flagship rights. These investments increased as ashare of total flows from 3% in the 1970s to 14% in the 1980s. In 1985-87alone, flows to Panama and the Caribbean amounted to US$8 billion, 16% ofthe global total, with the vast majority to financial and shippinginvestments due to preferential tax treatment.
7/ According to the 1988 World Development Report in 1965-80, GDP growthrates of Brazil (9.0%) and Mexico (6.5%) were similar to those of Korea(9.5%) and Hong Kong (8.5%), but in 1980-86, Brazil (2.7%) and Mexico(0.4%) lagged far behind Korea (8.2%) and China (10.5X)--two countrieswith large Japanese DFI increases in the 1980s.
- 18 -
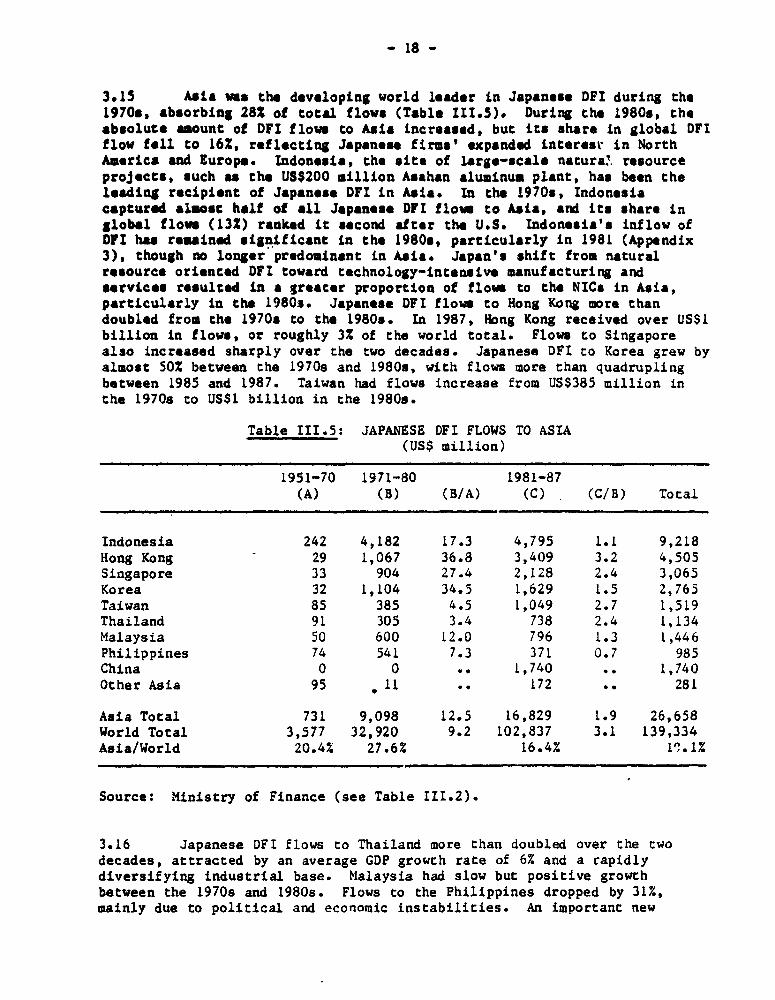
3.15 Asia was the developing world leader in Japanese DFI during the1970s, absorbing 28% of total flows (Table 111.5). During the 1980s, theabsolute amount of DFI flows to Asia increased, but its share in global OFIflow fell to 16%, reflecting Japanes firms' expanded interest in NorthAmerica and Europe. Indonesia, the site of large-scale natura. resourceprojects, such as the US$200 million Asahan aluminum plant, has been theloading recipient of Japanese DFI in Asia. In the 1970s, Indonesiacaptured almost half of all Japanese DPI flow to Asia, and its share inglobal flow (132) ranked it second after the U.S. Indonesia's inflow ofDPI has resained significant in the 1980s, particularly in 1981 (Appendix3), though no longer predominant in Asia. Japan's shift from naturalresource oriented DFI toward technology-intensive manufacturing andservices resulted in a greater proportion of flow to the NICs in Asia,particularly in the 1980-. Japanese DFI flows to Hong Kong more thandoubled from the 1970s to the 1980s. In 1987, Hong Kong received over US$1billion in flows, or roughly 3% of the world total. Flows to Singaporealso increased sharply over the two decades. Japanese DFI to Korea grew byalmost 50% between the 1970s and 19809, with flows more than quadruplingbetween 1985 and 1987. Taiwan had flows increase from US$385 million inthe 1970s to US$1 billion in the 1980s.
Table III.5: JAPANESE DFI FLOWS TO ASIA(US$ million)
1951-70 1971-80 1981-87(A) (B) (B/A) (C) (C/B) Total
Indonesia 242 4,182 17.3 4,795 1.1 9,218Hong Kong - 29 1,067 36.8 3,409 3.2 4,505Singapore 33 904 27.4 2,128 2.4 3,065Korea 32 1,104 34.5 1,629 1.5 2,765Taiwan 85 385 4.5 1,049 2.7 1,519Thailand 91 305 3.4 738 2.4 1,134Malaysia 50 600 12.0 796 1.3 1,446Philippines 74 541 7.3 371 0.7 985China 0 0 .. 1,740 .. 1,740Other Asia 95 . 11 . 172 .. 281
Asia Total 731 9,098 12.5 16,829 1.9 26,658World Total 3,577 32,920 9.2 102,837 3.1 139,334Asia/World 20.4% 27.6% 16.4% 19.1%
Source: Ministry of Finance (see Table II1.2).
3.16 Japanese DFI flows to Thailand more than doubled over the twodecades, attracted by an average GDP growth rate of 6% and a rapidlydiversifying industrial base. Malaysia had slow but positive growthbetween the 1970s and 1980s. Flows to the Philippines dropped by 31%,mainly due to political and economic instabilities. An important new
- 19 -
recipient of Japanes. DFI was the People's Republic of China, Flows toChina began in 1984; by 1987 China had 4% of the global total, aboutUS$1.2 billion out of US$33.4 billion. This was mainly attributed to theChinas economy's rapid growth (annual GDP growth rate of 10.52 in1980-86), large potential market, and the government's relatively openpolicy toward DFI.
3.17 The composition of Japanese OFt in key Asian countries variedaccording to the economic strengths of the host country (Table ItI.6).8/About 902 of Japan*s" subsidiaries set up in Korea in the 19709 were in themanufacturing sector. The share dropptd to about 802 in the 1980s, butmanufacturing wae still dominant. Taiwan, similar to Korea, has receivedabout 70-80X in the' mnufacturing sector. In Thailand, the manufacturingsector has absorbed about half of Japanese DFI in that country, and thecombined share of commerce and trade sector has been 20%. Some 10% ofinvestment has gone to mining, agriculture and const uction. Malaysiashowed a similar pattern to Thailand but is notable for the increasingshare of DFI in its construction sector (from 3.9% in the 1970s to 15.1% inthe 1980s) and for the decreasing share in its manufacturing sector.
3.18 Hong Kong has had dominance in the commerce, trade and financialsectors (about 60X) with a share of 16% to 22% in the manufacturingsector. Singapore also has had dominance in commerce, trade and finance(about 30% to 502). Compared with Hong Kong, Singapore has received alarger share of manufacturing (30% to 48%) and construction (12%) DFI.Singapore irs also significant for the financial sector's increase in share(from 6.4% in the 1970s to 15.4% in the 1980s) and the sharp decrease inDFI in the manufacturing sector (from 48% to 34%). In Indonesia, theleading sector has been the manufacturing sector (about 60%). Mining,agriculture and construction sectors togeaher have had a relatively largeshare (about 20%). In China, beginning in the 1980s, the main sectors forDFI have been manufacturing (51%) and construction (13%).
3.19 Leading manufacturing subsectors for Japanese DFI in most Asiancountries in the 1970s were electrical machinery, cextiles and cnemicals(Table III.6). In Korea, Taiwan, Hong Kong and Malaysia these were the topthree sectors, but Asian countries, in general, had comparative advantagein these sectors in the 1970s. The only exception is Singapore, whosenegligible textile share indicated a lack of comparative advantage intextiles. In the 1980s, the textile industry dropped from among the topsubsectors in almost every country except China. In Korea, Taiwan,Singapore and Thailand, more capital and technology intensive subsectorssuch as transport equipment and general machinery replaced textiles andchemicals. The direction of Japanese DFI toward electrical machinery couldbe observed in two broad groups: its share dropped in Korea, Taiwan andSingapore but increased in Thailand, Malaysia and Indonesia. Chemicalproducts and other basic material industries, including metals, decreasedin share in the 1980s but were still significant in many Asian countries.
8/ DFI composition used in this section is derived from the number ofinvestments. It can be regarded as an indirect indicator of sectoraldistribution of DFI amount.
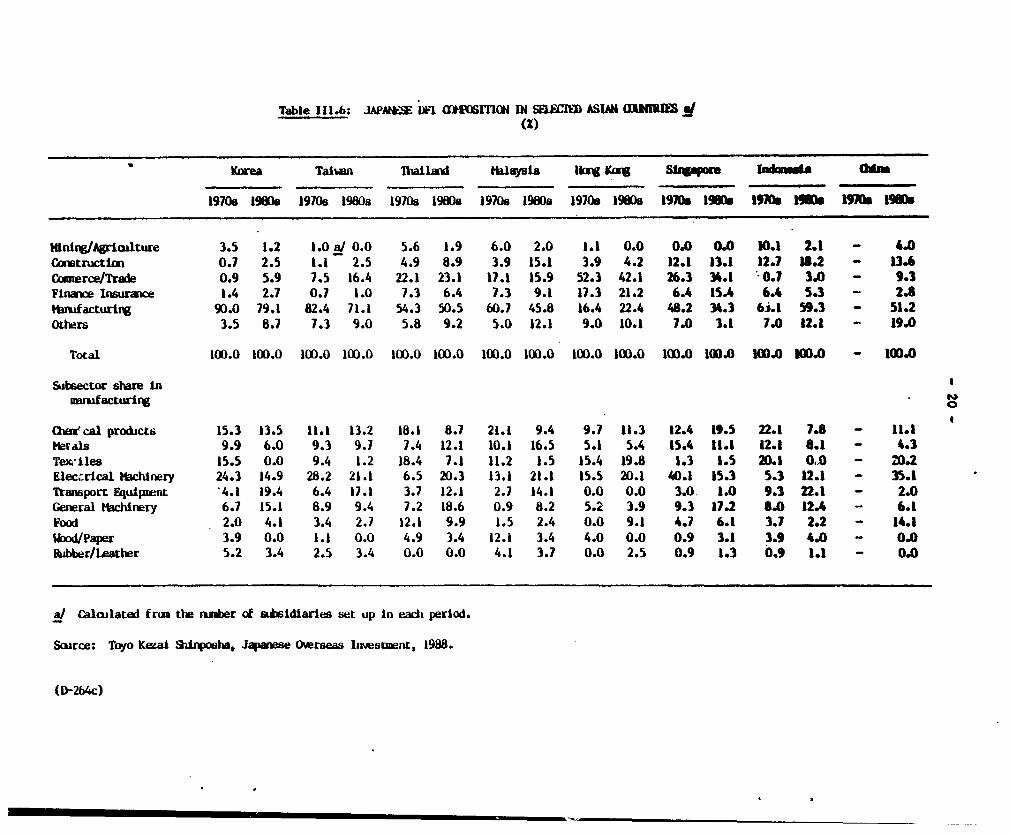
Table 111.6: JAPAN.E UF1 O1fM 1T1S 4 IN SECIM ASWIM 1 NIU (Z)
Korea Tai1n lbailld h.laysa lIkwg e SiaUqbo Idm Gum
1970. 196O0 1970s 1980s 1970s M9e08 1970. 1980e 19700 9e 1970l9hs 1970 19W) 1910 19S00
mining/hgriul.ture 3.5 1.2 1.0 a/ 0.0 5.6 1.9 6.0 2.0 1.1 0.0 0.0 0.0 10.1 2.1 - 4.0
mstnuctioE 0.7 2.5 1.1 2.5 4.9 8.9 3.9 15.1 3.9 4.2 12.1 13.1 12.7 18.2 - 13.6
Caerce/Trade 0.9 5.9 7.5 16.4 22.1 23.1 17.1 15.9 52.3 42.1 26.3 34.1 0.7 3.0 - 9.3
Finane Insurance 1.4 2.7 0.7 1.0 7.3 6.4 1.3 9.1 17.3 21.2 6.4 ISA 6.4 5.3 - 2.8
hmuacturtig 90.0 79.1 82.4 71.1 54.3 50.5 60.7 45.8 16.4 22.4 48.2 34.3 6j.1 59.3 - 51.2
Others 3.5 8.7 7.3 9.0 5.8 9.2 5.0 12.1 9.0 10.1 7.0 3.1 7.0 12.1 - 19.0
Total 100.0 100.0 100.0 100.0 100.0 100.0 100.0 100.0 100.0 100.0 100.0 100.0 100.0 100.0 - 100.0
Subsector share inDarufacturirg
O z:cal proicts 15.3 13.5 11.1 13.2 18.1 8.7 21.1 9.4 9.7 11.3 12.4 19.5 22.1 7.8 - 11.1
metals 9.9 6.0 9.3 9.7 7.4 12.1 10.1 16.5 5.1 5.4 15.4 11.1 12.1 6.1 - 4.3
Tex iles 15.5 0.0 9.4 1.2 18.4 7.1 11.2 1.5 15.4 19.8 1.3 1.5 20.1 0o.n - 20.2
Elec.rical Machinery 24.3 14.9 28.2 21.1 6.5 20.3 13.1 21.1 15.5 20.1 40.1 15.3 5.3 12.1 - 35.1
Transport Equipment '4.1 19.4 6.4 17.1 3.7 12.1 2.7 14.1 0.0 0.0 3.0 1.0 9.3 22.1 - 2.0
General Machinery 6.7 15.1 8.9 9.4 7.2 18.6 0.9 8.2 5.2 3.9 9.3 17.2 8.0 12.4 - 6.1
Food 2.0 4.1 3.4 2.7 12.1 9.9 1.5 2.4 0.0 9.1 4.7 6.1 3.7 2.2 - 14.1
WJoodJPaper 3.9 0.0 1.1 0.0 4.9 3.4 12.1 3.4 4.0 0.0 0.9 3.1 3.9 4.0 - 0.0
Rkbber/Leather 5.2 3.4 2.5 3.4 0.0 0.0 4.1 3.7 0.0 2.5 0.9 1.3 0.9 1.1 - 0.0
al Calculated fro the amber of aisidiaries set up in eadc period.
Source: Toyo Kezal Sinposha, Jqapese Overseas Irvestent, 198B.
(D-264c)
- 21 -
3.20 Japanese DFI to Oceania has been dosinated by Australia, whichcaptured an average 6S of global DPI from 1951-80. The absolute value of
Japanese DPI to Australia almost doubled from the 1970s to the 1980s, butthe global share dropped to 3%. Although a significant amount of DFIcontinues in mining (33% of subsidiaries in 1986) and other naturalresources, Australia is also absorbing significant amounts of manufacturingDFI (21x). In Africa, Japanese DPI flows have bean very low, with the
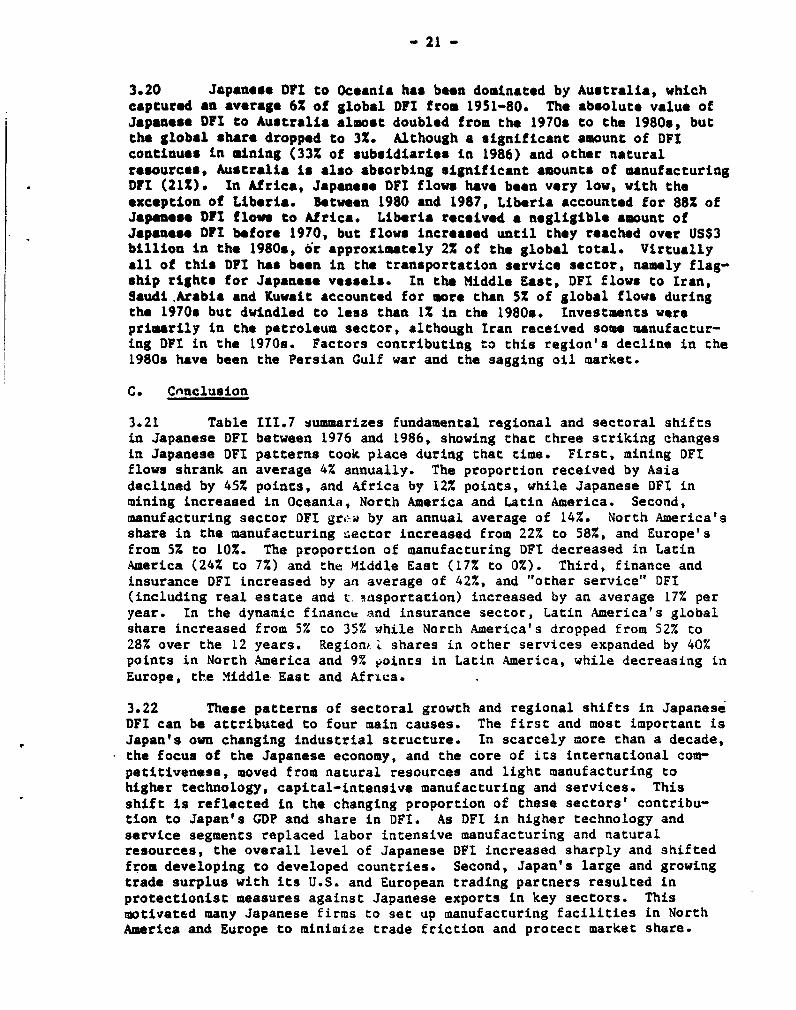
exception of Liberia. Between 1980 and 1987, Liberia accounted for 88% ofJapanese DPI flows to Africa. Liberia received a negligible amount ofJapacese DFI before 1970, but flows increased until they reached over US$3billion in the 1980s, or approximately 2% of the global total. Virtuallyall of this DFI has been in the transportation service sector, namely flag-ship rights for Japanese vessels. In the Middle East, DFI flows to Iran,Saudi Arabia and Kuwait accounted for more than 52 of global flows duringthe 1970s but dwindled to less than 1% in the 1980s. Investments wereprimarily in the petroleum sector, although Iran received some manufactur-ing DFI in the 19709. Factors contributing to this region's decline in the1980s have been the Persian Gulf war and the sagging oil market.
C. Cnnclusion
3.21 Table 111.7 summarizes fundamental regional and sectoral shiftsin Japanese DFI between 1976 and 1986, showing that chree striking changesin Japanese DFI patterns took place during that time. First, mining DFIflows shrank an average 4% annually. The proportion received by Asiadeclined by 45% points, and Africa by 12% points, while Japanese DFI inmining increased in Oceania, North America and Latin America. Second,manufacturing sector DFI gr- by an annual average of 14%. North America'sshare in the manufacturing iector increased from 22% to 58%, and Europe'sfrom 5% to 10%. The proportion of manufacturing OFt decreased in LatinAmerica (24% to 7%) and the Middle East (17% to 0%). Third, finance andinsurance DFI increased by an average of 42%, and "other service" DFI(including real estate and t. -asportation) increased by an average 17% peryear. In the dynamic finance and insurance sector, Latin America's globalshare increased from 5% to 35% while North America's dropped from 52% to28% over the 12 years. Regions Z shares in other services expanded by 40%points in North America and 9% points in Latin America, while decreasing in
Europe, the M4iddle- East and Africa.
3.22 These patterns of sectoral growth and regional shifts in JapaneseDFI can be attributed to four main causes. The first and most important isJapan's own changing industrial structure. In scarcely more than a decade,
the focus of the Japanese economy, and the core of its international com-petitiveness, moved from natural resources and light manufacturing tohigher technology, capital-intensive manufacturing and services. Thisshift is reflected in the changing proportion of these sectors' contribu-tion to Japan's GDP and share in DFI. As DFI in higher technology andservice segments replaced labor intensive manufacturing and naturalresources, the overall level of Japanese DFI increased sharply and shiftedfrom developing to developed countries. Second, Japan's large and growingtrade surplus with its U.S. and European trading partners resulted inprotectionist measures against Japanese exports in key sectors. Thismotivated many Japanese firms to set up manufacturing facilities in NorthAmerica and Europe to minimize trade friction and protect market share.

- 22 -
Table 111.7: REGIONAL DISTRIBUrION OF JAPANESE DFI FLOWS BY SECTOR, FY1976(% share)
Agriculture/ Comm rce/ Finance/Fisheries Mining Manuf. Trade Insurance Other a/ Total
North America 18.8 3.3 21.7 56.3 51.8 17.2 21.6Europe 0.0 0.7 4.8 23.1 30.9 16.7 9.7Oceania 21.9 0.5 4.1 2.7 1.8 12.2 4.7
Total; DevelopedCountries 40.6 4.5 30.6 82.1 84.5 46.1 36.0
Asia 32.8 80.3 27.8 9.9 10.0 9.4 36.0Latin America 20.3 2.7 24.1 7.7 4.5 10.6 12.1Middle East 0.0 0.5 17.2 0.2 0.9 13.2 8.0Africa 6.3 11.9 0.4 0.0 0.0 20.7 7.9
Total: DevelopingCountries 59.4 95.5 69.4 17.9 15.5 53.9 64.0
World Total 100.0 100.0 100.0 100.0 100.0 100.0 100.0
rEGIONAL DISIRIBUION OF JAPANESE DFI FLOWS BY SECTOR, FY1986(% share)
Agriculture/ Commerce/ Finance/Fisheries Mining Manuf. Trade Insurance Other a/ Total
North America 26.1 17.6 57.8 56.3 28.4 57.0 46.8Europe 0.0 4.0 9.7 20.9 31.5 4.6 15.5Oceania 13.0 28.8 4.0 4.5 1.3 5.4 4.4
Total: DevelopedCountries 39.1 50.5 71.5 81.6 61.2 67.0 66.8
Asia 13.0 35.6 21.1 11.3 4.0 9.0 10.4Latin America 30.4 13.9 7.2 7.0 34.8 20.0 21.2Middle East 0.0 0.0 0.0 0.0 0.0 0.5 0.2Africa 17.4 0.0 0.2 0.0 0.0 3.4 1.4
Total: DevelopingCountries 60.9 49.5 28.5 18.4 38.8 33.0 33.2
World Total 100.0 100.0 100.0 100.0 100.0 100.0 100.0
a/ Includes real estate, transporcation, and other miscellaneous service DFI.
Source: MITI, 1987 Survey.
- 23 -
3.23 Third, the rapid appreciation of the yen accelerated DFI flows tothe U.S. and, to a lesser extent, to Europe. Fourth, the relative economicperformance of developing cenuntries has led to regional shifts in JapaneseDFI. Poor economic performance among developing countries in Lacin Americaand Africa, and the declining economic importance of the Middle East, havediminished Japanese DFI flows to these regions. In many cases, economicdeterioration has been accompanied by political instability and risk. Theexceptions to the overall negative trend of Japanese DFI in these regionshave been rapidly growing tax-related financial and shipping rights invest-ments in Liberia, Panama and the Caribbean. At the same time, the strongeconomic performance of many Asian developing countries and NICs has drawnincreasing amounts of Japanese DFI, particularly in machinery and finance.
- 24 -
IV. CHARACTERISTICS OF JAPANESE DFI
A. Nature of Investors
4.01 Four types of Japanese firms are involved in direct foreigninvestment: general trading companies, small and modium scale firms, largemanufacturing enterprises and financial institutions. General tradingcompanies hold a pivotal place in the Japanese economy, having made largeoverseas investments themselves and acting as promoters of other firms'DFI. Small and medium scale firms-mostly manufacturing-activelyparticipated in DFI in the early 1970s, experienced some downturn there-after, but gained increasing importance after the currency appreciation.Major manufacturers, such as Sony and Nissan, have made DFI part of theirglobal strategy, and the role of such firms is increasing compared togeneral trading companies. Since 1985, insurance companies and banks havebeen large sources of Japanese DFI. About 30% of total Japanese DFI flowis in the finance and insurance sector (Chaptar III). Most of this DFI hasgone to expand portfolio and other financial activities in the U.S., theU.K. and some Caribbean countries, through acquisition or establishment ofsubsidiaries.l/ Since this report is primarily concerned with the impli-cations and trends of directly productive DFI in developing countries,further analysis of financial institutions will not be included in thissection.
4.02 General trading companies have been the leading multinationals inJapan's trading investment ventures (Table IV.1). In 1979, the cop fourforeign investors were general trading companies--namely, Mitsui & Co.,Mitsubishi Corporation, Marubeni Corporation and C. Itoh and Company. Ninetrading companies were among the 25 largest investors and had a share of55%. In 1987, Nissan Motor Company, which is not a general trading compa-ny, moved to second place. The share of general trading companies amongthe top 25 companies decreased to 48%, with the top four general tradingcompanies' share decreasing from 42% in 1979 to 28% in 1987. Althoughtheir share is decreaeing, trading companies still maintain an importantposition in japanese DFI, particularly if insurance companies are excluded.
4.03 Since the primary objective of general trading companies' invest-ment is to expand trade, a large share of their investment has been made toset up sales and import subsidiaries. About 60% of the subsidiaries ofgeneral trading companies are in sales and trade. General trading compa-nies, also invest in the manufacturing sector, often uncovering opportuni-ties to add value and expand sales through manufacturing activities. Forexample, in ASEAN countries, 45% of the subsidiaries of the general tradingcompanies are in manufacturing, while only 11 percent of Japanese subsidia-ries in the U.S. are engaged in manufacturing.
1/ In the U.S., for example, Nippon Life Insurance bought US$538 millionstock of Shearson Lehman Brothers, Inc. in 1987. In developingcountries such as Panama, the Cayman Islands and the Bahamas, forexample, Japanese financial sector DFI is attracted by preferential taxtreatment and other incentives encouraging offshore banking. It isquestionable how much of this DFI is subsequently filtered throughother sectors of the host country economy.

lable IV.1: DFI BY MAJOR CORPORATIONS(In Yen 100 million)
1 99 1 9 8 7 */
Cumulative CumulativeRanking Company Name Investment Ranking Company Name Investmnt
I Mitsui & Co * 2,353 1 Mitsubishi Corp * 6,0672 Mitsubishi Corporation * 1,581 2 Nissan Motor 3,9283 Marubeni Corporation * 1,552 3 Nisshi-Iwai * 3,7044 C. Itoh 6 Co. * 1,262 4 Harubeni Corp. * 3,3245 Japan Asahan Aluminium 870 5 Mitsui & Co.* 3,2446 Sumitoo Corporation * S88 6 Japan Asaban Aluminium 2,7227 Matsushita Electric Industries 674 7 Sumitamo Corp.* 2,3268 Nissan Motor 569 8 C. Itch 6 Co.* 2,2899 Nissho-Iwai * 569 9 Isuzu Motors 2,200
10 Toray 568 10 Mitsui Real Estate Development 1,70011 Tomen* 478 11 Tokyo Lease 1,52512 Honda Motor 439 12 Japan Oil Development 1,48613 Kawasaki Steel 422 13 Yoshida Kogyo 1,30814 Sanyo Electric 386 14 Sony 1,30115 Shin Nihon Steel 381 15 Nippon Kokan 1,16116 Sony 376 16 Nichimen Jitsugyo * 1,08917 Mitsubishi Heavy Industries 353 17 Nippon Amazon Aluminium 1,03918 Ishikawajima-Harima Heavy Industries 350 18 Kanematsu Gosho * 94319 KanematstA Copho * 340 19 Toshiba Corp. 92420 Japan Usiminus 325 20 Koto Oil Development 90021 Kawasaki Heavy Industries 314 21 Matsushita Electric 90022 Tokyo Kyuku Dentetsu 300 22 NEC Corp. 90023 Teijin 293 23 Tomen * 81324 Nichimen Jitsugyo * 289 24 Dianippon Ink & Chemical 78425 Tokyo Shib-ura Electric 282 25 Sharp 698
* General Trading Companies.a/ Exclude insurance companies and banks.
Source: K. Kojima and T. Ozawa "Japan's General Trading Companies" 1984.Toyo Kezai, "Japanese Overseas Investment 1988."
(D-264a)
- 26 -
4.04 Since general trading companies are major importers of naturalresources for Japan, they often engage in joint partnerships with majorconsumers for natural resource development projects. Trading companieshave the needed global information and marketing networks, and are able tomobilize major financing for projects that require large investment andsophisticated organizational skills. General trading companies alsosupport other Japanese investors through information gathering and dissemi-nation, loans, and organization of startup activities for less experiencedfirms.
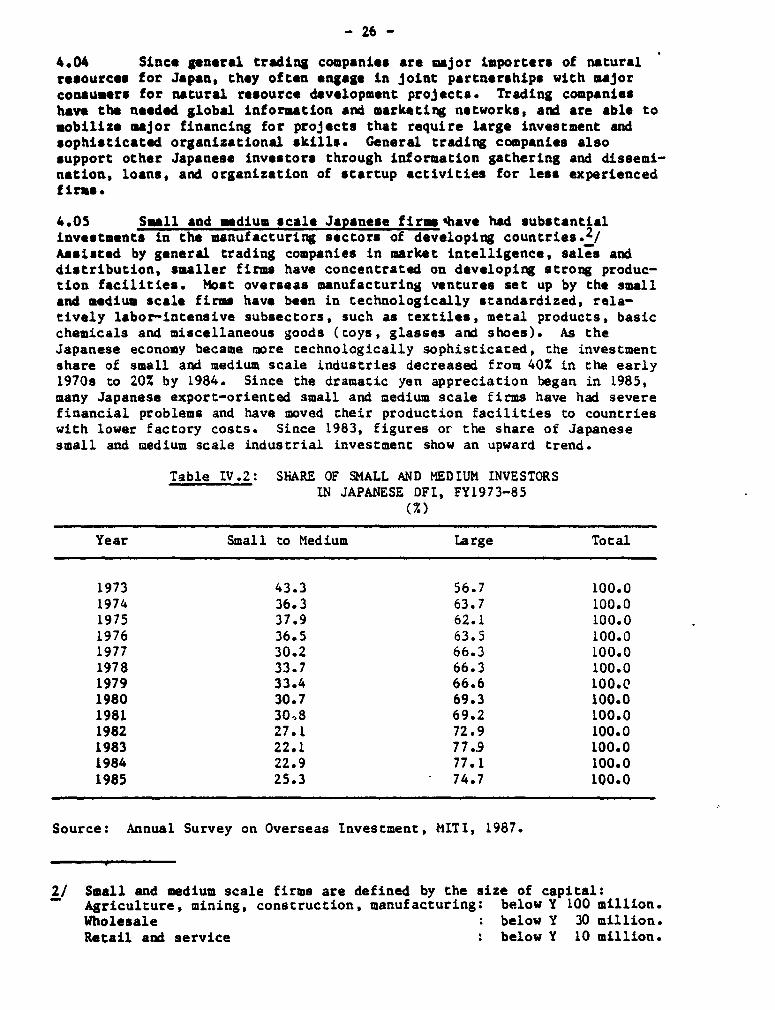
4.05 Small and medium scale Japanese firm 4have had substantialinvestments in the manufacturing sectors of developing countries.2/Assisted by general trading companies in market intelligence, sales anddistribution, smaller firms have concentrated on developing strong produc-tion facilities. Most overseas manufacturing ventures set up by the smalland medium scale firms have been in technologically standardized, rela-tively labor-intensive subsectors, such as textiles, metal products, basicchemicals and miscellaneous goods (toys, glasses and shoes). As theJapanese economy became more technologically sophisticated, the investmentshare of small and medium scale industries decreased from 40X in the early1970s to 20Z by 1984. Since the dramatic yen appreciation began in 1985,many Japanese export-oriented small and medium scale firms have had severefinancial problems and have moved their production facilities to countrieswith lower factory costs. Since 1983, figures or the share of Japanesesmall and medium scale industrial investment show an upward trend.
Table IV.2: ShARE OF SMALL AND MEDIUM INVESTORSIN JAPANESE DFI, FY1973-85
(x)
Year Small to Medium Large Total
1973 43.3 56.7 100.01974 36.3 63.7 100.01975 37.9 62.1 100.01976 36.5 63.5 100.01977 30.2 66.3 100.01978 33.7 66.3 100.01979 33.4 66.6 100.C1980 30.7 69.3 100.01981 30A8 69.2 100.01982 27.1 72.9 100.01983 22.1 77.9 100.01984 22.9 77.1 100.01985 25.3 74.7 100.0
Source: Annual Survey on Overseas Investment, MITI, 1987.
2/ Small and medium scale firms are defined by the size of capital:Agriculture, mining, construction, manufacturing: below Y 100 million.Wholesale : below Y 30 million.Retail and service : below Y 10 million.

- 27 -
4.08 Large manufacturing companies. As large Japanese manufacturingcompanies gained capabilities in gathering information, marketing, andsetting up production abroad, they expanded investment in foreign manufac-turing and distribution facilities. Major --rnational players are theautomobile companies (Nissan, Toyota, Honda) ctrical appliancecompanies (Sony, Toshiba), and steel and heav, .,.schinery companies (NipponKokan, Kawasaki Steel). The number of subsidiaries as of 1987 (Table IV.3)gives a rough indication of the relative importance of large manufacturingcompanies in Japanese DFI. Large manufacturing companies represent 3,148foreign subsidiaries, with an average of 4.7 subsidiaries per firm.Electric and electronics companies lead with 800 subsidiaries, followed byautomobile companies with 405 subsidiaries. Steel companies, representing167 subsidiaries, have the highest average number of subsidiaries per firm(15.2). The general trading companies have a total of 2,051 subsidiaries,and an average 7.2 subsidiaries per firm. Most small and medium scaleparent companies have only one subsidiary each.
Table IV.3: NUMBER oF SUBSIDIARES BY TYPE OF PARENT 0MPANY, FY1985
Small and MediumSectors Large Companies Scale Firms Total
Agriculture, Fishery, Forest 60 (8.6) 12 (1.5) 72 (4.8)Mining 42 (1.9) 0 (0.0) 42 (1.9)Construction 188 (3.8) 8 (4.0) 196 (3.8)Manufacturing total 3,148 (4.7) 28" (1.2) 3,435 (3.8)
Food products 104 (3.1) 20 (1.3) 124 (2.5)Textiles 210 (6.0) 18 (1.2) 228 (4.6)Wood products 45 (2.0) 6 (1.0) 51 (1.8)Chemicals 388 (3.6) 14 (1.1) 402 (3.4)Steel 167 (15.2) 12 (1.1) 179 (8.1)Non-ferrous metal 106 (4.2) 2 (1.0) 108 (4.0)General machinery 384 (4.5) 28 (1.2) 412 (3.8)Electric machinery 800 (5.7) 57 (1.3) 857 (4.6)Transport equipment 405 (5.6) 10 (1.4) 415 (5.3)Precision machinery 135 (5.0) 29 (1.4) 164 (3.4)Petroleum products 18 (2.6) 1 (1.0) 19 (2.4)Other manufacturing 386 (3.6) 90 (1.1) 476 (2.6)
Trade/Sales a/ 2,051 (7.2) 75 (1.3) 2,126 (6.2)Service 139 (2.8) 1Q (1.3) 149 (2.6)Others 197 (3.1) 36 (1.4) 233 (2.6)
TOTAL 5,825 (5.1) 428 (1.3) 6,253 (4.2)
( ) - average number of subsidiaries per parent company.a/ Includes general trading companies.
Source: Annual Survey on Overseas Investment, MITI, 1987.
- 28 -
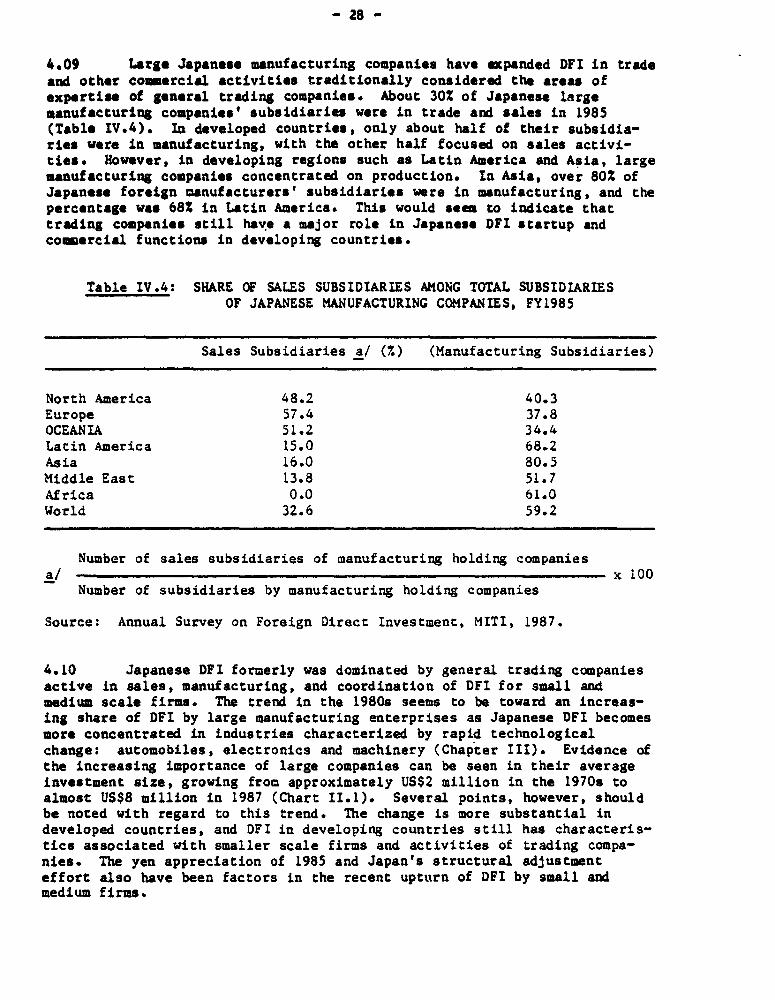
4.09 Large Japanese manufacturing companies have expanded DFI in tradeand other comercial activities traditionally considered the areas ofexpertis of general trading companies. About 30% of Japanese largemanufacturing companies' subsidiaries were in trade and sales in 1985(Table IV.4). In developed countries, only about half of their subsidia-ries were in manufacturing, with the other half focused on sales activi-ties. However, in developing regions such as Latin America and Asia, largemanufacturing companies concentrated on production. In Asia, over 80% ofJapanese foreign manufacturers' subsidiaries were in manufacturing, and thepercentage was 68% in Latin America. This would seem to indicate thattrading companies still have a major role in Japanese DFI startup andcoiercial functions in developing countries.
Table IV.4: SHARE OF SALES SUBSIDIARIES AMONG TOTAL SUBSIDIARIESOF JAPANESE MANUFACTURING COMPANIES, FY1985
Sales Subsidiaries a/ (7) (Manufacturing Subsidiaries)
North America 48.2 40.3Europe 57.4 37 8OCEANIA 51.2 34.4Latin America 15.0 68.2Asia 16.0 80.5Middle East 13.8 51.7Africa 0.0 61.0World 32.6 59.2
Number of sales subsidiaries of manufacturing holding companiesa! - x 100
Number of subsidiaries by manufacturing holding companies
Source: Annual Survey on Foreign Direct Investment, MITI, 1987.
4.10 Japanese DPI formerly was dominated by general trading companiesactive in sales, manufacturing, and coordination of DEI for small andmedium scale firms. The trend in the 1980s seems to be toward an increas-ing share of DFI by large manufacturing enterprises as Japanese DFI becomesmore concentrated in industries characterized by rapid technologicalchange: automobiles, electronics and machinery (Chapter III). Evidence ofthe increasing importance of large companies can be seen in their averageinvestment size, growing from approximately US$2 million in the 1970s toalmost US$8 million in 1987 (Chart II.1). Several points, however, shouldbe noted with regard to this trend. The change is more substantial indeveloped countries, and DFI in developing countries still has characteris-tics associated with smaller scale firms and activities of trading compa-nies. The yen appreciation of 1985 and Japan's structural adjustmenteffort also have been factors in the recent upturn of DFI by small andmedium firms.
- 29 -
S. Objectives of Japanese DFI
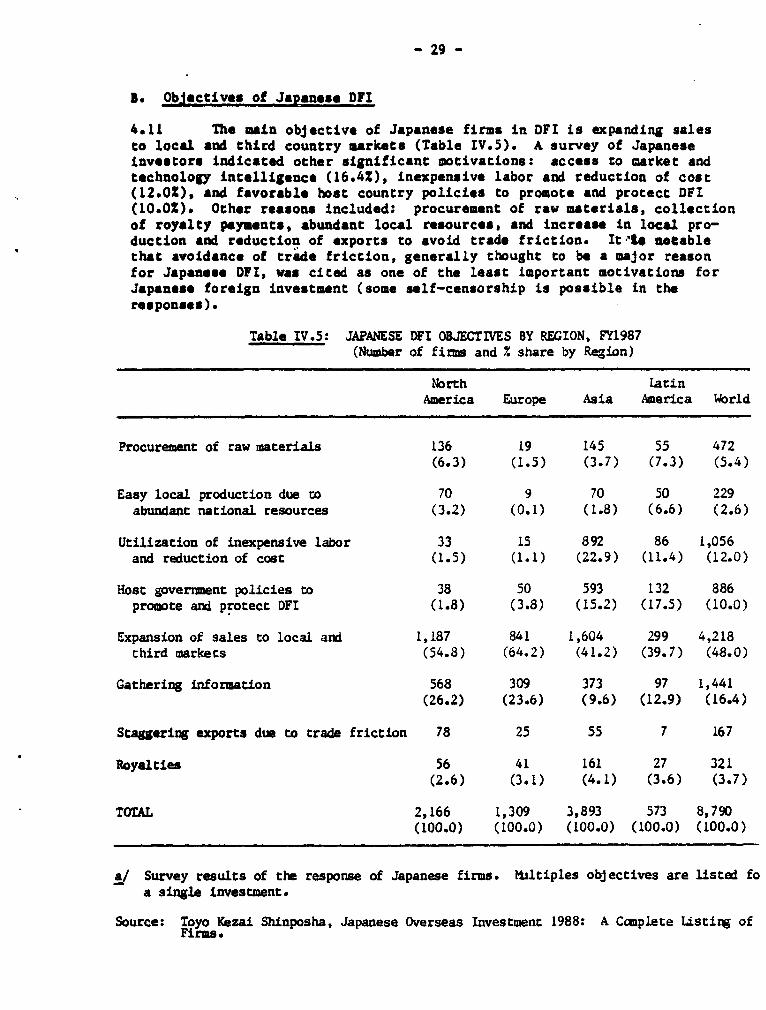
4.11 The main objective of Japanese firms in DFI is expanding salesto local and third country markets (Table IV.5). A survey of Japaneseinvestors indicated other significant motivations: access to market andtechnology intelligence (16.4%), inexpensive labor and reduction of cost(12.02), and favorable host country policies to promote and protect DFI(10.02). Other reasons included; procurement of raw materials, collectionof royalty payments, abundant local resources, and increase in local pro-duction and reduction of exports to avoid trade friction. It,," notablethat avoidance of trade friction, generally thought to be a major reasonfor Japanese DFI, was cited as one of the least important motivations forJapanese foreign investment (some self-censorship is possible in theresponses).
Table IV.5: JAPANESE DPI OBJECTIVES BY REGION, FY1987(Number of firms and % share by Region)
North LatinAmerica Europe Asia America World
Procurement of raw materials 136 19 145 55 472(6.3) (1.5) (3.7) (7.3) (5.4)
Easy local production due to 70 9 70 50 229abundant national resources (3.2) (0.1) (1.8) (6.6) (2.6)
Utilization of inexpensive labor 33 15 892 86 1,056and reduction of cost (1.5) (1.1) (22.9) (11.4) (12.0)
Host government policies to 38 50 593 132 886promote and protect DFI (1.8) (3.8) (15.2) (17.5) (10.0)
Expansion of sales to local and 1,187 841 1,604 299 4,218third markets (54.8) (64.2) (41.2) (39.7) (48.0)
Gathering information 568 309 373 97 1,441(26.2) (23.6) (9.6) (12.9) (16.4)
Staggering exports due to trade friction 78 25 55 7 167
Royalties 56 41 161 27 321(2.6) (3.1) (4.1) (3.6) (3.7)
TOTAL 2,166 1,309 3,893 573 8,790(100.0) (100.0) (100.0) (100.0) (100.0)
a/ Survey results of the response of Japanese firms* Miltiples objectives are listed foa single investment.
Source: Toyo Kezai Shinposha, Japanese Overseas Investment 1988: A Complete Listing ofFirms.
- 30 -
4.12 In all regions, expanding sles was the most important objective,but other motivations varied among regions. In North America, gatheringinformation (26.2%) was the second most important objective, procuringlocal raw material (6.32) the third, and avoiding trade friction (3.6%) thefourth. In Europe, gathering information (23.6%) also ranked second,followed by benefits from government policies toward DFI (3.8%), andgaining royaltios (3.1%). In Asia, tapping inoxpensive labor (22.9%) wasthe second motivation, host government policy (15.2%) third, and gatheringinformation (9.62) the fourth. In Latin America, host government policy(17.52) was the secood ranking objective, followed by gathering information(12.9Z) q0 low labor costs (11.4%).
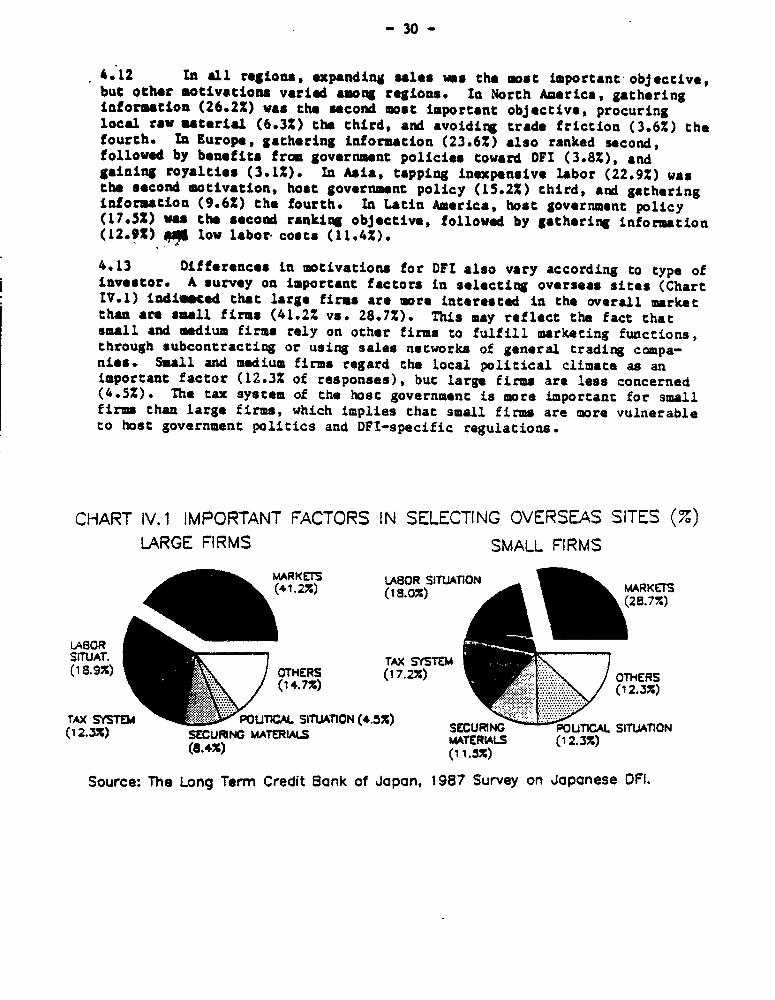
4.13 Differences in motivations for DFI also vary according to type ofinvestor. A survey on important factors in selecting overseas sites (ChartIV.1) inditead that large firAs are more interested in the overall marketthan are s*all firms (41.2% vs. 28.7%). This may reflect the fact thatsmall and medium firms rely on other firms to fulfill marketing functions,through subcontracting or using sales networks of general trading compa-nies. Small and medium firms regard the local political climate as animportant factor (12.3% of responses), but large firms are less concerned(4.5%). The tax system of the host government is more important for smallfirms than large firms, which implies that small firms are more vulnerableto host government politics and DFI-specific regulations.
CHART IV.1 IMPORTANT FACTORS IN SELECTING OVERSEAS SITES (%)LARGE FIRMS SMALL FIRMS
~~ MAR~~KETS LABOR SITUATIONRKS(1.2%) (1 8.02) MARKErS
LABORSITUAT. TAX SYSTEr M(1 8.9%) OTHERS (17.2%) OTHERS
(14.72) (1 2.3X)
TAX S _ ' POUTICAL SITLIATION (4.52)(12.3%) sccu~~~ MATERLALS SECURtING OUTICAL SITUATION(I 2.3X) SECUING MATtRL(4 MATERIALS (1 2.3%)
(8.4x) (1 1.52)
Source: The Long Term Credit Bank of Japan, 1987 Survey on Japanese OFI.
- 31 -
C. Difficulties Perceived by Japanese Firms in DFI Operations
4.14 The main problems for Japanese investors in developed countriesare associated with market conditions. Those in developing countriesoriginate from government policies and political and economic instabilities(Table IV.6). Problem areas differ by region. In North America, more thanhalf the Japanese investors cited market competition (52.22), shortage ofqualified labor (11.8X), and local employment requirements (10 ), partic-ularly in Canada, as the three main concerns. Inflation (5.OZ.*4 an indica-tor of overall macroeconomic performance, was the fourth most citedproblea.3/ In Europe, increasing market competition was viewed as themain problem (55.1%); inflation (8.5%), labor supply (8.1%), and localemployment requirements (6.7%) also were cited.
4.15 In Asia, market competition (24.22) was the most importantconcern for Japanese DPI. Inflation was the second ranking problem(10.4%), and difficulties in acquiring qualified labor the third (9.5%).Local employment requirements (8.7%) and foreign equity participation(6.5%) ranked fourth and fifth. In Latin America, inflation was cited asthe most important problem (28.8%). Government restrictions on imports ofraw materials and parts (13.6%) and on remitting dividends (8.7%) rankedsecond and third; government regulations have a more adverse impact inLatin America than in Asia. Market competition and political risk rankedfourth as a problem in Latin America (8.0%)
4.16 In Africa, the three most serious problems were governmentregulations restricting imports (14.3%), remitting dividends (13.5%), andlocal employment requirements (12.2%). Inflation (12.0%) and increasingmarket competition (9.8%) were slightly less serious problems. In theMiddle East, local employment requirements (20.2%) was the most importantproblem, followed by scarcity of qualified labor (11.5%). Increasingmarket competition (11.3%), political risk (11.1%) and restrictions onforeign participation (7.8%) were addicional difficulties cited forJapanese DFI operating in the Middle East.
D. Ownership Patterns of Japanese DFI
4.17 Most Japanese investors in foreign subsidiaries do not have 100%ownership. Joint ventures with local partners are common, with Japanesepartners having minority ownership. In 1985, only about 30% of Japanesemanufacturing subsidiaries were wholly owned by the Japanese investors; inabout half of the manufacturing subsidiaries, Japanese equity was 50% orless (Table IV.7). This is a distinctive feature of Japanese DFI;multinational corporations in ocher countries prefer majority ownership toensure control. The greater willingness of Japanese firms to acceptminority ownership reflects the importance of small and medium scale firmsin Japanese DFI. Small firms often lack the funds, market foothold andexpertise necessary in the local market. Thus, joint ventures and minorityshares in Japanese DFI are important for dealing with developing countries,many of which have legislation and practices that preclude or discouragemajority foreign ownership.
3/ Ignoring "other problems" in Table IV.6 which represents the sum of
various miscellaneous problems.
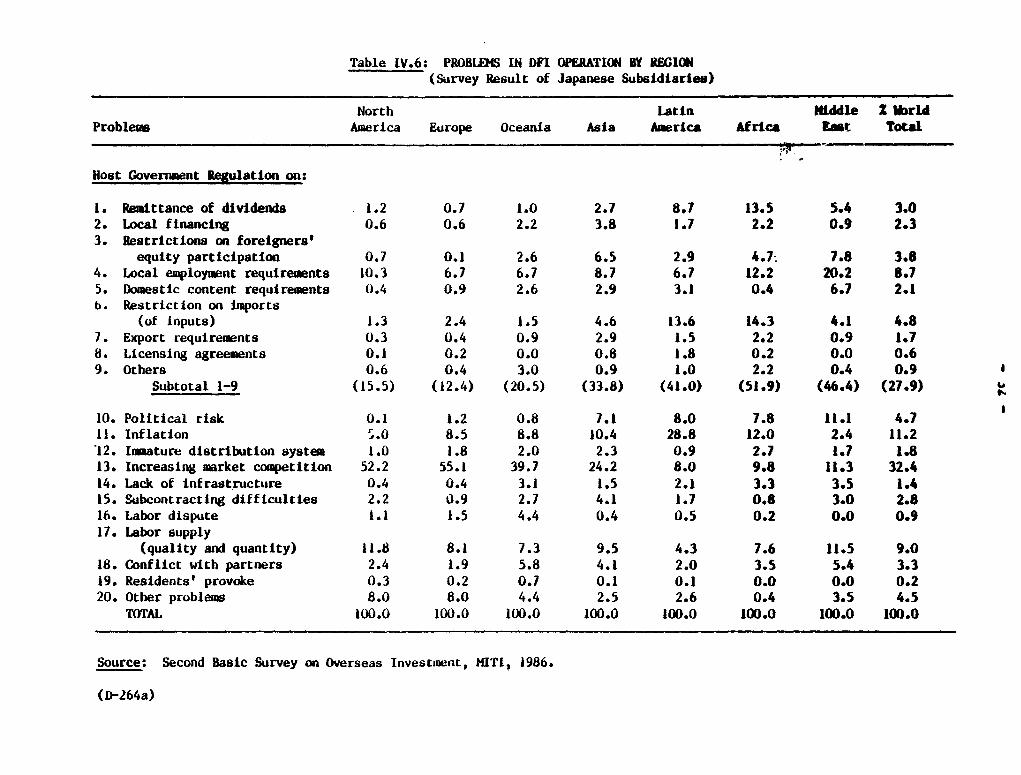
Table [V.6; PROBLE4S IN DFI OPERATION BY ROGION(Survey Result of Japanese Subsidiaries)
North Latin fiddle Z abrldProblems America Europe Oceania Asia America Africa Eat Total
Host Government Regulation on:
1. Remittance of dividends 1.2 0.7 1.0 2.7 8.7 13.5 5.4 3.02. Local financing 0.6 0.6 2.2 3.8 1.7 2.2 0.9 2.33. Restrictions on foreigners'equity participation 0.7 0.1 2.6 6.5 2.9 4.7: 7.8 3.84. Local employment requirements 10.3 6.7 6.7 8.7 6.7 12.2 20.2 8.75. Domestic content requirements 0.4 0.9 2.6 2.9 3.1 0.4 6.7 2.1b. Restriction on Imports(of Inputs) 1.3 2.4 1.5 4.6 13.6 14.3 4.1 4.87. Export requirements 0.3 0.4 0.9 2.9 1.5 2.2 0.9 1.78. Licensing agreements 0.1 0.2 0.0 0.8 1.8 0.2 0.0 0.69. Others 0.6 0.4 3.0 0.9 1.0 2.2 0.4 0.9Subtotal 1-9 (15.5) (12.4) (20.5) (33.8) (41.0) (51.9) (46.4) (27.9)
10. Political risk 0.1 1.2 0.8 7.1 8.0 7.8 11.1 4.711. Inflation ,.0 8.5 8.8 10.4 28.8 12.0 2.4 11.212. Immature distribution system 1.0 1.8 2.0 2.3 0.9 2.7 1.7 1.813. Increasing market competition 52.2 55.1 39.7 24.2 8.0 9.8 11.3 32.414. Lack of infrastructure 0.4 0.4 3.1 1.5 2.1 3.3 3.5 1.415. Subcontracting difficulties 2.2 0.9 2.7 4.1 1.7 0.8 3.0 2.816. Labor dispute 1.1 1.5 4.4 0.4 0.5 0.2 0.0 0.917. Labor supply(quality and quantity) 11.8 8.1 7.3 9.5 4.3 7.6 11.5 9.018. Conflict with partners 2.4 1.9 5.8 4.1 2.0 3.5 5.4 3.319. Residents' provoke 0.3 0.2 0.7 0.1 0.1 0.0 0.0 0.220. Other problems 8.0 8.0 4.4 2.5 2.6 0.4 3.5 4.5TOTAL 100.0 100.0 100.0 100.0 100.0 100.0 100.0 100.0
Source: Second Basic Survey on Overseas Investmuent, ITI, 1986.
(D-264a)
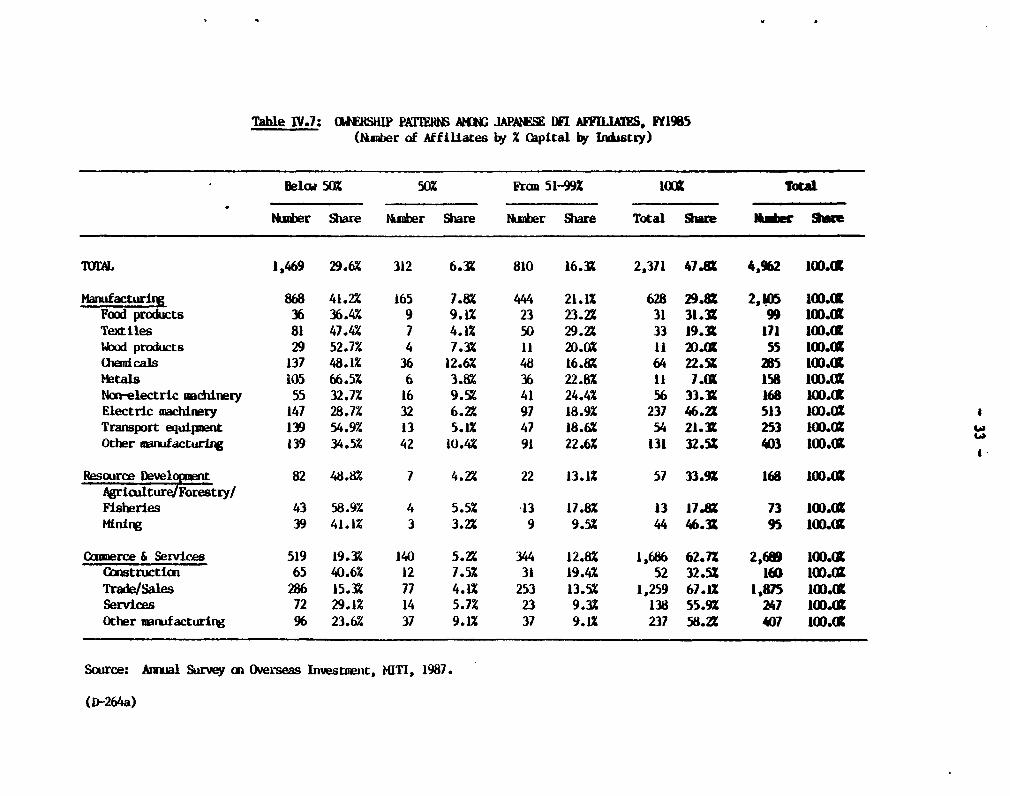
Table IV.7: (UEW &IP PAT 1 AIG JAPAWSE D[ AFFEJLA , FY1985(Umber of Affiliates by % C3pital by Indistry)
Belw 50% 50% Fram 51-99 l(lit Total
Nter Share tNwer Share Nler Share Total Share NI&dr Shie
1,469 29.6% 312 6.3X 810 16.3Z 2,371 47.U 4,962 100.(1
Manufacturigx 868 41.2X 165 7.8% 444 21.12 628 29.8% 2,105 10041Food products 36 36.4% 9 9.1% 23 23.2% 31 31.3X 99 10DA0Textiles 81 47.4% 7 4.1% 50 29.2% 33 19.3% 171 100.(1Wod products 29 52.7% 4 7.3X 11 20.0% 11 20D( 55 10D.CK(liancals 137 48.1% 36 12.6% 48 16.&% 64 22.5X 2h5 I0O.(Metals iO5 66.5% 6 3.8% 36 22.8% 11 7 AR 158 1004Non-electric machinery 55 32.7% 16 9.5% 41 24.4% 56 33.3 168 100.CtElectric machinery 147 28.7% 32 6.2X 97 18.9% 237 46.22 513 10D.02Transport equipsnt 139 54.9% 13 5.1% 47 18.6% 54 21.3X 253 1004.Other anrufacturig 139 34.5% 42 10.4% 91 22.6X 131 32.5% 403 100.41
Resource Develo3!Ent 82 48.% 7 4.2% 22 13.1X 57 33.92 168 100.01Agriculture/Forestry/Fisheries 43 58.9% 4 5.5% 13 17.8% 13 17.8 73 100.41Minirg 39 41.1% 3 3.2X 9 9.5% 44 46.3X 95 100AK.
cuerce & Services 519 19.37 140 5.2% 344 12.8% 1,686 62.72 2,611 100.41Coinstruction 65 40.6% 12 7.5% 31 19.4% 52 32.5X 160 IOD.G1Trade/Sales 286 15.3 77 4.1% 253 13.5% 1,259 67.1% 1,8I5 100.4Services 72 29.1% 14 5.7% 23 9.3% 138 55.92 247 100.4Other wrnufacturing 96 23.6% 37 9.1% 37 9.1% 237 58.2Z% 407 100.41
Source: Aral Survey ao Overseas Investnamt, MITI, 1987.
(D-264a)
34
4.18 Ownership patterns of Japanese DFI vary markedly by setor andcountry. In the coerceo and service sectors (Table IV.7), about 60% ofthe subsidiaries are wholly owned by Japanese investors, and in only about251 do Japanese investors own 50 or less. In manufacturing, 29.8% ofJapanese foreign ventures are 100% Japanese owned, while 49% have Japaneseownership of 50Z or lass. In relatively mature industries such as woodproducts, chemicals, and matals, over 60% of Japanese joint ventures have aJapanese share of 50X or less. In contrast, in electric machinery, asubsector characterixed by rapid technological change, only 35% of Japanesejoint ventures have 501 or less Japanese ownership, and over 46% of thesubsidiaries sre 100t Japanese owned. One explanation is that in matureindustries, firm calculate that value added is captured through majorityownership of the distribution chain rather than the production stage. Intechnology intensive industries, 100% Japanese ownership see5m to bepreferred to retain proprietorship over technology.
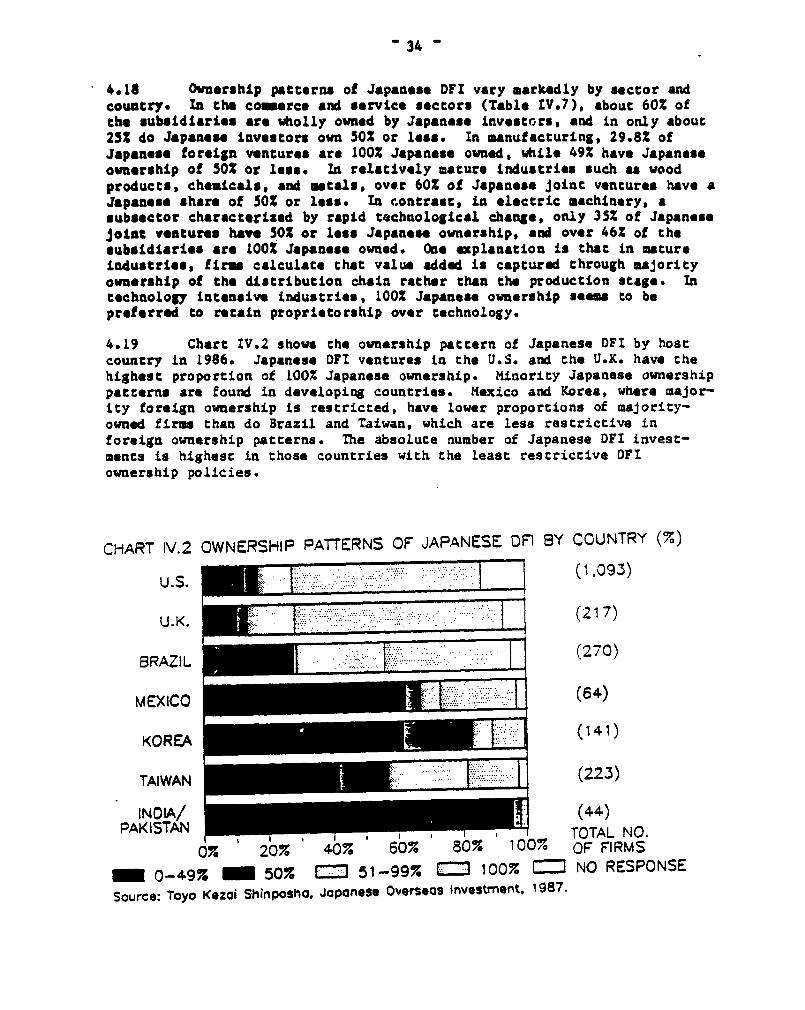
4.19 Chart IV.2 shows the ownership pattern of Japanese DFI by hostcountry in 1986. Japanese DFI ventures in the U.S. and the U.K. have thehighest proportion of 100% Japanese ownership. Minority Japanese ownershippatterns are found in developing countries. Mexico and Korea, where major-ity foreign ownership is restricted, have lower proportions of majority-owned firms than do Brazil and Taiwan, which are less restrictive inforeign ownership patterns. The absolute number of Japanese DFI invest-ments is highest in those countries with the least restrictive DFIownership policies.
CHART IV.2 OWNERSHIP PATTERNS OF JAPANESE OF] BY COUNTRY (7w)
U.S. _=(t03
U.K. r~. (217)
BRAZIL (270)
MEXICO (64)
KOREA (141)
TAIWAN (223)
INOA/ (44)PAKISTAN T TOTAL NO.
%7 20% 40% 60% 80P 100% OF FIRMS0-497_ 507. 51-99% = 100% = NO RESPONSE
Source: Toyo Kezai Shinposho, Japanese Overseas Investment, 1987.
- 35 -
4.20 As Japanese DFI expands in the trade and service sectors and intechnology intensive manufacturing industries, Japanes investors' insist-ance on majority or sole ownership is expected to increase. As the focusshifts toward finding flexible technical labor pools and gaining footholdsin increaingly protected industrialized markets, developing countryrestrictions on majority ownership will further diminish the appeal ofdeveloping countries as sources and as markets.
E. Market Destination of Japanese Hanufacturing Subsidi-ry
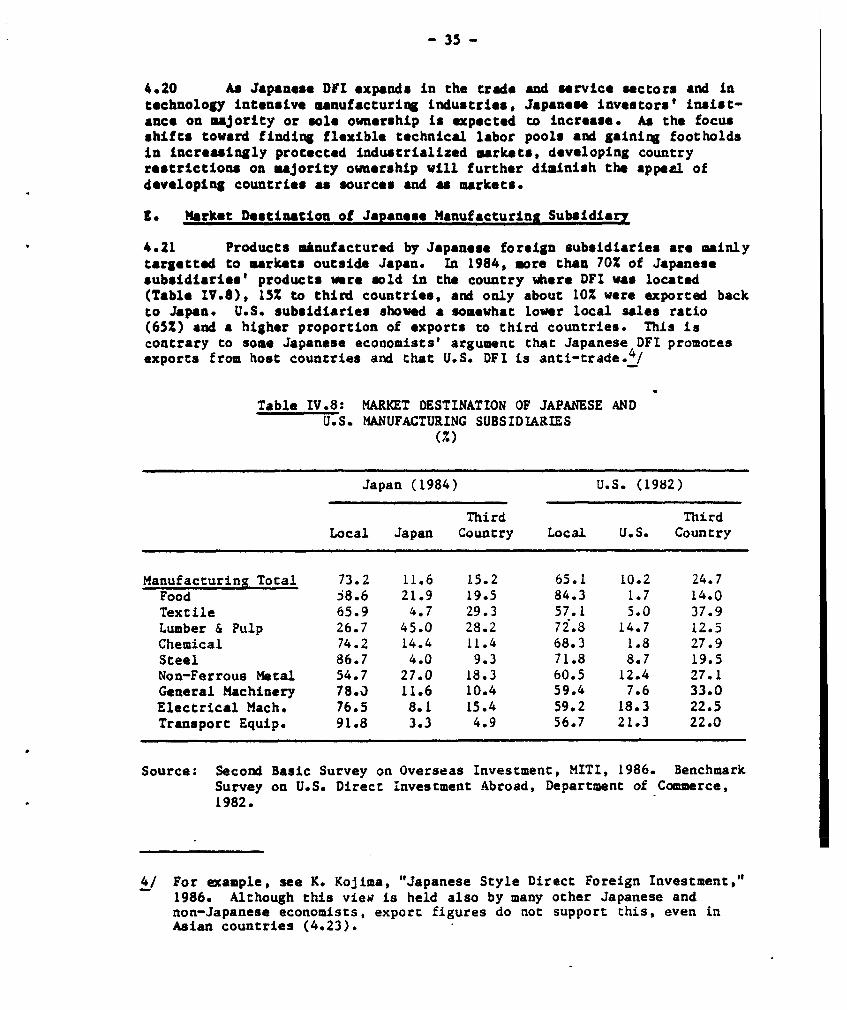
4.21 Products minufactured by Japanese foreign subsidiaries are mainlytargetted to markets outside Japan* In 1984, more than 70% of Japanesesubsidiaries' products were sold in the country where DFI was located(Table IV.8), 15% to third countries, and only about 10% were exported backto Japan. U.S. subsidiaries showed a somewhat lower local sales ratio(65%) and a higher proportion of exports to third countries. This iscontrary to some Japanese economists' argument that Japanese DFI promotesexports from host countries and that U.S. OFI is anti-trade.4/
Table IV.8: MARKET DESTINATION OF JAPANESE ANDU.S. MANUFACTURING SUBSIDIARIES
(%)
Japan (1984) U.S. (1982)
Third ThirdLocal Japan Country Local U.S. Country
Manufacturing Total 73.2 11.6 15.2 65.1 10.2 24.7Food j8.6 21.9 19.5 84.3 1.7 14.0Textile 65.9 4.7 29.3 57.1 5.0 37.9Lumber & Pulp 26.7 45.0 28.2 72.8 14.7 12.5Chemical 74.2 14.4 11.4 68.3 1.8 27.9Steel 86.7 4.0 9.3 71.8 8.7 19.5Non-Ferrous Metal 54.7 27.0 18.3 60.5 12.4 27.1General Machinery 78.0 11.6 10.4 59.4 7.6 33.0Electrical Mach. 76.5 8.1 15.4 59.2 18.3 22.5Transport Equip. 91.8 3.3 4.9 56.7 21.3 22.0
Source: Second Basic Survey on Overseas Investment, MITI, 1986. BenchmarkSurvey on U.S. Direct investment Abroad, Department of Commerce,1982.
4/ For example, see K. Kojima, "Japanese Style Direct Foreign Investment,"1986. Although this vies is held also by many other Japanese andnon-Japanese economists, export figures do not support this, even inAsian countries (4.23).

- 36 -
4.22 Japanese DFI in natural resource related industries sell a lowpercentage of output in the host country: lumber and pulp (26.7% soldlocally), non-ferrous metal (54.7%) and food (58.6Z). Transport equipment(91.8%), steel (86.7%), general machinery (78.0%), electrical machinery(76.5%) all show high local sales percentages. The textile industry isnotable for its high proportion of third country exports (28.3%), withJapanesa DFI utilizing the host countries as export bases. In contrastsU.S. DFI has a higher export ratio in capital and technology-intensivesectors than in natural resource-related subsectors. Most notable is theU.S. transport equipment subsector, which sold 21.3% of its products backto the U.S. and 22.02 to third countries; and electrical machinery, whichsold 18.3% to the U.S. and 22.5% to third countries. U.S. subsidiaries(particularly in automobile and electrical machinery) tend to use foreignproduction facilities as a component of the parent companies' globalproduction system, while Japanese subsidiaries, tend to produce the finalproduct for the local market.
4.23 Market destination patterns vary by region (Chart IV.3). InAsia, U.S. DFI shows a much higher export ratio than Japanese DFI, whileboth show a higher export ratio in Asia than in any other region. About60% of the product of U.S. subsidiaries in Asia is exported, while Japanesesubsidiaries in the region export about 30% of their products. U.S.investors use Latin America both for local sales (60%) and as export bases(40% export ratio). Almost all production of Japanese DFI in Latin Americais sold to che local market (87.2%). This difference is dramatic in thecase of the electronics industry. Japanese electronics subsidiaries inLacin America sell over 95% of production to the local market, while inAsia the local sales ratio of Japanese DFI is about 40%, with about 40% ofelectronics products exported to third countries. The U.S. electronicsf;ubsidiaries in Asia sell 65% of their products in the U.S. and only 12% inthe local market.
'HART IV.3 EXPORT RATIO Of JAPAN ANO U.S.-SUBSIDIARY BY REGION
100%7 MANUFACTURING AVERAGE 100- LECTRICAL MACRH.
80% 80%-
60%- 60%-
4.0%-- 40%-
20% - 20%-
ASIA LATIN AMERICA EUROPE ASIA LATIN AMERICA
r-1-14JAPANESE SUBSIQIARY _ U.S. SU8SIOIARYSource: See Chart IV.4
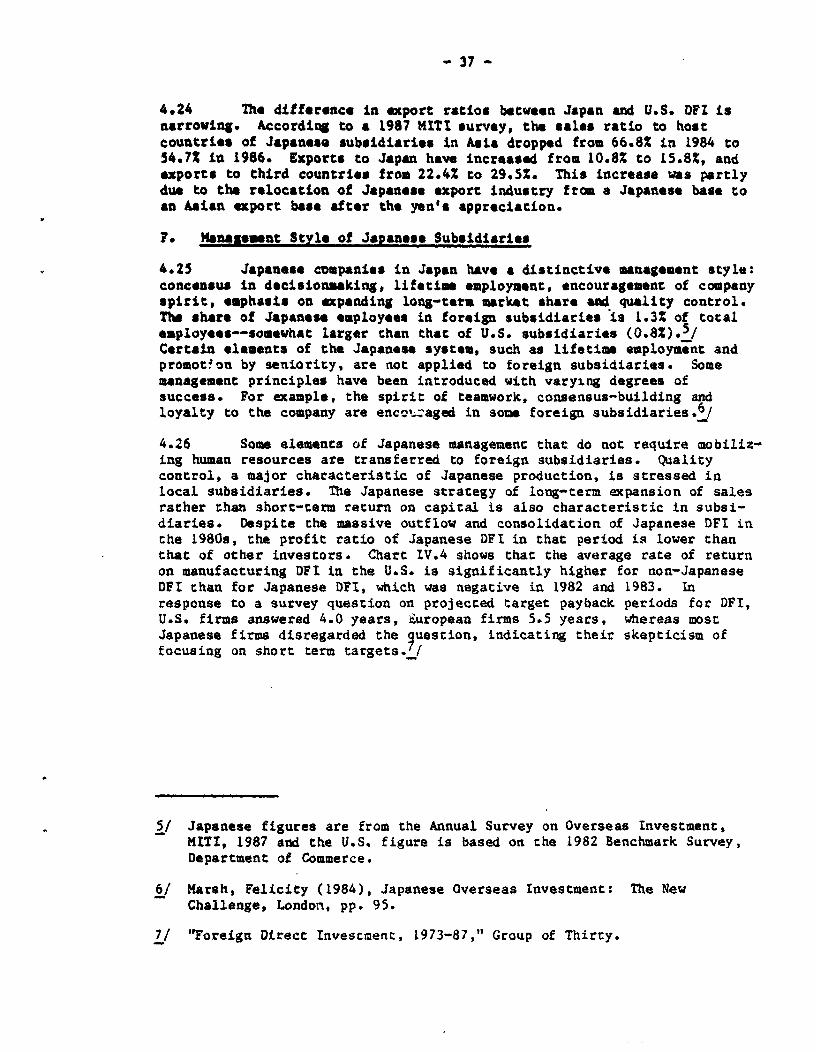
- 37 -
4.24 The difference in export ratios between Japan and U.S. DFI isnarrowing. According to a 1987 MlT survey, the sales ratio to hostcountries of Japanese subsidiaries in Asia dropped from 66.8% in 1984 to54.72 in l986. Exports to Japan have increased from 10.8% to 15.8%, andexports to third countries from 22.4% to 29.52. This increase was partlydue to the relocation of Japanese export industry from a Japanese base toan Asian export base after the yen's appreciation.
F. t4asmeuat Style of Japanese Subsidiaries
4.25 Japanese companies in Japan have a distinctive management style:concensus in decisionmaking, lifetim employment, encouragement of companyspirit, emphasis on expanding long-tern market share and quality control.The share of Japanese employees in foreign subsidiaries is 1.3% of totalemployees--somewhat larger than that of U.S. subsidiaries (0.82).5/Certain elements of the Japanese system, such as lifetime employment andpromot!on by seniority, are not applied to foreign subsidiaries. Somemanagement principles have been introduced with varying degrees ofsuccess. For example, the spirit of teamwork, consensus-building andloyalty to the company are enc^u_aged in some foreign subsidiaries.6 /
4.26 Some elemencs of Japanese management that do not require mobiliz-ing human resources are transferred to foreign subsidiaries. Qualitycontrol, a major characteristic of Japanese production, is stressed inlocal subsidiaries. The Japanese strategy of long-term expansion of salesrather than short-term return on capital is also characteristic in subsi-diaries. Despite the massive outflow and consolidation of Japanese DFI inthe 1980s, the profit ratio of Japanese DFI in that period is lower thanthat of other investors. Chart IV.4 shows that the average rate of returnon manufacturing DFI in the U.S. is significantly higher for non-JapaneseDFI than for Japanese DFI, which was negative in 1982 and 1983. Inresponse to a survey question on projected target payback periods for DFI,U.S. firms answered 4.0 years, Wuropean firms 5.5 years, whereas mostJapanese firms disregarded the guestion, indicating their skepticism offocusing on short term targets./
5/ Japanese figures are from the Annual Survey on Overseas Investment,MITI, 1987 and the U.S. figure is based on the 1982 Benchmark Survey,Department of Commerce.
6/ Marsh, Felicity (1984), Japanese Overseas Investment: The NewChallenge, London, pp. 95.
7/ "Foreign Direct Invescment, 1973-87," Group of Thirty.
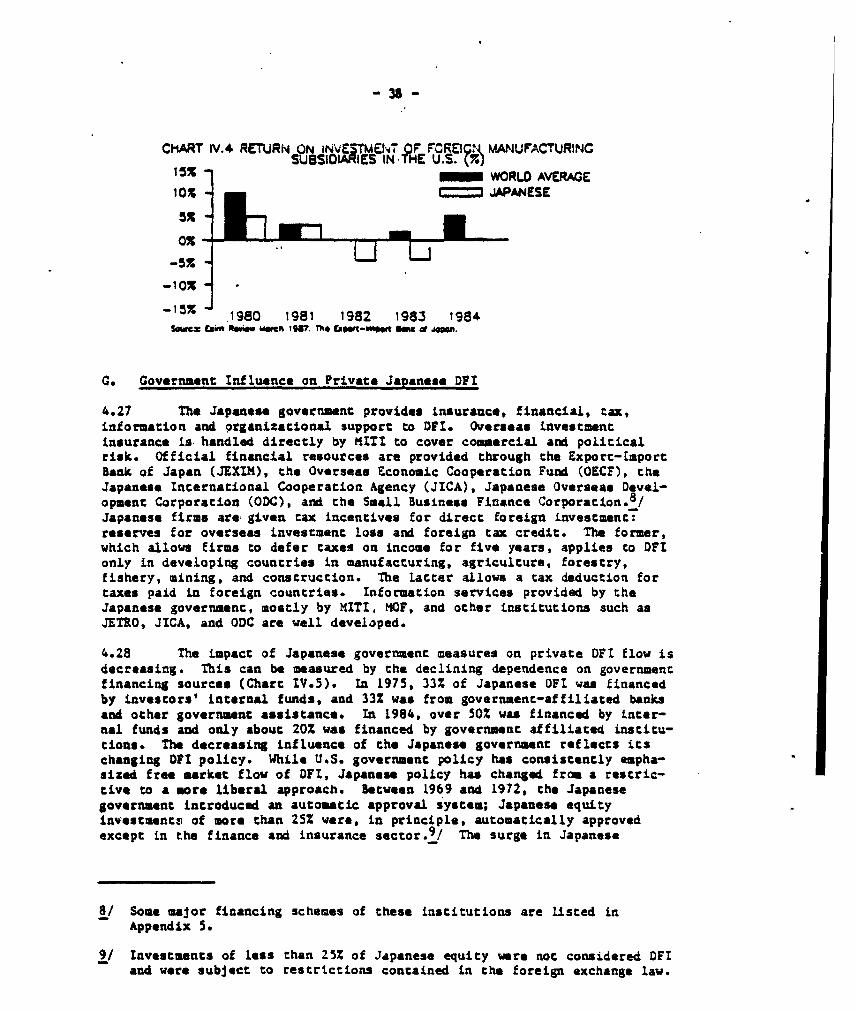
-38-
CHART V.4 RETURN ON INVETEsT FOREI ?AUFACTURNGSUBSIO IES IN HE U.S (
15 KWORLD AVERAGElox _ 4 PANESE
-10%
-15% 1980 1981 1982 1983 1984leivg Cup" at"v WI ISa?. Th. b _ M of ".
C. Government Influence on Private JaRanese ODF
4.27 The Japanese government provides insurance, financial, tax,information and organizational support to OFI. Overseas investmentinsurance is. handled directly by KITI to cover commercial and politicalrisk. Official financial resources are provided through the Export-IaportBank of Japan (JEXIM), the Overseas Economic Cooperation Fund (OECF), cheJapanese International Cooperation Agency (JICA), Japanese Overseas Devel-opment Corporation (ODC), and the Small Business Finance Corporation.8/Japanese firms are given tax incentives for direct foreign investment:reserves for overseas investment loss and foreign tax credit. The former,which allows firms to defer caxes on income for five years, applies to DFIonly in developing countries in manufacturing, agriculture, forestry,fishery, mining, and conscruction. The lacter allows a tax deduction fortaxes paid in foreign countries. Information services provided by theJapanese goverment, mostly by MITI, MOF, and other institutions such asJETRO, JICA, and ODC are well developed.
4.28 The impact of Japanese government measures on private DFI flow isdecreasing. This can be measured by the declining dependence on governmentfinancing sources (Chart IV.5). In 1975, 33Z of Japanese OFt was financedby investors' internal funds, and 33% was from government-affiliated banksand other government assistance. In 1984, over 50Z was financed by inter-nal funds and only about 202 was financed by government affiliated institu-tions. The decreasing influence of the Japanese government reflects itschanging DfI policy. While U.S. government policy has consistently empha-sized free market flow of OFI, Japanese policy ha changed from a restric-tive to a more liberal approach. Between 1969 and 1972, the Japanesegovernment introduced an autonatic approval system; Japanese equityinvestmentv of more than 25% were, in principle, automatically approvedexcept in the finance and insurance sector. 9/ The surge in Japanese
8/ Some major financing schemes of these institutions are listed inAppendix 5.
9/ Investments of less than 25% of Japanese equity ware not considered DFtand were subject to restrictions contained in the foreign exchange law.
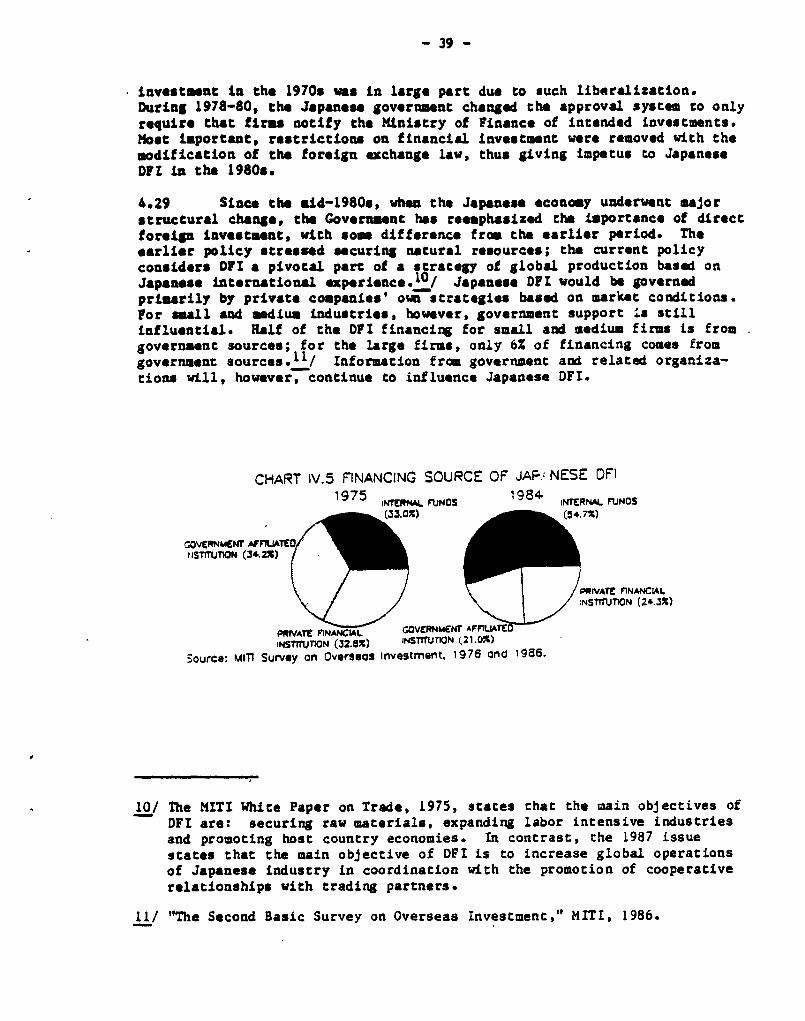
- 39 -
investment in the 1970s was ln large part due to such liberalization.During 1978-80, the Japanese government changed the approval system to onlyrequire that firus notify the Mlnistry of Finance of intended investments.Most important, restrictions on financial investment were removed with themodification of the foreign exchange law, thus giving impetus to JapaneseDWl in the 1980c.
4.29 Since the did-1980s, when the Japanese *conomy underwent majorstructural change, the Governmnt has reemphasized the importance of directforeiSn investment, with som difference froa the earlier period. Theearlier policy strosged securing natural resources; the current policyconsiders DFI a pivotal part of a stratogy of global production based onJapanese international experience. 1 0 / Japanese DFI would be governedprimarily by private companies' ownrstrategies based on market conditions.For small and medium industries, however, government support .s stillinfluential. Half of the DFI financir4 for small and medium firms is fromgovernuent sources; for the large firms, only 6Z of financing cones fromgovernment sources. 1 1 / Information from government and related organiza-tions will, however, continue to influence Japanese DFI.
CHART IV.5 FINANCING SOURCE OF JAP• NESE OFI1975 INf* frNAL 1984 iNrERNAL UNOS
- (33.O%) -(54. 7X)
OOVERNMCNT ArFATECDPISTU1MN (34.2X)
P0IVATC r1NA CLAL/NSTrrUTION (24.3X)
P"iVAT. VNANC^IA GOVERNMENt ArFIUATiNSTrrUTION (32.6%) INSTTJT1ON (21.0i-)
Source: Mln Survey on Overseas investment. 1976 and 1986.
10/ The MITI White Paper on Trade, 1975, states that the main objectives ofDFI are: securing raw materials, expanding labor intensive industriesand promoting host country economies. In contrase, the 1987 issuestates that the main objective of DFI is to increase global operationsof Japanese industry in coordination with the promotion of cooperativerelationships with trading partners.
11/ "The Second Basic Survey on Overseas Investment," MITI, 1986.
- 40 -
Be Conclusion
4.30 Japanese DPI has exhibited different characteristics from theDPI of other investors. Unlike western DFI, which is characterized bylarge multinational corporations specializing in a product group, generaltrading companies have had an important role in Japan's presence in foreigncountries. These trading companies also have coordinated the investment ofsmall and medium firms-another important group of actors in Japanese DFI.Japaese investors have ore willingly accepted joint venture arrangementsand minority ownership. The products of Japanes subsidiarie have beenlees export-oriented than those of U.S. subsidiaries. Japanese investorsfocus more on expansion of sales rather than on short term profitmamimization; hence, quality control is mphasized. Private decisionm*king of Japanese investors has been responsive to government policychange and supportive measures.
4.31 Japanese DFI performance varies across regions and subsectors.In developed countries, increased markec competition is the single mostimport concern to Japanese DFI. In Asia, market competition and governmentregulations, such as local employment requirements, are serious problems.In Latin America, poor performance of the host country economy, politicalrisk, and regulations on imports and remittanceis are all important concernsfor Japanese investors. Japanese subsidiaries in Asia export more thanthose in Latin America, with Asian subsidiaries' export shares increasing.Majority ownership is more prevalent in high value-added sectors (e.g.,electrical machinery), and the export ratio is highest in natural resource-related industries.
4.32 Traditional characteristics of Japanese DFI have declined, butto a varying degree among sectors and regions. Japanese DFI in naturalresource related industries and low value-added industries in developingcountries has been slowest to change, whereas DFI in developed regions hasbegun to resemble that of other developed countries. A point to noce isthat small and medium firms' DFI, which experienced a recent upturn due tothe yen appreciation, is closely affected by government policy incentivesand is more vulnerable to political risk than the large firms' DFI. Muchsmall firms' DFI is still financed by Japanese government-affiliatedfinancial institutions.
(D-264d)
- 41 -
V. SUMMU4RY AND IMPLICATIONS FOR DEVELOPING COUNTRIES
5.01 Japan's DFI growth ha been rapid and will continue as theJapanese trade surplus, a sajor source of capital outflow, accumulates.DFI flows to developing countries, formerly the recipients of more than 50Zof the total, have decreased significantly. Figures for 1980-87 show adeveloping country share of only 382, dropping to 222 if tax-related finan-cial and flagship rights investments in Africa and the Caribbean areexcluded. A major force behind this shift has been structural change inthe Japanese economy. Within a short period of time, the competitiveposition of the Japanese economy has moved from technologically standard-ized, labor-intensive manufacturing industries to capital and technology-intensive maufacturing and service industries. Reflecting this change,Japanese DFI flows shifted from light manufacturing sectors, such astextiles and food products, in developing countries to sophisticatedmanufacturing and service sectors, such as automobiles, electronics,banking and insurance, in developed markets.
5.02 Japanese experience in Asia, which has continued to be successfulin attracting Japanese DFI, shows patterns which vary by host country.Singapore and Hong Kong have captured growing financial sector DFI, Koreaand Taiwan mostly manufacturing DFI in capital intensive subsectors such asautomobiles and general machinery, and China significant flows of textilesector DFI.
5.03 General trading companies and small and medium firms have beenimportant participants in Japanese DFI and still play a significant role inmany developing countries. Large Japanese manufacturing firms are increas-ing their role as their DFI stocks grow, particularly in the automobile andmachinery sectors. Large manufacturing firms are concerned mainly withacquiring and maintaining market share, whereas small and medium firms alsoput emphasis on the host government tax and regulatory structure andpolitical situation. Expanding sales to local and third markets is themost important objective of Japanese DFI in all regions. In Asia, tappinglow cost labor is the second highest objective, followed by benefittingfrom the promotion policies of the host government and gathering informa-tion. In Latin America, promotion and information rank second and third,followed by low cost labor.
5.04 Japanese investors traditionally have participated in jointventures and more readily accepted minority equity participation thanwestern investors. However, this trend appears to be changing. In rela-tively mature industries such as wood products, chemicals and metals,service sectors, and manufacturing sectors characterized by rapid tech-nological change, majority ownership is dominant. Japanese DFI in Mexicoand Korea, countries characterized by relatively restrictive DFI regimes,follows a pattern of lower majority foreign equity ownership and loweroverall DFI levels than in Brazil and Taiwan, where DFI is less restric-ted. The implication is that imposing restrictions may increase developingcountries' control over the DFI and its performance to some extent but atthe cost of losing potential investors. This is particularly true insectors, such as electronics, where proprietory control of technology and
- 42 -
production processes is assential. As Japanese DPI continues to shift fromlabor intensive industries to technologically sophisticated industries,developing country bargaining power will diminish.
5.05 The performance of Japanese DFI runs counter to arguments that itis export-oriented. Most Japanese DPI production has been targetted to thehost country market. Industries which have had higher export ratios arenatural resource related industries such as lumber and pulp, nonferrousmetals and food products. Sectors such as transport equipment, steel,nonelectric and electric machinery all have sold production primarily inthe local market. This can be attributed to the rel&ively low level ofvertical integration of Japanese, as compared with U.S. or European DFIenterprises. As Japanese companies have moved toward more global produc-tion systess, the export performance of Japanese subsidiaries has improved,particularly in Asia. Although the export ratio of U.S. subsidiariesremains higher (almost 60%), the gap is narrowing. From 1984 to 1986, theexport ratio of Japanese subsidiaries in Asia increased from 33.2% to45.3%. In Latin America, however, the export ratio of Japanese manufactur-ing subsidiaries was only 13%; in electronics, the export ratio was only 5%(compared to about 40% in Asia).
5.06 The analysis of Japanese DFI in this report indicates that it hasthe potential to exert both a positive and negative effect in the hostcountry economy. For example, a Japanese firm's willingness to acceptainority equity participation may mean that in some cases the host countryhas greater control over its performance than that of majority owned DFI.The relatively poor export performance of Japanese DFI, however, indicatesthat it may not have a desirable impact on a host country's balance ofpayments.
5.07 In general terms, DFI's positive contributions to a country'seconomic welfare can include increased income, training, technologydevelopment, managerial know-how, demonstration effects, and a variety ofbackward and forward linkages. Negative contributions can includedifferences in priorities between the host government and foreign entityregarding exports, sourcing and pricing of inputs, choice and transfer oftechnology, business and employment practices, pricing practices, andsources of financing.
5.08 The benefits of DFI are difficult to measure, and some indirectbenefits may not be immediately apparent. Ultimately, it is a country'sdecision whether DFI from a particular source or in a particular sector isworth the potential tradeoff. Nevertheless, host cou'tries can greatlymaximize the positive and minimize the negative contributions of DFI by thekind of macroeconomic and policy environment they foster. For example, acountry with a protected local market is likely to attract DFI aimed atproducing for that market rather than for export; a country with subsidizedlocal credit will probably attract DFI which uses local credit rather thanforeign financing. A country with a stable, open economy is likely toattract DFI which takes advantage of some comparative advantage of operat-ing in that environment, not super-normal rents produced by trade barriersor other incentives.
- 43 -
5.09 Formulating DFI policy depends on the economic structure, poli-cies and priorities of the host country. Countries with abundant unskilledlabor, for example, can still attract DFI in textile and other labor inten-sive industries, but they can expect competition for that DFI from coun-tries such as China. Many developing countries could encourage DFI inchemicals and other basic materials industries, in which Japanese DFI hasbeen distributed widely. Many developing countries also might be success-ful attracting the DVI of newly industrialized countries, such as Korea orTaiwan. The NICs themselves can seek out Japanese DFI in sophisticatedcapital and technology intensive sectors, but they will be competing withdeveloped countries.
5.10 Developing countries need to understand what motivates investorsand be realistic about their own strengths and limitations in a competitiveglobal environment. Developing countries interested in attracting JapaneseDVI should address problems that constrain DFI operations. In LatinAmerica, the binding constraint is the unstable macroeconomic environment.While near term macroeconomic improvement may be difficult, policy ration-alization, such as lessening government restrictions on imports and divi-dend remittances, may greatly improve Latin American countries' potentialto attract Japanese DFI. In Asia, Japanese firms are concerned with grow-ing market competition and inflation, however difficulties in acquiringqualified labor, and government regulations on local employment and foreignequity participation are the main operating obstacles. Easing restrictionson DFI and promoting local labor training would encourage greater flows ofJapanese DFI. In Africa and the Middle East, the most serious constraintsto DFI are poor macroeconomic performance and political risk. Thesecountries could improve their DFI environment, however, by rationalizinggovernment restrictions on imports and dividend remittances, and improvingthe availability and quality of labor.
5.11 This report raises a number of issues still to be addressed. Acompelling question is to what extent Japanese DFI contributes to theeconomic welfare of individual developing countries, including incomedistribution, transfer of technology and know-how, and balance of paymenteffects. The longer term performance of Japanese DFI also merits consider-ation. The report has identified some factors affecting Japanese DFI,particularly exchange rate movements, the Japanese trade surplus, protec-tionist threats, and Japan's domestic structural adjustment effort.Further examination will illustrate to what extent these and other factorswill continue to result in large DFI flows.12 / Another issue is to whatextent Japanese subsidiaries are retaining distinctive Japanese character-istics, taking on characteristics generally associated with western multi-nationals, blending elements of both, or exhibiting new characteristics. Afinal issue worth exploring is whether the emerging DFI of NICs, such asKorea and Taiwan, is following Japan's earlier patterns, and what thisimplies for developing countries.
12/ Some studies suggest that Japanese DFI flows have already peaked. Forexample, see "Overseas Direct Investments by Japanese Corporations,"(1987) Japan Development Bank, JDB Research Report No. 87-2.
- 44 -
REFERENCaS
Dunning, John H. and Cantwell, John (1987), Directory of Statistics ofInternational Investment and Production, London.
The Export-Import Bank of Japan (1987), EXIlM Review Vol. 7 ; No. 2.
Gro;'p of Thirty (1984), Foreign Direct Investmnt 1973-1987, Naw York.
Japan Developmnt Bank (1987), Overseas Direct Investment by JapaneseCorporations, JDB Research Report No. 87-2.
Japanese Export Trade Organization (1987), White Paper on Direct ForeignInvestmnt of the World and Japan (in Japanese).
Kojima, Kiyoshi (1986), "Japanese Style Direct Foreign Investment,"Japanese Economic Studies Vol. 14 No. 1.
Kojima, K. and Ozawa, T. (1984), Japan's General Trading Companies:Merchants of Economic Development, Paris, OECD.
Koo, Bohn-Young (1985), Korean Business Ventures Abroad: Patterns andCharacteristics, Korea Development Institute.
The Long Term Credit Bank of Japan (1987), Survey on Japanese DirectForeign Investment.
Marsh, Felicity (1984), Japanese Overseas Investment: The New Challenge,Economist Intelligence Unit, London.
Ministry of Economic Planning, Japan (1987), Handbook of JapaneseEconomy (in Japanese).
Ministry of Finance, Japan (1987), Public Finance and Financial StatisticsMonthly, Vol. 428: Special Issues for Direct Foreign Investment (inJapanese).
Ministry of International Trade and Industry, Japan (1986), Second BasicSurvey on Overseas Investment: Comprehensive Statistics (inJapanese).
Ministry of International Trade and Industry, Japan (1987), Annual Surveyon Overseas Investment (in Japanese).
Ministry of International Trade and Industry, Japan (1988), Summary of theThird Basic Survey on Overseas Investment (in Japanese).
Ministry of International Trade and Industry, Japan (1988), InternacionalTrade Insurance in Japan.
- 45 -
Ministry of International Trade and Industry, Japan, News from MITI:various issues on overseas investmont.
Organization for Economic Co-operation and Development (1981), RecentInternational Direct Investment Trends.
Organization for EconomLc Co-operation and Development (1987), RecentTrends in International Direct Investment.
Ozaws, Terutoeo (1979a), Multinetionalism, Japanese Styles The PoliticalEconomy of Outward Dependency, Princeton University Press, Princeton.
The SGV Group (1986), Comparative Investment Incentives, Manila.
Thomsn, Stephen E. (1988), The Growth of American, British and JapaneseDirect Investment in the 1980s.
Toyo Kezai Shinposha (1987), Japanese Overseas Investment 1986-87: aComplete Listing by Firms and Countries.
Toyo Kezai Shinposha (1988), Japanese Overseas Investment1988: a Complete Listing of Firms (in Japanese).
U.S. Department of Commerce (1985), U.S. Direct Investment Abroad: 1982Benchmark Survey Daca.
U.S. Department of Commerce, Survey of Current Business; various issues.
U.S. Department of Commerce, International Trade Administration (1984),International Direct Investment: Global Trends and the U.S. Role.
The World Bank (1988), World Development Report, 1988.
-46
APPENDIX I
JAPANESE DPI DEFINITION AND INDUSTRY CLASSIFICATION
1. The definition of diroct foreign investment varia aog prac-tices of govornments and inforuation-gathering institutions* This appendixexplains the deofittion of Japanese ODl and industry classification used inthe text. Since there &re no international standard criteria for DIFstatistics, a rigorcue comparative analysts is alsost impossible. Howevor,a comparison with tbw U.S. definition provided in Section C of thisappendix provides an idea of how to interprets Japaneso data.
A. Definition of JaPanese DFI
2. The official definition of Japanese Oft is based on the ForeignExchange Control Order. The underlying principle of the Japanesedefinition is that it includes all business activities "that establishpermanent economic relations with overseas business activities." TheForeign Exchange Control Order specifies three kinds of activities whichare defined as DFI:
(1) Acquisition of foreign currency securities: when a residentpurchases 10 percent or more stocks or iavestment holdings of thetotal number of the said issued stocks of a foreign corporation.(Before, December 1, 1979, the relevant share of investment was25 percent or wore).
(2) Long term lending 4. money to subsidiaries: when a resident whomakes or has made an acquisition of foreign securities inaccordance with the above paragraph provides loans to the saidcorporation with a term exceeding one year.
(3) Cases of establishment or expansion of a branch, etc., by aresident: payments by a resident to a foreign councry of fundsnecessary for the establishment or expansion of a branch,factory, or other facilities in the said foreign currency.
3. Statistics of Japanese DFI: The Mtinistry of Finance compiles thVofficial DFI data, which is based on firms' notification of their invest-ment to the Ministry, in accordance with the Foreign Exchange Law. Thedata do not exclude unimplemonted, cancelled or withdrawn investments.Also, the reinvested profits or capital raised overseas are not aotified tothe Ministry and hence are not counted. The data does not use the calendaryear, but the Japanese fiscal year which begins on April 1 and ends onMarch 31 of the following year.
B. Japanese Industry Classification
4. Ia this report, whenever applicable, industry classificationfollows the "Standard Classification of Japanese Industry" described below:
- 47 -
Agriculture and fisheries: agriculture, livestock, forestry anufisheries.
Mining: mining of metal and coal, extraction of oil and gasConstruction.
Manufacturing:
.ood: food processing includes seafoodTextile: spinning, yarning and textile clothesLumber & Plp: lumber processing, furniture, paperChemical: fertilizer, pharmaceutical, petrochemical and other
chemicalMetal: steel, non-ferrous etal, and metal productsGeneral Machinery: agricultural machinery, industrial machinery
and other electronics productsTransportation Equipment: automobile and other transportation
equipmentPrecision Machinery: watches, optical instrumentsOther Manufacturing: sporting goods, toys, accessories
Sales and Trade: wholesale, general trading, retailFinance and InsuranceReal EstateTransportation & Telecommunication: transportation,
telecomunication, electricity, water supplyService: leasing, and other servicesOthers: those not included above
5. The degree of subsector classification differs from data todata. Therefore, careful interpretation of sectors or subsectors is neces-sary, particularly in evaluating service sectors. In terms of magnitude ofDFI, important service sectors are: Sales and Trade, Finance and Insur-ance, Transportation and Real Estate. The transportat4on and real estatesectors, despite their relative importance, are sometimes not explicitlyshown, but included in other services (or others) in many data.
C. Comparison with U.S. Data
6. Investment Shares: The U.S. also has 10 percent criteria.Hence, in both countries, the stock acquisition of only above 10 percent isregarded as direct investment (the stock acquisition below 10 percent istermed as "indirect investment" in Japan and is shown in differentstatistics).
7. Intercompany Debt Outflows: The U.S. includes net flows of loansbetween parent companies and subsidiaries in the direct investment positionabroad. Unlike Japan, loans from subsidiaries to parent companies offsetthe figures of outflow from the U.S. Not only long term loans exceedingone year but also other payables are accounted in the U.S.
- 48 -
8. Japanese DYI shows an almost consistent pattern that about SOpercent of Japanese DFI is made in the fom of loans to subsidiaries. Inthe U.S., intercoapany debt is also important in total DFI position, but noconsistent pattern can be found (for example, the figure is large andpositive in some years, but large and negative in other years).
9. Rainvested Earninls: The U.S. includes reinvested earnLngs withprofits in Its direct investaent position abroad, whereas Japan does not.In the U.S. data, relnvested earnings are very important and if excluded,DWI flow is negative ln most recent years. There is little information onhow large the JapaneOs reinvestment is, but since Japanese overass experi-ence has accumulated for some decades, it can be significontly large.
10. I-plemantation: U.S. data reflects actual implementation,whereas Japan counts only notification. It does not seem that there sx.stsa big gap between notification and actual implementatlon of Japanese DFI,since the statistics of host countries, in general, do not show muchdiscrepancy with Japanese data, ignoring the time lag.
11. Sources of Statistics: U.S. data is based on the "lasic Survey"by the Department of Commerce which is carried out for all foreign subsi-diaries every five years. Therefore, it does reflect "actual" figures,while Japanese data show planned figures. Although the Department ofCommerce also publish annual figures, they are based on samples.
12. Industry Classification: There does not seem to be a significantdifference in industry classification between the U.S. and Japan. U.S.data, however, seem to emphasize the distinction between banking and non-banking sectors (insurance is classified as a non-banking sector) and thusprovide a separate set of data on non-banking sectors. Japanese datainclude the finance and insurance sector, which has had increasing impor-tance in recent years. The Japanese DFI figure on the finance and insur-ance sector itself does not include indirect investment such as acquisitionof U.S. Treasury bonds, but includes increase in equity and loans to subsi-diaries. However, since this increase will in turn be related with finan-cial activities of the subsidiaries, DFI in this sector does not quitematch the traditional definition of DFI.
(D-264c)
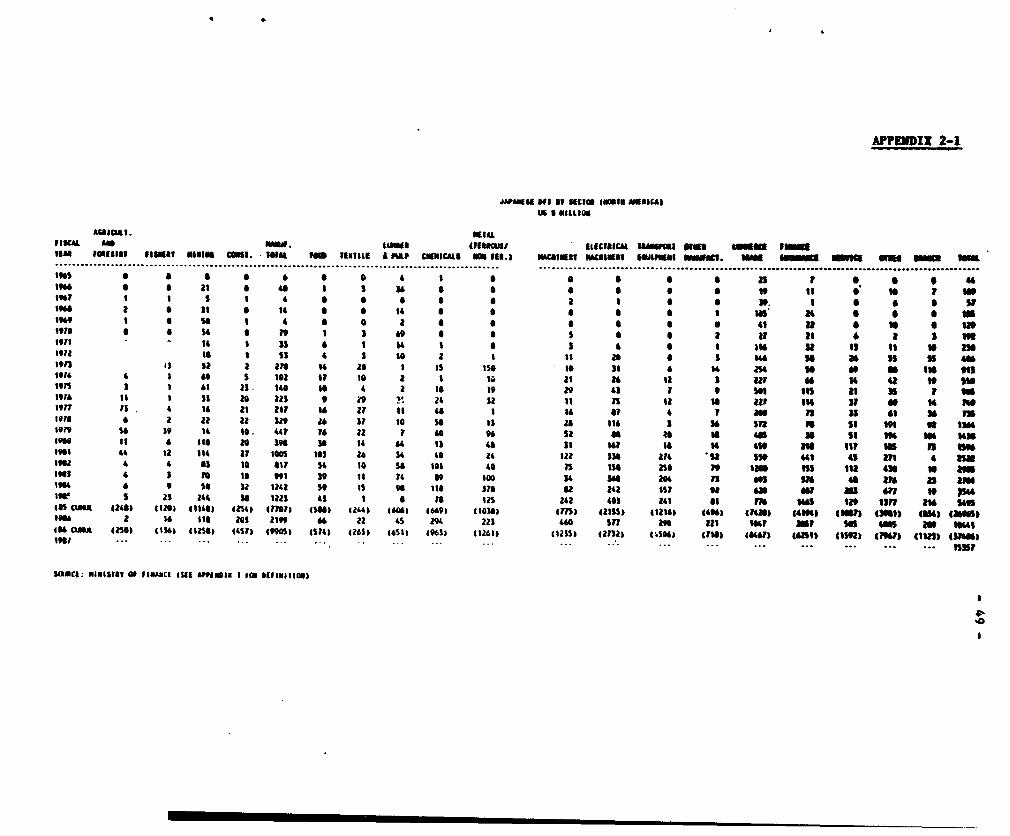
APPENDIX 2-1
JDAhAII FIB S1 MCIQo IMIN MUSNICAL)Us6 aaummo
MOIata. tVLUisIc *06 NNW. tow$ Iaan gLuCiiaCU 3606313 IN=m ini FUNNI
MIA Itlasft llOaI "loin mOtl. 6I. t - M ti t1X1TIL At * OC.ICU l 6ON IXl.) KNlRigl _IC EBi Iau mam - . aM *A t ................................ ...................................................... ..................................... ................................................................... ......................................................................................................
Ins a a a a a a a 4, I a a a S n5 I a S 41966 a a II S 40 I 3 36 S a a S 39 Is 0, to i iSItI? I s I 4 a e e a * I S 0 3*. S * * 0 sy
to" 2 S Si a 14 * a i * a I a SS at * a * i1,0o I a so a a a a a a 41 23 0 IS 6 in
1IM a a S a n I 3 69 a a I a a a ay as 4 a tSlIt# - ^ 14 13 6 a m a a s a a ii Is Is n os
iola ae I Si i S is a I 11 a s 14U 3 II SS 5 46Ion 1 i 52 2 27e 14 as I IS ISO 10 35 6 14 2S4 s S S too "I
1ti * I a s 102 Sy ls a I 1a at 2 la I ay U2 14 a Ss 5l5olys s I a1 a2 UO a* 4 a la it 29 41 1 * SI Its 2t ff 1 us11i to I is 28 228 9 89 !I 284 3 11 n la is 22t in By 0 he0
1t91 is * ta a, ato? m zr it is a ma of 4 t 2m i n * 36 ns
for. a 2 82 22 329 as s7 as sa Is za ma 5 36 SYR s so 1 a ISIl9r9 S6 St 14 l0. 4t 16 22 I 60 96 S2 U 6 a 45 3 St WG 11 t4S190 lt 6 It 2e s9a N1 14 64 Is 40 So t 16 Is 14 4St 2 Il, US 15n nu1901 4 1 1 14 ?2 IOOS aS 26 34 45 24 122 532 814 5W 44 41 *S in 4 nu
112 4 4 aU la all St la S1s So 40 n 1S 86 It iNS nIS Il2 43 te as1913 4 5 1 to 9"1 I9 11 14 09 1OQ 34 36 2" 7S 0 StS a at n6 2amtiWa 6 9 54 32 142 is 1 96 116 3 S3 68 822 151 92 U du 5 47 tO pZ19 5 25 244 36 183 6S I e ns 12S 242 401 241 at m S6i S2 15V? an sOS
6ISf a 62848 1120) 41146) 4854g) 6o s) (361 64 (6061 (669 floss) 41) (8131) 41216) It) (421) S4194) (S) tams l6ss (2awsFINNS 2 1U 201 2199 6 22 4 294 22S 440 sn 2890 821 l4 m so 465 5 164
I6 GlA 48c6) (1161 (18SS1 4451) (9901) 414) 4263) £651) 49651) 1261) £1251) 48fl) 406) trio) (404611 "al) (19 2) (ml) (18) t3n")1911 .. -. . . ---- ... .. ... ... .. .. ... ... nssr
SiflC: NINISISI Of fISANCt l(S AMMON I to olImlltim)
'0

AflNDIX 2-2
AAU Ul IuCI (t" tu0 MANK)
us $ iIUia1
9I3tUt. MIAM|sm m . F~. (timeI LIC"l EUIRICAt ItB MI_ G MwfH MuSTIV psuim Mimi OsIu. ulia seF M uwu4tt gapt cmulcus mm S.) m"cAs mAuseAv 1ESaUuE ma 1St. _ t um Sa -m mm................................ ...................................................... ..................................... ................................................................... ......................................................................................................
194 S I 4 * 21 t 2 9 O 0 3 2 14 S 1 #2 S 2 0 41 ~ ~~ a * t 21 ua 1 I 3 I I I 3 5 5 0 0 9 0 3 0 1
Ins 0 * * I a3 a 5 0 1 It * I 0 0 1 * 4I
It" 1 a 12s * 11 2 I a I s a s i 3 I 49
1911 aI 4 3 0 55 I II I 32 I 4 * * * 0 S * teauian 3 a S 141 4 33 a 49 19 II S 3F2t J 34 * S n S *13 II 4 25 tO 519 n Si a 294 42 ii SS 2t ii n2 41 1 45 9 411914 II 4 39 a ns 22 sa U 20 33 as 1} J, n1 M 1* Il * _i" 9 It a a4a r ar i ii 'a ii 11 4 a 2 s a s sn1914 13 a s41 S 21 33 2a 4a 2e IS 49 J I 9 1 44919fM so 1 1 a a 24 34 3a 2 52 aa as aa 1 41 a) 2 IN 41
Ioarr2 t s IO I 2 to At to Is Is la n aS t t
9rs is Il as s2 s22 IS Os U 3 44 Is 9 S is la * 2 W 2U 1
191 43 u 38 a3 134 12 11 9 1 31 IS 13 ia t1 Ss as T14 8 an
Ils 9 S Is 2 139 1 12 5 15 4 It Is 41 * 5 b 3 2SE2 I2 INl993 Ii I I? S 23 14 0 4 90 ? o 2 4 31 *S 13 6 13 9 s4119TY 24 S 1al 6 2*§ 24 54 2 6s ta 1nt
lowa 14 5 iii I 401 4 I
SURCI: NHIMSlSV o iNAISE cut1 0P9M14 I 5'
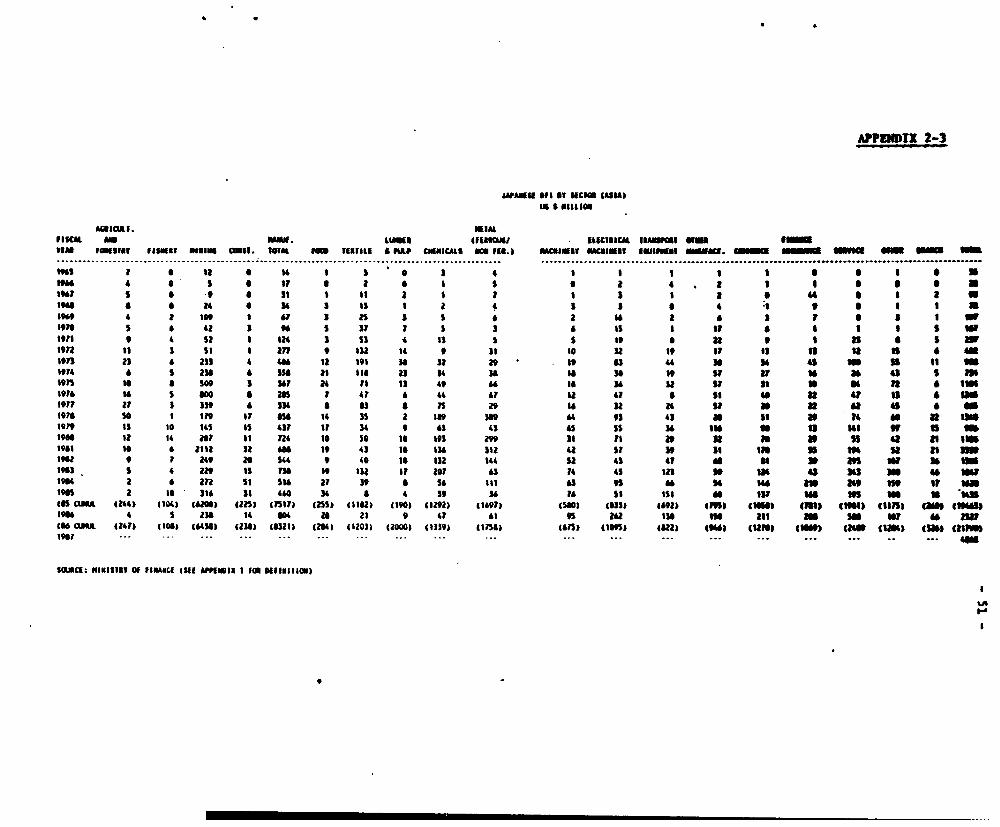
AP?UKNIX 2-3
JWAU Sg 01 MCIU (ASIA)US S MILLION
Iaaata. MZL111m Am _58. 3111 411410/ a IsaIIca 13135 am UU*
"M itineiwm IF&ISA w allow 31 1. TOTAL OU 1311111E At%# CU3NIU&S 63 915.)b SCRIESI tulA3U simM l loweNA. imfte 1U 5569 ORSIN....................................................... ........................................................ ..................................................... ....................................... ...................................... ............................................
"Iss I s la e 14 I s S I 4 I S a 1 SI0U1941 4 a 5 5 It ' a 4 * I 591 5 * .9 a St I It a 1 a I II a 86 it" a a4 a so s Is a a 5 5 2 * *I * * * 4 '11169 2 iW I 11 1 as s s I a a 3 * S I I1t91 5 & 42 * 98 5 1S 1 I 8 *Is I I f loft t 4 sa S 124 I Si 1 1S S S Ut u e *I n * *ion IT s Si a 27n 9 112 14 S 31 so 2 as If is n u a a aion 2Jas * 1 4 4U la t91 St 12 a o 13 44 U 5 41 3 is Is "a1914 A s 25 6 1sn 21 M 2S 54 SO is St SY sr SS 2a 45 5 m1Io5 to a so s soi 24 is is 49 as so sa2 sr it at 72 n *1918 1U s Sao a 2S 1 41 8 U 87 12 4r a so U 47 a 8 asit" 21 5 15 8 Su a ai i 7s 29 I 12 24 r as U St 8 * _1970 so a 119 or Ss se U a tss 2 U9 t4 n4 as Yt go 24 n n 1979 is lS 14s Is 451 IF 4 9 3 41 8 ss 55 si tot s sa w f Atso" 2 a 2er It n2 to so as Ias 2w it it 29 52 n at Ss * in IS9ga as 6 2ian la se 19 43 10 134 SlZ 42 S1 I9 sa In is n0. i n u
1902 9 7 249 26 544 9 40 IS 112 144 52 41 41 AG a5s 19 9 W 28 I111955 S 4 229 IS no a 1I4 It is? AS 14 45 U21 9 %2s 48 181 48 NW1904 2 a 21n Si S1 21 St a 54 IIU 4 t 148 Ue 2a" e it an1915 2 to 311 It 440 1 a 4 o9 36 18 Sl llS AG tw Ne a w u w1uS(Is OLJA (244) 104) (8290), t25) (Sn1 (ass) (i12) 4190) 41292) (891) t(ttn) (5Us) (692) (MD 4310 (M85 (11) clips) (ad" 111815319" 4 S 23 14 tJ4 2a 21 9 41 LI Is 282 1 no all 5 U S w8 3(tS OKtA 4241) (105) (8431) (2 X10 (e2a) (284) MC2) (2000) (1359) (1n18) (85n) (INS) (022 (9") (a2so (NW) (88 (113 (128 121a190- ... ... ... -.- ... ... ... ... ... ... . . ....
SCIs: aMaNSuRY O;f MAKE (Ufi APII I t1 EU Nflilltu)
IA

(m111u1136 WI I NIlddV 13) numI4j ASINI :?33Ss
... ... ... ... . . . .
6M91 tUg W~ (f LUl 19tf nIM u~ Ug tn. tit ts (2 .. - -s tl *t * 191*91 if im m U ~~~~~~~~~~~~~~~~~~~~~~~~~~~ ~~~~~'6 (Isle (if) to") LV) Ingw
"Ml) ttisu cm) Etll limp UM 'tin0 to") t f 12t) (u) NOtZ) Itt) (t199 III (i3 1iwn U8A 9 if eW I1 dSt f 28 O t n U * *t e * n Itt t I I e 0flM WU tt n esIS ua h it * t St t t W *:
" U t. e9 n in w Itt w it oSt ti t1 8 @§*lw e * t 1 on t * *t * S I fl * e g Scugm 9 i SW #91 ff *i2 1 9 5 1 68 699S2
uS t g a m 99 U * St S II 4 o P I * It ma
in 41 it it of VI t r Sl e $ t I t * e e o 9S usI eti £ f if 9 if Of 9s u a gs gggUt 9 @ 6 ~ *9 ii 6 £ 9 91 9 9 St I IS 1 e e o
in S 9 I tt, * * i * 0 9 *131 9 9S 2 Us nI 9t * 2 * * * 9 69 S 9 * 9 1*45UK Os is * § S t tt il t n et e t* XU SO nf * I SS Is S * t is I e e I 9 1 se e o Ut
- u tU I II if 9 6 9 2e I5t 3 9 9 I 56 S f t 9 cl
st w sw I n1 21 * 9 t t t 0 e e e 9t e gi e eSt t I *i * I * *1 9 * O e s *i * I 9 9 tiesb1 a * * * * * * * o g t O g g f *119 gmII I 9 9909 9 993
I S *t * * * * * * * O * * * 2 9 * * * 9412f 9 9 0 9 i 9 9 9 9 o e 9 o 9 9 9 9 5 9 9918
£ ~ ~~ X 9 _ 9 _ 0 l l# I 1 9 2 9 9 v 0 0 693141101, aIa 19 * ,
Willis 9 Sn~~~~~~~~~~~~~~~~~~~~~~ 101111it~~~~~~~~~~~~~~~~~~~~~~~~~~~ 1116
(Nw D19121 UII I fluww
f-Z IlONIdJ1
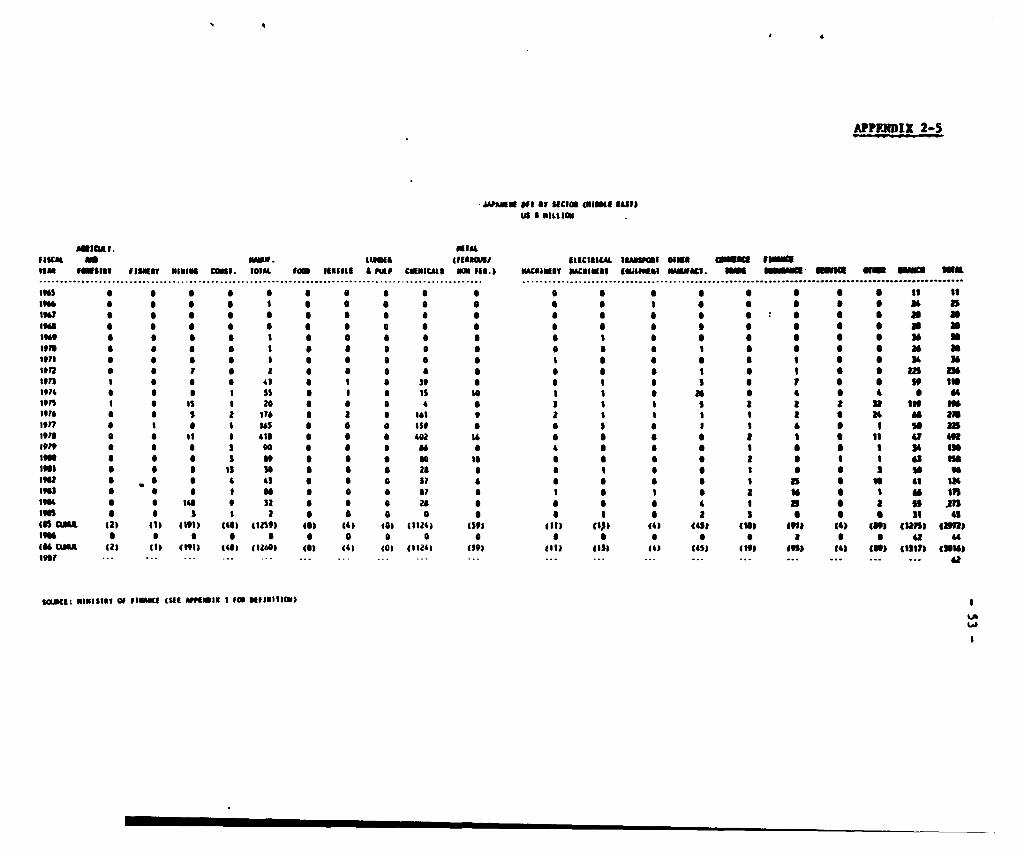
APPNDIX 2-5
uai *u t UCi89 (UISSI tIUI)
emloaI . flEVeLIdStl m llM. 11_uS guirnuu atctasCla aruVJi e435l t J *
amS a a a a t a a o a a a a a a s S S S *4 *
1w? * * * * * * * *z a * a 9 6 6 S 3 3 191 0 S S S I 0 S 0 6 6 S I S S 0 6 S S IS NIll, a a a a a S 0 0 e 8 a S * I 6 S * * so a
a,f a a a a ss s s a s a a a a a* * * * * *4 i
195 a S 15 1 20 0 * S 4 a s a a 5 3 3 2 33 519 IPS S * 5 a a* S 2 S 161 9 2 I I a a a *a aa a
1917 * a a S 195 a a a so 4 a a a a a a * ^ sItasi a a * s Sa a a a a@ s as a a a a a a ai isa 1z e ~ * a a ce 43 a a a ii a a a a a I S 15 4 U195 a a a a ts a a a ti 1a * * * a a ta a a so 5
aa a a aia 9 32 a a a 2u a a a 6 4 a a a ff .31ages a a i a a * a a a a a a a a s a a a ma *545 SU 42) 43 z4191 449 4la) 412§ (43 (01 ( 11243 59 (Ill CIJI(4 4413 (33a 4911 44) 489) gUll) (32)n
464 oBJ 423 sl ("191 (453 (1260 (5) (43 (Ci (12^a LIP (I) gSp( 41 5) (Sb 443 (U)s (ala? (315)s zn es
SaCt: UIKISuIV W llfUA S fffC I (51 iiae mEulUlIII
ANICIA 1. ~ ~ ~ ~ ~ ~ ~ ~ ~ ~ ~ ~ ~ ~ ~ ~ ~ ~ ~ ~ ~ ~ ~ ~ ~ ~ ~ ~ ~ ~ ~ ~ ~ ~ ~ ~ ~ ~~~'film me WAW - dfganml 91.11CISICAL IIMMMI OIWN come= form~~~~~~~~~~~~~~~~~~~~~~~~~~~~~~~~~~~~~L.
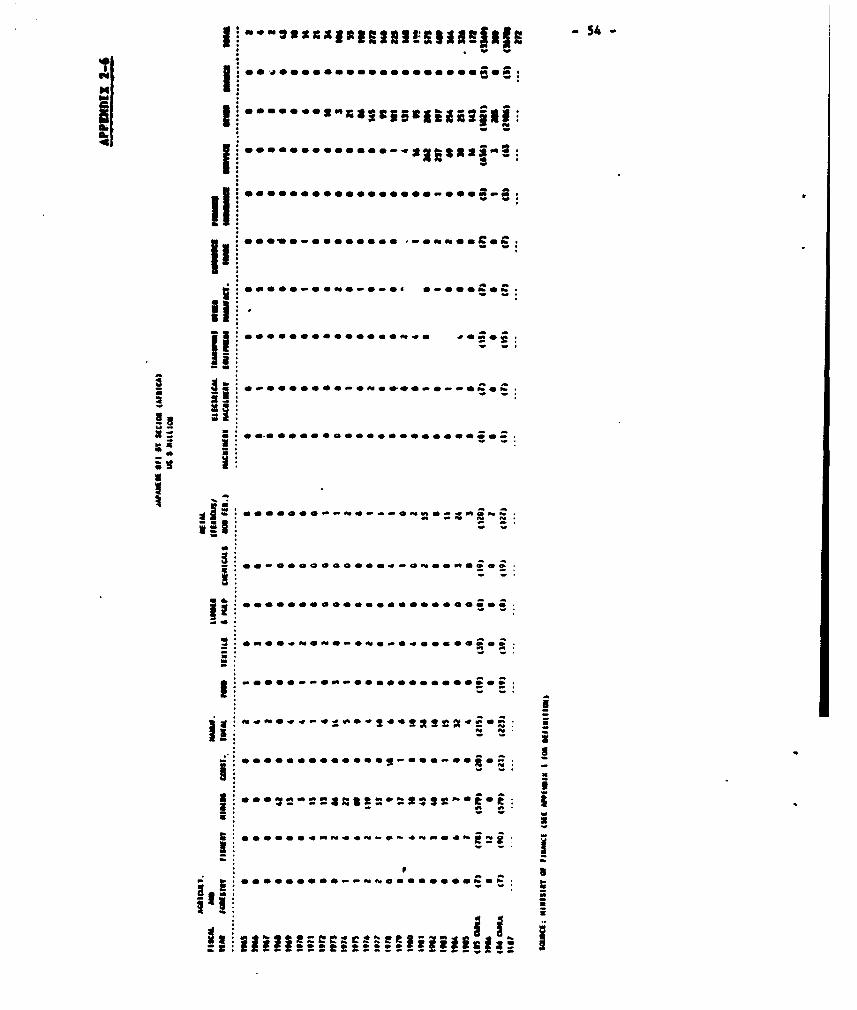
_ii
I i a
* :
| ,.. ..... *...00 0....Q..- ----
-E.a~~~~~~~~
U-'
X- ~.. .. , ........- a. aa.....-*_
_:
_ * . o.oo.....o o
!i-'' -- 0a--. -. , o*o*
. . * .0. .-,,, .. a 0 40 4 0 0a.a
00000-0000-0 *-0-£20: -
* -- *
3: *-.0rn8g.-w-*~-- 0-£202:
9 8
*~~~~~ 3 * 3
t ' fflSst_tI2z£t6tt:X-se s 6
_ r :0000002 2S 22 2' S' 0' _0 00 02 S2 2'-
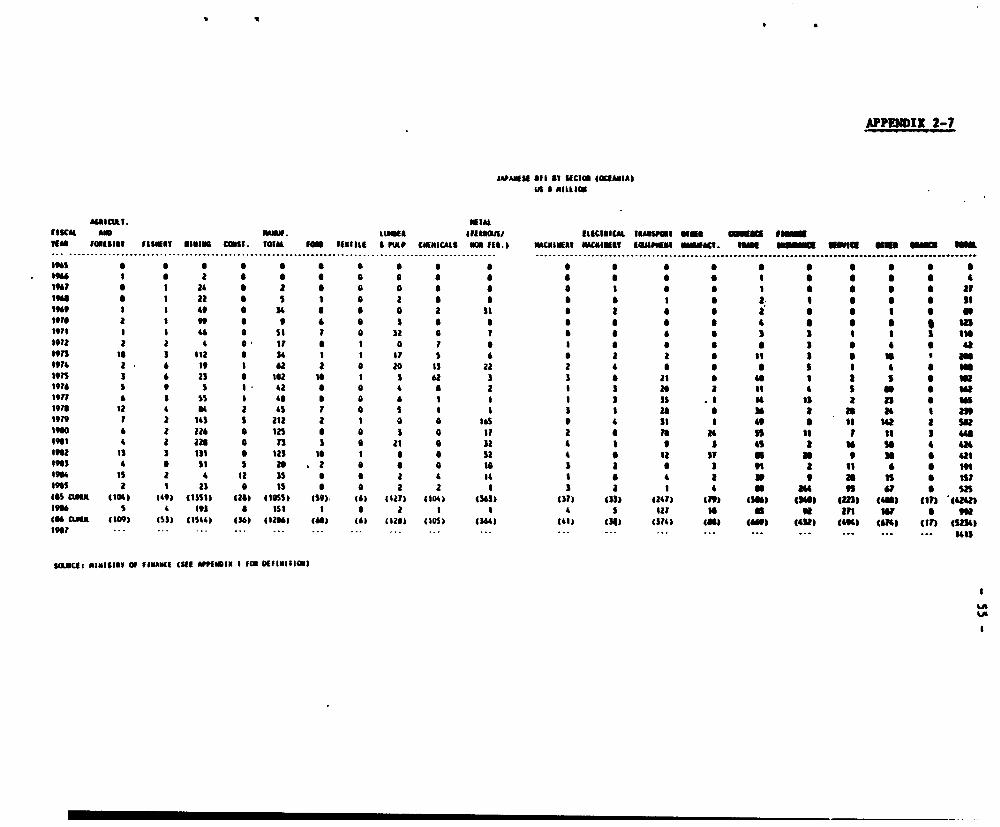
APPENDIX 2-7
JAAIU1 81 SW SEC1 (OEENIAUS S NuhilS
101CUL. N1EMwCA& AM mIUE. LU 4 O9UR=11/ iucuisa tu t * _am
"114 8 S 0 e l E l D SI. " FS S I S f IC.lOl . S SC CIC 1 S f D I SC IS I FC"ASM1 1S1101111_ _ ............................................................................................. ..................... ............................................................................. ......................................................................................................
196 6 a a a a a 0 a a a a * a * * * a S 6It" I u a2 a a a a a a a a a a 41911 * 1 24 Er OOIOO| isa a t 12 a s 1 0 2 S * * * I * 2 * * a * ii1959 I 4 ss ai t a a a a Isi a I n s I * I a a * a a a * i niSV, I I a4 St I a SI a a a a 6 s 5 11sa1isa9si 2 a 4 a It a I a 7 a a 0 4 O 4Unv ts 112 0a 54 , I ? s a * a 2 a Is * a na19is a * I 1 *2 2 a 2m Is 22 2 4 a O O S I * * ilips s 2S a S2 10 1 S 62 s 1 0 21 0 4t a s a an155 5 s S 42 a * a 4 a 2 a 2m a to 4 asa latn " SS s s 0 D a a I I S aS . I Is a a a iSfore ii 4 as a 45 1 a sm a as a a as i as
19719 1 a 14 s ai a a a e 5 4 It I 0 a ii1 UR a sar9a rma 2 Iin 12 a a 1 a II a a is 4 U It 1 Is 2 540
19811 a 22S a n I 21 0 12 * 5 5 a a is U 424fI2 1 a sIl O a 1a I a O Si a sr It3 asN a *at1915 4 a St S 2. a a a a I 5 a a s t a Is G * in19 is a 4 12 is s 0 a a 4 14 4ia Nr 2 S is?19125 a * as a is a a 2 1 S a I 4 U 844 v6 s o2S(IS amen cIDos 449) (I3S1i (25) 4105) 4s9) (Si (la?) 4104) 4SW) (5?) 4)I) t24 t1 WSM (3a) (223a tuui gsly tsam,19" s * Its a I I 0a a I I 4 S ft la u an na o vi245 OlIn 4109) (55) 41144, (56) (laoo) 460) () 4a128) (M)0 ga) (41) (4) 4314) 48.) (40) Oa (495) (1 5) (sa sS23
SOUCS: MSUIlsI O #SMAuC[ (ati M"SIN I fIO K0Fl1lll
U,I
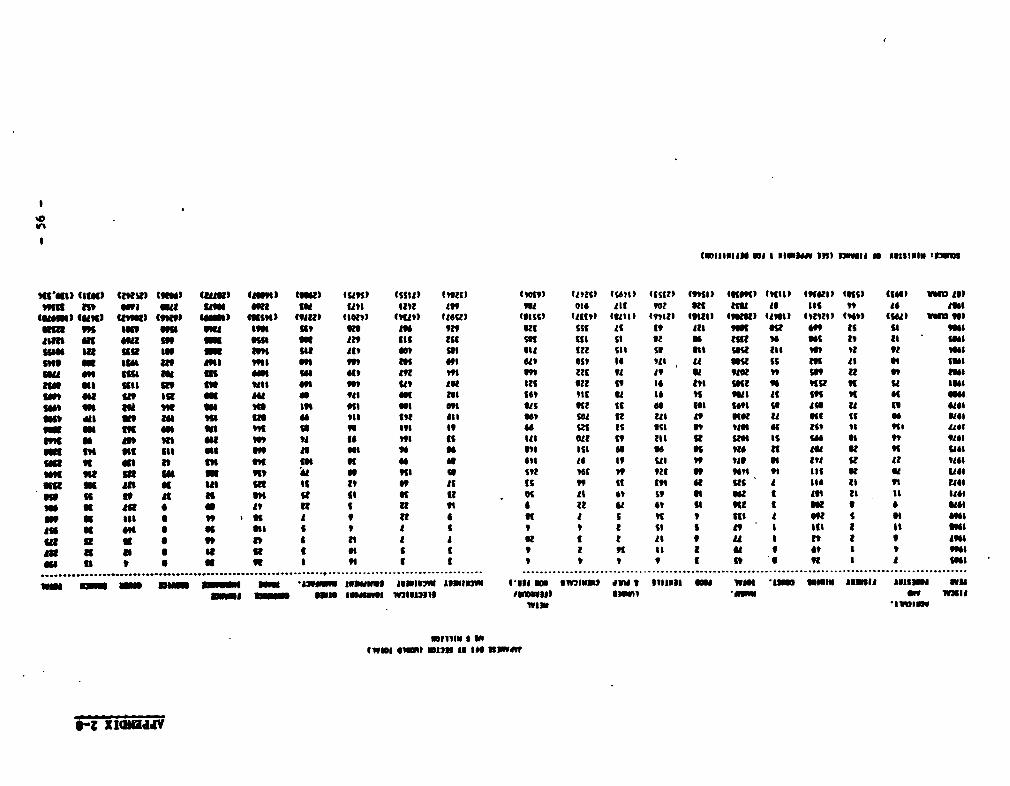
(W111uLNM WO I S IO91340 1311 1A ft 91s1S133 '30U
Ml*&1) fit") omit1) in"W) campW CAM)91 (OW) (1*91)ll (111*) 99) 4991) (Ut;c) (16)1 (fIll) (9,901 (KOK9) ("its 46914) (I31) 11961 uwu AllWm nt _i ads urm 0t1 IN uns mat I99 9 0o6 ltv "2 Kg nu Is Its n * tgSloS ) tow) (t1) GUM) fuIsO (91(1) flef) (9'l9) 1101) (1tsU O t(lit) f553ttl 49,111 £9t12 t49,61 (1m) £2915 (WI S) tS0* U Oam StS "a Omt gm at 9 W 919 IUt SSt IS 9t lit 91 SU 09 is %I 9*8m an 91a of OUK on * Sig la1 S tIti S1t Il 41 Mt 91 WI It El Sul1am In 9 to U 3 me Aft Mt sol l*t t122 Sli so "I Wu lit ti t "it9" m It m " "It nt sn m of 6 Ott to U tit a nu st t Is et SulNu " t mi ass n S9 at m m n * m f * n9' ue mn is n n 09 ml131 as5 Sig5 at9 "It6 a"5 39 19 AK2 lit 922 19 10 391 1012 90 mu1 it 11 1306U639 SO IL" to Su t16 a t it e0 lt 16S n1t 3U 1U IS lug At s1 9t SC out"i am "t o n t T " 1 "n as t "21% K tt got to" to AN u S n U61559 1*a on9 1 "a1 oil t4t 95 19 03 W61' StU tt Ut It not U NC 11 Ko NotWE OK OK o9 t1 tt o log 999 S91 II 00 1t is 3st n *tt 1 t it J J#I3991 41 *39 936 hi on 9* 10 199 is Usi all 1t1 09 14 is 100 95 99 9UK t 96 91 15 K *U 99 #0 S91 90 41 Off iI Go n1 I s Ut1 iS *01Stog1 U619091 9'A 4K 141 t4K 919 0* 41 91 13 Stt Is 99 9t I9 lit 9t III a It 1`*03KU 4K An 1 us we It it n it £t 99 St It9 a us A 150 at fi U&0IP 4 t I 0 99E '910S * 9 t S * 1t SI et " * 4lo I St Is01St~~~~~4 U at s U n tt t .e te GI 4U Is n t ma 1 , NotXSW t lit * It Is A a n I tt vt S us A I et Nm a 6" 0 e G s*ss to a t sl I*S n ' I as is IP Oj4 # #9 S 41 39 * 9 * I 9 9 3 *t £ U9 5 n1 * *t 91we A It * A K t I It 4u Ii t 49* 1609 3 4 6 i9 39 13 21 3 I 9 ad 5 29 9 *105so tt a o f t 9 It 9 A 9n01....... ............... ........................ ........................... ... ... ........ ..... . ..... ..... -....... ................................. .... .... .....................MM M3W MO t _M _O MU 'U3"l_ I"lEJlW bIt AVJII>II 'll§NIK clelts NM t 1110 VWI lilSi a WM IBM Islam alm * Allow wiswim NsoiUS 4MN IWIS W71913113 *33393) SWli.9 wma
"fill" t intmal ~I 013" is Its uoImv
WW 14K 51131 £3" 514 319499w
tz ~XIUM2d
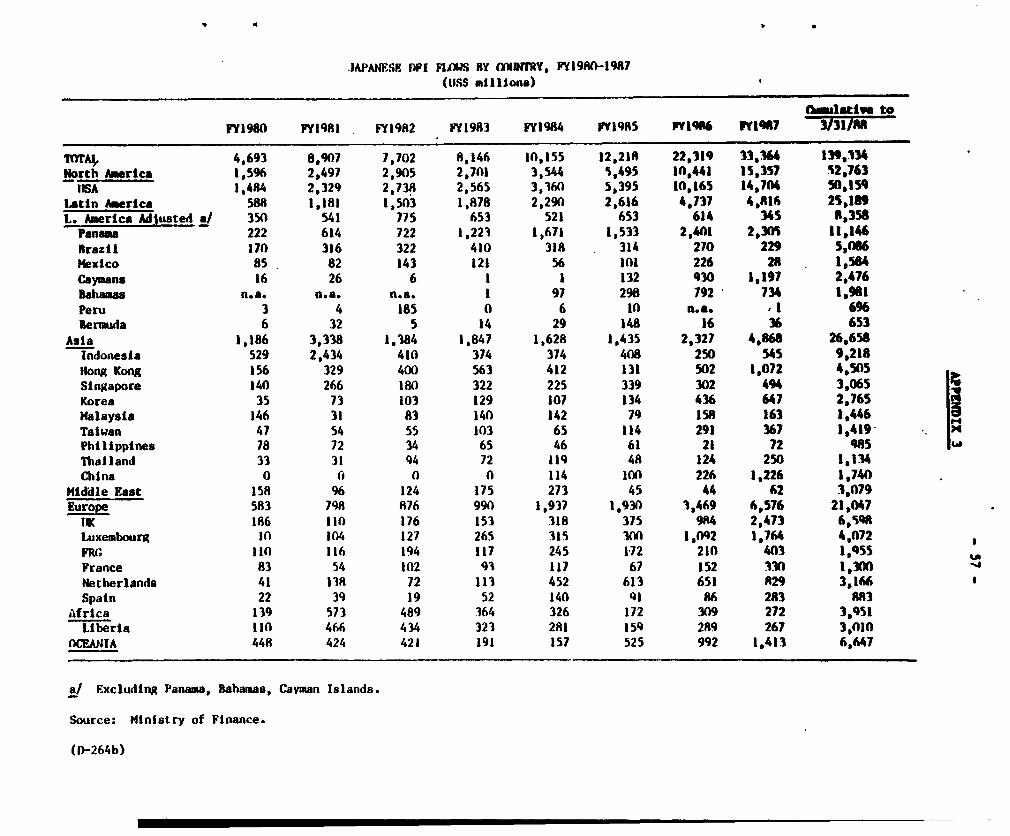
IAPANESE DFI FUIXS BY (aNIRY, PY19RO-1987(1S$ millions)
Eialative toFY1980 FY1981 FY1982 FY1983 FY1984 FY1985 FY1966 WM1967 3/31/PA
m T1F 4,693 8,907 7,702 8,146 10,155 12,218 22,319 33,364 139,334North Aerica 1,596 2,497 2,905 2,701 3,544 5,495 10,441 IS,357 52,763lISA 1,484 2,329 2,1738 2,565 3,360 5,395 10,16S 14,704 50s,ls
Latin America 58R 1,181 1,503 1,878 2,290 2,616 4,737 4,816 2S,189L. Aerica Adjusted a/ 350 541 775 653 521 653 614 345 8,358Panama 222 614 722 1,223 1,671 1,533 2,401 2,310 11,146Brazil 170 316 322 410 318 314 270 229 5,066Mexico 85 82 143 121 56 101 226 2A 1,584Caymans 16 26 6 1 1 132 930 1,197 2,476Bahamas n.a. n.a. n.a. 1 97 298 192 734 1,961Peru 3 4 185 0 6 In n.a. 1 696eremida 6 32 5 14 29 148 16 36 653
Asia 1,186 3,338 1,384 1,847 1,628 1,435 2,327 4,868 26,658Indonesia 529 2,434 410 374 374 408 250 545 9,218Hong Kong 156 329 400 563 412 131 502 1,072 4,505Singapore 140 266 180 322 225 339 302 494 3,065Korea 35 73 103 129 107 134 436 647 2,765Malaysia 146 31 83 140 142 79 158 163 1,446 aTaiwan 47 54 55 103 65 114 291 367 1,419*Philippines 78 72 34 65 46 61 21 72 985 IThailand 33 31 94 72 119 48 124 250 1,134China 0 n 0 0 114 10n 226 1,226 1,740
Middle Past 158 96 124 175 273 45 44 62 3,079Europe 583 798 R76 990 1,937 1.930 3,469 6,576 21,047IIK 186 110 176 153 318 375 984 2,473 6,549Luxembourg In 104 127 265 315 3n0 1,092 1,764 4,072FRC, 110 116 194 117 245 172 210 403 I,QssFrance 83 54 102 93 117 67 152 33n 1,3(00Netherlands 41 138 72 113 452 613 651 829 3,166Spain 22 39 19 52 140 91 86 283 883
Africa 139 573 489 364 326 172 309 272 3,951Liberia 110 466 434 323 281 159 289 267 3,010
OCEANIA 448 424 421 191 157 525 992 1,413 6,647
a/ Excluding Panama, Bahamas, Cayman Islands.
Source: Ministry of Finance.
(D-264b)
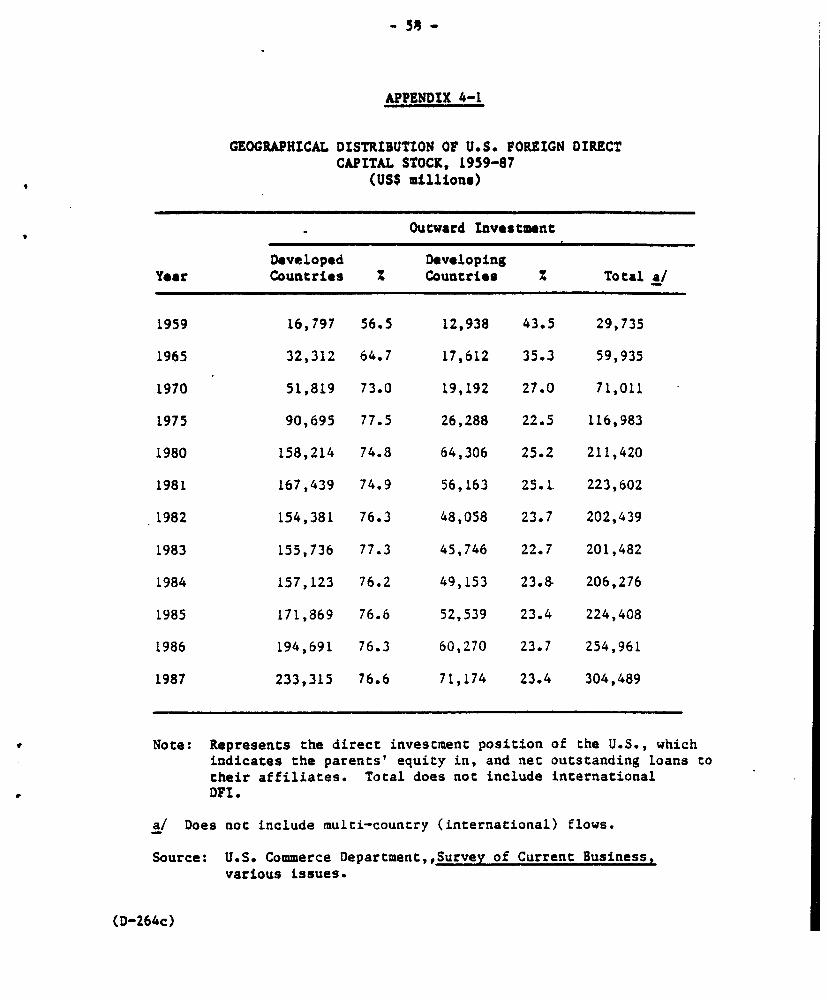
APPENDIX 4-1
GEOGRAPHICAL DISTRIBUTION OF U.S. FOREIGN DIRECTCAPITAL STOCK, 1959-87
(USS millions)
Outward Investment
Developed DevelopingYear Countries % Countries Z Total a/
1959 16,797 56.5 12,938 43.5 29,735
1965 32,312 64.7 17,612 35.3 59,935
1970 51,819 73.0 19,192 27.0 71,011
1975 90,695 77.5 26,288 22.5 116,983
1980 158,214 74.8 64,306 25.2 211,420
1981 167,439 74.9 56,163 25.1 223,602
1982 154,381 76.3 48,058 23.7 202,439
1983 155,736 77.3 45,746 22.7 201,482
1984 157,123 76.2 49,153 23.8- 206,276
1985 171,869 76.6 52,539 23.4 224,408
1986 194,691 76.3 60,270 23.7 254,961
1987 233,315 76.6 71,174 23.4 304,489
Note: Represents the direct invescment position of the U.S., whichindicates the parents' equity in, and net outstanding loans totheir affiliates. Total does not include internationalDFI.
a/ Does not include multi-country (international) flows.
Source: U.S. Commerce Department,,Survey of Current Business,various issues.
(D-264c)
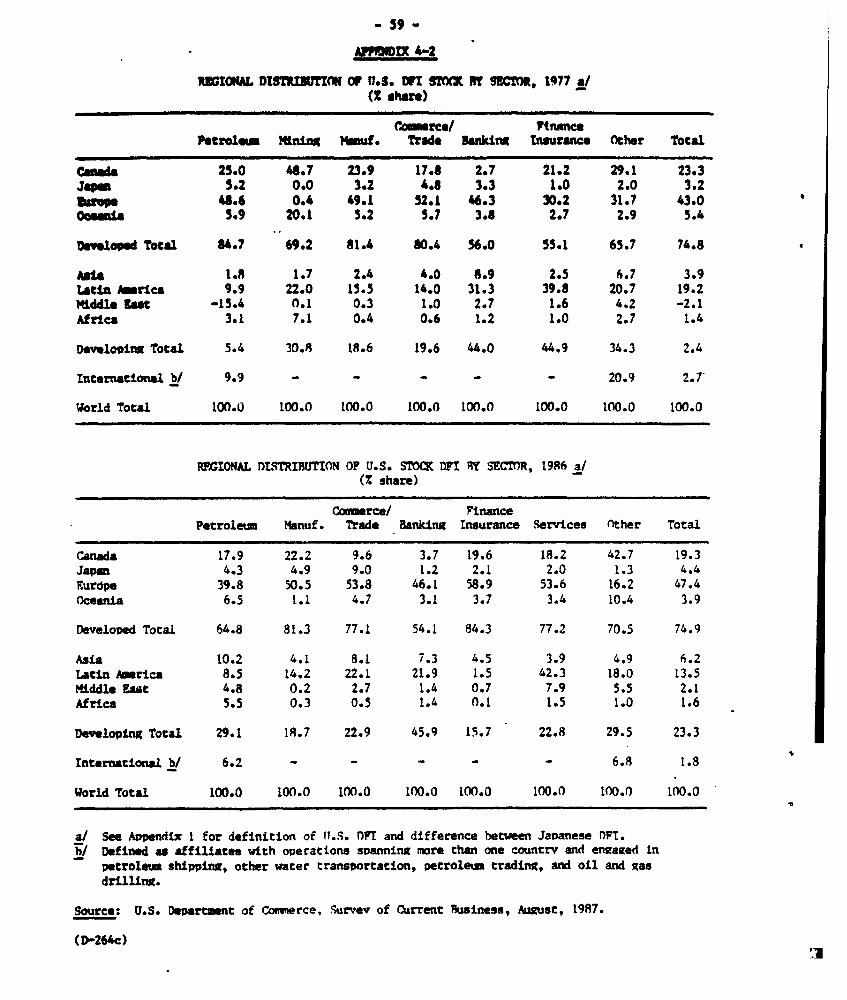
_ 59 -
-ixt 4-2
UCGICKL D2iKsuL3Xr!CN oP n.5. Die PI S1C FM SMC"M, 1977 a/(% share)
Commerce/ PtnancePotroleun Mining Menuf. Trad Danking Insurance Other Total
25.0 48.7 23.9 17.8 2.7 21.2 29.1 23.3Jepen 5.2 0.0 3.2 4.8 3.3 1.0 2.0 3.2
upep U48.6 0.4 49.1 52.1 *6.3 30.2 31.7 43.0Oceania 5.9 20.1 5.2 5.7 3.8 2.7 2.9 5.4
Dveloped Total 84.7 69.2 81.4 80.4 56.0 55.1 65.7 74.8
Aut 1. 1.7 2.4 4.0 8.9 2.5 h.7 3.9Latin mrlca 9.9 22.0 15.5 14.0 31.3 39.8 20.7 19.2Middle Zst -15.4 0.1 0.3 1.0 2.7 1.6 4.2 -2.1Africa 3.1 7.1 0.4 0.6 1.2 1.0 2.7 1.4
Deelcoina Total 5.4 30.8 18.6 19.6 44.0 44.9 34.3 2.4
International b/ 9.9 - - - - - 20.9 2.7
World Total 100.0 100.0 100.0 100.0 100.0 100.0 100.0 100.0
RPTIONAL DISTRIBUTION OF U.S. SMMC DF5 RY SECTR, 1986 a/(% share)
Commerce/ FinancePetroleum Manuf. Trade Banking Insurance Services Other Total
Canada 17.9 22.2 9.6 3.7 19.6 I.2 42.7 19.3Japan 4.3 4.9 9.0 1.2 2.1 2.0 1.3 4.4Furdpe 39.8 50.5 53.8 46.1 58.9 53.6 16.2 47.4Oceania 6.5 1.1 4.7 3.1 3.7 3.4 10.4 3.9
Developed Total 64.8 81.3 77.1 54.1 84.3 77.2 70.5 74.9
Asia 10.2 4.1 8.1 7.3 4.5 3.9 4.9 6.2Latin Amrica 8.5 14.2 22.1 21.9 1.5 42.3 18.0 13.5Middle East 4.8 0.2 2.7 1.4 0.7 7.9 5.5 2.1Africs 5.5 0.3 0.5 1.4 0.1 1.5 1.0 1.6
Developing Total 29.1 18.7 22.9 45.9 15.7 22.8 29.5 23.3
Internationl b/ 6.2 - - - - - 6.8 1.8
World Total 100.0 100.0 100.0 100.0 100.0 100.0 100.0 1o0.0
a/ See Appendix I for definition of l.S. (PT and difference between Javanese nFT.h/ Defined as affiliates with operations svanning more than one countrv and engaged in
petroleum shipping, other water transPortation, petroleum trading, and oil and gasdrillinx.
Source: U.S. D3Partr nt of Conmerce, Survev of Qirrent Business, August, 1987.
(D-264c)'1

-60-
APP3WDIX 5
ftnaucial Incentives for J4p2nese DFS
Institution Interest Rato TYpe of Lending
Export-Znport Lank 5.752 to 6.4%. Loans of funds needed by Japanesecorporations for Investments In orloans to foreign affillates.
Loans of long-term funds nteded byJavanese compantes and their foraignaffiliates to conduct businessactivlties ahroad.
overseas gconomic 4.52 to 5.25%. Loans of funds needed by JapwneseCooperation Fund companies for the undertaking of
development prolects centributingto the industrial development ofdeveloping countries, and foractivities which are recognizedas of primary importance inpromoting economic exchange withJapan.
Financing retarded as esveciallynecessary for the execution ofdevelopment orojects.
Japan International 2.0% to 3.5% Loans of funds needed by JapaneseCooperation Agency (special cases: companies for the uograding of
0.75%). eouipment or for experimentalenterprises relating to develop-oent projects in the agriculture,forestry or mining and manufac-turint industries in develovinwcountries.
Small Business 6.42. Loans of funds reauired forFinance Corp. overseas investments bv small-
scale Javanese companies.
Central Bonk for 6.4%. Loans of funds needed for overseasCoumercial and investments bv cooperatives thatIndustrial include small firms among theirCooperatives members, and bv member companies
of the bank.
Japan Overseas 2.0%. Loans of funds needed by smallDevelopment Japanese enterprises to make manu-Corporation facturing investments in developing
countries at the request of thegovernments of such countries.
Source: Outline of Direct Investment Measures, March 1987.
INDUMY 5131S PAPES
No. 2 trging Patterns of International Comtition in SelectedIdustrial Product Groups. Iebruary 1989
No. 3 Changing Fim Soundaries: Analysis of Technology-SharingAlliances, February 1989