Japan Low Carbon Societies (LCS) Scenarios Study toward 2050
51
Japan Low Carbon Societies (LCS) Japan Low Carbon Societies (LCS) Scenarios Study toward 2050 Scenarios Study toward 2050 Junichi Fujino ([email protected]) NIES (National Institute for Environmental Studies) 2006 AIM Training Workshop 19th October 2006, Tsukuba, Japan 脱温暖化 2050 http://2050.nies.go.jp
Transcript of Japan Low Carbon Societies (LCS) Scenarios Study toward 2050

Japan Low Carbon Societies (LCS)Japan Low Carbon Societies (LCS)Scenarios Study toward 2050Scenarios Study toward 2050
Junichi Fujino ([email protected])NIES (National Institute for Environmental Studies)
2006 AIM Training Workshop19th October 2006, Tsukuba, Japan
脱温暖化2050
http://2050.nies.go.jp
1. Why we need Low-Carbon Societies

?
Global Warming
ContaminationContamination
Deforestation
Waste (3R)
Ecosystem
Illegal Waste TreatmentResourceexhaustion
Network
Others
0.00.20.40.60.81.01.21.4
1950 1975 2000 2025 2050Year
Pop
ulat
ion
(100
mil.
per
sons
)
0
200
400
600
800
1000
1200
1950 1975 2000 2025 2050Year
GD
P(tr
i. ye
n)
Population Decrease
Economic Growth
Medium variant: 127 mil ('00) ➜ 101 mil ('50)
Survey of citizens onenvironmental concerns
(Marks allocated)
http://nikkeibp.jp/style/biz/enquete/051021quick_eco/
Annual growth rate of GDP per capita:
1%/yr – 2%/yr
Population Projections for Japan:2001-2050by National Institute of Population and Social Security Research (2002)
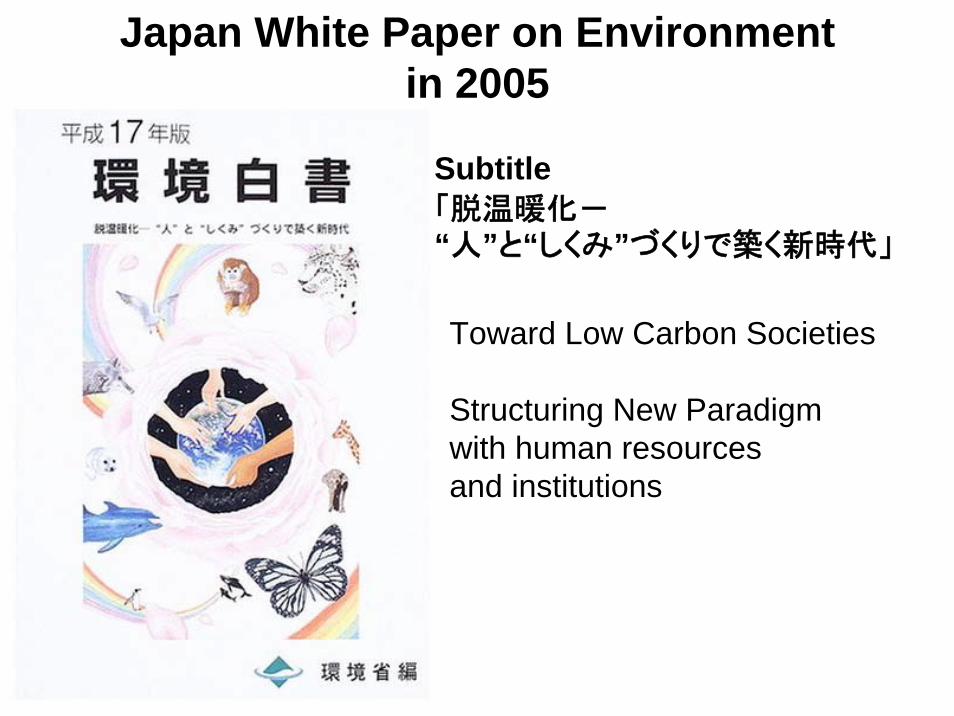
Japan White Paper on Environment in 2005
Subtitle「脱温暖化-“人”と“しくみ”づくりで築く新時代」
Toward Low Carbon Societies
Structuring New Paradigm with human resources and institutions

It has past one and half year since Kyoto Protocol has been enforced, but…
December 1997Kyoto Protocol Adopted
http://www.jccca.org/
Photo: Climate network
February 16 2005Kyoto Protocol Enforced
http://www.nikkei.co.jp/neteye5/shimizu/20050217nd82h000_17.html
Kyoto International Conference Room

1990
1995
1997
2000
20040%
20%
40%
60%
80%
100%
0
100
200
300
400
Total GHG emissions in Japan(Mt-C)
344 370 323:Kyoto Target
Sha
re o
f Sec
tor-
wis
e G
HG
em
issi
ons
(%)
Industry
Commercial
Residential
Transportation
CO2350.7
CH4, 6.7N2O, 7.0HFC, 2.3PFC, 1.7SF6, 1.2
FY FY 20020044
Can Japan observe Kyoto target?
7.4% increase compared with that in 1990
National Greenhouse Gas Inventory Report of JAPAN (2006.8)Ministry of the Environment, JapanGreenhouse Gas Inventory Office of Japan (GIO), CGER, NIES
6% reduction
We have to reduce
13.4%!

AIM, NIES
AIM/Enduse
AIM/Top-downFossil fuel Electricity
Non-energy goods
CO2
CO2
Production sector
Government
Household
Investment
Production factor
Rent
CO2
CO2
Consumption
Consumption
AIM/Material
Prod. sector
Household
Pollution Man.sector
market
Government
CapitalLabor
Pollution
EnergyFinal cons.
EnergyIntermediate
Recycle
Produced commodities
EnergyIntermediate
CO2
CO2
CO2
Env. capitalLabor
Env. IndustryEnv.
investment
Foreign
Trade
Internationalprice and trade
Energy Energy technology Energy service
• Oil• Coal• Gas• Solar• Electricity etc.
• Blast furnace• Power generation• Air conditioner• Boiler• Automobile etc.
• Crude steel products• Sectoral GDP• Cooling demand• Lighting• Transportation etc.
Energy consumptionCO2 emissions
Technologyselection
Energy servicedemands
Energy database• Energy type• Energy price• Energy constraints• CO2 emission factor
Technology database• Technology price• Energy consumption• Supplied service
amounts• Technology share• Lifetime
Socioeconomic scenario• Population growth• Economic growth• Industrial structure• Employment• Lifestyle
Ener
gy e
ffici
ency
impr
ovem
ent
Model analysis on CO2 reduction policyModel analysis on CO2 reduction policy
CO2 reductionin Japan
Model analysisAIM/EnduseAIM/Top-downAIM/MaterialConclusion

AIM, NIES
Carbon tax rate and required additional investmentsCarbon tax rate and required additional investmentsfor reducing CO2 emissions in Japanfor reducing CO2 emissions in Japan
sector Subsidized measures and devicesAdd.
investment
Industrial sector
Boiler conversion control, High performance motor, High performance industrial furnace, Waste plastic injection blast furnace, LDF with closed LDG recovery, High efficiency continuous annealing, Diffuser bleaching device, High efficiency clinker cooler, Biomass power generation
101.3
Residential sector
High efficiency air conditioner, High efficiency gas stove, Solar water heater, High efficiency gas cooking device, High efficiency television, High efficiency VTR, Latent heat recovery type water heater, High efficiency illuminator, High efficiency refrigerator, Standby electricity saving, Insulation
353.9
Commercial sector
High efficiency electric refrigerator, High efficiency air conditioner, High efficiency gas absorption heat pump, High efficiency gas boiler, Latent heat recovery type boiler, Solar water heater, High efficiency gas cooking device, High frequency inverter lighting with timer, High efficiency vending machine, Amorphous transformer, Standby electricity saving, Heat pump, Insulation
194.5
bil. JPY / year
Model analysis on CO2 reduction policyModel analysis on CO2 reduction policy--BottomBottom--up model approachup model approach--
CO2 reductionin Japan
Model analysisAIM/EnduseAIM/Top-downAIM/MaterialConclusion

AIM, NIES
Carbon tax rate and required additional investmentsfor reducing CO2 emissions in Japan (continued)
sector Subsidized measures and devices Add. investment
Transportation sector
High efficiency gasoline private car, High efficiency diesel car, Hybrid commercial car, High efficiency diesel bus, High efficiency small-sized truck, High efficiency standard-sized track
106.6
Forest management
Plantation, Weeding, Tree thinning, Multilayered thinning, Improvement of natural forest 195.7
Total 952.0bil. JPY / year
Tax rate to appropriate required subsidiary payments (JPY/tC) 3,433
Model analysis on CO2 reduction policyModel analysis on CO2 reduction policy--BottomBottom--up model approachup model approach--
CO2 reductionin Japan
Model analysisAIM/EnduseAIM/Top-downAIM/MaterialConclusion
AIM, NIES
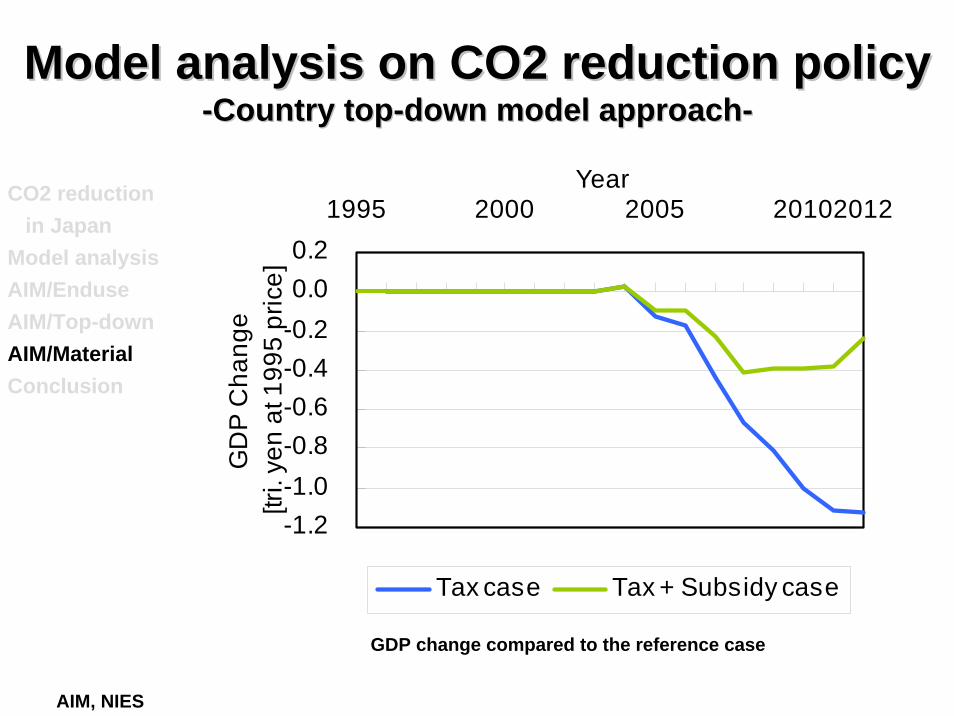
-1.2-1.0-0.8-0.6-0.4-0.20.00.2
1995 2000 2005 20102012Year
GD
P C
hang
e[tr
i. ye
n at
199
5 pr
ice]
Tax case Tax + Subsidy case
Model analysis on CO2 reduction policyModel analysis on CO2 reduction policy--Country topCountry top--down model approachdown model approach--
GDP change compared to the reference case
CO2 reductionin Japan
Model analysisAIM/EnduseAIM/Top-downAIM/MaterialConclusion

19781998
Melting Himalayan Glaciers
Mountainous glaciers were retreated drastically during 20th century

Surface Air Temperature Change (1990=0 oC)CCSR/NIES/FRCGC, Japan

Observed Impacts of Global Warming Retreat of Glaciers
Tianshan Glaciers (disappeared by 22% for the past 40 years)
Tibettian Glaciers (disappeared 4420km2 (9%) for the past 30 years)
Himalayan Glaciers (500,000 km2 to 100,000 km2 by 2035)
Heat Wave
45-49oC in May, 2003 in India (1600 death)
2-3 oC increase in July, 2004 in Japan (heat stroke patients more than 600 in Tokyo)
Typhoon
10 typhoon landed in 2004 in Japan (>200 death, 120 billion $ damage)
Increasing damage in Philippines (900 death, Nov. 2004, >500 , Dec. 2004)
Wind Storm
Increasing wind storm in Mongolia
Session1-1 Hedeo Harasawa

To avoid serious CC impacts, it is likely to be necessary of temperature raise stabilization below 2 degree compared with pre-industrialized level
IPCC TAR, 2001
22°°CC

BaU GHG-475ppm GHG-500ppm GHG-550ppm GHG-650ppm
0
5
10
15
20
25
1990
2000
2010
2020
2030
2040
2050
2060
2070
2080
2090
2100
年
温室
効果
ガス
排出
量 (二
酸化
炭素
換算
:G
tC/年
)
0.0
1.0
2.0
3.0
4.0
5.0
1990
2000
2010
2020
2030
2040
2050
2060
2070
2080
2090
2100
2110
2120
2130
2140
2150
年
気温
上昇
(199
0年=0
.6℃
)Temperature raise(global average)
Global GHG emissions
•It is estimated that around 50% GHG reductions in 2050 are required to control temperature raise below 2C•Japan may be required more reduction (60-80%).Another country-level 2050 scenarios have been studied (UK 60%, Germany 80%, France 75%, and so on).
GHG475ppmGHG: Greenhouse gases
50% reduction
Calculated by AIM/Impact[policy]Model
•Impacts will be occurred even in 2C temp control.•Adaptation is necessary.
650550500
BaU
GHG475ppm
Tem
pera
ture
rais
e(a
bove
the
pre-
indu
stria
l lev
el)
Year Year
GH
G e
mis
sion
s (G
t-Ceq
)
475
650550500
BaU

2. How to find pathways toward Low-Carbon Societies

Back-casting from future target world
2020 20502000
Long-term target year
Release of A
IM result
Technology development,socio-economic change projected by historically trend
Forecasting
Back-casting
Normative target world
Reference future world
Service demand change
by changing social behavior, lifestyles
and institutions
Mitigation Technology
developmentRequiredPolicy
intervention and Investment
required intervention policy and measures
Envi
ronm
enta
l pre
ssur
e
Checkingyear(2015)
Checkingyear(2025)
Requ
ired
int
erve
ntion
3. We need“Trend Breaks”
to realize visions
2. We need“Visions”
1.Target may be tough
60-80% reductions

CO2 emissions=PopActivity Energy CO2
× Pop Activity Energy× ×
+ + +
Changerate
CO2emissionChange rate
PopChange rate
ActivityPop
change rate
EnergyActivity
change rate
CO2
Energychange rate
=
integral
differential
Total
Change rate=speed
Total amount
Per capitaactivity
EnergyIntensity
CarbonIntensity
How fast GHG emissions should be reduced?
-0.5%/year 1.5%/year-2~3%/year
1%/year
Y%/year X%/year
-3~4%/year
60-80% reductions
Kaya identity
1.Target may be tough

Energy Intensity(EI)Com/Tran Ser. DemCarbon Intensity(CI)Nuclear power
–3 –2 –1 0–3
–2
–1
0
Carbon intensity (%/y)
Ene
rgy
inte
nsity
(%/y
)
Japan(90–00)
France
Germany
UK60-00
Japan(90–00)
60-0060-00
50% reduction
60% reduction
70% reduction
80% reduction
90% reduction
Switchover
B2
Revival
Saving energy
Combine option
(90–00)
(90–00)
(90–00)
(Source: Kawase et al. 2005)40% reduction
30% reduction
20% reduction
Cha
nge
rate
of E
nerg
y In
tens
ity o
f GD
P (%
/yea
r)
Change rate of Carbon Intensity of Energy (%/year)
Range of MaximumEI Change experienced
for country-level
CO2 Reduction rate during 50yrs with 1%
GDP growth rateincluding CCS (Carbon Capture and Storage)
excluding CCS
How fast we have to reduce GHG emissions?
Japan scenariotoward 2030
UK, Germany, FranceToward 2050
Available reduction rate over 50yrs with 1%/yr
GDP growth rate
1.Target may be tough

Global cooperation Economy Growth(eg BRICs)
Aging anddwindling birthrate
Competition/Slow life
Immigration/Migration
IndustrialStructure
Centralization/Decentralization
Big government/Small government
ICTInnovation
Technology RD&D
ConsumptionPattern
Energy Supplysystem
Financial Market
Urban System
Industrial Structure
TransportationSystem
ICT
Global trade regime
TechnologyInnovation
Urban-living/Rural-living
Global cooperation Division of Labor
Diplomacy
TaxationSystem
(Elements strongly related to GHG emissions and LCS development)
Dominant elements for GHG emissions and national development for Japan
Investigating development path toward LCS by back-casting approach
Generating possible combinations of major elements for LCS study
(Glo
bal)
(Dom
estic
)(Major elements determine
Japanese development path)
Est
imat
ing
emis
sion
per
mis
sion
with
ass
umpt
ion
of
poss
ible
glo
bal p
artic
ipat
ion
and
glob
al G
HG
targ
et
2. We need “Visions”

Vision A Vision B
Vivid, Technology-driven Slow, Natural-oriented
Urban/Personal Decentralized/Community
Technology breakthroughCentralized production /recycle
Self-sufficientProduce locally, consume locally
Comfortable and Convenient Social and Cultural Values
As for LCS visions, we prepared two As for LCS visions, we prepared two different but likely future societiesdifferent but likely future societies
2. We need “Visions”Akemi Imagawa

Key concepts of two scenariosKey concepts of two scenarios
2. We need “Visions”

Key concepts of two scenarios (2)Key concepts of two scenarios (2)
2. We need “Visions”
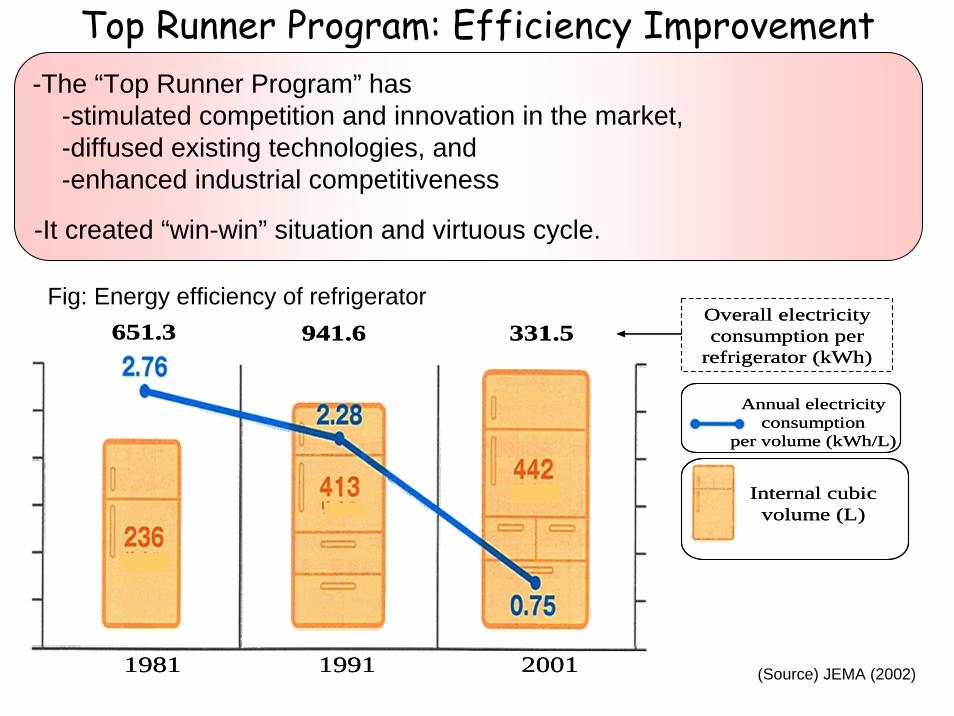
-The “Top Runner Program” has-stimulated competition and innovation in the market,-diffused existing technologies, and -enhanced industrial competitiveness
-It created “win-win” situation and virtuous cycle.
Top Runner Program: Efficiency Improvement
(Source) JEMA (2002)
Annual electricity consumption
per volume (kWh/L)
Internal cubic volume (L)
1981 1991 2001
651.3 941.6 331.5Overall electricity consumption per
refrigerator (kWh)
Annual electricity consumption
per volume (kWh/L)
Internal cubic volume (L)
1981 1991 2001
651.3 941.6 331.5Overall electricity consumption per
refrigerator (kWh)
Fig: Energy efficiency of refrigerator

0.0
1.0
2.0
3.0
4.0
5.0
6.0
7.0
8.0
9.0
1995 2000 2005 2010 2015 2020 2025 2030 2035 2040 2045 2050 2055
CO
P (C
oeffi
cien
t of p
erfo
rman
ce)
Best
Average
Worst
Historical
Projected energy efficiency improvement: Projected energy efficiency improvement: AirAir--conditioners for cooling and heatingconditioners for cooling and heating
AISTMOE
METI METI

On these two scenarios, we allocate possible On these two scenarios, we allocate possible trendtrend--breaking optionsbreaking options
3. We need “Trend Breaks” to realize visions

To analyze the feasibility and impacts of To analyze the feasibility and impacts of interventions with the modelsinterventions with the models
3. We need “Trend Breaks” to realize visions

Technology details: example of Hybrid vehicleTechnology details: example of Hybrid vehicle
Hybrid vehicleHybrid vehicle
SDB - develop intervention scenarios

Energy supply & demand
:Model
:Output of model
Macroeconomic
Stock Activity
Populationand
householdmodel
Residentialsector
Commercialsector
Transpor-tationsector
Industrialsector
Energybalance
table
Pop
ulat
ion
Labo
r
Service
Mat
eria
l sto
ck &
flow
mod
el
Energy Trns.sector En
ergy
supp
ly
mod
elEfficiency
Bui
ldin
g dy
nam
ic m
odel
Env
ironm
enta
l opt
ion
data
base
, Bot
tom
-up
engi
neer
ing
mod
el
Passenger Trns.demand modelFreight Trns.
demand model
Inte
r-sec
tor a
nd m
acro
eco
nom
ic m
odel
Household Prd.& lifestyle model
Residential energyservice model
Commercial energyservice model
Industrial production model
Stock
Preference of household
Production amount
Investment
EnergySnapshot
Tool:Data flow

Efficient useNew energy
InfrastructureEco-lifestyle
Super high efficiency air-conditioner
Stand-by energy reduction
LED lightPV on roof
Fuel cell cogeneration
Heat insulation house
Hot water supply by heat pump or
solar heating
HEMS (Home Energy
Management System)
Eco-life Navigation
COP=8for cooling
EnvironmentEducation
10-20% reduction
66% reduction oflighting demand
60% reduction of heat demand
33% reduction COP=5 for warming
3-4kW
Depict Future Image: Residential sector in 2050
10-20% reduction

0
10
20
30
40
50
60
BaU Option1 Option2
2000 2050 2050 2050
Ener
gy d
eman
d in
resi
dent
ial (
Mto
e ) cooling heating hot water cooking lighting others
32% reductions withHigh eff. insulation,HEMS/Eco-life, etc
25% reductionswith heat pump,LED lighting,standby powercontrol, etc
Energy demand in residential sector in Japan, 2050

UK, February 2005“40% House”
60% reductions
Japan, June 2005Guidance for Self-sustained Residential, 50% reductions

AIM Training WorkshopOhyama Hall, NIES, Ibaraki, Japan, Oct 16-20, 2006
AIM/Energy Snapshot toolTomoki Ehara
Structure of the model Back GroundBack Ground
Structure & Flow
Operation Operation
Demand Setting 1Demand Setting 1
Exercise 1Exercise 1
Demand Setting 2Demand Setting 2
Exercise 2Exercise 2
Transformation SecTransformation Sec
Exercise 3Exercise 3
AnalysisAnalysis
Exercise 4Exercise 4
Contents
EBEBEBEB
CtlFactors
PWRTR_FTR_PCOMIND RES
Factor Analysis(D, E/D, C/E, C’/C)
Energy efficiency
Energy Balances
Energy consumption
Service share
Service demand Service demand
Energy efficiency
Service share
CO2 emission CO2 emission
Mixture
Own use
Loss
Electricity demand
Generation byenergy input
Efficiency
Mixture
Own use
Loss
Electricity demand
Generation byenergy input
Efficiency
Energy consumption
CO2 emission tablesCO2 emission factor
CO2 emission factor
Energy consumption
Energy consumption
: Endogenous variables: Exogenous variables
<Base year> <Target year> <Base year> <Target year>

CO270%reductions Industry Res Ser
PasTrans.
FreightTrans.
0 100 200 300 400
2000
Scenario A
Industry Residential ServicePassengerTransporation
FreightTransportation
2050
2050
Energy demandstructure
一次エネルギー供給
Coal Oil Gas
Biomass
Nuclear
Hydro
Photo/Wind
- 100 200 300 400 500 600
2000
Coal Oil Gas Biomass Nuclear Hydro Photo/Wind
(Mtoe)
Energy supplystructure Centralized style
Decentralized styleMicro grid
2050
2050
(Mtoe)
Demand reduction
Scenario B
Scenario A
Scenario B

Main driving forces to reduce CO2 emissions Category
Soci
ety ・reduce raw material production・decrease numbers of population/household
Activity
・Increase rate of natural gas use CI
EE
CI
・Motor-driven mobiles: Electric Battery Vehicles, Fuel Cell Battery Vehicles
EECI
・Advanced fire plant + CCS・Hydrogen supply using fossil fuel + CCS
CCS
・High efficiency hair-conditioner, hot water heater, lighting system
・Fuel cell system, Photovoltaics on the roof
EE
SD
SD
CI
・Production efficiency improvement
Industry
・Use of high insulation system・Control of home energy system
Residential
・Replacement of working/living place・Public transportation
Transportation
・Nuclear energy・Use of electricity in night time, Electric storage・CO2-free hydrogen supply
Energy supply
23MtC
27MtC
16MtC
8MtC
21MtC
11MtC9MtC
30MtC
41MtC
30MtC
11MtC
amount*
* CO2 reduction amount compared with the emissions in 2000
amountServiceDemand
(SD)40
EnergyEfficiency
(EE)78
CarbonIntensity
(CI)79
CCS30
Countermeasures to achieve 70% reductions toward 2050 (A)D
emand side
Supply side
CCS: Carbon Capture Storage

Service demand improvement
Energy efficiency improvement
Fuel mix change in end-use sectors
Fuel mix change in power sector
Total
Factor decomposition of COFactor decomposition of CO22 emission reduction emission reduction in 2050, Japanin 2050, Japan
-19%
-37%
-18%
-34%
-72%
-26%
-21%
-49%
-15%
-72%
-80%-60%-40%-20%0%

0
20
40
60
80
100
120
140
2000 2010 2020 2030 2040 2050
Popu
latio
n (T
hous
and)
80-60-7940-5920-390-19
0
1 0
2 0
3 0
4 0
5 0
6 0
2005
2010
2015
2020
2025
2030
2035
2040
2045
2050
Milli
on
W o o d e n d e ta c h e d N o n -w o o d e n d e ta c h e dW o o d e n a p a r tm e n t N o n -w o o d e n a p a r tm e n t
0
200,000
400,000
600,000
800,000
1,000,000
1,200,000
1,400,000
1,600,000
2000 2005 2010 2015 2020 2025 2030 2035 2040 2045 2050
Number of Dwelling by typePopulation by age
Transportation demand by mode
Bus Aviation Pass.car Maritime Railway Walking & Bicycling

0
50
100
150
200
250
300
350
Agric
ultur
eFo
restr
yFis
hing
Coal
minin
gCr
ude o
il & N
G mi
ning
Othe
r mini
ngFo
od pr
oduc
ts &
beve
rage
sTe
xtiles
Pulp,
pape
r & pa
per p
rodu
ctsPu
blish
ing &
ingCh
emica
l mate
rials
Chem
ical p
rodu
ctsPe
troleu
m pr
oduc
tsCo
al pr
oduc
tsNo
n-me
tallic
mine
ral
Pig i
ron &
crud
e stee
lOt
her s
teel p
rodu
ctsNo
n-fer
rous
meta
lFa
brica
ted m
etal p
rodu
ctsMa
chine
ryEl
ec.m
achin
e, eq
uip. &
supp
lies
Tran
spor
t equ
ipmen
tPr
ecisi
on in
strum
ents
Othe
r man
ufactu
ring
Cons
tructi
onTh
erma
l pow
er pl
ant
Non-
therm
al po
wer p
lant
Town
gas
Wate
r sup
plyW
holes
ale &
retai
l trad
eFin
ance
& in
sura
nce
Real
estat
eRa
ilway
tran
spor
tRo
ad tr
ansp
ort
Wate
r tra
nspo
rtAi
r tra
nspo
rtOt
her t
rans
port
Comm
unica
tions
Publi
c ser
vice a
ctivit
iesOt
her s
ervic
e acti
vities
<Sectors>
Tri.
yen
at 2
000
pric
e
2000 2050 A 2050 B
Economic impact analysis using CGE model

Estimated automotive CO2 emissions by different regions in Japan
Moriguchi & Matsuhashi, 2005
0.00
0.50
1.00
1.50
2.00
2.50
0 20 40 60 80 100 120 140
Accumulated population in Japan[million]
Auto
motive
CO
2 p
er
cap
ita[
t-CO
2/ye
ar]
Metropolitan region Outlying region
Citie
s w
ith a
pop.
of
0.5
mill
ion a
nd
above
Citie
s w
ith a
pop.
of
0.3
mill
ion a
nd
above
Citie
s w
ith a
pop.
of
0.1
mill
ion a
nd
above
Citie
s w
ith a
pop.
of
less
than
0.1
mill
ion
Citie
s w
ith a
pop.
of
0.5
mill
ion a
nd
above
Citie
s w
ith a
pop.
of
0.3
mill
ion a
nd
above
Citie
s w
ith a
pop.
of
0.1
mill
ion a
nd
above
Citie
s w
ith a
pop.
of
less
than
0.1
mill
ion
Counties
of
urb
an lan
d use
Counties
Counties
of
plai
n f
arm
lan
d
Counties
of
mid
land
farm
lan
d
Counties
of
mounta
in f
arm
lan
d
Maj
or
citie
s

Shiga Prefecture VisionsShiga Prefecture Visions
http://www.pref.shiga.jp/koho/2006-01/03.html

50
60
70
80
90
100
110
120
130
Case A
2000 20301990
Emission Factor of Electricity
Fuel Switch
Compact City- Halve trip distances
TechnologicalInnovation
Lifestyle
BaU(+20%)
1.Both supply & demand measures necessary to reduce CO2 emission by 30%2.Substantial contribution of compact city
-30%
Supply
Demand
CO2 Emission Transitions (1990 level=100)
Renewable Energy
Shimada (2006)

+ + +CO2emission
Change ratePop
Change rate
ActivityPop
change rate
EnergyActivity
change rate
CO2
Energychange rate
=
Per capitaactivity
EnergyIntensity
CarbonIntensity
-0.5%/year 1.5%/year
How can we reduce GHG emissions?
-2~3%/year
1%/year
Y%/year X%/year
-3~4%/year
Energy EfficiencyEnergy SavingEco-industryEnv. sound transpirationCompact city
Enhance/Keep service level,use less energy
Fuel switchingRenewablesNuclearCCSHydrogen/Fuel cell
Use less GHG intensive fuel
Green GDPSD indexLifestyle change
Change of growth pattern
3. We need global participation to realize low-carbon societies

Scenarios from 8 countries
NIES COP11 and COP/MOP1 side eventon December 3rd in Montreal
Global Challenges Toward Global Challenges Toward LowLow--Carbon Economy Carbon Economy (LCE)(LCE)
-Focus on Country-Specific Scenario Analysis-
JapanLow Carbon
Society 2050

US
Canada
UK
France
China
India
W orld
0
1
2
3
4
5
6
7
1970
1980
1990
2000
2010
2020
2030
2040
2050
CO
2 per
cap
ita e
mis
sion
s (t-C
/cap
)
GermanyMETI, Japan2030 scenario
Current per capita CO2 emissions and Target
Target for Low Carbon SocietyIB1
IA2
Japan 2050 scenario
US: delay for tech development, global warming business
EU: Initiatives toward LCSJapan: Need long-term vision
Developing countries: earlierguidance toward LCS is key
$200/t-C scenario
Shuzo Nishioka, Junichi Fujino; NIES COP11 and COP/MOP1 side eventGlobal Challenges Toward Low-Carbon Economy (LCE), Dec.3, 2005

JapanJapan––UK Joint Research ProjectUK Joint Research ProjectDeveloping visions for a Low Carbon Society (LCS) Developing visions for a Low Carbon Society (LCS)
through sustainable developmentthrough sustainable development
Organized by Organized by MoEJMoEJ, , DefraDefra, NIES, UKERC, , NIES, UKERC, Tyndall Centre for Climate Change ResearchTyndall Centre for Climate Change Research
Japan and UK promote studies toward achieving a Low Carbon Society (LCS) by 2050 in collaboration, encourage other countries to engage in LCS studies, and jointly hold series of international workshops. The first workshop was held in June 2006 in Tokyo involving researchers and governmental officials from about 20 countries, and international organizations.

Participants from 19 countries;Asia: Japan, China, India, Thailand, Taiwan (China)Africa: South Africa, NigeriaEurope: UK, France, Germany, Denmark, Spain, Netherlands, RussiaLatin America: Brazil, Mexico, ChileNorth America: US, Canada
A second workshop will be held in UK, 2007.
11stst workshop on Japan workshop on Japan –– UK Joint Research ProjectUK Joint Research ProjectDeveloping visions for a Low Carbon Society (LCS)Developing visions for a Low Carbon Society (LCS)
through sustainable development on June 2006through sustainable development on June 2006

““Aligning sustainable development & climate Aligning sustainable development & climate change actions can reduce the burden and change actions can reduce the burden and facilitate the transition to stabilization. LCS is facilitate the transition to stabilization. LCS is technologically and economically feasible.technologically and economically feasible.””
Economy-environment trade-off can be circumvented with innovative strategies and by exploiting co-benefits
Environmental Quality
National Environment Goals
Innovation strategiesExploiting co-benefits
SustainableSustainableDevelopmentDevelopment
Econ
omic
/soc
ial i
ndi
cato
r
National Economic Targets

1) Aligning climate change and sustainable development 1) Aligning climate change and sustainable development actions will facilitate costactions will facilitate cost--effective transition to effective transition to stabilization of climate change.stabilization of climate change.2) A variety of tools (e.g. models) & methods (e.g. 2) A variety of tools (e.g. models) & methods (e.g. backcasting, scenarios) are required to delineate options backcasting, scenarios) are required to delineate options for costfor cost--effective transition to low carbon pathwayseffective transition to low carbon pathways3) Cooperation for LCS involves a long3) Cooperation for LCS involves a long--term policy term policy framework, a wider range of issues and actors (domestic framework, a wider range of issues and actors (domestic & international) and a comprehensive range of & international) and a comprehensive range of technologies and policy measures. Political vision and technologies and policy measures. Political vision and leadership are vital to generate signals, prompt activities leadership are vital to generate signals, prompt activities and deploy resources to achieve LCS goals.and deploy resources to achieve LCS goals.
We appreciate your participation!
AIM always supports your modeling activity!
http://www-iam.nies.go.jp/aim/
AIM is model, AIM is team, AIM is human network