Janus Membranes with Controllable Asymmetric Configuration … · 2019-02-28 · S1 Electronic...
12
S1 Electronic Supplementary Information Janus Membranes with Controllable Asymmetric Configuration for Highly Efficient Separation of Oil-in-Water Emulsions Jing Yang † , Hao-Nan Li † , Zhi-Xiong Chen, Ai He, Qi-Zhi Zhong, Zhi-Kang Xu* MOE Key Laboratory of Macromolecular Synthesis and Functionalization, and Key Laboratory of Adsorption and Separation Materials & Technologies of Zhejiang Province, Department of Polymer Science and Engineering, Zhejiang University, Hangzhou 310027, China *E-mail: [email protected] † These authors contributed equally to this work Electronic Supplementary Material (ESI) for Journal of Materials Chemistry A. This journal is © The Royal Society of Chemistry 2019
Transcript of Janus Membranes with Controllable Asymmetric Configuration … · 2019-02-28 · S1 Electronic...

S1
Electronic Supplementary Information
Janus Membranes with Controllable Asymmetric Configuration
for Highly Efficient Separation of Oil-in-Water Emulsions
Jing Yang†, Hao-Nan Li†, Zhi-Xiong Chen, Ai He, Qi-Zhi Zhong, Zhi-Kang Xu*
MOE Key Laboratory of Macromolecular Synthesis and Functionalization, and Key Laboratory of
Adsorption and Separation Materials & Technologies of Zhejiang Province, Department of Polymer
Science and Engineering, Zhejiang University, Hangzhou 310027, China
*E-mail: [email protected]
†These authors contributed equally to this work
Electronic Supplementary Material (ESI) for Journal of Materials Chemistry A.This journal is © The Royal Society of Chemistry 2019
S2
Table of Contents
Figure S1 – Figure S2----------------------------------------------------------------------------------------S3
Figure S3 – Figure S4----------------------------------------------------------------------------------------S4
Figure S5--------------------------------------------------------------------------------------------------------S5
Table S1---------------------------------------------------------------------------------------------------------S6
Figure S6 – Figure S7---------------------------------------------------------------------------------------S7
Figure S8 – Figure S9---------------------------------------------------------------------------------------S8
Figure 10 and Table S2---------------------------------------------------------------------------------S9
Figure S11 --------------------------------------------------------------------------------------------S10
Figure S12 – Figure S13---------------------------------------------------------------------------------S11
Figure S14-----------------------------------------------------------------------------------------------------S12
References--------------------------------------------------------------------------------------------------------S12
S3
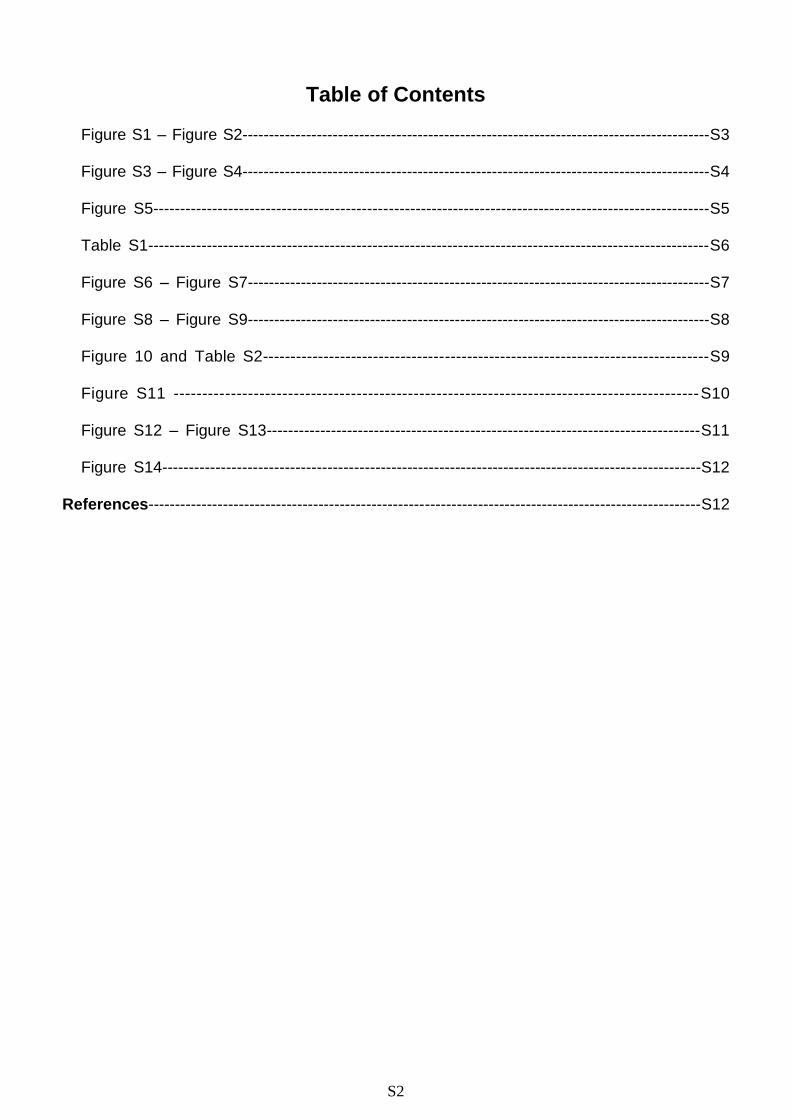
Figure S1. 3D LSCM images of PDA/PSS JMs constructed by varing co-deposition time (from
15 min to 120 min) and thus with different hydrophilization depths (from 7.2 μm to 30.0 μm)
wetted by the rhodamine B solution.
Figure S2. FT-IR/ATR spectra of (a) PDA/PDDA JMs and (b) PDA/PSS JMs for both the
hydrophilic side and the hydrophobic side with different co-deposition periods.
15 min
60 min 90 min 120 min
30 min 45 min
Thickness = 7.2 μm Thickness = 10.8 μm Thickness = 16.0 μm
Thickness = 18.8 μm Thickness = 22.5 μm Thickness = 30.0 μm
1800 1600 1400 1200 1000
Wavenumbers (cm-1
)
120 min
90 min
60 min
30 min
15 min
PPMM
Hydrophilic Side of PDA/PDDA JMs
45 min
1800 1600 1400 1200 1000
30 min
Wavenumbers (cm-1
)
120 min
90 min
60 min
45 min
15 min
PPMM
Hydrophobic Side of PDA/PDDA JMs
1800 1600 1400 1200 1000
15 min
45 min
Wavenumbers (cm-1
)
120 min
90 min
60 min
30 min
PPMM
Hydrophilic Side of PDA/PSS JMs
1800 1600 1400 1200 1000
15 min
Wavenumbers (cm-1
)
45 min
120 min
90 min
60 min
30 min
PPMM
Hydrophobic Side of PDA/PSS JMs
(a)
(b)

S4
Figure S3. XPS spectra of (a) PDA/PDDA JMs and (b) PDA/PSS JMs for both the hydrophilic
side and the hydrophobic side.
0
20
40
60
80
100
120
140
160
Wa
ter
co
nta
ct
an
gle
(o)
Thickness of hydrophilic portion (m)
hydrophilic side hydrophobic side
0 7.2 10.8 16.0 18.8 22.5 30.0
Figure S4. WCA on the hydrophilic side and the hydrophobic side of PDA/PSS JMs with
different hydrophilization depths.
600 500 400 300 200 100
PDA/PDDA JMs
1 h-hydropilic side
0.5 h-hydrophilic side
2 h-hydrophobic side
PPMM
C 1s
N 1s
O 1s
Binding Energy (eV)600 500 400 300 200 100
PDA/PSS JMs
1 h-hydrophilic side
0.5 h-hydrophilic side
2 h-hydrophobic side
PPMM
C 1s
N 1s
O 1s
Binding Energy (eV)
S 2p3S 2s
(a) (b)

S5
Figure S5. SEM images of the hydrophilic side of (a) PDA/PDDA JMs and (b) PDA/PSS JMs
with different hydrophilization depths.
(a)
(b) 7.2 μm0 μm 10.8 μm 16.0 μm
18.8 μm 22.5 μm 30.0 μm
12.1 μm0 μm
16.9 μm 20.0 μm 27.3 μm
7.8 μm 14.8 μm

S6
Table S1. Average pore diameter and porosity of nascent PPMM and JMs with different
hydrophilization depths.
Samples
Bulk Surface
Average pore diameter (nm)
Porosity (%) Average pore diameter (nm)
Porosity (%)
Nascent PPMMs 245.4 73.2 190.2 30.7
PDA/PDDA JMs (7.8 μm) --- --- 157.3 28.5
PDA/PDDA JMs (12.1 μm) 262.3 73.2 185.5 37.1
PDA/PDDA JMs (14.3 μm) 276.3 73.4 236.9 39.8
PDA/PDDA JMs (16.9 μm) --- --- 167.5 31.0
PDA/PDDA JMs (20.0 μm) --- --- 178.2 31.1
PDA/PDDA JMs (27.3 μm) 260.0 73.0 147.7 27.4
PDA/PSS JMs (7.2 μm) --- --- 197.4 36.7
PDA/PSS JMs (10.8 μm) 242.0 72.8 174.7 29.9
PDA/PSS JMs (16.0 μm) 250.7 73.1 189.9 36.6
PDA/PSS JMs (18.8 μm) --- --- 208.0 39.2
PDA/PSS JMs (22.5 μm) --- --- 243.9 39.4
PDDA/PSS JMs (30.0 μm) 273.2 73.4 179.9 24.1
S7
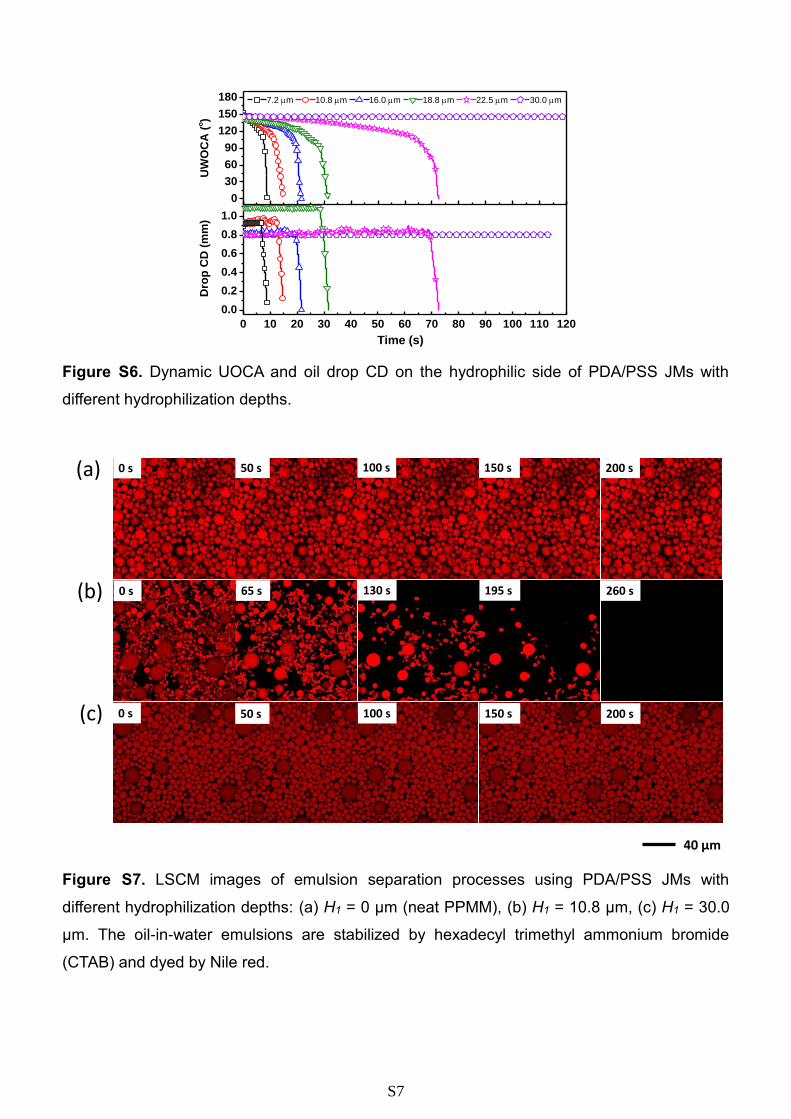
Figure S6. Dynamic UOCA and oil drop CD on the hydrophilic side of PDA/PSS JMs with
different hydrophilization depths.
Figure S7. LSCM images of emulsion separation processes using PDA/PSS JMs with
different hydrophilization depths: (a) H1 = 0 μm (neat PPMM), (b) H1 = 10.8 μm, (c) H1 = 30.0
μm. The oil-in-water emulsions are stabilized by hexadecyl trimethyl ammonium bromide
(CTAB) and dyed by Nile red.
0
30
60
90
120
150
180
7.2 m 10.8 m 16.0 m 18.8 m 22.5 m 30.0 m
UW
OC
A (
o)
Time (s)
0 10 20 30 40 50 60 70 80 90 100 110 120
0.0
0.2
0.4
0.6
0.8
1.0
Dro
p C
D (
mm
)
40 μm
(a)
(b)
(c)
0 s 200 s50 s 100 s 150 s
0 s 260 s65 s 130 s 195 s
0 s 200 s50 s 100 s 150 s

S8
Figure S8. Optical microscopic photos (left) and DLS graph (right) of (a) Tween 80 stabilized
and (b) CTAB stabilized emulsions. The oil contents are 100 mg/mL and 15 mg/mL for (a) and
(b), respectively.
Figure S9. DLS graphs of feed after separation for (a) PDA/PDDA JMs toward SDS stabilized
emulsions, (b) PDA/PSS JMs toward CTAB stabilized emulsions, (c) PDA/PDDA JMs toward
Tween 80 stabilized emulsions, and d) PDA/PSS JMs toward Tween 80 stabilized emulsions.
The corresponding DLS graphs of filtrate after separation for (a), (b), (c) and (d) are shown in
(e), (f), (g) and (h).
20 30 40 50 60 70
0
10
20
30
Nu
mb
er
(%)
Droplet size (nm)
50 100 150 200 250
0
10
20
30
Droplet size (nm)
Nu
mb
er
(%)
(a)
(b)
50 μm
50 μm
25 50 75 100 125 1500
10
20
30
Filtrate
Size (d. nm)
Nu
mb
er
(%)
30 60 90 120 1500
10
20
30
Feed after separation
Size (d. nm)
Nu
mb
er
(%)
25 50 75 100 125 1500
10
20
30
Filtrate
Size (d. nm)
Nu
mb
er
(%)
5 10 15 20 250
10
20
30
Feed after separation
Size (d. nm)
Nu
mb
er
(%)
25 50 75 100 125 1500
10
20
30
Filtrate
Size (d. nm)
Nu
mb
er
(%)
30 60 90 120 1500
10
20
30
Feed after separation
Size (d. nm)
Nu
mb
er
(%)
25 50 75 100 125 1500
10
20
30
Filtrate
Size (d. nm)
Nu
mb
er
(%)
5 10 15 20 250
10
20
30
Feed after separation
Size (d. nm)
Nu
mb
er
(%)
(a) (b) (c) (d)
(e) (f) (g) (h)
S9
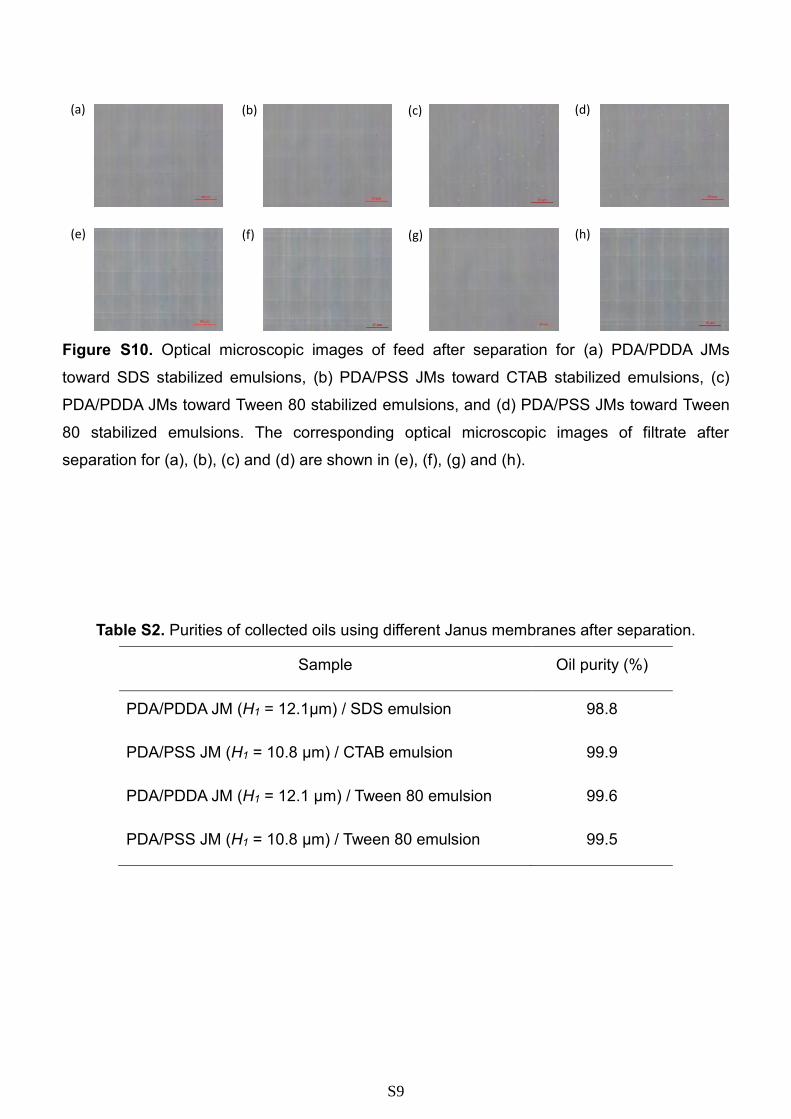
Figure S10. Optical microscopic images of feed after separation for (a) PDA/PDDA JMs
toward SDS stabilized emulsions, (b) PDA/PSS JMs toward CTAB stabilized emulsions, (c)
PDA/PDDA JMs toward Tween 80 stabilized emulsions, and (d) PDA/PSS JMs toward Tween
80 stabilized emulsions. The corresponding optical microscopic images of filtrate after
separation for (a), (b), (c) and (d) are shown in (e), (f), (g) and (h).
Table S2. Purities of collected oils using different Janus membranes after separation.
Sample Oil purity (%)
PDA/PDDA JM (H1 = 12.1μm) / SDS emulsion 98.8
PDA/PSS JM (H1 = 10.8 μm) / CTAB emulsion 99.9
PDA/PDDA JM (H1 = 12.1 μm) / Tween 80 emulsion 99.6
PDA/PSS JM (H1 = 10.8 μm) / Tween 80 emulsion 99.5
(a) (b) (c) (d)
(e) (f) (g) (h)

S10
Figure S11. Photographs of petroleum ether separation status at time t=0, 10, 30 min for oil-
in-water emulsions stabilized by (a) SDS using PDA/PDDA JMs (H1 = 12.1 μm) and by (b)
CTAB using PDA/PSS JMs (H1 = 10.8 μm). The optical microscopic images and DLS graphs
of feed before and after separation as well as filtrate after separation are shown
correspondingly.
0 min 30 min10 min
(a)
50 μm 50 μm 50 μm
50 μm 50 μm 50 μm
(b)
50 100 150 200 2503000
10
20
30
Size (d. nm)
Nu
mb
er
(%)
0.1 1 10 1000
10
20
30
Size (d. nm)
Nu
mb
er
(%)
0.1 1 10 1000
10
20
30
Size (d. nm)
Nu
mb
er
(%)
50 100 150 200 2503000
10
20
30
Size (d. nm)
Nu
mb
er
(%)
0 min 30 min10 min
10 1000
10
20
30
Size (d. nm)
Nu
mb
er
(%)
10 1000
10
20
30
Size (d. nm)
Nu
mb
er
(%)
S11
0 2 4 6 8 10 12 14 16 18
0
20
40
60
80
100
PDA/PDDA JM for Tween 80 emulsions
Oil r
eco
very
rati
o (
%)
Time (min)
PDA/PDDA JM for SDS emulsions
PDA/PSS JM for Tween 80 emulsions
PDA/PSS JM for CTAB emulsions
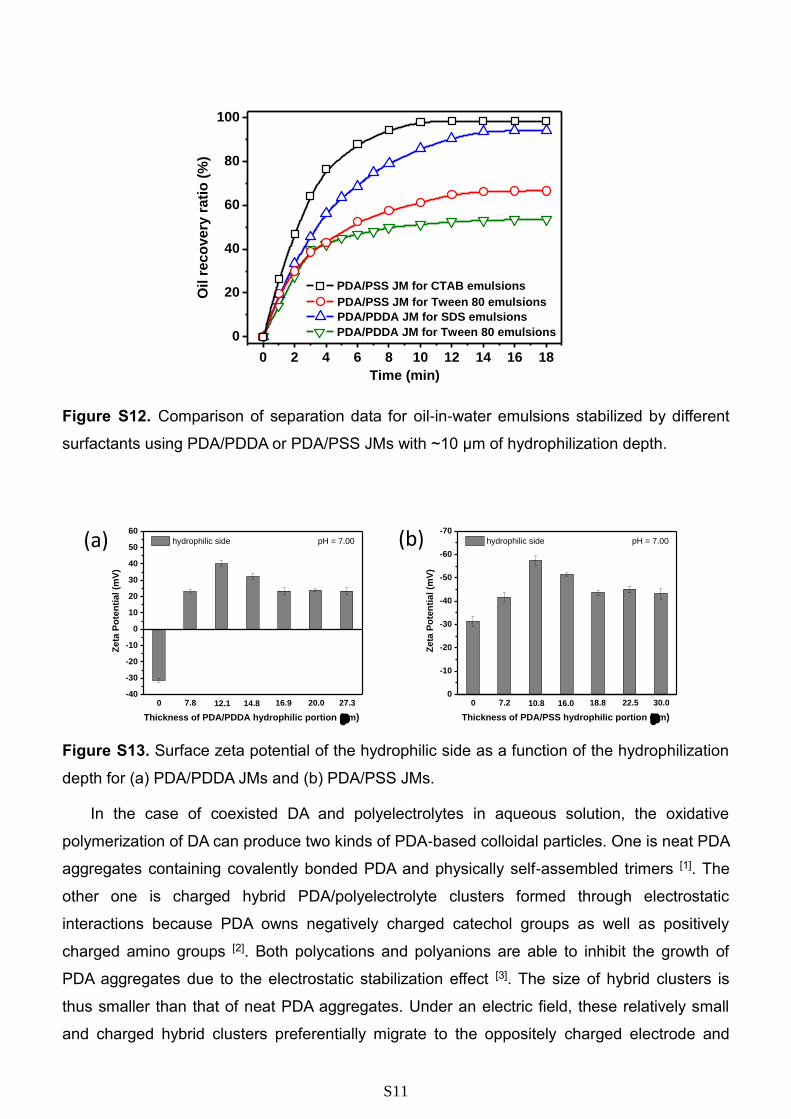
Figure S12. Comparison of separation data for oil-in-water emulsions stabilized by different
surfactants using PDA/PDDA or PDA/PSS JMs with ~10 μm of hydrophilization depth.
Figure S13. Surface zeta potential of the hydrophilic side as a function of the hydrophilization
depth for (a) PDA/PDDA JMs and (b) PDA/PSS JMs.
In the case of coexisted DA and polyelectrolytes in aqueous solution, the oxidative
polymerization of DA can produce two kinds of PDA-based colloidal particles. One is neat PDA
aggregates containing covalently bonded PDA and physically self-assembled trimers [1]. The
other one is charged hybrid PDA/polyelectrolyte clusters formed through electrostatic
interactions because PDA owns negatively charged catechol groups as well as positively
charged amino groups [2]. Both polycations and polyanions are able to inhibit the growth of
PDA aggregates due to the electrostatic stabilization effect [3]. The size of hybrid clusters is
thus smaller than that of neat PDA aggregates. Under an electric field, these relatively small
and charged hybrid clusters preferentially migrate to the oppositely charged electrode and
(a) (b)
-40
-30
-20
-10
0
10
20
30
40
50
60
pH = 7.00
Zeta
Po
ten
tial
(mV
)
hydrophilic side
0 7.8 12.1 14.8 16.9 20.0 27.3
Thickness of PDA/PDDA hydrophilic portion (m)
0
-10
-20
-30
-40
-50
-60
-70
hydrophilic side
Zeta
Po
ten
tial
(mV
)
0 7.2 10.8 16.0 18.8 22.5 30.0
Thickness of PDA/PSS hydrophilic portion (m)
pH = 7.00
S12
adhere onto the membrane surface and inside wall of the pores. However, the deposition of
the neat PDA aggregates cannot be accelerated due to their neutral and large-sized profiles. It
means that the electric field-accelerating deposition of charged PDA/electrolyte clusters is
dominant during the first 30 min until an equilibrium is reached. The deposition of neat PDA
aggregates, however, is still in progress afterwards. Such difference in the kinetics of
deposition thus causes a maximum value of the surface zeta potential when the membrane
was deposited for 30 min (Figure S13). Therefore, those Janus membranes with the most
enriched surface charge (H1 ≈ 10 μm) significantly facilitate the deemulsification process,
exhibiting excellent separation performances mentioned above. Further, the efficiency of
emulsion separation becomes depressed with thickening the hydrophilic depth because the
directional oil delivery is hindered gradually.
Figure S14. Oil flux and recovery ratio evolutions under repeated cycles when PDA/PSS JMs
(H1 = 10.8 μm) were used to separate the CTAB stabilized oil-in-water emulsions. 1,2-
Dichloroethane (a) and petroleum ether (b) were used as the heavy oil and the light oil,
respectively.
References
[1] S. Hong, Y. S. Na, S. Choi, I. T. Song, W. Y. Kim, H. Lee, Adv. Funct. Mater. 2012, 22,
4711-4717.
[2] H.-C. Yang, R. Z. Waldman, M.-B. Wu, J. Hou, L. Chen, S. B. Darling, Z.-K. Xu, Adv.
Funct. Mater. 2018, 28, 1705327.
[3] M. Mateescu, M. H. Metz-Boutigue, P. Bertani, V. Ball, J. Colloid Interf. Sci. 2016, 469,
184-190.
0
5000
10000
15000
20000
10 2
Cycle number
Oil
flu
x (
Lh
-1m
-2 b
ar-1
)
oil flux
3 4 5 6 7 8 9 100
20
40
60
80
100
oil recovery ratio
O
il r
eco
very
rati
o (
%)
(a) (b)
0
10
20
30
40
50
10 2
Cycle number
Oil
flu
x (
Lh
-1m
-2)
oil flux
3 4 5 6 7 8 9 100
10
20
30
40
50
60
70
80oil recovery ratio
O
il r
eco
very
rati
o (
%)


![Controllable Sliding Bearings and Controllable Lubrication ... · Review Controllable Sliding Bearings and Controllable ... or evolutionary [5], but it does not change the fact that](https://static.fdocuments.us/doc/165x107/5fc50df11ca4e1756528a85b/controllable-sliding-bearings-and-controllable-lubrication-review-controllable.jpg)