
January/February 2013, Vol 6, No 1
60
EDITORIAL Technology Trends in Healthcare David B. Nash, MD, MBA BUSINESS Budget Impact Model: Epigenetic Assay Can Help Avoid Unnecessary Repeated Prostate Biopsies and Reduce Healthcare Spending Wade Aubry, MD; Robert Lieberthal, PhD; Arnold Willis, MD; Grant Bagley, MD, JD; Simon M. Willis III, MS; Andrew Layton, BA Stakeholder Perspective by Kelly Huang, PhD The Opportunity for Health Plans to Improve Quality and Reduce Costs by Embracing Primary Care Medical Homes Sarah Collins, MBA; Kevin B. “Kip” Piper, MA, FACHE; Gary Owens, MD Stakeholder Perspective by Jack E. Fincham, PhD, RPh REGULATORY Medicare Part D and the Federal Employees Health Benefits Program: A Comparison of Prescription Drug Coverage Annesha Lovett, PharmD, MS, PhD Stakeholder Perspective by J. Warren Salmon, PhD Industry Trends As Deadline Nears, Health Insurance Exchanges Making Progress, with Some Setbacks ©2013 Engage Healthcare Communications, LLC www.AHDBonline.com ™ JANUARY/FEBRUARY 2013 VOLUME 6, NUMBER 1 THE PEER-REVIEWED FORUM FOR EVIDENCE IN BENEFIT DESIGN ™ FOR PAYERS, PURCHASERS, POLICYMAKERS, AND OTHER HEALTHCARE STAKEHOLDERS YEAR ANNIVERSARY 6 EST . 2008
-
Upload
dalia-buffery -
Category
Documents
-
view
252 -
download
17
description
American Health & Drug Benefits
Transcript of January/February 2013, Vol 6, No 1

EDITORIAL
Technology Trends in Healthcare David B. Nash, MD, MBA
BUSINESS
Budget Impact Model: Epigenetic Assay Can Help Avoid Unnecessary Repeated Prostate Biopsies and Reduce Healthcare Spending Wade Aubry, MD; Robert Lieberthal, PhD; Arnold Willis, MD; Grant Bagley, MD, JD; Simon M. Willis III, MS; Andrew Layton, BA
Stakeholder Perspective by Kelly Huang, PhD
The Opportunity for Health Plans to Improve Quality and Reduce Costs by Embracing Primary Care Medical HomesSarah Collins, MBA; Kevin B. “Kip” Piper, MA, FACHE; Gary Owens, MD
Stakeholder Perspective by Jack E. Fincham, PhD, RPh
REGULATORY
Medicare Part D and the Federal Employees Health Benefits Program: A Comparison of Prescription Drug CoverageAnnesha Lovett, PharmD, MS, PhD
Stakeholder Perspective by J. Warren Salmon, PhD
Industry Trends
As Deadline Nears, Health Insurance Exchanges Making Progress, with Some Setbacks
©2013 Engage Healthcare Communications, LLCwww.AHDBonline.com
™
January/February 2013 Volume 6, number 1
THE PEEr-rEviEwED Forum For EviDEnCE in BEnEFiT DEsign™
For Payers, Purchasers, Policymakers, and other healthcare stakeholders
YEAR ANNIVERSARY6EST. 2008

ADVERTISEMENTADVERTISEMENT
Low levels of platelet inhibitioncan raise some questions*1-6
Factors that may impact platelet inhibition* for patients taking an oral antiplatelet include:
• Genetic variation7-9
• Concomitant medications10-12
• Preexisting conditions that may impact antiplatelet response (eg, diabetes, obesity)13-15
• Patient noncompliance16-18
• Side e ects that impact adherence19
* The relationship between inhibition of platelet aggregation and clinical activity has not been established.
References: 1. Buonamici P, Marcucci R, Migliorini A, et al. J Am Coll Cardiol. 2007;49:2312-2317. 2. Matetzky S, Shenkman B, Guetta V, et al. Circulation. 2004;109:3171-3175. 3. Cuisset T, Frere C, Quilici J, et al. J Thromb Haemost. 2006;4:542-549. 4. Hochholzer W, Trenk D, Bestehorn H-P, et al. J Am Coll Cardiol. 2006;48:1742-1750. 5. Marcucci R, Gori AM, Paniccia R, et al. Circulation. 2009;119:237-242. 6. Bonello L, Tantry US, Marcucci R, et al; for the Working Group on High On-Treatment Platelet Reactivity. J Am Coll Cardiol. 2010;56:919-933. 7. Brandt JT, Close SL, Iturria SJ, et al. J Thromb Haemost. 2007;5:2429-2436. 8. Varenhorst C, James S, Erlinge D, et al. Eur Heart J. 2009;30:1744-1752. 9. Frere C, Cuisset T, Morange P-E, et al. Am J Cardiol. 2008;101:1088-1093. 10. Gilard M, Arnaud B, Cornily J-C, et al. J Am Coll Cardiol. 2008;51:256-260. 11. Farid NA, Payne CD, Small DS, et al. Clin Pharmacol Ther. 2007;81:735-741. 12. Yun KH, Rhee SJ, Park H-Y, et al. Int Heart J. 2010;51:13-16. 13. Angiolillo DJ, Fernandez-Ortiz A, Bernando E, et al. Diabetes. 2005;54:2430-2435. 14. Angiolillo DJ, Bernardo E, Ramírez C, et al. J Am Coll Cardiol. 2006;48:298-304. 15. Angiolillo DJ, Fernández-Ortiz A, Bernardo E, et al. J Invasive Cardiol. 2004;16:169-174. 16. Baran KW, Lasala JM, Cox DA, et al; for ARRIVE Investigators. Am J Cardiol. 2008;102:541-545. 17. Ergelen M, Uyarel H, Osmonov D, et al. Clin Appl Thromb Hemost. 2010;16:33-41. 18. Iakovou I, Schmidt T, Bonizzoni E, et al. JAMA. 2005;293:2126-2130. 19. Ho PM, Bryson CL, Rumsfeld JS. Circulation. 2009;119:3028-3035.
Have you considered these factors when selecting an oral antiplatelet?
Copyright © 2012 Daiichi Sankyo, Inc. and Lilly USA, LLC. All Rights Reserved.
PG81531. Printed in USA. December 2012.
KJob Number: 16002Revision No: 0Date: 12/06/12
YMC182-34058 PB

editorial board
4 l American Health & Drug Benefits l www.AHDBonline.com January/February 2012 l Vol 6, No 1
Editor-in-ChiEfDavid B. Nash, MD, MBA Dean, the Dr Raymond C. and Doris N. Grandon Professor, Jefferson School of Population Health Philadelphia, PA
dEputy EditorsJoseph D. Jackson, PhDProgram Director, Applied Health Economics and Outcomes Research, Jefferson University School of Population Health, PhiladelphiaLaura T. Pizzi, PharmD, MPH, RPhAssociate Professor, Dept. of Pharmacy Practice, Jefferson School of Pharmacy, Philadelphia
Aging And WEllnEssEric G. Tangalos, MD, FACP, AGSF, CMDProfessor of MedicineMayo Clinic, Rochester, MN
CAnCEr rEsEArChAl B. Benson, III, MD, FACP, FASCOProfessor of Medicine, Associate Director for Clinical InvestigationsRobert H. Lurie Comprehensive Cancer Center Northwestern University, ILPast Chair, NCCN Board of Directors Samuel M. Silver, MD, PhD, FASCOProfessor of Internal Medicine, Hematology/OncologyAssistant Dean for Research, Associate Director, Faculty Group Practice, University of Michigan Medical School
EMployErsArthur F. Shinn, PharmD, FASCPPresident, Managed Pharmacy Consultants, LLC, Lake Worth, FLF. Randy Vogenberg, RPh, PhDPrincipal, Institute for Integrated Healthcare and Bentteligence, Sharon, MA
EndoCrinologyJames V. Felicetta, MD Chairman, Dept. of Medicine Carl T. Hayden Veterans AffairsMedical Center, Phoenix, AZ Quang Nguyen, DO, FACP, FACEAdjunct Associate Professor EndocrinologyTouro University Nevada
EpidEMiology rEsEArChJoshua N. Liberman, PhDExecutive Director, Research, Development & Dissemination, Sutter Health, Concord, CA
goVErnMEntKevin B. “Kip” Piper, MA, FACHEPresident, Health Results Group, LLCWashington, DC
HEALTH INFORMATION TECHNOLOGY Kelly Huang, PhDPresident, HealthTronics, Inc.Austin, TX J. B. Jones, PhD, MBAResearch Investigator, Geisinger Health System, Danville, PAVictor J. Strecher, PhD, MPHProfessor and Director for Innovation and Social EntrepreneurshipUniversity of Michigan, School of Public Health and Medicine, Ann Arbor
hEAlth outCoMEs rEsEArCh Diana Brixner, RPh, PhDProfessor & Chair, Dept. of PharmacotherapyExecutive Director, Outcomes Research Center, Director of Outcomes Personalized Health Care Program, University of Utah, Salt Lake CityJoseph Couto, PharmD, MBAClinical Program ManagerCigna Corporation, Bloomfield, CT
Steve Miff, PhDSenior Vice PresidentVHA, Inc., Irving, TXTerri S. Moore, PhD, RPh, MBASenior Manager, Product DevelopmentURACKavita V. Nair, PhDAssociate Professor, School of PharmacyUniversity of Colorado at Denver, COGary M. Owens, MDPresident, Gary Owens AssociatesGlen Mills, PAAndrew M. Peterson, PharmD, PhDDean, Mayes School of Healthcare Business and Policy, Associate Professor, University of the Sciences, Philadelphia, PASarah A. Priddy, PhDDirector, Competitive Health AnalyticsHumana, Louisville, KY Timothy S. Regan, BPharm, RPh, CPhExecutive Director, Strategic Accounts Xcenda, Palm Harbor, FLVincent J. Willey, PharmDAssociate Professor, Philadelphia School of Pharmacy, University of the SciencesPhiladelphia, PAPaul WilsonSenior VP, Health Consumer Insights and Analytics, Blue Bell, PADavid W. Wright, MPHPresident, Institute for Interactive Patient Care Bethesda, MD
hEAlth & VAluE proMotion Craig Deligdish, MDHematologist/OncologistOncology Resource Networks, Orlando, FLThomas G. McCarter, MD, FACPChief Clinical OfficerExecutive Health Resources, PAAlbert Tzeel, MD, MHSA, FACPENational Medical DirectorHumanaOne, Waukesha, WI
MAnAgEd MArKEts Jeffrey A. Bourret, RPh, MS, FASHPSenior Director, Medical Lead, Payer and Specialty Channel Strategy, Medical AffairsPfizer Specialty Care Business Unit, PARichard B. Weininger, MDChairman, CareCore National, LLCBluffton, SC
pAtiEnt AdVoCACy William E. Fassett, BSPharm, MBA, PhD, FAPhAProfessor of Pharmacy Law & Ethics Dept. of Pharmacotherapy, College of Pharmacy Washington State University, Spokane, WAMike PucciSr VP Commercial Operations and Business Development, PhytoChem PharmaceuticalsLake Gaston, NC
pErsonAlizEd MEdiCinEAmalia M. Issa, PhD, MPHDirector, Program in Personalized Medicine & Targeted TherapeuticsUniversity of the Sciences, Philadelphia
phArMACoEConoMiCsJosh FeldsteinPresident & CEOCAVA, The Center for Applied Value Analysis, Inc., Norwalk, CTJeff Jianfei Guo, BPharm, MS, PhDProfessor of Pharmacoeconomics & Pharmacoepidemiology, College of Pharmacy, Univ of Cincinnati, Medical Center, OH
phArMACy BEnEfit dEsign Joel V. Brill, MD, AGAF, CHCQMChief Medical Officer, Predictive Health, Phoenix, AZLeslie S. Fish, PharmDVice President of Clinical ProgramsFallon Community Health Plan, MAJohn Hornberger, MD, MSCedar Associates, LLCCHP/PCOR Adjunct Associate, Menlo Park, CA Michael S. Jacobs, RPhVice President, National AccountsTruveris, Inc., New York, NYMatthew Mitchell, PharmD, MBAManager, Pharmacy ServicesSelectHealth, Salt Lake City, UTPaul Anthony Polansky, BSPharm, MBASenior Field Scientist, Health Outcomes and PharmacoEconomics (HOPE) Endo Health Solutions, Chadds Ford, PAChristina A. Stasiuk, DO, FACOISenior Medical DirectorCigna, Philadelphia, PA Scott R. Taylor, BSPharm, MBAExecutive Director, Industry RelationsGeisinger Health System, Danville, PA
poliCy & puBliC hEAlth Joseph R. Antos, PhDWilson H. Taylor Scholar in Health Care Retirement Policy, American Enterprise Institute Washington, DCRobert W. Dubois, MD, PhDChief Science OfficerNational Pharmaceutical Council, Washington, DCJack E. Fincham, PhD, RPh Professor of Pharmacy, Practice and Administration School of Pharmacy, University of Missouri Kansas City, MOWalid F. Gellad, MD, MPHAssistant Professor of Medicine, University of Pittsburgh, Staff Physician, Pittsburgh VA Medical Center, Adjunct Scientist, RAND HealthPaul Pomerantz, MBAExecutive DirectorDrug Information Association, Horsham, PAJ. Warren Salmon, PhDProfessor of Health Policy & AdministrationSchool of Public HealthUniversity of Illinois at ChicagoRaymond L. Singer, MD, MMM, CPE, FACSChief, Division of Cardiothoracic SurgeryVice Chair, Department of Surgery for Quality & Patient Safety and OutreachLehigh Valley Health Network, PA
rEsEArCh & dEVElopMEnt Frank Casty, MD, FACPChief Medical OfficerSenior VP, Clinical Development Medical ScienceEndo Pharmaceuticals, Chadds Ford, PAMichael F. Murphy, MD, PhDChief Medical Officer and Scientific Officer Worldwide Clinical TrialsKing of Prussia, PA
spECiAlty phArMACyAtheer A. Kaddis, PharmDSenior Vice PresidentManaged Markets/Clinical ServicesDiplomat Specialty Pharmacy, Flint, MIJames T. Kenney, Jr, RPh, MBAPharmacy Operations Manager Harvard Pilgrim Health Care Wellesley, MAMichael KleinrockDirector, Research DevelopmentIMS Institute for Healthcare InformaticsCollegeville, PA

5 www.AHDBonline.com l American Health & Drug Benefits lVol 6, No 1 l January/February 2013
Table of ConTenTs
American Health & Drug Benefits is included in the following indexing and database services:
EMBASE/Elsevier Bibliographic Database SCOPUS/Elsevier Bibliographic Database Cumulative Index to Nursing and Allied Health Literature (CINAHL) EBSCO research databases Standard Periodical Directory
MEMBEr: Committee on Publication Ethics (COPE)
January/February 2013 Volume 6, number 1
™ ™
The Peer-reviewed Forum For evidence in BeneFiT design™
For Payers, Purchasers, Policymakers, and other healthcare stakeholders
EDITORIAL
12 Technology Trends in Healthcare David B. Nash, MD, MBA
busInEss
15 Budget Impact Model: Epigenetic Assay Can Help Avoid Unnecessary Repeated Prostate Biopsies and Reduce Healthcare Spending
Wade Aubry, MD; Robert Lieberthal, PhD; Arnold Willis, MD; Grant Bagley, MD, JD; Simon M. Willis III, MS; Andrew Layton, BA
23 Stakeholder Perspective: Molecular Epigenetic Tests Can Improve Clinical Outcomes While Reducing Healthcare Costs
Kelly Huang, PhD
30 The Opportunity for Health Plans to Improve Quality and Reduce Costs by Embracing Primary Care Medical Homes
Sarah Collins, MBA; Kevin B. “Kip” Piper, MA, FACHE; Gary Owens, MD
38 Stakeholder Perspective: Enhancing Health Outcomes and Quality of Care with the Medical Home Model in Primary Care
Jack E. Fincham, PhD, RPh
American Health & Drug Benefits is found-ed on the concept that health and drug benefits have undergone a transforma-tion: the econo metric value of a drug is of equal importance to clinical out-comes as it is to serving as the basis for securing coverage in formularies and benefit designs. Because benefit designs are greatly affected by clinical, business, and policy conditions, this journal offers a forum for stakeholder integration and collaboration toward the improvement of healthcare.This publication further provides benefit design de cision makers the integrated industry information they require to devise formularies and benefit designs that stand up to today’s special health-care delivery and business needs.
Mission Statement
PublisherNicholas [email protected] DirectorDalia [email protected] PublisherMaurice [email protected] EditorLara J. [email protected] AssistantJennifer [email protected] Vice PresidentEngage Managed MarketsChuck [email protected] Accounts ManagerZach [email protected] Production ManagerLynn HamiltonQuality Control DirectorBarbara MarinoBusiness ManagerBlanche Marchitto
Founding Editor-in-ChiefRobert E. Henry
Contact Information: For subscription information and edi torial queries, please contact: [email protected]; tel: 732-992-1892; fax: 732-992-1881
Continued on page 10

In treating multiple myeloma
What is the value of VELCADE® (bortezomib)?▼ Overall survival advantage▼ De� ned length of therapy▼ Medication cost
IF YOU DEFINE VALUE AS AN OVERALL SURVIVAL ADVANTAGE:VELCADE (bortezomib) combination delivered a >13-month overall survival advantage
At 5-year median follow-up, VELCADE+MP* provided a median overall survival of 56.4 months vs 43.1 months with MP alone (HR=0.695 [95% CI, 0.57-0.85]; p<0.05)†
At 3-year median follow-up, VELCADE+MP provided an overall survival advantage over MP that was not regained with subsequent therapies
IF YOU DEFINE VALUE AS DEFINED LENGTH OF THERAPY: Results achieved using VELCADE twice-weekly followed by weekly dosing for a median of
50 weeks (54 planned)1
IF YOU DEFINE VALUE AS MEDICATION COST: Medication cost is an important factor when considering overall drug spend. The Wholesale Acquisition
Cost for VELCADE is $1,506 per 3.5-mg vial as of July 2012
When determining the value of a prescription drug regimen, it may be worth considering medication cost, length of therapy, and dosing regimens. This list is not all-inclusive; there are additional factors to consider when determining value for a given regimen
Indication and Important Safety Information for VELCADE® (bortezomib) INDICATIONVELCADE (bortezomib) is indicated for the treatment ofpatients with multiple myeloma.
CONTRAINDICATIONS VELCADE is contraindicated in patients with hypersensitivity (not including local reactions) to bortezomib, boron, or mannitol, including anaphylactic reactions. VELCADE is contraindicated for intrathecal administration.
WARNINGS, PRECAUTIONS, AND DRUG INTERACTIONS▼ Peripheral neuropathy: Manage with dose modi� cation
or discontinuation. Patients with preexisting severeneuropathy should be treated with VELCADE only aftercareful risk-bene� t assessment.
▼ Hypotension: Use caution when treating patientstaking antihypertensives, with a history of syncope,or with dehydration.
▼ Cardiac toxicity: Worsening of and development of cardiac failure have occurred. Closely monitor patients with existing heart disease or risk factors for heart disease.
▼ Pulmonary toxicity: Acute respiratory syndromes have occurred. Monitor closely for new or worsening symptoms.
▼ Posterior reversible encephalopathy syndrome: Consider MRI imaging for onset of visual or neurological symptoms; discontinue VELCADE if suspected.
▼ Gastrointestinal toxicity: Nausea, diarrhea, constipation, and vomiting may require use of antiemetic and antidiarrheal medications or fluid replacement.
▼ Thrombocytopenia or Neutropenia: Monitor complete blood counts regularly throughout treatment.
▼ Tumor lysis syndrome: Closely monitor patients with high tumor burden.
▼ Hepatic toxicity: Monitor hepatic enzymes during treatment.
▼ Embryo-fetal risk: Women should avoid becoming pregnant while being treated with VELCADE. Advise pregnant women of potential embryo-fetal harm.
▼ Closely monitor patients receiving VELCADE in combination with strong CYP3A4 inhibitors. Avoid concomitant use of strong CYP3A4 inducers.
ADVERSE REACTIONSMost commonly reported adverse reactions (incidence ≥20%) in clinical studies include nausea, diarrhea, thrombocytopenia, neutropenia, peripheral neuropathy, fatigue, neuralgia, anemia, leukopenia, constipation, vomiting, lymphopenia, rash, pyrexia, and anorexia.
Please see Brief Summary for VELCADE on the next page of this advertisement.
For Reimbursement Assistance, call 1-866-VELCADE (835-2233), Option 2, or visit VELCADEHCP.com.
Reference: 1. Mateos M-V, Richardson PG, Schlag R, et al. Bortezomib plus melphalan and prednisone compared with melphalan and prednisone in previously untreated multiple myeloma: updated follow-up and impact of subsequent therapy in the phase III VISTA trial. J Clin Oncol. 2010;28(13):2259-2266.*Melphalan+prednisone.† VISTA TRIAL: a randomized, open-label, international phase 3 trial (N=682) evaluating the ef� cacy and safety of VELCADE administered intravenously in combination with MP vs MP in previously untreated multiple myeloma. The primary endpoint was TTP. Secondary endpoints were CR, ORR, PFS, and overall survival. At a prespeci� ed interim analysis (median follow-up 16.3 months), VELCADE+MP resulted in signi� cantly superior results for TTP (median 20.7 months with VELCADE+MP vs 15.0 months with MP [p=0.000002]), PFS, overall survival, and ORR. Further enrollment was halted and patients receiving MP were offered VELCADE in addition. Updated analysis was performed.
The median age of patients in the VISTA† trial was 71 years(range: 48-91).
3822_26_milpro_fa1_hpr_ahdb.indd 1 12/12/12 3:00 PM
VELCADE, MILLENNIUM and are registered trademarks of Millennium Pharmaceuticals, Inc. Other trademarks are property of their respective owners.
Millennium Pharmaceuticals, Inc., Cambridge, MA 02139 Copyright © 2012, Millennium Pharmaceuticals, Inc.All rights reserved. Printed in USA
Brief Summary
INDICATIONS:VELCADE® (bortezomib) for Injection is indicated for the treatment of patients with multiple myeloma. VELCADE for Injection is indicated for the treatment of patients with mantle cell lymphoma who have received at least 1 prior therapy.
CONTRAINDICATIONS: VELCADE is contraindicated in patients with hypersensitivity (not including local reactions) to bortezomib, boron, or mannitol, including anaphylactic reactions. VELCADE is contraindicated for intrathecal administration.
WARNINGS AND PRECAUTIONS: Peripheral Neuropathy: VELCADE treatment causes a peripheral neuropathy that is predominantly sensory; however, cases of severe sensory and motor peripheral neuropathy have been reported. Patients with pre-existing symptoms (numbness, pain, or a burning feeling in the feet or hands) and/or signs of peripheral neuropathy may experience worsening peripheral neuropathy (including ≥Grade 3) during treatment with VELCADE. Patients should be monitored for symptoms of neuropathy, such as a burning sensation, hyperesthesia, hypoesthesia, paresthesia, discomfort, neuropathic pain or weakness. In the Phase 3 relapsed multiple myeloma trial comparing VELCADE subcutaneous vs intravenous, the incidence of Grade ≥2 peripheral neuropathy events was 24% for subcutaneous and 39% for intravenous. Grade ≥3 peripheral neuropathy occurred in 6% of patients in the subcutaneous treatment group, compared with 15% in the intravenous treatment group. Starting VELCADE subcutaneously may be considered for patients with pre-existing or at high risk of peripheral neuropathy.Patients experiencing new or worsening peripheral neuropathy during VELCADE therapy may require a decrease in the dose and/or a less dose-intense schedule. In the VELCADE vs dexamethasone phase 3 relapsed multiple myeloma study, improvement in or resolution of peripheral neuropathy was reported in 48% of patients with ≥Grade 2 peripheral neuropathy following dose adjustment or interruption. Improvement in or resolution of peripheral neuropathy was reported in 73% of patients who discontinued due to Grade 2 neuropathy or who had ≥Grade 3 peripheral neuropathy in the phase 2 multiple myeloma studies. The long-term outcome of peripheral neuropathy has not been studied in mantle cell lymphoma.Hypotension: The incidence of hypotension (postural, orthostatic, and hypotension NOS) was 8%. These events are observed throughout therapy. Caution should be used when treating patients with a history of syncope, patients receiving medications known to be associated with hypotension, and patients who are dehydrated. Management of orthostatic/postural hypotension may include adjustment of antihypertensive medications, hydration, and administration of mineralocorticoids and/or sympathomimetics.Cardiac Toxicity: Acute development or exacerbation of congestive heart failure and new onset of decreased left ventricular ejection fraction have occurred during VELCADE therapy, including reports in patients with no risk factors for decreased left ventricular ejection fraction. Patients with risk factors for, or existing, heart disease should be closely monitored. In the relapsed multiple myeloma study of VELCADE vs dexamethasone, the incidence of any treatment-related cardiac disorder was 8% and 5% in the VELCADE and dexamethasone groups, respectively. The incidence of adverse reactions suggestive of heart failure (acute pulmonary edema, pulmonary edema, cardiac failure, congestive cardiac failure, cardiogenic shock) was ≤1% for each individual reaction in the VELCADE group. In the dexamethasone group, the incidence was ≤1% for cardiac failure and congestive cardiac failure; there were no reported reactions of acute pulmonary edema, pulmonary edema, or cardiogenic shock. There have been isolated cases of QT-interval prolongation in clinical studies; causality has not been established.Pulmonary Toxicity: Acute Respiratory Distress Syndrome (ARDS) and acute diffuse infiltrative pulmonary disease of unknown etiology, such as pneumonitis, interstitial pneumonia, and lung infiltration have occurred in patients receiving VELCADE. Some of these events have been fatal. In a clinical trial, the first two patients given high-dose cytarabine (2 g/m2 per day) by continuous infusion with daunorubicin and VELCADE for relapsed acute myelogenous leukemia died of ARDS early in the course of therapy. There have been reports of pulmonary hypertension associated with VELCADE administration in the absence of left heart failure or significant pulmonary disease. In the event of new or worsening cardiopulmonary symptoms, consider interrupting VELCADE until a prompt, comprehensive, diagnostic evaluation is conducted.Posterior Reversible Encephalopathy Syndrome (PRES): Posterior Reversible Encephalopathy Syndrome (PRES; formerly termed Reversible Posterior Leukoencephalopathy Syndrome (RPLS)) has occurred in patients receiving VELCADE. PRES is a rare, reversible, neurological disorder, which can present with seizure, hypertension, headache, lethargy, confusion, blindness, and other visual and neurological disturbances. Brain imaging, preferably MRI (Magnetic Resonance Imaging), is used to confirm the diagnosis. In patients developing PRES, discontinue VELCADE. The safety of reinitiating VELCADE therapy in patients previously experiencing PRES is not known.Gastrointestinal Toxicity: VELCADE treatment can cause nausea, diarrhea, constipation, and vomiting, sometimes requiring use of antiemetic and antidiarrheal medications. Ileus can occur. Fluid and electrolyte replacement should be administered to prevent dehydration. Interrupt VELCADE for severe symptoms.Thrombocytopenia/Neutropenia: VELCADE is associated with thrombocytopenia and neutropenia that follow a cyclical pattern, with nadirs occurring following the last dose of each cycle and typically recovering prior to initiation of the subsequent cycle. The cyclical pattern of platelet and neutrophil decreases and recovery remained consistent over the 8 cycles of twice-weekly dosing, and there was no evidence of cumulative thrombocytopenia or neutropenia. The mean platelet count nadir measured was approximately 40% of baseline. The severity of thrombocytopenia was related to pretreatment platelet count. In the relapsed multiple myeloma study of VELCADE vs dexamethasone, the incidence of bleeding (≥Grade 3) was 2% on the VELCADE arm and <1% on the dexamethasone arm. Complete blood counts (CBC) should be monitored frequently during treatment with VELCADE. Platelet counts should be monitored prior to each dose of VELCADE. Patients experiencing thrombocytopenia may require change in the dose and schedule of VELCADE. Gastrointestinal and intracerebral hemorrhage has been reported in association with VELCADE. Transfusions may be considered. Tumor Lysis Syndrome: Tumor lysis syndrome has been reported with VELCADE therapy. Patients at risk of tumor lysis syndrome are those with high tumor burden prior to treatment. Monitor patients closely and take appropriate precautions.Hepatic Toxicity: Cases of acute liver failure have been reported in patients receiving multiple concomitant medications and with serious underlying medical conditions. Other reported hepatic reactions include hepatitis, increases in liver enzymes, and hyperbilirubinemia. Interrupt VELCADE therapy to assess reversibility. There is limited re-challenge information in these patients.
Embryo-fetal: Pregnancy Category D. Women of reproductive potential should avoid becoming pregnant while being treated with VELCADE. Bortezomib administered to rabbits during organogenesis at a dose approximately 0.5 times the clinical dose of 1.3 mg/m2 based on body surface area caused post-implantation loss and a decreased number of live fetuses.
ADVERSE EVENT DATA: Safety data from phase 2 and 3 studies of single-agent VELCADE 1.3 mg/m2/dose administered intravenously twice weekly for 2 weeks followed by a 10-day rest period in 1163 patients with previously-treated multiple myeloma (N=1008) and previously-treated mantle cell lymphoma (N=155) were integrated and tabulated. In these studies, the safety profile of VELCADE was similar in patients with multiple myeloma and mantle cell lymphoma.In the integrated analysis, the most commonly reported (≥10%) adverse reactions were nausea (49%), diarrhea NOS (46%), fatigue (41%), peripheral neuropathies NEC (38%), thrombocytopenia (32%), vomiting NOS (28%), constipation (25%), pyrexia (21%), anorexia (20%), anemia NOS (18%), headache NOS (15%), neutropenia (15%), rash NOS (13%), paresthesia (13%), dizziness (excl vertigo 11%), and weakness (11%). Eleven percent (11%) of patients experienced at least 1 episode of ≥Grade 4 toxicity, most commonly thrombocytopenia (4%) and neutropenia (2%). A total of 26% of patients experienced a serious adverse reaction during the studies. The most commonly reported serious adverse reactions included diarrhea, vomiting, and pyrexia (3% each), nausea, dehydration, and thrombocytopenia (2% each), and pneumonia, dyspnea, peripheral neuropathies NEC, and herpes zoster (1% each).In the phase 3 VELCADE+melphalan and prednisone study in previously untreated multiple myeloma, the safety profile of VELCADE administered intravenously in combination with melphalan/prednisone is consistent with the known safety profiles of both VELCADE and melphalan/prednisone. The most commonly reported adverse reactions in this study (VELCADE+melphalan/prednisone vs melphalan/prednisone) were thrombocytopenia (48% vs 42%), neutropenia (47% vs 42%), peripheral neuropathy (46% vs 1%), nausea (39% vs 21%), diarrhea (35% vs 6%), neuralgia (34% vs <1%), anemia (32% vs 46%), leukopenia (32% vs 28%), vomiting (26% vs 12%), fatigue (25% vs 14%), lymphopenia (23% vs 15%), constipation (23% vs 4%), anorexia (19% vs 6%), asthenia (16% vs 7%), pyrexia (16% vs 6%), paresthesia (12% vs 1%), herpes zoster (11% vs 3%), rash (11% vs 2%), abdominal pain upper (10% vs 6%), and insomnia (10% vs 6%).In the phase 3 VELCADE subcutaneous vs intravenous study in relapsed multiple myeloma, safety data were similar between the two treatment groups. The most commonly reported adverse reactions in this study were peripheral neuropathy NEC (37% vs 50%), thrombocytopenia (30% vs 34%), neutropenia (23% vs 27%), neuralgia (23% vs 23%), anemia (19% vs 23%), diarrhea (19% vs 28%), leukopenia (18% vs 20%), nausea (16% vs 14%), pyrexia (12% vs 8%), vomiting (9% vs 11%), asthenia (7% vs 16%), and fatigue (7% vs 15%). The incidence of serious adverse reactions was similar for the subcutaneous treatment group (20%) and the intravenous treatment group (19%). The most commonly reported SARs were pneumonia and pyrexia (2% each) in the subcutaneous treatment group and pneumonia, diarrhea, and peripheral sensory neuropathy (3% each) in the intravenous treatment group.
DRUG INTERACTIONS: Bortezomib is a substrate of cytochrome P450 enzyme 3A4, 2C19 and 1A2. Co-administration of ketoconazole, a strong CYP3A4 inhibitor, increased the exposure of bortezomib by 35% in 12 patients. Monitor patients for signs of bortezomib toxicity and consider a bortezomib dose reduction if bortezomib must be given in combination with strong CYP3A4 inhibitors (eg, ketoconazole, ritonavir). Co-administration of omeprazole, a strong inhibitor of CYP2C19, had no effect on the exposure of bortezomib in 17 patients. Co-administration of rifampin, a strong CYP3A4 inducer, is expected to decrease the exposure of bortezomib by at least 45%. Because the drug interaction study (n=6) was not designed to exert the maximum effect of rifampin on bortezomib PK, decreases greater than 45% may occur. Efficacy may be reduced when VELCADE is used in combination with strong CYP3A4 inducers; therefore, concomitant use of strong CYP3A4 inducers is not recommended in patients receiving VELCADE. St. John’s wort (Hypericum perforatum) may decrease bortezomib exposure unpredictably and should be avoided. Co-administration of dexamethasone, a weak CYP3A4 inducer, had no effect on the exposure of bortezomib in 7 patients. Co-administration of melphalan-prednisone increased the exposure of bortezomib by 17% in 21 patients. However, this increase is unlikely to be clinically relevant.
USE IN SPECIFIC POPULATIONS:Nursing Mothers: It is not known whether bortezomib is excreted in human milk. Because many drugs are excreted in human milk and because of the potential for serious adverse reactions in nursing infants from VELCADE, a decision should be made whether to discontinue nursing or to discontinue the drug, taking into account the importance of the drug to the mother.Pediatric Use: The safety and effectiveness of VELCADE in children has not been established.Geriatric Use: No overall differences in safety or effectiveness were observed between patients ≥age 65 and younger patients receiving VELCADE; but greater sensitivity of some older individuals cannot be ruled out.Patients with Renal Impairment: The pharmacokinetics of VELCADE are not influenced by the degree of renal impairment. Therefore, dosing adjustments of VELCADE are not necessary for patients with renal insufficiency. Since dialysis may reduce VELCADE concentrations, VELCADE should be administered after the dialysis procedure. For information concerning dosing of melphalan in patients with renal impairment, see manufacturer’s prescribing information.Patients with Hepatic Impairment: The exposure of bortezomib is increased in patients with moderate and severe hepatic impairment. Starting dose should be reduced in those patients.Patients with Diabetes: During clinical trials, hypoglycemia and hyperglycemia were reported in diabetic patients receiving oral hypoglycemics. Patients on oral antidiabetic agents receiving VELCADE treatment may require close monitoring of their blood glucose levels and adjustment of the dose of their antidiabetic medication.
Please see full Prescribing Information for VELCADE at VELCADEHCP.com.
V-12-0306 11/12
3822_26_milpro_fa1_hpr_ahdb.indd 2 11/13/12 4:57 PM

9 www.AHDBonline.com l American Health & Drug Benefits lVol 6, No 1 l January/February 2013
Join AHDB Peer reView
Articles fall into 3 main areas related to healthcare: Regulatory, Business, and Clinical. These main categories are represented from the different vantage points of all stakeholders in healthcare and are divided into many sub-categories, including (but not limited to) those listed below. Please mark the categories that apply to your expertise:
Administration/management Benefit design Disease management/state (eg, asthma, diabetes,
heart disease, infectious diseases, pain management, etc) Drug therapy (including biologics, generics) Drug utilization Employers/health plans Finance/health economics Health information technology Health policy/reform Patient education/initiatives/quality-of-life issues Payer perspectives Pharmacoeconomics analyses Pharmacy management: pharmacology, specialty pharmacy, pharmacy benefits Reimbursement: Medicare/Medicaid, health insurance, prior authorization Research: methods, study design, data collection/analysis
American Health & Drug Benefits (AHDB) is looking for medical
and pharmacy directors, P & T Committee members,
and other healthcare experts who are interested in joining our peer
reviewers and assist in maintaining the high quality of articles published in the journal.
You will be asked to review at least 1 or 2 articles per year in your area of expertise. Reviewers’
names will be published online at the end of the year.
Please indicate at least 1 area of expertise in a health-related field
for which they feel qualified to assess the content and quality of
manuscripts submitted to AHDB.
to become a peer reviewer, please complete the form below and fax to: 732-992-1881or e-mail to [email protected]
Your Information
_______________________________________________________________________________________First Name Last Name Credentials _______________________________________________________________________________________Title Company
_______________________________________________________________________________________Address
_______________________________________________________________________________________E-mail Phone
10 l American Health & Drug Benefits l www.AHDBonline.com January/February 2013 l Vol 6, No 1
January/February 2013 Volume 6, number 1
American Health & Drug Benefits, ISSN 1942-2962 (print); ISSN 1942-2970 (online), is published 8 times a year by Engage Healthcare Communications, LLC, 1249 South River Rd, Suite 202A, Cranbury, NJ 08512. Copyright © 2013 by Engage Healthcare Communications, LLC. All rights reserved. American Health & Drug Benefits and The Peer-Reviewed Forum for Evidence in Benefit Design are trademarks of Engage Healthcare Communications, LLC. No part of this publication may be reproduced or transmitted in any form or by any means now or hereafter known, electronic or mechanical, including pho-tocopy, recording, or any informational storage and retrieval system, without written permission from the Publisher. Printed in the United States of America.
Address all editorial correspondence to: [email protected] Telephone: 732-992-1892 Fax: 732-992-1881 American Health & Drug Benefits 1249 South River Rd, Suite 202A, Cranbury, NJ 08512
The ideas and opinions expressed in American Health & Drug Benefits do not necessarily reflect those of the Editorial Board, the Editors, or the Publisher. Publication of an advertisement or other product mentioned in American Health & Drug Benefits should not be construed as an endorsement of the product or the manufacturer’s claims. Readers are encouraged to contact the manufacturers about any features or limitations of prod-ucts mentioned. Neither the Editors nor the Publisher assume any responsibility for any injury and/or damage to persons or property arising out of or related to any use of the material mentioned in this publication.
For permission to reuse material from American Health & Drug Benefits (ISSN 1942-2962), please access www. copyright.com <http://www.copyright. com/> or contact the Copyright Clearance Center, Inc. (CCC), 222 Rosewood Drive, Danvers, MA 01923, 978-750-8400.
Table of ConTenTs (Continued)
™ ™
The Peer-reviewed Forum For evidence in BeneFiT design™
For Payers, Purchasers, Policymakers, and other healthcare stakeholders
POSTMASTER: CORRESPONDENCE REGARDING SUBSCRIPTIONS OR CHANGE OF ADDRESS should be directed to CIRCULATION DIRECTOR, American Health & Drug Benefits, 1249 South River Rd, Suite 202A, Cranbury, NJ 08512. Fax: 732-992-1881. YEARLY SUBSCRIPTION RATES: One year: $99.00 USD; Two years: $149.00 USD; Three years: $199.00 USD.
REGuLATORY
47 Medicare Part D and the Federal Employees Health Benefits Program: A Comparison of Prescription Drug Coverage
Annesha Lovett, PharmD, MS, PhD
58 Stakeholder Perspective: Medicare Part D and the Federal Employees Health Benefits Program
J. Warren Salmon, PhD
DEPARTMEnTs
14 Exploring Men’s Willingness to Pay for Prostate Cancer Screening to Avoid Unnecessary Biopsy and Treatment
Rosemary Frei, MSc
INDUSTRY TRENDS25 As Deadline Nears, Health Insurance Exchanges Making Progress,
with Some Setbacks By Dalia Buffery, MA, ABD
42 HIPAA Privacy and Security Regulations Updated Ross D. Margulies, JD, MPH; Jayson Slotnik, JD, MPH
43 The Role of Personalized Medicine in the Management of Patients with Breast Cancer
Phoebe Starr

MANAGED MARKETS
Partner with us for a diff erence your plan can see
a Novartis company
At Alcon, our focus on vison care comes with managed markets expertise.Leading pharmaceuticals and in-demand vision care products — with an understanding of what you and your members need. Contact your Alcon Managed Markets account manager to see what we can do for your plan.
©2013 Novartis 12/12 MGC13030MS
S:7.25”S:9.875”
T:8.125”T:10.875”
B:8.375”B:11.125”
AMCM2M0011_Alcon_Managed_Care_Ad_r18.indd 1 2/7/13 10:49 AM
EDITORIAL
12 l American Health & Drug Benefits l www.AHDBonline.com January/February 2013 l Vol 6, No 1
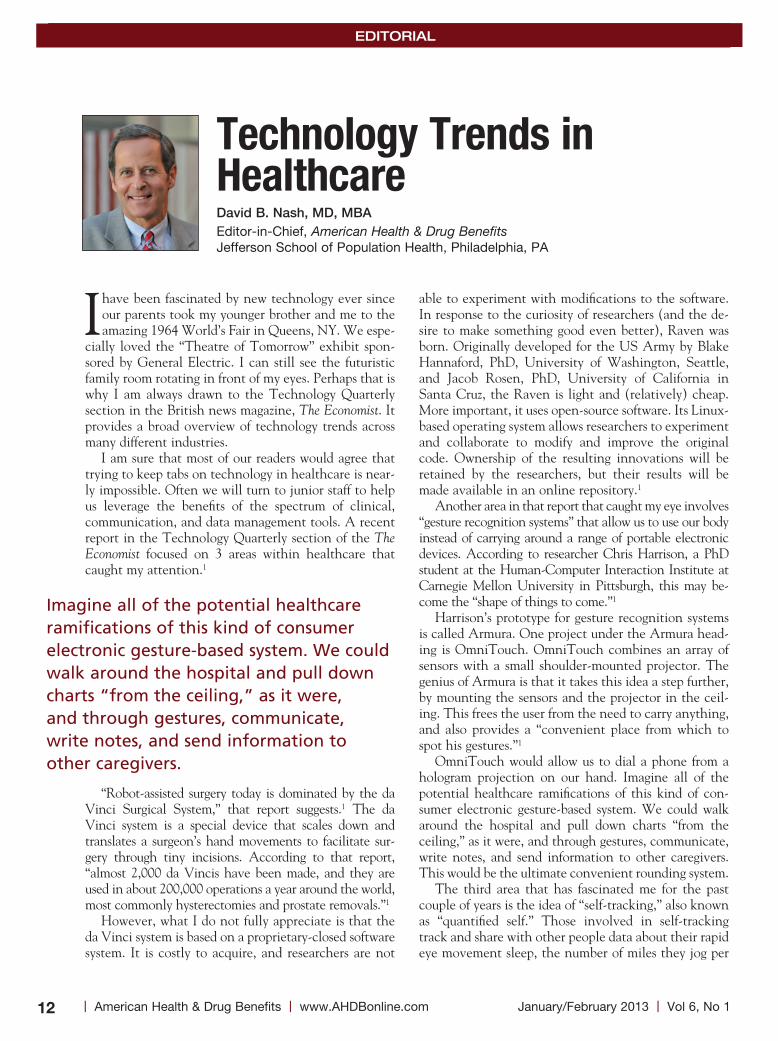
I have been fascinated by new technology ever since our parents took my younger brother and me to the amazing 1964 World’s Fair in Queens, NY. We espe-
cially loved the “Theatre of Tomorrow” exhibit spon-sored by General Electric. I can still see the futuristic family room rotating in front of my eyes. Perhaps that is why I am always drawn to the Technology Quarterly section in the British news magazine, The Economist. It provides a broad overview of technology trends across many different industries.
I am sure that most of our readers would agree that trying to keep tabs on technology in healthcare is near-ly impossible. Often we will turn to junior staff to help us leverage the benefits of the spectrum of clinical, communication, and data management tools. A recent report in the Technology Quarterly section of the The Economist focused on 3 areas within healthcare that caught my attention.1
“Robot-assisted surgery today is dominated by the da Vinci Surgical System,” that report suggests.1 The da Vinci system is a special device that scales down and translates a surgeon’s hand movements to facilitate sur-gery through tiny incisions. According to that report, “almost 2,000 da Vincis have been made, and they are used in about 200,000 operations a year around the world, most commonly hysterectomies and prostate removals.”1
However, what I do not fully appreciate is that the da Vinci system is based on a proprietary-closed software system. It is costly to acquire, and researchers are not
able to experiment with modifications to the software. In response to the curiosity of researchers (and the de-sire to make something good even better), Raven was born. Originally developed for the US Army by Blake Hannaford, PhD, University of Washington, Seattle, and Jacob Rosen, PhD, University of California in Santa Cruz, the Raven is light and (relatively) cheap. More important, it uses open-source software. Its Linux-based operating system allows researchers to experiment and collaborate to modify and improve the original code. Ownership of the resulting innovations will be retained by the researchers, but their results will be made available in an online repository.1
Another area in that report that caught my eye involves “gesture recognition systems” that allow us to use our body instead of carrying around a range of portable electronic devices. According to researcher Chris Harrison, a PhD student at the Human-Computer Interaction Institute at Carnegie Mellon University in Pittsburgh, this may be-come the “shape of things to come.”1
Harrison’s prototype for gesture recognition systems is called Armura. One project under the Armura head-ing is OmniTouch. OmniTouch combines an array of sensors with a small shoulder-mounted projector. The genius of Armura is that it takes this idea a step further, by mounting the sensors and the projector in the ceil-ing. This frees the user from the need to carry anything, and also provides a “convenient place from which to spot his gestures.”1
OmniTouch would allow us to dial a phone from a hologram projection on our hand. Imagine all of the potential healthcare ramifications of this kind of con-sumer electronic gesture-based system. We could walk around the hospital and pull down charts “from the ceiling,” as it were, and through gestures, communicate, write notes, and send information to other caregivers. This would be the ultimate convenient rounding system.
The third area that has fascinated me for the past couple of years is the idea of “self-tracking,” also known as “quantified self.” Those involved in self-tracking track and share with other people data about their rapid eye movement sleep, the number of miles they jog per
EDITORIAL
Technology Trends in Healthcare David B. Nash, MD, MBAEditor-in-Chief, American Health & Drug Benefits Jefferson School of Population Health, Philadelphia, PA
Imagine all of the potential healthcare ramifications of this kind of consumer electronic gesture-based system. We could walk around the hospital and pull down charts “from the ceiling,” as it were, and through gestures, communicate, write notes, and send information to other caregivers.
EDITORIAL
13 www.AHDBonline.com l American Health & Drug Benefits lVol 6, No 1 l January/February 2013
day, the total calories they consume, and the like. The Economist reports on new players (ie, companies that are all based in San Francisco) and developments in the “self-tracking” world1:• Jawbone has released Up, a wristband that communi-
cates with an iPhone and can also measure physical activity and sleep patterns
• Basis is about to launch a wristwatch-type device capable of measuring heart rate, skin conductance, and sleep patterns, all of which can then be displayed on a health dashboard
• And finally, GreenGoose has devised a tiny motion sensor that can be attached to everyday items, send-ing a wireless signal to a base station whenever the item is used; this sensor, for example, can be at-tached to a toothbrush, watering can, collar of the dog, or other potential health-related activities that can become a “platform for the gamification of ev-eryday activities.”I am fascinated by all of the potential prevention and
wellness activities that can be enhanced via the tech-nology from companies like Jawbone, Basis, and Green
Goose. Data that have been collected can serve as the basis for a very comprehensive conversation with prima-ry care physicians about a patient’s commitment to fit-ness, appropriate diet, and other prevention and wellness activities. This practical use of technology has the poten-tial to transform the patient–physician relationship.
My future grandchildren will not be attending a World’s Fair in person anytime soon; they will, instead, be logging on and participating in a virtual way, led by some of the companies mentioned above. The poten-tial to improve our daily life, enhanced with the appro-priate technology, is nearly limitless. We can start with enhanced adherence and compliance programs and build a prevention platform and a healthcare dashboard today. I am confident that there are pharmacists, nurs-es, and clinicians of all types tinkering in their garages right now.
As always, I am interested in your views, and you can reach me by e-mail at [email protected]. Please also visit my blog at http://nashhealthpolicy.blogspot.com.
Reference1. Technology Quarterly. The Economist. March 3, 2012:3-24.
Signature (Required) Specialty
Date (Required) Address
Name City/State/Zip
Company E-mail
Title Phone
Request your subscRipTion to AmericAn HeAltH & Drug Benefits®
Please provide all information indicated, including date and signature. INCOMPLETE CARDS WILL NOT BE PROCESSED.
q YES! I would like to receive American Health & Drug Benefits® as well as related educational supplements.
q NO. Please discontinue my subscription.
Fax to: 732.992.1881

14 l American Health & Drug Benefits l www.AHDBonline.com January/February 2013 l Vol 6, No 1
Dutch researchers have peered into the minds and wallets of a group of men aged 55 to 75 years to determine what they are willing to
trade for a reduced risk of prostate cancer–related death or to avoid unnecessary procedures and treatment.
Men with more education had a lower probability of opting for prostate cancer screening. Furthermore, in aggregate, the men were willing to lose 2% of risk re-duction in mortality related to prostate cancer or to pay on average €188 (in 2010 Euros; equivalent to $245 in 2010 US dollars) annually for a 10% reduced risk of unnecessary biopsy or treatment.
“Physicians should be aware that men, particularly those with less education, may overestimate the benefit of prostate cancer screening, due to numeracy prob-lems...and that therefore tailored prostate cancer screening programs may result in a better-informed shared decision-making for screening,” wrote Esther W. de Bekker-Grob, PhD, a researcher and health economist at Erasmus Medical Center, Rotterdam, the Netherlands, and her colleagues (de Bekker-Grob EW, et al. Br J Cancer. 2013 Jan 29 [Epub ahead of print]).
“Increasing knowledge on overdiagnosis and over-treatment, especially for men with lower educational levels, is warranted to prevent unrealistic expectations from prostate cancer screening,” she continued.
The team formulated 2 versions of a questionnaire containing 16 choice sets on prostate cancer screening. These were based on the prostate cancer screening lit-erature and interviews with 8 prostate cancer experts. A total of 459 men (average age, 63.3 years) from
southwest Holland responded to the questionnaires. The researchers divided the men into 3 groups:
• Most men in the first group had a lower educational level, did not have anxiety or depression, and were willing to pay for prostate cancer screening
• Most men in the second group also had a lower ed-ucational level and did not have anxiety or depres-sion, but they were not willing to pay for screening
• The third group largely comprised men who had a higher educational level, had anxiety or depression, and were not willing to pay for prostate cancer screening.The men in all 3 groups indicated that a reduction
in the risk of developing prostate cancer, a reduction in the risk of unnecessary treatment and biopsy, and costs are all important.
Those in the first group had a preference for annual or biennial screening, those in the second group did not have a preference for shorter or for longer screening intervals, and members of the third group preferred screening every 2 years versus screening every 4 years.
Willingness to PayWhen all 3 groups were combined, the men were
willing to pay an average cost of:• €188 (or $245 US) for a 10% reduction in prostate
cancer–related death• €33 ($43 US) annually for a 10% reduction in the
risk of an unnecessary prostate biopsy• €38 ($50 US) annually for a 10% decrease in the
risk of undergoing unnecessary treatment• €87 ($115 US) annually to access a prostate cancer
screening program with a 2-year interval rather than a 4-year interval. In addition, the men were willing to exchange 2% of
the reduced risk of prostate cancer mortality for a 10% reduction in unnecessary treatment.
The men were also willing to trade 1.8% of their re-duced mortality risk for a 10% reduction in the probabil-ity of an unnecessary biopsy, and a 4.6% reduced risk of prostate cancer–related death for a 2-year screening in-terval rather than a 4-year screening interval. n
Exploring Men’s Willingness to Pay for Prostate Cancer Screening to Avoid Unnecessary Biopsy and TreatmentBy Rosemary Frei, MSc
The men were also willing to trade 1.8% of their reduced mortality risk for a 10% reduction in the probability of an unnecessary biopsy, and a 4.6% reduced risk of prostate cancer–related death for a 2-year screening interval rather than a 4-year screening interval.
15 www.AHDBonline.com l American Health & Drug Benefits lVol 6, No 1 l January/February 2013
BUSINESS
Original research
Budget Impact Model: Epigenetic Assay Can Help Avoid Unnecessary Repeated Prostate Biopsies and Reduce Healthcare Spending Wade aubry, MD; robert lieberthal, PhD; arnold Willis, MD; grant Bagley, MD, JD; simon M. Willis iii, Ms; andrew layton, Ba
Background: The diagnosis of prostate cancer involves invasive, sometimes harmful, proce-dures that can entail negative quality-of-life implications to individuals and high additional costs to the US healthcare system when these procedures result in retesting and iatrogenic harms. It is estimated that $1.86 billion is spent annually on prostate-specific antigen (PSA) testing alone. An advanced epigenetic molecular diagnostic test that uses methylation-specific poly-merase chain reaction to assess the DNA methylation status of GSTP1, APC, and RASSF1 genes associated with oncogenesis enables a higher degree of accuracy (previously unattain-able through prostate biopsy procedures alone) and produces clinical, financial, and health benefits by reducing the number of medically unnecessary and costly repeated biopsies that are part of today’s standard of care. Objectives: The purpose of this study is to quantify, using a budget impact model, the effect of a relatively new epigenetic assay on healthcare costs for commercial health plans that re-imburse for the assay, by avoiding unnecessary repeated prostate biopsy procedures. Methods: A budget impact model was developed to test the hypothesis that the epigenetic assay can produce cost-saving benefits to health plans, as well as clinical benefits to urologists and patients with prostate cancer, by providing guidance on how to offer patients more appropri-ate, and less costly, care. The budget impact model is presented from the perspective of a hypo-thetical commercial health plan, and direct costs are calculated over a 1-year time horizon, using 2013 Medicare fee-for-service rates. Using a plan of 1 million members, the model compares 1-year costs in a “reference scenario,” in which the epigenetic assay is not used for the screening and diagnosis of prostate cancer, to costs in a “new scenario,” in which the epigenetic assay is used to distinguish true-negative prostate biopsy results from false-negative biopsy results.Results: Based on this analysis, administering the epigenetic assay to patients with histo-pathologically negative biopsies would result in a reduction of 1106 unnecessary biopsies for a health plan with 1 million members. The total 1-year cost of repeated prostate cancer biopsies to the health plan was found to be $2,864,142 in the reference scenario and $2,333,341 in the new scenario. This translates to a total budget impact, or an annual savings, of $530,801 to the plan. The total diagnostic cost was calculated to be $2584 per patient in the new scenario (using the genetic assay) compared with $3172 per patient in the reference scenario (that did not use the assay), resulting in a savings of $588 per patient management.Conclusion: This analysis shows that the net cost to a commercial health plan with 1 million members would be reduced by approximately $500,000 if patients with histopathologically negative biopsies were managed with the use of the epigenetic assay to differentiate patients who should undergo repeated biopsy and those who should not. Using this genetic-based assay can save costs to health plans and to the US healthcare and improve the clinical man-agement of patients with elevated PSA levels.
Am Health Drug Benefits. 2013;6(1):15-24www.AHDBonline.com
Disclosures are at end of text
Stakeholder Perspective, page 23
Dr Aubry is Associate Clinical Professor of Medicine, Philip R. Lee Institute for Health Policy Studies, University of California, San Francisco, and Senior Medical Director, Quorum Consulting, San Francisco, CA; Dr Lieberthal is Assistant Professor, Jefferson School of Population Health, Thomas Jefferson University, Philadelphia, PA; Dr A. Willis is Associate Dean of Clinical Sciences and Professor of Urology, Aureus University School of Medicine, Oranjestad, Aruba; Dr Bagley is Senior Advisor, HillCo HEALTH, Washington, DC; Mr S.M. Willis is third-year medical student, Aureus University School of Medicine, Oranjestad, Aruba; and Mr Layton is Director, Information Technology, Quorum Consulting, San Francisco, CA.
BUSINESS
16 l American Health & Drug Benefits l www.AHDBonline.com January/February 2013 l Vol 6, No 1
Prostate cancer is the most frequently detected can-cer in men, and 1 of 6 men will be diagnosed with prostate cancer during their lifetime based on
Medicare enrollment data.1 In the United States, ap-proximately 19 million men annually are screened by prostate-specific antigen (PSA) testing,2 resulting in ap-proximately 4.7 million abnormal PSA test results (≥4.0 ng/mL)3 leading to approximately 1.3 million biopsy procedures.4 According to the National Cancer Institute, 241,740 men are diagnosed with prostate cancer annually, and 28,170 prostate cancer–related deaths were reported in 2012.5 Although some forms of prostate cancer are deadly, many forms are low grade and can be managed by active surveillance. Aggressive variants of prostate cancer can be one of the deadliest cancers in men, and accurate diagnosis and follow-up remain a challenge and come at a considerable cost to the US healthcare system.
Clinical BurdenDespite the recent controversy that was raised by the
US Preventive Services Task Force (USPSTF) findings on PSA testing, leading to their recommendations to stop routine PSA-based screening,6 the American Urological Association (AUA) continues to recommend the PSA blood test, along with digital rectal examination (DRE), for screening men at risk for prostate cancer. Screening has led to a shift of detecting earlier-stage disease, resulting in an increased likelihood for curative treatment. If screening is eliminated, urologists fear an increased inci-dence of advanced cancers and an increase in healthcare costs to effectively treat these patients.7 Today, urologists typically perform a biopsy for high-risk patients with a rising PSA and for patients with a PSA level ≥4.0 ng/mL, obtaining approximately 10 to 12 needle-core tissue sam-ples according to the current standard of care.8,9
Of note, an abnormal PSA result can often be caused by factors other than cancer, including infection, inflam-mation, or other benign conditions, such as benign pros-tatic hyperplasia. This leads to the inclusion of many men with no cancer among those who are being subject-ed to prostate biopsies (ie, false-positive PSA screening). The rate of cancer detection in men undergoing prostate biopsies is approximately 30%, and approximately 75% of men who have undergone biopsies have negative pros-tate biopsy results.2,3
An elevated PSA and/or abnormal DRE identify men at high risk for prostate cancer, and, as a result, many of these men will undergo a biopsy procedure. However, because of the nature of random and limited sampling of the prostate, many cancers are undetected by histo-pathologic review. Studies by urology and pathology opinion leaders report that initial prostate biopsy histo-pathology has a 20% to 30% false-negative rate.8,10,11
Given these reported false-negative rates for histology, many patients with persistently elevated PSA values are at risk for occult cancer. This uncertainty poses a diag-nostic dilemma, resulting in many men receiving 2, 3, and sometimes 4 repeated biopsy procedures.12-14
Repeated biopsies expose patients to the discomfort and risk of complications associated with this invasive procedure. Complications include infections, prostatitis, cystitis, sepsis, endocarditis, hypotension, gastrointesti-nal hemorrhage, hematuria, and urinary symptoms. Recently, antibiotic resistance has also been cited as a growing concern.1
Economic BurdenRepeated biopsies also generate high medical costs.
Approximately $1.86 billion is spent annually on PSA tests alone.2,15 More than $4 billion is spent annually on therapies for prostate cancer, and this amount is expect-ed to increase to $8.7 billion by the year 2019.16
Molecular TestingWith such high costs to the US healthcare system, as
well as negative quality-of-life implications to patients,
Key Points
➤ The diagnosis of prostate cancer involves invasive procedures that can have negative clinical implications for patients and add costs to health plans and the US healthcare system.
➤ The appropriate use of PSA testing remains controversial, because elevated PSA levels can be caused by conditions unrelated to prostate cancer.
➤ Nevertheless, many men with benign conditions and elevated PSA levels undergo repeated prostate biopsies, which may be unnecessary, because of low risk of prostate cancer.
➤ A recent genetic-based assay has shown 90% negative predictive value in differentiating men with elevated PSA levels who should undergo a biopsy and those who should not.
➤ Applying a budget impact analysis to a hypothetical 1-million-member health plan based on current evidence-based data, the use of this assay would reduce the number of unnecessary biopsies in this plan by 1106 annually and save the plan $530,142.
➤ In line with the increasing focus on personalized medicine in oncology, using a genetic-based test to select appropriate candidates for prostate cancer biopsies can limit the number of unnecessary biopsies performed and save costs to payers and to the US healthcare system.
Epigenetic Assay: Screening for Prostate Cancer
17 www.AHDBonline.com l American Health & Drug Benefits lVol 6, No 1 l January/February 2013
the AUA has called for new biomarkers for the improved diagnosis and treatment of prostate cancer.17 With the growing movement toward personalized medicine, the application of molecular testing to improve cancer de-tection and the management of patients represents an evolution in oncology.2,18
Epigenetic assays, in particular, have been reported to improve on the accuracy of prostate biopsies and histo-pathologic review.2,8 (Epigenetic refers to gene regulatory mechanisms; epigenetic assays are based on the differences in the chromatin structure of actively and silent genes.) In a recent multicenter, blinded study, such an epigenetic assay (ie, ConfirmMDx for Prostate Cancer) was used to detect occult cancer in histopathologically negative pros-tate biopsies.8 The assay was performed using multiplex methylation-specific polymerase chain reaction to assess the DNA methylation status of the GSTP1, APC, and RASSF1 genes associated with the presence of cancer in residual negative prostate biopsy tissue samples.3,8,10 Using this advanced molecular diagnostic test allows for a higher degree of accuracy that was previously unattainable through prostate biopsy procedures alone.
By detecting epigenetic changes that are known to be associated with oncogenesis progression, in cancer lesions or in neighboring cells (ie, field effect), these biomarkers aid in the identification of occult prostate cancer. This field effect accounts for improved detection in adjacent, benign-looking tissue, providing a higher negative predic-tive value than standard histopathology alone.19,20 The test results of this new epigenetic assay can guide urologists in decisions regarding the need to repeat a biopsy in patients with a previously negative biopsy who are still considered at risk for prostate cancer.8
A Budget Impact AnalysisA budget impact model was developed to assess
whether the epigenetic assay can also produce financial benefits, beyond the reported clinical and health bene-fits. The model was designed to quantify the impact on the costs associated with repeated biopsies used for the screening and diagnosis of prostate cancer, and to test the hypothesis that the epigenetic assay produces a ben-eficial reduction in costs to commercial health plans, while providing improved guidance for patient manage-ment that leads to less invasive and less costly care. This type of analysis is an essential tool for healthcare manag-ers and policymakers budgeting and instituting coverage decisions for prostate cancer diagnostics.
MethodsStudy Design
The budget impact model is presented from the per-spective of a hypothetical commercial health plan, and
direct costs are calculated over a 1-year time horizon, using Medicare fee-for-service (FFS) rates.21,22 The mem-bership of this health plan is based on an assumed size of 1 million members, half of whom are males. The mem-bership is distributed among age categories according to US population data.23
The model’s base-case analysis was conducted for a hypothetical plan using patient age-groups between ages 40 and 64 years (similar to those in commercial health plans). An additional sensitivity analysis was conducted for a hypothetical plan consisting of patients aged ≥65 years (similar to a Medicare health plan), using methods identical to the base case, with the exception of the pa-tient ages and corresponding PSA rates. Biopsies and costs for patients younger than age 40 years or older than age 74 years were not included in the analysis.
The model screens the population to select patients who may receive a biopsy to test for the presence of pros-tate cancer. It then selects a specific subpopulation of those men, which are individuals who may receive a re-peat biopsy.
For men at risk of undergoing a repeated biopsy, the model allows for the simulation of the current (reference scenario) and a counterfactual reality (new scenario). In the reference scenario, the model uses current clinical patterns of care to simulate the treatment of men at risk of prostate cancer in the reference scenario; a molecular assay was not utilized for prostate cancer detection. In the new scenario, men at risk for repeated biopsy are evaluated with the epigenetic assay, and those with a negative DNA methylation test result are spared a repeat of the biopsy, thereby reducing the number of unneces-sary procedures.
The cost analysis was based on total costs of 1 year in the course of prostate cancer screening and evaluation through prostate biopsy. Costs to the health plan are as-sumed to be equal to the Medicare FFS rates, which provide a conservative benchmark for reimbursement rates paid for by other health plans. In the reference
The cost analysis was based on total costs of 1 year in the course of prostate cancer screening and evaluation through prostate biopsy. Costs to the health plan are assumed to be equal to the Medicare FFS rates, which provide a conservative benchmark for reimbursement rates paid for by other health plans.
BUSINESS
18 l American Health & Drug Benefits l www.AHDBonline.com January/February 2013 l Vol 6, No 1
scenario, the health plan incurs the costs of 1 or several repeated biopsies and the associated iatrogenic costs. In the new scenario, the health plan incurs the cost of an additional diagnostic test performed on the residual prostate tissue from the original sample plus the cost for repeated biopsies and associated iatrogenic costs on pa-tients who had positive test results.
The model assumes that the epigenetic assay would be used for all men meeting the assay’s eligibility require-ments, including an abnormal DRE, an elevated PSA level, and a negative prostate biospy. Both scenarios
calculate a total cost and a plan budget impact, ex-pressed on a per-member per-month (PMPM) basis, as well as the aggregate annual cost to the plan.
Data SourcesThe PubMed database was searched for published clin-
ical and pharmacoeconomic studies to assign values to the clinical and cost parameters used in the model. Studies were identified in PubMed that reflect current practice patterns of 10 to 12 core prostate biopsies in contrast to older studies that were based on sextant biopsy practice.
For cost parameters, a combination of published liter-ature cross-referenced to Medicare payment rates was used. Parameters pertaining to the accuracy and out-comes of the assay (including the assay’s sensitivity and specificity, and the positive and negative predictive val-ues) were cited from the MATLOC clinical trial.8
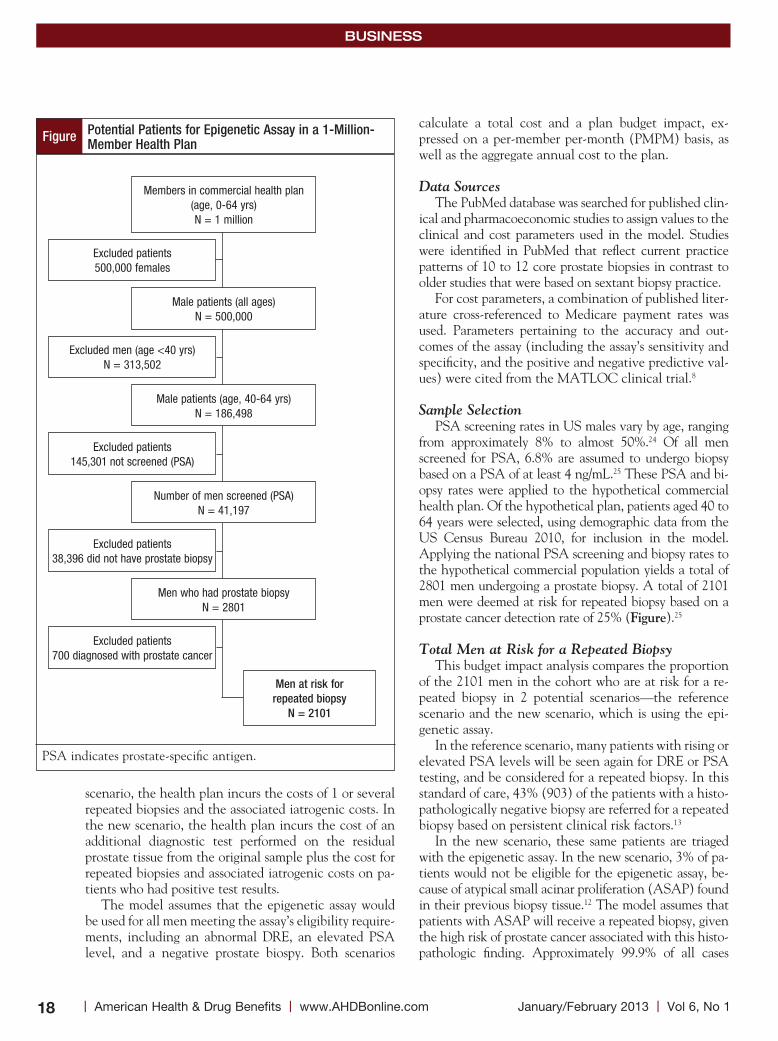
Sample SelectionPSA screening rates in US males vary by age, ranging
from approximately 8% to almost 50%.24 Of all men screened for PSA, 6.8% are assumed to undergo biopsy based on a PSA of at least 4 ng/mL.25 These PSA and bi-opsy rates were applied to the hypothetical commercial health plan. Of the hypothetical plan, patients aged 40 to 64 years were selected, using demographic data from the US Census Bureau 2010, for inclusion in the model. Applying the national PSA screening and biopsy rates to the hypothetical commercial population yields a total of 2801 men undergoing a prostate biopsy. A total of 2101 men were deemed at risk for repeated biopsy based on a prostate cancer detection rate of 25% (Figure).25
Total Men at Risk for a Repeated BiopsyThis budget impact analysis compares the proportion
of the 2101 men in the cohort who are at risk for a re-peated biopsy in 2 potential scenarios—the reference scenario and the new scenario, which is using the epi-genetic assay.
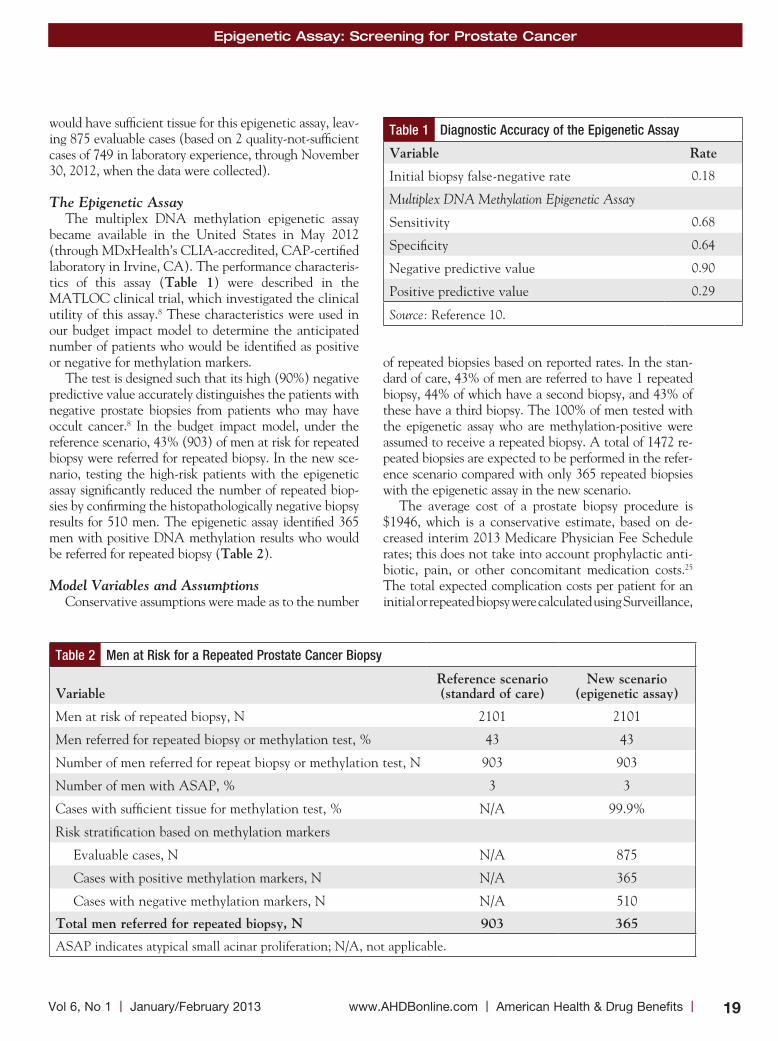
In the reference scenario, many patients with rising or elevated PSA levels will be seen again for DRE or PSA testing, and be considered for a repeated biopsy. In this standard of care, 43% (903) of the patients with a histo-pathologically negative biopsy are referred for a repeated biopsy based on persistent clinical risk factors.13
In the new scenario, these same patients are triaged with the epigenetic assay. In the new scenario, 3% of pa-tients would not be eligible for the epigenetic assay, be-cause of atypical small acinar proliferation (ASAP) found in their previous biopsy tissue.12 The model assumes that patients with ASAP will receive a repeated biopsy, given the high risk of prostate cancer associated with this histo-pathologic finding. Approximately 99.9% of all cases
Members in commercial health plan(age, 0-64 yrs)N = 1 million
Male patients (all ages)N = 500,000
Male patients (age, 40-64 yrs)N = 186,498
Number of men screened (PSA)N = 41,197
Men who had prostate biopsyN = 2801
Men at risk for repeated biopsy
N = 2101
Excluded patients500,000 females
Excluded men (age <40 yrs)N = 313,502
Excluded patients145,301 not screened (PSA)
Excluded patients38,396 did not have prostate biopsy
Excluded patients700 diagnosed with prostate cancer
PSA indicates prostate-specific antigen.
Figure Potential Patients for Epigenetic Assay in a 1-Million-Member Health Plan
Epigenetic Assay: Screening for Prostate Cancer
19 www.AHDBonline.com l American Health & Drug Benefits lVol 6, No 1 l January/February 2013
would have sufficient tissue for this epigenetic assay, leav-ing 875 evaluable cases (based on 2 quality-not-sufficient cases of 749 in laboratory experience, through November 30, 2012, when the data were collected).
The Epigenetic AssayThe multiplex DNA methylation epigenetic assay
became available in the United States in May 2012 (through MDxHealth’s CLIA-accredited, CAP-certified laboratory in Irvine, CA). The performance characteris-tics of this assay (table 1) were described in the MATLOC clinical trial, which investigated the clinical utility of this assay.8 These characteristics were used in our budget impact model to determine the anticipated number of patients who would be identified as positive or negative for methylation markers.
The test is designed such that its high (90%) negative predictive value accurately distinguishes the patients with negative prostate biopsies from patients who may have occult cancer.8 In the budget impact model, under the reference scenario, 43% (903) of men at risk for repeated biopsy were referred for repeated biopsy. In the new sce-nario, testing the high-risk patients with the epigenetic assay significantly reduced the number of repeated biop-sies by confirming the histopathologically negative biopsy results for 510 men. The epigenetic assay identified 365 men with positive DNA methylation results who would be referred for repeated biopsy (table 2).
Model Variables and AssumptionsConservative assumptions were made as to the number
of repeated biopsies based on reported rates. In the stan-dard of care, 43% of men are referred to have 1 repeated biopsy, 44% of which have a second biopsy, and 43% of these have a third biopsy. The 100% of men tested with the epigenetic assay who are methylation-positive were assumed to receive a repeated biopsy. A total of 1472 re-peated biopsies are expected to be performed in the refer-ence scenario compared with only 365 repeated biopsies with the epigenetic assay in the new scenario.
The average cost of a prostate biopsy procedure is $1946, which is a conservative estimate, based on de-creased interim 2013 Medicare Physician Fee Schedule rates; this does not take into account prophylactic anti-biotic, pain, or other concomitant medication costs.25
The total expected complication costs per patient for an initial or repeated biopsy were calculated using Surveillance,
Table 2 Men at Risk for a Repeated Prostate Cancer Biopsy
Variable
Reference scenario (standard of care)
new scenario (epigenetic assay)
Men at risk of repeated biopsy, N 2101 2101
Men referred for repeated biopsy or methylation test, % 43 43
Number of men referred for repeat biopsy or methylation test, N 903 903
Number of men with ASAP, % 3 3
Cases with sufficient tissue for methylation test, % N/A 99.9%
Risk stratification based on methylation markers
Evaluable cases, N N/A 875
Cases with positive methylation markers, N N/A 365
Cases with negative methylation markers, N N/A 510
total men referred for repeated biopsy, n 903 365
ASAP indicates atypical small acinar proliferation; N/A, not applicable.
Table 1 Diagnostic Accuracy of the Epigenetic Assay
Variable Rate
Initial biopsy false-negative rate 0.18
Multiplex DNA Methylation Epigenetic Assay
Sensitivity 0.68
Specificity 0.64
Negative predictive value 0.90
Positive predictive value 0.29
Source: Reference 10.

BUSINESS
20 l American Health & Drug Benefits l www.AHDBonline.com January/February 2013 l Vol 6, No 1
Epidemiology and End Results (SEER)-Medicare cancer registries’ reported incidence of infectious and noninfec-tious complications and the associated mean payment for the Medicare Severity-Diagnosis Related Groups (MS-DRGs) from the 2012 Centers for Medicare & Medicaid Services MS-DRG payment schedule.22
table 3 shows the calculations for the average cost ($392) of complications per patient undergoing repeated prostate cancer biopsy. The total weighted cost of a fully burdened biopsy is $1946—the sum of the procedural cost and the cost of complications weighted by inci-dence. The retail price for the epigenetic assay is $206 per individual core, or $2061 for a 10-core biopsy (pric-ing is based on the cost of the ConfirmMDx for Prostate Cancer Test, as provided by MDxHealth, the manufac-turer of this test). The model assesses the health plan’s costs compared with billed charges; therefore, the cost of this assay is discounted by 10%, to conservatively reflect payer costs, at $1855.02 per test.
ResultsCosts
This budget impact analysis demonstrates that the net cost to a commercial plan is lower if patients under-going prostate cancer biopsies are managed using the assay. Although this involves an additional cost for the acquisition of the assay, using the assay results in a reduc-tion of 1106 unnecessary biopsies for a health plan with 1 million members (table 4).
The total cost of repeated biopsies avoided is $2,152,276 (1106 biopsies avoided × $1946 per biopsy). The total cost to the health plan in 1 year was calculated to be $2,864,142 in the reference scenario versus $2,333,341 with the epigenetic assay in the new scenar-io. To calculate the total diagnostic cost per patient in the reference scenario, the cost of a prostate biopsy ($1946) was applied and weighted to a repeated biopsy distribution rate for the percentage of men who receive first, second, and third repeated biopsies of 43%, 44%, and 43%, respectively.13
For the new scenario, the total diagnostic cost per pa-tient includes the cost of the assay plus the weighted biop-sy cost, applied and weighted to 43% of men who have positive results based on the epigenetic assay (based on the sensitivity, specificity, and negative and positive pre-dictive values).8 The total diagnostic cost per patient was $3172 in the reference scenario compared with $2584 in the new scenario, resulting in a savings of $588 per patient managed. This results in a total savings of $530,801 annu-ally to the health plan, or –$0.0442 PMPM (table 5).
Sensitivity AnalysisTo test for uncertainty among the model parameters,
Table 3 Per-Patient Costs Associated with Biopsy Complications
infectious complications
DRG payment,
$
incidence (seeR-
Medicare)
Per- patient cost, $
Kidney infection 5594
Urinary tract infection 5594
Prostatitis 6220
Cystitis 5594
Sepsis/bacteremia 16,662
Endocarditis 10,943
Hypotension 5801
Average payment for infectious complications
8058 0.04 322
noninfectious complications
DRG payment,
$
incidence (seeR-
Medicare)
Per-patient cost, $
Gastrointestinal hemorrhage
6559
Hematuria 5366
Acute posthemorrhagic anemia
5660
Urinary symptoms/retention 5594
Average payment for noninfectious complications
5795 0.012 70
total cost 392
DRG indicates diagnosis-related group; SEER, Surveillance, Epidemiology and End Results.
Table 4 Total Resource Use: Repeated Prostate Biopsies
Resource
Reference scenario (standard
of care)
new scenario (epigenetic
assay)
Total men referred for first repeated biopsy, N
903 903
Total men referred for second repeated biopsy, N
397
Total men referred for third repeated biopsy, N
171
Total epigenetic tests, N 0 875
Total repeated biopsies, N 1472 365
total repeated biopsies avoided, n 1106
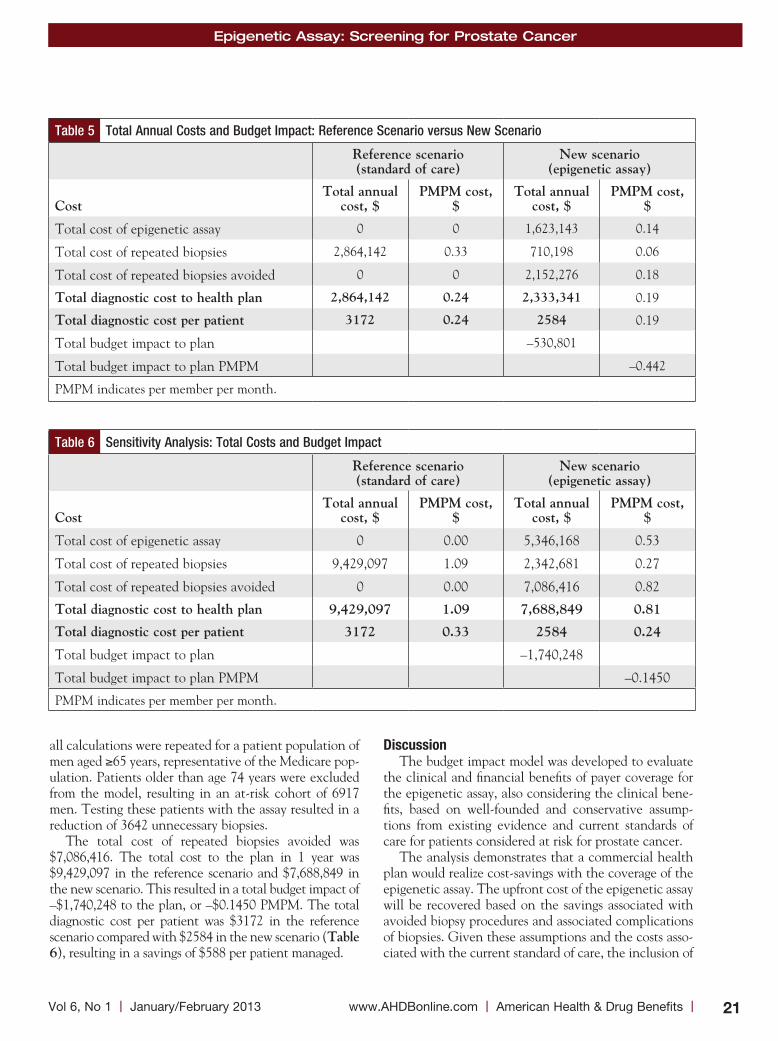
Epigenetic Assay: Screening for Prostate Cancer
21 www.AHDBonline.com l American Health & Drug Benefits lVol 6, No 1 l January/February 2013
all calculations were repeated for a patient population of men aged ≥65 years, representative of the Medicare pop-ulation. Patients older than age 74 years were excluded from the model, resulting in an at-risk cohort of 6917 men. Testing these patients with the assay resulted in a reduction of 3642 unnecessary biopsies.
The total cost of repeated biopsies avoided was $7,086,416. The total cost to the plan in 1 year was $9,429,097 in the reference scenario and $7,688,849 in the new scenario. This resulted in a total budget impact of –$1,740,248 to the plan, or –$0.1450 PMPM. The total diagnostic cost per patient was $3172 in the reference scenario compared with $2584 in the new scenario (table 6), resulting in a savings of $588 per patient managed.
DiscussionThe budget impact model was developed to evaluate
the clinical and financial benefits of payer coverage for the epigenetic assay, also considering the clinical bene-fits, based on well-founded and conservative assump-tions from existing evidence and current standards of care for patients considered at risk for prostate cancer.
The analysis demonstrates that a commercial health plan would realize cost-savings with the coverage of the epigenetic assay. The upfront cost of the epigenetic assay will be recovered based on the savings associated with avoided biopsy procedures and associated complications of biopsies. Given these assumptions and the costs asso-ciated with the current standard of care, the inclusion of
Table 6 Sensitivity Analysis: Total Costs and Budget Impact
Reference scenario (standard of care)
new scenario (epigenetic assay)
Cost
total annual cost, $
PMPM cost, $
total annual cost, $
PMPM cost, $
Total cost of epigenetic assay 0 0.00 5,346,168 0.53
Total cost of repeated biopsies 9,429,097 1.09 2,342,681 0.27
Total cost of repeated biopsies avoided 0 0.00 7,086,416 0.82
total diagnostic cost to health plan 9,429,097 1.09 7,688,849 0.81
total diagnostic cost per patient 3172 0.33 2584 0.24
Total budget impact to plan –1,740,248
Total budget impact to plan PMPM –0.1450
PMPM indicates per member per month.
Table 5 Total Annual Costs and Budget Impact: Reference Scenario versus New Scenario
Reference scenario (standard of care)
new scenario (epigenetic assay)
Cost
total annual cost, $
PMPM cost, $
total annual cost, $
PMPM cost, $
Total cost of epigenetic assay 0 0 1,623,143 0.14
Total cost of repeated biopsies 2,864,142 0.33 710,198 0.06
Total cost of repeated biopsies avoided 0 0 2,152,276 0.18
total diagnostic cost to health plan 2,864,142 0.24 2,333,341 0.19
total diagnostic cost per patient 3172 0.24 2584 0.19
Total budget impact to plan –530,801
Total budget impact to plan PMPM –0.442
PMPM indicates per member per month.

BUSINESS
22 l American Health & Drug Benefits l www.AHDBonline.com January/February 2013 l Vol 6, No 1
the epigenetic assay into the management of men who are screened for prostate cancer would result in a net cost-savings of –$530,801 in the first year after the assay became available in the United States in a health plan with 1 million members.
The epigenetic assay provides clear and actionable results that aid the urologist in treatment decision-mak-ing, improving patient care, and yielding significant healthcare savings. A key assumption is that a health plan inclusion of the epigenetic assay in medical policy and coverage decisions will motivate a change in the behavior of urologists, resulting in a reduction of repeat-ed biopsies. Policy tools that promote appropriate pa-tient management according to evidence-based guide-lines, such as value-based payment (eg, financial incentives for choosing evidence-based interventions) or coverage restrictions for repeated biopsies, may fur-ther enhance such outcomes.
LimitationsThe results of this budget impact analysis are based on
a hypothetical cohort modeled on the basis of values from the published literature. The use of national aver-ages may not reflect the true variety in clinical practice. Initial prostate biopsy and repeated biopsy rates in spe-cific geographic regions may be higher or lower than the reported national averages. Costs and resource utiliza-tion may also vary between practices and between geo-graphic regions.
Another potential limitation to the application of this model is that the future rates of screening for pros-tate cancer may vary, given the recent recommendation of the USPSTF to stop routine PSA-based prostate can-cer screening.6 The recommendation suggests that phy-sicians discuss the benefit-risk ratio with their patients and decide if PSA testing is appropriate based on risk factors such as race or family history.6 How this will af-fect screening rates is not yet known and is not explored in this analysis.
This study is intended to address the financial impact of the epigenetic assay on the costs to commercial health plans of repeated biopsies. Because the cost impact is associated with a reduction in complications from the
biopsy, the study provides some perspective on the im-pact of the assay on clinical outcomes. However, clinical outcomes were not evaluated in the design of the present study. A cost-effectiveness analysis would be the suitable approach to investigate the cost and the clinical out-comes associated with the use of the assay.
In addition, the assay’s impact on the rates of prostate cancer diagnosis and earlier case identification were out-side the scope of the study and were not methodically investigated.
Subgroup analyses were not performed for modestly elevated PSA patients versus those with markedly ele-vated PSA, because these patients are not managed dif-ferently in clinical practice.
Because of the negative predictive value of 90% of the epigenetic assay, 10% of patients testing negative with the assay could have a diagnosis of prostate cancer identified through recommended return screening. The clinical impact of this is not evaluated by the design of this model. The test has only been commercially avail-able in the United States since May 2012.
Conclusion Approximately $1.8 billion is spent annually on PSA
testing alone, and more than $4 billion is spent on pros-tate cancer therapies, leading the AUA to call for new biomarkers to improve accurate diagnosis and reduce the cost burden. Epigenetic assays have been reported to improve the accuracy of prostate biopsies and help to prevent repeated biopsies, the majority of which show negative results. Based on a recent analysis, the results of a new epigenetic assay can guide urologists in decisions regarding the need to repeat a biopsy in patients with a previously negative biopsy who are still considered at risk for prostate cancer.
A budget impact analysis calculated whether this assay can also produce financial benefits, beyond the previously reported clinical benefits. Using a hypotheti-cal health plan with 1 million members, this analysis shows that the total annual cost to the health plan would be reduced if patients with histopathologically negative biopsies would be managed with the epigenetic assay.
Specifically, the use of the assay would reduce the number of repeated biopsies from 1472 to 365, thereby preventing 1106 unnecessary biopsies and reducing the annual costs by approximately $500,000 to the health plan, based on the current standard of care. This test has only been available for a short time. Research to investi-gate the clinical impact of this essay based on real-world data will be appropriate.
DisclaimerAt the time this study was submitted for publication,
Approximately $1.8 billion is spent annually on PSA testing alone, and more than $4 billion is spent on prostate cancer therapies, leading the AUA to call for new biomarkers to improve accurate diagnosis and reduce the cost burden.
Epigenetic Assay: Screening for Prostate Cancer
23 www.AHDBonline.com l American Health & Drug Benefits lVol 6, No 1 l January/February 2013
prostate biopsy costs incorporated maximum payment reductions; conversion factor $25.0008 per the 2013 Medicare Physician Fee Schedule published December 5, 2012. If changes to the sustainable growth rate patch and sequestration cuts occur, savings for payers reimburs-ing the epigenetic assay may be greater than reported. n
Author Disclosure StatementDr Aubry is a Consultant to MDxHealth. Dr Lieberthal
receives research/grant support from Abbott Molecular, Genomic Health, and MDxHealth. Dr A. Willis is a Consultant to ConfirmMDx and 21st Century Oncology, and is on the Speaker’s Bureau for Astellas, Clinlogix, GlaxoSmithKline, Eli Lilly, and sanofi aventis. Dr Bagley is a Consultant/Advisor to HillCo HEALTH. Mr Layton is a Consultant to ConfirmMDx. Mr S.M. Willis has noth-ing to disclose.
References1. Loeb S, Carter HB, Berndt SI, et al. Complications after prostate biopsy: data from SEER-Medicare. J Urol. 2011;186:1830-1834. Epub 2011 Sep 23.2. Ekwueme DU, Stroud LA, Chen Y. Cost analysis of screening for, diagnosing, and staging prostate cancer based on a systematic review of published studies. Prev Chronic Dis. 2007;4:A100.3. Van Neste L, Herman JG, Otto G, et al. The epigenetic promise for prostate cancer diagnosis. Prostate. 2012;72:1248-1261.4. Mosquera J-M, Mehra R, Regan MM, et al. Prevalence of TMPRSS2-ERG fusion prostate cancer among men undergoing prostate biopsy in the United States. Clin Cancer Res. 2009;15:4706-4711.5. National Cancer Institute. Surveillance, Epidemiology and End Results. 2012. http://seer.cancer.gov/csr/1975_2009_pops09/results_single/sect_01_table.01.pdf. Accessed November 1, 2012.6. US Preventive Services Task Force. Screening for Prostate Cancer. May 2012. www.uspreventiveservicestaskforce.org/prostatecancerscreening/prostatefinalrs.htm. Accessed September 20, 2012.7. Crawford D, Grubb R, Pinsky P, Black A. Factors influencing initial treatment decisions in PLCO: comparison of screening and control arms. Abstract LBA4. Proceedings of the AUA Annual Meeting, May 21, 2012; Atlanta, GA. 8. Stewart G, Van Neste L, Delvenne P, et al. Clinical utility of a multiplexed epi-
genetic gene assay to detect cancer in histopathologically negative prostate biopsies: results of the multicenter MATLOC study. J Urol. (2012), doi: 10.1016/j.juro.2012. 08.219.9. Kehinde EO, Al-Maghrebi M, Sheikh M, Anim JT. Combined ciprofloxacin and amikacin prophylaxis in the prevention of septicemia after transrectal ultra-sound-guided biopsy of the prostate. J Uro. 2012 September 23. pii: S0022-5347(12) 04945-2. doi: 10.1016/j.juro.2012.08.237. 10. Trock B, Brotzman MJ, Mangold LA, et al. Evaluation of GSTP1 and APC methylation as indicators for repeat biopsy in a high-risk cohort of men with negative initial prostate biopsies. BJU Int. 2012;110:56-62.11. Rabets JC, Jones JS, Patel A, Zippe CD. Prostate cancer detection with office based saturation biopsy in a repeat biopsy population. J Urol. 2004;172:94-97.12. Laurila M, van der Kwast T, Bubendorf L, et al. Detection rates of cancer, high grade PIN and atypical lesions suspicious for cancer in the European Randomized Study of Screening for Prostate Cancer. Eur J Cancer. 2010;46:3068-3072.13. Pinsky PF, Crawford ED, Kramer BS, et al. Repeat prostate biopsy in the prostate, lung, colorectal and ovarian cancer screening trial. BJU Int. 2007;4:775-779.14. Resnick MJ, Lee DJ, Magerfleisch L, et al. Repeat prostate biopsy and the incre-mental risk of clinically insignificant prostate cancer. Urology. 2011;77:548-552.15. National Cancer Institute Trends Progress Report-2009/2010 Updated. www.cancer.gov/newscenter/newsfromnci/2010/ProgressReport2010. Accessed November 1, 2012. 16. Merril J. Prostate cancer market snapshot: more than provenge. The Pink Sheet. November 22, 2010. Elsevier Business Intelligence Publications and Products. www.elsevierbi.com/Publications/The-Pink-Sheet/72/47/Prostate-Cancer-Market-Snapshot-More-Than-Provenge?result=2&total=2&searchquery=%253fq%253dPros tate%252520Cancer%252520Market%252520Snapshot%2526date%253don%25253a11%25252f22%25252f2010. Accessed January 29, 2013.17. Thompson I, Thrasher JB, Aus G, et al. Guideline for the management of clini-cally localized prostate cancer: 2007 update. J Urol. 2007;177:2106-2131.18. Stricker S. The era of personalized medicine in oncology: novel biomarkers usher-ing in new approaches to cancer therapy. Am Health Drug Benefits. 2011;4:387-388.19. Mehrotra J, Varde S, Wang H, et al. A quantitative, spatial resolution of the epigenetic field effect in prostate cancer. Prostate. 2008;68:152-160.20. Trujillo KA, Jones AC, Griffith JK, Bisoffi M. Markers of field cancerization: proposed clinical applications in prostate biopsies. Prostate Cancer. 2012;2012:302894.21. Centers for Medicare & Medicaid Services. Medicare Physician Fee Schedule 2013. www.cms.gov/Medicare/Medicare-Fee-for-Service-Payment/Physician FeeSched/index.html?redirect=/physicianfeesched/. Accessed December 5, 2012. 22. Centers for Medicare & Medicaid Services. Medicare Inpatient Prospective Payment System 2012. www.cms.gov/Medicare/Medicare-Fee-for-Service-Payment/AcuteInpatientPPS/index.html. Accessed December 5, 2012.23. US Census Bureau. Age and sex composition: 2010. 2010 census briefs. www.census.gov/prod/cen2010/briefs/c2010br-03.pdf. Accessed November 1, 2012.24. Drazer MW, Huo D, Schonberg MA, et al. Population-based patterns and pre-dictors of prostate-specific antigen screening among older men in the United States. J Clin Oncol. 2011;29:1736-1743. Epub 2011 Mar 28.25. Nichol MB, Wu J, An JJ, et al. Budget impact analysis of a new prostate cancer risk index for prostate cancer detection. Prostate Cancer Prostatic Dis. 2011;14:253-261.
Molecular Epigenetic Tests Can Improve Clinical Outcomes While Reducing Healthcare Costs By Kelly huang, PhDPresident, HealthTronics, Inc, Austin, TX
HeALtH PLAns: Health insurance plans and other payers recognize the potential for molecular diag-nostics to facilitate the approach known as personalized medicine, which utilizes molecular testing to identify patients who will benefit from a specific approach to management or a specific targeted therapy. Personalized medicine can lead to reduced healthcare costs over the life of the patient. However, payers are struggling to keep up with the rapidly expanding range of molecular tests.
Because of the ambiguous nature of “laboratory-devel-
oped tests,” many health insurers are deeming many new tests as experimental or investigational and are therefore refusing to cover them. When determining coverage of molecular diagnostic tests, payers expect evidence not only for clinical utility but also for cost-effectiveness.1 It follows that cost-effectiveness should also lead to a reim-bursement structure that is based on the value of that test or service rather than merely on stacking codes of the methodology steps.
In this current article by Aubry and colleagues, the
STAkEHolDER PERSPECTIvE
Continued

BUSINESS
24 l American Health & Drug Benefits l www.AHDBonline.com January/February 2013 l Vol 6, No 1
authors propose a well-articulated hypothetical model to assess the value of an epigenetic test’s (ConfirmMDx) ability to confirm the negative results of a prostate biopsy. According to this model, using this test leads to a mean-ingful $588 savings per patient managed, by avoiding unnecessary repeated prostate biopsies.
As with any hypothetical model, there are limitations to the analysis with regard to real-world facts. Nev-ertheless, the authors clearly outline their assumptions and the rationale behind their calculations, so that read-ers can consider the conclusions, assess the sensitivity of the assumptions, and arrive at their own perspective.
Beyond the economic benefits of this test, payers should also consider the improvement in quality of life for patients who avoid the need for repeated biopsies.
PAtients/PRoViDeRs: Patients and providers will experience the benefits of many new and soon-to- become-available advances in the detection and treat-ment of prostate cancer. Along with new drug therapies and surgical advances, such as minimally invasive abla-
tive procedures, molecular epigenetic tests show promise in determining the aggressive nature of a tumor, or in the case of ConfirmMDx, provide true confirmation of nega-tive biopsy results.
Although these epigenetic tests are relatively new, they already provide further input, along with the details of the biopsy results, prostate-specific antigen history, family history, digital rectal examination, age, and so on, to help the physician’s and the patient’s determination of a specific treatment regimen. Over time, as more experi-ence is gained and the tests are improved for specificity and sensitivity, molecular epigenetic tests can be expect-ed to provide significant improvements in extended sur-vival and enhanced quality of life for patients. n
1. Trogan G. What do payers want in oncology diagnostics? Insights from a national survey of top commercial and Medicare health plans. Am Health Drug Benefits. 2011; 4 (4 Special Issue):34.
Disclosure: HealthTronics offers Laboratory Solutions, including ConfirmMDx and other epigenetic testing for prostate cancer.
STAkEHolDER PERSPECTIvE Continued
information for AuthorsManuscripts submitted to American Health & Drug Benefits (AHDB) must be original and must not have been pub-lished previously, either in print or in electronic form. Manuscripts cannot be submitted elsewhere while under consideration by AHDB, and must adhere to the format described in the full Guidelines for Authors available at www.AHDBonline.com. All manuscripts undergo peer review, and acceptance is based on that review. If accepted, authors will be notified of any recommended revisions.
Routine editorial changes are made to conform to house style, following the AMA Manual of Style, 10th ed. (New York, NY: Oxford University Press, 2007). Time from submission to publication is generally 3 to 5 months.
CoPyRiGHt/DisCLosUReAuthors must sign a Copyright Transfer Form, assigning all copyrights to Engage Healthcare Communications, LLC, publisher of AHDB, as well as a Financial Disclosure Form, disclosing any financial interests or potential conflict of interest involving the materials discussed in the manuscript.
MAnUsCRiPt FoRMAt• Title page: provide a proper title for the article; list names, degrees, titles, and affiliations for all authors, as well as
contact information for the corresponding author • Abstract: 200-300 words • Tables and figures: cite these in the text, but place graphic elements after the references; type all tables in a Word format • References: 35-45 current, post-1990 references, cited in the text but listed at the end of the manuscript; avoid au-
tomatic numbering, footnotes, endnotes• Length of article: 3000-4000 words, plus tables and figures • Provide all Figures as PDF, jpg, or PowerPoint files, saved at 300 dpi
PeRMissions Authors must secure a written permission from the original publisher for any previously published (online or in print) Table or Figure. Provide the source with each element.
submit the manuscript electronically to: [email protected]. For assistance call 732-992-1892.
25 www.AHDBonline.com l American Health & Drug Benefits lVol 6, No 1 l January/February 2013
Industry trends
On December 12, 2012, Secretary of Health and Human Services (HHS) Kathleen Sebelius mused in her blog on the progress made by
health plans toward the establishment of the health in-surance exchanges, which will open the world of health insurance to many currently uninsured, as well as insured, Americans. States can choose to establish their own ex-change, enter into a state-federal partnership, or default to an exchange that will be set up and run by the federal government, under the auspices of the HHS Secretary.
The Progress“Ten months from today, Americans in every state
can begin to choose health insurance in new state mar-ketplaces where they will have access to affordable care. Many will have never had health insurance, or had been forced to make the decision to go without insurance after losing a job or becoming sick,”1 HHS Secretary Sebelius wrote in December. “Today, we’re announcing that six states who applied early have made enough progress setting up their own marketplaces or Exchanges that we are ready to conditionally approve their plans—meaning they are on track to meet all Exchanges deadlines. These…states include: Colorado, Connecticut, Mas-sachusetts, Maryland, Oregon, and Washington.”1
That was 2 months ago. Now, early in February 2013, a total of 18 states (including the District of Columbia) have received conditional approval to establish a state exchange, and 7 are planning state-federal partnership exchanges; the balance of 26 states will default to the federal exchange, unless they manage to submit a plan by the imminent deadline.2
The deadline to submit a plan for a state or a state-federal partnership exchange is February 15, 2013, with open enrollment starting on October 1, 2013, and coverage beginning on January 1, 2014.
The 12 states that have joined the original 6 states in planning to establish a state exchange are California, Connecticut, Hawaii, Idaho, Kentucky, Minnesota, New Mexico, New York, Rhode Island, Utah, Vermont, and Washington, DC.2
Why Establish an Exchange?Why establish a health insurance exchange? Despite
the considerable efforts and logistics involved in fulfill-ing the demands required to establish an exchange, it is generally accepted that health plans are poised to benefit financially from participation in the exchanges, with approximately 29 million to 30 million uninsured Americans anticipated to buy health insurance through these exchanges, to the tune of $205 billion by 2021, according to one analysis.3
Last year, WellPoint, one of the largest health plans in the country, reportedly allotted at least $50 million to enhance its “brand” in preparation for the exchanges, and it is expected to spend as much this year.4 The ex-planation for such spending by one of the best-recog-nized health insurance companies, according to WellPoint, is that the company “expects the future pur-chase of health insurance to function more like online retailing than even before, where brand name, along with price and convenience, win the day.”4
WellPoint’s Chief Financial Officer Wayne DeVeydt explained it this way last year, “As you think about 2014, you’re going to have to market in a more retail environment, something that this industry hasn’t had to do historically, and branding is going to become more relevant.”4
If WellPoint’s predictions materialize, the exchanges may inherently change the face of health insurance into something new. Only time will tell. However, even
As Deadline Nears, Health Insurance Exchanges Making Progress, with Some SetbacksBy Dalia Buffery, MA, ABDEditorial Director, American Health & Drug Benefits
WellPoint’s Chief Financial Officer Wayne DeVeydt explained it this way last year, “As you think about 2014, you’re going to have to market in a more retail environment, something that this industry hasn’t had to do historically, and branding is going to become more relevant.”
26 l American Health & Drug Benefits l www.AHDBonline.com January/February 2013 l Vol 6, No 1
Industry trends
with the potential for considerable financial gains for health plans and gain of access for patients, the logistics of establishing the exchanges on such a large scale pres-ent challenges for all stakeholders.
The Setbacks There is no doubt that such a large undertaking is
more complex than might have first appeared even to those who wrote the law. On January 24, 2013, federal regulators have announced the delay of one of the Affordable Care Act (ACA)’s requirements—that em-ployers notify their employees by March 1, 2013, about the availability of health insurance exchanges that are to be open to people insured in their state. The expectation now is that employees will be given notifications by their employers sometime during the summer, just in time for the October 1 open enrollment date.5 The reason cited for the delay was the need to give employers more time to appropriately coordinate with the exchanges.
Nevertheless, the HHS and other federal regulators are confident that the deadlines will be met. “We are committed to a smooth implementation process, includ-ing providing employers with sufficient time to comply and selecting an applicability date that ensures that employees receive the information at a meaningful time,” they said.5
On February 8, 2013, Mississippi became the first state to have its health exchange plan rejected by the HHS, citing Governor Phil Bryant’s opposition to the health insurance exchange plan as the reason for this development. “With a lack of support from your gover-nor and no formal commitment to coordinate from
other state agencies, we do not see a feasible pathway to conditionally approving a state-based exchange in Mississippi for 2014,” the HHS wrote in a letter to the state of Mississippi.6
Politics may indeed be the reason for this develop-ment. “Mississippi Insurance Commissioner Mike Chaney, a Republican, had waged a bitter battle with [Governor Phil] Bryant and other fellow party leaders in his state over implementing a state-run health insurance exchange,”6 which is being seen as an issue that pro-motes the Democratic Party and the president’s health-care reform platform. Governor Bryant opposes the idea of a state-based health insurance exchange, which he sees as an act of embracing the ACA, believing that it “will shackle the state with debt related to inflated Medicaid rolls.”6
The HHS Secretary said that she considered Mississippi “an excellent candidate” for a state-federal partnership exchange.6 n
Moving ForwardAs we move closer to the various time points in the
road toward establishing the exchanges, more progress and some setbacks can be expected, but for now at least, the majority of the states are moving forward, in one fashion or another, with plans in place to address the ACA’s requirement of health insurance exchanges. The potential for billions of dollars in saving for health plans can only mean good things for members and patients.
References 1. Sebelius K. Progress continues in setting up health insurance marketplaces. HealthCare.gov. December 12, 2012. www.healthcare.gov/blog/2012/12/market places121012.html. Accessed February 3, 2013.2. Kaiser Family Foundation. States decisions for creating health insurance exchang-es in 2014. February 8, 2013. www.statehealthfacts.org/comparemaptable.jsp?ind=962 &cat=17. Accessed February 8, 2013. 3. PwC Health Research Institute. Health insurance exchange: long on options, short on time. October 2012. http://healthreformgps.org/wp-content/uploads/pwc-health- insurance-exchanges-impact-and-options.pdf. Accessed February 3, 2013.4. Indianapolis Business Journal. WellPoint spends $50M to burnish brand. Septem-ber 17, 2013. www.ibj.com/article/print?articleId=36730. Accessed February 3, 2013.5. Jerry Geisel. Health insurance exchange reporting delayed. BusinessInsurance.com. January 25, 2013. www.businessinsurance.com/article/20130125/NEWS03/130129877?tags=|62|63|307|329|74|278. Accessed February 3, 2013. 6. Le Coz E. US rejects Mississippi health insurance exchange plan. Reuters. February 8, 2013. http://news.yahoo.com/u-rejects-mississippi-health-insurance- exchange-plan-202610533.html. Accessed February 8, 2013.
On February 8, 2013, Mississippi became the first state to have its health exchange plan rejected by the HHS, citing Governor Phil Bryant’s opposition to the health insurance exchange plan as the reason for this development.
27 www.AHDBonline.com l American Health & Drug Benefits lVol 6, No 1 l January/February 2013
American Health & Drug Benefits will be publishing a Special Issue on Cardiometabolic Health in 2013
Readers are invited to submit articles for publication in this special issue on topics relevant to the clinical, business, and policy aspects of cardiometabolic health and wellness. Original research, comparative effectiveness analyses, white papers, evidence-based comprehensive reviews, and case studies are of particular interest. All articles will undergo the journal’s rigorous peer-review process and acceptance is contingent on that review.
Call for PapersCardiometabolic Health Special Issue
Topics of high interest include:
• Benefit designs to improve cardiometabolic patient outcomes
• Best practices in insulin control, lipid management, or blood pressure control
• Comparative effectiveness analyses of best therapies for cardiovascular health
• Cost-effectiveness comparisons of current therapies for diabetes
• Current recommendations for optimizing A1C target outcomes
• Diabetes management and prevention
• Employers’ strategies to enhance employees’ cardiometabolic wellness
• Emerging therapies for diabetes, heart disease, and/or obesity
• Health plan initiatives for cardiometabolic health and prevention
• Hot topics in diabetes management
• Insulin resistance and type 2 diabetes
• Lifestyle strategies and cardiometabolic health and wellness
• Lipid management in patients with diabetes
• Medication adherence
• New biomarkers for assessing cardiometabolic risk
• New therapies for diabetes, cardiovascular disease, or obesity
• Optimal therapies for cardiovascular disease, diabetes, and/or obesity
• Pharmacoeconomic analyses
• Prevention strategies for diabetes risk reduction
• Wellness programs for patients with heart disease, diabetes, or obesity
Articles must follow the Manuscript Instructions for Authors at www.AHDBonline.com.
Submit articles to [email protected]. For more information, call 732-992-1889.
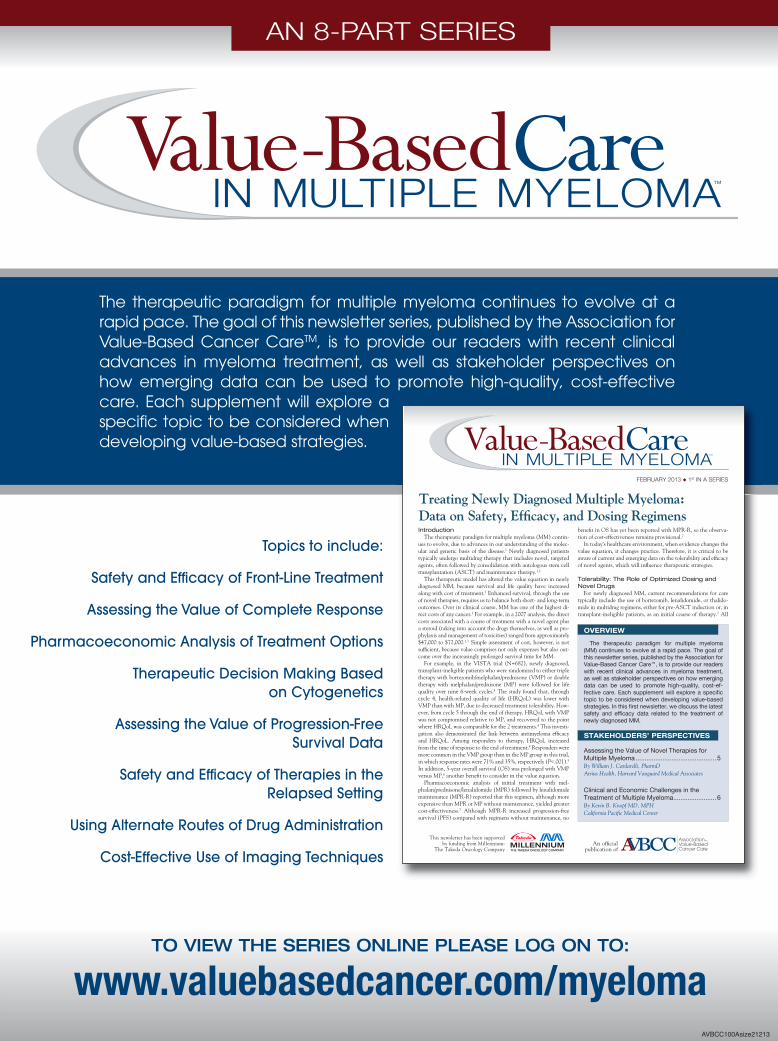
The therapeutic paradigm for multiple myeloma continues to evolve at a rapid pace. The goal of this newsletter series, published by the Association for Value-Based Cancer CareTM, is to provide our readers with recent clinicaladvances in myeloma treatment, as well as stakeholder perspectives onhow emerging data can be used to promote high-quality, cost-effectivecare. Each supplement will explore aspecific topic to be considered whendeveloping value-based strategies.
Value-BasedCareIN MULTIPLE MYELOMA™
Value-BasedCareIN MULTIPLE MYELOMA�
An official publication of
FEBRUARY 2013 1st IN A SERIES
This newsletter has been supported by funding from Millennium:
The Takeda Oncology Company
Treating Newly Diagnosed Multiple Myeloma: Data on Safety, Efficacy, and Dosing RegimensIntroduction
The therapeutic paradigm for multiple myeloma (MM) contin-ues to evolve, due to advances in our understanding of the molec-ular and genetic basis of the disease.1 Newly diagnosed patients typically undergo multidrug therapy that includes novel, targeted agents, often followed by consolidation with autologous stem cell transplantation (ASCT) and maintenance therapy.1,2
This therapeutic model has altered the value equation in newly diagnosed MM, because survival and life quality have increased along with cost of treatment.1 Enhanced survival, through the use of novel therapies, requires us to balance both short- and long-term outcomes. Over its clinical course, MM has one of the highest di-rect costs of any cancer.1 For example, in a 2007 analysis, the direct costs associated with a course of treatment with a novel agent plus a steroid (taking into account the drugs themselves, as well as pro-phylaxis and management of toxicities) ranged from approximately $47,000 to $72,000.1,3 Simple assessment of cost, however, is not sufficient, because value comprises not only expenses but also out-come over the increasingly prolonged survival time for MM.
For example, in the VISTA trial (N=682), newly diagnosed, transplant-ineligible patients who were randomized to either triple therapy with bortezomib/melphalan/prednisone (VMP) or double therapy with melphalan/prednisone (MP) were followed for life quality over nine 6-week cycles.4 The study found that, through cycle 4, health-related quality of life (HRQoL) was lower with VMP than with MP, due to decreased treatment tolerability. How-ever, from cycle 5 through the end of therapy, HRQoL with VMP was not compromised relative to MP, and recovered to the point where HRQoL was comparable for the 2 treatments.4 This investi-gation also demonstrated the link between antimyeloma efficacy and HRQoL. Among responders to therapy, HRQoL increased from the time of response to the end of treatment.4 Re sponders were more common in the VMP group than in the MP group in this trial, in which response rates were 71% and 35%, respectively (P<.001).5 In addition, 5-year overall survival (OS) was prolonged with VMP versus MP,6 another benefit to consider in the value equation.
Pharmacoeconomic analysis of initial treatment with mel-phalan/prednisone/lenalidomide (MPR) followed by lenalidomide maintenance (MPR-R) reported that this regimen, although more expensive than MPR or MP without maintenance, yielded greater cost-effectiveness.7 Although MPR-R increased progression-free survival (PFS) compared with regimens without maintenance, no
benefit in OS has yet been reported with MPR-R, so the observa-tion of cost-effectiveness remains provisional.7
In today’s healthcare environment, when evidence changes the value equation, it changes practice. Therefore, it is critical to be aware of current and emerging data on the tolerability and efficacy of novel agents, which will influence therapeutic strategies.
Tolerability: The Role of Optimized Dosing and Novel Drugs
For newly diagnosed MM, current recommendations for care typically include the use of bortezomib, lenalidomide, or thalido-mide in multidrug regimens, either for pre-ASCT induction or, in transplant-ineligible patients, as an initial course of therapy.2 All
OVERVIEW
STAKEHOLDERS’ PERSPECTIVES
The therapeutic paradigm for multiple myeloma (MM) continues to evolve at a rapid pace. The goal of this newsletter series, published by the Association for Value-Based Cancer Care , is to provide our readers with recent clinical advances in myeloma treatment, as well as stakeholder perspectives on how emerging data can be used to promote high-quality, cost-ef-
topic to be considered when developing value-based
newly diagnosed MM.
Assessing the Value of Novel Therapies for Multiple Myeloma ............................................. 5By William J. Cardarelli, PharmDAtrius Health, Harvard Vanguard Medical Associates
Clinical and Economic Challenges in the Treatment of Multiple Myeloma ........................ 6By Kevin B. Knopf MD, MPHCalifornia Pacific Medical Center
www.valuebasedcancer.com/myelomaTO VIEW THE SERIES ONLINE PLEASE LOG ON TO:
Topics to include:
Safety and Efficacy of Front-Line Treatment
Assessing the Value of Complete Response
Pharmacoeconomic Analysis of Treatment Options
Therapeutic Decision Making Based on Cytogenetics
Assessing the Value of Progression-Free Survival Data
Safety and Efficacy of Therapies in the Relapsed Setting
Using Alternate Routes of Drug Administration
Cost-Effective Use of Imaging Techniques
AN 8-PART SERIES
AVBCC100Asize21213
AVBCC100_Asize21213_VBCM 2/12/13 11:30 AM Page 1
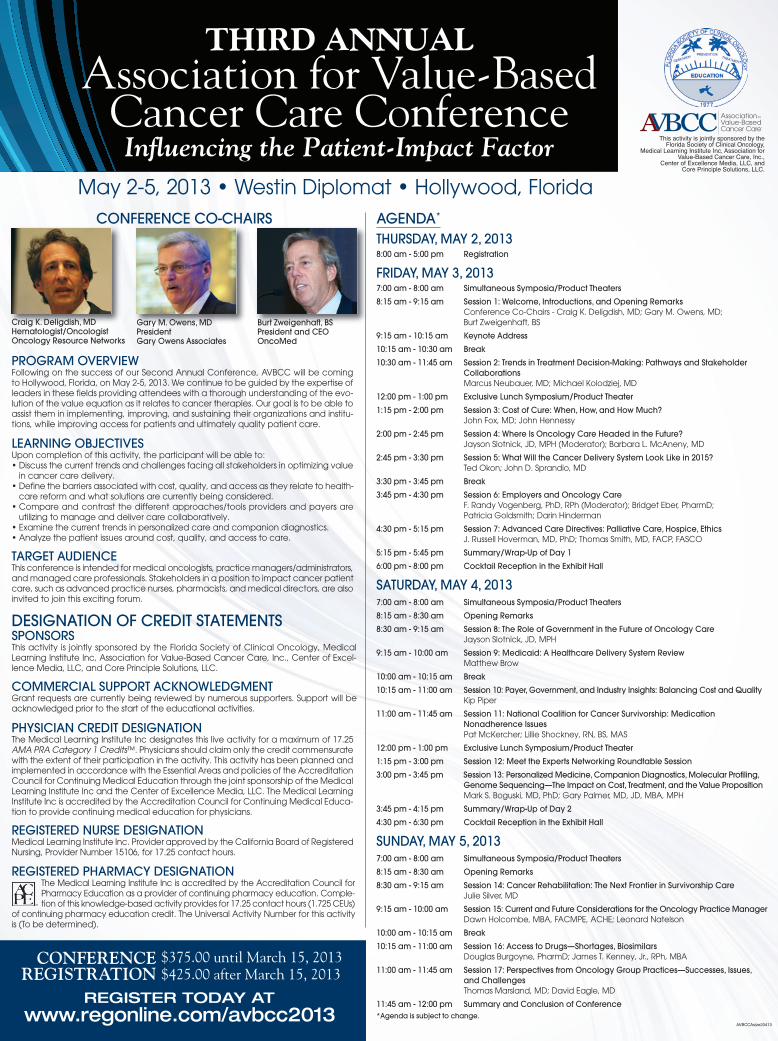
AVBCCAsize20413
CONFERENCE CO-CHAIRS
May 2-5, 2013 • Westin Diplomat • Hollywood, Florida
Craig K. Deligdish, MDHematologist/OncologistOncology Resource Networks
Gary M. Owens, MDPresidentGary Owens Associates
Burt Zweigenhaft, BSPresident and CEOOncoMed
THURSDAY, MAY 2, 20138:00 am - 5:00 pm Registration
FRIDAY, MAY 3, 20137:00 am - 8:00 am Simultaneous Symposia/Product Theaters
8:15 am - 9:15 am Session 1: Welcome, Introductions, and Opening RemarksConference Co-Chairs - Craig K. Deligdish, MD; Gary M. Owens, MD; Burt Zweigenhaft, BS
9:15 am - 10:15 am Keynote Address
10:15 am - 10:30 am Break
10:30 am - 11:45 am Session 2: Trends in Treatment Decision-Making: Pathways and Stakeholder CollaborationsMarcus Neubauer, MD; Michael Kolodziej, MD
12:00 pm - 1:00 pm Exclusive Lunch Symposium/Product Theater
1:15 pm - 2:00 pm Session 3: Cost of Cure: When, How, and How Much?John Fox, MD; John Hennessy
2:00 pm - 2:45 pm Session 4: Where Is Oncology Care Headed in the Future?Jayson Slotnick, JD, MPH (Moderator); Barbara L. McAneny, MD
2:45 pm - 3:30 pm Session 5: What Will the Cancer Delivery System Look Like in 2015?Ted Okon; John D. Sprandio, MD
3:30 pm - 3:45 pm Break
3:45 pm - 4:30 pm Session 6: Employers and Oncology CareF. Randy Vogenberg, PhD, RPh (Moderator); Bridget Eber, PharmD; Patricia Goldsmith; Darin Hinderman
4:30 pm - 5:15 pm Session 7: Advanced Care Directives: Palliative Care, Hospice, Ethics J. Russell Hoverman, MD, PhD; Thomas Smith, MD, FACP, FASCO
5:15 pm - 5:45 pm Summary/Wrap-Up of Day 1
6:00 pm - 8:00 pm Cocktail Reception in the Exhibit Hall
SATURDAY, MAY 4, 20137:00 am - 8:00 am Simultaneous Symposia/Product Theaters
8:15 am - 8:30 am Opening Remarks
8:30 am - 9:15 am Session 8: The Role of Government in the Future of Oncology CareJayson Slotnick, JD, MPH
9:15 am - 10:00 am Session 9: Medicaid: A Healthcare Delivery System ReviewMatthew Brow
10:00 am - 10:15 am Break
10:15 am - 11:00 am Session 10: Payer, Government, and Industry Insights: Balancing Cost and QualityKip Piper
11:00 am - 11:45 am Session 11: National Coalition for Cancer Survivorship: Medication Nonadherence IssuesPat McKercher; Lillie Shockney, RN, BS, MAS
12:00 pm - 1:00 pm Exclusive Lunch Symposium/Product Theater
1:15 pm - 3:00 pm Session 12: Meet the Experts Networking Roundtable Session
3:00 pm - 3:45 pm Session 13: Personalized Medicine, Companion Diagnostics, Molecular Profiling,Genome Sequencing—The Impact on Cost, Treatment, and the Value PropositionMark S. Boguski, MD, PhD; Gary Palmer, MD, JD, MBA, MPH
3:45 pm - 4:15 pm Summary/Wrap-Up of Day 2
4:30 pm - 6:30 pm Cocktail Reception in the Exhibit Hall
SUNDAY, MAY 5, 20137:00 am - 8:00 am Simultaneous Symposia/Product Theaters
8:15 am - 8:30 am Opening Remarks
8:30 am - 9:15 am Session 14: Cancer Rehabilitation: The Next Frontier in Survivorship CareJulie Silver, MD
9:15 am - 10:00 am Session 15: Current and Future Considerations for the Oncology Practice ManagerDawn Holcombe, MBA, FACMPE, ACHE; Leonard Natelson
10:00 am - 10:15 am Break
10:15 am - 11:00 am Session 16: Access to Drugs—Shortages, BiosimilarsDouglas Burgoyne, PharmD; James T. Kenney, Jr., RPh, MBA
11:00 am - 11:45 am Session 17: Perspectives from Oncology Group Practices—Successes, Issues, and ChallengesThomas Marsland, MD; David Eagle, MD
11:45 am - 12:00 pm Summary and Conclusion of Conference*Agenda is subject to change.
PROGRAM OVERVIEWFollowing on the success of our Second Annual Conference, AVBCC will be comingto Hollywood, Florida, on May 2-5, 2013. We continue to be guided by the expertise ofleaders in these fields providing at tendees with a thorough understanding of the evo-lution of the value equation as it relates to cancer therapies. Our goal is to be able toassist them in implementing, improving, and sustaining their organizations and institu-tions, while improving access for patients and ultimately quality patient care.
TARGET AUDIENCEThis conference is intended for medical oncologists, practice managers/administrators,and managed care professionals. Stakeholders in a position to impact cancer patientcare, such as advanced practice nurses, pharmacists, and medical directors, are alsoinvited to join this exciting forum.
SPONSORSThis activity is jointly sponsored by the Florida Society of Clinical Oncology, MedicalLearning Institute Inc, Association for Value-Based Cancer Care, Inc., Center of Excel-lence Media, LLC, and Core Principle Solutions, LLC.
COMMERCIAL SUPPORT ACKNOWLEDGMENTGrant requests are currently being reviewed by numerous supporters. Support will beacknowledged prior to the start of the educational activities.
REGISTERED NURSE DESIGNATIONMedical Learning Institute Inc. Provider approved by the California Board of Registered Nursing, Provider Number 15106, for 17.25 contact hours.
REGISTERED PHARMACY DESIGNATIONThe Medical Learning Institute Inc is accredited by the Accreditation Council for Pharmacy Education as a provider of continuing pharmacy education. Comple-tion of this knowledge-based activity provides for 17.25 contact hours (1.725 CEUs)
of continuing pharmacy education credit. The Universal Activity Number for this activityis (To be determined).
PHYSICIAN CREDIT DESIGNATIONThe Medical Learning Institute Inc designates this live activity for a maximum of 17.25AMA PRA Category 1 Credits™. Physicians should claim only the credit commensuratewith the extent of their participation in the activity. This activity has been planned andimplemented in accordance with the Essential Areas and policies of the AccreditationCouncil for Continuing Medical Education through the joint sponsorship of the MedicalLearning Institute Inc and the Center of Excellence Media, LLC. The Medical LearningInstitute Inc is accredited by the Accreditation Council for Continuing Medical Educa-tion to provide continuing medical education for physicians.
DESIGNATION OF CREDIT STATEMENTS
LEARNING OBJECTIVESUpon completion of this activity, the participant will be able to:• Discuss the current trends and challenges facing all stakeholders in optimizing value
in cancer care delivery.• Define the barriers associated with cost, quality, and access as they relate to health-
care reform and what solutions are currently being considered.• Compare and contrast the different approaches/tools providers and payers are
utilizing to manage and deliver care collaboratively.• Examine the current trends in personalized care and companion diagnostics.• Analyze the patient issues around cost, quality, and access to care.
$375.00 until March 15, 2013$425.00 after March 15, 2013
Influencing the Patient-Impact Factor
THIRD ANNUALAssociation for Value-Based
Cancer Care Conference
www.regonline.com/avbcc2013REGISTER TODAY AT
AGENDA*
This activity is jointly sponsored by the Florida Society of Clinical Oncology,
Medical Learning Institute Inc, Association forValue-Based Cancer Care, Inc.,
Center of Excellence Media, LLC, and Core Principle Solutions, LLC.
CONFERENCE REGISTRATION
AVBCC2013Asize13013_AVBCC 2/4/13 2:10 PM Page 1
business
30 l American Health & Drug Benefits l www.AHDBonline.com January/February 2013 l Vol 6, No 1
business
The large and growing cost of healthcare, which amounted to 17.9% of the gross domestic product in 2011,1 will continue to be a burden for all payers in
the US healthcare system, not only for states that are strug-gling to meet Medicaid costs and the federal government’s requirements, but also for private health plans that serve commercial, Medicare Advantage, and Medicaid beneficia-ries.2,3 Costs will continue to grow as millions more people become newly insured because of the Patient Protection and Affordable Care Act (ACA).
Primary care that is delivered through patient-centered
Review ARticle
The Opportunity for Health Plans to Improve Quality and Reduce Costs by Embracing Primary Care Medical HomesSarah collins, MBA; Kevin B. “Kip” Piper, MA, FAcHe; Gary Owens, MD
Background: The large and growing costs of healthcare will continue to burden all payers in the nation’s healthcare system—not only the states that are struggling to meet Medicaid costs and the federal government, but also the private health plans that serve commercial, Medicare Advantage, and Medicaid beneficiaries. Cost will increasingly become a concern as millions more people become newly insured as a result of the Patient Protection and Affordable Care Act (ACA). Primary care delivery through patient-centered medical homes (PCMHs) and other coordinated-care models have improved care and reduced costs. Health plans have a strategic opportunity to promote better care at a lower cost by embracing med-ical homes and encouraging their growth. Health plans can play an important role in trans-forming the US healthcare system, as well as better position themselves for long-term corpo-rate success.Objectives: To discuss several examples of organizations that serve a variety of beneficiaries and have been successful in promoting medical homes and coordinated primary care, and to suggest steps that health plans can take to improve the quality of care and reduce costs.Discussion: The models discussed in this article take a number of different approaches to create incentives for high-quality, cost-effective, coordinated primary care. Several health plans and groups use enhanced fee-for-service or per-member per-month payment models for primary care physician (PCP) practices that reach a specified level of medical home or electronic health record certification. Most of the examples addressed in this article also in-clude an additional payment to encourage care management and coordination. The results showed a significant decline in costs and in the use of expensive medical services. One Medicaid coordinated-care program we reviewed saved almost $1 billion in reduced spend-ing over 4 years, and achieves savings of approximately 15% within 6 months of the benefi-ciaries’ enrollment into their program. Another PCMH payer program led to an approximate 28% reduction in acute care hospital admissions among Medicare beneficiaries and an ap-proximate 38% reduction in admissions among commercial beneficiaries.Conclusion: Based on the review of real-world examples, we recommend 6 steps that health plans can use to take advantage of the opportunity to embrace medical homes as a means to improve healthcare quality and to reduce costs. These recommendations include getting feedback from PCPs to improve plan provider networks, creating value-based prima-ry care reimbursement systems, encouraging biannual visits with high-risk patients, funding case managers for high-risk patients, considering Medicaid coordinated-care models, and promoting ACA policies that support primary care.
Am Health Drug Benefits. 2013;6(1):30-38www.AHDBonline.com
Disclosures are at end of text
Stakeholder Perspective, page 38
Ms Collins is President, America’s Health, Oak Hill, VA; Mr Piper is President, Health Results Group, Washington, DC; and Dr Owens is President, Gary Owens and Associates, Glen Mills, PA.
Primary Care Medical Homes
31 www.AHDBonline.com l American Health & Drug Benefits lVol 6, No 1 l January/February 2013
medical homes (PCMHs) and other coordinated- care models has served as a means to improve care and to re-duce costs.4,5 Health plans, therefore, have a strategic op-portunity to promote better care at a lower cost by embrac-ing medical homes and encouraging their growth. Using this strategy would enable health plans to play an impor-tant role in transforming the US healthcare system, and to be better positioned for long-term corporate success.
Large business groups already have taken note of the potential for primary care and medical homes to reduce their healthcare costs. The National Business Group on Health (NBGH), which has more than 300 large corpo-rate members that provide health insurance for 50 mil-lion Americans, has made primary care, and more re-cently the PCMH model, a priority “for years,” said NBGH Vice President Veronica Goff in an April 18, 2012, telephone interview. Several large employers are conducting PCMH pilot programs, including IBM, Boeing, Whirlpool, Dow Chemical, and Perdue Farms. Some state Medicaid programs and private health plans have also launched efforts to establish medical homes.
In this article, we discuss several examples of organi-zations that serve a variety of beneficiaries and that have been successful in promoting medical homes and coordi-nated primary care. We review their results and make recommendations to health plans that are interested in seizing this opportunity.
Defining and Certifying Patient-Centered Medical Homes
The PCMH model has been widely discussed in re-cent years. In 2007, the 4 major associations representing 333,000 primary care physicians (PCPs) issued joint principles of the PCMH model.6 These principles indi-cate that a PCMH should include6: • A personal physician• A team approach• A patient-centric focus• A dedication to quality and safety, including evidence-
based medicine and clinical decision support tools• Coordinated care across settings• Enhanced access for patients, such as through open
scheduling, e-mail, and expanded hours• Appropriate, enhanced payment.
In 2008, the National Committee for Quality Assurance (NCQA) released its first set of standards and guidelines for PCMH recognition, which were revised and reissued in 2011.7 Practices that were recognized under the 2008 NCQA guidelines have 3 years from the date of recognition to update their practices to match the 2011 guidelines.
“As of January 2013, 5198 sites with a total of 24,544 clinicians had received NCQA recognition,” said Peggy
Reineking, NCQA’s Director of Clinical Recognition Programs, in a January 8, 2013, telephone interview. “Practice size varied, but about 50% of those recognized were large sites, likely primary care practices from inte-grated health systems,” she said.
The NCQA’s 2011 guidelines include 6 standards, each with a number of elements, for practices to meet.7
Within these 6 standards, there are several must-pass elements for which a practice must earn at least 50% of the total possible points. These 6 standards are7:1. Enhance access and continuity2. Identify and manage patient populations3. Plan and manage care4. Provide self-care support and community resources5. Track and coordinate care6. Measure and improve performance.
Based on their point totals in those categories, practic-es can earn 3 levels of recognition: level 1 (35-59 points), level 2 (60-84 points), and level 3 (85-100 points).8
To achieve the highest levels of PCMH recognition, practices must have electronic health record (EHR) sys-tems for activities such as patient and population manage-ment. The NCQA aligned its 2011 standards with the “meaningful use” standards from the Office of the National Coordinator for Health Information, which is part of the US Department of Health and Human Services.
Key Points➤ As more Americans become insured under the
ACA, healthcare costs will increase in our already burdened healthcare system.
➤ Primary care medical homes, especially PCMHs, have been shown to improve the quality of care for patients and reduce costs by delivering high-quality, cost-effective, coordinated care.
➤ Typically, health plans and provider groups use enhanced FFS and PMPM payment structures to reimburse primary care practices that reach a specified level of medical home or meaningful use standards.
➤ One Medicaid coordinated care program had almost $1 billion in reduced spending over 4 years.
➤ Another PCMH payer program had an approximate 28% reduction in acute care hospital admissions among Medicare beneficiaries and an approximate 38% reduction in admissions among commercial beneficiaries.
➤ By adopting and paying for PCMHs, health plans can play an important role in transforming the US healthcare system, as well as better position themselves for long-term corporate success.
business
32 l American Health & Drug Benefits l www.AHDBonline.com January/February 2013 l Vol 6, No 1
Practices with clinicians demonstrating meaningful use standards will also receive credit from the NCQA. Approximately 21,300 family practice and internal medi-cine specialists demonstrated meaningful use standards as of April 2012, receiving on average approximately $17,000 per practice from the Centers for Medicare & Medicaid Services (CMS) EHR incentives program.9 In addition, more than 13,800 nurse practitioners have enrolled in the CMS incentives program as of April 2012.9
Challenges to Promoting Medical Homes and Primary Care
PCMHs and PCP practices in general face a number of barriers to growth. Yet, the medical home model will likely become an increasingly important way to curb healthcare costs as millions more people across the coun-try become newly insured as a result of the ACA.
Primary Care ReimbursementThe first hurdle is that reimbursement for primary
care tends to follow the fee-for-service (FFS) model, and often at lower rates than used for specialist care. For ex-ample, in a personal interview on May 8, 2012, Sunanda Sindhwani, MD, of Internal Medicine Associates, Reston, VA, said that at her practice, which treats ap-proximately 10,000 patients in Fairfax County, VA (and has one of the highest county median incomes in the nation10), the practice’s reimbursement level has changed by only a small amount in the past 5 years. Practice re-imbursement is still almost exclusively based on FFS, with commercial plans paying a slightly higher amount than Medicare.
Notably, as a sign of the recognition of primary care reimbursement as a problem, the ACA required state Medicaid programs to reimburse PCPs at no less than 100% of Medicare’s reimbursement rate in 2013 and 2014.11 The ACA also provides a 10% Medicare incen-tive payment for primary care services.12
PCMH Certification and Health Information Technology
The NCQA certification for PCMHs has tremendous value as a uniform, nationally recognized set of standards. Achieving NCQA’s certification, however, is often chal-lenging for PCP practices, which must invest significant amounts of resources and uncompensated staff time to
complete the process. Randall Curnow, Jr., MD, MBA, Executive Vice President and Chief Medical Officer of Summit Medical Group in Knoxville, TN, commented in an April 26, 2012, interview that achieving even the 2008 NCQA standards, which are considerably less chal-lenging than the 2011 standards, required as many as 100 hours in addition to the day-to-day patient care.
The technologic requirements for PCMH certification also can be daunting. In a May 1, 2012, telephone inter-view, Joel C. White, Executive Director of the Health IT Now Coalition, commented that “Stage 1 represents a fairly low bar.” The stage 1 meaningful use measures focus on basic electronic tools, such as e-prescribing, computer-ized physician order entry, clinical decision support, and recording basic demographic information.
Stage 2 standards, however, are more challenging and require information sharing to allow for care coordina-tion using point-to-point messaging. “Lack of interoper-ability, for example, between a [PCP] practice and hospi-tals or with specialists’ practices is a significant problem, although it is not a technology or standards issue,” Mr White indicated.
Dr Sindhwani reinforced the value of interoperability, particularly as a way to avoid redundancy in services, such as duplicate magnetic resonance imaging or labora-tory tests. With the majority of PCP practices being rel-atively small, and particularly for practices in rural health provider shortage areas, the challenges of moving to an accredited meaningful use EHR system may well be significant, and may “disrupt workflow,” he noted.
Effects of the ACAThe ACA’s policies are expected to increase the im-
portance of and the demand for primary care services, particularly for people who are newly enrolled in Medi-caid. The Supreme Court’s decision in NFIB v Sebelius gave states a choice of whether to expand Medicaid eli-gibility up to 138% of the federal poverty level starting in 2014.13
The estimates vary widely for how many new people Medicaid programs will enroll. The Congressional Budget Office’s latest projection, after the Supreme Court’s decision, estimates that 11 million people will become newly insured through Medicaid by 2022, 6 mil-lion fewer than it had projected before the Supreme Court’s decision.14 However, of those 6 million, 50% are expected to get coverage through state health insurance exchanges and the other 50% are expected to be unin-sured.14 The Kaiser Commission on Medicaid and the Uninsured estimates that 21.3 million people would be-come newly enrolled in Medicaid if all states choose to expand the program.15
The combination of people who become newly in-
The ACA’s policies are expected to increase the importance of and the demand for primary care services, particularly for people who are newly enrolled in Medicaid.
Primary Care Medical Homes
33 www.AHDBonline.com l American Health & Drug Benefits lVol 6, No 1 l January/February 2013
sured, as well as general population growth and aging de-mographics, will create an additional demand for primary care services. One recent study projected that those factors would increase the number of annual primary care visits from 462 million in 2008 to 565 million in 2025.16
Successful Models to Promote Medical Homes, Improve Quality, and Reduce Costs
Health plans have an opportunity to address each of the challenges described above. This section discusses several proved methods that health plans could use to support medical homes, drawn from health plans and other organizations that serve a variety of beneficiaries.
At first, paying more for primary care seems at odds with the goal of reducing overall healthcare costs. However, the right kinds of PCP incentives and models have proved to reduce the use of expensive medical ser-vices and cut costs. We review those models and then discuss their results. We divided the incentive methods into 2 broad categories—enhanced payments for high-quality primary care and care coordination.
Examples of Enhanced Payments for High-Quality Primary Care
The payment incentives we examined involved a few basic models:• Enhanced FFS payments based on NCQA and mean-
ingful use certifications• Supplementary payments, frequently on a per-member
per-month (PMPM) basis• Value-based payment methods, or pay-for-perfor-
mance (P4P) payments• Gain-sharing payments (which are less frequently used).
A 2010 study of PCMH pilot projects showed that medical homes used a variety of payment models, often mixing multiple kinds of payments.17 For example, typi-cal FFS and PMPM payments were ubiquitous, with 96% of the programs in the study using each of them. Of these programs, 58% had PMPM payments that were adjusted based on the NCQA accreditation level at-tained and 23% had payments adjusted for risk. The mean annual additional PMPM payment was $22,834 per physician. (This amount represents the mean high and low. The full range of PMPM payments was be-tween $720 and $91,146.17) Such results mirror the mixture of incentive payment methods in the examples we discuss for this article.
Geisinger Health System. Geisinger Health Plan’s medical home model—ProvenHealth Navigator—is “an intensive multidimensional medical home model that addresses care delivery and financing.”18 Janet Tomcavage, RN, MSN, Geisinger’s Health System Chief Clinical Transformation Officer, said in a May 2, 2012, telephone
interview that the program follows a “value-based reim-bursement model,” which includes FFS and perfor-mance-based PMPM payments. Practices can earn up to 3 P4P stars, which are based on quality indicators, such as Healthcare Effectiveness Data and Information Set (HEDIS) measures, emergency department utilization, and medication adherence. The performance-based pay-ments can reach $6 PMPM. Ms Tomcavage illustrated that a 3-star practice with 1000 Geisinger Health Plan members could earn an additional P4P payment of $6000 monthly, or $72,000 annually.
In the same interview, Ms Tomcavage said that Geisinger’s model also includes “quality gated results shar-ing.” Practices receive a portion of the estimated cost-sav-ings if, compared with the previous 2 years, they meet targets for efficiency and medical expenses. Practices must also show improvement in quality measures, such as better patient outcomes in diabetes and cardiovascular disease, and enhanced patient satisfaction.
BCBS of North Carolina. Blue Cross Blue Shield (BCBS) of North Carolina is another health plan that has been successful in promoting medical homes. Through its Blue Quality Physician Program, it provides an approxi-mately 25% enhancement to fee schedule payments for practices serving as medical homes and for practices mak-ing other clinical improvements. During the 3-year pilot project leading up to the Blue Quality program, BCBS of North Carolina paid financial rewards to physicians who achieved NCQA performance measures. A separate BCBS of North Carolina program helps PCPs to develop EHRs and to demonstrate meaningful use standards. Demonstrating meaningful use standards allows PCP prac-tices to receive substantial incentive payments, often ap-proximately $17,000, from CMS.9
Summit Medical Group. An example of a provider group that has embraced the PCMH model and benefit-ed from enhanced quality- and certification-based pay-ments is Summit Medical Group. The group has approx-imately 220 physicians (almost exclusively PCPs) with level 3 NCQA certification, and is recognized as a top practice in the NCQA’s certifications for diabetes, heart, and stroke care. Dr Curnow believes that the healthcare industry is moving from an FFS model to a “fee-for-val-
Paying more for primary care seems at odds with the goal of reducing overall healthcare costs. However, the right kinds of PCP incentives and models have proved to reduce the use of expensive medical services and cut costs.

business
34 l American Health & Drug Benefits l www.AHDBonline.com January/February 2013 l Vol 6, No 1
ue” model, with P4P and gain-sharing. Dr Curnow ex-pects that in the next few years a substantial portion of Summit Medical Group’s revenue will be related to its NCQA accreditations, meaningful use criteria, and its gain-sharing payments.
Summit Medical Group recently sought relationships with commercial insurers who were interested in making value-based FFS payments. Those relationships have led to significantly enhanced FFS payments for its commer-cial and Medicare Advantage populations as a result of Summit’s verified quality, size, and market power, Dr Curnow noted. The practice also receives payments based on its NCQA and meaningful use certifications.
In addition, the group is seeking gain-sharing pro-grams with some of its commercial insurers. Gain-sharing typically provides practices with savings based on how actual costs compare with the expected risk-adjusted costs of their beneficiary population. Dr Curnow expects gain-sharing to be adjusted, including potential reduc-tions, based on patient satisfaction and quality scores, such as performance on preventive care, care coordina-tion, and selected HEDIS measures.
Care Coordination and ManagementIn addition to enhanced payments for quality mea-
sures, health plans and other organizations have made additional payments to promote care coordination, which is a fundamental component of PCMHs.
In the Geisinger Health Plan model, Ms Tomcavage noted that “case management is embedded in the practic-es.” Case managers are registered nurses who are Geisinger Health Plan employees and who are physically located in practices with other team members. Geisinger Health System (the parent company of Geisinger Health Plan) also has superb information technology that links health system components, such as practices, hospitals, and labo-ratories. The system provides substantial and valuable data for the case managers, practices, and physicians who use these data for patient and population management.
CCNC. Community Care of North Carolina (CCNC)’s PCMH is one of the best-known examples of how care coordination can improve outcomes and re-duce costs for Medicaid beneficiaries. CCNC consists of 14 locally owned and locally led care networks. As Paul Mahoney, Director of Communications at CCNC, stat-ed in an April 17, 2012, interview and in personal com-munications, the networks allow CCNC to tailor its services to North Carolina’s diverse geography and pop-ulations, and CCNC staff members consider the net-works to be an important part of CCNC’s success. Local ownership and control also help to achieve a high level of buy-in from physicians and their practices.
The state Medicaid program pays primary care prac-tices 95% of Medicare’s reimbursement rates and makes PMPM payments of $2.50 for beneficiaries who are women and children and $5 for beneficiaries who are elderly, blind, and disabled. North Carolina also gives
$30
$25
$20
$15
$10
$5
$0
$450
$400
$350
$300
$250
$200
$150
$100
$50
$0 FY07 FY08 FY09 FY10 FY07 FY08 FY09 FY10
291% 4-year savings growth
$9
$16
$21
$25
$103
$204
$295
$382
Per member per month
$984 million total estimated savings
Total annual savings, $ millions
Figure 1 Community Care of North Carolina Cost-Savings to the North Carolina Medicaid Program
FY indicates fiscal year.Source: Reference 5.
Community Care of North Carolina’s PCMH is one of the best-known examples of how care coordination can improve outcomes and reduce costs for Medicaid beneficiaries.
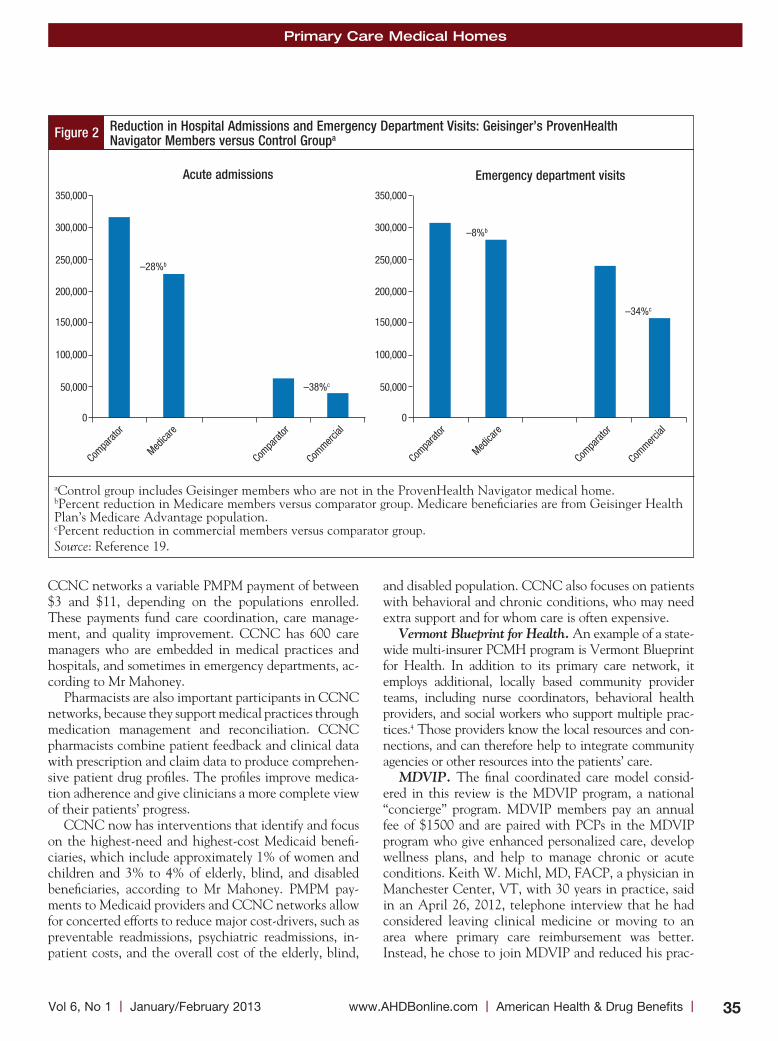
Primary Care Medical Homes
35 www.AHDBonline.com l American Health & Drug Benefits lVol 6, No 1 l January/February 2013
CCNC networks a variable PMPM payment of between $3 and $11, depending on the populations enrolled. These payments fund care coordination, care manage-ment, and quality improvement. CCNC has 600 care managers who are embedded in medical practices and hospitals, and sometimes in emergency departments, ac-cording to Mr Mahoney.
Pharmacists are also important participants in CCNC networks, because they support medical practices through medication management and reconciliation. CCNC pharmacists combine patient feedback and clinical data with prescription and claim data to produce comprehen-sive patient drug profiles. The profiles improve medica-tion adherence and give clinicians a more complete view of their patients’ progress.
CCNC now has interventions that identify and focus on the highest-need and highest-cost Medicaid benefi-ciaries, which include approximately 1% of women and children and 3% to 4% of elderly, blind, and disabled beneficiaries, according to Mr Mahoney. PMPM pay-ments to Medicaid providers and CCNC networks allow for concerted efforts to reduce major cost-drivers, such as preventable readmissions, psychiatric readmissions, in-patient costs, and the overall cost of the elderly, blind,
and disabled population. CCNC also focuses on patients with behavioral and chronic conditions, who may need extra support and for whom care is often expensive.
Vermont Blueprint for Health. An example of a state-wide multi-insurer PCMH program is Vermont Blueprint for Health. In addition to its primary care network, it employs additional, locally based community provider teams, including nurse coordinators, behavioral health providers, and social workers who support multiple prac-tices.4 Those providers know the local resources and con-nections, and can therefore help to integrate community agencies or other resources into the patients’ care.
MDVIP. The final coordinated care model consid-ered in this review is the MDVIP program, a national “concierge” program. MDVIP members pay an annual fee of $1500 and are paired with PCPs in the MDVIP program who give enhanced personalized care, develop wellness plans, and help to manage chronic or acute conditions. Keith W. Michl, MD, FACP, a physician in Manchester Center, VT, with 30 years in practice, said in an April 26, 2012, telephone interview that he had considered leaving clinical medicine or moving to an area where primary care reimbursement was better. Instead, he chose to join MDVIP and reduced his prac-
Figure 2 Reduction in Hospital Admissions and Emergency Department Visits: Geisinger’s ProvenHealth Navigator Members versus Control Groupa
aControl group includes Geisinger members who are not in the ProvenHealth Navigator medical home. bPercent reduction in Medicare members versus comparator group. Medicare beneficiaries are from Geisinger Health Plan’s Medicare Advantage population.cPercent reduction in commercial members versus comparator group.Source: Reference 19.
350,000
300,000
250,000
200,000
150,000
100,000
50,000
0
Compa
rator
–8%b
350,000
300,000
250,000
200,000
150,000
100,000
50,000
0
Medica
re
Commerc
ial
Compa
rator
Compa
rator
Medica
re
Commerc
ial
Compa
rator
–34%c
–38%c
–28%b
Emergency department visitsAcute admissions
business
36 l American Health & Drug Benefits l www.AHDBonline.com January/February 2013 l Vol 6, No 1
tice size from 2000 patients to 500 patients. His patients now include self-employed people, some of whom have foregone health insurance in the past because of its cost, as well as wealthy retirees and teachers. Dr Michl re-ceives approximately $1000 of each patient’s annual MDVIP fee. Having an MDVIP practice, he said, allows him to spend more time with his patients, to communi-cate with them via e-mail and phone, as well as after hours, and also to do more disease management, such as nutrition and lifestyle counseling.
Results of PCMH ModelsData from PCMH models demonstrate the clinical
and cost benefits of the PCMH model for members with commercial, Medicaid, or Medicare coverage.
As shown in Figure 1, (page 34), CCNC has gener-ated substantial estimated savings for the North Carolina Medicaid program.5 In addition, CCNC is generating savings from an intensive patient-centric focus on high-cost beneficiaries and savings of approximately 15% per beneficiary 6 months after their enrollment in CCNC, according to Mr Mahoney.
With 4 million members in 39 states receiving care in primary care medical homes, BCBS has been a leader in the move to the PCMH model.4 In one of the BCBS of North Carolina programs—Blue Quality Physician Program—patients who belonged to NCQA-recognized PCMHs had 52% fewer visits to specialists and 70% fewer emergency department visits.4
For Horizon BCBS of New Jersey’s PCMH, the PMPM costs were reduced by 10%, and 26% fewer emer-gency department visits and 21% fewer inpatient admis-sions were reported in 2012.4 Similarly, BCBS of Nebraska’s PCMH had 27% fewer emergency depart-ment visits and 10% fewer hospitalizations in 2012.4
Other programs have shown similar results for Medicare Advantage, traditional Medicare, and commercial insur-ance beneficiaries. For example, Geisinger Health Plan’s ProvenHealth Navigator medical home model significant-ly reduced the use of costly hospital-related services for the program’s patients (Figure 2, page 35).19 Acute admissions were reduced by 28% for Medicare members in the ProvenHealth Navigator medical home compared with those not in the medical home. Similarly, a 38% reduc-tion was seen among commercial members in the
ProvenHealth Navigator medical home versus those who were not (Figure 2).
Intermountain Healthcare, an integrated health sys-tem in Utah, has a medical home model called “Care Management Plus.” For Care Management Plus patients, the odds of dying in the first and second years of partici-pating in the program were significantly less for all pa-tients, with greater benefits for patients with diabetes (at 1 year 6.2% vs 10.6% for all patients with diabetes in the control group, at 2 years 21.0% vs 24.2% for patients with diabetes in the control group).20,21 The odds of ad-mission for any cause were reduced by 27% to 40%.20
A Call to ActionHealthcare plans covering the gamut of patient popu-
lations have an opportunity to improve care and to re-duce costs for their beneficiaries by taking steps to sup-port the growth and the evolution of PCP practices and PCMHs. Based on our review of the plans discussed in this article, we recommend the following 6 actions that health plans can take to achieve these goals.
1. Get Feedback from PCPsManaged care organization executives involved with
network management should have frank and open con-versations with PCPs representing a variety of practices with varying sizes and locations to learn from their expe-riences. Doing so will help health plans to craft policies that strengthen networks by retaining PCPs, who are vital to improving care and to reducing costs.
2. Create Value-Based PCP ReimbursementEnhanced and value-based reimbursement policies for
PCPs, particularly those in PCMHs, are vital to improv-ing care and to reducing costs. We recommend that:• Commercial insurer and Medicare Advantage FFS
payments for primary care services are roughly 10% higher than Medicare payments; the ACA requires state Medicaid programs to reimburse PCPs at no less than 100% of Medicare’s reimbursement rate in 2013 and 2014
• Enhanced PMPM payments to practices that meet higher levels of NCQA accreditation and CMS meaningful use standards, or for smaller or rural prac-tices or older physicians, other medical home models, HEDIS scores, use of nonphysician providers, health information technology infrastructure, and expanded patient access
• Gain-sharing or bonuses when cost-savings are demon-strated, which can be actuarially imputed or other-wise estimated
• Substantial total increased payments, representing as much as a 20% increase in payment.
CCNC is generating savings from an intensive patient-centric focus on high-cost beneficiaries and savings of approximately 15% per beneficiary 6 months after their enrollment in CCNC.
Primary Care Medical Homes
37 www.AHDBonline.com l American Health & Drug Benefits lVol 6, No 1 l January/February 2013
3. Encourage Biannual Visits with High-Risk Patients
Pay practices an enhanced FFS payment, of roughly $125 to $150, for biannual visits for patients whom prac-tices or plans identify as being at a moderate or an in-creased risk based on their health status.
4. Fund Case Managers for High-Risk PatientsAssist PCPs in identifying the 2% to 5% of patients
who have the highest morbidity and costs. Then identify a provider who can be an overall case manager for the care of those patients and help to identify or to provide resources for patient and practice assistance.
5. Consider Medicaid Coordinated-Care ModelsWith the dramatic expansion of Medicaid under the
ACA, it will be particularly important to consider mod-els, such as CCNC, that have reduced costs.5
6. Promote ACA Provisions that Support Primary Care
Health plans should advocate that the components of the ACA that support primary care are brought for-ward and funded, whether as ACA components or as separate bills.22
ConclusionThe cost of healthcare in the United States presents a
tremendous burden to all stakeholders, including federal and state governments, employers, commercial payers, and individuals. With millions of new health insurance beneficiaries expected in 2014 as a result of the ACA, there will most likely be an increased demand for health-care. Primary care is the front line for delivering preven-tive care and the care for chronic conditions, such as dia-betes, hypertension, and hyperlipidemia, which are the major drivers of morbidity, mortality, and costs. Robust primary care models, such as the PCMH model, have shown to improve outcomes; reduce the use of higher-cost resources, such as hospital admissions and emergency de-partment visits; and lower the total costs of care. Payers’ support of primary care (eg, via enhanced payment and support for the PCMH model) is key in transforming the US healthcare system to improve healthcare quality and outcomes and to reduce the current unsustainable trajec-tory of growth in healthcare costs. n
Author Disclosure StatementDr Owens is a consultant to Allergan, Biogen Idec, Boston
Scientific, CardioDx, Crescendo Biosciences, Eli Lilly,
Genzyme, Iroko, Johnson & Johnson, and Novocure. Ms Collins has nothing to disclose. Mr Piper has no conflicts of interest to report.
References1. Centers for Medicare & Medicaid Services. National Health Expenditure Projections 2011-2021. www.cms.gov/Research-Statistics-Data-and-Systems/Statistics-Trends-and-Reports/NationalHealthExpendData/Downloads/Proj2011PDF.pdf. Accessed January 15, 2013.2. Kaiser Family Foundation and Health Research and Educational Trust. Employer Health Benefits 2012 Summary of Findings. http://ehbs.kff.org/pdf/2012/8346.pdf. Accessed January 15, 2013.3. State Budget Crisis Task Force. Report of the State Budget Crisis Task Force. Revised July 31, 2012. www.statebudgetcrisis.org/wpcms/wp-content/images/Report-of-the-State-Budget-Crisis-Task-Force-Full.pdf. Acessed January 15, 2013.4. Nielsen M, Langner B, Zema C, et al. Patient-Centered Primary Care Collabora-tive. Benefits of implementing the primary care patient-centered medical home: a review of cost and quality results, 2012. www.pcpcc.net/files/benefits_of_implementing_ the_primary_care_pcmh_0.pdf. Accessed January 15, 2013.5. Cosway R, Girod C, Abbott B. Analysis of Community Care of North Carolina Cost Savings. Milliman, Inc. December 15, 2011. www.communitycarenc.org/elements/ media/files/milliman-executive-summary.pdf. Accessed April 26, 2012.6. American Academy of Family Physicians, American Association of Pediatrics, American College of Physicians, American Osteopathic Association. Joint Principles of the Patient-Centered Medical Home. March 2007. www.aap.org/en-us/professional- resources/practice-support/quality-improvement/Documents/Joint-Principles-Patient-Centered-Medical-Home.pdf. Accessed January 22, 2013.7. NCQA’s Patient-Centered Medical Home (PCMH) 2011. November 21, 2011. www.ncqa.org/Portals/0/PCMH2011%20withCAHPSInsert.pdf. Accessed January 22, 2013.8. NCQA’s Patient-Centered Medical Home (PCMH) 2011 January 31, 2011. http://ncqa.org/Portals/0/Programs/Recognition/PCMH_2011_Overview_5.2.pdf. Accessed January 25, 2013.9. Centers for Medicare & Medicaid Services. April 2012 EHR Incentive Program Active Registrations. www.cms.gov/Regulations-and-Guidance/Legislation/EHR IncentivePrograms/downloads/Monthly_Payment_Registration_Report_Updated.pdf. Accessed January 22, 2013.10. Vardi N. America’s richest counties. Forbes.com. April 11, 2011. www.forbes.com/2011/04/11/americas-richest-counties-business-washington.html. Accessed January 15, 2013.11. Centers for Medicare & Medicaid Services. Affordable Care Act Timeline. www.medicaid.gov/AffordableCareAct/Timeline/Timeline.html. Accessed January 15, 2013.12. Centers for Medicare & Medicaid Services. MLN Matters. August 8, 2012. www.cms.gov/Outreach-and-Education/Medicare-Learning-Network-MLN/MLNMatters Articles/downloads/mm7060.pdf. Accessed January 15, 2013.13. Implementing the ACA’s Medicaid-Related Health Reform Provisions After the Supreme Court’s Decision. Kaiser Family Foundation Focus on Health Reform. August 2012. www.kff.org/healthreform/upload/8348.pdf. Accessed January 15, 2013.14. Congressional Budget Office. Estimates for the insurance coverage provisions of the Affordable Care Act updated for the recent Supreme Court decision. July 2012. www.cbo.gov/sites/default/files/cbofiles/attachments/43472-07-24-2012-Coverage Estimates.pdf. Accessed January 23, 2013.15. Holahan J, Buettgens M, Carroll C, Dorn S. The cost and coverage implications of the ACA Medicaid expansion: national and state-by-state analysis. The Urban Institute and the Kaiser Commission on Medicaid and the Uninsured. November 2012. www.kff.org/medicaid/upload/8384.pdf. Accessed January 23, 2013.16. Petterson SM, Liaw WR, Phillips RL Jr, et al. Projecting US primary care physi-cian workforce needs: 2010-2025. Ann Fam Med. 2012;10:503-509.17. Bitton A, Martin C, Landon BE. A nationwide survey of patient centered med-ical home demonstration projects. J Gen Intern Med. 2010;25:584-592.18. Gilfillan R, Tomcavage J, Rosenthal MB, et al. Value and the medical home: effects of transformed primary care. Am J Manag Care. 2010;16:607-614.19. Steele GD, Haynes JA, Davis DE, et al. How Geisinger’s advanced medical home model argues the case for rapid-cycle innovation. Health Aff (Millwood). 2010;29: 2047-2053.20. Dorr DA, Brunker CP. Building the Medical Home: The Role of Care Manage-ment Plus. http://caremanagementplus.org/publications/FinalCM+CenteronAging Feb232011Brunker.pdf. Accessed January 23, 2013.21. Dorr DA, Wilcox AB, Brunker C, et al. The effect of technology-supported, multidisease care management on the mortality and hospitalization of seniors. J Am Geriatr Soc. 2008;56:2195-2202.22. Collins S. Primary care shortages: strengthening this sector is urgently needed, now and in preparation for healthcare reform. Am Health Drug Benefits. 2012;5:40-47.
Stakeholder Perspective on page 38
business
38 l American Health & Drug Benefits l www.AHDBonline.com January/February 2013 l Vol 6, No 1
Enhancing Health Outcomes and Quality of Care with the Medical Home Model in Primary Care By Jack e. Fincham, PhD, RPhProfessor of Pharmacy Practice and Administration University of Missouri-Kansas City School of Pharmacy
The passage of the Affordable Care Act (ACA) has highlighted the importance of a renewed focus on en-hancing health outcomes, while also promoting the quality of care delivered with both economic and struc-tural benefits.
HeALtH PLAns: This exceptionally well-written article provides information, instruction, and guidance pertinent to how health plans, and other payers, can use primary care medical homes for multiple purposes to im-prove outcomes. The descriptions of currently successful models provide templates for other groups to utilize for advantageous outcomes.
The examples presented in this article by Ms Collins and colleagues range from models providing enhanced fee-for-service payments to supplemental per-member per-month models, as well as value-based or pay-for-per-formance models. The Call to Action section of the arti-cle outlines key action steps for models that are currently in existence and for those groups that may be anticipat-ing instituting such plans in the future.
In 2010, a document written by Meyers and colleagues and published by the Agency for Healthcare Research and Quality outlined roles for medical homes and ac-countable care organizations from a coordination of patient care standpoint.1 Evidence of the success of such innovations has been documented, but this current arti-cle expands on this perspective to a considerable degree by citing even more informative increases in quality of care and positive outcomes that have ensued over the succeeding years.
In this article by Ms Collins and colleagues, the state-wide, public–private partnership known as Community Care of North Carolina is being discussed. It may further be useful to note the beneficial aspects of the North Carolina program through the incorporation of a success-
ful primary care medical home model for the population of at-risk pregnant Medicaid beneficiaries as another ex-ample of lowering healthcare costs and improving health outcomes with the medical home model.2
PAtients/PRoViDeRs: Economic, patient-, and provider-related benefits have been shown to materialize with patient-centered medical homes. In a comparative study carried out within the Seattle-based Group Health of Puget Sound, results indicated that patients whose care was managed via a medical home reported increased lev-els of patient satisfaction compared with the comparator group with no medical home involvement. In addition, physicians and other providers experienced less burnout associated with providing care, and the economic bene-fits were reported to be an average of $10.30 per patient per month in the study protocol over a 2-year period.3
The crucial next steps for the evaluation of the quality enhancement aspects of the ACA, as outlined in the cur-rent article by Ms Collins and colleagues, will enable further assessment and innovative components that will facilitate an evaluation of the positive application of the primary care medical home to enhance outcomes—in terms of the economic, patient, and provider components of medical homes. Enhanced quality of care should be an expected and a welcome outcome of such system changes. n
1. Meyers D, Peikes D, Genevro J, et al. The Roles of Patient-Centered Medical Homes and Accountable Care Organizations in Coordinating Patient Care. Agency for Healthcare Research and Quality US Department of Health and Human Services, AHRQ Publication No. 11-M005-EF. December 2010. http://pcmh.ahrq.gov/portal/server.pt/community/pcmh__home/1483/PCMH_Home_Papers%20Briefs%20and%20Othe%20Resources_v2. Accessed February 2, 2013.2. AHRQ Health Care Innovations Exchange. Statewide Medical Home Program for Low-Income Pregnant Women Enhances Access to Comprehensive Prenatal Care and Case Management, Improves Outcomes. January 2013. www.innovations.ahrq.gov/content.aspx?id=3778. Accessed February 2, 2012. 3. Reid RJ, Coleman K, Johnson EA, et al. The Group Health Medical Home at year two: cost savings, higher patient satisfaction, and less burnout for providers. Health Aff (Millwood). 2010;29:835-843.
STAkEHolDER PERSPECTiVE

39 www.AHDBonline.com l American Health & Drug Benefits lVol 6, No 1 l January/February 2012
Call for PaPersCancer Care Theme Issue
American Health & Drug Benefits will be publishing a theme issue on cancer care in mid-2013
The growing focus on targeted therapies and diagnostics, and the ever-increasing cost of cancer care, require a thorough examination of current and emerging trends in oncology, focusing on benefit design, utilization, and health outcomes.
readers are invited to submit manuscripts for this issue, including original research, cost-effective analyses, evidence-based comprehensive reviews, case studies, and industry surveys/trends.
All articles will undergo the journal’s rigorous peer-review process. Manuscripts must follow the format described in the Information for Authors (available at www.AHDBonline.com).
Areas of particular interest include:
➤ Benefit design for cancer therapies
➤ Best practices in oncology
➤ Cancer care and health disparities
➤ Cost considerations in cancer care
➤ Emerging trends in hematology/oncology
➤ End-of-life issues
➤ Health plan initiatives in oncology
➤ Managing toxicities of cancer therapies
➤ Patient navigation initiatives
➤ Pathways and practice guidelines
➤ Personalized medicine in oncology
➤ Survivorship programs
➤ Targeted cancer therapies
➤ Value-based cancer care
articles should follow the Manuscript Instructions for authors at www.aHDBonline.com.
submit articles to [email protected]. for more information, call 732-992-1889.
*
3:00 pm - 7:00 pm Registration
5:30 pm - 7:30 pm Welcome Reception and Exhibits
7:00 am - 8:00 am Symposium/Product Theater
8:15 am - 8:30 am Welcome to the Second Annual Conference of the Global Biomarkers Consortium—Setting the Stage for the MeetingProfessor Rob Coleman, MBBS, MD, FRCP
8:15 am - 11:45 am General Session I• Personalized Medicine in Oncology: Evolution of Cancer Therapy from
Nonspecific Cytotoxic Drugs to Targeted Therapies• Taking Stock of Molecular Oncology Biomarkers
• Genomics• Bioinformatics
• Validating Biomarkers for Clinical Use in Solid Tumors - Professor Rob Coleman, MBBS, MD, FRCP
• Validating Biomarkers for Clinical Use in Hematologic MalignanciesJorge E. Cortes, MD
• The Challenges of Biomarker-Based Clinical Trials• Keynote Lecture: Understanding Cancer at the Molecular Level
12:00 pm - 1:00 pm Symposium/Product Theater/Exhibits
1:15 pm - 4:30 pm General Session II • Introduction to Case Studies - Jorge E. Cortes, MD• Case Studies: Optimal, Value-Based Use of Molecular Biomarkers in
Oncology: The Expert’s Perspective on How I Treat My Patients, Part I • Lung Cancer• Breast Cancer• Multiple Myeloma• Prostate Cancer• Leukemia• Lymphoma
• Panel Discussion: Management Controversies and Accepted Guidelinesfor the Personalized Management of Solid Tumors and Hematologic Malignancies
• Keynote Lecture: The Medical-Legal Issues Surrounding the Use of Biomarkers in Oncology
4:30 pm - 6:30 pm Meet the Experts/Networking/Exhibits
7:00 am - 8:00 am Symposium/Product Theater
8:15 am - 11:45 am General Session III• Review of Saturday’s Presentations and Preview of Today - Jorge E. Cortes, MD• Case Studies: Optimal, Value-Based Use of Molecular Biomarkers in
Oncology: The Expert’s Perspective on How I Treat My Patients, Part II • Melanoma• Colorectal Cancer and Other GI Malignancies• MDS• Myeloproliferative Neoplasms
• Keynote Lecture: Promises and Challenges of Personalized Medicine in Im-proving Cancer Care
• Tumor Board: Challenging Cases in the Use of Biomarkers in ManagingSolid Tumors (attendee-contributed cases)
• Tumor Board: Challenging Cases in the Use of Biomarkers in ManagingHematologic Malignancies (attendee-contributed cases)
12:00 pm - 1:00 pm Symposium/Product Theater/Exhibits
1:15 pm - 3:00 pm General Session IV • Keynote Lecture: Making Personalized Medicine a Reality: The Realization
of Genomic Medicine• The Future of Personalized Medicine: Measuring Clinical Outcomes
• Cost-Effective Technologies That Can Drive Therapeutic Decision Making• Regulatory Perspectives on PMO• PMO: The Payer’s Perspective• Panel Discussion: Can We Afford PMO? A Value-Based Analysis
• Practical Considerations in Incorporating PMO into Everyday Cinical Management
• Reimbursement Challenges• Closing Remarks
3:00 pm Departures
The only global meeting dedicated to advancing the understanding of value and clinical impactof biomarker research in oncology. Guided by the expertise of leaders in this field, participants willreceive a thorough understanding of the current and future landscape of the relevance of tumor biomarkers and how to effectively personalize cancer care in the clinical setting.
This meeting will be directed toward medical oncologists and hematologists, pathologists, geneti-cists, advanced practice oncology nurses, research nurses, clinical oncology pharmacists, andgenetic counselors involved in the management of patients with solid tumors or hematologic ma-lignancies, and interested in the use of molecular tumor biomarkers to help optimize patient care.
This activity is jointly sponsored by Medical Learning Institute Inc, Center of Excellence Media,LLC, and Core Principle Solutions, LLC.
The Medical Learning Institute Inc designates this live activity for a maximum of 12.5 AMA PRA Category 1Credits™. Physicians should claim only the credit commensurate with the extent oftheir participation in the activity. This activity has been planned and implemented in accordancewith the Essential Areas and policies of the Accreditation Council for Continuing Medical Educa-tion through the joint sponsorship of the Medical Learning Institute Inc and the Center of ExcellenceMedia, LLC. The Medical Learning Institute Inc is accredited by the Accreditation Council for Con-tinuing Medical Education to provide continuing medical education for physicians.
Medical Learning Institute IncProvider approved by the California Board of Registered Nursing, Provider Number 15106, for12.5 contact hours.
The Medical Learning Institute Inc is accredited by the Accreditation Council for Phar-macy Education as a provider of continuing pharmacy education. Completion of thisknowledge-based activity provides for 12.5 contact hours (1.25 CEUs) of continuing
pharmacy education credit. The Universal Activity Number for this activity is (To be determined).
Upon completion of this activity, the participant will be able to:• Assess emerging data and recent advances in the discovery of molecular biomarkers and
their impact on the treatment of patients with solid tumors or hematologic malignancies• Discuss the role of molecular biomarkers in designing personalized therapy for patients with
solid tumors or hematologic malignancies• Outline the practical aspects of integrating molecular biomarkers into everyday clinical
practice in the treatment of patients with cancer
CONFERENCE REGISTRATIONEARLY BIRD
REGISTRATION NOW OPEN!
www.globalbiomarkersconsortium.com$175.00 until June 30, 2013
Professor Rob Coleman, MBBS, MD, FRCPYorkshire Cancer Research Professor of Medical OncologyDirector, Sheffield Cancer Research CentreAssociate Director, National Institute for Health Research Cancer Research NetworkDepartment of Oncology, Weston Park HospitalSheffield, United Kingdom
Jorge E. Cortes, MDChair, CML and AML SectionsD.B. Lane Cancer Research Distinguished Professor for Leukemia ResearchDepartment of Leukemia, Division of Cancer MedicineThe University of Texas MD Anderson Cancer CenterHouston, TX
*Agenda is subject to change.
MOP PERSONALIZED
MEDICINE IN ONCOLOGY
Grant requests are currently being reviewed by numerous supporters. Support will be acknowl-edged prior to the start of the educational activities.
ANNUAL CONFERENCE
GBC2013Asize20813_Layout 1 2/8/13 11:12 AM Page 1
AGENDA*
FRIDAY, JULY 26, 20133:00 pm – 7:00 pm Registration5:30 pm – 7:30 pm Welcome Reception/Exhibits
SATURDAY, JULY 27, 20137:00 am – 8:00 am Breakfast Symposium/Product Theater/Exhibits8:00 am – 8:15 am BREAK8:15 am – 8:30 am Welcome to the Second Annual World Cutaneous Malignancies
Congress — Setting the Stage for the Meeting - Sanjiv S. Agarwala, MD
8:30 am – 11:45 am General Session I: A Clinician’s Primer on the Molecular Biology of Cutaneous Malignancies• Keynote Lecture Understanding the Basic Biology and Clinical
Implications of the Hedgehog Pathway• Keynote Lecture Pathogenesis of Merkel Cell Carcinoma:
An Infectious Etiology? - Paul Nghiem, MD, PhD
12:00 pm – 1:00 pm Lunch Symposium/Product Theater/Exhibits1:00 pm – 1:15 pm BREAK1:15 pm – 4:30 pm General Session II: Current Treatment Guidelines in Cutaneous
Malignancies• Case Studies Optimal, Value-Based Therapy of Cutaneous
Malignancies: The Expert’s Perspective on How I Treat My Patients• Panel Discussion Management Controversies and Accepted
Guidelines for the Personalized Management of Cutaneous Malignancies
• Keynote Lecture New Combinations in Melanoma: A Role for MEK + BRAF and Anti–PD-1
4:30 pm – 6:30 pm Meet the Experts/Networking/Exhibits
SUNDAY, JULY 28, 20137:00 am – 8:00 am Breakfast Symposium/Product Theater/Exhibits8:00 am – 8:15 am BREAK8:15 am – 8:30 am Review of Saturday’s Presentations and Preview of Today’s Sessions8:30 am – 11:45 am General Session III: Review of Emerging Treatment Options for
Cutaneous MalignanciesGeneral Session IV: Challenges for the Cutaneous Malignancies Clinician• Panel Discussion How Can the Healthcare Team Work Best
Together to Deliver Value-Based Care in Cutaneous Malignancies?
12:00 pm – 1:00 pm Lunch Symposium/Product Theater/Exhibits1:00 pm – 1:15 pm BREAK1:15 pm – 2:45 pm General Session V: “Hot Data” — What I Learned at Recent Meetings:
Focus on Cutaneous Malignancies2:45 pm – 3:00 pm Closing Remarks - Steven J. O’Day, MD
*Agenda is subject to change.
A 2-day congress dedicated to informing, educating, and fostering the exchangeof clinically relevant information in the field of cutaneous malignancies on topics inmelanoma, basal cell carcinoma, cutaneous T-cell lymphoma, squamous cell carci-noma, and Merkel cell carcinoma, including:
• Epidemiology and genetic/environmental factors
• Molecular biology and cytogenetics related to the pathogenesis of cutaneousmalignancies
• Risk stratification based on patient and tumor characteristics
• Principles of cancer prevention of melanoma and basal cell carcinoma
• Current treatment guidelines
• Emerging treatment options for personalized therapy
• Future strategies in management based on translational data from current clinicaltrials and basic research
PROGRAM OVERVIEW
This activity was developed for medical and surgical oncologists, dermatologists,radiation oncologists, and pathologists actively involved in the treatment of cu-taneous malignancies. Advanced practice oncology or dermatololgy nurses,oncology pharmacists, and researchers interested in the molecular biology andmanagement of cutaneous malignancies are also encouraged to participate.
TARGET AUDIENCE
Upon completion of this activity, the participant will be able to:
• Review the molecular biology and pathogenesis of cutaneous malignancies asthey relate to the treatment of cutaneous T-cell lymphoma, basal cell carci-noma, Merkel cell tumors, and malignant melanoma
• Compare risk stratification of patients with cutaneous malignancies, and how totailor treatment based on patient and tumor characteristics
• Summarize a personalized treatment strategy that incorporates current stan-dards of care and emerging treatment options for therapy of patients with cu-taneous malignancies
LEARNING OBJECTIVES
DESIGNATION OF CREDIT STATEMENTS
PHYSICIAN CREDIT DESIGNATION
SPONSORS
REGISTERED NURSE DESIGNATION
The Medical Learning Institute Inc designates this live activity for a maximum of 12.0AMA PRA Category 1 Credits™. Physicians should claim only the credit commensuratewith the extent of their participation in the activity. This activity has been planned andimplemented in accordance with the Essential Areas and policies of the AccreditationCouncil for Continuing Medical Education through the joint sponsorship of the MedicalLearning Institute Inc and the Center of Excellence Media, LLC. The Medical LearningInstitute Inc is accredited by the Accreditation Council for Continuing Medical Educa-tion to provide continuing medical education for physicians.
This activity is jointly sponsored by Medical Learning Institute Inc, Center of ExcellenceMedia, LLC, and Core Principle Solutions, LLC.
COMMERCIAL SUPPORT ACKNOWLEDGMENTGrant requests are currently being reviewed by numerous supporters. Support will beacknowledged prior to the start of the educational activities.
Medical Learning Institute IncProvider approved by the California Board of Registered Nursing, Provider Number15106, for 12.0 contact hours.
Sanjiv S. Agarwala, MDProfessor of Medicine Temple University School ofMedicine Chief, Oncology & Hematology St. Luke’s Cancer Center Bethlehem, Pennsylvania
Steven J. O’Day, MDHematology/Oncology Director of Clinical Research Director of Los Angeles Skin Cancer Institute at Beverly Hills Cancer CenterClinical Associate Professor of MedicineUSC Keck School of MedicineLos Angeles, California
Professor Dr. Med. AxelHauschildProfessor, Department of DermatologyUniversity of KielKiel, Germany
CONFERENCE CO-CHAIRS
July 26-28, 2013Hyatt Regency La Jolla • San Diego, California
• Melanoma
• Basal Cell Carcinoma
• Cutaneous T-Cell Lymphoma
• Squamous Cell Carcinoma
• Merkel Cell Carcinoma
CONFERENCE REGISTRATION
EARLY BIRD REGISTRATION NOW OPEN!$175.00 UNTIL APRIL 30, 2013
www.CutaneousMalignancies.com
REGISTERED PHARMACY DESIGNATIONThe Medical Learning Institute Inc is accredited by the AccreditationCouncil for Pharmacy Education as a provider of continuing pharmacyeducation. Completion of this knowledge-based activity provides for 12.0contact hours (1.2 CEUs) of continuing pharmacy education credit. The
Universal Activity Number for this activity is (To be determined).
For complete agenda please visit www.CutaneousMalignancies.com
WCMC HouseAd_A-size_11512_Layout 1 11/12/12 5:02 PM Page 1

Policy UPdate
42 l American Health & Drug Benefits l www.AHDBonline.com January/February 2013 l Vol 6, No 1
On January 17, 2013, nearly 3 years after its ini-tial proposed rule, the US Department of Health and Human Services (HHS) issued the
long-awaited and much-anticipated Health Insurance Portability and Accountability Act (HIPAA) “omni-bus” rule, extending the scope of the privacy law be-yond healthcare providers to their business associates and subcontractors, and adding increased penalties for noncompliance.1
Regulated entities must be in compliance with the new rules by September 22, 2013, although covered entities and business associates will have up to 1 year after the 180-day compliance date to modify existing contracts to comply with these revised rules. All pro-vider practices and health plans should begin to exam-ine their policies now to ensure a seamless transition to these new rules.
Among the most dramatic changes to the existing law is that HIPAA’s privacy and security requirements will now directly apply to business associates.
Business associates will now include health informa-tion organizations, e-prescribing gateways, other entities that provide data transmission services for covered enti-
ties and that require access to data on a routine basis, entities that offer a personal health record to individuals on behalf of a covered entity, and subcontractors.
Penalties for noncompliance will range in severity, depending on the degree of culpability, including the number of individuals affected, and whether the non-compliant body has a history of noncompliance.
Central to the new regulations—which total a whop-ping 563 pages—is the sharing of patient-protected health information. Patients are given new control over their patient-protected health information, including allowing patients to request a copy of their electronic medical record in an electronic format and permitting patients to instruct their provider not to share informa-tion about treatment with their health plan when the individual pays for that care out of pocket.
In addition, the final rule expands the definition of a “breach” under HIPAA, thus eliminating the “harm” standard, which previously allowed entities to avoid breach notification if they could demonstrate that the breach posed no significant risk of harm to the individ-ual. Under the new rule, any impermissible use or dis-closure of patient-protected health information is pre-sumed a breach, “regardless of whether the information is being held by a health plan, a healthcare provider, or one of their business associates,”1 unless a low probabil-ity that information has been compromised can be demonstrated.
All provider practices and health plans are now tasked with the arduous effort of implementing what the HHS is calling “the most sweeping changes to the HIPAA privacy and security rules since they were first implemented.”1 n
Reference 1. US Department of Health and Human Services. New Rule Protects Patient Privacy, Secures Health Information. Press Release. January 17, 2013. www.hhs.gov/news/press/2013pres/01/20130117b.html. Accessed February 2, 2013.
Mr Margulies is an Associate at Foley Hoag, LLP, Washington, DC; Mr Slotnik is a Partner, Health Policy Strategies, LLC, Washington, DC.
All provider practices and health plans are now tasked with the arduous effort of implementing what the HHS is calling “the most sweeping changes to the HIPAA privacy and security rules since they were first implemented.”
HIPAA Privacy and Security Regulations UpdatedBy Ross D. Margulies, JD, MPH, and Jayson Slotnik, JD, MPH

SABCS Highlights
43 www.AHDBonline.com l American Health & Drug Benefits lVol 6, No 1 l January/February 2013
Applying the approach of personalized medicine to cancer care is gradually becoming crucial for en-suring the correct use of targeted therapies and
individualizing the management of patient care. The role of genetics in breast cancer is not new, but the ever-in-creasing numbers of new molecular diagnostics and tar-geted therapies are making this disease a growing focus of personalized medicine.
Several studies reported at the 2012 CTRC-AACR San Antonio Breast Cancer Symposium focused on the role of personalized medicine in breast cancer management.
BluePrint and MammaPrint Molecular Assays Reclassify Many Primary Breast Cancers
In a retrospective study of 208 patients with breast cancer, the use of molecular subtyping revealed that 25% of these tumors had been misclassified when diagnosed clinically, and therefore these patients should have been receiving different treatments if these molecular tests had been applied prospectively.
Specifically, 39% of the breast cancers that had been classified clinically as HER2 disease should have instead been managed with therapies for luminal-type breast cancer, such as endocrine therapy, and 20% of cancers that had been classified clinically as triple-negative breast cancer should have received therapies for luminal and HER2 disease (eg, endocrine therapy and trastuzu-mab-based regimens).
The investigators used frozen tumor samples from 208 patients (median age, 56 years) who were managed at 2 American institutions, following the National Compre-hensive Cancer Network guidelines between 1992 and 2010. The median follow-up was 11.3 years.
The majority (59%) of patients had estrogen receptor–positive (ER+) or progesterone receptor–positive (PR+) cancer; 20% had HER2 phenotype, and 24% had triple- negative breast cancer, as assessed by immunohisto-chemistry (IHC) and fluorescence in situ hybridization (FISH). All patients had undergone lumpectomy or mastectomy with axillary staging.
In this study, 2 microarray-based assays—BluePrint and MammaPrint—were used retrospectively to evaluate the clinical diagnosis performed with IHC and FISH.
The assays showed that 13 of 188 tumors that had been classified as ER+, PR+, or HER2-negative were not luminal-type cancer by BluePrint; 24 of 41 cancers clin-ically identified as HER2 were not shown to be so by BluePrint; and 10 of 49 triple-negative tumors were not confirmed as basal-type cancer by BluePrint.
Overall, 51 patients had to be reclassified based on these molecular tests. Of these, 28 patients were reas-sessed for ER, PR, and HER2 status.
The patients with luminal-type early breast cancer that was identified by BluePrint have excellent re-lapse-free survival rates of 97% for those with luminal A cancer, and 98% for patients with luminal B cancer.
These findings have important clinical implications for the accurate identification of women with a specific type of breast cancer and the selection of appropriate therapy.
According to lead investigator Massimo Cristofanilli, MD, FACP, Chair, Department of Medical Oncology, Fox Chase Cancer Center, Philadelphia, PA, and col-leagues, “The use of MammaPrint and BluePrint should be implemented in the management of primary breast cancer for the selection of adjuvant therapy in the era of personalized care.”
EndoPredict Identifies Women with ER+ Breast Cancer at Risk for Late Metastases
Another multigene test, EndoPredict, can help to identify women with ER+/HER2-negative breast cancer who are likely to develop metastatic disease in the long-term. EndoPredict, which is not yet available for use in the United States, is different from other molecular as-says in its ability to predict later, rather than earlier, metastases, according to lead investigator Peter C. Dubsky, MD, Associate Professor, Department of Surgery, Medi cal University of Vienna, Austria.
“Oncotype DX and other predictive tests that rely on genetic signatures are used to predict earlier recurrence within the first 5 years,” Dr Dubsky said. “It is important to be able to predict risk of late recurrence for ER-positive breast cancer, because after 5 to 10 years of fol-low-up, mortality rates are higher for ER-positive than for ER-negative breast cancer.”
If these results are validated, then a low EndoPredict
The Role of Personalized Medicine in the Management of Patients with Breast CancerBy Phoebe Starr
Continued on page 44

SABCS Highlights
44 l American Health & Drug Benefits l www.AHDBonline.com January/February 2013 l Vol 6, No 1
score could identify the women with breast cancer who could forego extended antihormonal therapy.
Unlike other multigene tests that are based solely on the molecular fingerprint of a tumor, the EndoPredict score factors in tumor biology data that are derived from tumor size and nodal status along with gene expression for 8 genes (3 proliferation genes and 5 ER-dependent genes) and 3 reference genes, similar to the techniques used in the Oncotype DX assay.
This study was conducted on tumor tissue from 1702 postmenopausal women (median age, 64 years) with ER+/HER2-negative breast cancer who participated in 2 randomized trials—the Austrian Breast Cancer Study Group (ABCSG)-6 and ABCSG-8.
Overall, 33% had node-positive disease. None of the women received adjuvant chemotherapy, but all of them received some form of hormonal therapy for 5 years, in-cluding tamoxifen alone or as a sequence of tamoxifen and an aromatase inhibitor. All the women had low-to- intermediate clinical risk.
Based on a predefined EndoPredict clinical score that combined the EndoPredict with nodal status and tumor size, 64% of the patients were determined to be at low risk for distant metastases; 98.2% of these women were free of late metastases at 10 years and were 5 times more likely to remain free of late metastases at 10 years than the 33% of women with a high EndoPredict score.
Further analysis showed that the genes associated with ER signaling added independent prognostic infor-mation for late recurrence.
Discussing the importance of these findings, Dr Dubsky noted that current clinical trials are not provid-ing the type of data needed to predict late metastases. “We currently have around 20,000 women in ongoing extended/late endocrine therapy clinical trials….We see very low rates, and the efficacy data of these trials is un-likely to make individual decisions for women very sim-ple,” Dr Dubsky said. He believes that gene-expression data extracted from EndoPredict could help to establish subgroups of patients with an excellent prognosis, which would facilitate the choice of therapy.
EndoPredict is currently available for diagnostic use in Austria and Switzerland. Expanded studies are ongoing.
Triple-Negative Breast Cancer Linked to BRCA1, but Not BRCA2, Mutation
In a large study with 2105 patients with breast cancer, triple-negative breast cancer was strongly associated with the BRCA1 genetic mutation but not with BRCA2.
Women with triple-negative breast cancer are thought
to be more likely to have the BRCA genetic mutation, but it remains controversial whether newly diagnosed women with triple-negative breast cancer should be re-ferred for genetic counseling. The recommendation for genetic counseling in this patient population is based only on studies with small numbers of BRCA carriers, and no clear guideline is available.
This study was conducted by investigators at Kaiser Permanente and was based on a retrospective cohort of 2105 women with breast cancer who were tested for BRCA mutations between 1997 and 2011. The BRCA-related results were reported in the health plan’s clinical genetics registry.
Of the 2105 women with breast cancer, 249 were found to be carriers of a BRCA mutation—143 had the BRCA1 mutation, and 106 had the BRCA2 mutation.
Data linkages were performed for all patients with the National Cancer Institute-SEER (Surveillance, Epidemi ology and End Results)– affiliated tumor regis-try; ER, PR, and HER2 statuses were captured and were assessed by IHC or FISH techniques. Patients were classified into the 2 main biologic subtypes of triple-neg-ative breast cancer (ER-negative, PR-negative, HER2-negative) and non–triple-negative breast cancer (lumi-nal A, luminal B, and HER2-enriched).
The association between triple-negative breast can-cer and non–triple-negative breast cancer and BRCA1 or BRCA2 mutation status was then examined.
The triple-negative subtype was strongly correlated with BRCA status (P <.001). Women with triple-negative tumors were 5 times more likely to be BRCA carriers than women with non–triple-negative tumors (odds ratio [OR], 5.6; 95% confidence interval [CI], 4.1-7.5). The associa-tion between triple-negative breast cancer and BRCA1 was more robust (OR, 12.2; 95% CI, 8.3-17.9) and was unchanged after adjusting for age, stage at diagnosis, and race or ethnicity. Triple-negative cancer was not associat-ed with BRCA2 status (OR, 1.6; 95% CI, 0.9-2.7).
ConclusionThese data, taken together, point to the increasing
importance of personalized medicine in the daily man-agement of patients with breast cancer. Consequently, research is needed to evaluate the cost impact of incor-porating these molecular tests into clinical practice, and to compare the cost-effectiveness of these various tools, considering that more accurate diagnosis is associated with improved health outcomes and therefore often with reduced overall costs, despite the extra costs asso-ciated with the administration of the test itself. n

Clearly the right choice for your formulary
VASCEPA® is an optimal TG-lowering agent for your formulary and your members with severe hypertriglyceridemia. VASCEPA® is the first FDA-approved, EPA-only omega-3-fatty acid that significantly lowers median placebo-adjusted TG levels by 33% without increasing LDL-C or HbA1c compared to placebo while also positively affecting a broad spectrum of lipid parameters.1
Consider VASCEPA® an affordable option for your members with severe hypertriglyceridemia (TG levels ≥ 500 mg/dL).
Indications and Usage
VASCEPA® (icosapent ethyl) is indicated as an adjunct to diet to reduce triglyceride (TG) levels in adult patients with severe (≥ 500 mg/dL) hypertriglyceridemia.
• The effect of VASCEPA® on the risk for pancreatitis in patients with severe hypertriglyceridemia has not been determined
• The effect of VASCEPA® on cardiovascular mortality and morbidity in patients with severe hypertriglyceridemia has not been determined
For the treatment of severe hypertriglyceridemia (TG levels ≥ 500 mg/dL)
Reference: 1. Bays HE, Ballantyne CM, Kastelein JJ, et al. Eicosapentaenoic acid ethyl ester (AMR101) therapy in patients with very high triglyceride levels (from the multi-center, placebo-controlled, randomized, double blind, 12-week study with an open-label extension [MARINE] trial). Am J Cardiol. 2011;108:682-690.
For more information on VASCEPA® see the brief summary or for the Full Prescribing Information please visit www.VASCEPA.com.
Important Safety Information for VASCEPA® • VASCEPA® is contraindicated in patients with known
hypersensitivity (e.g., anaphylactic reaction) to VASCEPA® or any of its components
• Use with caution in patients with known hypersensitivity to fish and/or shellfish
• The most common reported adverse reaction (incidence >2% and greater than placebo) was arthralgia
• Patients should be advised to swallow VASCEPA® capsules whole; not to break open, crush, dissolve, or chew VASCEPA®
Amarin Pharma Inc. Bedminster, NJ 07921 www.AmarinCorp.com © 2012 Amarin Pharmaceuticals Ireland Limited. All rights reserved. 130033 1/2013 Reprint Code: XXXXXX
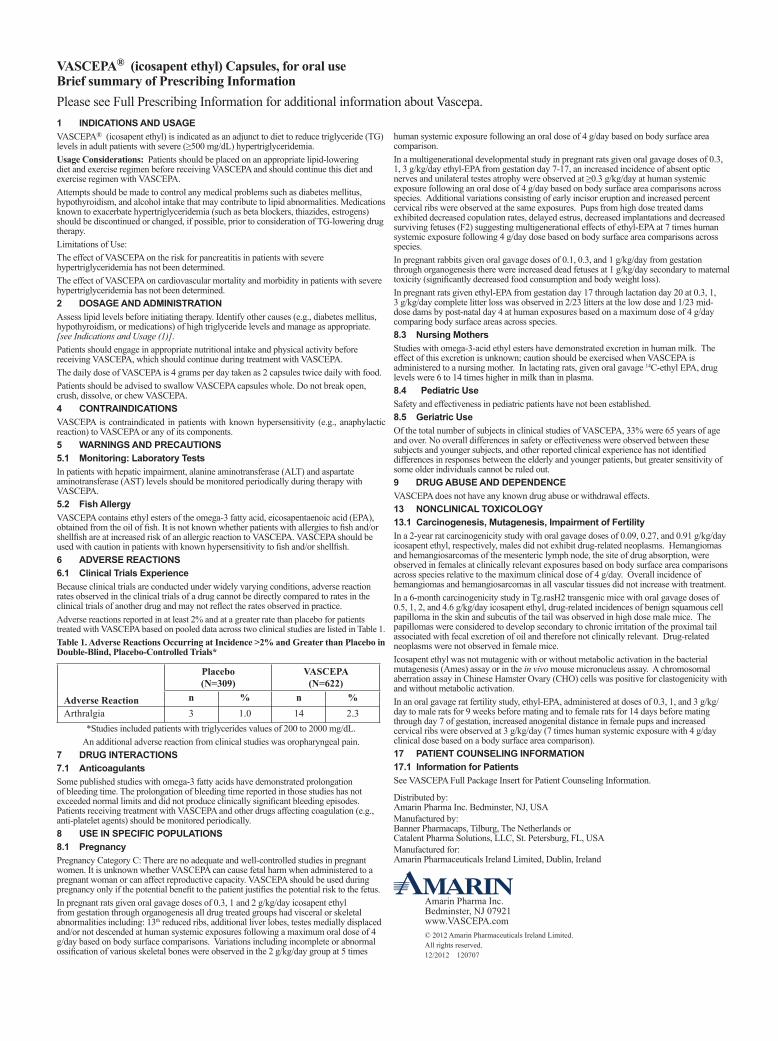
1 INDICATIONS AND USAGEVASCEPA® (icosapent ethyl) is indicated as an adjunct to diet to reduce triglyceride (TG) levels in adult patients with severe (≥500 mg/dL) hypertriglyceridemia.Usage Considerations: Patients should be placed on an appropriate lipid-lowering diet and exercise regimen before receiving VASCEPA and should continue this diet and exercise regimen with VASCEPA.Attempts should be made to control any medical problems such as diabetes mellitus, hypothyroidism, and alcohol intake that may contribute to lipid abnormalities. Medications known to exacerbate hypertriglyceridemia (such as beta blockers, thiazides, estrogens) should be discontinued or changed, if possible, prior to consideration of TG-lowering drug therapy.Limitations of Use:The effect of VASCEPA on the risk for pancreatitis in patients with severe hypertriglyceridemia has not been determined.The effect of VASCEPA on cardiovascular mortality and morbidity in patients with severe hypertriglyceridemia has not been determined.2 DOSAGE AND ADMINISTRATIONAssess lipid levels before initiating therapy. Identify other causes (e.g., diabetes mellitus, hypothyroidism, or medications) of high triglyceride levels and manage as appropriate. [see Indications and Usage (1)].Patients should engage in appropriate nutritional intake and physical activity before receiving VASCEPA, which should continue during treatment with VASCEPA. The daily dose of VASCEPA is 4 grams per day taken as 2 capsules twice daily with food.Patients should be advised to swallow VASCEPA capsules whole. Do not break open, crush, dissolve, or chew VASCEPA.4 CONTRAINDICATIONSVASCEPA is contraindicated in patients with known hypersensitivity (e.g., anaphylactic reaction) to VASCEPA or any of its components.5 WARNINGS AND PRECAUTIONS5.1 Monitoring: Laboratory TestsIn patients with hepatic impairment, alanine aminotransferase (ALT) and aspartate aminotransferase (AST) levels should be monitored periodically during therapy with VASCEPA.5.2 Fish AllergyVASCEPA contains ethyl esters of the omega-3 fatty acid, eicosapentaenoic acid (EPA), obtained from the oil of fish. It is not known whether patients with allergies to fish and/or shellfish are at increased risk of an allergic reaction to VASCEPA. VASCEPA should be used with caution in patients with known hypersensitivity to fish and/or shellfish.6 ADVERSE REACTIONS6.1 Clinical Trials ExperienceBecause clinical trials are conducted under widely varying conditions, adverse reaction rates observed in the clinical trials of a drug cannot be directly compared to rates in the clinical trials of another drug and may not reflect the rates observed in practice. Adverse reactions reported in at least 2% and at a greater rate than placebo for patients treated with VASCEPA based on pooled data across two clinical studies are listed in Table 1.Table 1. Adverse Reactions Occurring at Incidence >2% and Greater than Placebo in Double-Blind, Placebo-Controlled Trials*
Adverse Reaction
Placebo(N=309)
VASCEPA(N=622)
n % n %Arthralgia 3 1.0 14 2.3
*Studies included patients with triglycerides values of 200 to 2000 mg/dL.An additional adverse reaction from clinical studies was oropharyngeal pain.
7 DRUG INTERACTIONS7.1 Anticoagulants Some published studies with omega-3 fatty acids have demonstrated prolongation of bleeding time. The prolongation of bleeding time reported in those studies has not exceeded normal limits and did not produce clinically significant bleeding episodes. Patients receiving treatment with VASCEPA and other drugs affecting coagulation (e.g., anti-platelet agents) should be monitored periodically.8 USE IN SPECIFIC POPULATIONS8.1 PregnancyPregnancy Category C: There are no adequate and well-controlled studies in pregnant women. It is unknown whether VASCEPA can cause fetal harm when administered to a pregnant woman or can affect reproductive capacity. VASCEPA should be used during pregnancy only if the potential benefit to the patient justifies the potential risk to the fetus.In pregnant rats given oral gavage doses of 0.3, 1 and 2 g/kg/day icosapent ethyl from gestation through organogenesis all drug treated groups had visceral or skeletal abnormalities including: 13th reduced ribs, additional liver lobes, testes medially displaced and/or not descended at human systemic exposures following a maximum oral dose of 4 g/day based on body surface comparisons. Variations including incomplete or abnormal ossification of various skeletal bones were observed in the 2 g/kg/day group at 5 times
human systemic exposure following an oral dose of 4 g/day based on body surface area comparison.In a multigenerational developmental study in pregnant rats given oral gavage doses of 0.3, 1, 3 g/kg/day ethyl-EPA from gestation day 7-17, an increased incidence of absent optic nerves and unilateral testes atrophy were observed at ≥0.3 g/kg/day at human systemic exposure following an oral dose of 4 g/day based on body surface area comparisons across species. Additional variations consisting of early incisor eruption and increased percent cervical ribs were observed at the same exposures. Pups from high dose treated dams exhibited decreased copulation rates, delayed estrus, decreased implantations and decreased surviving fetuses (F2) suggesting multigenerational effects of ethyl-EPA at 7 times human systemic exposure following 4 g/day dose based on body surface area comparisons across species.In pregnant rabbits given oral gavage doses of 0.1, 0.3, and 1 g/kg/day from gestation through organogenesis there were increased dead fetuses at 1 g/kg/day secondary to maternal toxicity (significantly decreased food consumption and body weight loss).In pregnant rats given ethyl-EPA from gestation day 17 through lactation day 20 at 0.3, 1, 3 g/kg/day complete litter loss was observed in 2/23 litters at the low dose and 1/23 mid-dose dams by post-natal day 4 at human exposures based on a maximum dose of 4 g/day comparing body surface areas across species. 8.3 Nursing MothersStudies with omega-3-acid ethyl esters have demonstrated excretion in human milk. The effect of this excretion is unknown; caution should be exercised when VASCEPA is administered to a nursing mother. In lactating rats, given oral gavage 14C-ethyl EPA, drug levels were 6 to 14 times higher in milk than in plasma.8.4 Pediatric UseSafety and effectiveness in pediatric patients have not been established.8.5 Geriatric UseOf the total number of subjects in clinical studies of VASCEPA, 33% were 65 years of age and over. No overall differences in safety or effectiveness were observed between these subjects and younger subjects, and other reported clinical experience has not identified differences in responses between the elderly and younger patients, but greater sensitivity of some older individuals cannot be ruled out.9 DRUG ABUSE AND DEPENDENCEVASCEPA does not have any known drug abuse or withdrawal effects.13 NONCLINICAL TOXICOLOGY13.1 Carcinogenesis, Mutagenesis, Impairment of FertilityIn a 2-year rat carcinogenicity study with oral gavage doses of 0.09, 0.27, and 0.91 g/kg/day icosapent ethyl, respectively, males did not exhibit drug-related neoplasms. Hemangiomas and hemangiosarcomas of the mesenteric lymph node, the site of drug absorption, were observed in females at clinically relevant exposures based on body surface area comparisons across species relative to the maximum clinical dose of 4 g/day. Overall incidence of hemangiomas and hemangiosarcomas in all vascular tissues did not increase with treatment.In a 6-month carcinogenicity study in Tg.rasH2 transgenic mice with oral gavage doses of 0.5, 1, 2, and 4.6 g/kg/day icosapent ethyl, drug-related incidences of benign squamous cell papilloma in the skin and subcutis of the tail was observed in high dose male mice. The papillomas were considered to develop secondary to chronic irritation of the proximal tail associated with fecal excretion of oil and therefore not clinically relevant. Drug-related neoplasms were not observed in female mice.Icosapent ethyl was not mutagenic with or without metabolic activation in the bacterial mutagenesis (Ames) assay or in the in vivo mouse micronucleus assay. A chromosomal aberration assay in Chinese Hamster Ovary (CHO) cells was positive for clastogenicity with and without metabolic activation.In an oral gavage rat fertility study, ethyl-EPA, administered at doses of 0.3, 1, and 3 g/kg/day to male rats for 9 weeks before mating and to female rats for 14 days before mating through day 7 of gestation, increased anogenital distance in female pups and increased cervical ribs were observed at 3 g/kg/day (7 times human systemic exposure with 4 g/day clinical dose based on a body surface area comparison).17 PATIENT COUNSELING INFORMATION17.1 Information for PatientsSee VASCEPA Full Package Insert for Patient Counseling Information.
Distributed by: Amarin Pharma Inc. Bedminster, NJ, USAManufactured by: Banner Pharmacaps, Tilburg, The Netherlands orCatalent Pharma Solutions, LLC, St. Petersburg, FL, USAManufactured for: Amarin Pharmaceuticals Ireland Limited, Dublin, Ireland
VASCEPA® (icosapent ethyl) Capsules, for oral useBrief summary of Prescribing InformationPlease see Full Prescribing Information for additional information about Vascepa.
Amarin Pharma Inc. Bedminster, NJ 07921 www.VASCEPA.com© 2012 Amarin Pharmaceuticals Ireland Limited.All rights reserved.12/2012 120707
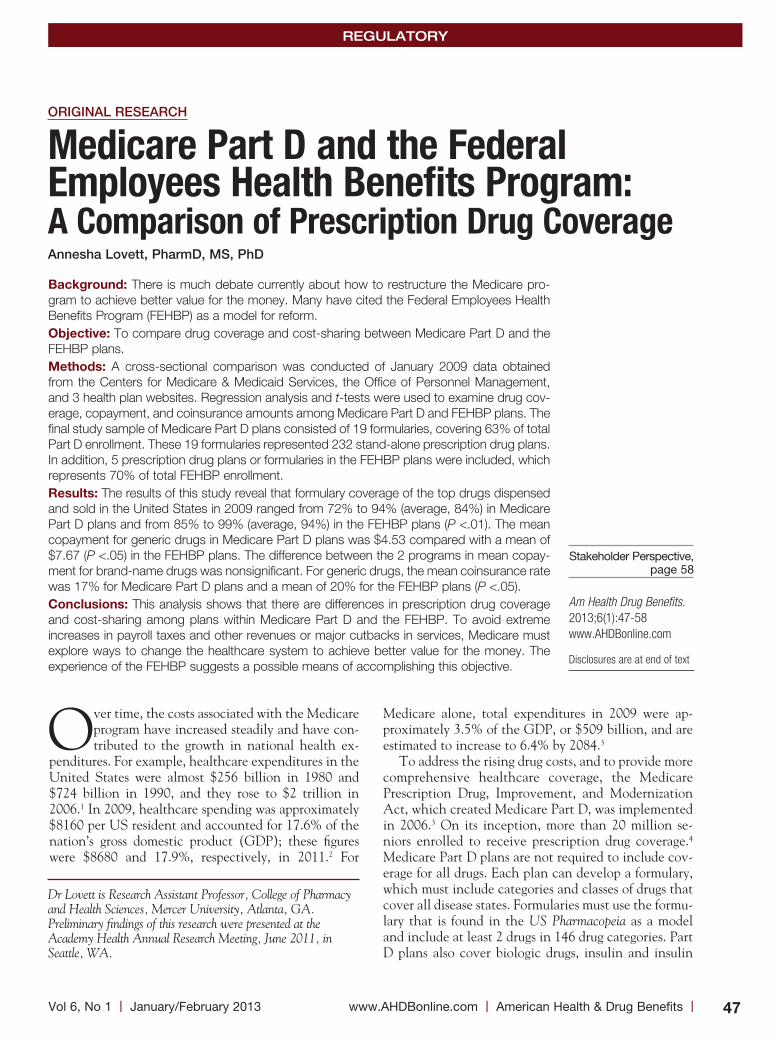
47 www.AHDBonline.com l American Health & Drug Benefits lVol 6, No 1 l January/February 2013
Over time, the costs associated with the Medicare program have increased steadily and have con-tributed to the growth in national health ex-
penditures. For example, healthcare expenditures in the United States were almost $256 billion in 1980 and $724 billion in 1990, and they rose to $2 trillion in 2006.1 In 2009, healthcare spending was approximately $8160 per US resident and accounted for 17.6% of the nation’s gross domestic product (GDP); these figures were $8680 and 17.9%, respectively, in 2011.2 For
Medicare alone, total expenditures in 2009 were ap-proximately 3.5% of the GDP, or $509 billion, and are estimated to increase to 6.4% by 2084.3
To address the rising drug costs, and to provide more comprehensive healthcare coverage, the Medicare Prescription Drug, Improvement, and Modernization Act, which created Medicare Part D, was implemented in 2006.3 On its inception, more than 20 million se-niors enrolled to receive prescription drug coverage.4 Medicare Part D plans are not required to include cov-erage for all drugs. Each plan can develop a formulary, which must include categories and classes of drugs that cover all disease states. Formularies must use the formu-lary that is found in the US Pharmacopeia as a model and include at least 2 drugs in 146 drug categories. Part D plans also cover biologic drugs, insulin and insulin
RegulatoRy
Original research
Medicare Part D and the Federal Employees Health Benefits Program: A Comparison of Prescription Drug Coverageannesha lovett, PharmD, Ms, PhD
Background: There is much debate currently about how to restructure the Medicare pro-gram to achieve better value for the money. Many have cited the Federal Employees Health Benefits Program (FEHBP) as a model for reform. Objective: To compare drug coverage and cost-sharing between Medicare Part D and the FEHBP plans.Methods: A cross-sectional comparison was conducted of January 2009 data obtained from the Centers for Medicare & Medicaid Services, the Office of Personnel Management, and 3 health plan websites. Regression analysis and t-tests were used to examine drug cov-erage, copayment, and coinsurance amounts among Medicare Part D and FEHBP plans. The final study sample of Medicare Part D plans consisted of 19 formularies, covering 63% of total Part D enrollment. These 19 formularies represented 232 stand-alone prescription drug plans. In addition, 5 prescription drug plans or formularies in the FEHBP plans were included, which represents 70% of total FEHBP enrollment.Results: The results of this study reveal that formulary coverage of the top drugs dispensed and sold in the United States in 2009 ranged from 72% to 94% (average, 84%) in Medicare Part D plans and from 85% to 99% (average, 94%) in the FEHBP plans (P <.01). The mean copayment for generic drugs in Medicare Part D plans was $4.53 compared with a mean of $7.67 (P <.05) in the FEHBP plans. The difference between the 2 programs in mean copay-ment for brand-name drugs was nonsignificant. For generic drugs, the mean coinsurance rate was 17% for Medicare Part D plans and a mean of 20% for the FEHBP plans (P <.05). Conclusions: This analysis shows that there are differences in prescription drug coverage and cost-sharing among plans within Medicare Part D and the FEHBP. To avoid extreme increases in payroll taxes and other revenues or major cutbacks in services, Medicare must explore ways to change the healthcare system to achieve better value for the money. The experience of the FEHBP suggests a possible means of accomplishing this objective.
Am Health Drug Benefits. 2013;6(1):47-58www.AHDBonline.com
Disclosures are at end of text
Stakeholder Perspective, page 58
Dr Lovett is Research Assistant Professor, College of Pharmacy and Health Sciences, Mercer University, Atlanta, GA. Preliminary findings of this research were presented at the Academy Health Annual Research Meeting, June 2011, in Seattle, WA.
REGULATORY
48 l American Health & Drug Benefits l www.AHDBonline.com January/February 2013 l Vol 6, No 1
syringes, specialty drugs, injectables, and smoking-ces-sation drugs.
The major purpose of Medicare Part D is to provide seniors access to prescription drugs; however, many questions surrounding coverage for prescription drugs have emerged, including questions from state policy-makers about the projected cost-savings in switching enrollees from other plans to Medicare Part D plans.5 In addition, concerns about Medicare funding persist, as costs continue to rise at alarming rates.6
There has been a debate over the potential benefits or consequences that may result if Medicare is reformed to resemble the Federal Employees Health Benefits Program (FEHBP).7-9 The FEHBP was created by Congress in 1959.10 The program provides healthcare coverage to active and retired federal and postal workers and their families, in addition to active and retired members of Congress and congressional staff. More than 400 private plans compete to provide coverage to more than 9 mil-lion people.10 Some have cited the program’s cost-saving techniques and provision of quality services as markers of a truly successful program.11
A Central, Unanswered QuestionAn unanswered question that is central to this debate
is how Medicare Part D and the FEHBP prescription drug plans coverage compare. To explore this question, this study compared prescription drug coverage offered in Medicare Part D and the FEHBP in 2009. The analy-sis focused on the consumer perspective, by examining differences in drug coverage and cost-sharing.
Specific advantages of the FEHBP include optional enrollment and broad eligibility requirements. In addi-tion, the FEHBP uses community ratings as a disincen-tive for plans to determine coverage on the basis of beneficiary risk. Furthermore, the program offers more provider choice and access, increased rural access, great-er achievements in cost control, and enhanced health benefits, by covering preventive services, dental services, and healthcare costs that are incurred abroad.12-14 For these reasons, the FEHBP has been cited by some as being superior to the Medicare program.10
By contrast, some reports reveal opposing views on Medicare’s adoption of an FEHBP-type model. Several studies dispute the claim that adopting an FEHBP model would offer an improvement to the Medicare pro-gram.15-17 Before the implementation of Medicare Part D, the lack of coverage for prescription drugs made the FEHBP particularly attractive in comparison with Medicare. Now that Medicare Part D has been imple-mented, however, the debate has been renewed on the desirability of switching enrollees from Medicare to an FEHBP-type plan.18
MethodsMedicare Part D Data Collection
Data were obtained from the Centers for Medicare & Medicaid Services (CMS) for January 2009 (chang-es to Medicare formulary are done once a year in January, hence the data in this study apply to the full year 2009). The initial sample of Medicare Part D pre-scription drug plans consisted of approximately 2500 prescription drug plans. Medicare Advantage plans were excluded, because separate data about prescrip-tion drug coverage were not available for those plans. After this exclusion, approximately 1893 stand-alone prescription drug plans remained. The percent and the cumulative percent of enrollees within each plan were calculated, and the plans were then ranked in terms of total enrollment. Beginning with the plans with the largest enrollment, the plans representing 63% of total Part D enrollment were selected for further consider-ation, resulting in a total of 232 stand-alone prescrip-tion drug plans.
For the excluded plans representing 37% of total enrollment, the range of enrollment was 16,697 to
Key Points
➤ With the looming increase in enrollees, the Medicare program will need restructuring to improve healthcare for less money.
➤ The FEHBP has been suggested as a model for Medicare Part D, because of its cost-saving strategies and quality services, but no comparisons of these 2 programs are available regarding their drug coverage, cost-savings, and quality of care.
➤ This study compares the drug coverage and cost-sharing in 63% of Medicare Part D plans and 70% of the FEHBP plans.
➤ Based on this analysis, formulary coverage of the top drugs dispensed in 2009 averaged 84% in Part D plans versus an average of 94% in the FEHBP plans.
➤ Mean copayment for generic drugs in Part D plans was $4.53 compared with a mean of $7.67 in the FEHBP plans; the difference in mean copayment for brand-name drugs was not significant.
➤ Enrollment was the single strongest predictor of the number of drugs covered per therapeutic class; as enrollment increased, the number of drugs covered per therapeutic class increased
➤ To avoid cutbacks in services, Medicare must explore ways to achieve better value for the money; the experience of the FEHBP suggests a possible means of accomplishing this objective.
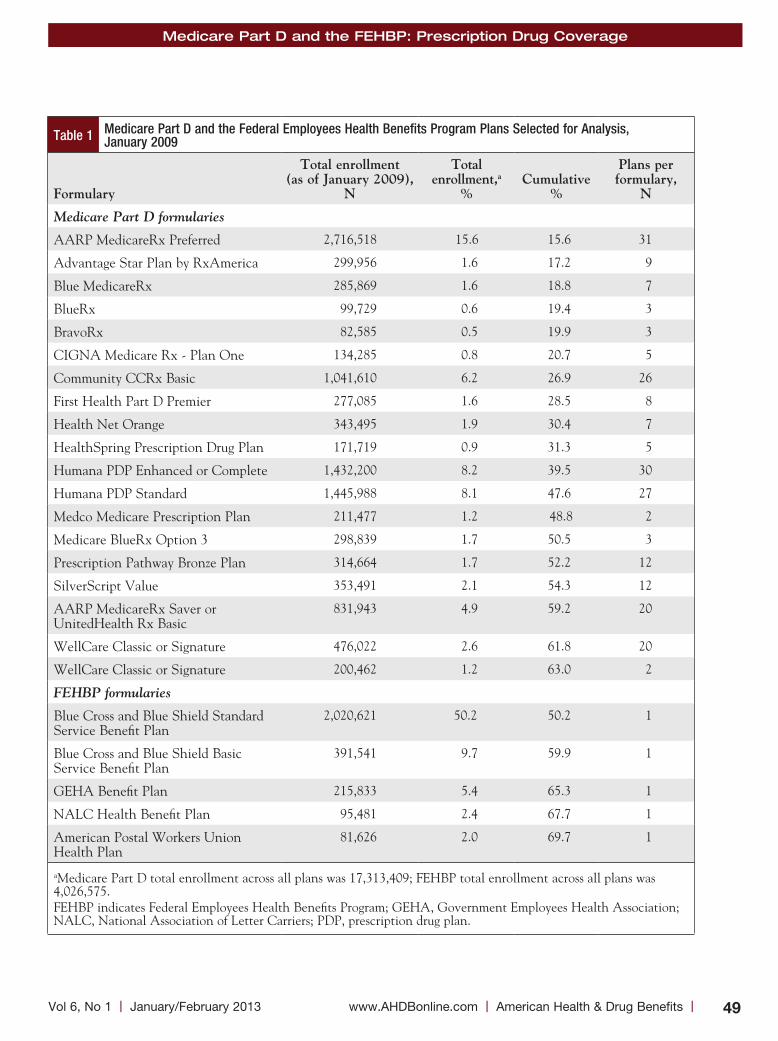
Medicare Part D and the FEHBP: Prescription Drug Coverage
49 www.AHDBonline.com l American Health & Drug Benefits lVol 6, No 1 l January/February 2013
Table 1 Medicare Part D and the Federal Employees Health Benefits Program Plans Selected for Analysis, January 2009
Formulary
total enrollment (as of January 2009),
n
total enrollment,a
%
Cumulative
%
Plans per formulary,
n
Medicare Part D formularies
AARP MedicareRx Preferred 2,716,518 15.6 15.6 31
Advantage Star Plan by RxAmerica 299,956 1.6 17.2 9
Blue MedicareRx 285,869 1.6 18.8 7
BlueRx 99,729 0.6 19.4 3
BravoRx 82,585 0.5 19.9 3
CIGNA Medicare Rx - Plan One 134,285 0.8 20.7 5
Community CCRx Basic 1,041,610 6.2 26.9 26
First Health Part D Premier 277,085 1.6 28.5 8
Health Net Orange 343,495 1.9 30.4 7
HealthSpring Prescription Drug Plan 171,719 0.9 31.3 5
Humana PDP Enhanced or Complete 1,432,200 8.2 39.5 30
Humana PDP Standard 1,445,988 8.1 47.6 27
Medco Medicare Prescription Plan 211,477 1.2 48.8 2
Medicare BlueRx Option 3 298,839 1.7 50.5 3
Prescription Pathway Bronze Plan 314,664 1.7 52.2 12
SilverScript Value 353,491 2.1 54.3 12
AARP MedicareRx Saver or UnitedHealth Rx Basic
831,943 4.9 59.2 20
WellCare Classic or Signature 476,022 2.6 61.8 20
WellCare Classic or Signature 200,462 1.2 63.0 2
FEHBP formularies
Blue Cross and Blue Shield Standard Service Benefit Plan
2,020,621 50.2 50.2 1
Blue Cross and Blue Shield Basic Service Benefit Plan
391,541 9.7 59.9 1
GEHA Benefit Plan 215,833 5.4 65.3 1
NALC Health Benefit Plan 95,481 2.4 67.7 1
American Postal Workers Union Health Plan
81,626 2.0 69.7 1
aMedicare Part D total enrollment across all plans was 17,313,409; FEHBP total enrollment across all plans was 4,026,575. FEHBP indicates Federal Employees Health Benefits Program; GEHA, Government Employees Health Association; NALC, National Association of Letter Carriers; PDP, prescription drug plan.
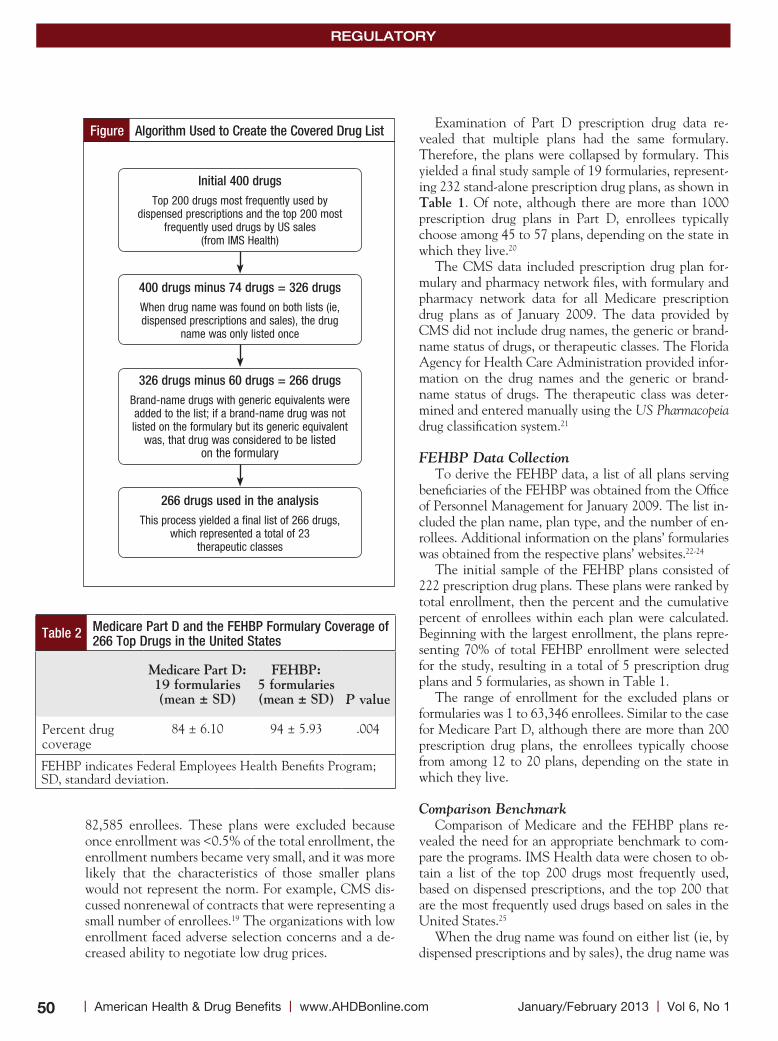
REGULATORY
50 l American Health & Drug Benefits l www.AHDBonline.com January/February 2013 l Vol 6, No 1
82,585 enrollees. These plans were excluded because once enrollment was <0.5% of the total enrollment, the enrollment numbers became very small, and it was more likely that the characteristics of those smaller plans would not represent the norm. For example, CMS dis-cussed nonrenewal of contracts that were representing a small number of enrollees.19 The organizations with low enrollment faced adverse selection concerns and a de-creased ability to negotiate low drug prices.
Examination of Part D prescription drug data re-vealed that multiple plans had the same formulary. Therefore, the plans were collapsed by formulary. This yielded a final study sample of 19 formularies, represent-ing 232 stand-alone prescription drug plans, as shown in table 1. Of note, although there are more than 1000 prescription drug plans in Part D, enrollees typically choose among 45 to 57 plans, depending on the state in which they live.20
The CMS data included prescription drug plan for-mulary and pharmacy network files, with formulary and pharmacy network data for all Medicare prescription drug plans as of January 2009. The data provided by CMS did not include drug names, the generic or brand-name status of drugs, or therapeutic classes. The Florida Agency for Health Care Administration provided infor-mation on the drug names and the generic or brand-name status of drugs. The therapeutic class was deter-mined and entered manually using the US Pharmacopeia drug classification system.21
FEHBP Data CollectionTo derive the FEHBP data, a list of all plans serving
beneficiaries of the FEHBP was obtained from the Office of Personnel Management for January 2009. The list in-cluded the plan name, plan type, and the number of en-rollees. Additional information on the plans’ formularies was obtained from the respective plans’ websites.22-24
The initial sample of the FEHBP plans consisted of 222 prescription drug plans. These plans were ranked by total enrollment, then the percent and the cumulative percent of enrollees within each plan were calculated. Beginning with the largest enrollment, the plans repre-senting 70% of total FEHBP enrollment were selected for the study, resulting in a total of 5 prescription drug plans and 5 formularies, as shown in Table 1.
The range of enrollment for the excluded plans or formularies was 1 to 63,346 enrollees. Similar to the case for Medicare Part D, although there are more than 200 prescription drug plans, the enrollees typically choose from among 12 to 20 plans, depending on the state in which they live.
Comparison BenchmarkComparison of Medicare and the FEHBP plans re-
vealed the need for an appropriate benchmark to com-pare the programs. IMS Health data were chosen to ob-tain a list of the top 200 drugs most frequently used, based on dispensed prescriptions, and the top 200 that are the most frequently used drugs based on sales in the United States.25
When the drug name was found on either list (ie, by dispensed prescriptions and by sales), the drug name was
Figure Algorithm Used to Create the Covered Drug List
Initial 400 drugsTop 200 drugs most frequently used by
dispensed prescriptions and the top 200 most frequently used drugs by US sales
(from IMS Health)
400 drugs minus 74 drugs = 326 drugsWhen drug name was found on both lists (ie, dispensed prescriptions and sales), the drug
name was only listed once
326 drugs minus 60 drugs = 266 drugsBrand-name drugs with generic equivalents were added to the list; if a brand-name drug was not listed on the formulary but its generic equivalent
was, that drug was considered to be listed on the formulary
266 drugs used in the analysisThis process yielded a final list of 266 drugs,
which represented a total of 23 therapeutic classes
Table 2 Medicare Part D and the FEHBP Formulary Coverage of 266 Top Drugs in the United States
Medicare Part D: 19 formularies (mean ± sD)
FeHBP: 5 formularies (mean ± sD)
P value
Percent drug coverage
84 ± 6.10 94 ± 5.93 .004
FEHBP indicates Federal Employees Health Benefits Program; SD, standard deviation.
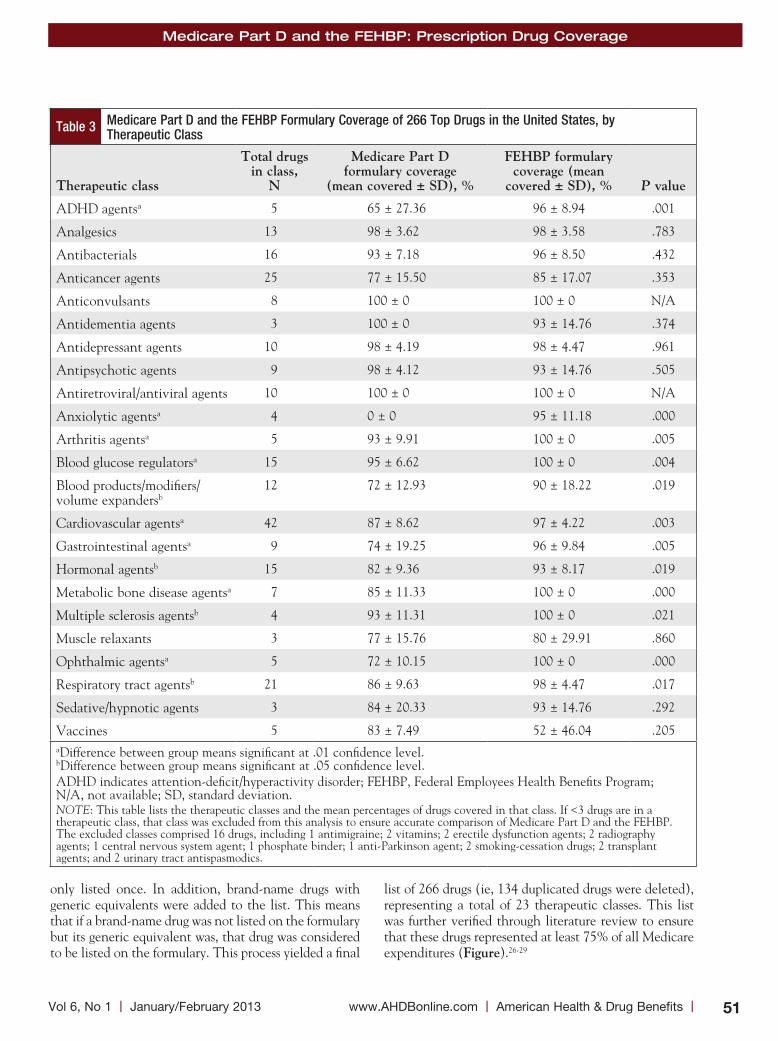
Medicare Part D and the FEHBP: Prescription Drug Coverage
51 www.AHDBonline.com l American Health & Drug Benefits lVol 6, No 1 l January/February 2013
Table 3 Medicare Part D and the FEHBP Formulary Coverage of 266 Top Drugs in the United States, by Therapeutic Class
therapeutic class
total drugs in class,
n
Medicare Part D formulary coverage
(mean covered ± sD), %
FeHBP formulary coverage (mean
covered ± sD), %
P value
ADHD agentsa 5 65 ± 27.36 96 ± 8.94 .001
Analgesics 13 98 ± 3.62 98 ± 3.58 .783
Antibacterials 16 93 ± 7.18 96 ± 8.50 .432
Anticancer agents 25 77 ± 15.50 85 ± 17.07 .353
Anticonvulsants 8 100 ± 0 100 ± 0 N/A
Antidementia agents 3 100 ± 0 93 ± 14.76 .374
Antidepressant agents 10 98 ± 4.19 98 ± 4.47 .961
Antipsychotic agents 9 98 ± 4.12 93 ± 14.76 .505
Antiretroviral/antiviral agents 10 100 ± 0 100 ± 0 N/A
Anxiolytic agentsa 4 0 ± 0 95 ± 11.18 .000
Arthritis agentsa 5 93 ± 9.91 100 ± 0 .005
Blood glucose regulatorsa 15 95 ± 6.62 100 ± 0 .004
Blood products/modifiers/ volume expandersb
12 72 ± 12.93 90 ± 18.22 .019
Cardiovascular agentsa 42 87 ± 8.62 97 ± 4.22 .003
Gastrointestinal agentsa 9 74 ± 19.25 96 ± 9.84 .005
Hormonal agentsb 15 82 ± 9.36 93 ± 8.17 .019
Metabolic bone disease agentsa 7 85 ± 11.33 100 ± 0 .000
Multiple sclerosis agentsb 4 93 ± 11.31 100 ± 0 .021
Muscle relaxants 3 77 ± 15.76 80 ± 29.91 .860
Ophthalmic agentsa 5 72 ± 10.15 100 ± 0 .000
Respiratory tract agentsb 21 86 ± 9.63 98 ± 4.47 .017
Sedative/hypnotic agents 3 84 ± 20.33 93 ± 14.76 .292
Vaccines 5 83 ± 7.49 52 ± 46.04 .205aDifference between group means significant at .01 confidence level. bDifference between group means significant at .05 confidence level. ADHD indicates attention-deficit/hyperactivity disorder; FEHBP, Federal Employees Health Benefits Program; N/A, not available; SD, standard deviation.NOTE: This table lists the therapeutic classes and the mean percentages of drugs covered in that class. If <3 drugs are in a therapeutic class, that class was excluded from this analysis to ensure accurate comparison of Medicare Part D and the FEHBP. The excluded classes comprised 16 drugs, including 1 antimigraine; 2 vitamins; 2 erectile dysfunction agents; 2 radiography agents; 1 central nervous system agent; 1 phosphate binder; 1 anti-Parkinson agent; 2 smoking-cessation drugs; 2 transplant agents; and 2 urinary tract antispasmodics.
only listed once. In addition, brand-name drugs with generic equivalents were added to the list. This means that if a brand-name drug was not listed on the formulary but its generic equivalent was, that drug was considered to be listed on the formulary. This process yielded a final
list of 266 drugs (ie, 134 duplicated drugs were deleted), representing a total of 23 therapeutic classes. This list was further verified through literature review to ensure that these drugs represented at least 75% of all Medicare expenditures (Figure).26-29
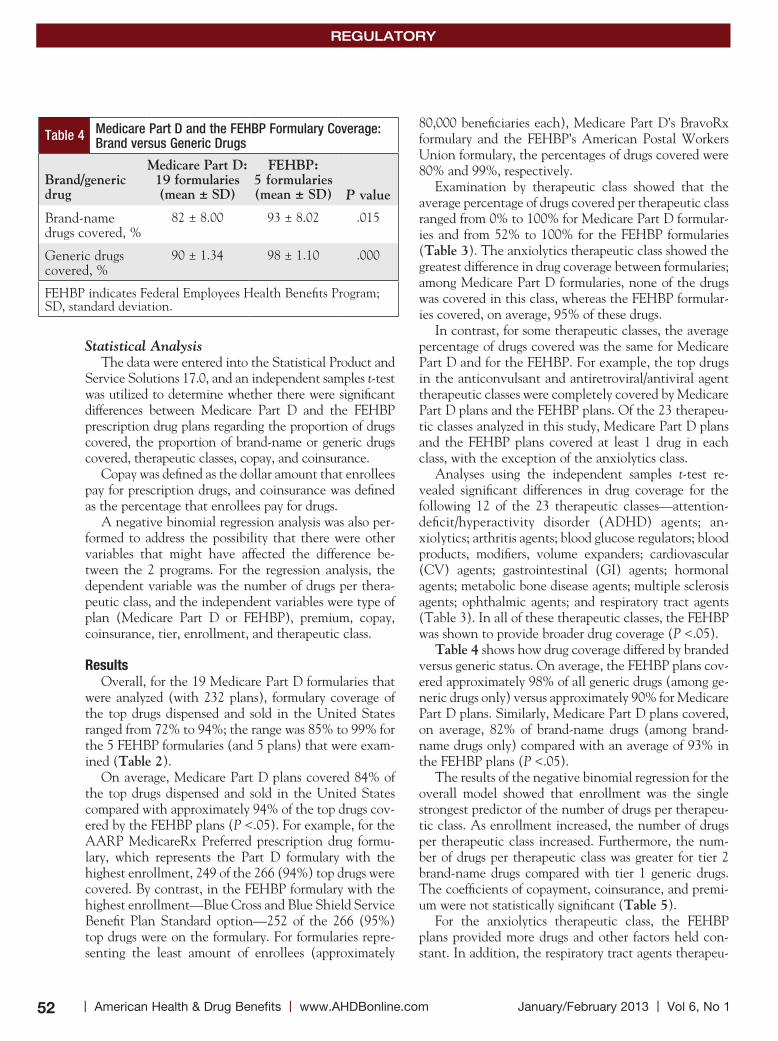
REGULATORY
52 l American Health & Drug Benefits l www.AHDBonline.com January/February 2013 l Vol 6, No 1
Statistical AnalysisThe data were entered into the Statistical Product and
Service Solutions 17.0, and an independent samples t-test was utilized to determine whether there were significant differences between Medicare Part D and the FEHBP prescription drug plans regarding the proportion of drugs covered, the proportion of brand-name or generic drugs covered, therapeutic classes, copay, and coinsurance.
Copay was defined as the dollar amount that enrollees pay for prescription drugs, and coinsurance was defined as the percentage that enrollees pay for drugs.
A negative binomial regression analysis was also per-formed to address the possibility that there were other variables that might have affected the difference be-tween the 2 programs. For the regression analysis, the dependent variable was the number of drugs per thera-peutic class, and the independent variables were type of plan (Medicare Part D or FEHBP), premium, copay, coinsurance, tier, enrollment, and therapeutic class.
ResultsOverall, for the 19 Medicare Part D formularies that
were analyzed (with 232 plans), formulary coverage of the top drugs dispensed and sold in the United States ranged from 72% to 94%; the range was 85% to 99% for the 5 FEHBP formularies (and 5 plans) that were exam-ined (table 2).
On average, Medicare Part D plans covered 84% of the top drugs dispensed and sold in the United States compared with approximately 94% of the top drugs cov-ered by the FEHBP plans (P <.05). For example, for the AARP MedicareRx Preferred prescription drug formu-lary, which represents the Part D formulary with the highest enrollment, 249 of the 266 (94%) top drugs were covered. By contrast, in the FEHBP formulary with the highest enrollment—Blue Cross and Blue Shield Service Benefit Plan Standard option—252 of the 266 (95%) top drugs were on the formulary. For formularies repre-senting the least amount of enrollees (approximately
80,000 beneficiaries each), Medicare Part D’s BravoRx formulary and the FEHBP’s American Postal Workers Union formulary, the percentages of drugs covered were 80% and 99%, respectively.
Examination by therapeutic class showed that the average percentage of drugs covered per therapeutic class ranged from 0% to 100% for Medicare Part D formular-ies and from 52% to 100% for the FEHBP formularies (table 3). The anxiolytics therapeutic class showed the greatest difference in drug coverage between formularies; among Medicare Part D formularies, none of the drugs was covered in this class, whereas the FEHBP formular-ies covered, on average, 95% of these drugs.
In contrast, for some therapeutic classes, the average percentage of drugs covered was the same for Medicare Part D and for the FEHBP. For example, the top drugs in the anticonvulsant and antiretroviral/antiviral agent therapeutic classes were completely covered by Medicare Part D plans and the FEHBP plans. Of the 23 therapeu-tic classes analyzed in this study, Medicare Part D plans and the FEHBP plans covered at least 1 drug in each class, with the exception of the anxiolytics class.
Analyses using the independent samples t-test re-vealed significant differences in drug coverage for the following 12 of the 23 therapeutic classes—attention- deficit/hyperactivity disorder (ADHD) agents; an-xiolytics; arthritis agents; blood glucose regulators; blood products, modifiers, volume expanders; cardiovascular (CV) agents; gastrointestinal (GI) agents; hormonal agents; metabolic bone disease agents; multiple sclerosis agents; ophthalmic agents; and respiratory tract agents (Table 3). In all of these therapeutic classes, the FEHBP was shown to provide broader drug coverage (P <.05).
table 4 shows how drug coverage differed by branded versus generic status. On average, the FEHBP plans cov-ered approximately 98% of all generic drugs (among ge-neric drugs only) versus approximately 90% for Medicare Part D plans. Similarly, Medicare Part D plans covered, on average, 82% of brand-name drugs (among brand-name drugs only) compared with an average of 93% in the FEHBP plans (P <.05).
The results of the negative binomial regression for the overall model showed that enrollment was the single strongest predictor of the number of drugs per therapeu-tic class. As enrollment increased, the number of drugs per therapeutic class increased. Furthermore, the num-ber of drugs per therapeutic class was greater for tier 2 brand-name drugs compared with tier 1 generic drugs. The coefficients of copayment, coinsurance, and premi-um were not statistically significant (table 5).
For the anxiolytics therapeutic class, the FEHBP plans provided more drugs and other factors held con-stant. In addition, the respiratory tract agents therapeu-
Table 4 Medicare Part D and the FEHBP Formulary Coverage: Brand versus Generic Drugs
Brand/generic drug
Medicare Part D: 19 formularies (mean ± sD)
FeHBP: 5 formularies (mean ± sD)
P value
Brand-name drugs covered, %
82 ± 8.00 93 ± 8.02 .015
Generic drugs covered, %
90 ± 1.34 98 ± 1.10 .000
FEHBP indicates Federal Employees Health Benefits Program; SD, standard deviation.

Medicare Part D and the FEHBP: Prescription Drug Coverage
53 www.AHDBonline.com l American Health & Drug Benefits lVol 6, No 1 l January/February 2013
tic class was borderline significant (P = .067) in favor of the FEHBP providing greater coverage. The remaining therapeutic classes (ie, ADHD agents, analgesics, anti-bacterial agents, anticancer agents, anticonvulsants, an-tidepressants, antipsychotics, arthritis agents, blood glu-cose regulators, CV agents, GI agents, and hormonal agents) showed no difference in drug coverage among plans when controlling for enrollment, premium, tier, coinsurance, and copayment.
When comparing plans based on whether they pro-vided cost-sharing through copayments versus coinsur-ance, results showed that Medicare Part D plans and the FEHBP plans utilized fixed-dollar copayments more often than coinsurance for tier 1 generic drugs. By con-trast, for tier 2 brand-name drugs, Medicare Part D plans were more likely to utilize copays, whereas the FEHBP
plans were more likely to utilize coinsurance.For the Medicare Part D plans, the mean copayment
for tier 1 generic drugs was $4.53 (range, $0-$8) com-pared with a mean of $7.67 for the FEHBP plans (range, $5-$10; P <.05). The difference in tier 2 brand-name drugs coverage was nonsignificant (P = .901). The mean rate for Medicare Part D plans that utilized coinsurance for tier 1 generic drugs was 17% compared with a mean of 20% for the FEHBP plans (P <.01). For the Medicare Part D plans that utilized coinsurance for tier 2 brand-name drugs, the mean was 26% compared with a mean of 34% for the FEHBP plans (P = .066).
DiscussionMedicare Part D and the FEHBP both provide services
to millions of enrollees, yet they have different methods
Table 5 Medicare Part D and the FEHBP Predictors of the Number of Drugs Covered in the Top 15 US Therapeutic Classes
Drug class
type of plan (Medicare Part D or the FeHBP)
Premium
Copay
Coinsurance
tier
enrollment
ADHD agents –.078 –.450E-03 .031a 1.704a –1.849a .050
Analgesics –.025 –.243E-03 –.109E-02 .139 .015 .196E-02
Antibacterials .033 .413E-03 .128E-02 .041 –.014 .016
Anticancer agents .822E-02 .202E-03 .723E-02a .513a –.085a .045a
Anticonvulsants –.152E-28 .162E-31 –.372E-30 –.336E-28 .456E-29 –.26E-02
Antidepressants .011 .645E-04 .372E-03 –.029 .443E-02 .172E-02
Antipsychotics .020 .313E-03 –.273E-02 –.471 .040 –.24E-02
Anxiolytics –2.06a .387E-03 –.105E-02 -.174 .016 .422E-02
Arthritis agents –.763E-02 .188E-03 .342E-02 .153 –.038 .022
Blood glucose .564E-02 .942E-04 .123E-02 .193 –.018 .019
Blood products –.020 .625E-03 –.110E-02 –.214 .017 .043a
Cardiovascular –.018 .125E-03 –.342E-03 –.170 .838E-02 .022a
Gastrointestinal –.052 .168E-03 –.192E-02 –.544 .035 .043a
Hormonal agents –.041 .143-03 –.174E-03 –.305 .011 .025
Respiratory tract agents
–.067a –.108E-03 –.168E-02 –.497a .031 .028a
aVariable is significant at .05 confidence level. NOTE: This table summarizes the results for separate regressions by therapeutic class. For the variable type of plan, no significant difference was found between the classes for the number of drugs covered, except for anxiolytic and respiratory drugs. But the variable enrollment was positively associated with the number of drugs covered per therapeu-tic class for anticancer drugs, blood products, cardiovascular drugs, gastrointestinal drugs, and respiratory tract drugs. Coinsurance was a significant predictor of the number of drugs covered per therapeutic class for the ADHD, anticancer, and respiratory tract drug classes. Copay and tier were only significant for the ADHD and anticancer classes.ADHD indicates attention-deficit/hyperactivity disorder; FEHBP, Federal Employees Health Benefits Program.

REGULATORY
54 l American Health & Drug Benefits l www.AHDBonline.com January/February 2013 l Vol 6, No 1
of operation. Medicare has been criticized for its lack of provision of services. For example, 9 of 10 Medicare en-rollees purchase supplemental coverage.6 Some advocate for reforming Medicare to look more like the FEHBP, citing the FEHBP’s exemplary benefits, service, cata-strophic limits, cost control, lack of fraud and abuse, and protection against interest group politics as advantages.7-9 Evidence has been lacking on the full comparison of these programs, particularly given the challenges faced by a growing elderly population in the United States.
The findings from this study reveal significant differ-ences between the 2 programs. Analyses by therapeutic class have shown that the anxiolytics therapeutic class, which was composed entirely of benzodiazepine drugs (ie, alprazolam, clonazepam, diazepam, and lorazepam), showed the greatest difference in drug coverage between formularies. Among Medicare Part D formularies, none of the drugs was covered in this class, whereas the FEHBP formularies covered, on average, 95% of them. This find-ing may be explained by the difference in enrollee popu-lation characteristics of the 2 programs (ie, the majority of Medicare beneficiaries are older vs the FEHBP, which includes working-age adults and those aged ≥65 years). For example, some experts suggest that anxiolytics are not recommended for use in the elderly,30 whereas others rec-ommend their use, but only with caution.31
The decision of whether to provide coverage for an-xiolytics may also be based on the associated side effects and the addictive properties of the drugs.21,32 By contrast, recent studies reveal that the exclusion of anxiolytics from formularies may decrease use, but it may not result in better patient outcomes, specifically a decrease in frac-ture risk.33,34 Considering the lack of consensus on the use of anxiolytics, the benefits of the provision or the lack of coverage of these agents remains unclear. Yang and col-leagues suggest that future studies that examine anxiolyt-ic use in Medicare beneficiaries should focus on age, sex, and racial or ethnic differences among beneficiaries.35
To shed further light on the coverage of anxiolytics and other classes of drugs, separate regression analyses were conducted, with the dependent variable defined as each therapeutic class (Table 5). The only 2 classes that showed a significant difference with respect to the type of plan were the anxiolytic and respiratory drug classes, with the FEHBP providing broader drug coverage.
This shows that comparison of the FEHBP and the Medicare Part D program is complex; that is, many fac-tors should be considered for such a comparison. The independent variables used in these analyses (ie, premi-um, tier, enrollment, copay, coinsurance, and therapeu-tic class) had an effect on coverage differences between the 2 programs.
In addition, it is clear that coverage may be broader for one program versus another, but such coverage gen-erosity depends on the therapeutic class. Regulation and other factors could possibly affect the inclusion of drugs on a formulary. With regard to premium, no significant differences were found. A review of the literature re-vealed that premiums are heavily dependent on the de-gree of cost-sharing. Specifically, some authors note that deductibles have the greatest impact on premiums. Perhaps including deductibles in the regression analyses would have resulted in significant differences for the variable premium.36
A recent examination of health plans in New York showed that changes in deductibles and cost-sharing can result in premium reductions of 50% or more.36 Other studies have shown that, although copay and coinsur-ance are used to deter enrollees from seeking services, premiums do not directly affect the number of services that are utilized.
Furthermore, studies show that savings via cost-shar-ing result in decreased premiums, but the extent of sav-ings depends on the type and the amount of cost-shar-ing.36 Therefore, it is understandable that results in the present study regarding premiums were nonsignificant. Future research that considers deductibles and fluctua-tions in cost-sharing may yield more significant premi-um-related results.
Although fluctuations in cost-sharing were not ex-plored, copay and coinsurance were included in the re-gression model as factors associated with the number of drugs covered per therapeutic class. A positive associa-tion was found for the number of drugs covered per therapeutic class and the copay for the ADHD and anti-cancer drug classes. An increase in copay by $1 resulted in an increase in the number of drugs covered in these classes. In addition, coinsurance was a significant predic-tor of the number of drugs covered per therapeutic class for ADHD, anticancer, and respiratory tract drugs. The number of ADHD and anticancer drugs rose as coinsur-
The decision of whether to provide coverage for an xiolytics may also be based on the associated side effects and the addictive properties of the drugs. By contrast, recent studies reveal that the exclusion of anxiolytics from formularies may decrease use, but it may not result in better patient outcomes, specifically a decrease in fracture risk.
Medicare Part D and the FEHBP: Prescription Drug Coverage
55 www.AHDBonline.com l American Health & Drug Benefits lVol 6, No 1 l January/February 2013
ance increased; yet, the number of respiratory covered drugs decreased as coinsurance increased.
This study shows that the relevance of individual therapeutic classes should be considered in the interpre-tation of cost-sharing findings. In a study by Avalere Health and the American Cancer Society Cancer Action Network that examined Medicare Part D plan cost-sharing for cancer drugs, it was noted that most Medicare plans place cancer drugs on higher tiers and that the coinsurance maximum is 33%.37 Earlier results of the regression analysis revealed that an increase in copay by $1 resulted in an increase in the number of anticancer agents. Therefore, both enrollees and plans can benefit from this type of benefit structure. Beneficiaries pay more through higher copays and coin-surance, yet they receive more drugs as a result. Similarly, plans provide more drugs, yet beneficiaries use less.38
For the variable tier, a significant difference was found for the ADHD agent and anticancer agent classes. For both classes, the number of drugs per therapeutic class was greater for tier 2 brand-name drugs compared with tier 1 generic drugs. It is interesting that more brand-name drugs were listed on the formularies than generic drugs, considering that generic drug promotion is often used as a cost-containment measure.39
Finally, variable enrollment was included in the re-gression analyses as a factor that would greatly affect the number of drugs per therapeutic class. For the initial overall model, enrollment was the single strongest pre-dictor of the number of drugs per therapeutic class. As enrollment increased, the number of drugs per therapeu-tic class grew. Specifically, an increase was shown in the anticancer agents; blood products, modifiers, volume expanders; CV agents; GI agents; and respiratory tract agents classes.
Both FEHBP and Medicare Part D plans offer an open enrollment season to beneficiaries. In 2009, Walton Francis commented that Medicare Part D’s offering of an open enrollment season was a direct result of learning a lesson from the FEHBP.6 The FEHBP and Medicare Part D allow beneficiaries to disenroll in their current plan and to change to another plan once annually between November and December. During that period, if enroll-ees dislike their plan for any reason, they can choose another plan without penalty.
Results of the regression analysis revealed that for 5 therapeutic classes, enrollment was positive and statisti-cally significant. Therefore, for these classes, as enroll-ment increased by 1 person, the number of drugs offered in these classes increased. This finding becomes especial-ly important during the discussion when prescription drug plan decision makers are trying to find ways to re-design themselves for improvement. For example, from
this finding, we can learn that as Medicare seeks to de-termine ways to contain costs, the best time to examine drug coverage is after the open enrollment season.
Furthermore, plans may find that after the open en-rollment season, it is the best time to negotiate drug coverage with manufacturers. Plans can also tell enroll-ees that the list of drugs offered when they join will only increase after enrollment. The enrollees can benefit by knowing that the drugs in the anticancer agent; blood products, modifiers, volume expanders; CV agent; GI agent; and respiratory tract agent therapeutic classes will only increase in number after they join. Studies show that the number of enrollees opting to change plans is very low for the FEHBP.6 Some have stated that this is a result of enrollee brand loyalty and older age.
Few studies have examined the FEHBP or Medicare Part D coverage of therapeutic drug classes. Bowman and colleagues examined formulary coverage in Medicare Part D plans for anticancer drugs, showing that the majority of cancer drugs were covered by almost all Medicare Part D plans.40 More up-to-date studies are needed related to access to anticancer drugs and to Medicare coverage to address the current debate on whether Medicare provides sufficient coverage for anti-cancer drugs.
Gellad and colleagues examined Medicare Part D plan coverage of angiotensin receptor blockers (ARBs), which are categorized under the CV agent class.41 Results showed that all Medicare Part D prescription drug plan formularies included at least 1 ARB, and 35% of the plans covered all 7 ARBs discussed in the study.41
Consistent with previous research, our study also shows that Medicare Part D plans cover a large number of anticancer and CV drugs. Tseng and colleagues re-ported on Medicare Part D plan coverage related to GI drugs, CV drugs, respiratory agents, antidepressants, blood glucose regulators, and analgesic classes; their findings reveal that the greatest coverage (85%-90% of Part D plans) was for CV agents.39 However, the authors
Few studies have examined the FEHBP or Medicare Part D coverage of therapeutic drug classes. More up-to-date studies are needed related to access to anticancer drugs and to Medicare coverage to address the current debate on whether Medicare provides sufficient coverage for anticancer drugs.

REGULATORY
56 l American Health & Drug Benefits l www.AHDBonline.com January/February 2013 l Vol 6, No 1
concluded that less than 50% of the drugs examined (34 of 75) were widely covered by Medicare Part D plans.39
Although mostly found in published reports, broad coverage of formulary drugs has also been shown within therapeutic classes in the FEHBP. A 2003 US Government Accountability Office (GAO) report shows that FEHBP enrollees generally have unrestricted access to prescrip-tion drugs.42 Furthermore, formularies are not considered to be overly restrictive, based on the study’s findings on most major therapeutic drug categories.42
As for coverage of brand versus generic drugs, a 2007 study by the Lewin Group reveals that Medicare Part D plans covered more of the 132 benchmark brand-name drugs (128, or 97%) compared with the FEHBP (125, or 95%).43 However, the researchers did not conduct any statistical analyses43; therefore, it is impossible to deter-mine any significant difference between the 2 groups. Tseng and colleagues found that Medicare Part D plans covered 90% of generic drugs, but they did not examine the FEHBP.39
The reason that a drug is included on a formulary can be complex. A 2010 GAO report on specialty drugs for the FEHBP and Medicare Part D examined the reasons why some drugs were included on the formulary and why others were not.44 The findings revealed that Medicare Part D plans considered limited ability to negotiate price concessions with manufacturers, low utilization for some drugs, and CMS’s US Pharmacopeia–guided formulary requirements were barriers to inclusion of drugs on for-mulary.44 The conclusions drawn from this report are noted with caution, given the unique nature and differ-ent set of issues surrounding specialty drugs.
Overall, the findings of the bivariate analysis in this present study revealed that the FEHBP provided broader drug coverage than the Medicare Part D program. Some of the results of the bivariate analysis disappeared in multivariate analysis, revealing only a small difference between the 2 programs and one that only persisted within specific therapeutic classes. This difference in findings using the 2 different analytical methods may be useful to various groups.
For example, consumers may be interested in the ac-tual number and the kind of drugs on their formulary, so they may find the t-test results useful. Other consumers may find copay and coinsurance to be important and may focus on regression results. Health plan providers may be more interested in how factors such as premium, copay, coinsurance, tier, and enrollment affect drug cov-erage as they make complex decisions on which drugs to include on their formulary.
LimitationsSeveral limitations should be considered in interpret-
ing the findings of this research. First, data were not available on the demographics of enrollees within each plan. Although factors such as age, income, sex, race, and employment status may affect the results, only the largest plans were used in this study, and clinical needs can be extrapolated from general populations.
Second, caution should be used in the interpretation of results that come from the cross-sectional nature of the data. Plans are subject to change over time. The data used in this research represent coverage in the year 2009. Therefore, these data may not capture the full impact of drug coverage in 2013.
Third, not all Medicare Part D and FEHBP plans were included in the study. Nevertheless, the analyses included the top 63% prescription drug plans in Medicare Part D and 70% of those in the FEHBP. This represents a considerable increase from previous studies, which only compared a maximum of 3 Medicare Part D and FEHBP prescription drug plans.40,43,45
ConclusionBy the year 2030, the United States is expected to
have 71 million persons aged ≥65 years.46 For the first time in history, the United States may have more elder-ly individuals than working individuals. Many projec-tions indicate that Medicare will not be able to deliver promised benefits to the next generation of retirees without making changes to the program.10
Policymakers and healthcare professionals are inter-ested in recommendations to address the anticipated needs of older persons. To avoid extreme increases in payroll taxes and other revenues or major cutbacks in services, Medicare must explore ways to change the healthcare system to achieve better value for the money. The experience of the FEHBP suggests a possible means of accomplishing this objective.
There are lessons here to be gleaned for both Medicare Part D and the FEHBP. Important areas for future research in the comparison of these 2 programs are the role of demographic factors in prescription drug cov-erage, the market behavior of prescription drug plans, the impact of increasing oral drugs for classes once ad-ministered parenterally (hence reduced costs), and health outcomes associated with drug coverage. n
AcknowledgmentThe author would like to thank Dr Ronald Ward for
his invaluable support and review of this manuscript.
Study FundingThis study was supported by funding from the PhRMA
Foundation through a predoctoral fellowship in health outcomes.
Medicare Part D and the FEHBP: Prescription Drug Coverage
57 www.AHDBonline.com l American Health & Drug Benefits lVol 6, No 1 l January/February 2013
Author Disclosure StatementDr Lovett has no conflicts of interest to report.
References1. Centers for Medicare & Medicaid Services. Office of the Actuary. National Health Statistics Group. National Health Care Expenditures Data. www.cms.gov/Research-Statistics-Data-and-Systems/Statistics-Trends-and-Reports/National HealthExpendData/downloads/tables.pdf. Accessed January 28, 2013. 2. Centers for Medicare & Medicaid Services. Office of the Actuary. National Health Statistics Group. www.cms.gov/Research-Statistics-Data-and-Systems/Statistics- Trends-and-Reports/NationalHealthExpendData/NationalHealthAccounts Historical.html. Accessed January 22, 2013. 3. 2010 Annual Report of the Boards of Trustees of the Federal Hospital Insurance and Federal Supplementary Medical Insurance Trust Funds. Washington, DC; August 5, 2010. www.cms.gov/Research-Statistics-Data-and-Systems/Statistics-Trends-and-Reports/ReportsTrustFunds/downloads/tr2010.pdf. Accessed January 13, 2013. 4. Henry J. Kaiser Family Foundation. Medicare chartpack: overview of Medicare Part D organizations, plans, and benefits by enrollment in 2006 and 2007. November 2007. www.kff.org/medicare/upload/7710.pdf. Accessed January 30, 2013. 5. 2009 Annual Report of the Boards of Trustees of the Federal Hospital Insurance and Federal Supplementary Medical Insurance Trust Fund. Washington, DC; May 12, 2009. www.cms.gov/Research-Statistics-Data-and-Systems/Statistics-Trends-and-Reports/ReportsTrustFunds/downloads/tr2009.pdf. Accessed January 28, 2013. 6. Francis W. Putting Medicare Consumers in Charge: Lessons from the FEHBP. 1st ed. Washington, DC: American Enterprise Institute Press; 2009.7. National Bipartisan Commission on the Future of Medicare. Building a better Medicare for today and tomorrow. March 16, 1999. http://medicare.commission.gov/medicare/bbmtt31599.html. Accessed June 5, 2009.8. Francis W. Using the federal employees’ model: nine tests for rational Medicare re-form. 2003. www.heritage.org/Research/Reports/2003/08/Using-the-Federal-Employees-Model-Nine-Tests-for-Rational-Medicare-Reform. Accessed January 9, 2009.9. Oberlander J. Through the looking glass: the politics of the Medicare Prescrip-tion Drug, Improvement, and Modernization Act. J Health Politics Policy Law. 2007; 32:187-219.10. Butler SM, Moffit RE. The FEHBP as a model for a new Medicare program. Health Aff (Millwood). 1995;14:47-61.11. Francis W. The FEHBP as a model for Medicare reform: separating fact from fic-tion. August 7, 2003. www.heritage.org/Research/Reports/2003/08/The-FEHBP-as-a-Model-for-Medicare-Reform-Separating-Fact-from-Fiction. Accessed January 9, 2009. 12. Hoff J. Medicare Private Contracting: Paternalism or Autonomy? Washington, DC: American Enterprise Institute Press; 1998.13. McBride T, Andrews C, Mueller K, Shambaugh-Miller M. An analysis of avail-ability of Medicare+Choice, commercial HMO, and FEHBP plans in rural areas: implications for Medicare reform. Rural Policy Brief. 2003;8:1-8. www.unmc.edu/ruprihealth/Pubs/PB2003-5.pdf. Accessed December 5, 2008.14. Francis W. The political economy of the Federal Employees Health Benefits Program. In Helms RB. Health Policy Reform: Competition and Controls. 1st ed. Washington, DC: American Enterprise Institute Press; 1993:269-303. 15. Peck B. Private Insurance Plans and Medicare: the Disappointing History. Public Citizen’s Congress Watch; 2003. www.citizen.org/documents/privatemedicare.pdf. Accessed January 28, 2013. 16. Moon M. Medicare, Modernization and FEHBP. March 20, 2002. www.urban.org/publications/900489.html. Accessed May 7, 2009.17. Oberlander J. Is premium support the right medicine for Medicare? Health Aff (Millwood). 2000;19:84-99.18. D’Angelo G, Moffit RE. Time to get serious (again) about Medicare reform. May 13, 2009. www.heritage.org/research/reports/2009/05/time-to-get-serious-again-about- medicare-reform#_ftn1. Accessed July 9, 2010.19. Cubanski J, Neuman P. Status report on Medicare Part D enrollment in 2006: anal-ysis of plan-specific market share and coverage. Health Aff (Millwood). 2007;26:w1-w12.20. Hoadley J, Hargrave E, Cubanski J, Neuman T. The Medicare Drug Benefit. An in-depth examination of formularies and other features of Medicare drug plans. Kaiser Family Foundation. 2006. www.kff.org/medicare/upload/7489.pdf. Accessed January 30, 2013.21. United States Pharmacopeial Convention. Medicare prescription drug benefit: summary of USP approach and methodology to the model guidelines version 4.0: drug categories and classes in Part D. February 4, 2008. www.usp.org/sites/default/files/usp_pdf/EN/healthcareProfessionals/modelguidelinesv4summaryofapproach.pdf. Accessed January 29, 2013.22. CVS Caremark. Blue Cross Blue Shield formulary: basic and standard versions. www.caremark.com/portal/asset/feprx_drug_list48.pdf. Accessed January 29, 2013.
23. Medco Health. 2012 Formulary Reference Guide. https://host1.medcohealth.com/art/corporate/medco_formularies.pdf. Accessed January 29, 2013.24. NALC Health Benefit Plan Formulary. January 2013. www.nalc.org/depart/hbp/news/Forms/Caremark/DrugList.pdf. Accessed January 29, 2013.25. Bartholow M. Top 200 prescription drugs of 2009. Pharmacy Times. www.pharmacy times.com/publications/issue/2010/May2010/RxFocusTopDrugs-0510. Accessed January 5, 2010. 26. Soni A. The top five therapeutic classes of outpatient prescription drugs ranked by total expense for adults age 18 and older in the U.S. civilian noninstitutionalized population, 2006. Statistical Brief #232. 2009. www.meps.ahrq.gov/mepsweb/data_files/publications/st232/stat232.pdf. Accessed March 11, 2009.27. Stevenson DG, Huskamp HA, Keating NL, et al. Medicare Part D and nursing home residents. J Am Geriatr Soc. 2007;55:1115-1125.28. Simoni-Wastila L, Shaffer T, Stuart B. A national comparison of prescription drug expenditures by Medicare beneficiaries living in the community and long-term care facility settings. February 15, 2007. http://aspe.hhs.gov/daltcp/reports/2007/ pdnatcom.pdf. Accessed March 8, 2009.29. Families USA. Enough to make you sick: prescription drug prices for the elderly. June 2001. Publication No. 01-103. http://familiesusa2.org/assets/pdfs/Enough-to-Make-You-Sick.pdf. Accessed March 11, 2009.30. Pontillo DC, Lang AJ, Stein MB. Management and treatment of anxiety disor-ders in the older patient. Clin Geriatr. 2002;10:38-49.31. Merck Manual of Geriatrics. Generalized anxiety disorder. 2010. www.merck manuals.com/professional/psychiatric_disorders/anxiety_disorders/generalized_anxiety_disorder.html. Accessed August 6, 2010. 32. Bambauer KZ, Sabin JE, Soumerai SB. The exclusion of benzodiazepine coverage in Medicare: simple steps for avoiding a public health crisis. Psychiatr Serv. 2005;56: 1143-1146.33. Briesacher BA, Soumerai SB, Field TS, et al. Medicare Part D’s exclusion of ben-zodiazepines and fracture risk in nursing homes. Arch Intern Med. 2010;170:693-698. 34. Wagner AK, Ross-Degnan D, Gurwitz JH, et al. Effect of New York State regula-tory action on benzodiazepine prescribing and hip fracture rates. Ann Intern Med. 2007; 146:96-103.35. Yang HW, Simoni-Wastila L, Zuckerman IH, Stuart B. Benzodiazepine use and expenditures for Medicare beneficiaries and the implications of Medicare Part D exclusions. Psychiatr Serv. 2008;59:384-391.36. Gorman B, Gorman D, Newell P; United Hospital Fund. Cost sharing in New York’s health insurance market. 2010. http://uhfnyc.org/assets/795. Accessed January 30, 2013.37. Murphy L, Sadownick S, Ford C, et al. Cost sharing for cancer patients in Medicare, 2009. December 2008. www.avalerehealth.net/research/docs/ACS_CAN_ Cost_Sharing_Analysis.pdf. Accessed January 30, 2013. 38. Huskamp HA, Deverka PA, Epstein AM, et al. The effect of incentive-based formularies on prescription-drug utilization and spending. N Engl J Med. 2003;349: 2224-2232. 39. Tseng CW, Mangione CM, Brook RH, et al. Identifying widely covered drugs and drug coverage variation among Medicare Part D formularies. JAMA. 2007;297: 2596-2602.40. Bowman J, Rousseau A, Silk D, Harrison C. Access to cancer drugs in Medicare Part D: formulary placement and beneficiary cost sharing in 2006. Health Aff (Millwood). 2006;25:1240-1248. 41. Gellad WF, Huskamp HA, Phillips KA, et al. Angiotensin receptor blockers on the formularies of Medicare drug plans. J Gen Intern Med. 2007;22:1172-1175. 42. US Government Accountability Office. Federal Employees’ Health Benefits: ef-fects of using pharmacy benefit managers on health plans, enrollees, and pharmacies. January 2003. GAO-03-196. www.gao.gov/new.items/d03196.pdf. Accessed January 28, 2013. 43. The Lewin Group, Inc. Comparison of VA national formulary and formularies of the highest enrollment plans in Medicare Part D and the Federal Employee Health Benefit Program. December 2008 (data compiled in 2007). www.lewin.com/~/media/Lewin/Site_Sections/Publications/3987.pdf. Accessed January 28, 2013. 44. US Government Accountability Office. Medicare Part D: spending, beneficiary cost sharing, and cost-containment efforts for high-cost drugs eligible for a specialty tier. January 2010. GAO-10-242. www.gao.gov/new.items/d10242.pdf. Accessed January 28, 2013. 45. Yamamoto D, Neuman T, Strollo MK. How does the benefit value of Medicare compare to the benefit value of typical large employer plans? The Henry J. Kaiser Family Foundation; 2008; Publication #7768. www.kff.org/medicare/upload/7768.pdf. Accessed January 28, 2013. 46. Centers for Disease Control and Prevention, Merck Company Foundation. The state of aging and health in America 2007. Whitehouse Station, NJ: The Merck Company Foundation; 2007. www.cdc.gov/aging/pdf/saha_2007.pdf. Accessed June 8, 2009.
Stakeholder perspective on page 58
REGULATORY
58 l American Health & Drug Benefits l www.AHDBonline.com January/February 2013 l Vol 6, No 1
Medicare Part D and the Federal Employees Health Benefits ProgramBy J. Warren salmon, PhDProfessor of Health Policy and Administration, School of Public Health, University of Illinois at Chicago
PoLiCyMAKeRs: Policy analyses of in-place federal programs tend to wane over time, and it seems that ongo-ing policymaking often fails to sufficiently regard histori-cal precedents. At first, interest is high and some funding may be available for research, but, even when they are known to be “successful,” programs are often not explored to extract key learning, as we may likely see with aspects of the Affordable Care Act (ACA). Reflective policy-making that is based on health services research is most important in today’s healthcare system.
In this article on Medicare Part D and the Federal Employees Health Benefits Program (FEHBP) compari-son of prescription drug coverage, Dr Lovett probes drug coverage issues and attempts to examine cost-sharing. By design, both programs rely on the marketplace with loose overarching regulatory structures. Over the years, the FEHBP has been known to be cost-saving for quality care, with high employee acceptance. Its functionality, nevertheless, extends beyond mere drug policies, because of the similar character of its participating plans that bid for contracts. Medicare Part D plans share a heterogene-ity, and it has taken a few years to become ready for health services research to assess the program’s effective-ness and patient outcomes.
HeALtH PLAns/ReseARCHeRs: This article by Dr Lovett nicely highlights the programmatic differ-ences in plan coverage, enrollment, premiums, copay-ments and coinsurance, tiers, and therapeutic classes. Yet, we should be mindful that the served populations differ dramatically (families of federal employees vs the much more vulnerable aged and disabled). Further clini-cal studies on benefit design would serve to capture what works best in the ongoing marketplace tinkering with
drug benefits that private and public payers are pursuing.Such a direction may yield wisdom in formulating better
policies for health insurance exchanges. Accountable care organizations (ACOs) could become experimental labora-tories to test benefit designs for differing populations across the United States and across disease states. Pharmacy and Therapeutic Committees may be natural settings for initi-ating studies to address puzzling cost and care issues within formularies. Evidence-based investigations should be aimed at being relevant to ongoing public policy implementation.
It must be noted that the FEHBP provides more than an insurance mechanism; it is embedded within delivery of care systems, as hopes for the ACOs are also intended. Medicare Part D and the new drug benefit designs under the ACA, along with Medicaid programs, should be carefully scrutinized and critiqued as our nation more diligently embarks on the implementation of health re-form. Organized systems of care delivery have proved to be superior for population-based health, as better Medicare Advantage plans can demonstrate in learning from practice.
The FEHBP may be a possible model for addressing some drug coverage for savings in Medicare, but these 2 government programs are both complex and still differ greatly. The study’s focus on varying uses in drug classi-fications and coverage point to the need for more de-tailed analyses in such investigations.
Although issues remain on the suitability of FEHBP-type approaches (eg, a more costly vulnerable patient group) for Medicare reform, this study goes a long way to demonstrate that prudent means of reorganizing care through health services research are superior to political fiat for cost-cutting. n
STAkEHoLDEr PErSPECTIvE

FREEContinuingEducation
Registered participants will receive e-mail announcements as new educational activities become available.
To use 2D barcodes, download the ScanLife app:• Text “scan” to 43588• Go to www.getscanlife.com
on your smartphone’s web browser, and select “Download”
• Visit the app store for your smartphone
Scan Here to Register.
REGISTER TODAY AT www.COEXM.com
InteractiveOnline PresentationsNewsletters Live Symposia
Local Meetings
MULTIPLE MYELOMABREAST CANCER
LUNG CANCERLYMPHOMAS
CINVBIOMARKERS
MYELOFIBROSISSUPPORTIVE CARE
PATIENT NAVIGATIONMULTIPLE SCLEROSIS
CUTANEOUS MALIGNANCIESVALUE-BASED CANCER CARE
PERSONALIZED CANCER CARE
Current activities atwww.COEXM.com include:
Pushing Your Limits
COEKsize71112CE©iStockphoto.com/altaykaya
COEAsizeCE_fish_71112_House Ad 7/11/12 11:47 AM Page 1

© 2012 Novo Nordisk Printed in the U.S.A. 0312-00007951-1 March 2012
Diabetes care is complex and requires that many issues, beyond glycemic control, be addressed.1 One issue is medication adherence.2 Medication adherence may prevent hospitalizations for diabetes complications.2
Another major issue is hypoglycemia. Not only is it a barrier to successful diabetes management,1 but it can also be very costly3:
• ER-to-inpatient costs: $10,3623 • ER plus outpatient costs: $9863 • Hospital admission costs: $7,3173
However, you may not be informed of all your members’ hypoglycemic events. In a multicenter, retrospective medical record review of 3 academic emergency departments, 83% of hypoglycemia visits, often excluded in prior hypoglycemia analyses, were coded as “diabetes with other specifi ed manifestations,” while others may not be reported at all.4
For these reasons, diabetes management costs may be even greater than you know.
References: 1. American Diabetes Association®. Standards of medical care in diabetes—2012. Diabetes Care. 2012;35(suppl 1):S11-S63. 2. Healthcare Cost and Utilization Project. Economic and Health Costs of Diabetes. Rockville, MD: Agency for Healthcare Research and Quality; 2005. 3. Curkendall SM, Zhang B, Oh KS, Williams SA, Pollack MF, Graham J. Incidence and cost of hypoglycemia among patients with type 2 diabetes in the United States: analysis of a health insurance database. JCOM. 2011;18(10):455-462. 4. Ginde AA, Blanc PG, Lieberman RM, Camargo CA Jr. Validation of ICD-9-CM coding algorithm for improved identifi cation of hypoglycemia visits. BMC Endocr Disord [series online]. April 1, 2008;doc 8:4.
That’s why Novo Nordisk is committed to providing your organization with a broad range of solutions in glycemic management.
For more information about Novo Nordisk, please visit novonordisk-us.com.
Ever feel as if the costs of diabetesmanagement just keep coming around?
S:7.625”S:10.375”
T:8.125”T:10.875”
B:8.375”B:11.125”
NMMS3M0358_E_Non_Branded_Wheel_r1.indd 1 2/8/13 4:35 PM