January through March 2012 - henkel.com · 1 Calculated on the basis of units of 1,000 euros;...
32
Q1 Quarterly financial report January through March 2012
Transcript of January through March 2012 - henkel.com · 1 Calculated on the basis of units of 1,000 euros;...
Q1 Quarterly financial report January through March 2012
Contents03 Highlights first quarter 201204 Major events04 Share performance05 Report first quarter 2012 05 Business performance first quarter 2012 07 Comparison between actual business perfor-
mance and guidance 08 Regional performance 10 Business sector performance 10 Laundry & Home Care 12 Cosmetics/Toiletries 14 Adhesive Technologies16 Financial report first quarter 2012 16 Underlying economic conditions 16 Sectors of importance for Henkel 16 Effects on Henkel
17 Results of operations 17 Net assets 18 Financial position 19 Capital expenditures 19 Acquisitions and divestments 19 Employees 19 Research and development20 Outlook21 Subsequent events22 Interim consolidated financial statements
first quarter 2012 27 Selected explanatory notes30 Independent review report31 Report of the Audit Committee of the
Supervisory Board32 Credits / Financial calendar
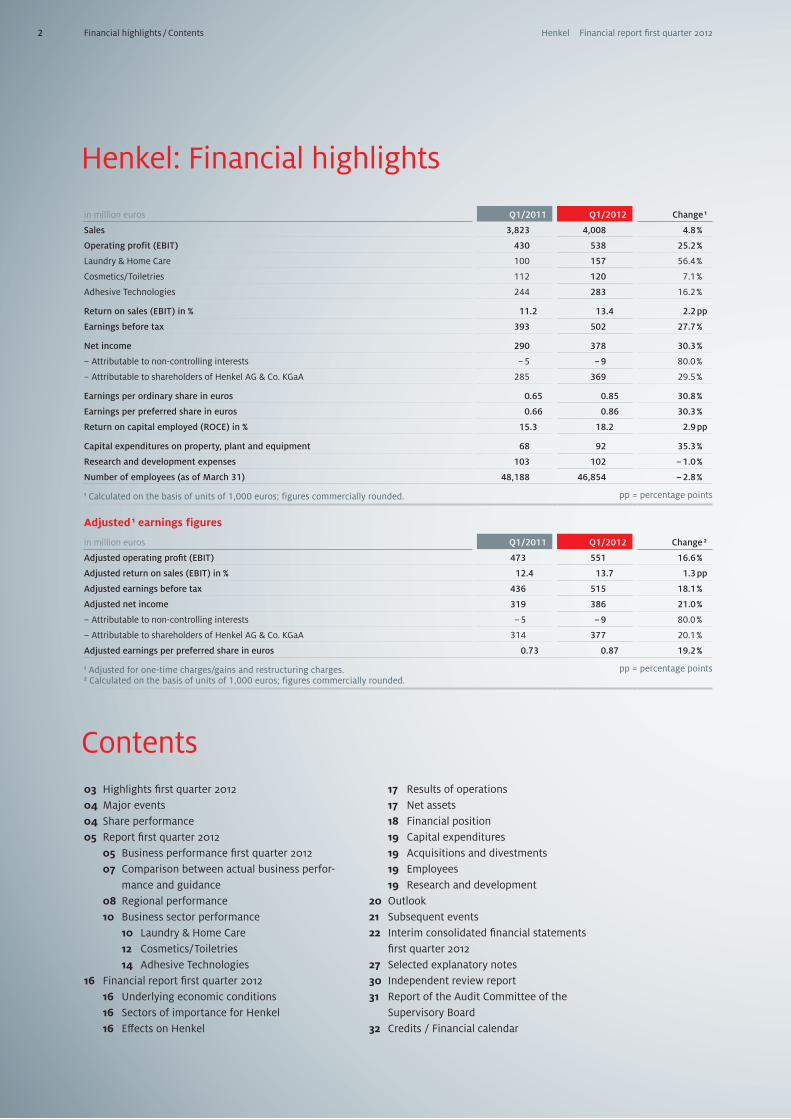
in million euros Q1/2011 Q1/2012 Change 1
Sales 3,823 4,008 4.8 %
Operating profit (EBIT) 430 538 25.2 %
Laundry & Home Care 100 157 56.4 %
Cosmetics/Toiletries 112 120 7.1 %
Adhesive Technologies 244 283 16.2 %
Return on sales (EBIT) in % 11.2 13.4 2.2 pp
Earnings before tax 393 502 27.7 %
Net income 290 378 30.3 %
– Attributable to non-controlling interests – 5 – 9 80.0 %
– Attributable to shareholders of Henkel AG & Co. KGaA 285 369 29.5 %
Earnings per ordinary share in euros 0.65 0.85 30.8 %
Earnings per preferred share in euros 0.66 0.86 30.3 %
Return on capital employed (ROCE) in % 15.3 18.2 2.9 pp
Capital expenditures on property, plant and equipment 68 92 35.3 %
Research and development expenses 103 102 – 1.0 %
Number of employees (as of March 31) 48,188 46,854 – 2.8 %
1 Calculated on the basis of units of 1,000 euros; figures commercially rounded. pp = percentage points
Adjusted 1 earnings figures
in million euros Q1/2011 Q1/2012 Change 2
Adjusted operating profit (EBIT) 473 551 16.6 %
Adjusted return on sales (EBIT) in % 12.4 13.7 1.3 pp
Adjusted earnings before tax 436 515 18.1 %
Adjusted net income 319 386 21.0 %
– Attributable to non-controlling interests – 5 – 9 80.0 %
– Attributable to shareholders of Henkel AG & Co. KGaA 314 377 20.1 %
Adjusted earnings per preferred share in euros 0.73 0.87 19.2 %
1 Adjusted for one-time charges/gains and restructuring charges. 2 Calculated on the basis of units of 1,000 euros; figures commercially rounded.
pp = percentage points
Henkel: Financial highlights
Financial highlights / Contents2 Henkel Financial report first quarter 2012
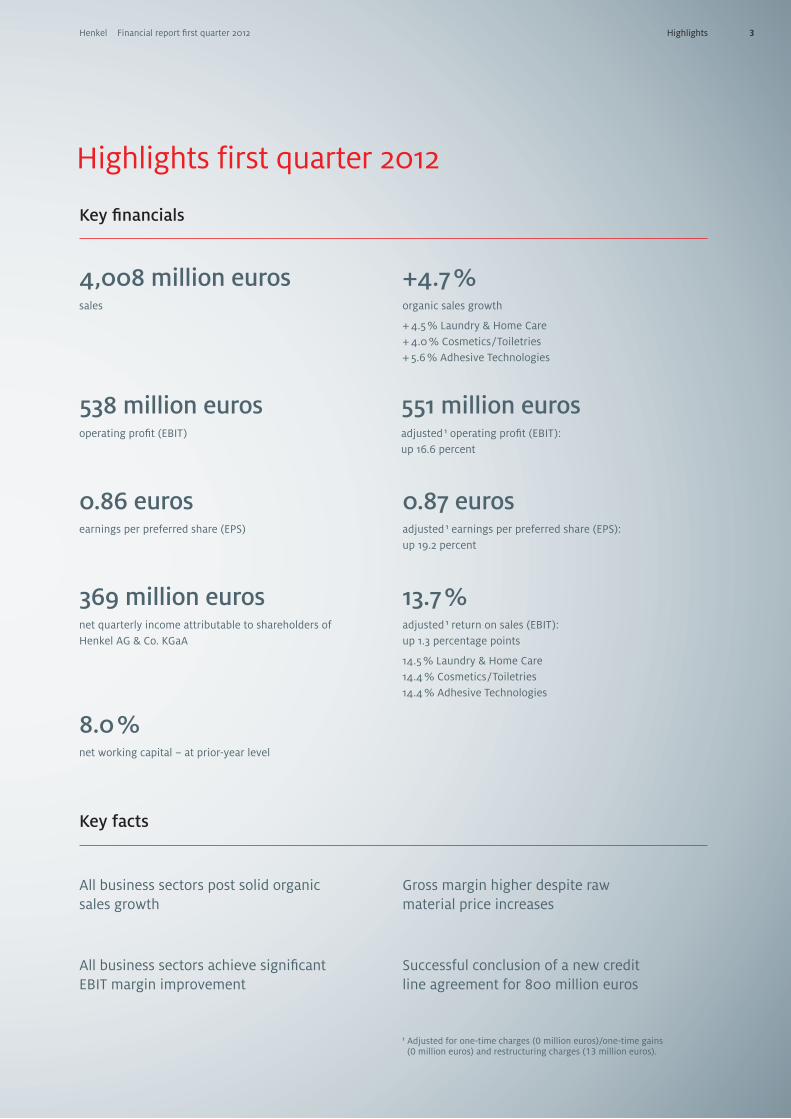
4,008 million euros sales
538 million eurosoperating profit (EBIT)
0.86 euros earnings per preferred share (EPS)
369 million euros net quarterly income attributable to shareholders of Henkel AG & Co. KGaA
+4.7 % organic sales growth + 4.5 % Laundry & Home Care+ 4.0 % Cosmetics /Toiletries+ 5.6 % Adhesive Technologies
551 million euros adjusted 1 operating profit (EBIT): up 16.6 percent
0.87 euros adjusted 1 earnings per preferred share (EPS): up 19.2 percent
13.7 %adjusted 1 return on sales (EBIT): up 1.3 percentage points 14.5 % Laundry & Home Care14.4 % Cosmetics /Toiletries14.4 % Adhesive Technologies
8.0 %net working capital – at prior-year level
Key financials
Key facts
Highlights first quarter 2012
All business sectors post solid organic sales growth
Gross margin higher despite raw material price increases
All business sectors achieve significant EBIT margin improvement
Successful conclusion of a new credit line agreement for 800 million euros
1 Adjusted for one-time charges (0 million euros)/one-time gains (0 million euros) and restructuring charges (13 million euros).
Highlights 3Henkel Financial report first quarter 2012
55
50
45
Major events Share performance
You will find our annual reports, our quarterly reports, the latest data on Henkel’s shares and bonds, and also news, financial reports and presentations relating to the company on our Investor Relations website:
www.henkel.com/ir
On February 23, 2012, the company announced that the governing bodies of Henkel AG & Co. KGaA had extended the mandates of both the Chief Executive Officer, Kasper Rorsted, and the Executive Vice President Cosmetics/Toiletries, Hans Van Bylen, for another five-year term re-spectively.
On March 28, 2012, Henkel signed a new 800 mil-lion euros revolving credit facility. The facility with a tenor of 5 years and two additional one-year extension options serves as a backup for Henkel’s commercial paper programs, securing flexible financing for the company.
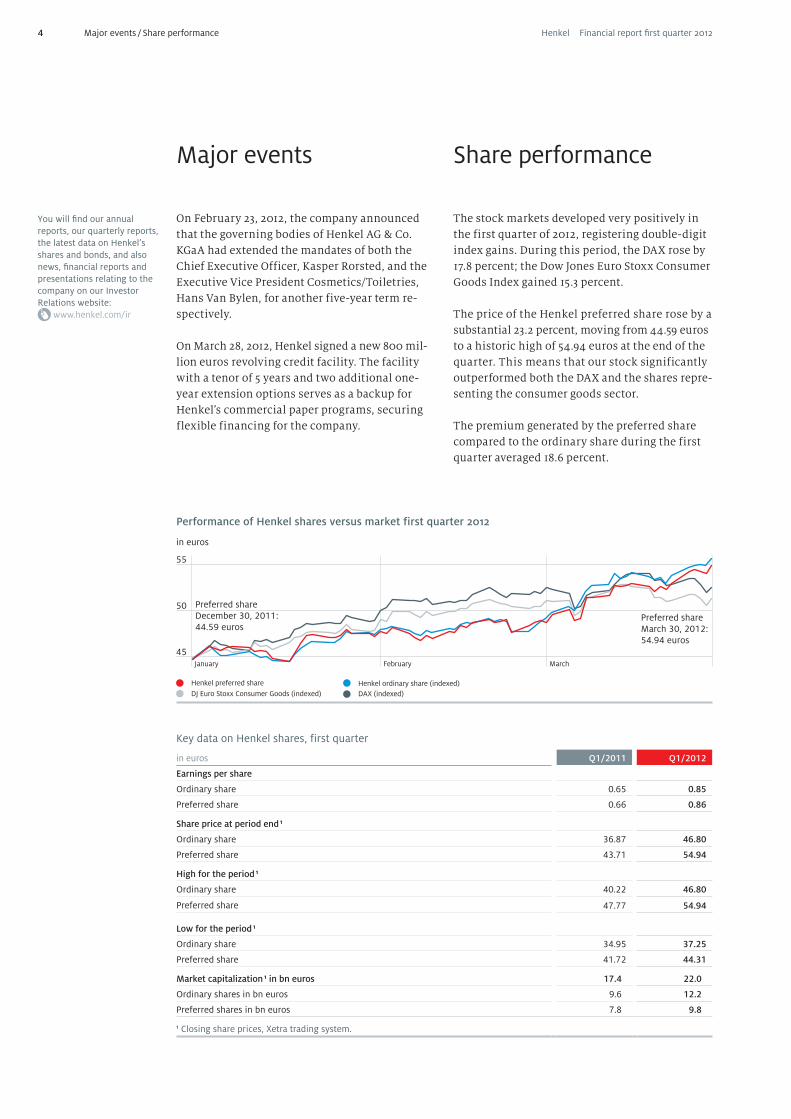
The stock markets developed very positively in the first quarter of 2012, registering double-digit index gains. During this period, the DAX rose by 17.8 percent; the Dow Jones Euro Stoxx Consumer Goods Index gained 15.3 percent.
The price of the Henkel preferred share rose by a substantial 23.2 percent, moving from 44.59 euros to a historic high of 54.94 euros at the end of the quarter. This means that our stock significantly outperformed both the DAX and the shares repre-senting the consumer goods sector.
The premium generated by the preferred share compared to the ordinary share during the first quarter averaged 18.6 percent.
Key data on Henkel shares, first quarter
in euros Q1/2011 Q1/2012
Earnings per share
Ordinary share 0.65 0.85
Preferred share 0.66 0.86
Share price at period end 1
Ordinary share 36.87 46.80
Preferred share 43.71 54.94
High for the period 1
Ordinary share 40.22 46.80
Preferred share 47.77 54.94
Low for the period 1
Ordinary share 34.95 37.25
Preferred share 41.72 44.31
Market capitalization 1 in bn euros 17.4 22.0
Ordinary shares in bn euros 9.6 12.2
Preferred shares in bn euros 7.8 9.8
1 Closing share prices, Xetra trading system.
Major events / Share performance
Performance of Henkel shares versus market first quarter 2012 in euros
Preferred share December 30, 2011: 44.59 euros
Preferred share March 30, 2012: 54.94 euros
Henkel preferred share Henkel ordinary share (indexed)DJ Euro Stoxx Consumer Goods (indexed) DAX (indexed)
January February March
4 Henkel Financial report first quarter 2012
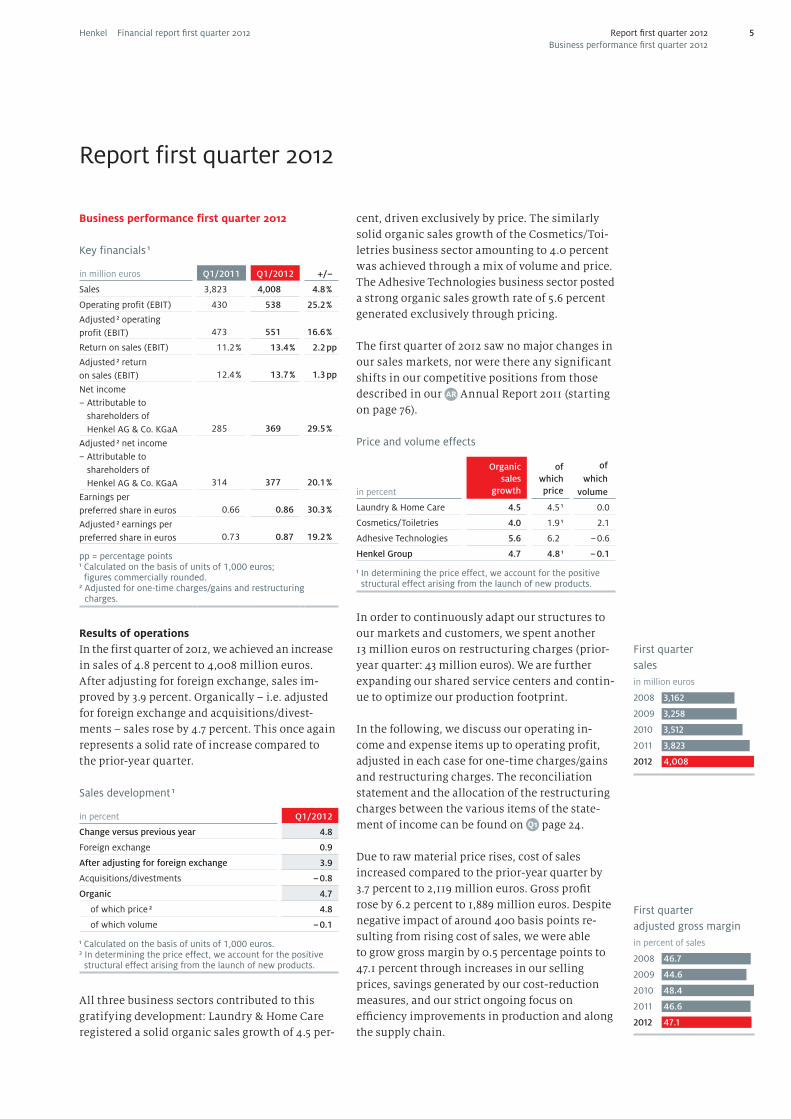
First quarter adjusted gross marginin percent of sales
2008 46.7
2009 44.6
2010 48.4
2011 46.6
2012 47.1
Report first quarter 2012
Business performance first quarter 2012
Key financials 1
in million euros Q1/2011 Q1/2012 +/–
Sales 3,823 4,008 4.8 %
Operating profit (EBIT) 430 538 25.2 %
Adjusted 2 operating profit (EBIT) 473 551 16.6 %
Return on sales (EBIT) 11.2 % 13.4 % 2.2 pp
Adjusted 2 return on sales (EBIT) 12.4 % 13.7 % 1.3 pp
Net income – Attributable to
shareholders of Henkel AG & Co. KGaA 285 369 29.5 %
Adjusted 2 net income – Attributable to
shareholders of Henkel AG & Co. KGaA 314 377 20.1 %
Earnings per preferred share in euros 0.66 0.86 30.3 %
Adjusted 2 earnings per preferred share in euros 0.73 0.87 19.2 %
pp = percentage points1 Calculated on the basis of units of 1,000 euros; figures commercially rounded.
2 Adjusted for one-time charges/gains and restructuring charges.
Results of operationsIn the first quarter of 2012, we achieved an increase in sales of 4.8 percent to 4,008 million euros. After adjusting for foreign exchange, sales im-proved by 3.9 percent. Organically – i.e. adjusted for foreign exchange and acquisitions/divest-ments – sales rose by 4.7 percent. This once again represents a solid rate of increase compared to the prior-year quarter.
Sales development 1
in percent Q1/2012
Change versus previous year 4.8
Foreign exchange 0.9
After adjusting for foreign exchange 3.9
Acquisitions/divestments – 0.8
Organic 4.7
of which price 2 4.8
of which volume – 0.1
1 Calculated on the basis of units of 1,000 euros.2 In determining the price effect, we account for the positive structural effect arising from the launch of new products.
All three business sectors contributed to this gratifying development: Laundry & Home Care registered a solid organic sales growth of 4.5 per-
cent, driven exclusively by price. The similarly solid organic sales growth of the Cosmetics/Toi-letries business sector amounting to 4.0 percent was achieved through a mix of volume and price. The Adhesive Technologies business sector posted a strong organic sales growth rate of 5.6 percent generated exclusively through pricing.
The first quarter of 2012 saw no major changes in our sales markets, nor were there any significant shifts in our competitive positions from those described in our Annual Report 2011 (starting on page 76).
Price and volume effects
in percent
Organic sales
growth
of which price
of which
volume
Laundry & Home Care 4.5 4.5 1 0.0
Cosmetics/Toiletries 4.0 1.9 1 2.1
Adhesive Technologies 5.6 6.2 – 0.6
Henkel Group 4.7 4.8 1 – 0.1
1 In determining the price effect, we account for the positive structural effect arising from the launch of new products.
In order to continuously adapt our structures to our markets and customers, we spent another 13 million euros on restructuring charges (prior-year quarter: 43 million euros). We are further expanding our shared service centers and contin-ue to optimize our production footprint.
In the following, we discuss our operating in-come and expense items up to operating profit, adjusted in each case for one-time charges/gains and restructuring charges. The reconciliation statement and the allocation of the restructuring charges between the various items of the state-ment of income can be found on page 24.
Due to raw material price rises, cost of sales increased compared to the prior-year quarter by 3.7 percent to 2,119 million euros. Gross profit rose by 6.2 percent to 1,889 million euros. Despite negative impact of around 400 basis points re-sulting from rising cost of sales, we were able to grow gross margin by 0.5 percentage points to 47.1 percent through increases in our selling prices, savings generated by our cost-reduction measures, and our strict ongoing focus on efficiency improvements in production and along the supply chain.
First quarter salesin million euros
2008 3,162
2009 3,258
2010 3,512
2011 3,823
2012 4,008
Report first quarter 2012Business performance first quarter 2012
5Henkel Financial report first quarter 2012
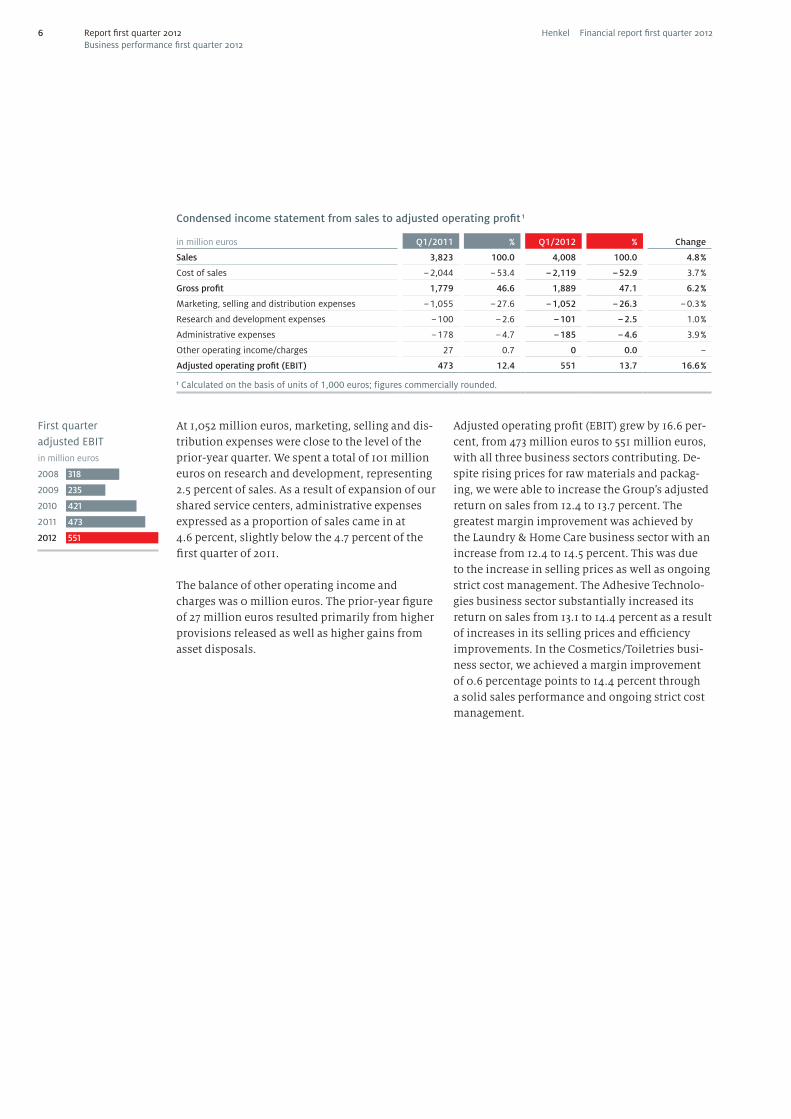
First quarter adjusted EBITin million euros
2008 318
2009 235
2010 421
2011 473
2012 551
At 1,052 million euros, marketing, selling and dis-tribution expenses were close to the level of the prior-year quarter. We spent a total of 101 million euros on research and development, representing 2.5 percent of sales. As a result of expansion of our shared service centers, administrative expenses expressed as a proportion of sales came in at 4.6 percent, slightly below the 4.7 percent of the first quarter of 2011.
The balance of other operating income and charges was 0 million euros. The prior-year figure of 27 million euros resulted primarily from higher provisions released as well as higher gains from asset disposals.
Adjusted operating profit (EBIT) grew by 16.6 per-cent, from 473 million euros to 551 million euros, with all three business sectors contributing. De-spite rising prices for raw materials and packag-ing, we were able to increase the Group’s adjusted return on sales from 12.4 to 13.7 percent. The greatest margin improvement was achieved by the Laundry & Home Care business sector with an increase from 12.4 to 14.5 percent. This was due to the increase in selling prices as well as ongoing strict cost management. The Adhesive Technolo-gies business sector substantially increased its return on sales from 13.1 to 14.4 percent as a result of increases in its selling prices and efficiency improvements. In the Cosmetics/Toiletries busi-ness sector, we achieved a margin improvement of 0.6 percentage points to 14.4 percent through a solid sales performance and ongoing strict cost management.
Condensed income statement from sales to adjusted operating profit 1
in million euros Q1/2011 % Q1/2012 % Change
Sales 3,823 100.0 4,008 100.0 4.8 %
Cost of sales – 2,044 – 53.4 – 2,119 – 52.9 3.7 %
Gross profit 1,779 46.6 1,889 47.1 6.2 %
Marketing, selling and distribution expenses – 1,055 – 27.6 – 1,052 – 26.3 – 0.3 %
Research and development expenses – 100 – 2.6 – 101 – 2.5 1.0 %
Administrative expenses – 178 – 4.7 – 185 – 4.6 3.9 %
Other operating income/charges 27 0.7 0 0.0 –
Adjusted operating profit (EBIT) 473 12.4 551 13.7 16.6 %
1 Calculated on the basis of units of 1,000 euros; figures commercially rounded.
Report first quarter 2012Business performance first quarter 2012
6 Henkel Financial report first quarter 2012
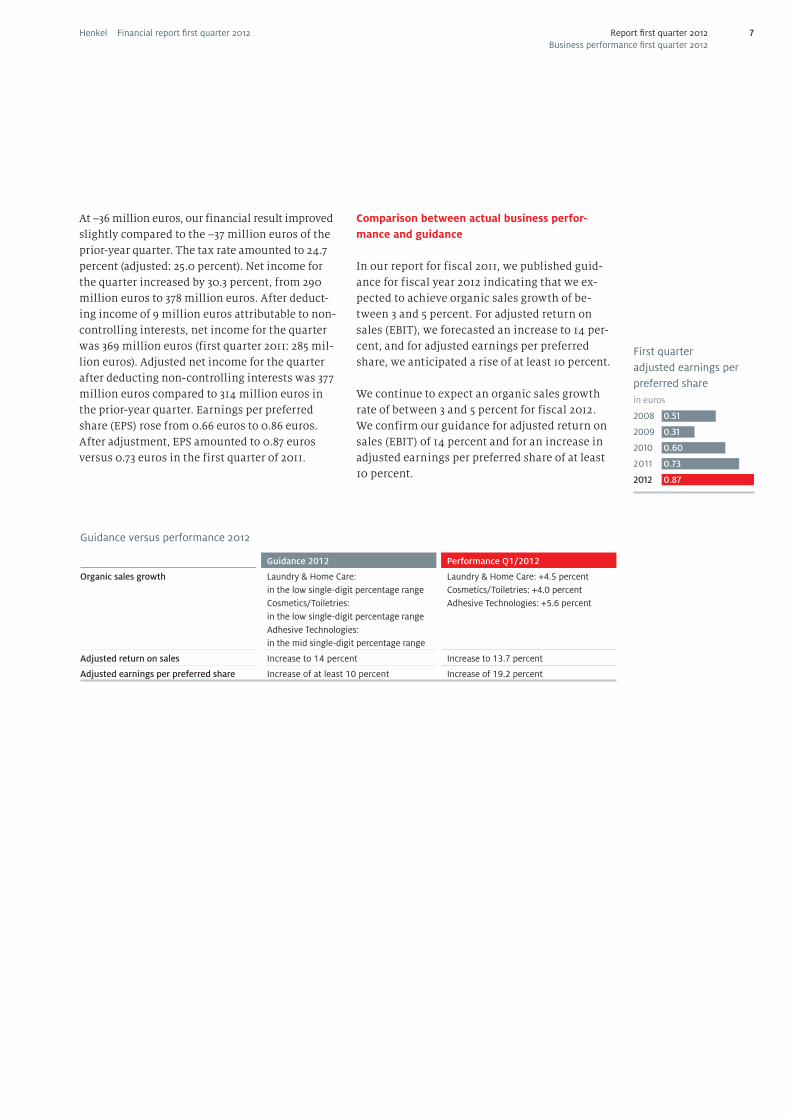
First quarter adjusted earnings per preferred sharein euros
2008 0.51
2009 0.31
2010 0.60
2011 0.73
2012 0.87
Report first quarter 2012Business performance first quarter 2012
Guidance versus performance 2012
Guidance 2012 Performance Q1/2012
Organic sales growth Laundry & Home Care: in the low single-digit percentage rangeCosmetics/Toiletries:in the low single-digit percentage rangeAdhesive Technologies:in the mid single-digit percentage range
Laundry & Home Care: +4.5 percentCosmetics/Toiletries: +4.0 percentAdhesive Technologies: +5.6 percent
Adjusted return on sales Increase to 14 percent Increase to 13.7 percent
Adjusted earnings per preferred share Increase of at least 10 percent Increase of 19.2 percent
At –36 million euros, our financial result improved slightly compared to the –37 million euros of the prior-year quarter. The tax rate amounted to 24.7 percent (adjusted: 25.0 percent). Net income for the quarter increased by 30.3 percent, from 290 million euros to 378 million euros. After deduct-ing income of 9 million euros attributable to non-controlling interests, net income for the quarter was 369 million euros (first quarter 2011: 285 mil-lion euros). Adjusted net income for the quarter after deducting non-controlling interests was 377 million euros compared to 314 million euros in the prior-year quarter. Earnings per preferred share (EPS) rose from 0.66 euros to 0.86 euros. After adjustment, EPS amounted to 0.87 euros versus 0.73 euros in the first quarter of 2011.
Comparison between actual business perfor-mance and guidance
In our report for fiscal 2011, we published guid-ance for fiscal year 2012 indicating that we ex-pected to achieve organic sales growth of be-tween 3 and 5 percent. For adjusted return on sales (EBIT), we forecasted an increase to 14 per-cent, and for adjusted earnings per preferred share, we anticipated a rise of at least 10 percent.
We continue to expect an organic sales growth rate of between 3 and 5 percent for fiscal 2012. We confirm our guidance for adjusted return on sales (EBIT) of 14 percent and for an increase in adjusted earnings per preferred share of at least 10 percent.
7Henkel Financial report first quarter 2012
Regional performance
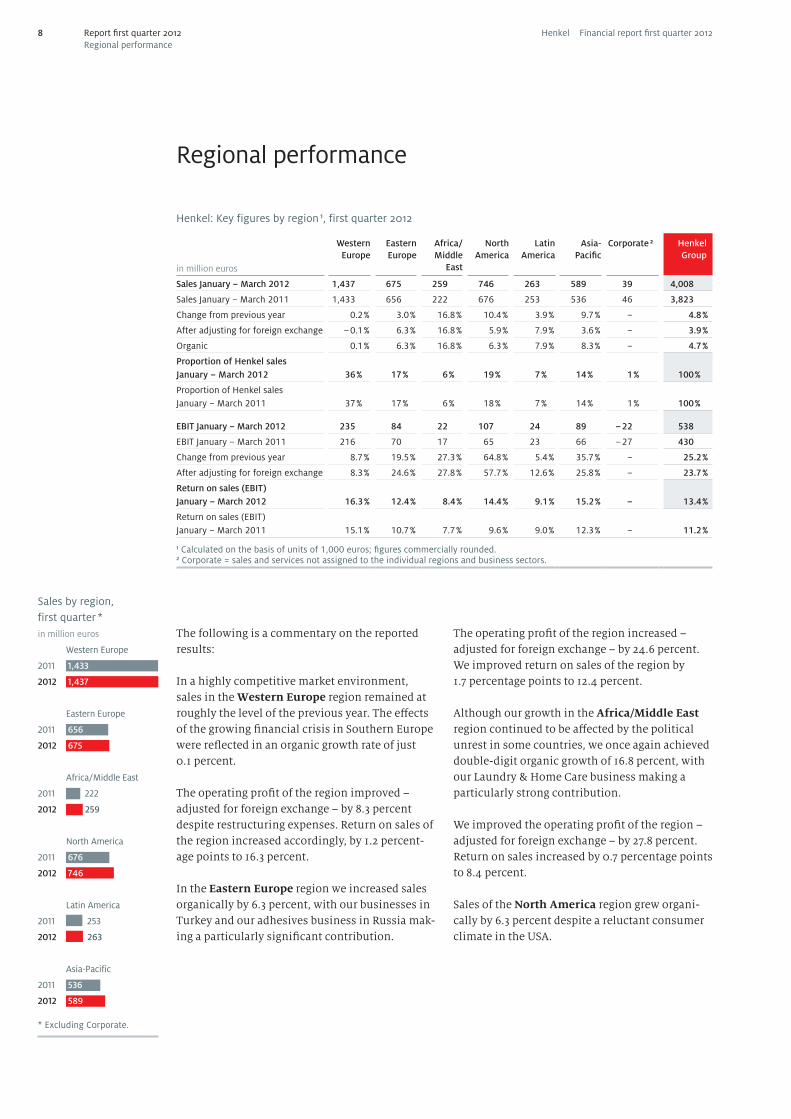
Henkel: Key figures by region 1, first quarter 2012
in million euros
WesternEurope
Eastern Europe
Africa/ Middle
East
NorthAmerica
LatinAmerica
Asia- Pacific
Corporate 2
HenkelGroup
Sales January – March 2012 1,437 675 259 746 263 589 39 4,008
Sales January – March 2011 1,433 656 222 676 253 536 46 3,823
Change from previous year 0.2 % 3.0 % 16.8 % 10.4 % 3.9 % 9.7 % – 4.8 %
After adjusting for foreign exchange – 0.1 % 6.3 % 16.8 % 5.9 % 7.9 % 3.6 % – 3.9 %
Organic 0.1 % 6.3 % 16.8 % 6.3 % 7.9 % 8.3 % – 4.7 %
Proportion of Henkel sales January – March 2012 36 % 17 % 6 % 19 % 7 % 14 % 1 % 100 %
Proportion of Henkel sales January – March 2011 37 % 17 % 6 % 18 % 7 % 14 % 1 % 100 %
EBIT January – March 2012 235 84 22 107 24 89 – 22 538
EBIT January – March 2011 216 70 17 65 23 66 – 27 430
Change from previous year 8.7 % 19.5 % 27.3 % 64.8 % 5.4 % 35.7 % – 25.2 %
After adjusting for foreign exchange 8.3 % 24.6 % 27.8 % 57.7 % 12.6 % 25.8 % – 23.7 %
Return on sales (EBIT) January – March 2012 16.3 % 12.4 % 8.4 % 14.4 % 9.1 % 15.2 % – 13.4 %
Return on sales (EBIT) January – March 2011 15.1 % 10.7 % 7.7 % 9.6 % 9.0 % 12.3 % – 11.2 %
1 Calculated on the basis of units of 1,000 euros; figures commercially rounded.2 Corporate = sales and services not assigned to the individual regions and business sectors.
The following is a commentary on the reported results:
In a highly competitive market environment, sales in the Western Europe region remained at roughly the level of the previous year. The effects of the growing financial crisis in Southern Europe were reflected in an organic growth rate of just 0.1 percent.
The operating profit of the region improved – adjusted for foreign exchange – by 8.3 percent despite restructuring expenses. Return on sales of the region increased accordingly, by 1.2 percent-age points to 16.3 percent.
In the Eastern Europe region we increased sales organically by 6.3 percent, with our businesses in Turkey and our adhesives business in Russia mak-ing a particularly significant contribution.
The operating profit of the region increased – adjusted for foreign exchange – by 24.6 percent. We improved return on sales of the region by 1.7 percentage points to 12.4 percent.
Although our growth in the Africa/Middle East region continued to be affected by the political unrest in some countries, we once again achieved double-digit organic growth of 16.8 percent, with our Laundry & Home Care business making a particularly strong contribution.
We improved the operating profit of the region – adjusted for foreign exchange – by 27.8 percent. Return on sales increased by 0.7 percentage points to 8.4 percent.
Sales of the North America region grew organi-cally by 6.3 percent despite a reluctant consumer climate in the USA.
Sales by region, first quarter *in million euros
Western Europe
2011 1,433
2012 1,437
Eastern Europe
2011 656
2012 675
Africa/Middle East
2011 222
2012 259
North America
2011 676
2012 746
Latin America
2011 253
2012 263
Asia-Pacific
2011 536
2012 589 * Excluding Corporate.
Report first quarter 2012Regional performance
8 Henkel Financial report first quarter 2012
We were able to increase the operating profit of the region – adjusted for foreign exchange – by 57.7 percent. Return on sales of the region increased significantly, from 9.6 percent in the prior-year quarter to 14.4 percent.
We increased organic sales in the Latin America region by 7.9 percent. Our business development in Mexico made a particularly important contri-bution to this improvement.
We increased operating profit – adjusted for for-eign exchange – by 12.6 percent. Return on sales of the region improved slightly, by 0.1 percentage points to 9.1 percent.
With organic growth of 8.3 percent, the Asia-Pacific region continued to show very strong development, supported in particular by growth in China and India.
Operating profit increased – adjusted for foreign exchange – by 25.8 percent. Return on sales im-proved correspondingly, by 2.9 percentage points to 15.2 percent.
Sales growth was again given a particular boost by our performance in the emerging markets of Eastern Europe, Africa/Middle East, Latin America and Asia (excluding Japan). Here we were able to increase sales by 6.7 percent to 1,639 million euros. The emerging markets thus accounted for 41 percent of Group sales (first quarter 2011: 40 percent). Organic growth amounted to 8.7 percent, supported in particular by the business sectors Adhesive Technologies and Laundry & Home Care.
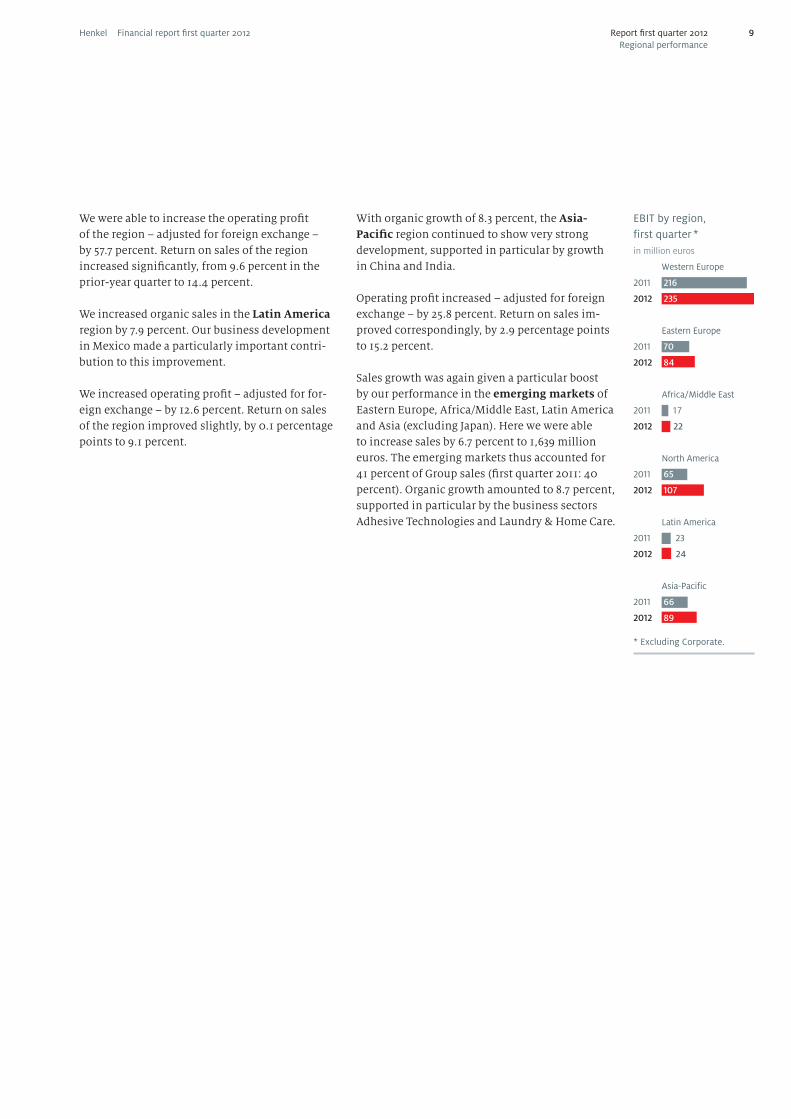
EBIT by region, first quarter *in million euros
Western Europe
2011 216
2012 235
Eastern Europe
2011 70
2012 84
Africa/Middle East
2011 17
2012 22
North America
2011 65
2012 107
Latin America
2011 23
2012 24
Asia-Pacific
2011 66
2012 89 * Excluding Corporate.
Report first quarter 2012Regional performance
9Henkel Financial report first quarter 2012
Innovation
Laundry & Home Care
Key financials 1
in million euros Q1/2011 Q1/2012 + / –
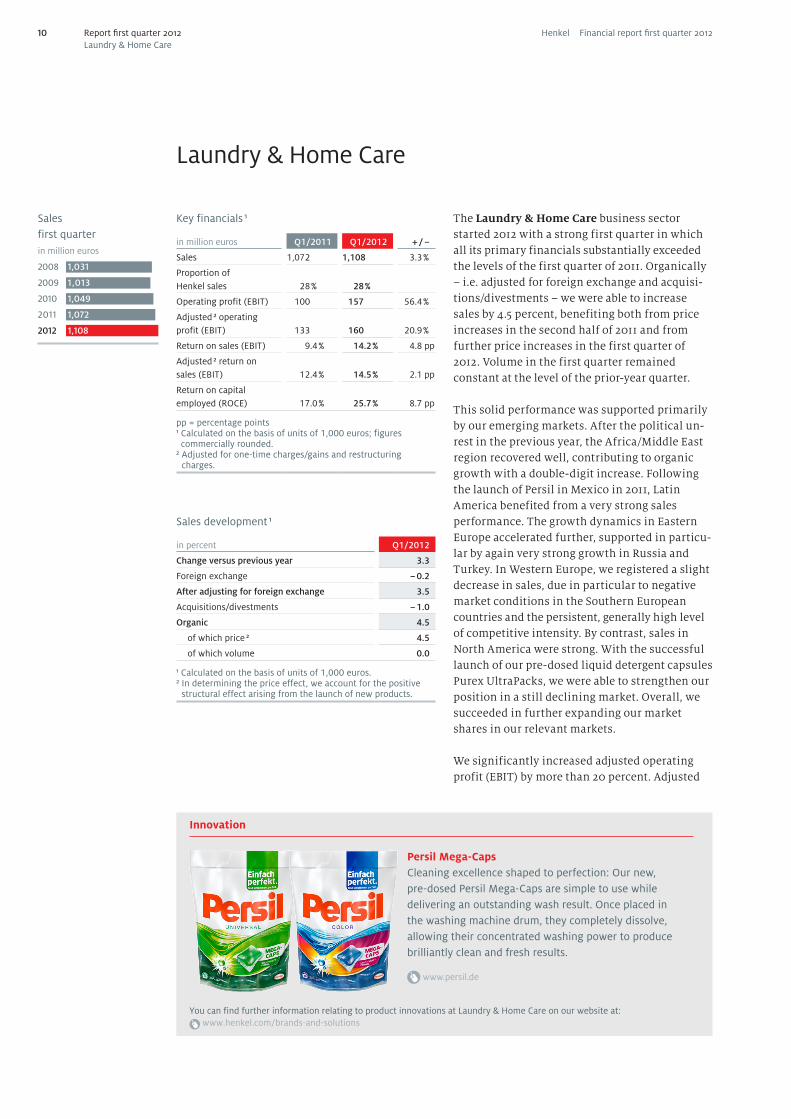
Sales 1,072 1,108 3.3 %
Proportion of Henkel sales 28 % 28 %
Operating profit (EBIT) 100 157 56.4 %
Adjusted 2 operating profit (EBIT) 133 160 20.9 %
Return on sales (EBIT) 9.4 % 14.2 % 4.8 pp
Adjusted 2 return on sales (EBIT) 12.4 % 14.5 % 2.1 pp
Return on capital employed (ROCE) 17.0 % 25.7 % 8.7 pp
pp = percentage points1 Calculated on the basis of units of 1,000 euros; figures commercially rounded.
2 Adjusted for one-time charges/gains and restructuring charges.
Sales development 1
in percent Q1/2012
Change versus previous year 3.3
Foreign exchange – 0.2
After adjusting for foreign exchange 3.5
Acquisitions/divestments – 1.0
Organic 4.5
of which price 2 4.5
of which volume 0.0
1 Calculated on the basis of units of 1,000 euros.2 In determining the price effect, we account for the positive
structural effect arising from the launch of new products.
The Laundry & Home Care business sector started 2012 with a strong first quarter in which all its primary financials substantially exceeded the levels of the first quarter of 2011. Organically – i.e. adjusted for foreign exchange and acquisi-tions/divestments – we were able to increase sales by 4.5 percent, benefiting both from price increases in the second half of 2011 and from further price increases in the first quarter of 2012. Volume in the first quarter remained constant at the level of the prior-year quarter.
This solid performance was supported primarily by our emerging markets. After the political un-rest in the previous year, the Africa/Middle East region recovered well, contributing to organic growth with a double-digit increase. Following the launch of Persil in Mexico in 2011, Latin America benefited from a very strong sales performance. The growth dynamics in Eastern Europe accelerated further, supported in particu-lar by again very strong growth in Russia and Turkey. In Western Europe, we registered a slight decrease in sales, due in particular to negative market conditions in the Southern European countries and the persistent, generally high level of competitive intensity. By contrast, sales in North America were strong. With the successful launch of our pre-dosed liquid detergent capsules Purex UltraPacks, we were able to strengthen our position in a still declining market. Overall, we succeeded in further expanding our market shares in our relevant markets.
We significantly increased adjusted operating profit (EBIT) by more than 20 percent. Adjusted
Sales first quarterin million euros
2008 1,031
2009 1,013
2010 1,049
2011 1,072
2012 1,108
Persil Mega-Caps Cleaning excellence shaped to perfection: Our new, pre-dosed Persil Mega-Caps are simple to use while delivering an outstanding wash result. Once placed in the washing machine drum, they completely dissolve, allowing their concentrated washing power to produce brilliantly clean and fresh results.
www.persil.de
Report first quarter 2012Laundry & Home Care
You can find further information relating to product innovations at Laundry & Home Care on our website at: www.henkel.com/brands-and-solutions
10 Henkel Financial report first quarter 2012
Top brands
return on sales improved by 2.1 percentage points to 14.5 percent. With our price increases and ongoing measures to reduce costs and enhance efficiency in production and supply chain, we succeeded in increasing our gross margin despite the rise in material costs. Further progress in optimizing our cost structures additionally contributed to the substantial increase in return on sales. The difference between operating profit and adjusted operating profit is attributable to restructuring charges. These relate to measures aligned to further efficiency enhancement, particularly in production. Return on capital employed (ROCE) underwent a very strong increase to 25.7 percent. We were able to further improve the ratio of net working capital to sales versus the prior-year quarter.
We achieved a strong increase in sales in the Laundry business during the first quarter, generat-ing particular growth momentum in the strategi-cally important category of heavy-duty detergents with our core brands Persil, Dixan and Purex. A contributory factor in this regard was the suc-cessful launch of our innovative liquid detergent capsules, in the first quarter of 2012, marketed as Persil Mega-Caps in Germany and as Purex Ultra-Packs in North America. Further positive mo-mentum emanated from Persil Black and Spee Black with color protection for dark and black apparel, which we launched in the German-speaking countries in 2011. The solid uptrend registered by our fabric softeners continued, supported by new lines under the Vernel and Silan brands.
Sales of the Home Care business in the first quarter remained constant compared to the prior-year quarter. Among the machine-dishwashing prod-ucts, Somat 10 in particular performed very well.
Sales of our hand-dishwashing products particu-larly in the emerging markets increased substan-tially, boosted in part by the successful launch of Pril in Central America. We were able to further expand our sales of WC products, supported primarily by the products of the Bref “Power Activ” line – marketed in Germany under the WC Frisch brand. This innovative WC rim block with its patent-pending technology offers all-round WC freshness thanks to its combination of four active substances. Our air freshener business recovered significantly, putting in a positive performance in North America despite the still declining market.
Outlook
We intend to further expand our worldwide market positions again in 2012. We are confident to generate organic sales growth in the low single-digit percentage range. We expect the rate of increase in raw material prices to decelerate compared to the previous year. Following our substantial price increases in 2011, we plan to implement moderate price increases for 2012 in order to compensate for rising raw material costs and to increase our gross margin. We will remain firmly focused on maintaining our strict cost discipline. With these measures, we expect adjusted return on sales to increase significantly compared to the previous year (2011 figure: 13.2 percent).
Report first quarter 2012Laundry & Home Care
11Henkel Financial report first quarter 2012
Innovation
Cosmetics/Toiletries
Key financials 1
in million euros Q1/2011 Q1/2012 + / –
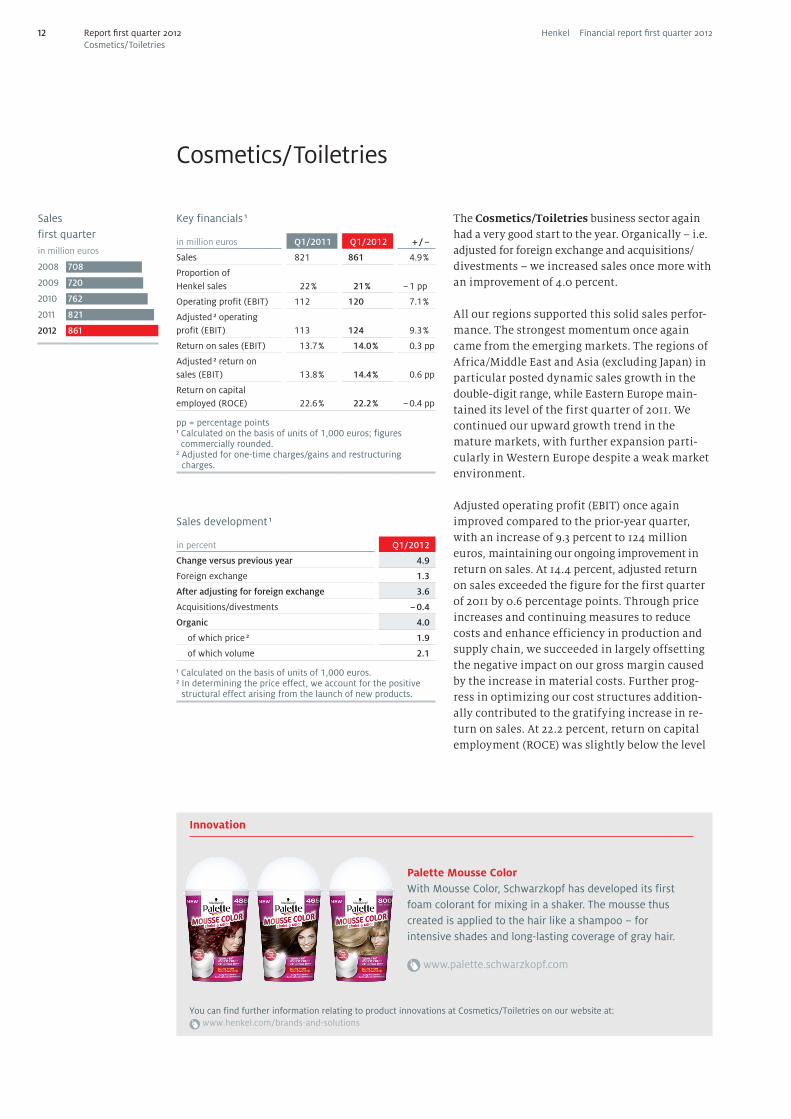
Sales 821 861 4.9 %
Proportion of Henkel sales 22 % 21 % – 1 pp
Operating profit (EBIT) 112 120 7.1 %
Adjusted 2 operating profit (EBIT) 113 124 9.3 %
Return on sales (EBIT) 13.7 % 14.0 % 0.3 pp
Adjusted 2 return on sales (EBIT) 13.8 % 14.4 % 0.6 pp
Return on capital employed (ROCE) 22.6 % 22.2 % – 0.4 pp
pp = percentage points1 Calculated on the basis of units of 1,000 euros; figures commercially rounded.
2 Adjusted for one-time charges/gains and restructuring charges.
Sales development 1
in percent Q1/2012
Change versus previous year 4.9
Foreign exchange 1.3
After adjusting for foreign exchange 3.6
Acquisitions/divestments – 0.4
Organic 4.0
of which price 2 1.9
of which volume 2.1
1 Calculated on the basis of units of 1,000 euros.2 In determining the price effect, we account for the positive
structural effect arising from the launch of new products.
The Cosmetics/Toiletries business sector again had a very good start to the year. Organically – i.e. adjusted for foreign exchange and acquisitions/ divestments – we increased sales once more with an improvement of 4.0 percent.
All our regions supported this solid sales perfor-mance. The strongest momentum once again came from the emerging markets. The regions of Africa/Middle East and Asia (excluding Japan) in particular posted dynamic sales growth in the double-digit range, while Eastern Europe main-tained its level of the first quarter of 2011. We continued our upward growth trend in the mature markets, with further expansion parti-cularly in Western Europe despite a weak market environment.
Adjusted operating profit (EBIT) once again improved compared to the prior-year quarter, with an increase of 9.3 percent to 124 million euros, maintaining our ongoing improvement in return on sales. At 14.4 percent, adjusted return on sales exceeded the figure for the first quarter of 2011 by 0.6 percentage points. Through price increases and continuing measures to reduce costs and enhance efficiency in production and supply chain, we succeeded in largely offsetting the negative impact on our gross margin caused by the increase in material costs. Further prog-ress in optimizing our cost structures addition-ally contributed to the gratifying increase in re-turn on sales. At 22.2 percent, return on capital employment (ROCE) was slightly below the level
Sales first quarterin million euros
2008 708
2009 720
2010 762
2011 821
2012 861
Report first quarter 2012Cosmetics/Toiletries
You can find further information relating to product innovations at Cosmetics/Toiletries on our website at: www.henkel.com/brands-and-solutions
Palette Mousse ColorWith Mousse Color, Schwarzkopf has developed its first foam colorant for mixing in a shaker. The mousse thus created is applied to the hair like a shampoo – for intensive shades and long-lasting coverage of gray hair.
www.palette.schwarzkopf.com
12 Henkel Financial report first quarter 2012
Top brands
of the prior-year quarter. The ratio of net working capital to sales was slightly above that of the first quarter of 2011.
Our Branded Consumer Goods business posted a solid sales performance in the first quarter. The Hair Cosmetics business in particular stood out again in this quarter as a result of very strong developments in all areas. In the Hair Care busi-ness, the focus under the Gliss Kur brand was on the launch of the new Ultimate Volume line. Within our Syoss brand, we have established a new retail segment with our new “silicone-free” products, which already delivered highly positive results. In addition, the relaunch of the Schauma brand and the launch of the new care line Schauma Cream&Oil are worthy of mention. Sales of the Hair Colorants business were boosted by the new subline Syoss Pronature and the continuing roll-out of the new Palette mousse colorant in shaker format. The positive development in our Hair Styl-ing business was supported by the international launch of Got2b Glatter Wahnsinn and also the relaunch of the Taft Volume line. With Fa Sport and Fa Natural + Care, two innovative lines were introduced into the main categories shower and deodorant in the Body Care business. Under the Right Guard brand, the focus was on the launch in Europe and North America of the innovative deodorant line Right Guard Xtreme Polar with its “Aircondition effect.” Under the Dial brand, we were able to generate momentum in North America through a comprehensive innovation offensive encompassing, among others, the rich care line Dial Triple Moisture and Dial for Men Speedfoam. In the Skin Care business, we extended our strong portfolio in the anti-aging area through the launch of Diadermine Lift+ Sun Protect, our first anti-aging care product with UV and light protec-tion. The Oral Care business began 2012 with the expansion of its Theramed 2in1 product line.
Aside from the complete relaunch of the range in combination with improved formulas, the focus was on the introduction of Theramed 2in1 Inter-dental.
Our Hair Salon business likewise achieved solid sales growth in the first quarter of 2012, continuing the gratifying momentum of previous quarters. The successful relaunch of the color protection line Color Freeze under the BC Bonacure brand generated particular growth momentum. This line was specially developed for the requirements of colored, highlighted and damaged hair in order to protect it from dulling – for long-lasting color protection and 100 percent color shine.
Outlook
We are confident to continue our positive growth path in 2012 and generate organic sales growth in the low single-digit percentage range. We expect the rate of increase in raw material prices to decelerate compared to the previous year. In addition to continuing our innovation offensive in order to expand our global market position, we will remain firmly focused on implementing measures to improve our cost structure and increase our efficiency. We expect adjusted return on sales to increase compared to prior year (2011 figure: 14.2 percent).
Report first quarter 2012Cosmetics/Toiletries
13Henkel Financial report first quarter 2012
Innovation
Adhesive Technologies
Key financials 1
in million euros Q1/2011 Q1/2012 + / –
Sales 1,884 2,001 6.2 %
Proportion of Henkel sales 49 % 50 % 1 pp
Operating profit (EBIT) 244 283 16.2 %
Adjusted 2 operating profit (EBIT) 247 289 16.9 %
Return on sales (EBIT) 13.0 % 14.2 % 1.2 pp
Adjusted 2 return on sales (EBIT) 13.1 % 14.4 % 1.3 pp
Return on capital employed (ROCE) 14.2 % 15.8 % 1.6 pp
pp = percentage points1 Calculated on the basis of units of 1,000 euros; figures commercially rounded.
2 Adjusted for one-time charges/gains and restructuring charges.
Sales development 1
in percent Q1/2012
Change versus previous year 6.2
Foreign exchange 1.4
After adjusting for foreign exchange 4.8
Acquisitions/divestments – 0.8
Organic 5.6
of which price 6.2
of which volume – 0.6
1 Calculated on the basis of units of 1,000 euros.
The Adhesive Technologies business sector continued its very good sales and earnings performance into the first quarter of 2012. We succeeded in generating sales just beyond the 2 billion euro mark. Organically – i.e. adjusted for acquisitions/divestments and foreign exchange – our adhesives business grew by 5.6 percent. This strong performance was supported by price in-creases amounting to 6.2 percent. Volume in the first quarter was slightly below the level of the prior-year quarter, also due to the partial exit from the emulsion business in Asia.
This strong sales performance was supported primarily by our emerging markets. Here, partic-ular momentum was generated in the regions of Eastern Europe, Asia (excluding Japan), and Afri-ca/Middle East in which we achieved our highest growth. Sales in the mature markets also devel-oped well versus the prior-year quarter, with our business in North America in particular register-ing very strong sales growth.
We significantly increased adjusted operating profit (EBIT) compared to the prior-year quarter, by 16.9 percent to 289 million euros. We were able to improve adjusted return on sales by 1.3 percent-age points to 14.4 percent. Through our price increases and ongoing measures to reduce costs and enhance efficiency in production and supply chain, we succeeded in increasing our gross mar-gin despite the rise in material costs. Continuing optimization of our cost structures additionally contributed to the substantial increase in return
Sales first quarterin million euros
2008 1,364
2009 1,469
2010 1,651
2011 1,884
2012 2,001
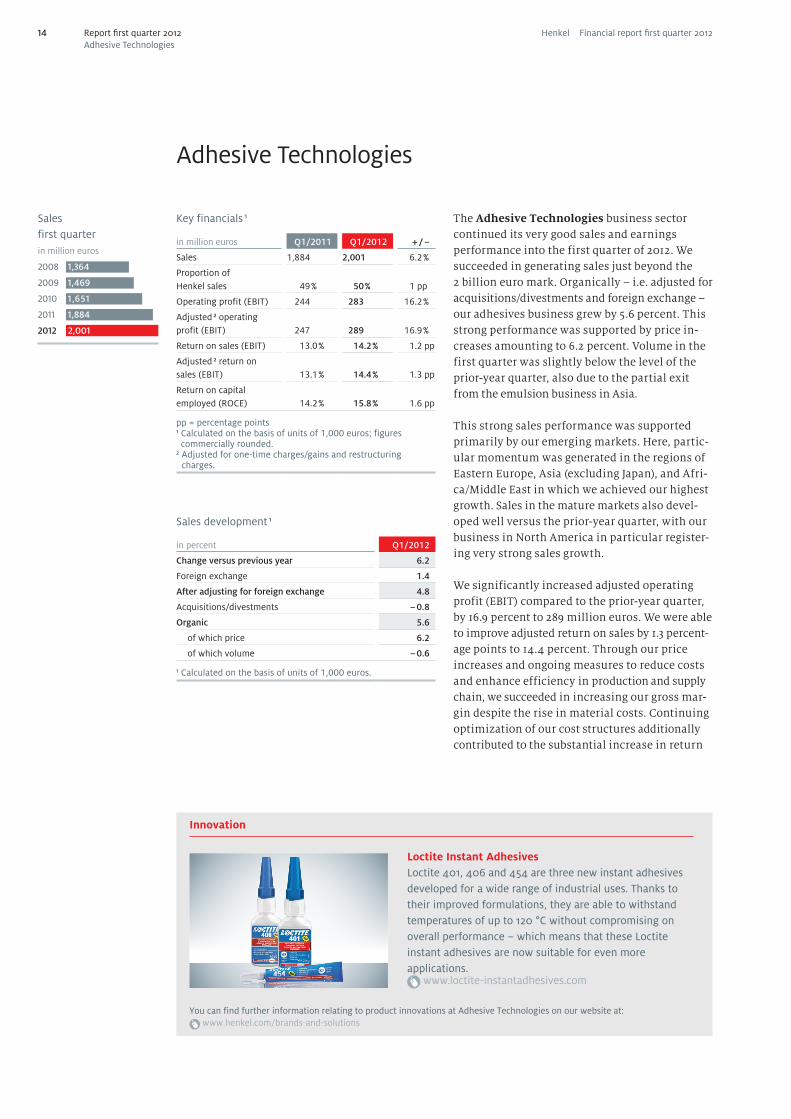
Loctite Instant AdhesivesLoctite 401, 406 and 454 are three new instant adhesives developed for a wide range of industrial uses. Thanks to their improved formulations, they are able to withstand temperatures of up to 120 °C without compromising on overall performance – which means that these Loctite instant adhesives are now suitable for even more applications.
www.loctite-instantadhesives.com
Report first quarter 2012Adhesive Technologies
You can find further information relating to product innovations at Adhesive Technologies on our website at: www.henkel.com/brands-and-solutions
14 Henkel Financial report first quarter 2012
Top brands
on sales. As a result of the improvement in earn-ings, return on capital employed (ROCE) likewise increased significantly, from 14.2 percent to 15.8 percent. The ratio of net working capital to sales remained at roughly the level of the prior-year quarter.
We were able to further increase sales of the Ad-hesives for Consumers, Craftsmen and Building business in the first quarter of 2012, due in particular to very strong growth in our activities involving the building industry. In regional terms, North America and Eastern Europe contributed particularly to this solid performance. For the purpose of further developing our flooring business in the Eastern Europe region, we opened our first Thomsit InnoCenter in Istanbul, Turkey. This enables architects, interior designers and craftsmen to become acquainted with examples of innovative applications for modern floor design.
We again posted a strong sales performance in the Packaging, Consumer Goods and Construction Adhesives business, with our highest rates of increase occurring in the emerging markets and in North America, achieved through expansion of our customer base.
We recorded our highest sales growth in the Transport and Metal business. The double-digit increase achieved overall was supported by all our regions, with double-digit growth rates realized in North America and all our emerging markets. Technology-aligned projects with major customers showed especially positive develop-ments.
The General Industry business likewise posted an increase in sales, with the regions of Eastern Europe and Africa/Middle East showing parti-cularly gratifying development. Sales in North America as well underwent a strong increase. Through the launch of new temperature-resis-tant Loctite instant adhesives, we were able to enter into new areas of application – for instance in generators, rechargeable batteries, in the manu-facture of washing machines and tumble dryers, in heating elements and in illuminants.
Due to declining demand, sales of the Electronics business were slightly below the level of the first quarter of 2011. Positive growth momentum was generated in North America, while business in the other regions declined slightly despite the positive contribution emanating from new applications adopted by key customers.
Outlook
For 2012 we estimate organic sales growth in the mid single-digit percentage range. We expect to once again develop significantly better in the emerging markets than in the mature markets. We see prices for raw materials and packaging rising more slowly than in 2011. Also on the basis of our significantly improved cost structures, we expect adjusted return on sales to increase versus prior year (2011 figure: 13.9 percent).
Report first quarter 2012Adhesive Technologies
15Henkel Financial report first quarter 2012

Financial report first quarter 2012
Sectors of importance for Henkel
With a rise of around 2 percent, developments in private consumption in the first quarter of 2012 remained sluggish. Consumers in North America increased their spend by about 2 percent. Con-sumer spending in Western Europe, and particu-larly in Southern Europe, likely declined slightly compared to the prior-year period. The emerging markets exhibited a higher propensity to consume with a plus of some 4 percent.
With an approximately 4 percent increase, indus-trial production continued to expand faster than the economy as a whole. The transport sector saw its output increase by around 6 percent. The metal industry showed robust development with an increase of around 5 percent, while the electronics sector increased production by just about 2 percent. Similarly sluggish were developments in consumer-related sectors such as the global packaging in-dustry which grew by little more than 1 percent. Global construction output was up by around 3 percent in the first quarter of 2012.
Effects on Henkel
Despite the declining dynamism, overall eco-nomic development in the first three months of 2012 had a generally positive effect on Henkel’s business performance: Robust levels of business activity in many regions of the world were re-flected in disproportionately strong organic sales growth of 4.7 percent.
Growth in private consumption had a positive impact on our consumer businesses, while the Adhesive Technologies business sector benefited from the relatively strong increase in industrial production.
We were significantly affected in all three busi-ness sectors by persistently high raw material prices. However, by increasing our selling prices and maintaining our strict cost discipline, we succeeded in increasing gross margin despite the rise in material costs.
Underlying economic conditions
The world economy grew by around 2 percent in the first quarter of 2012 compared to the prior- year period. With an increase of some 4 percent, industrial production expanded twice as fast as private consumption, which rose by around 2 percent, based in each case on data provided by Feri EuroRating Services.
Persistently high risks such as the debt crises in Europe and the USA, and also weakening growth in Asia arising from efforts to combat inflation, continued to adversely affect economic develop-ment together with investor and private consum-er confidence.
In the first quarter of 2012, the North American economy and Japanese gross domestic product grew moderately by around 2 percent versus the prior-year quarter. Economic output in Western Europe stagnated due to a moderate recession, particularly in certain Southern European coun-tries.
The emerging region of Asia (excluding Japan) increased its economic output by around 5 per-cent. Latin America registered growth of about 3 percent. Due in particular to a lower level of demand from Western Europe, economic growth in Eastern Europe cooled slightly to just under 2 percent.
The euro depreciated slightly against the US dollar, from 1.37 to 1.31 USD, in the first three months of 2012 versus the prior-year period, due in particular to the debt crisis in Europe. Around the world, consumer prices likely rose by around 4 percent. At around 7 percent, global unemployment remains at the level encountered at the end of 2011.
Financial report first quarter 201216 Henkel Financial report first quarter 2012
Results of operations
For our comments regarding results of operations, please refer to the section discussing our busi-ness performance for the first quarter of 2012 on
page 5.
Net assets
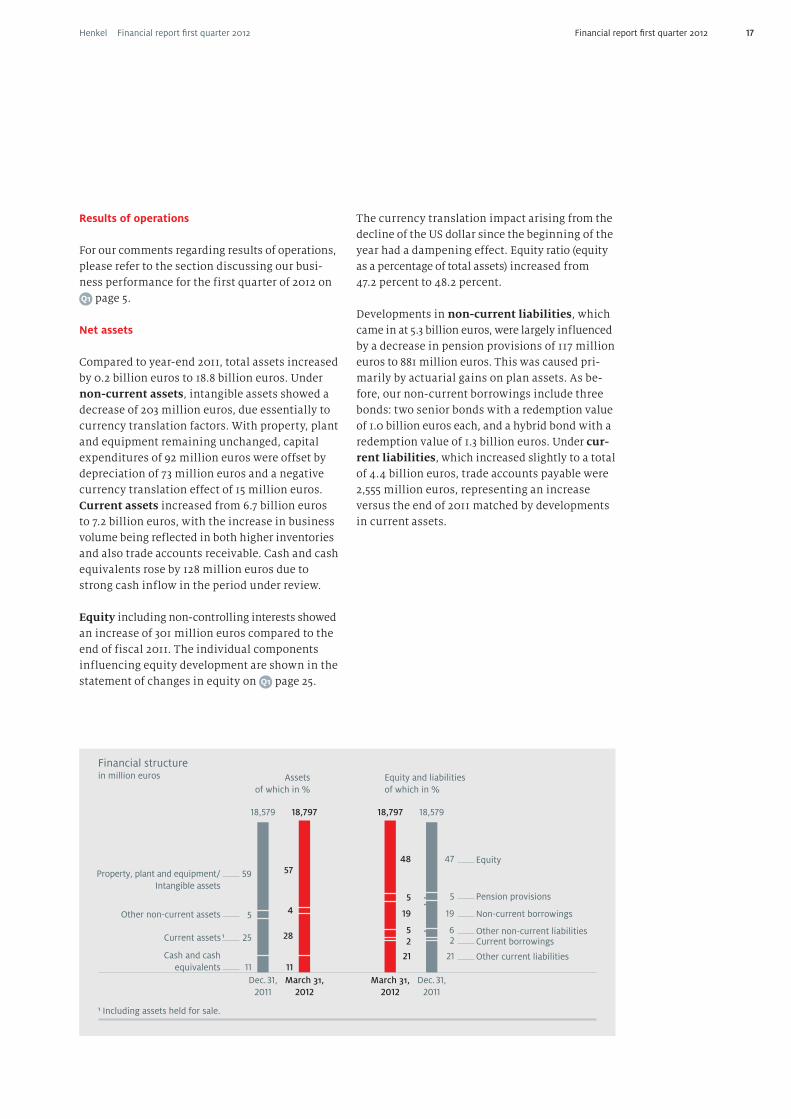
Compared to year-end 2011, total assets increased by 0.2 billion euros to 18.8 billion euros. Under non-current assets, intangible assets showed a decrease of 203 million euros, due essentially to currency translation factors. With property, plant and equipment remaining unchanged, capital expenditures of 92 million euros were offset by depreciation of 73 million euros and a negative currency translation effect of 15 million euros. Current assets increased from 6.7 billion euros to 7.2 billion euros, with the increase in business volume being reflected in both higher inventories and also trade accounts receivable. Cash and cash equivalents rose by 128 million euros due to strong cash inflow in the period under review.
Equity including non-controlling interests showed an increase of 301 million euros compared to the end of fiscal 2011. The individual components influencing equity development are shown in the statement of changes in equity on page 25.
The currency translation impact arising from the decline of the US dollar since the beginning of the year had a dampening effect. Equity ratio (equity as a percentage of total assets) increased from 47.2 percent to 48.2 percent.
Developments in non-current liabilities, which came in at 5.3 billion euros, were largely influenced by a decrease in pension provisions of 117 million euros to 881 million euros. This was caused pri-marily by actuarial gains on plan assets. As be-fore, our non-current borrowings include three bonds: two senior bonds with a redemption value of 1.0 billion euros each, and a hybrid bond with a redemption value of 1.3 billion euros. Under cur-rent liabilities, which increased slightly to a total of 4.4 billion euros, trade accounts payable were 2,555 million euros, representing an increase versus the end of 2011 matched by developments in current assets.
Financial report first quarter 2012
Property, plant and equipment/ Intangible assets
Other non-current assets
Cash and cashequivalents
1 Including assets held for sale.
Financial structure in million euros Assets
of which in %Equity and liabilities of which in %
18,797
March 31,2012
18,579
Dec. 31,2011
18,797
March 31,2012
18,579
Dec. 31,2011
Current assets 1
59 5748
5
5 4 19
25 285
11 11
2
21
Equity
Pension provisions
Other non-current liabilitiesCurrent borrowings
Non-current borrowings
Other current liabilities
47
5
19
62
21
17Henkel Financial report first quarter 2012
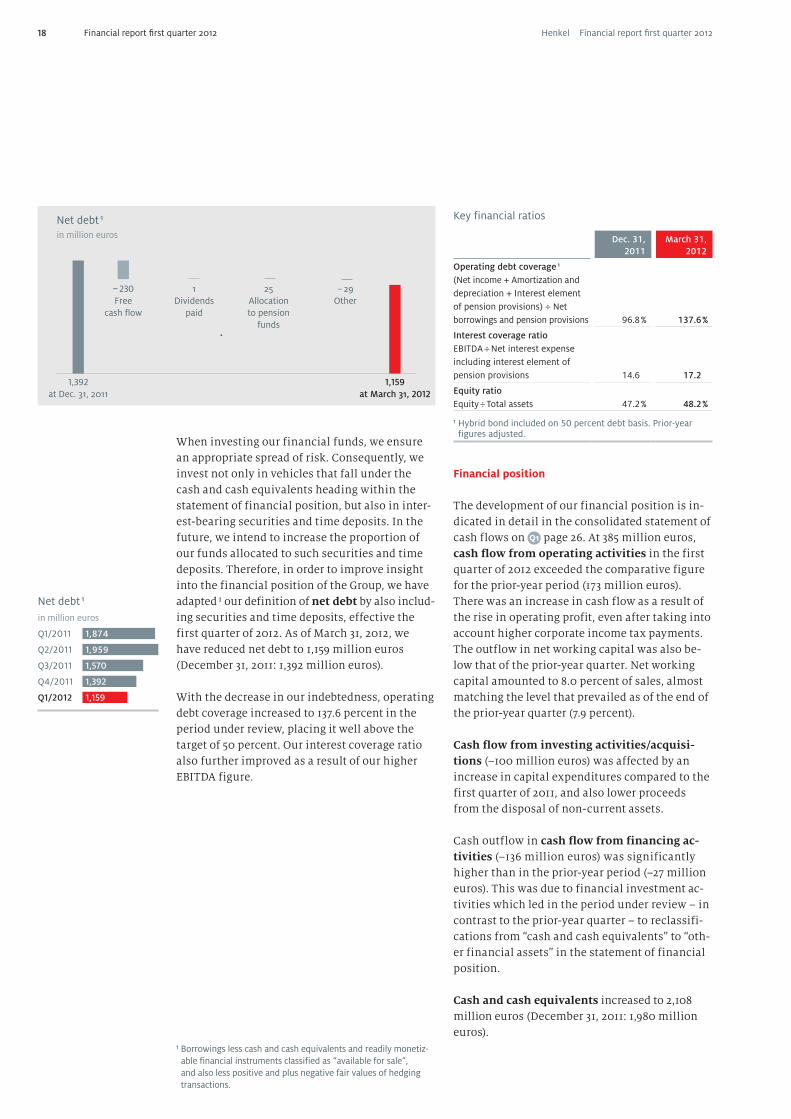
When investing our financial funds, we ensure an appropriate spread of risk. Consequently, we invest not only in vehicles that fall under the cash and cash equivalents heading within the statement of financial position, but also in inter-est-bearing securities and time deposits. In the future, we intend to increase the proportion of our funds allocated to such securities and time deposits. Therefore, in order to improve insight into the financial position of the Group, we have adapted 1 our definition of net debt by also includ-ing securities and time deposits, effective the first quarter of 2012. As of March 31, 2012, we have reduced net debt to 1,159 million euros (December 31, 2011: 1,392 million euros).
With the decrease in our indebtedness, operating debt coverage increased to 137.6 percent in the period under review, placing it well above the target of 50 percent. Our interest coverage ratio also further improved as a result of our higher EBITDA figure.
Key financial ratios
Dec. 31, 2011
March 31, 2012
Operating debt coverage 1 (Net income + Amortization and depreciation + Interest element of pension provisions) ÷ Net borrowings and pension provisions 96.8 % 137.6 %
Interest coverage ratio EBITDA ÷ Net interest expense including interest element of pension provisions 14.6 17.2
Equity ratio Equity ÷ Total assets 47.2 % 48.2 %
1 Hybrid bond included on 50 percent debt basis. Prior-year figures adjusted.
Financial position
The development of our financial position is in-dicated in detail in the consolidated statement of cash flows on page 26. At 385 million euros, cash flow from operating activities in the first quarter of 2012 exceeded the comparative figure for the prior-year period (173 million euros). There was an increase in cash flow as a result of the rise in operating profit, even after taking into account higher corporate income tax payments. The outflow in net working capital was also be-low that of the prior-year quarter. Net working capital amounted to 8.0 percent of sales, almost matching the level that prevailed as of the end of the prior-year quarter (7.9 percent).
Cash flow from investing activities/acquisi-tions (–100 million euros) was affected by an increase in capital expenditures compared to the first quarter of 2011, and also lower proceeds from the disposal of non-current assets.
Cash outflow in cash flow from financing ac-tivities (–136 million euros) was significantly higher than in the prior-year period (–27 million euros). This was due to financial investment ac-tivities which led in the period under review – in contrast to the prior-year quarter – to reclassifi-cations from “cash and cash equivalents” to “oth-er financial assets” in the statement of financial position.
Cash and cash equivalents increased to 2,108 million euros (December 31, 2011: 1,980 million euros).
Financial report first quarter 2012
Net debt 1in million euros
1,159 at March 31, 2012
1,392 at Dec. 31, 2011
1 Borrowings less cash and cash equivalents and readily monetiz-able financial instruments classified as “available for sale”, and also less positive and plus negative fair values of hedging transactions.
– 230 Free
cash flow
– 29Other
1 Dividends
paid
25 Allocation to pension
funds
Net debt 1in million euros
Q1/2011 1,874
Q2/2011 1,959
Q3/2011 1,570
Q4/2011 1,392
Q1/2012 1,159
18 Henkel Financial report first quarter 2012
At 230 million euros, free cash flow showed an increase compared to the first quarter of 2011 (75 million euros) resulting from the increase in cash flow from operating activities. This exceed-ed the higher outflows arising from the balance of capital expenditures and disposal proceeds under non-current assets.
Capital expenditures
Investments in property, plant and equipment for continuing operations amounted to 92 million euros compared to 68 million euros in the first quarter of 2011. We spent 5 million euros on intan-gible assets (prior-year period: 2 million euros). A large part of these capital expenditures was attributable to the Adhesive Technologies and Laundry & Home Care business sectors. Around three quarters of the investment sum went into expansion projects and rationalization mea-sures, for example the introduction of innovative product lines and optimization of our production structure and business processes. In regional terms, capital expenditures focused primarily on Western Europe, Eastern Europe and Asia.
The first-time consolidation of Bella Vista A/S, Silkeborg, Denmark, resulted in an addition to intangible assets in the amount of 4 million euros.
Capital expenditures first quarter 2012
in million euros
Continuing operations
Acquisi-tions
Total
Intangible assets 5 4 9
Property, plant and equipment 92 – 92
Total 97 4 101
Acquisitions and divestments
Effective January 2, 2012, we acquired control of the distribution company Bella Vista A/S, Silke-borg, Denmark. Our share of voting rights in the company is 100 percent. The purchase price paid was 5 million euros. A provisional difference of 4 million euros has been recognized.
In the first quarter, we spent 7 million euros acquiring the outstanding non-controlling interests in Chemofast Anchoring GmbH,
Willich, Germany, increasing our shareholding from 73 percent to 95 percent.
Neither the acquisitions and divestments made nor other measures and activities undertaken have resulted in changes in our business and organizational structures. For a detailed descrip-tion of our organization and business activities, please refer to the information provided in our
Annual Report 2011 starting on page 45.
Thanks to continuing good business perfor-mance and our improved financial profile, we regained our target ratings of “A flat” (Standard & Poor’s) and “A2” (Moody’s) in the second quarter of 2011. Looking forward, we intend not to jeopar-dize our target ratings when assessing possible acquisitions.
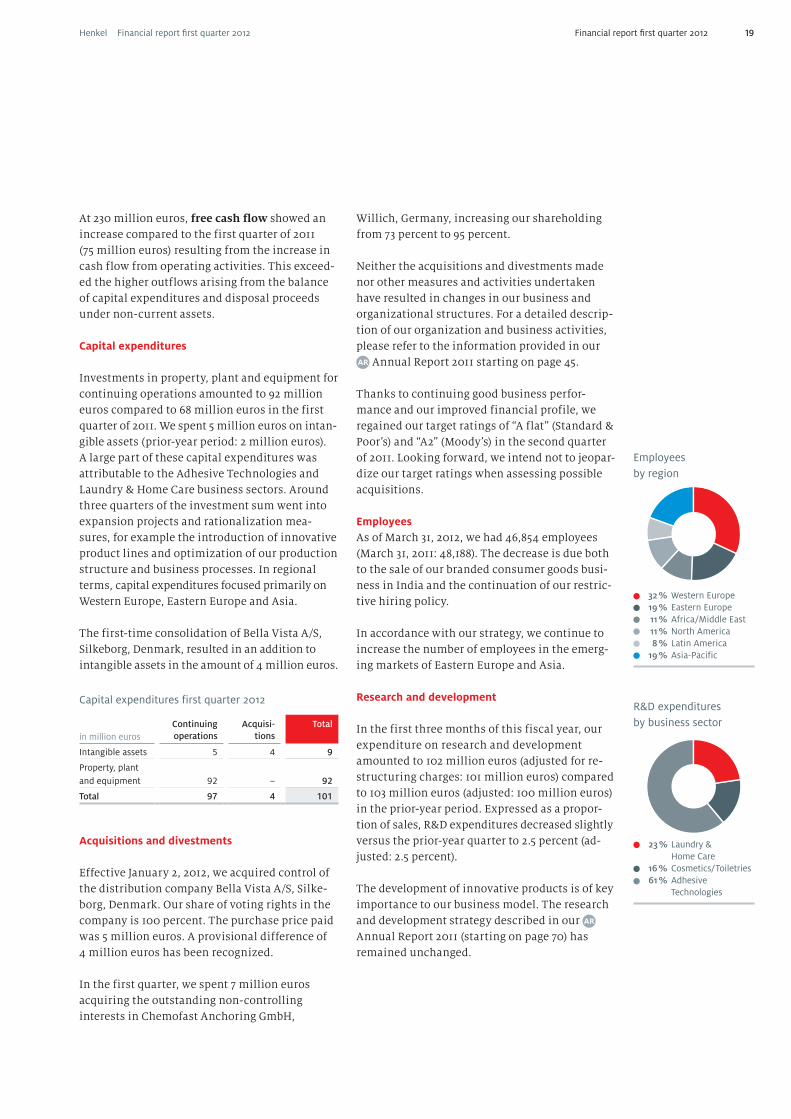
EmployeesAs of March 31, 2012, we had 46,854 employees (March 31, 2011: 48,188). The decrease is due both to the sale of our branded consumer goods busi-ness in India and the continuation of our restric-tive hiring policy.
In accordance with our strategy, we continue to increase the number of employees in the emerg-ing markets of Eastern Europe and Asia.
Research and development
In the first three months of this fiscal year, our expenditure on research and development amounted to 102 million euros (adjusted for re-structuring charges: 101 million euros) compared to 103 million euros (adjusted: 100 million euros) in the prior-year period. Expressed as a propor-tion of sales, R&D expenditures decreased slightly versus the prior-year quarter to 2.5 percent (ad-justed: 2.5 percent).
The development of innovative products is of key importance to our business model. The research and development strategy described in our Annual Report 2011 (starting on page 70) has remained unchanged.
Financial report first quarter 2012
Employees by region
32 % Western Europe 19 % Eastern Europe 11 % Africa/Middle East 11 % North America 8 % Latin America 19 % Asia-Pacific
R&D expenditures by business sector
23 % Laundry & Home Care
16 % Cosmetics/Toiletries 61 % Adhesive
Technologies
19Henkel Financial report first quarter 2012
Our view based on data provided by Feri EuroRat-ing Services is that the world economy will grow by less than 3 percent during 2012. The industri-alized countries should undergo no more than moderate growth at 1.5 percent, while we expect the emerging regions to show a relatively robust rate of economic growth of around 4 percent.
The North American economy, like Japan’s, is likely to grow by around 2 percent. For Western Europe, we anticipate a slight degree of contin-ued growth, with the recession tendencies in some Southern European countries exerting ma-jor influence.
In the case of Asia (excluding Japan), we expect economic output to increase by 5.5 percent, with Latin America likely posting a plus of around 3 percent. Eastern Europe should grow by about 2 percent. For the Africa/Middle East region, we expect economic growth of around 4 percent.
Global inflation is forecasted at 3.5 percent for 2012. While we can expect a high degree of price stability for the industrialized countries with a rise of 2 percent, the inflation rate of the emerg-ing regions is likely to average 5.5 percent.
Private consumption should rise by 2.5 percent globally in 2012. In the industrialized countries, consumers are likely to spend around 1 percent more than in the previous year. The emerging countries should again show an increase in con-sumption of 4.5 percent in 2012.
Global industrial growth will ease compared to the previous year, with expansion at around 4 percent. Here again, the emerging regions are likely to make by far the greater contribution.
We expect the transport industry to register a plus of around 5 percent. Production in the elec-tronics industry, an important customer sector for Henkel, should increase by about 4 percent. Within the electronics industry, the growth of relevance to us in basic products such as semi-conductors and printed circuit boards should be slightly higher than in fiscal 2011. We expect production in the metal industry to grow slightly less than in 2011, with expansion at around 5 per-cent. Developments in the global packaging in-
dustry are likely to be sluggish, with our estimates showing growth in the low single-digit range. We expect global construction to expand by around 3 percent.
Opportunities and risks
We continue to see great potential in the emerg-ing markets, with above-average growth oppor-tunities from which we intend to benefit through our local business activities. The regions con-cerned include, in particular, Asia (excluding Japan), Eastern Europe and Africa/Middle East, with Latin America also part of the wider group.
We regard our research and development activi-ties as a further great source of opportunity. We are developing a steady stream of new and inno-vative products and product solutions offering our customers added value. We have a well filled and balanced pipeline of medium and long-term projects involving products and systems that we intend to launch onto the markets of all three of our business sectors, both this year and in years to come.
Further opportunity lies in our strict focus on cost and our willingness to constantly examine and analyze the status quo. Such scrutiny regularly reveals further potential for cost reductions and capacity adjustments, or the elimination of non-core business activities and minor brands from our portfolio. We also expect the planned further expansion of our shared service centers to make a substantial contribution to cost reduction.
Opportunities will also arise from the ongoing pursuit and implementation of our three strate-gic priorities. These are explained in detail in the section entitled “Strategy and financial tar-gets for 2012” on pages 45 to 48 of our Annual Report 2011.
We see risks for our consumer businesses arising from a further downturn in the macroeconomic conditions and particularly from a deteriorating consumer climate – as would ensue, for example, in the event of a hefty rise in unemployment. We also expect the intensity of competition to re-main challenging, manifesting itself in persis-tent promotional pressure.
Financial report first quarter 2012
Outlook
20 Henkel Financial report first quarter 2012
Financial report first quarter 2012
We base this guidance on anticipated increases of our selling prices and the ongoing adaptation of our structures to the constantly changing mar-ket conditions. Through these activities and the maintenance of our strict cost discipline, we in-tend to more than offset the effects of increased raw material costs on our earnings.
We also continue to expect the following devel-opments in 2012:• Increase in the prices for raw materials, packag-
ing, contract manufacturing and traded goods in the mid single-digit percentage range.
• Restructuring charges of around 100 million euros.
• Investments in property, plant and equipment of around 410 million euros.
Financial targets for 2012
Annual organic sales growth (average):3–5 percent
Adjusted return on sales (EBIT):14 percent
Annual growth in adjusted earnings per preferred share (average):> 10 percent
Subsequent events
Effective April 2, 2012 we concluded the disposal process involving non-core brands of the Cos-metics/Toiletries business sector. The assets disclosed in the statement of financial position as held for sale at the time of disposal were trans-ferred to the purchaser.
Risks for our Adhesive Technologies business sector lie in the macroeconomic effects arising from the current debt crises, and also, to a de-gree, in the development of our emerging markets.
For all three business sectors, unexpectedly high rises in raw material and packaging prices pres-ent a risk, as do supply shortages with respect to certain raw materials, particularly those required by the Adhesive Technologies business sector. In addition, the effects on the global supply chain of the political turmoil in North Africa are not yet fully assessable.
At the time of preparing this report, no risks in relation to future developments have been iden-tified that might jeopardize the continuing exis-tence of the company or of the Group as a going concern. For an appraisal of the various risk cat-egories, please refer to the risk report in our Annual Report 2011, pages 88 to 93. The situation with respect to our legal action against the fine of 92 million euros imposed by the French anti-trust authorities remains unchanged.
Further specific opportunities and risks are dis-cussed in the sections dealing with the individu-al business sectors in our Annual Report 2011 in the relevant sections on pages 76 through 87.
Outlook for the Henkel Group 2012
We continue to expect the Henkel Group to generate organic sales growth of between 3 and 5 percent in fiscal 2012.
We are confident of continuing the positive growth trend posted by our consumer goods businesses, with revenues expanding in the low single-digit percentage range.
For the Adhesive Technologies business sector, we expect sales to grow in the mid single-digit percentage range.
We confirm our forecast for an adjusted 1 return on sales (EBIT) of 14 percent (2011: 13.0 percent) and for an increase in adjusted earnings per pre-ferred share of at least 10 percent (2011: 3.14 euros).
1 Adjusted for one-time charges/gains and restructuring charges.
21Henkel Financial report first quarter 2012
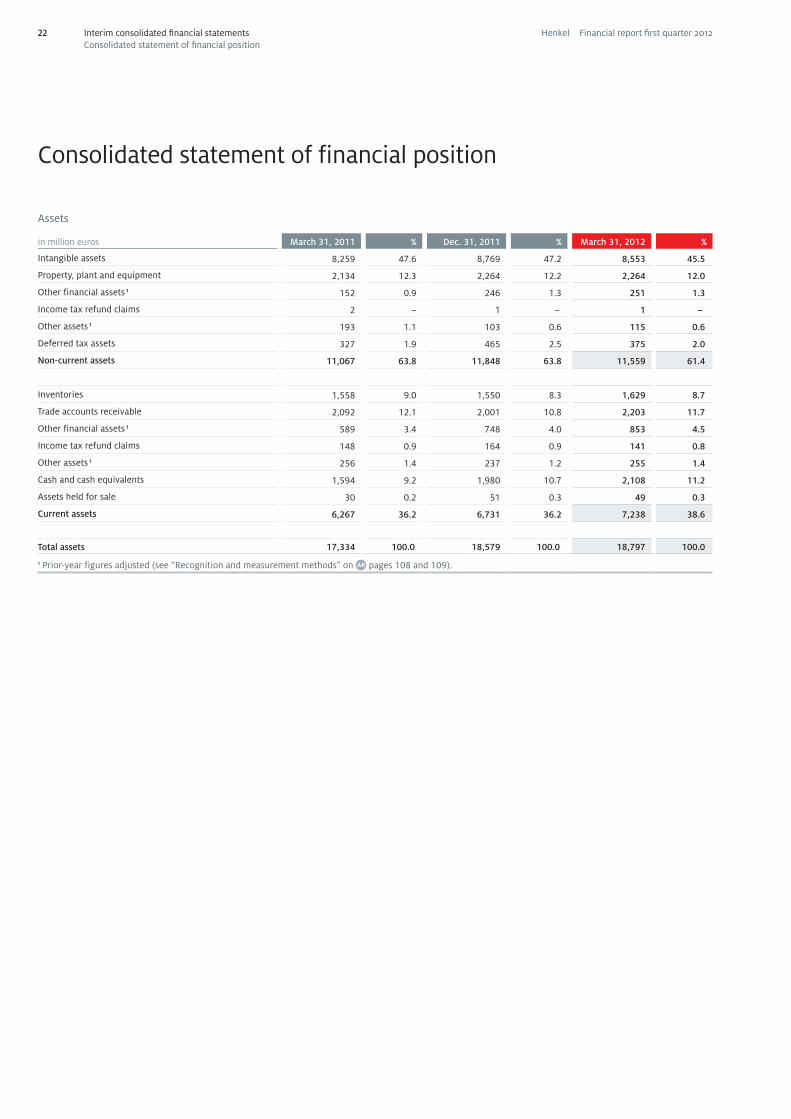
Assets
in million euros March 31, 2011 % Dec. 31, 2011 % March 31, 2012 %
Intangible assets 8,259 47.6 8,769 47.2 8,553 45.5
Property, plant and equipment 2,134 12.3 2,264 12.2 2,264 12.0
Other financial assets 1 152 0.9 246 1.3 251 1.3
Income tax refund claims 2 – 1 – 1 –
Other assets 1 193 1.1 103 0.6 115 0.6
Deferred tax assets 327 1.9 465 2.5 375 2.0
Non-current assets 11,067 63.8 11,848 63.8 11,559 61.4
Inventories 1,558 9.0 1,550 8.3 1,629 8.7
Trade accounts receivable 2,092 12.1 2,001 10.8 2,203 11.7
Other financial assets 1 589 3.4 748 4.0 853 4.5
Income tax refund claims 148 0.9 164 0.9 141 0.8
Other assets 1 256 1.4 237 1.2 255 1.4
Cash and cash equivalents 1,594 9.2 1,980 10.7 2,108 11.2
Assets held for sale 30 0.2 51 0.3 49 0.3
Current assets 6,267 36.2 6,731 36.2 7,238 38.6
Total assets 17,334 100.0 18,579 100.0 18,797 100.0
1 Prior-year figures adjusted (see “Recognition and measurement methods” on pages 108 and 109).
Consolidated statement of financial position
Interim consolidated financial statementsConsolidated statement of financial position
22 Henkel Financial report first quarter 2012
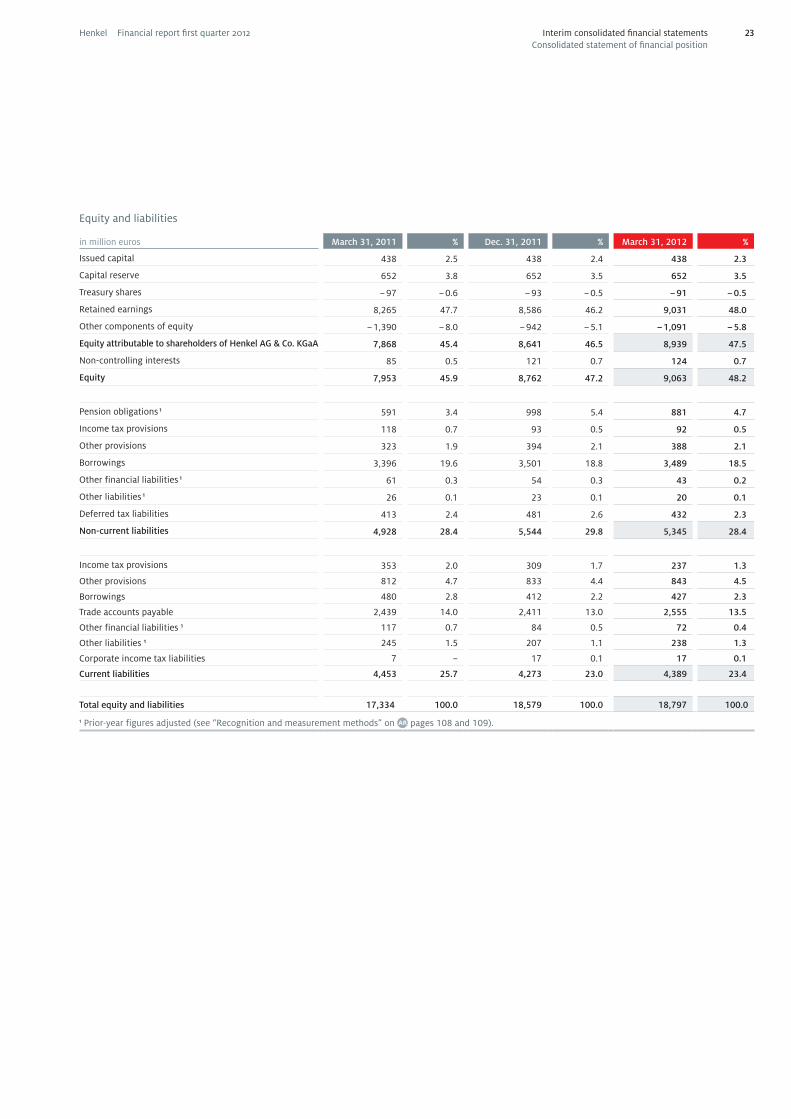
Equity and liabilities
in million euros March 31, 2011 % Dec. 31, 2011 % March 31, 2012 %
Issued capital 438 2.5 438 2.4 438 2.3
Capital reserve 652 3.8 652 3.5 652 3.5
Treasury shares – 97 – 0.6 – 93 – 0.5 – 91 – 0.5
Retained earnings 8,265 47.7 8,586 46.2 9,031 48.0
Other components of equity – 1,390 – 8.0 – 942 – 5.1 – 1,091 – 5.8
Equity attributable to shareholders of Henkel AG & Co. KGaA 7,868 45.4 8,641 46.5 8,939 47.5
Non-controlling interests 85 0.5 121 0.7 124 0.7
Equity 7,953 45.9 8,762 47.2 9,063 48.2
Pension obligations 1 591 3.4 998 5.4 881 4.7
Income tax provisions 118 0.7 93 0.5 92 0.5
Other provisions 323 1.9 394 2.1 388 2.1
Borrowings 3,396 19.6 3,501 18.8 3,489 18.5
Other financial liabilities 1 61 0.3 54 0.3 43 0.2
Other liabilities 1 26 0.1 23 0.1 20 0.1
Deferred tax liabilities 413 2.4 481 2.6 432 2.3
Non-current liabilities 4,928 28.4 5,544 29.8 5,345 28.4
Income tax provisions 353 2.0 309 1.7 237 1.3
Other provisions 812 4.7 833 4.4 843 4.5
Borrowings 480 2.8 412 2.2 427 2.3
Trade accounts payable 2,439 14.0 2,411 13.0 2,555 13.5
Other financial liabilities 1 117 0.7 84 0.5 72 0.4
Other liabilities 1 245 1.5 207 1.1 238 1.3
Corporate income tax liabilities 7 – 17 0.1 17 0.1
Current liabilities 4,453 25.7 4,273 23.0 4,389 23.4
Total equity and liabilities 17,334 100.0 18,579 100.0 18,797 100.0
1 Prior-year figures adjusted (see “Recognition and measurement methods” on pages 108 and 109).
Interim consolidated financial statementsConsolidated statement of financial position
23Henkel Financial report first quarter 2012
Interim consolidated financial statementsConsolidated statement of income
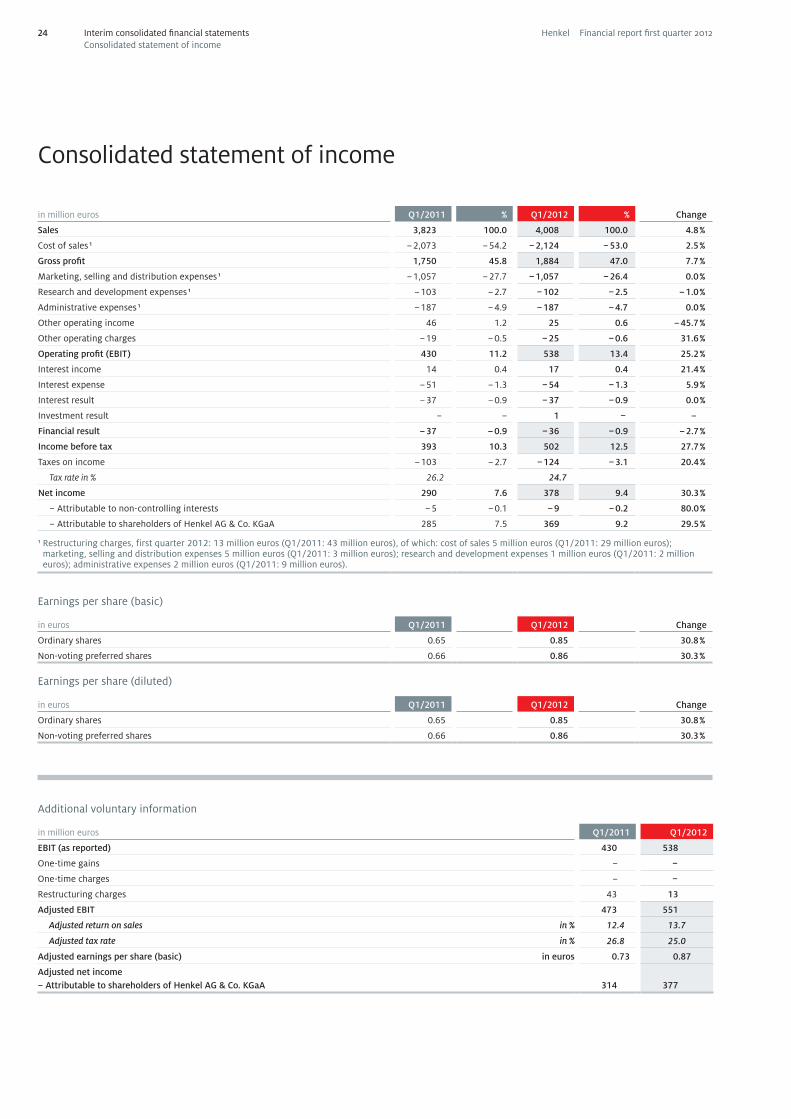
Consolidated statement of income
in million euros Q1/2011 % Q1/2012 % Change
Sales 3,823 100.0 4,008 100.0 4.8 %
Cost of sales 1 – 2,073 – 54.2 – 2,124 – 53.0 2.5 %
Gross profit 1,750 45.8 1,884 47.0 7.7 %
Marketing, selling and distribution expenses 1 – 1,057 – 27.7 – 1,057 – 26.4 0.0 %
Research and development expenses 1 – 103 – 2.7 – 102 – 2.5 – 1.0 %
Administrative expenses 1 – 187 – 4.9 – 187 – 4.7 0.0 %
Other operating income 46 1.2 25 0.6 – 45.7 %
Other operating charges – 19 – 0.5 – 25 – 0.6 31.6 %
Operating profit (EBIT) 430 11.2 538 13.4 25.2 %
Interest income 14 0.4 17 0.4 21.4 %
Interest expense – 51 – 1.3 – 54 – 1.3 5.9 %
Interest result – 37 – 0.9 – 37 – 0.9 0.0 %
Investment result – – 1 – –
Financial result – 37 – 0.9 – 36 – 0.9 – 2.7 %
Income before tax 393 10.3 502 12.5 27.7 %
Taxes on income – 103 – 2.7 – 124 – 3.1 20.4 %
Tax rate in % 26.2 24.7
Net income 290 7.6 378 9.4 30.3 %
– Attributable to non-controlling interests – 5 – 0.1 – 9 – 0.2 80.0 %
– Attributable to shareholders of Henkel AG & Co. KGaA 285 7.5 369 9.2 29.5 %
1 Restructuring charges, first quarter 2012: 13 million euros (Q1/2011: 43 million euros), of which: cost of sales 5 million euros (Q1/2011: 29 million euros); marketing, selling and distribution expenses 5 million euros (Q1/2011: 3 million euros); research and development expenses 1 million euros (Q1/2011: 2 million euros); administrative expenses 2 million euros (Q1/2011: 9 million euros).
Earnings per share (basic)
in euros Q1/2011 Q1/2012 Change
Ordinary shares 0.65 0.85 30.8 %
Non-voting preferred shares 0.66 0.86 30.3 %
Earnings per share (diluted)
in euros Q1/2011 Q1/2012 Change
Ordinary shares 0.65 0.85 30.8 %
Non-voting preferred shares 0.66 0.86 30.3 %
Additional voluntary information
in million euros Q1/2011 Q1/2012
EBIT (as reported) 430 538
One-time gains – –
One-time charges – –
Restructuring charges 43 13
Adjusted EBIT 473 551
Adjusted return on sales in % 12.4 13.7
Adjusted tax rate in % 26.8 25.0
Adjusted earnings per share (basic) in euros 0.73 0.87
Adjusted net income– Attributable to shareholders of Henkel AG & Co. KGaA 314 377
24 Henkel Financial report first quarter 2012
Interim consolidated financial statementsConsolidated statement of comprehensive income / Consolidated statement of changes
in equity
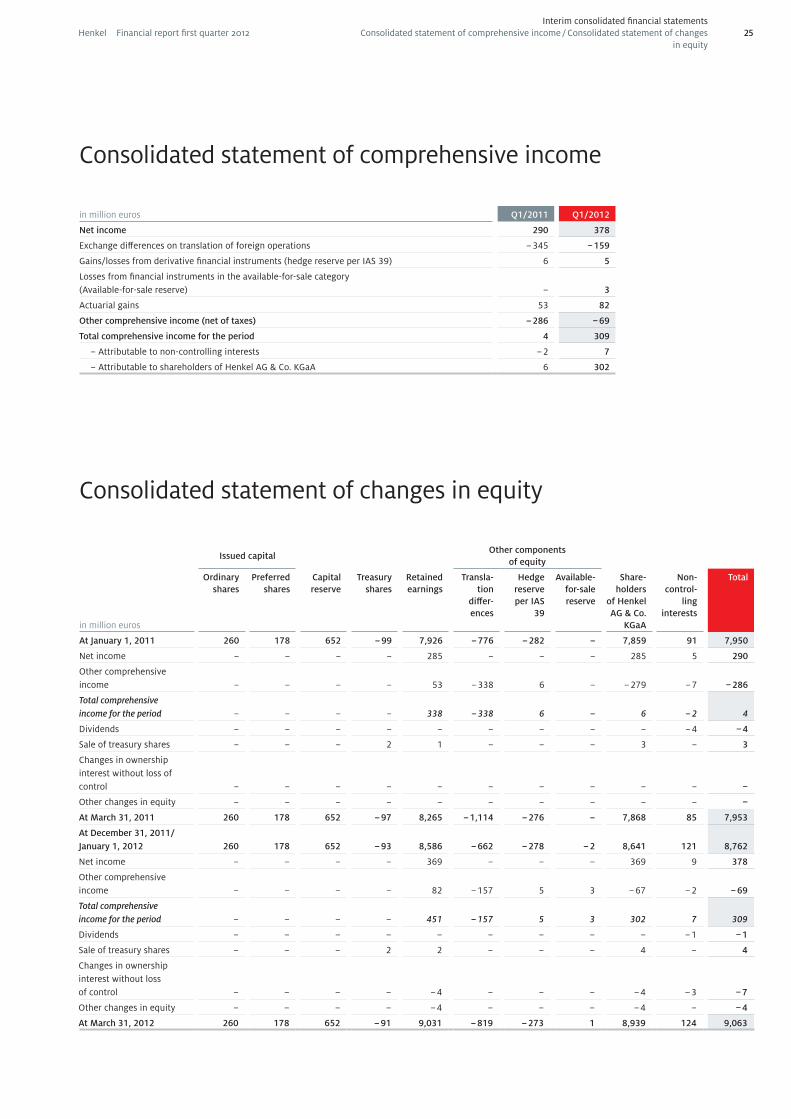
Consolidated statement of comprehensive income
Consolidated statement of changes in equity
in million euros Q1/2011 Q1/2012
Net income 290 378
Exchange differences on translation of foreign operations – 345 – 159
Gains/losses from derivative financial instruments (hedge reserve per IAS 39) 6 5
Losses from financial instruments in the available-for-sale category (Available-for-sale reserve) – 3
Actuarial gains 53 82
Other comprehensive income (net of taxes) – 286 – 69
Total comprehensive income for the period 4 309
– Attributable to non-controlling interests – 2 7
– Attributable to shareholders of Henkel AG & Co. KGaA 6 302
Issued capitalOther components
of equity
in million euros
Ordinary shares
Preferred shares
Capital reserve
Treasury shares
Retained earnings
Transla-tion
differ-ences
Hedge reserve per IAS
39
Available-for-sale reserve
Share-holders
of Henkel AG & Co.
KGaA
Non- control-
ling interests
Total
At January 1, 2011 260 178 652 – 99 7,926 – 776 – 282 – 7,859 91 7,950
Net income – – – – 285 – – – 285 5 290
Other comprehensive income – – – – 53 – 338 6 – – 279 – 7 – 286
Total comprehensive income for the period – – – – 338 – 338 6 – 6 – 2 4
Dividends – – – – – – – – – – 4 – 4
Sale of treasury shares – – – 2 1 – – – 3 – 3
Changes in ownership interest without loss of control – – – – – – – – – – –
Other changes in equity – – – – – – – – – – –
At March 31, 2011 260 178 652 – 97 8,265 – 1,114 – 276 – 7,868 85 7,953
At December 31, 2011/ January 1, 2012 260 178 652 – 93 8,586 – 662 – 278 – 2 8,641 121 8,762
Net income – – – – 369 – – – 369 9 378
Other comprehensive income – – – – 82 – 157 5 3 – 67 – 2 – 69
Total comprehensive income for the period – – – – 451 – 157 5 3 302 7 309
Dividends – – – – – – – – – – 1 – 1
Sale of treasury shares – – – 2 2 – – – 4 – 4
Changes in ownership interest without loss of control – – – – – 4 – – – – 4 – 3 – 7
Other changes in equity – – – – – 4 – – – – 4 – – 4
At March 31, 2012 260 178 652 – 91 9,031 – 819 – 273 1 8,939 124 9,063
25Henkel Financial report first quarter 2012
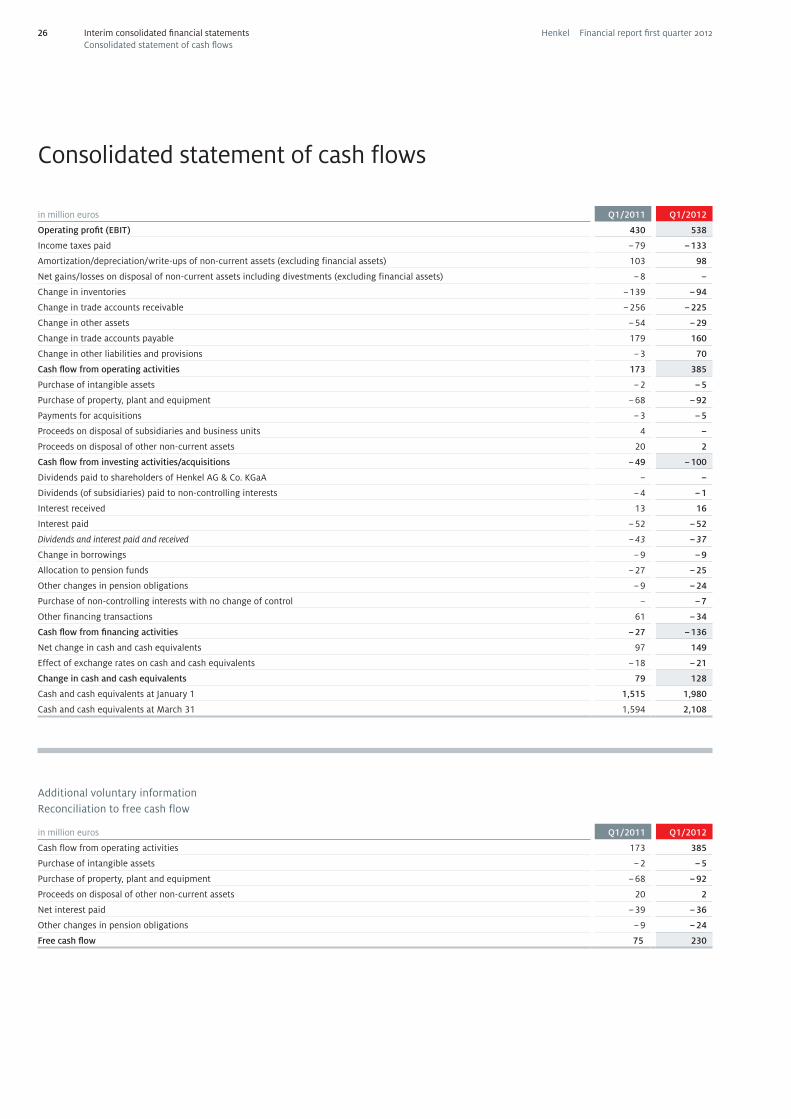
Consolidated statement of cash flows
in million euros Q1/2011 Q1/2012
Operating profit (EBIT) 430 538
Income taxes paid – 79 – 133
Amortization/depreciation/write-ups of non-current assets (excluding financial assets) 103 98
Net gains/losses on disposal of non-current assets including divestments (excluding financial assets) – 8 –
Change in inventories – 139 – 94
Change in trade accounts receivable – 256 – 225
Change in other assets – 54 – 29
Change in trade accounts payable 179 160
Change in other liabilities and provisions – 3 70
Cash flow from operating activities 173 385
Purchase of intangible assets – 2 – 5
Purchase of property, plant and equipment – 68 – 92
Payments for acquisitions – 3 – 5
Proceeds on disposal of subsidiaries and business units 4 –
Proceeds on disposal of other non-current assets 20 2
Cash flow from investing activities/acquisitions – 49 – 100
Dividends paid to shareholders of Henkel AG & Co. KGaA – –
Dividends (of subsidiaries) paid to non-controlling interests – 4 – 1
Interest received 13 16
Interest paid – 52 – 52
Dividends and interest paid and received – 43 – 37
Change in borrowings – 9 – 9
Allocation to pension funds – 27 – 25
Other changes in pension obligations – 9 – 24
Purchase of non-controlling interests with no change of control – – 7
Other financing transactions 61 – 34
Cash flow from financing activities – 27 – 136
Net change in cash and cash equivalents 97 149
Effect of exchange rates on cash and cash equivalents – 18 – 21
Change in cash and cash equivalents 79 128
Cash and cash equivalents at January 1 1,515 1,980
Cash and cash equivalents at March 31 1,594 2,108
Additional voluntary information Reconciliation to free cash flow
in million euros Q1/2011 Q1/2012
Cash flow from operating activities 173 385
Purchase of intangible assets – 2 – 5
Purchase of property, plant and equipment – 68 – 92
Proceeds on disposal of other non-current assets 20 2
Net interest paid – 39 – 36
Other changes in pension obligations – 9 – 24
Free cash flow 75 230
Interim consolidated financial statementsConsolidated statement of cash flows
26 Henkel Financial report first quarter 2012
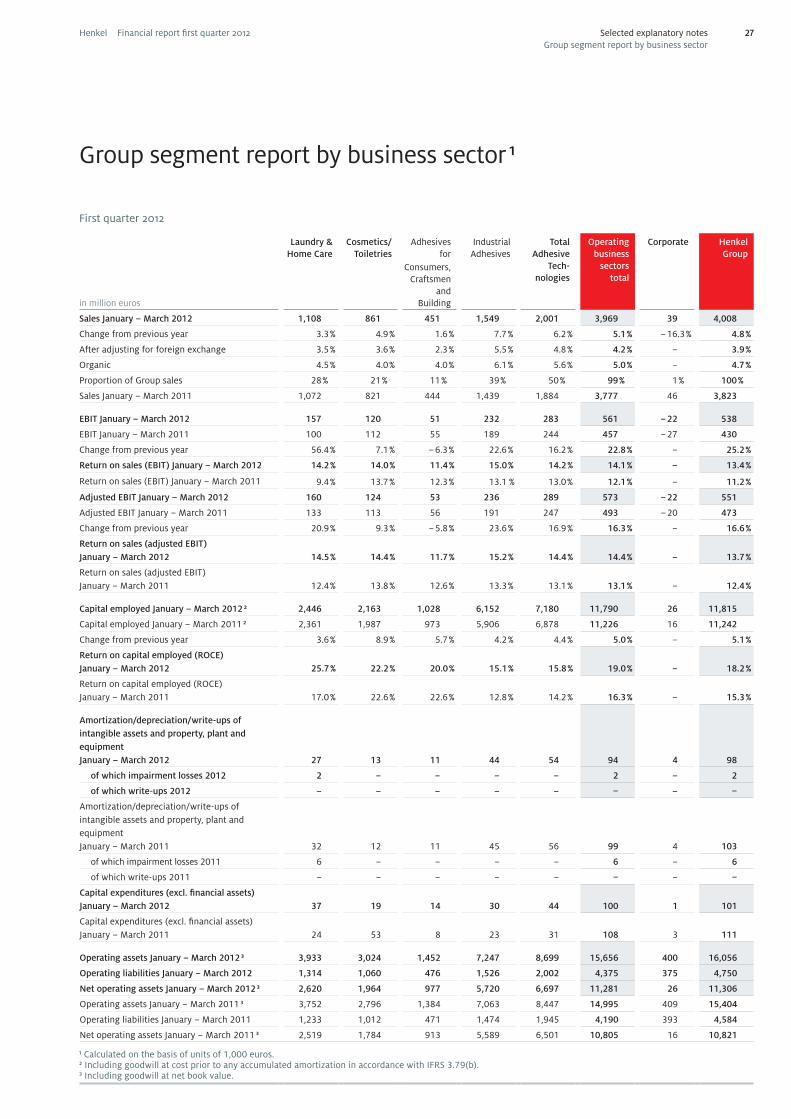
Group segment report by business sector 1
First quarter 2012
in million euros
Laundry & Home Care
Cosmetics/ Toiletries
Adhesives for
Consumers, Craftsmen
and Building
Industrial Adhesives
Total Adhesive
Tech- nologies
Operating business
sectors total
Corporate
Henkel Group
Sales January – March 2012 1,108 861 451 1,549 2,001 3,969 39 4,008
Change from previous year 3.3 % 4.9 % 1.6 % 7.7 % 6.2 % 5.1 % – 16.3 % 4.8 %
After adjusting for foreign exchange 3.5 % 3.6 % 2.3 % 5.5 % 4.8 % 4.2 % – 3.9 %
Organic 4.5 % 4.0 % 4.0 % 6.1 % 5.6 % 5.0 % – 4.7 %
Proportion of Group sales 28 % 21 % 11 % 39 % 50 % 99 % 1 % 100 %
Sales January – March 2011 1,072 821 444 1,439 1,884 3,777 46 3,823
EBIT January – March 2012 157 120 51 232 283 561 – 22 538
EBIT January – March 2011 100 112 55 189 244 457 – 27 430
Change from previous year 56.4 % 7.1 % – 6.3 % 22.6 % 16.2 % 22.8 % – 25.2 %
Return on sales (EBIT) January – March 2012 14.2 % 14.0 % 11.4 % 15.0 % 14.2 % 14.1 % – 13.4 %
Return on sales (EBIT) January – March 2011 9.4 % 13.7 % 12.3 % 13.1 % 13.0 % 12.1 % – 11.2 %
Adjusted EBIT January – March 2012 160 124 53 236 289 573 – 22 551
Adjusted EBIT January – March 2011 133 113 56 191 247 493 – 20 473
Change from previous year 20.9 % 9.3 % – 5.8 % 23.6 % 16.9 % 16.3 % – 16.6 %
Return on sales (adjusted EBIT) January – March 2012 14.5 % 14.4 % 11.7 % 15.2 % 14.4 % 14.4 % – 13.7 %
Return on sales (adjusted EBIT) January – March 2011 12.4 % 13.8 % 12.6 % 13.3 % 13.1 % 13.1 % – 12.4 %
Capital employed January – March 2012 2 2,446 2,163 1,028 6,152 7,180 11,790 26 11,815
Capital employed January – March 2011 2 2,361 1,987 973 5,906 6,878 11,226 16 11,242
Change from previous year 3.6 % 8.9 % 5.7 % 4.2 % 4.4 % 5.0 % – 5.1 %
Return on capital employed (ROCE) January – March 2012 25.7 % 22.2 % 20.0 % 15.1 % 15.8 % 19.0 % – 18.2 %
Return on capital employed (ROCE) January – March 2011 17.0 % 22.6 % 22.6 % 12.8 % 14.2 % 16.3 % – 15.3 %
Amortization/depreciation/write-ups of intangible assets and property, plant and equipment January – March 2012 27 13 11 44 54 94 4 98
of which impairment losses 2012 2 – – – – 2 – 2
of which write-ups 2012 – – – – – – – –
Amortization/depreciation/write-ups of intangible assets and property, plant and equipment January – March 2011
32
12
11
45
56
99
4
103
of which impairment losses 2011 6 – – – – 6 – 6
of which write-ups 2011 – – – – – – – –
Capital expenditures (excl. financial assets) January – March 2012 37 19 14 30 44 100 1 101
Capital expenditures (excl. financial assets) January – March 2011 24 53 8 23 31 108 3 111
Operating assets January – March 2012 3 3,933 3,024 1,452 7,247 8,699 15,656 400 16,056
Operating liabilities January – March 2012 1,314 1,060 476 1,526 2,002 4,375 375 4,750
Net operating assets January – March 2012 3 2,620 1,964 977 5,720 6,697 11,281 26 11,306
Operating assets January – March 2011 3 3,752 2,796 1,384 7,063 8,447 14,995 409 15,404
Operating liabilities January – March 2011 1,233 1,012 471 1,474 1,945 4,190 393 4,584
Net operating assets January – March 2011 3 2,519 1,784 913 5,589 6,501 10,805 16 10,821
1 Calculated on the basis of units of 1,000 euros.2 Including goodwill at cost prior to any accumulated amortization in accordance with IFRS 3.79(b).3 Including goodwill at net book value.
Selected explanatory notesGroup segment report by business sector
27Henkel Financial report first quarter 2012
Accounting policies
The interim financial report and interim consolidated finan-cial statements of the Henkel Group for the first quarter of the year have been prepared in accordance with section 37x (3) in conjunction with section 37w (2) of the German Securi-ties Trading Act (Wertpapierhandelsgesetz – WpHG), in accor-dance with International Financial Reporting Standards (IFRS) as adopted by the European Union, and consequently in compliance with International Accounting Standard (IAS) 34 “Interim Financial Reporting.”
The same accounting principles have been applied as for the 2011 consolidated financial statements, with the exception of the accounting pronouncements recently adopted in 2012. These pronouncements do not exert any material influence on the presentation of the quarterly financial report. In order to further ensure a true and fair view of our net assets, finan-cial position and results of operations, additional line items have been included and some line items have been renamed in the consolidated statement of financial position, consoli-dated statement of income, consolidated statement of com-prehensive income, consolidated statement of changes in equity and consolidated statement of cash flows.
To simplify interim financial reporting, IAS 34.41 allows cer-tain estimates and assumptions to be made beyond the scope permitted for annual financial statements, on condition that all material financial information is appropriately presented to enable a proper assessment of the net assets, financial po-sition and results of operations of the company. In calculat-ing taxes on income, the interim tax expense is determined on the basis of the estimated effective income tax rate for the current financial year.
The interim report for the first quarter of the year, comprised of condensed consolidated financial statements and an inter-im Group management report, was duly subjected to an audi-tor’s review.
Scope of consolidation
In addition to Henkel AG & Co. KGaA as the ultimate parent company, the scope of consolidation as of March 31, 2012 in-cludes eight German and 173 non-German companies in which Henkel AG & Co. KGaA has the power to govern finan-cial and operating policy, based on the concept of control. This is generally the case where Henkel AG & Co. KGaA holds, directly or indirectly, a majority of the voting rights. Compa-nies in which not more than half of the voting rights are held
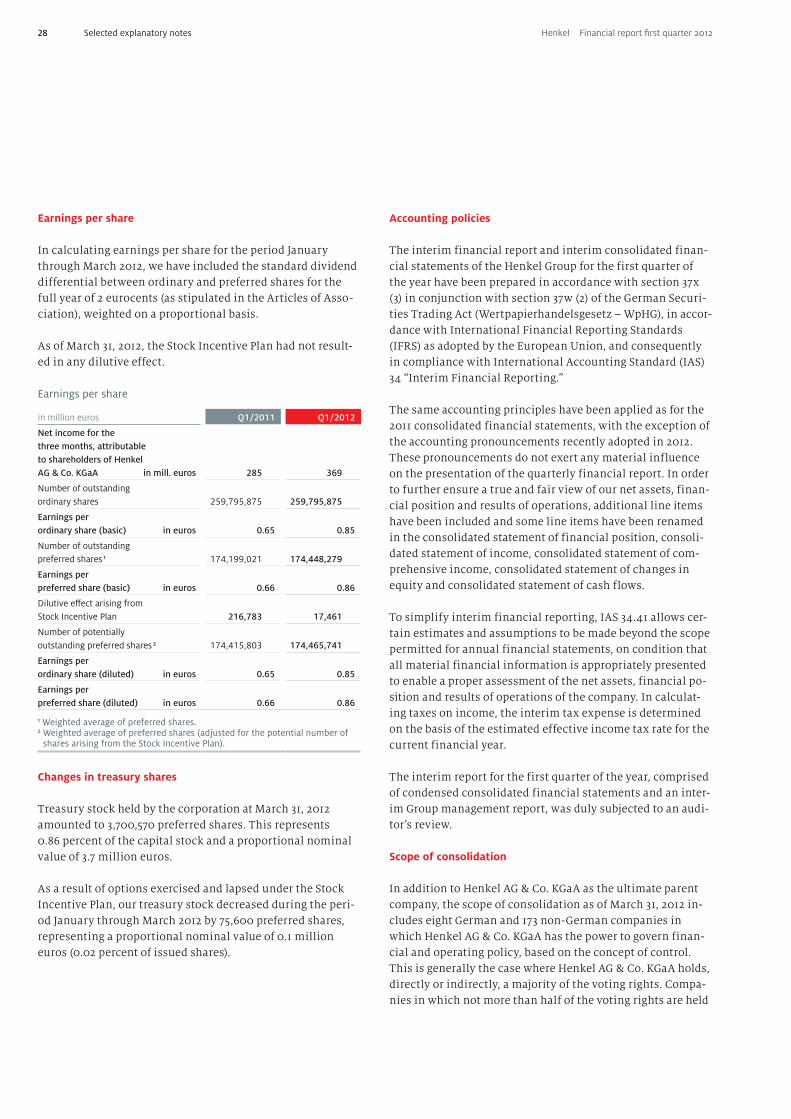
Earnings per share
In calculating earnings per share for the period January through March 2012, we have included the standard dividend differential between ordinary and preferred shares for the full year of 2 eurocents (as stipulated in the Articles of Asso-ciation), weighted on a proportional basis.
As of March 31, 2012, the Stock Incentive Plan had not result-ed in any dilutive effect.
Earnings per share
in million euros Q1/2011 Q1/2012
Net income for the three months, attributable to shareholders of Henkel AG & Co. KGaA in mill. euros 285 369
Number of outstanding ordinary shares 259,795,875 259,795,875
Earnings per ordinary share (basic) in euros 0.65 0.85
Number of outstanding preferred shares 1 174,199,021 174,448,279
Earnings per preferred share (basic) in euros 0.66 0.86
Dilutive effect arising from Stock Incentive Plan 216,783 17,461
Number of potentially outstanding preferred shares 2 174,415,803 174,465,741
Earnings per ordinary share (diluted) in euros 0.65 0.85
Earnings per preferred share (diluted) in euros 0.66 0.86
1 Weighted average of preferred shares. 2 Weighted average of preferred shares (adjusted for the potential number of
shares arising from the Stock Incentive Plan).
Changes in treasury shares
Treasury stock held by the corporation at March 31, 2012 amounted to 3,700,570 preferred shares. This represents 0.86 percent of the capital stock and a proportional nominal value of 3.7 million euros.
As a result of options exercised and lapsed under the Stock Incentive Plan, our treasury stock decreased during the peri-od January through March 2012 by 75,600 preferred shares, representing a proportional nominal value of 0.1 million euros (0.02 percent of issued shares).
Selected explanatory notes28 Henkel Financial report first quarter 2012
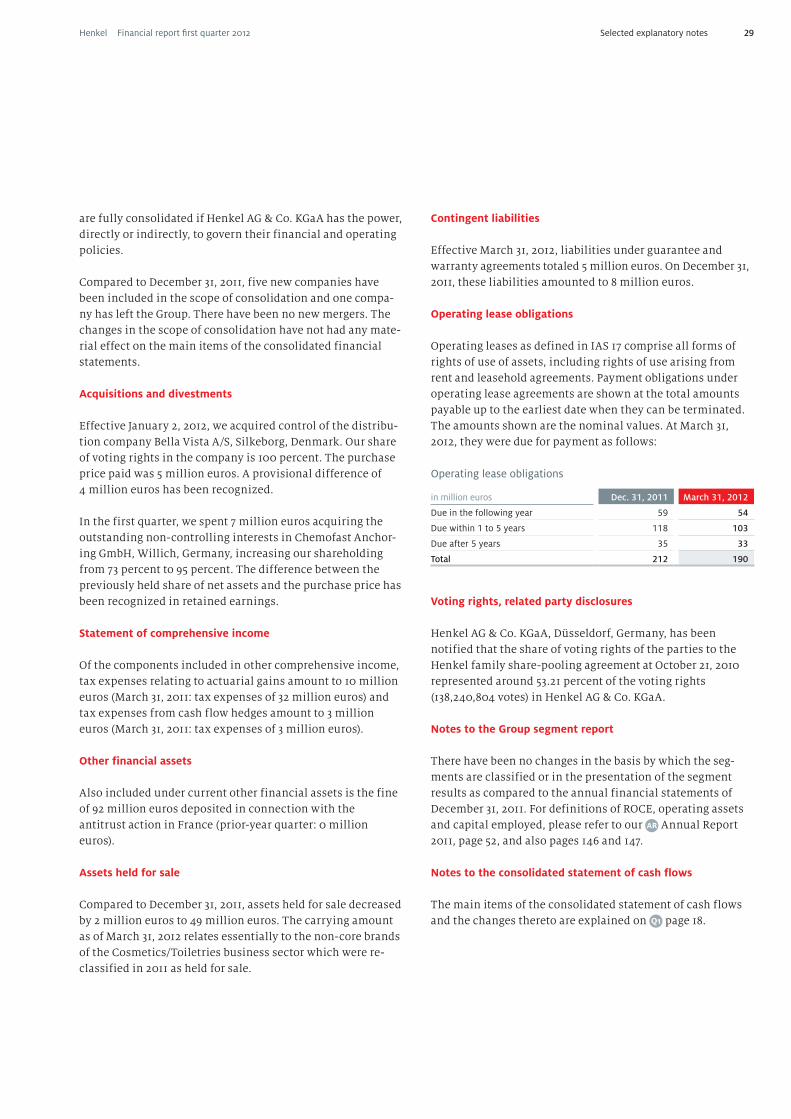
are fully consolidated if Henkel AG & Co. KGaA has the power, directly or indirectly, to govern their financial and operating policies.
Compared to December 31, 2011, five new companies have been included in the scope of consolidation and one compa-ny has left the Group. There have been no new mergers. The changes in the scope of consolidation have not had any mate-rial effect on the main items of the consolidated financial statements.
Acquisitions and divestments
Effective January 2, 2012, we acquired control of the distribu-tion company Bella Vista A/S, Silkeborg, Denmark. Our share of voting rights in the company is 100 percent. The purchase price paid was 5 million euros. A provisional difference of 4 million euros has been recognized.
In the first quarter, we spent 7 million euros acquiring the outstanding non-controlling interests in Chemofast Anchor-ing GmbH, Willich, Germany, increasing our shareholding from 73 percent to 95 percent. The difference between the previously held share of net assets and the purchase price has been recognized in retained earnings.
Statement of comprehensive income
Of the components included in other comprehensive income, tax expenses relating to actuarial gains amount to 10 million euros (March 31, 2011: tax expenses of 32 million euros) and tax expenses from cash flow hedges amount to 3 million euros (March 31, 2011: tax expenses of 3 million euros).
Other financial assets
Also included under current other financial assets is the fine of 92 million euros deposited in connection with the antitrust action in France (prior-year quarter: 0 million euros).
Assets held for sale
Compared to December 31, 2011, assets held for sale decreased by 2 million euros to 49 million euros. The carrying amount as of March 31, 2012 relates essentially to the non-core brands of the Cosmetics/Toiletries business sector which were re-classified in 2011 as held for sale.
Contingent liabilities
Effective March 31, 2012, liabilities under guarantee and warranty agreements totaled 5 million euros. On December 31, 2011, these liabilities amounted to 8 million euros.
Operating lease obligations
Operating leases as defined in IAS 17 comprise all forms of rights of use of assets, including rights of use arising from rent and leasehold agreements. Payment obligations under operating lease agreements are shown at the total amounts payable up to the earliest date when they can be terminated. The amounts shown are the nominal values. At March 31, 2012, they were due for payment as follows:
Operating lease obligations
in million euros Dec. 31, 2011 March 31, 2012
Due in the following year 59 54
Due within 1 to 5 years 118 103
Due after 5 years 35 33
Total 212 190
Voting rights, related party disclosures
Henkel AG & Co. KGaA, Düsseldorf, Germany, has been notified that the share of voting rights of the parties to the Henkel family share-pooling agreement at October 21, 2010 represented around 53.21 percent of the voting rights (138,240,804 votes) in Henkel AG & Co. KGaA.
Notes to the Group segment report
There have been no changes in the basis by which the seg-ments are classified or in the presentation of the segment results as compared to the annual financial statements of December 31, 2011. For definitions of ROCE, operating assets and capital employed, please refer to our Annual Report 2011, page 52, and also pages 146 and 147.
Notes to the consolidated statement of cash flows
The main items of the consolidated statement of cash flows and the changes thereto are explained on page 18.
Selected explanatory notes 29Henkel Financial report first quarter 2012
2410. Those standards require that we plan and perform the review so that we can preclude through critical evaluation, with a certain level of assurance, that the condensed interim consol-idated financial statements have not been pre-pared, in material aspects, in accordance with the IFRS applicable to interim financial reporting as adopted by the EU, and that the interim group management report has not been prepared, in material aspects, in accordance with the regula-tions of the German Securities Trading Act appli-cable to interim group management reports. A review is limited primarily to inquiries of com-pany employees and analytical assessments and therefore does not provide the assurance attain-able in a financial statement audit. Since, in ac-cordance with our engagement, we have not per-formed a financial statement audit, we cannot issue an auditor’s report. Based on our review, no matters have come to our attention that cause us to believe that the condensed interim consolidat-ed financial statements have not been prepared, in material respects, in accordance with the IFRS applicable to interim financial reporting as ad-opted by the EU, or that the interim group man-agement report has not been prepared, in mate-rial respects, in accordance with the regulations of the German Securities Trading Act applicable to interim group management reports.
Düsseldorf, May 2, 2012
KPMG AGWirtschaftsprüfungsgesellschaft
Prof. Dr. Kai C. Andrejewski Michael GewehrWirtschaftsprüfer Wirtschaftsprüfer (German Public Auditor) (German Public Auditor)
To Henkel AG & Co. KGaA, Düsseldorf:We have reviewed the condensed interim consol-idated financial statements – comprising the consolidated statement of financial position, the consolidated statement of income, the consoli-dated statement of comprehensive income, the consolidated statement of changes in equity, the consolidated statement of cash flows and select-ed notes – and the interim group management report of Henkel AG & Co. KGaA, Düsseldorf, for the period from January 1, 2012 to March 31, 2012 which form part of the quarterly financial report according to section 37x (3) in conjunction with section 37w (2) German Securities Trading Act (Wertpapierhandelsgesetz – WpHG).
The preparation of the condensed interim con-solidated financial statements in accordance with those International Financial Reporting Standards (IFRS) applicable to interim financial reporting as adopted by the EU, and of the inter-im group management report in accordance with the requirements of the German Securities Trad-ing Act applicable to interim group management reports, is the responsibility of the Company’s management. Our responsibility is to issue a report on the condensed interim consolidated financial statements and on the interim group management report based on our review.
We conducted our review of the condensed inter-im consolidated financial statements and the interim group management report in accordance with the German generally accepted standards for the review of financial statements promulgat-ed by the Institut der Wirtschaftsprüfer (IDW) and in supplementary compliance with the Inter-national Standard on Review Engagements (ISRE)
Independent review report
30 Henkel Financial report first quarter 2012
In the meeting of May 2, 2012, the Audit Commit-tee was presented the interim consolidated finan-cial report for the first three months of fiscal 2012 and the report prepared by KPMG AG, Wirtschaftsprüfungsgesellschaft, on its review of the condensed interim consolidated financial statements and the interim Group management report. The Audit Committee also received verbal explanations from the Management Board and KPMG pertaining to the above. The Audit Com-mittee has approved and endorses the interim consolidated financial report.
Düsseldorf, May 2, 2012
Chairman of the Audit CommitteeProf. Dr. Theo Siegert
Report of the Audit Committee of theSupervisory Board
31Henkel Financial report first quarter 2012
Henkel AG & Co. KGaA40191 Düsseldorf, GermanyPhone: +49 (0)211 / 797-0www.henkel.com
Published by: Henkel AG & Co. KGaA 40191 Düsseldorf, Germany Phone: +49 (0) 211 / 797-0
© 2012 Henkel AG & Co. KGaA
Edited by:Corporate Communications, Investor Relations, Corporate Accounting and Reporting Coordination: Constance Spitzer, Jens Bruno Wilhelm, Wolfgang ZengerlingEnglish translation: Paul Knighton, Cambridge Design and production: mpm Corporate Communication Solutions, MainzPhotographs: Claudia Kempf, Rüdiger Nehmzow; Henkel Printed by: Druckpartner, Essen
Date of publication of this Report:May 9, 2012
Corporate CommunicationsPhone: +49 (0) 211 / 797-26 06 Fax: +49 (0) 211 / 798-24 84 E-mail: [email protected]
Investor RelationsPhone: +49 (0) 211 / 797-39 37 Fax: +49 (0) 211 / 798-28 63 E-mail: [email protected]
Publication of Report for the Second Quarter / Half Year 2012:
Wednesday, August 1, 2012
Publication of Report for the Third Quarter / Nine Months 2012:Friday, November 16, 2012
Publication of Report for Fiscal 2012:Thursday, February 28, 2013
Annual General Meeting Henkel AG & Co. KGaA 2013:Monday, April 15, 2013
Up-to-date facts and figures on Henkel also available on the internet: www.henkel.com Our quarterly reports are also published in the Henkel Corporate Report app for iPads.
Credits Financial calendar
This financial report is printed on PROFIsilkFSC from Sappi. The paper is made from pulp bleached without chlorine. It consists of wood fibers originating from sustainably managed forests and certified according to the rules of the Forest Stewardship Council (FSC). The printing inks contain no heavy metals.
All product names are registered trademarks of Henkel AG & Co. KGaA, Düsseldorf, or our affiliated companies.
This document contains forward-looking statements which are based on the current estimates and assumptions made by the executive man agement of Henkel AG & Co. KGaA. Forward-looking statements are characterized by the use of words such as expect, intend, plan, predict, assume, believe, estimate, anticipate, forecast and similar formulations. Such statements are not to be understood as in any way guaranteeing that those expectations will turn out to be accurate. Future performance and the results actually achieved by Henkel AG & Co. KGaA and its affiliated companies depend on a number of risks and uncertainties and may therefore differ materially from such forward-looking statements. Many of these factors are outside Henkel’s control and cannot be accurately estimated in advance, such as the future economic environment and the actions of competitors and others involved in the marketplace. Henkel neither plans nor undertakes to update forward-looking statements.
The Henkel Corporate Report app:
Henkel in social media:
www.facebook.com/henkelwww.twitter.com/henkelwww.youtube.com/henkel