JANUARY - JUNE - santander.com · P/E ratio (X) 10.62 11.06 10.62 12.49 13.56 Note. The financial...
67
2018 Financial Report JANUARY - JUNE #SimplePersonalFair
Transcript of JANUARY - JUNE - santander.com · P/E ratio (X) 10.62 11.06 10.62 12.49 13.56 Note. The financial...
2018Financial Report
JANUARY - JUNE
#SimplePersonalFair
3 Key consolidated data
4 Santander aim
6 Group performance
9 General background
10 Income statement and balance sheet
17 Solvency ratios
18 Risk management
20 Business information
37 Corporate Governance
38 Sustainability
39 The Santander share
40 Financial information. Appendix
58 Alternative Performance Measures
FINANCIALREPORT
January - June 2018
All customers. shareholders and the general publiccan use Santander’s official social network channelsin all the countries in which the Bank operates,
3Financial Report 2018
JANUARY - JUNEKey consolidated data
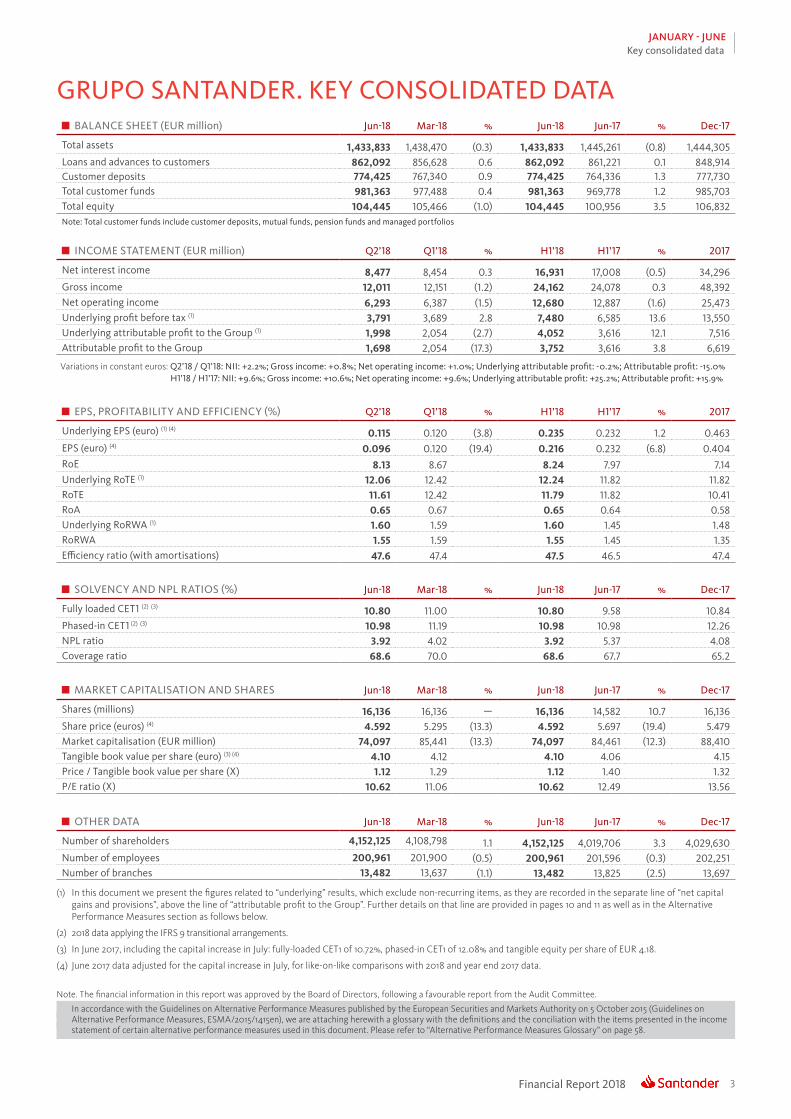
GRUPO SANTANDER. KEY CONSOLIDATED DATA BALANCE SHEET (EUR million) Jun-18 Mar-18 % Jun-18 Jun-17 % Dec-17
Total assets 1,433,833 1,438,470 (0.3) 1,433,833 1,445,261 (0.8) 1,444,305Loans and advances to customers 862,092 856,628 0.6 862,092 861,221 0.1 848,914Customer deposits 774,425 767,340 0.9 774,425 764,336 1.3 777,730Total customer funds 981,363 977,488 0.4 981,363 969,778 1.2 985,703Total equity 104,445 105,466 (1.0) 104,445 100,956 3.5 106,832Note: Total customer funds include customer deposits, mutual funds, pension funds and managed portfolios
INCOME STATEMENT (EUR million) Q2’18 Q1’18 % H1’18 H1’17 % 2017
Net interest income 8,477 8,454 0.3 16,931 17,008 (0.5) 34,296Gross income 12,011 12,151 (1.2) 24,162 24,078 0.3 48,392Net operating income 6,293 6,387 (1.5) 12,680 12,887 (1.6) 25,473Underlying profit before tax (1) 3,791 3,689 2.8 7,480 6,585 13.6 13,550Underlying attributable profit to the Group (1) 1,998 2,054 (2.7) 4,052 3,616 12.1 7,516Attributable profit to the Group 1,698 2,054 (17.3) 3,752 3,616 3.8 6,619
Variations in constant euros: Q2’18 / Q1’18: NII: +2.2%; Gross income: +0.8%; Net operating income: +1.0%; Underlying attributable profit: -0.2%; Attributable profit: -15.0% H1’18 / H1’17: NII: +9.6%; Gross income: +10.6%; Net operating income: +9.6%; Underlying attributable profit: +25.2%; Attributable profit: +15.9%
EPS, PROFITABILITY AND EFFICIENCY (%) Q2’18 Q1’18 % H1’18 H1’17 % 2017
Underlying EPS (euro) (1) (4) 0.115 0.120 (3.8) 0.235 0.232 1.2 0.463EPS (euro) (4) 0.096 0.120 (19.4) 0.216 0.232 (6.8) 0.404RoE 8.13 8.67 8.24 7.97 7.14Underlying RoTE (1) 12.06 12.42 12.24 11.82 11.82RoTE 11.61 12.42 11.79 11.82 10.41RoA 0.65 0.67 0.65 0.64 0.58Underlying RoRWA (1) 1.60 1.59 1.60 1.45 1.48RoRWA 1.55 1.59 1.55 1.45 1.35Efficiency ratio (with amortisations) 47.6 47.4 47.5 46.5 47.4
SOLVENCY AND NPL RATIOS (%) Jun-18 Mar-18 % Jun-18 Jun-17 % Dec-17
Fully loaded CET1 (2) (3) 10.80 11.00 10.80 9.58 10.84Phased-in CET1 (2) (3) 10.98 11.19 10.98 10.98 12.26NPL ratio 3.92 4.02 3.92 5.37 4.08Coverage ratio 68.6 70.0 68.6 67.7 65.2
OTHER DATA Jun-18 Mar-18 % Jun-18 Jun-17 % Dec-17
Number of shareholders 4,152,125 4,108,798 1.1 4,152,125 4,019,706 3.3 4,029,630Number of employees 200,961 201,900 (0.5) 200,961 201,596 (0.3) 202,251Number of branches 13,482 13,637 (1.1) 13,482 13,825 (2.5) 13,697
MARKET CAPITALISATION AND SHARES Jun-18 Mar-18 % Jun-18 Jun-17 % Dec-17
Shares (millions) 16,136 16,136 — 16,136 14,582 10.7 16,136Share price (euros) (4) 4.592 5.295 (13.3) 4.592 5.697 (19.4) 5.479Market capitalisation (EUR million) 74,097 85,441 (13.3) 74,097 84,461 (12.3) 88,410Tangible book value per share (euro) (3) (4) 4.10 4.12 4.10 4.06 4.15Price / Tangible book value per share (X) 1.12 1.29 1.12 1.40 1.32P/E ratio (X) 10.62 11.06 10.62 12.49 13.56
Note. The financial information in this report was approved by the Board of Directors, following a favourable report from the Audit Committee.
In accordance with the Guidelines on Alternative Performance Measures published by the European Securities and Markets Authority on 5 October 2015 (Guidelines onAlternative Performance Measures, ESMA/2015/1415en), we are attaching herewith a glossary with the definitions and the conciliation with the items presented in the incomestatement of certain alternative performance measures used in this document. Please refer to “Alternative Performance Measures Glossary” on page 58.
(1) In this document we present the figures related to “underlying” results, which exclude non-recurring items, as they are recorded in the separate line of “net capital gains and provisions”, above the line of “attributable profit to the Group”. Further details on that line are provided in pages 10 and 11 as well as in the Alternative Performance Measures section as follows below.
(2) 2018 data applying the IFRS 9 transitional arrangements.
(3) In June 2017, including the capital increase in July: fully-loaded CET1 of 10.72%, phased-in CET1 of 12.08% and tangible equity per share of EUR 4.18.
(4) June 2017 data adjusted for the capital increase in July, for like-on-like comparisons with 2018 and year end 2017 data.
Financial Report 20184
JANUARY - JUNESantander aim
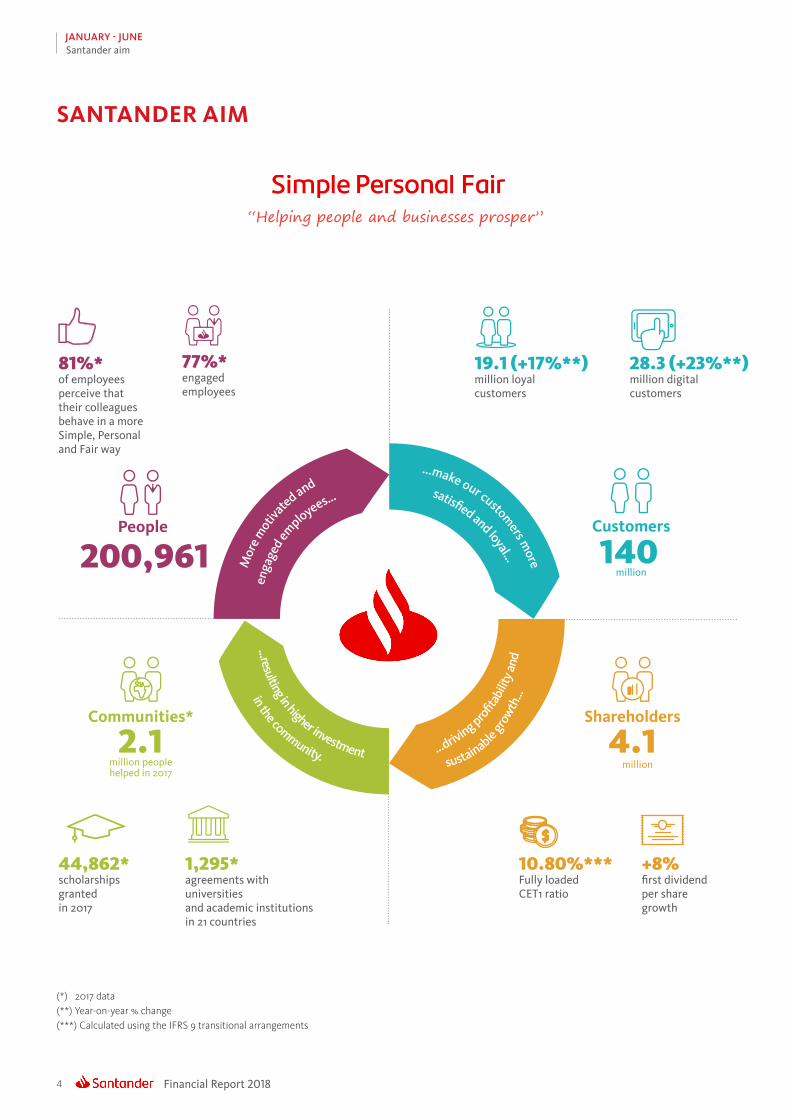
SANTANDER AIM
(*) 2017 data(**) Year-on-year % change(***) Calculated using the IFRS 9 transitional arrangements
“Helping people and businesses prosper”
People
200,961Customers
million140
2.1Communities*
million peoplehelped in 2017
Shareholders
4.1 million
81%*of employeesperceive thattheir colleaguesbehave in a moreSimple, Personaland Fair way
44,862*scholarshipsgrantedin 2017
19.1 (+17%**)million loyalcustomers
10.80%***Fully loadedCET1 ratio
77%*engagedemployees
1,295*agreements withuniversitiesand academic institutionsin 21 countries
28.3 (+23%**)million digital customers
+8%first dividendper sharegrowth
Mor
e mot
iva
ted and
...resulting in higher investment
enga
ged e
mployees...
in the community.
...make our customers m
ore
satisf ed and loyal…
...driving prof t
abili
ty a
nd
sustainable grow
th…
5Financial Report 2018
JANUARY - JUNESantander aim
SANTANDER AIM
Progress was made in installing the Workday platform (One Team programme), which will enable us to have a talent pool at the global level, manage talent in a more Simple, Personal and Fair way and enhance the experience of our professionals.
The first phase of the Strategic Workforce Planning was carried out in the UK, Mexico and the Corporate Centre. This project aims to identify the talent needed in the medium- and short-term, quantifying the skills required for the future. Action plans have been put into effect in these countries.
Behaviours in the life cycle of employees continued to be incorporated. Of note was the consolidation of MyContribution, the performance management model where the achievement of results is balanced with how they are attained. Another example are succession plans, where behaviours are key.
We are Santander week, a global initiative for transmitting Santander’s culture to its employees, as well as fostering pride in belonging to the Group, was held for the 11th time.
.
Various strategies continued to be developed under the commercial transformation programme in order to improve customer loyalty and experience. The number of loyal customers rose by 2.8 million and digital ones by 5.3 million year-on-year.
Of note among the commercial actions implemented in the second quarter were the launch of the 1|2|3 Profesional in Spain (the first joint offer from Santander and Popular), the launch of the first digital SME account for companies under the SAS regime (Company for Simplified Actions) in Mexico and the good results of Santander Life in Chile.
As regards digitalisation, in Brazil we launched the new app for managing sales. In Spain, the first operations of we.trade, a blockchain-based platform that facilitates the internationalisation of companies, were made. In Argentina, the new online banking service continued to be well received.
In mobile banking, Poland now offers five ways to pay: Apple Pay, Google Pay, Garmin Pay, BLIK and HCE. In the UK, we were the first bank to offer Garmin Pay and Fitbit Pay.
Santander’s investor relations was ranked top in Spain and second among European banks by the Extel survey, which includes responses from 11,000 investment professionals.
For the third year running, the IR Magazine Awards recognised Santander as one of the best European companies and banks in investor relations in Europe. We were rated first in the categories of Best Use of Multimedia for IR, Best IR during a Corporate Transaction and Best Investor Relations Event, and third in Best in IR Financial Sector (banks and insurance) and in Best Investor Relations Officer in Europe (all sectors).
A survey was conducted among investors, analysts and shareholders in Spain and the UK to assess the implanting of the corporate culture and our contribution to progress.
Santander joined the responsible banking initiative promoted by the United Nations. Together with 25 other big banks from five continents, we will develop principles for adapting the financial sector to the UN’s Sustainable Development Goals and the Paris Climate Agreement.
At an event presided by HM Queen Letizia, Ana Botín awarded the prizes on 7 May to the ten winning projects of the 10th Convening of Banco Santander’s Social projects, financed by the Euros from your Payroll fund.
For the ninth year running, Banco Santander turned off the lights in the most emblematic buildings in its 10 core markets and in its branch network, as part of the WWF’s Earth Hour campaign.
Some 20,800 kg of food was collected during the We are Santander Week and delivered to the Red Cross.
People
Customers
Shareholders
Community

Financial Report 20186
JANUARY - JUNEConsolidated financial report
GROUP PERFORMANCE
GROWTH
The commercial transformation is driving growth in loyal and digital customers, reflected in greater business in almost all markets
Santander’s strategy remained focus on customer loyalty. The number of loyal customers continued to rise in the second quarter and was 2.8 million higher than in June 2017 (+17%), with individuals as well as companies rising.
The number of digital customers rose by 5.3 million (+23%) in the last 12 months, underscoring the strength of our multichannel strategy. Penetration of digital clients and the use of mobile devices is growing notably.
Growth benefited from the incorporation of Banco Popular’s customers in March 2018.
The trend in volumes improved in the quarter. In local currency, lending and customer funds increased 2%, and in both mature and developing markets.
Loans grew year-on-year in nine of the ten core units and funds in eight. Demand and time deposits and mutual funds all increased.
Solid funding and liquidity structure. Net loan-to-deposit ratio of 111% (113% in June 2017).
LOYAL CUSTOMERSMillions
DIGITAL CUSTOMERSMillions
JUN-18 VERSUS JUN-17% change in constant euros
During the second quarter we have delivered strong growth in underlying revenue and improving credit quality, despite strong currency headwinds
Our business model enabled us to improve dynamics in volumes and increase profts in almost all units
7Financial Report 2018
JANUARY - JUNEConsolidated financial report
Solid capital ratios, appropriate for our business model, balance sheet structure and risk profile. Credit quality improved in the last few quarters
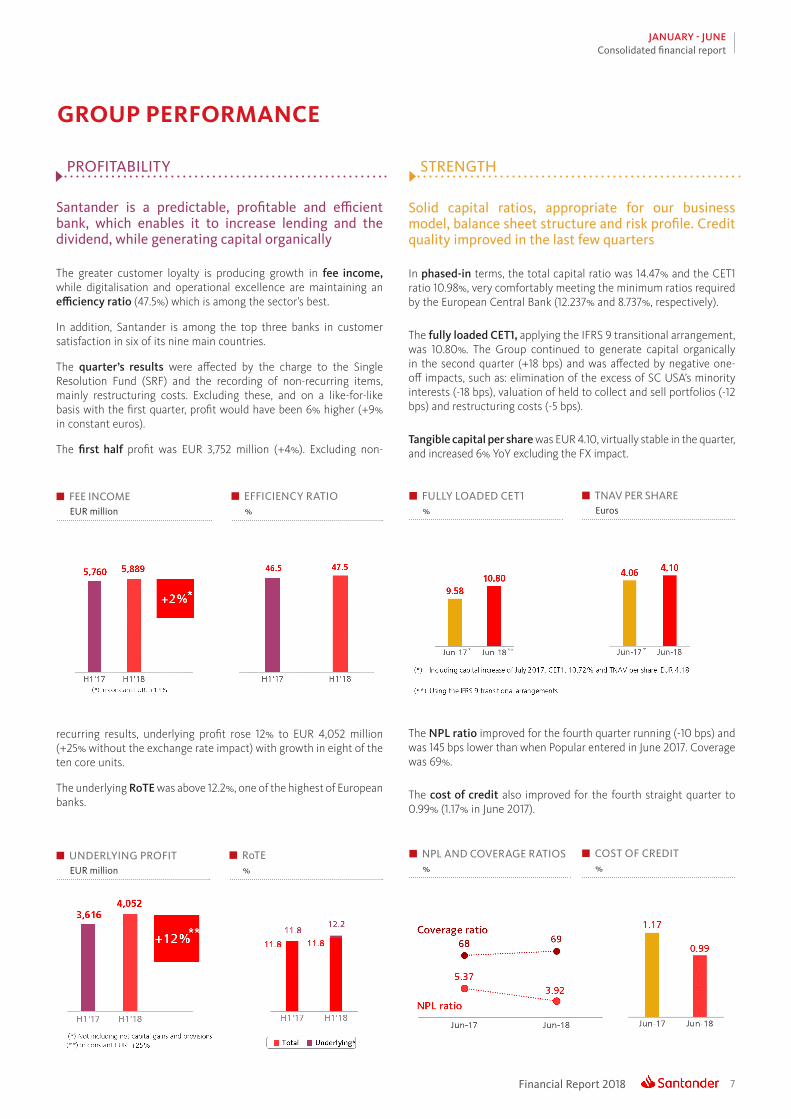
In phased-in terms, the total capital ratio was 14.47% and the CET1 ratio 10.98%, very comfortably meeting the minimum ratios required by the European Central Bank (12.237% and 8.737%, respectively).
The fully loaded CET1, applying the IFRS 9 transitional arrangement, was 10.80%. The Group continued to generate capital organically in the second quarter (+18 bps) and was affected by negative one-off impacts, such as: elimination of the excess of SC USA’s minority interests (-18 bps), valuation of held to collect and sell portfolios (-12 bps) and restructuring costs (-5 bps).
Tangible capital per share was EUR 4.10, virtually stable in the quarter, and increased 6% YoY excluding the FX impact.
The NPL ratio improved for the fourth quarter running (-10 bps) and was 145 bps lower than when Popular entered in June 2017. Coverage was 69%.
The cost of credit also improved for the fourth straight quarter to 0.99% (1.17% in June 2017).
FULLY LOADED CET1%
TNAV PER SHAREEuros
GROUP PERFORMANCE
NPL AND COVERAGE RATIOS%
COST OF CREDIT%
PROFITABILITY STRENGTH
Santander is a predictable, profitable and efficient bank, which enables it to increase lending and the dividend, while generating capital organically
The greater customer loyalty is producing growth in fee income, while digitalisation and operational excellence are maintaining an efficiency ratio (47.5%) which is among the sector’s best.
In addition, Santander is among the top three banks in customer satisfaction in six of its nine main countries.
The quarter’s results were affected by the charge to the Single Resolution Fund (SRF) and the recording of non-recurring items, mainly restructuring costs. Excluding these, and on a like-for-like basis with the first quarter, profit would have been 6% higher (+9% in constant euros).
The frst half profit was EUR 3,752 million (+4%). Excluding non-
recurring results, underlying profit rose 12% to EUR 4,052 million (+25% without the exchange rate impact) with growth in eight of the ten core units.
The underlying RoTE was above 12.2%, one of the highest of European banks.
FEE INCOMEEUR million
EFFICIENCY RATIO%
UNDERLYING PROFITEUR million
RoTE%

Financial Report 20188
JANUARY - JUNEConsolidated financial report
UNDERLYING ATTRIBUTABLE PROFIT. H1’18EUR million. % change YoY in constant euros
(Greater detail on pages 20 to 36 and in the appendix)
MAIN BUSINESS AREAS PERFORMANCE
(Changes in constant euros)
• Continental Europe recorded an attributable profit of EUR 1,447 million in the first half, having included costs associated with integrations (mainly restructuring costs) net of tax impacts in Spain and Portugal in the last quarter.
Excluding these impacts, underlying attributable profit would have been EUR 1,707 million, an annual increase of 15%. Growth was largely due to the increase in commercial revenue and also benefited from Banco Popular’s integration and the greater stake in Santander Asset Management.
Underlying profit was 17% lower in the second quarter than in the first, due to the contribution to the Single Resolution Fund (SRF) and lower gains on financial transactions in Spain. Commercial revenue and costs were practically flat and provisions were lower.
• United Kingdom: in a highly competitive environment with some remaining uncertainties surrounding Brexit, attributable profit was 14% lower year-on-year at EUR 692 million. This was due to pressure on spreads and investments in regulatory and strategic projects. Cost of credit was only 10 bps.
The second quarter attributable profit was 16% higher quarter-on-quarter. The pressure on mortgage spreads was offset by higher fee income, increased gains on financial transactions and lower costs and provisions.
EUROPE THE AMERICAS
• Latin America: attributable profit of EUR 2,214 million, 26% higher year-on-year. Growth in volumes, spreads management and increased loyalty underpinned the good evolution, both in net interest income as well as fee income, in addition to an improved cost of credit.
Operating expenses grew mainly due to plans relating to the expansion, commercial transformation and increased digitalisation of our retail networks.
Profit was 7% higher in the second quarter than in the first, due to the good performance of net interest income and fee income, which rose for the fifth consecutive quarter, and stable provisions.
• United States: first half profit of EUR 335 million, 54% more year-on-year, due to a fall in costs and, above all, reduced provisions, which comfortably offset the decline in gross income from lower personal loans, reduced spreads, higher funding costs and the drop in fee income from servicing.
Quarter-on-quarter, profit was up 64%, partially due to a seasonal effect at SC USA. Good performance of all P&L lines: gross income increased, and costs and provisions declined (all three for the second quarter running).
UNDERLYING ATTRIBUTABLE PROFIT GEOGRAPHIC DISTRIBUTION*. H1’18
United Kingdom: 14%
Other America: 2%
Spain: 15%
SCF: 13%
Portugal: 4%Poland: 3%
Mexico: 7%
Brazil: 26%
Chile: 6%Argentina: 3%
USA: 7%
(*) % operating areas excluding Spain Real Estate Activity and Corporate Centre
9Financial Report 2018
JANUARY - JUNE
GENERAL BACKGROUND
EXCHANGE RATES: 1 EURO / CURRENCY PARITY
Average (income statement) Period-end (balance sheet)
H1’18 H1’17 Jun-18 Mar-18 Jun-17
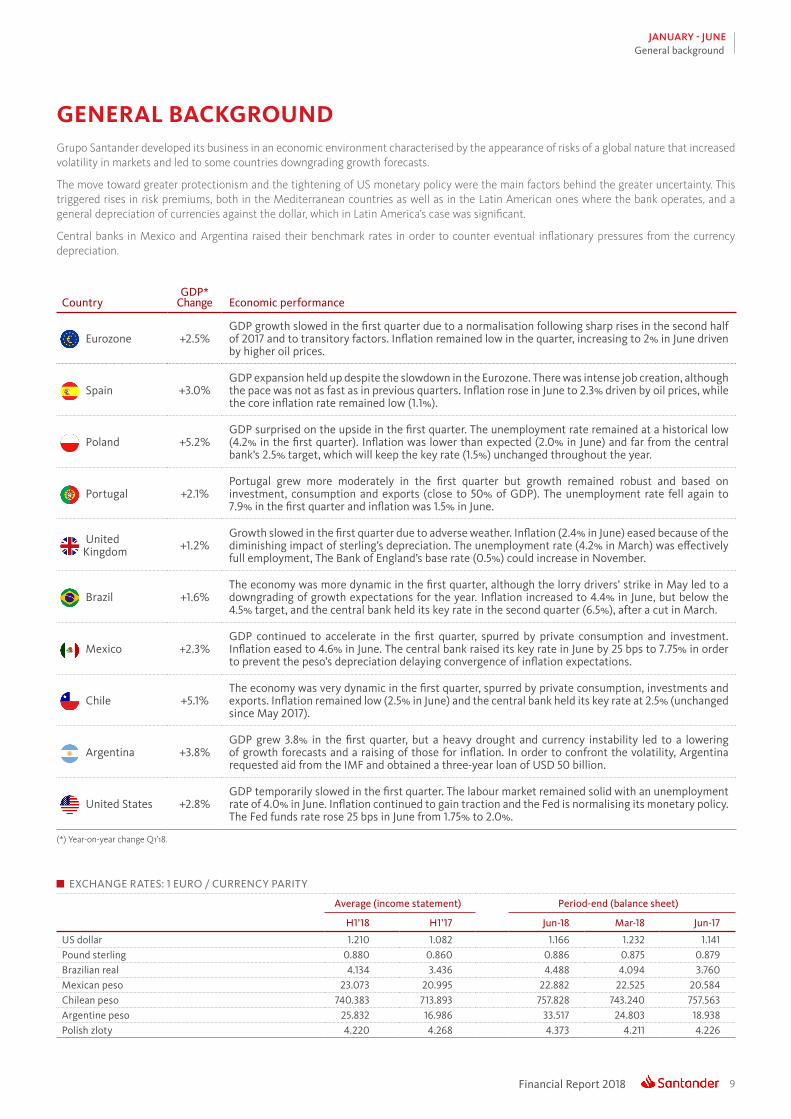
US dollar 1.210 1.082 1.166 1.232 1.141Pound sterling 0.880 0.860 0.886 0.875 0.879Brazilian real 4.134 3.436 4.488 4.094 3.760Mexican peso 23.073 20.995 22.882 22.525 20.584Chilean peso 740.383 713.893 757.828 743.240 757.563Argentine peso 25.832 16.986 33.517 24.803 18.938Polish zloty 4.220 4.268 4.373 4.211 4.226
Grupo Santander developed its business in an economic environment characterised by the appearance of risks of a global nature that increased volatility in markets and led to some countries downgrading growth forecasts.
The move toward greater protectionism and the tightening of US monetary policy were the main factors behind the greater uncertainty. This triggered rises in risk premiums, both in the Mediterranean countries as well as in the Latin American ones where the bank operates, and a general depreciation of currencies against the dollar, which in Latin America’s case was significant.
Central banks in Mexico and Argentina raised their benchmark rates in order to counter eventual inflationary pressures from the currency depreciation.
CountryGDP*
Change Economic performance
Eurozone +2.5%GDP growth slowed in the first quarter due to a normalisation following sharp rises in the second half of 2017 and to transitory factors. Inflation remained low in the quarter, increasing to 2% in June driven by higher oil prices.
Spain +3.0%GDP expansion held up despite the slowdown in the Eurozone. There was intense job creation, although the pace was not as fast as in previous quarters. Inflation rose in June to 2.3% driven by oil prices, while the core inflation rate remained low (1.1%).
Poland +5.2%GDP surprised on the upside in the first quarter. The unemployment rate remained at a historical low (4.2% in the first quarter). Inflation was lower than expected (2.0% in June) and far from the central bank’s 2.5% target, which will keep the key rate (1.5%) unchanged throughout the year.
Portugal +2.1%Portugal grew more moderately in the first quarter but growth remained robust and based on investment, consumption and exports (close to 50% of GDP). The unemployment rate fell again to 7.9% in the first quarter and inflation was 1.5% in June.
United Kingdom +1.2%
Growth slowed in the first quarter due to adverse weather. Inflation (2.4% in June) eased because of the diminishing impact of sterling’s depreciation. The unemployment rate (4.2% in March) was effectively full employment, The Bank of England’s base rate (0.5%) could increase in November.
Brazil +1.6%The economy was more dynamic in the first quarter, although the lorry drivers’ strike in May led to a downgrading of growth expectations for the year. Inflation increased to 4.4% in June, but below the 4.5% target, and the central bank held its key rate in the second quarter (6.5%), after a cut in March.
Mexico +2.3%GDP continued to accelerate in the first quarter, spurred by private consumption and investment. Inflation eased to 4.6% in June. The central bank raised its key rate in June by 25 bps to 7.75% in order to prevent the peso’s depreciation delaying convergence of inflation expectations.
Chile +5.1%The economy was very dynamic in the first quarter, spurred by private consumption, investments and exports. Inflation remained low (2.5% in June) and the central bank held its key rate at 2.5% (unchanged since May 2017).
Argentina +3.8%GDP grew 3.8% in the first quarter, but a heavy drought and currency instability led to a lowering of growth forecasts and a raising of those for inflation. In order to confront the volatility, Argentina requested aid from the IMF and obtained a three-year loan of USD 50 billion.
United States +2.8%GDP temporarily slowed in the first quarter. The labour market remained solid with an unemployment rate of 4.0% in June. Inflation continued to gain traction and the Fed is normalising its monetary policy. The Fed funds rate rose 25 bps in June from 1.75% to 2.0%.
(*) Year-on-year change Q1’18.
General background

Financial Report 201810
JANUARY - JUNEConsolidated financial report
GRUPO SANTANDER RESULTS
GRUPO SANTANDER. INCOME STATEMENT EUR million
Change Change
Q2’18 Q1’18 % % excl. FX H1’18 H1’17 % % excl. FX
Net interest income 8,477 8,454 0.3 2.2 16,931 17,008 (0.5) 9.6Net fee income 2,934 2,955 (0.7) 1.9 5,889 5,760 2.2 12.8Gains (losses) on financial transactions 361 493 (26.8) (25.5) 854 859 (0.6) 12.6Other operating income 239 249 (4.0) (6.3) 488 451 8.2 16.4
Dividends 229 35 554.3 555.4 264 279 (5.3) (2.4) Income from equity-accounted method 176 178 (1.1) 0.4 354 293 21.0 32.2 Other operating income/expenses (166) 36 — — (130) (120) 8.1 9.2
Gross income 12,011 12,151 (1.2) 0.8 24,162 24,078 0.3 10.6Operating expenses (5,718) (5,764) (0.8) 0.7 (11,482) (11,191) 2.6 11.7
General administrative expenses (5,114) (5,151) (0.7) 0.8 (10,265) (9,897) 3.7 13.2 Personnel (2,960) (3,000) (1.3) 0.1 (5,960) (5,855) 1.8 10.4 Other general administrative expenses (2,154) (2,151) 0.1 1.7 (4,305) (4,042) 6.5 17.3
Depreciation and amortisation (604) (613) (1.5) (0.1) (1,217) (1,294) (5.9) 0.7Net operating income 6,293 6,387 (1.5) 1.0 12,680 12,887 (1.6) 9.6Net loan-loss provisions (2,015) (2,282) (11.7) (9.7) (4,297) (4,680) (8.2) 3.7Impairment losses on other assets (34) (24) 41.7 47.3 (58) (131) (55.7) (53.0)Other income (453) (392) 15.6 18.6 (845) (1,492) (43.4) (37.7)Underlying profit before tax 3,791 3,689 2.8 5.5 7,480 6,585 13.6 25.8Tax on profit (1,379) (1,280) 7.7 11.0 (2,659) (2,254) 18.0 29.9Underlying profit from continuing operations 2,412 2,409 0.1 2.5 4,821 4,331 11.3 23.7Net profit from discontinued operations — — — — — — — —Underlying consolidated profit 2,412 2,409 0.1 2.5 4,821 4,331 11.3 23.7Minority interests 414 355 16.6 18.2 769 715 7.6 16.4Underlying attributable profit to the Group 1,998 2,054 (2.7) (0.2) 4,052 3,616 12.1 25.2Net capital gains and provisions* (300) — — — (300) — — —Attributable profit to the Group 1,698 2,054 (17.3) (15.0) 3,752 3,616 3.8 15.9
Underlying EPS (euros) ** 0.115 0.120 (3.8) 0.235 0.232 1.2Underlying diluted EPS (euros) ** 0.115 0.119 (3.8) 0.234 0.231 1.2
EPS (euros) ** 0.096 0.120 (19.4) 0.216 0.232 (6.8)Diluted EPS (euros) ** 0.096 0.119 (19.3) 0.216 0.231 (6.8)
Pro memoria: Average total assets 1,437,163 1,439,732 (0.2) 1,438,444 1,362,352 5.6 Average stockholders' equity 94,607 94,793 (0.2) 94,662 90,783 4.3
(*) In Q2’18, integration costs (mainly restructuring costs) net of tax impacts, in Spain: EUR -280 million, Corporate Centre: EUR -40 million and Portugal: EUR 20 million.
(**) H1’17 data adjusted to capital increase of July 2017, with impact on the earnings per share of previous periods, due to the change in the number of shares in circulation. Thefinancial information for these periods has been restated in accordance with the applicable regulation.
Second quarter attributable profit of EUR 1,698 million, affected by the contribution of EUR 187 million to the Single Resolution Fund and by non-recurring results (EUR -300 million), both net of tax. Excluding these effects (i.e. in terms equivalent to those of the first quarter), profit would have been 6% higher (+9% excluding exchange rate impact)
The first half attributable profit was EUR 3,752 million. Excluding the non-recurring items, underlying profit was EUR 4,052 million, 12% higher year-on-year and 25% excluding the exchange rate impact
This evolution was positively affected by the incorporation of Banco Popular and the greater stake in Santander Asset Management and negatively by exchange rates and continued low interest rates in mature markets
The results reflect solid commercial revenues, an efficiency ratio of 47.5%, which remains one of the best among our competitors, and a further improvement in the cost of credit to 0.99%
The underlying RoTE was 12.2%, higher than in 2017, and the RoRWA rose to 1.60%
Underlying earnings per share (EPS) of EUR 0.235 (EUR 0.216 including non-recurring items)
11Financial Report 2018
JANUARY - JUNEConsolidated financial report
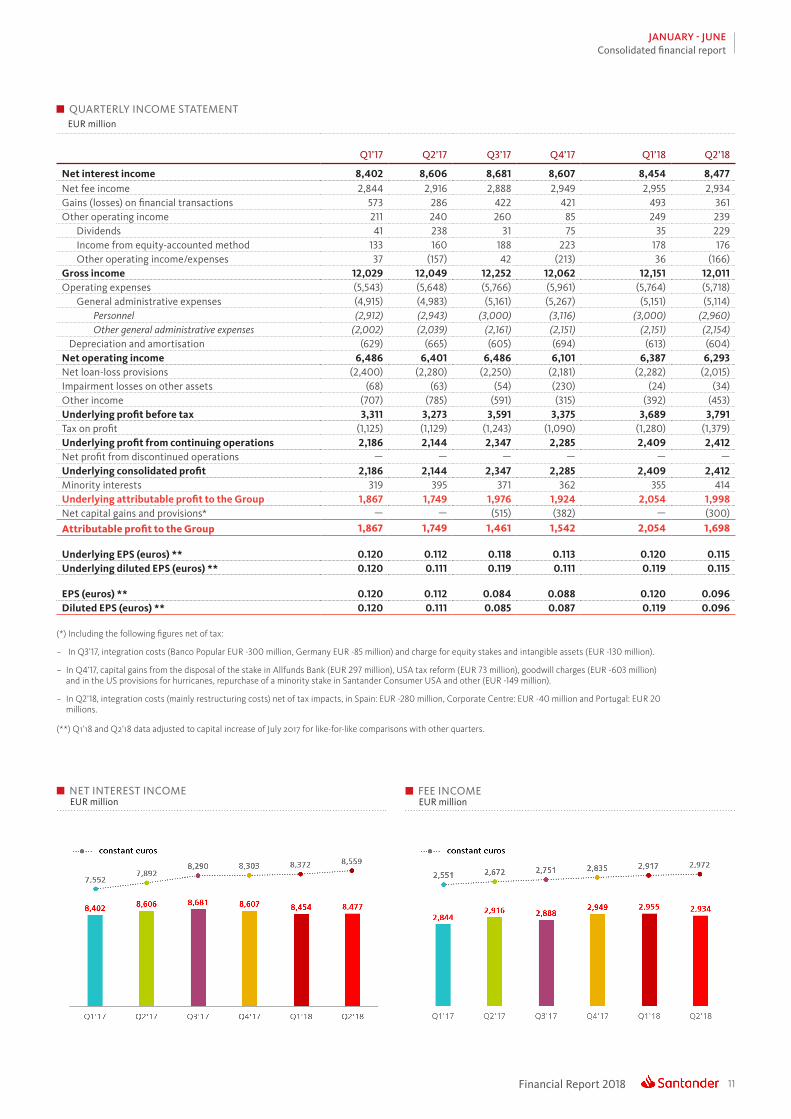
QUARTERLY INCOME STATEMENTEUR million
Q1’17 Q2’17 Q3’17 Q4’17 Q1’18 Q2’18
Net interest income 8,402 8,606 8,681 8,607 8,454 8,477Net fee income 2,844 2,916 2,888 2,949 2,955 2,934Gains (losses) on financial transactions 573 286 422 421 493 361Other operating income 211 240 260 85 249 239
Dividends 41 238 31 75 35 229 Income from equity-accounted method 133 160 188 223 178 176 Other operating income/expenses 37 (157) 42 (213) 36 (166)
Gross income 12,029 12,049 12,252 12,062 12,151 12,011Operating expenses (5,543) (5,648) (5,766) (5,961) (5,764) (5,718)
General administrative expenses (4,915) (4,983) (5,161) (5,267) (5,151) (5,114) Personnel (2,912) (2,943) (3,000) (3,116) (3,000) (2,960) Other general administrative expenses (2,002) (2,039) (2,161) (2,151) (2,151) (2,154)
Depreciation and amortisation (629) (665) (605) (694) (613) (604)Net operating income 6,486 6,401 6,486 6,101 6,387 6,293Net loan-loss provisions (2,400) (2,280) (2,250) (2,181) (2,282) (2,015)Impairment losses on other assets (68) (63) (54) (230) (24) (34)Other income (707) (785) (591) (315) (392) (453)Underlying profit before tax 3,311 3,273 3,591 3,375 3,689 3,791Tax on profit (1,125) (1,129) (1,243) (1,090) (1,280) (1,379)Underlying profit from continuing operations 2,186 2,144 2,347 2,285 2,409 2,412Net profit from discontinued operations — — — — — —Underlying consolidated profit 2,186 2,144 2,347 2,285 2,409 2,412Minority interests 319 395 371 362 355 414Underlying attributable profit to the Group 1,867 1,749 1,976 1,924 2,054 1,998Net capital gains and provisions* — — (515) (382) — (300)Attributable profit to the Group 1,867 1,749 1,461 1,542 2,054 1,698
Underlying EPS (euros) ** 0.120 0.112 0.118 0.113 0.120 0.115Underlying diluted EPS (euros) ** 0.120 0.111 0.119 0.111 0.119 0.115
EPS (euros) ** 0.120 0.112 0.084 0.088 0.120 0.096Diluted EPS (euros) ** 0.120 0.111 0.085 0.087 0.119 0.096
(*) Including the following figures net of tax:
– In Q3’17, integration costs (Banco Popular EUR -300 million, Germany EUR -85 million) and charge for equity stakes and intangible assets (EUR -130 million).
– In Q4’17, capital gains from the disposal of the stake in Allfunds Bank (EUR 297 million), USA tax reform (EUR 73 million), goodwill charges (EUR -603 million) and in the US provisions for hurricanes, repurchase of a minority stake in Santander Consumer USA and other (EUR -149 million).
– In Q2’18, integration costs (mainly restructuring costs) net of tax impacts, in Spain: EUR -280 million, Corporate Centre: EUR -40 million and Portugal: EUR 20 millions.
(**) Q1’18 and Q2’18 data adjusted to capital increase of July 2017 for like-for-like comparisons with other quarters.
NET INTEREST INCOMEEUR million
FEE INCOMEEUR million

Financial Report 201812
JANUARY - JUNEConsolidated financial report
GROSS INCOMEEUR million
OPERATING EXPENSESEUR million
Second quarter results compared to the first quarter of 2018
The second quarter attributable profit was EUR 1,698 million, including EUR -300 million of non-recurring items associated with integrations (mainly restructuring costs) net of tax impacts, broken down as follows: Spain EUR -280 million, Corporate Centre EUR -40 million and Portugal EUR 20 million.
Excluding these charges, underlying profit was EUR 1,998 million, 3% lower than the previous quarter. In constant euros growth was flat, with the following detail:
• Positive evolution in the most commercial revenue (net interest income and fee income), which rose 2%. Part of this growth was absorbed by lower gains on financial transactions and the Single Resolution Fund contribution (EUR 267 million, EUR 187 million net of tax).
• Operating expenses were slightly higher (+1%), due to developing markets (+3%), in part due to investments and higher inflation. Costs in mature markets, on the other hand, fell 1%. Of note was the 3% reduction in the US.
• Loan-loss provisions were 10% lower and fell notably in SCF, the UK and in the US.
Excluding the contribution to the SRF, underlying profit increased 6% quarter-on-quarter (+9% in constant euros).
Evolution of results compared to the first half of 2017
The first half attributable profit of EUR 3,752 million was 4% higher year-on-year and 16% in constant euros. Underlying profit (excluding capital gains and provisions) was up 12% at EUR 4,052 million (+25% in constant euros). The P&L performance by line was as follows. To facilitate analysis and comparisons of management actions, all changes exclude exchange rate impacts.
Gross income
• The structure of our gross income, where net interest income and fee income accounted for 94% of total revenue in the first half, well above the average of our competitors, continues to enable us to grow in a consistent and recurring way, limiting the impact periods of high volatility can have on gains on financial transactions. Gross income increased 11%, as follows:
– Net interest income rose 10%, due to greater lending and deposit volumes, mainly in developing countries, which grew at double-digit rates, due to management of spreads.
All units increased except for the United Kingdom, affected by pressure on spreads on new mortgages and standard variable rate (SVR) balances, and the US, hit by lower personal loans, tighter spreads and the higher cost of funding. The decline in revenue in the US was offset by a 24% fall in provisions.
– Fee income was up 13%, reflecting greater activity and customer loyalty, as well as the strategy of growth in services and higher value-added products and in areas of low capital consumption. Growth in fee income from Retail Banking (+10%) as well as from Corporate & Investment Banking (+4%) and Wealth Management (+67%).
– Other income streams also increased; Gains on fnancial transactions, which only account for 4% of gross income, as well as the sum of dividends, equity-accounted income and other income which rose in part due to the higher income from leasing in the United States.
13Financial Report 2018
JANUARY - JUNEConsolidated financial report
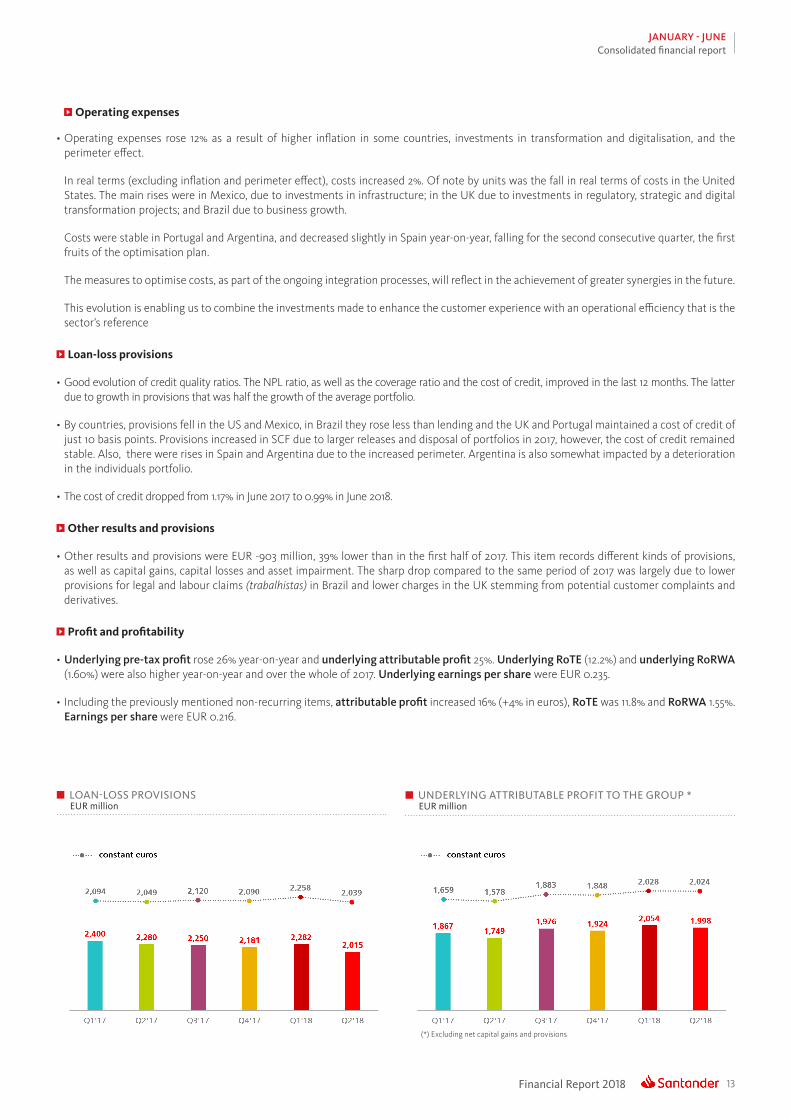
LOAN-LOSS PROVISIONSEUR million
UNDERLYING ATTRIBUTABLE PROFIT TO THE GROUP *EUR million
Operating expenses
• Operating expenses rose 12% as a result of higher inflation in some countries, investments in transformation and digitalisation, and the perimeter effect.
In real terms (excluding inflation and perimeter effect), costs increased 2%. Of note by units was the fall in real terms of costs in the United States. The main rises were in Mexico, due to investments in infrastructure; in the UK due to investments in regulatory, strategic and digital transformation projects; and Brazil due to business growth.
Costs were stable in Portugal and Argentina, and decreased slightly in Spain year-on-year, falling for the second consecutive quarter, the first fruits of the optimisation plan.
The measures to optimise costs, as part of the ongoing integration processes, will reflect in the achievement of greater synergies in the future.
This evolution is enabling us to combine the investments made to enhance the customer experience with an operational efficiency that is the sector’s reference
Loan-loss provisions
• Good evolution of credit quality ratios. The NPL ratio, as well as the coverage ratio and the cost of credit, improved in the last 12 months. The latter due to growth in provisions that was half the growth of the average portfolio.
• By countries, provisions fell in the US and Mexico, in Brazil they rose less than lending and the UK and Portugal maintained a cost of credit of just 10 basis points. Provisions increased in SCF due to larger releases and disposal of portfolios in 2017, however, the cost of credit remained stable. Also, there were rises in Spain and Argentina due to the increased perimeter. Argentina is also somewhat impacted by a deterioration in the individuals portfolio.
• The cost of credit dropped from 1.17% in June 2017 to 0.99% in June 2018.
Other results and provisions
• Other results and provisions were EUR -903 million, 39% lower than in the first half of 2017. This item records different kinds of provisions, as well as capital gains, capital losses and asset impairment. The sharp drop compared to the same period of 2017 was largely due to lower provisions for legal and labour claims (trabalhistas) in Brazil and lower charges in the UK stemming from potential customer complaints and derivatives.
Profit and profitability
• Underlying pre-tax proft rose 26% year-on-year and underlying attributable proft 25%. Underlying RoTE (12.2%) and underlying RoRWA (1.60%) were also higher year-on-year and over the whole of 2017. Underlying earnings per share were EUR 0.235.
• Including the previously mentioned non-recurring items, attributable proft increased 16% (+4% in euros), RoTE was 11.8% and RoRWA 1.55%. Earnings per share were EUR 0.216.
(*) Excluding net capital gains and provisions
Financial Report 201814
JANUARY - JUNEConsolidated financial report
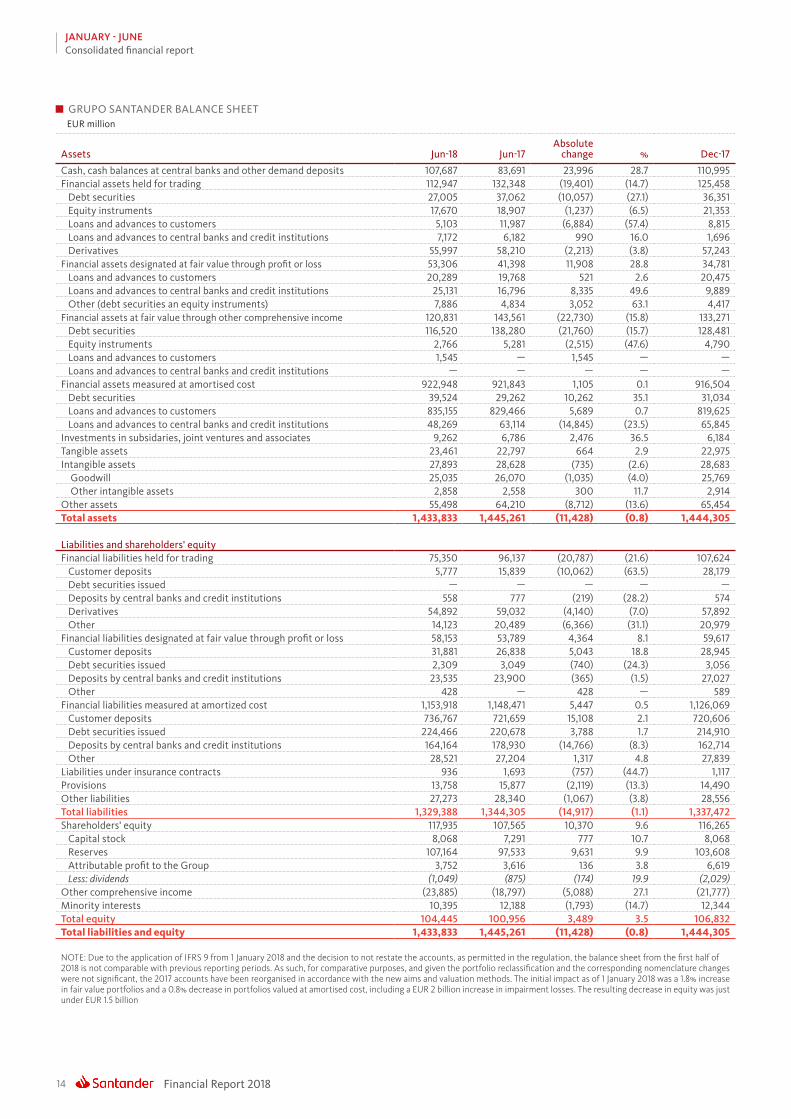
GRUPO SANTANDER BALANCE SHEET EUR million
Assets Jun-18 Jun-17Absolute
change % Dec-17
Cash, cash balances at central banks and other demand deposits 107,687 83,691 23,996 28.7 110,995Financial assets held for trading 112,947 132,348 (19,401) (14.7) 125,458 Debt securities 27,005 37,062 (10,057) (27.1) 36,351 Equity instruments 17,670 18,907 (1,237) (6.5) 21,353 Loans and advances to customers 5,103 11,987 (6,884) (57.4) 8,815 Loans and advances to central banks and credit institutions 7,172 6,182 990 16.0 1,696 Derivatives 55,997 58,210 (2,213) (3.8) 57,243Financial assets designated at fair value through profit or loss 53,306 41,398 11,908 28.8 34,781 Loans and advances to customers 20,289 19,768 521 2.6 20,475 Loans and advances to central banks and credit institutions 25,131 16,796 8,335 49.6 9,889 Other (debt securities an equity instruments) 7,886 4,834 3,052 63.1 4,417Financial assets at fair value through other comprehensive income 120,831 143,561 (22,730) (15.8) 133,271 Debt securities 116,520 138,280 (21,760) (15.7) 128,481 Equity instruments 2,766 5,281 (2,515) (47.6) 4,790 Loans and advances to customers 1,545 — 1,545 — — Loans and advances to central banks and credit institutions — — — — —Financial assets measured at amortised cost 922,948 921,843 1,105 0.1 916,504 Debt securities 39,524 29,262 10,262 35.1 31,034 Loans and advances to customers 835,155 829,466 5,689 0.7 819,625 Loans and advances to central banks and credit institutions 48,269 63,114 (14,845) (23.5) 65,845Investments in subsidaries, joint ventures and associates 9,262 6,786 2,476 36.5 6,184Tangible assets 23,461 22,797 664 2.9 22,975Intangible assets 27,893 28,628 (735) (2.6) 28,683 Goodwill 25,035 26,070 (1,035) (4.0) 25,769 Other intangible assets 2,858 2,558 300 11.7 2,914Other assets 55,498 64,210 (8,712) (13.6) 65,454Total assets 1,433,833 1,445,261 (11,428) (0.8) 1,444,305
Liabilities and shareholders' equityFinancial liabilities held for trading 75,350 96,137 (20,787) (21.6) 107,624 Customer deposits 5,777 15,839 (10,062) (63.5) 28,179 Debt securities issued — — — — — Deposits by central banks and credit institutions 558 777 (219) (28.2) 574 Derivatives 54,892 59,032 (4,140) (7.0) 57,892 Other 14,123 20,489 (6,366) (31.1) 20,979Financial liabilities designated at fair value through profit or loss 58,153 53,789 4,364 8.1 59,617 Customer deposits 31,881 26,838 5,043 18.8 28,945 Debt securities issued 2,309 3,049 (740) (24.3) 3,056 Deposits by central banks and credit institutions 23,535 23,900 (365) (1.5) 27,027 Other 428 — 428 — 589Financial liabilities measured at amortized cost 1,153,918 1,148,471 5,447 0.5 1,126,069 Customer deposits 736,767 721,659 15,108 2.1 720,606 Debt securities issued 224,466 220,678 3,788 1.7 214,910 Deposits by central banks and credit institutions 164,164 178,930 (14,766) (8.3) 162,714 Other 28,521 27,204 1,317 4.8 27,839Liabilities under insurance contracts 936 1,693 (757) (44.7) 1,117Provisions 13,758 15,877 (2,119) (13.3) 14,490Other liabilities 27,273 28,340 (1,067) (3.8) 28,556Total liabilities 1,329,388 1,344,305 (14,917) (1.1) 1,337,472Shareholders' equity 117,935 107,565 10,370 9.6 116,265 Capital stock 8,068 7,291 777 10.7 8,068 Reserves 107,164 97,533 9,631 9.9 103,608 Attributable profit to the Group 3,752 3,616 136 3.8 6,619 Less: dividends (1,049) (875) (174) 19.9 (2,029)Other comprehensive income (23,885) (18,797) (5,088) 27.1 (21,777)Minority interests 10,395 12,188 (1,793) (14.7) 12,344Total equity 104,445 100,956 3,489 3.5 106,832Total liabilities and equity 1,433,833 1,445,261 (11,428) (0.8) 1,444,305
NOTE: Due to the application of IFRS 9 from 1 January 2018 and the decision to not restate the accounts, as permitted in the regulation, the balance sheet from the first half of2018 is not comparable with previous reporting periods. As such, for comparative purposes, and given the portfolio reclassification and the corresponding nomenclature changeswere not significant, the 2017 accounts have been reorganised in accordance with the new aims and valuation methods. The initial impact as of 1 January 2018 was a 1.8% increasein fair value portfolios and a 0.8% decrease in portfolios valued at amortised cost, including a EUR 2 billion increase in impairment losses. The resulting decrease in equity was justunder EUR 1.5 billion
15Financial Report 2018
JANUARY - JUNEConsolidated financial report
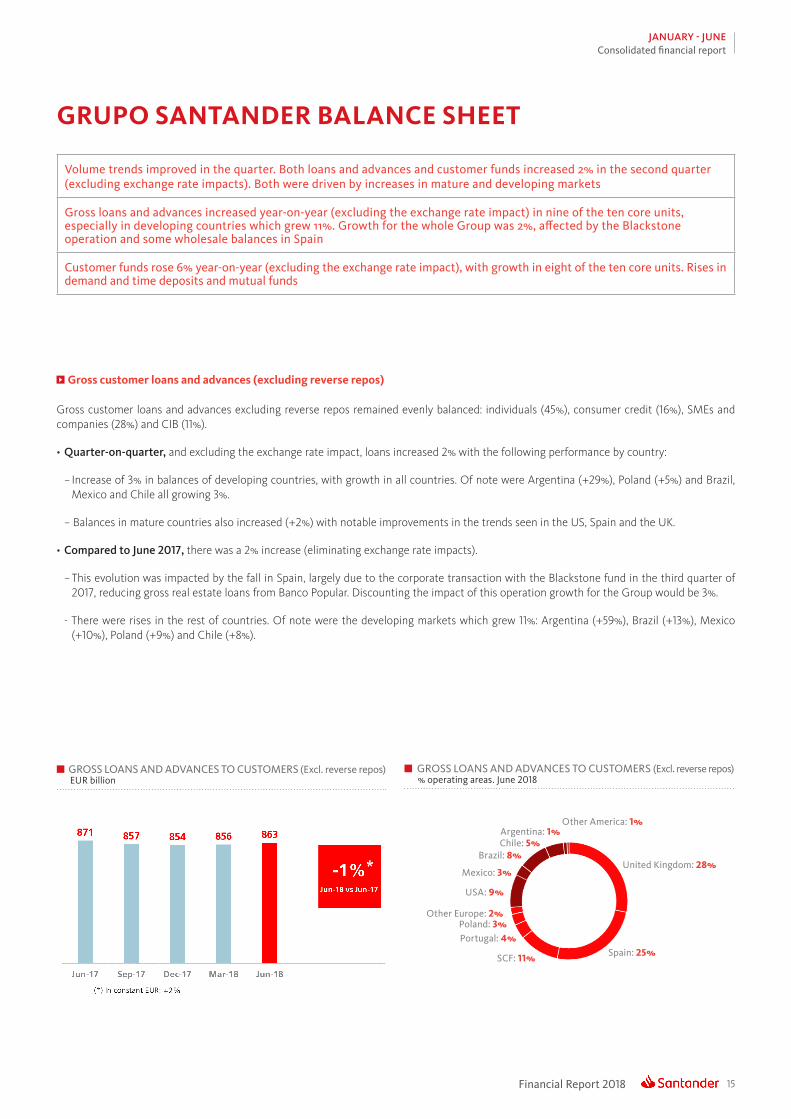
Volume trends improved in the quarter. Both loans and advances and customer funds increased 2% in the second quarter (excluding exchange rate impacts). Both were driven by increases in mature and developing markets
Gross loans and advances increased year-on-year (excluding the exchange rate impact) in nine of the ten core units, especially in developing countries which grew 11%. Growth for the whole Group was 2%, affected by the Blackstone operation and some wholesale balances in Spain
Customer funds rose 6% year-on-year (excluding the exchange rate impact), with growth in eight of the ten core units. Rises in demand and time deposits and mutual funds
GRUPO SANTANDER BALANCE SHEET
GROSS LOANS AND ADVANCES TO CUSTOMERS (Excl. reverse repos)EUR billion
GROSS LOANS AND ADVANCES TO CUSTOMERS (Excl. reverse repos)% operating areas. June 2018
United Kingdom: 28%
Other America: 1%
Spain: 25%SCF: 11%
Portugal: 4%Poland: 3%
Other Europe: 2%
Mexico: 3%
Brazil: 8%Chile: 5%Argentina: 1%
USA: 9%
Gross customer loans and advances (excluding reverse repos)
Gross customer loans and advances excluding reverse repos remained evenly balanced: individuals (45%), consumer credit (16%), SMEs and companies (28%) and CIB (11%).
• Quarter-on-quarter, and excluding the exchange rate impact, loans increased 2% with the following performance by country:
− Increase of 3% in balances of developing countries, with growth in all countries. Of note were Argentina (+29%), Poland (+5%) and Brazil, Mexico and Chile all growing 3%.
− Balances in mature countries also increased (+2%) with notable improvements in the trends seen in the US, Spain and the UK.
• Compared to June 2017, there was a 2% increase (eliminating exchange rate impacts).
− This evolution was impacted by the fall in Spain, largely due to the corporate transaction with the Blackstone fund in the third quarter of 2017, reducing gross real estate loans from Banco Popular. Discounting the impact of this operation growth for the Group would be 3%.
- There were rises in the rest of countries. Of note were the developing markets which grew 11%: Argentina (+59%), Brazil (+13%), Mexico (+10%), Poland (+9%) and Chile (+8%).
Financial Report 201816
JANUARY - JUNEConsolidated financial report
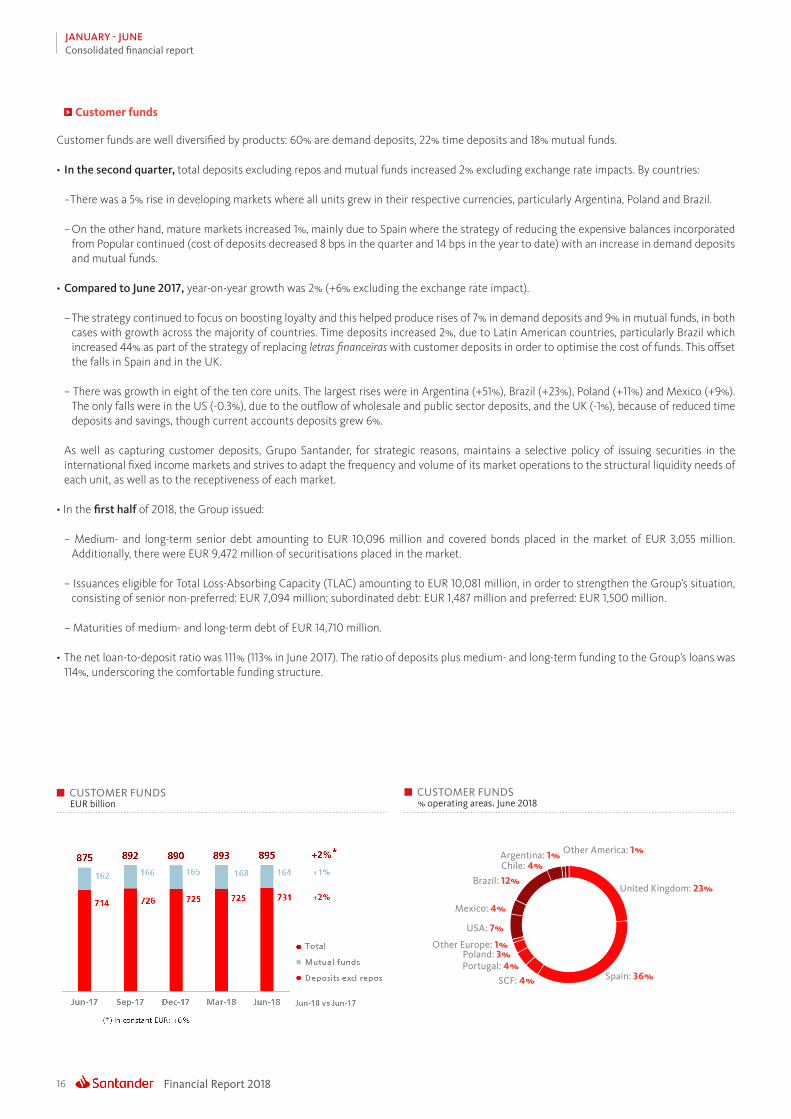
CUSTOMER FUNDSEUR billion
CUSTOMER FUNDS% operating areas. June 2018
United Kingdom: 23%
Other America: 1%
Spain: 36%SCF: 4%Portugal: 4%Poland: 3%
Other Europe: 1%
Mexico: 4%
Brazil: 12%
Chile: 4%Argentina: 1%
USA: 7%
Customer funds
Customer funds are well diversified by products: 60% are demand deposits, 22% time deposits and 18% mutual funds.
• In the second quarter, total deposits excluding repos and mutual funds increased 2% excluding exchange rate impacts. By countries:
−There was a 5% rise in developing markets where all units grew in their respective currencies, particularly Argentina, Poland and Brazil.
– On the other hand, mature markets increased 1%, mainly due to Spain where the strategy of reducing the expensive balances incorporated from Popular continued (cost of deposits decreased 8 bps in the quarter and 14 bps in the year to date) with an increase in demand deposits and mutual funds.
• Compared to June 2017, year-on-year growth was 2% (+6% excluding the exchange rate impact).
– The strategy continued to focus on boosting loyalty and this helped produce rises of 7% in demand deposits and 9% in mutual funds, in both cases with growth across the majority of countries. Time deposits increased 2%, due to Latin American countries, particularly Brazil which increased 44% as part of the strategy of replacing letras financeiras with customer deposits in order to optimise the cost of funds. This offset the falls in Spain and in the UK.
− There was growth in eight of the ten core units. The largest rises were in Argentina (+51%), Brazil (+23%), Poland (+11%) and Mexico (+9%). The only falls were in the US (-0.3%), due to the outflow of wholesale and public sector deposits, and the UK (-1%), because of reduced time deposits and savings, though current accounts deposits grew 6%.
As well as capturing customer deposits, Grupo Santander, for strategic reasons, maintains a selective policy of issuing securities in the international fixed income markets and strives to adapt the frequency and volume of its market operations to the structural liquidity needs of each unit, as well as to the receptiveness of each market.
• In the frst half of 2018, the Group issued:
− Medium- and long-term senior debt amounting to EUR 10,096 million and covered bonds placed in the market of EUR 3,055 million. Additionally, there were EUR 9,472 million of securitisations placed in the market.
− Issuances eligible for Total Loss-Absorbing Capacity (TLAC) amounting to EUR 10,081 million, in order to strengthen the Group’s situation, consisting of senior non-preferred: EUR 7,094 million; subordinated debt: EUR 1,487 million and preferred: EUR 1,500 million.
− Maturities of medium- and long-term debt of EUR 14,710 million.
• The net loan-to-deposit ratio was 111% (113% in June 2017). The ratio of deposits plus medium- and long-term funding to the Group’s loans was 114%, underscoring the comfortable funding structure.
17Financial Report 2018
JANUARY - JUNEConsolidated financial report
FULLY LOADED CAPITAL RATIO%
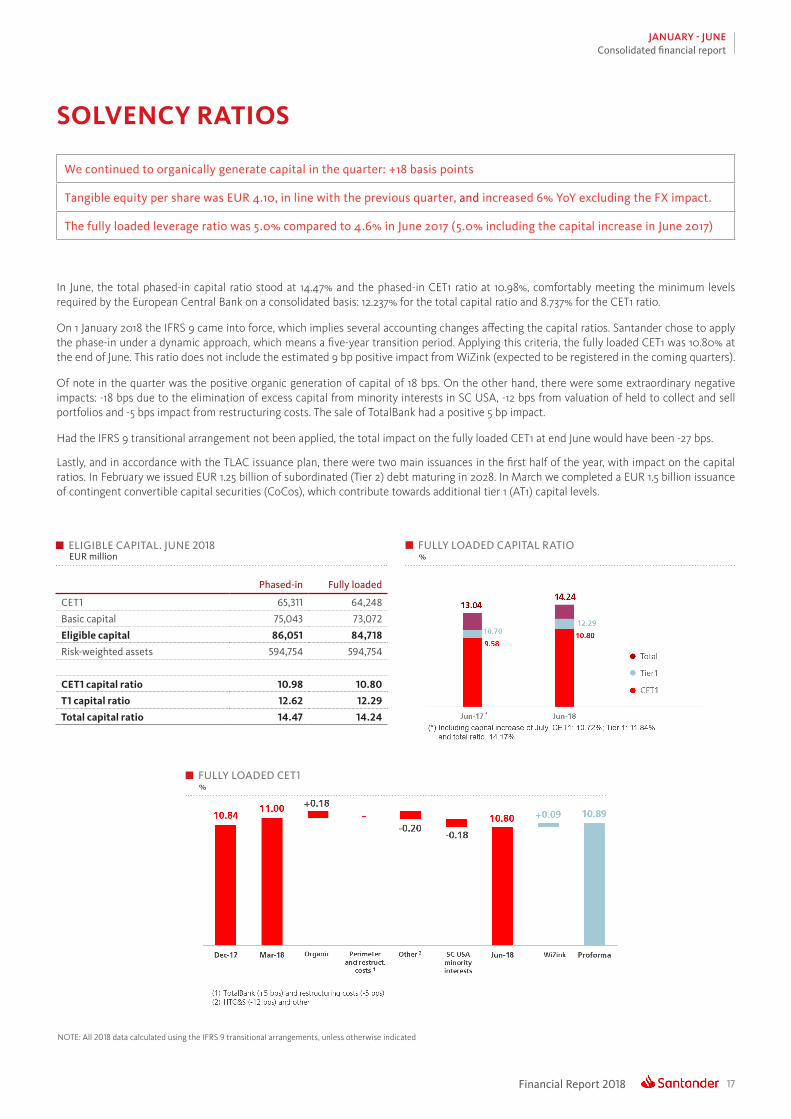
ELIGIBLE CAPITAL. JUNE 2018EUR million
Phased-in Fully loaded
CET1 65,311 64,248
Basic capital 75,043 73,072
Eligible capital 86,051 84,718
Risk-weighted assets 594,754 594,754
CET1 capital ratio 10.98 10.80
T1 capital ratio 12.62 12.29
Total capital ratio 14.47 14.24
We continued to organically generate capital in the quarter: +18 basis points
Tangible equity per share was EUR 4.10, in line with the previous quarter, and increased 6% YoY excluding the FX impact.
The fully loaded leverage ratio was 5.0% compared to 4.6% in June 2017 (5.0% including the capital increase in June 2017)
SOLVENCY RATIOS
In June, the total phased-in capital ratio stood at 14.47% and the phased-in CET1 ratio at 10.98%, comfortably meeting the minimum levels required by the European Central Bank on a consolidated basis: 12.237% for the total capital ratio and 8.737% for the CET1 ratio.
On 1 January 2018 the IFRS 9 came into force, which implies several accounting changes affecting the capital ratios. Santander chose to apply the phase-in under a dynamic approach, which means a five-year transition period. Applying this criteria, the fully loaded CET1 was 10.80% at the end of June. This ratio does not include the estimated 9 bp positive impact from WiZink (expected to be registered in the coming quarters).
Of note in the quarter was the positive organic generation of capital of 18 bps. On the other hand, there were some extraordinary negative impacts: -18 bps due to the elimination of excess capital from minority interests in SC USA, -12 bps from valuation of held to collect and sell portfolios and -5 bps impact from restructuring costs. The sale of TotalBank had a positive 5 bp impact.
Had the IFRS 9 transitional arrangement not been applied, the total impact on the fully loaded CET1 at end June would have been -27 bps.
Lastly, and in accordance with the TLAC issuance plan, there were two main issuances in the first half of the year, with impact on the capital ratios. In February we issued EUR 1.25 billion of subordinated (Tier 2) debt maturing in 2028. In March we completed a EUR 1.5 billion issuance of contingent convertible capital securities (CoCos), which contribute towards additional tier 1 (AT1) capital levels.
FULLY LOADED CET1%
NOTE: All 2018 data calculated using the IFRS 9 transitional arrangements, unless otherwise indicated
Financial Report 201818
JANUARY - JUNEConsolidated financial report
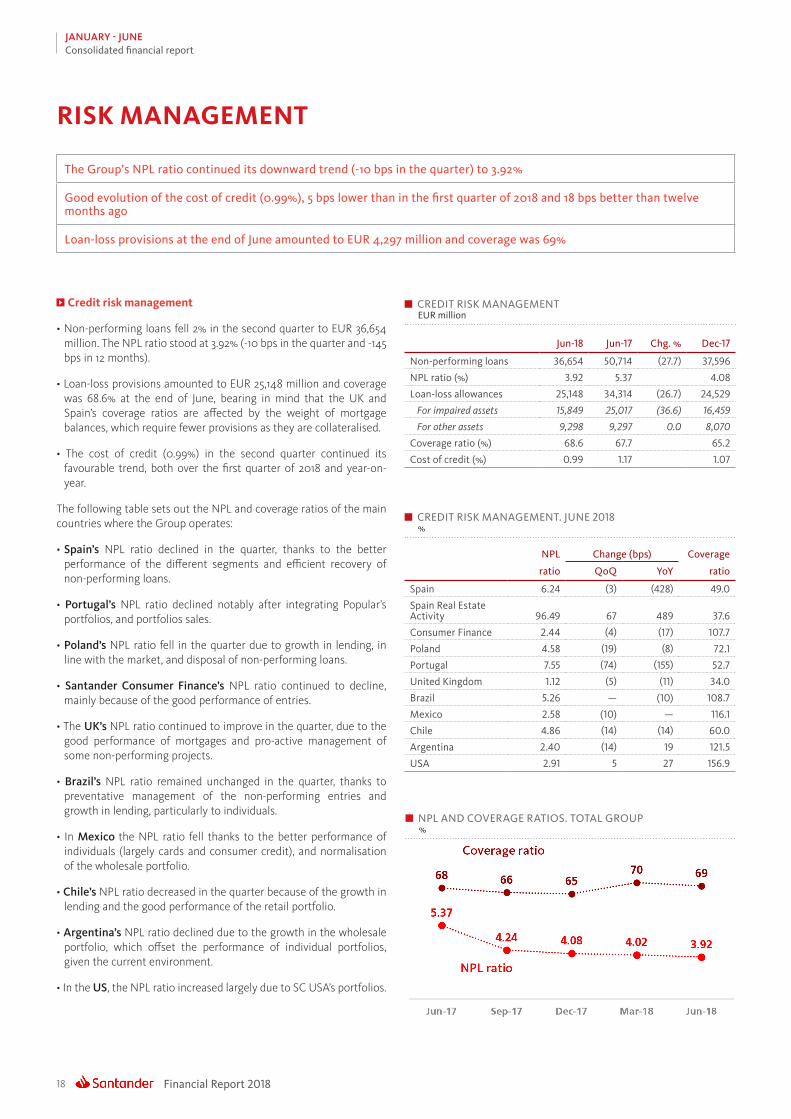
The Group’s NPL ratio continued its downward trend (-10 bps in the quarter) to 3.92%
Good evolution of the cost of credit (0.99%), 5 bps lower than in the first quarter of 2018 and 18 bps better than twelve months ago
Loan-loss provisions at the end of June amounted to EUR 4,297 million and coverage was 69%
RISK MANAGEMENT
Credit risk management
• Non-performing loans fell 2% in the second quarter to EUR 36,654 million. The NPL ratio stood at 3.92% (-10 bps in the quarter and -145 bps in 12 months).
• Loan-loss provisions amounted to EUR 25,148 million and coverage was 68.6% at the end of June, bearing in mind that the UK and Spain’s coverage ratios are affected by the weight of mortgage balances, which require fewer provisions as they are collateralised.
• The cost of credit (0.99%) in the second quarter continued its favourable trend, both over the first quarter of 2018 and year-on-year.
The following table sets out the NPL and coverage ratios of the main countries where the Group operates:
• Spain’s NPL ratio declined in the quarter, thanks to the better performance of the different segments and efficient recovery of non-performing loans.
• Portugal’s NPL ratio declined notably after integrating Popular’s portfolios, and portfolios sales.
• Poland’s NPL ratio fell in the quarter due to growth in lending, in line with the market, and disposal of non-performing loans.
• Santander Consumer Finance’s NPL ratio continued to decline, mainly because of the good performance of entries.
• The UK’s NPL ratio continued to improve in the quarter, due to the good performance of mortgages and pro-active management of some non-performing projects.
• Brazil’s NPL ratio remained unchanged in the quarter, thanks to preventative management of the non-performing entries and growth in lending, particularly to individuals.
• In Mexico the NPL ratio fell thanks to the better performance of individuals (largely cards and consumer credit), and normalisation of the wholesale portfolio.
• Chile’s NPL ratio decreased in the quarter because of the growth in lending and the good performance of the retail portfolio.
• Argentina’s NPL ratio declined due to the growth in the wholesale portfolio, which offset the performance of individual portfolios, given the current environment.
• In the US, the NPL ratio increased largely due to SC USA’s portfolios.
CREDIT RISK MANAGEMENTEUR million
Jun-18 Jun-17 Chg. % Dec-17
Non-performing loans 36,654 50,714 (27.7) 37,596
NPL ratio (%) 3.92 5.37 4.08
Loan-loss allowances 25,148 34,314 (26.7) 24,529
For impaired assets 15,849 25,017 (36.6) 16,459
For other assets 9,298 9,297 0.0 8,070
Coverage ratio (%) 68.6 67.7 65.2
Cost of credit (%) 0.99 1.17 1.07
CREDIT RISK MANAGEMENT. JUNE 2018%
NPL Change (bps) Coverage
ratio QoQ YoY ratio
Spain 6.24 (3) (428) 49.0
Spain Real Estate Activity 96.49 67 489 37.6
Consumer Finance 2.44 (4) (17) 107.7
Poland 4.58 (19) (8) 72.1
Portugal 7.55 (74) (155) 52.7
United Kingdom 1.12 (5) (11) 34.0
Brazil 5.26 — (10) 108.7
Mexico 2.58 (10) — 116.1
Chile 4.86 (14) (14) 60.0
Argentina 2.40 (14) 19 121.5
USA 2.91 5 27 156.9
NPL AND COVERAGE RATIOS. TOTAL GROUP%
19Financial Report 2018
JANUARY - JUNEConsolidated financial report
Structural exchange rate risk
Santander maintains a CET1 ratio coverage level of around 100% in order to protect itself from exchange rate movements.
Market risk
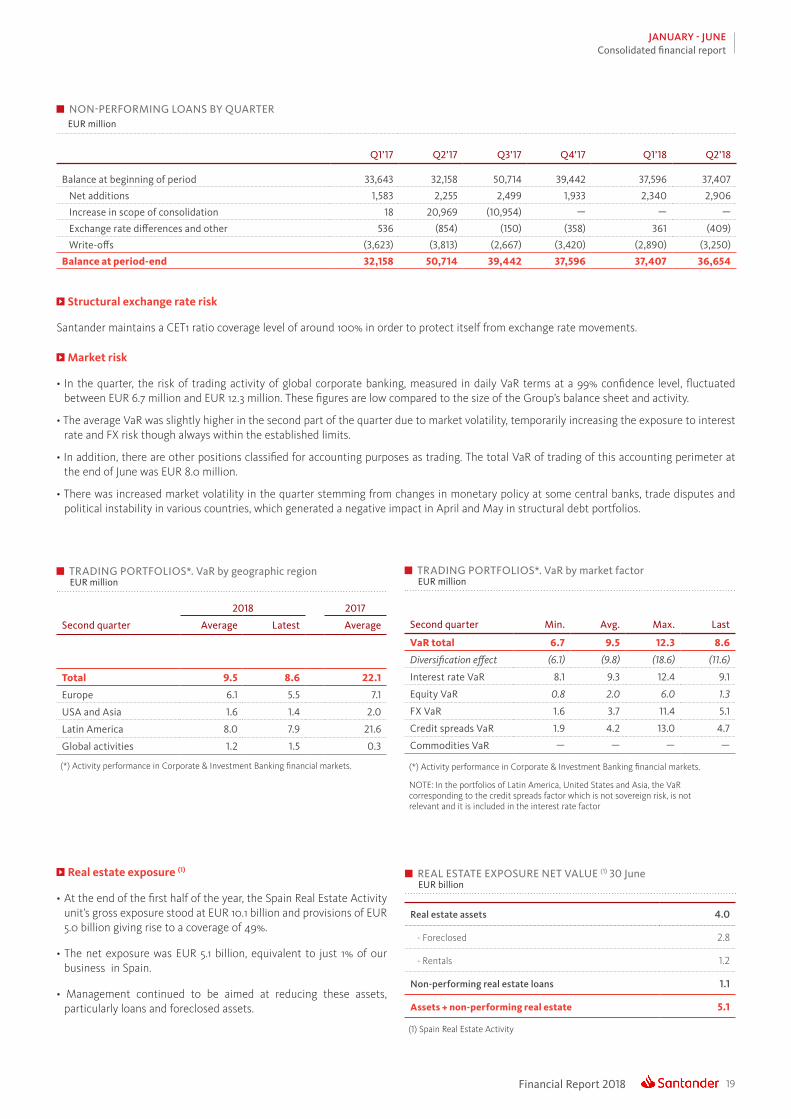
• In the quarter, the risk of trading activity of global corporate banking, measured in daily VaR terms at a 99% confidence level, fluctuated between EUR 6.7 million and EUR 12.3 million. These figures are low compared to the size of the Group’s balance sheet and activity.
• The average VaR was slightly higher in the second part of the quarter due to market volatility, temporarily increasing the exposure to interest rate and FX risk though always within the established limits.
• In addition, there are other positions classified for accounting purposes as trading. The total VaR of trading of this accounting perimeter at the end of June was EUR 8.0 million.
• There was increased market volatility in the quarter stemming from changes in monetary policy at some central banks, trade disputes and political instability in various countries, which generated a negative impact in April and May in structural debt portfolios.
NON-PERFORMING LOANS BY QUARTEREUR million
Q1’17 Q2’17 Q3’17 Q4’17 Q1’18 Q2’18
Balance at beginning of period 33,643 32,158 50,714 39,442 37,596 37,407
Net additions 1,583 2,255 2,499 1,933 2,340 2,906
Increase in scope of consolidation 18 20,969 (10,954) — — —
Exchange rate differences and other 536 (854) (150) (358) 361 (409)
Write-offs (3,623) (3,813) (2,667) (3,420) (2,890) (3,250)
Balance at period-end 32,158 50,714 39,442 37,596 37,407 36,654
TRADING PORTFOLIOS*. VaR by geographic regionEUR million
2018 2017
Second quarter Average Latest Average
Total 9.5 8.6 22.1
Europe 6.1 5.5 7.1
USA and Asia 1.6 1.4 2.0
Latin America 8.0 7.9 21.6
Global activities 1.2 1.5 0.3
TRADING PORTFOLIOS*. VaR by market factorEUR million
Second quarter Min. Avg. Max. Last
VaR total 6.7 9.5 12.3 8.6
Diversification effect (6.1) (9.8) (18.6) (11.6)
Interest rate VaR 8.1 9.3 12.4 9.1
Equity VaR 0.8 2.0 6.0 1.3
FX VaR 1.6 3.7 11.4 5.1
Credit spreads VaR 1.9 4.2 13.0 4.7
Commodities VaR — — — —
(*) Activity performance in Corporate & Investment Banking financial markets.
Real estate exposure (1)
• At the end of the first half of the year, the Spain Real Estate Activity unit’s gross exposure stood at EUR 10.1 billion and provisions of EUR 5.0 billion giving rise to a coverage of 49%.
• The net exposure was EUR 5.1 billion, equivalent to just 1% of our business in Spain.
• Management continued to be aimed at reducing these assets, particularly loans and foreclosed assets.
Real estate assets 4.0
- Foreclosed 2.8
- Rentals 1.2
Non-performing real estate loans 1.1
Assets + non-performing real estate 5.1
(1) Spain Real Estate Activity
REAL ESTATE EXPOSURE NET VALUE (1) 30 JuneEUR billion
(*) Activity performance in Corporate & Investment Banking financial markets.
NOTE: In the portfolios of Latin America, United States and Asia, the VaR corresponding to the credit spreads factor which is not sovereign risk, is not relevant and it is included in the interest rate factor

Financial Report 201820
JANUARY - JUNEBusiness information
DESCRIPTION OF BUSINESSIn 2018 Grupo Santander maintained the same general criteria applied in 2017, as well as the business segments, with the following exceptions:
• Banco Popular’s financial results and balance sheet have been allocated to the corresponding geographic areas. In 2017, starting from the integration date, Banco Popular was reported separately. The main affected areas are: Spain, Portugal and Real Estate Activity in Spain.
• The Wealth Management unit, created at the end of 2017, will be reported independently as a global business. This unit was previously included in Retail Banking. This change has no impact on the geographic segments.
• Annual adjustment of the Global Customer Relationship Model’s perimeter, between Retail Banking and Corporate and Investment Banking, with no impact on the geographic businesses.
These changes have no impact on the Group’s figures. However, for comparative purposes, the figures of previous periods have been restated including changes in the affected geographic and global businesses.
Moreover, the balance sheets have been adjusted to the new IFRS 9 regulation. Since retroactive application of this rule is not mandatory, certain lines of the 2018 balance sheet are not comparable with previously reported periods. For comparative purposes, and given the scant significance of portfolio reclassifications and their nomenclature changes, the 2017 accounts have been reorganised in accordance with their purpose and valuation method.
The financial statements of each business unit have been drawn up by aggregating the Group’s basic operating units. The information relates to both the accounting data of the units integrated in each segment, as well as that provided by the management information systems. In all cases, the same general principles as those used in the Group are applied.
The operating business areas are structured into two levels:
Geographic businesses. The operating units are segmented by geographical areas. This coincides with the Group’s first level of management and reflects Santander’s positioning in the world’s three main currency areas (euro, sterling and dollar). The segments reported on are:
• Continental Europe. This covers all businesses in the area. Detailed financial information is provided on Spain, Portugal, Poland and Santander Consumer Finance (which incorporates all the region’s business, including the three countries mentioned herewith).
• United Kingdom. This includes the businesses developed by the Group’s various units and branches in the country.
• Latin America. This embraces all the Group’s financial activities conducted via its banks and subsidiaries in the region. The financial statements of Brazil, Mexico, Chile and Argentina are set out.
• United States. Includes the holding Santander Holdings USA (SHUSA) and its subsidiaries Santander Bank, Banco Santander Puerto Rico, Santander Consumer USA, Banco Santander International, Santander Investment Securities and the New York branch.
Globales businesses. The activity of the operating units is distributed by the type of business: Retail Banking, Santander Corporate and Invesment Banking, Wealth Management and Spain Real Estate Activity.
• Retail Banking. This covers all customer banking businesses, including consumer finance, except those of corporate banking, which are managed through the CIB, and asset management and private banking, which are managed by Wealth Management. The results of the hedging positions in each country are also included, conducted within the sphere of each one’s Assets and Liabilities Committee.
• Corporate and Investment Banking (CIB). This business reflects the revenues from global corporate banking, investment banking and markets worldwide including treasuries managed globally (always after the appropriate distribution with Retail Banking customers), as well as equities business.
• Wealth Management. Includes the asset management business (Santander Asset Management), the new corporate unit of Private Banking and International Private Banking in Miami and Switzerland.
In addition to these operating units, which report by geographic area and by businesses, the Group continues to maintain the area of Corporate Centre. This area incorporates the centralised activities relating to equity stakes in financial companies, financial management of the structural exchange rate position, assumed within the sphere of the Group’s Assets and Liabilities Committee, as well as management of liquidity and of shareholders’ equity via issuances.
As the Group’s holding entity, this area manages all capital and reserves and allocations of capital and liquidity with the rest of businesses. It also incorporates amortisation of goodwill but not the costs related to the Group’s central services (charged to the areas), except for corporate and institutional expenses related to the Group’s functioning.
The figures of the Group’s various units have been drawn up in accordance with these criteria, and so do not coincide individually with those published by each unit.

21Financial Report 2018
JANUARY - JUNEBusiness information
NET OPERATING INCOME QoQ YoYEUR million Q2’18 % % excl. FX H1’18 % % excl. FX
Continental Europe 1,715 (10.4) (10.3) 3,631 12.7 13.0o/w: Spain 714 (22.2) (22.2) 1,633 23.4 23.4 Santander Consumer Finance 619 (1.9) (1.8) 1,250 1.7 2.4 Poland 236 32.1 34.4 415 7.2 6.0 Portugal 182 (0.6) (0.6) 364 26.6 26.6United Kingdom 610 4.1 3.3 1,195 (21.8) (20.1)Latin America 3,408 0.5 6.1 6,798 (2.6) 14.9o/w: Brazil 2,228 (2.3) 5.0 4,508 (3.5) 16.1 Mexico 505 2.9 3.2 996 (5.8) 3.5 Chile 370 (3.2) (3.0) 752 (1.6) 2.0 Argentina 223 40.4 56.8 382 (0.8) 50.8USA 932 10.6 7.3 1,775 (14.5) (4.5)Operating areas 6,665 (1.0) 1.3 13,399 (2.9) 7.3Corporate Centre (372) 7.0 7.0 (719) (21.7) (21.7)Total Group 6,293 (1.5) 1.0 12,680 (1.6) 9.6
GROSS LOANS AND ADVANCES TO CUSTOMERS EX. REV. REPOS QoQ YoYEUR million Q2’18 % % excl. FX H1’18 % % excl. FX
Continental Europe 386,720 1.0 1.1 386,720 (2.3) (2.1)o/w: Spain 218,191 0.6 0.6 218,191 (7.5) (7.5) Santander Consumer Finance 94,299 2.3 2.3 94,299 6.1 6.1 Poland 23,388 1.0 4.9 23,388 5.6 9.2 Portugal 37,057 (1.0) (1.0) 37,057 4.7 4.7United Kingdom 239,501 0.2 1.5 239,501 1.7 2.5Latin America 149,967 (3.6) 2.9 149,967 (2.7) 10.8o/w: Brazil 69,475 (6.2) 2.8 69,475 (5.3) 13.0 Mexico 29,212 1.8 3.4 29,212 (1.2) 9.8 Chile 39,396 1.0 3.0 39,396 8.4 8.4 Argentina 7,417 (4.2) 29.5 7,417 (10.1) 59.0USA 79,562 10.1 4.1 79,562 (1.0) 1.1Operating areas 855,751 0.7 1.8 855,751 (1.2) 1.6Total Group 862,885 0.8 1.9 862,885 (0.9) 1.8
CUSTOMER FUNDS (CUSTOMER DEP. EX. REPOS + MUTUAL FUNDS) QoQ YoYEUR million Q2’18 % % excl. FX H1’18 % % excl. FX
Continental Europe 432,133 1.8 2.0 432,133 6.0 6.3o/w: Spain 318,387 1.6 1.6 318,387 5.4 5.4 Santander Consumer Finance 36,728 (0.3) (0.4) 36,728 3.5 3.6 Poland 28,751 2.3 6.2 28,751 7.6 11.3 Portugal 39,195 5.2 5.2 39,195 8.9 8.9United Kingdom 204,659 (1.3) (0.0) 204,659 (1.9) (1.1)Latin America 195,788 (3.0) 4.5 195,788 0.3 16.3o/w: Brazil 106,121 (3.7) 5.6 106,121 3.4 23.4 Mexico 39,039 2.5 4.1 39,039 (1.7) 9.2 Chile 34,126 0.7 2.7 34,126 4.4 4.5 Argentina 11,325 (13.8) 16.5 11,325 (14.5) 51.3USA 62,210 6.0 0.3 62,210 (2.4) (0.3)Operating areas 894,790 0.3 1.9 894,790 2.3 6.0Total Group 895,028 0.3 1.9 895,028 2.3 6.0
ATTRIBUTABLE PROFIT TO THE GROUP QoQ YoYEUR million Q2’18 % % excl. FX H1’18 % % excl. FX
Continental Europe* 776 (16.7) (16.6) 1,707 14.5 15.1o/w: Spain* 325 (28.5) (28.5) 780 24.9 24.9 Santander Consumer Finance 346 7.2 7.2 669 5.5 6.6 Poland 93 46.7 49.1 156 9.4 8.1 Portugal* 103 (18.8) (18.8) 230 (2.5) (2.5)United Kingdom 372 16.4 15.5 692 (16.0) (14.1)Latin America 1,115 1.4 6.8 2,214 6.0 25.7o/w: Brazil 647 (4.5) 2.7 1,324 6.4 28.0 Mexico 184 5.6 5.9 359 2.5 12.6 Chile 158 4.8 5.0 308 4.0 7.9 Argentina 71 7.6 21.7 137 (28.7) 8.4USA 210 68.1 63.9 335 37.5 53.7Operating areas* 2,473 (0.1) 2.0 4,948 6.5 15.9Corporate Centre* (475) 12.7 12.7 (896) (13.1) (13.1)Total Group* 1,998 (2.7) (0.2) 4,052 12.1 25.2Net capital gains and provisions (300) — — (300) — —Total Group 1,698 (17.3) (15.0) 3,752 3.8 15.9
(*) In the units, underlying attributable profit (excluding net capital gains and provisions)
Financial Report 201822
JANUARY - JUNEBusiness information
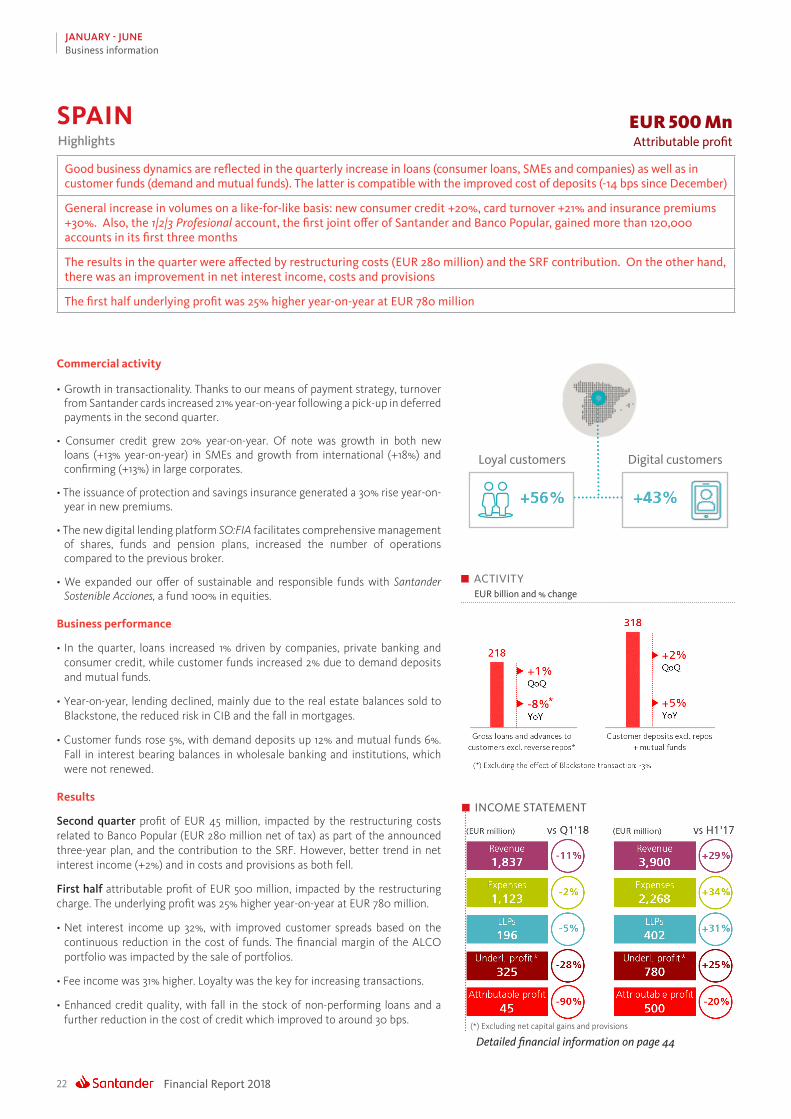
Commercial activity
• Growth in transactionality. Thanks to our means of payment strategy, turnover from Santander cards increased 21% year-on-year following a pick-up in deferred payments in the second quarter.
• Consumer credit grew 20% year-on-year. Of note was growth in both new loans (+13% year-on-year) in SMEs and growth from international (+18%) and confirming (+13%) in large corporates.
• The issuance of protection and savings insurance generated a 30% rise year-on-year in new premiums.
• The new digital lending platform SO:FIA facilitates comprehensive management of shares, funds and pension plans, increased the number of operations compared to the previous broker.
• We expanded our offer of sustainable and responsible funds with Santander Sostenible Acciones, a fund 100% in equities.
Business performance
• In the quarter, loans increased 1% driven by companies, private banking and consumer credit, while customer funds increased 2% due to demand deposits and mutual funds.
• Year-on-year, lending declined, mainly due to the real estate balances sold to Blackstone, the reduced risk in CIB and the fall in mortgages.
• Customer funds rose 5%, with demand deposits up 12% and mutual funds 6%. Fall in interest bearing balances in wholesale banking and institutions, which were not renewed.
Results
Second quarter profit of EUR 45 million, impacted by the restructuring costs related to Banco Popular (EUR 280 million net of tax) as part of the announced three-year plan, and the contribution to the SRF. However, better trend in net interest income (+2%) and in costs and provisions as both fell.
First half attributable profit of EUR 500 million, impacted by the restructuring charge. The underlying profit was 25% higher year-on-year at EUR 780 million.
• Net interest income up 32%, with improved customer spreads based on the continuous reduction in the cost of funds. The financial margin of the ALCO portfolio was impacted by the sale of portfolios.
• Fee income was 31% higher. Loyalty was the key for increasing transactions.
• Enhanced credit quality, with fall in the stock of non-performing loans and a further reduction in the cost of credit which improved to around 30 bps.
Detailed financial information on page 44
ACTIVITYEUR billion and % change
EUR 500 MnAttributable profitHighlights
Good business dynamics are reflected in the quarterly increase in loans (consumer loans, SMEs and companies) as well as in customer funds (demand and mutual funds). The latter is compatible with the improved cost of deposits (-14 bps since December)
General increase in volumes on a like-for-like basis: new consumer credit +20%, card turnover +21% and insurance premiums +30%. Also, the 1|2|3 Profesional account, the first joint offer of Santander and Banco Popular, gained more than 120,000 accounts in its first three months
The results in the quarter were affected by restructuring costs (EUR 280 million) and the SRF contribution. On the other hand, there was an improvement in net interest income, costs and provisions
The first half underlying profit was 25% higher year-on-year at EUR 780 million
SPAIN
Digital customersLoyal customers
INCOME STATEMENT
(*) Excluding net capital gains and provisions
23Financial Report 2018
JANUARY - JUNEBusiness information
Commercial activity
• The auto finance market continued to grow on a sustained basis, with new car sales up 2.9% in the first half in Europe.
• SCF continued its growth based on its business model: diversification by country, efficiency and risk and recovery systems that maintain high credit quality.
• Management continued to focus on boosting auto finance and increasing consumer credit by strengthening digital channels.
• In consumer credit, we launched two of the core projects to transform the business model (e-commerce and digital interaction with customers), with a roll out of more than 30 customer journeys in 10 units during the year.
• SC Germany’s integration of retail networks is progressing according to plan.
Business performance
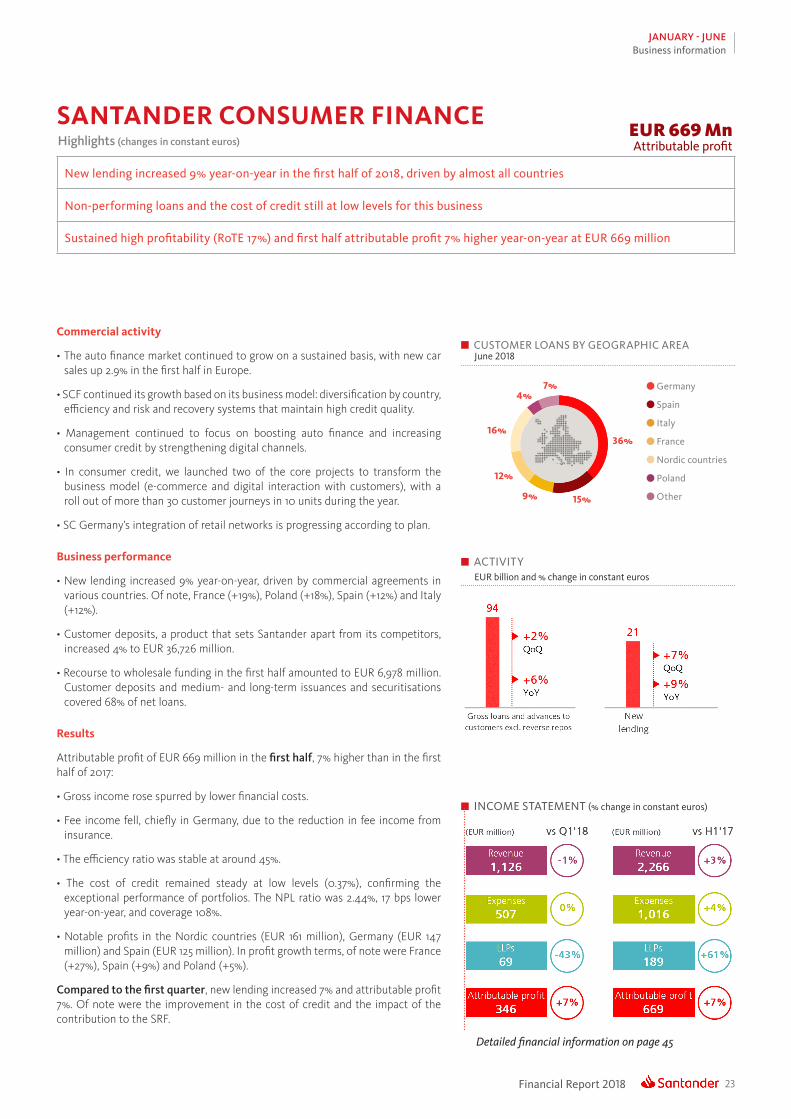
• New lending increased 9% year-on-year, driven by commercial agreements in various countries. Of note, France (+19%), Poland (+18%), Spain (+12%) and Italy (+12%).
• Customer deposits, a product that sets Santander apart from its competitors, increased 4% to EUR 36,726 million.
• Recourse to wholesale funding in the first half amounted to EUR 6,978 million. Customer deposits and medium- and long-term issuances and securitisations covered 68% of net loans.
Results
Attributable profit of EUR 669 million in the frst half, 7% higher than in the first half of 2017:
• Gross income rose spurred by lower financial costs.
• Fee income fell, chiefly in Germany, due to the reduction in fee income from insurance.
• The efficiency ratio was stable at around 45%.
• The cost of credit remained steady at low levels (0.37%), confirming the exceptional performance of portfolios. The NPL ratio was 2.44%, 17 bps lower year-on-year, and coverage 108%.
• Notable profits in the Nordic countries (EUR 161 million), Germany (EUR 147 million) and Spain (EUR 125 million). In profit growth terms, of note were France (+27%), Spain (+9%) and Poland (+5%).
Compared to the frst quarter, new lending increased 7% and attributable profit 7%. Of note were the improvement in the cost of credit and the impact of the contribution to the SRF.
Detailed financial information on page 45
ACTIVITYEUR billion and % change in constant euros
SANTANDER CONSUMER FINANCE
CUSTOMER LOANS BY GEOGRAPHIC AREAJune 2018
Germany
Spain
Italy
France
Nordic countries
Poland
Other
36%
15%9%
4%7%
12%
16%
INCOME STATEMENT (% change in constant euros)
EUR 669 MnAttributable profitHighlights (changes in constant euros)
New lending increased 9% year-on-year in the first half of 2018, driven by almost all countries
Non-performing loans and the cost of credit still at low levels for this business
Sustained high profitability (RoTE 17%) and first half attributable profit 7% higher year-on-year at EUR 669 million
Financial Report 201824
JANUARY - JUNEBusiness information
Detailed financial information on page 46
ACTIVITYEUR billion and % change in constant euros
Digital customersLoyal customers
INCOME STATEMENT (% change in constant euros)
Commercial activity
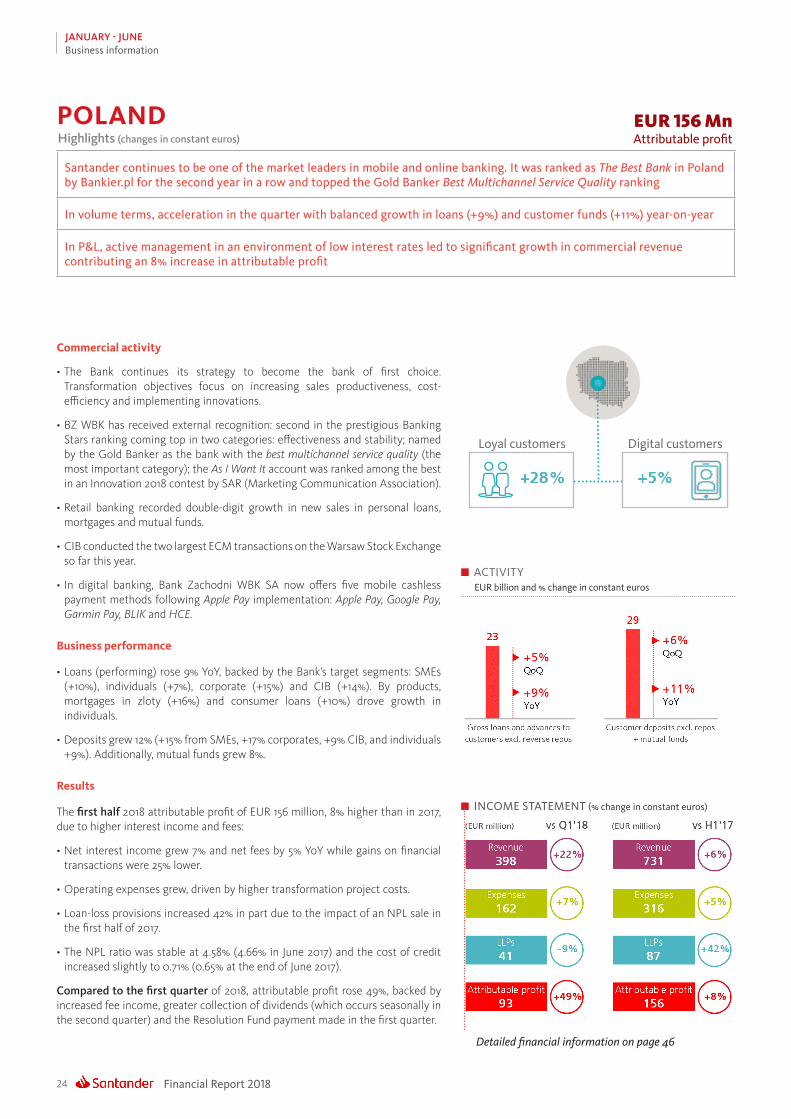
• The Bank continues its strategy to become the bank of first choice. Transformation objectives focus on increasing sales productiveness, cost-efficiency and implementing innovations.
• BZ WBK has received external recognition: second in the prestigious Banking Stars ranking coming top in two categories: effectiveness and stability; named by the Gold Banker as the bank with the best multichannel service quality (the most important category); the As I Want It account was ranked among the best in an Innovation 2018 contest by SAR (Marketing Communication Association).
• Retail banking recorded double-digit growth in new sales in personal loans, mortgages and mutual funds.
• CIB conducted the two largest ECM transactions on the Warsaw Stock Exchange so far this year.
• In digital banking, Bank Zachodni WBK SA now offers five mobile cashless payment methods following Apple Pay implementation: Apple Pay, Google Pay, Garmin Pay, BLIK and HCE.
Business performance
• Loans (performing) rose 9% YoY, backed by the Bank’s target segments: SMEs (+10%), individuals (+7%), corporate (+15%) and CIB (+14%). By products, mortgages in zloty (+16%) and consumer loans (+10%) drove growth in individuals.
• Deposits grew 12% (+15% from SMEs, +17% corporates, +9% CIB, and individuals +9%). Additionally, mutual funds grew 8%.
Results
The frst half 2018 attributable profit of EUR 156 million, 8% higher than in 2017, due to higher interest income and fees:
• Net interest income grew 7% and net fees by 5% YoY while gains on financial transactions were 25% lower.
• Operating expenses grew, driven by higher transformation project costs.
• Loan-loss provisions increased 42% in part due to the impact of an NPL sale in the first half of 2017.
• The NPL ratio was stable at 4.58% (4.66% in June 2017) and the cost of credit increased slightly to 0.71% (0.65% at the end of June 2017).
Compared to the frst quarter of 2018, attributable profit rose 49%, backed by increased fee income, greater collection of dividends (which occurs seasonally in the second quarter) and the Resolution Fund payment made in the first quarter.
EUR 156 MnAttributable profitHighlights (changes in constant euros)
Santander continues to be one of the market leaders in mobile and online banking. It was ranked as The Best Bank in Poland by Bankier.pl for the second year in a row and topped the Gold Banker Best Multichannel Service Quality ranking
In volume terms, acceleration in the quarter with balanced growth in loans (+9%) and customer funds (+11%) year-on-year
In P&L, active management in an environment of low interest rates led to significant growth in commercial revenue contributing an 8% increase in attributable profit
POLAND

25Financial Report 2018
JANUARY - JUNEBusiness information
Commercial activity
• The Bank continued to focus on the operational and technological integration of Banco Popular Portugal, the new functionalities of the digital channels and increasing loyalty.
• Of note, in addition to the Mundo 1|2|3 programme, was the development of new digital platforms such as the Santander Empresas app, among others. In personal loans, CrediSimples (contracting loans via digital channels) already accounts for 43% of new lending in the second quarter.
• In custumer funds, the campaign aimed at capturing new customers and their loyalty as well as reactivate current clients continued at a brisk pace.
• The strategy to transform the business model spurred growth in loyal and digital customers.
Business performance
• Loans were 5% higher year-on-year. The integration of Banco Popular Portugal made the loan portfolio more balanced and strengthened lending to companies, which now accounts for 42% of the total.
• Our market share of new loans to companies increased to 20% (+2.5 pp compared to the same period of 2017). In financing lines to SMEs (PME Investe, Crescimento and Capitalizar), the Bank remains the market leader with a share of 23%. Mortgage lending also remained dynamic (market share gain of 2.8 pp year-on-year).
• Customer funds increased 9% year-on-year, spurred by mutual funds (+15%), demand deposits (+11%) and time deposits (7%).
Results
The frst half attributable profit up 6% due to:
• Gross income increased 21% largely driven by net interest income (+25%).
• Costs rose 15%. Net income increased 27% and the efficiency ratio stood at 47.0% (-240 bps year-on-year).
• Provisions stood at EUR 8 million, compared to a release in the first half of 2017. The NPL ratio improved to 7.55% (9.10% a year before). Coverage was 53%.
• In addition, we recorded non-recurring items such as inorganic transactions and a temporary higher tax rate.
Compared to the frst quarter, underlying profit declined, as net interest income was impacted by the larger volume of deposits, lower fee income from advisory in CIB, integration costs and a higher tax rate. These impacts were only partially offset by higher gains on financial transactions from the sale of bonds.
Detailed financial information on page 47
ACTIVITYEUR billion and % change
EUR 250 MnAttributable profitHighlights
Santander Totta remains the country’s largest private sector bank by assets and domestic loans and continued to strengthen its position in the corporate market
The commercial strategy is reflected in lending growth, mainly companies and customer funds. First half profit up 6%
In April, DBRS upgraded its long-term debt rating for the Bank to A, with stable outlook
PORTUGAL
Digital customersLoyal customers
INCOME STATEMENT
(*) Excluding net capital gains and provisions
Financial Report 201826
JANUARY - JUNEBusiness information
Detailed financial information on page 48
ACTIVITYEUR billion and % change in constant euros
Digital customersLoyal customers
INCOME STATEMENT (% change in constant euros)
Commercial activity
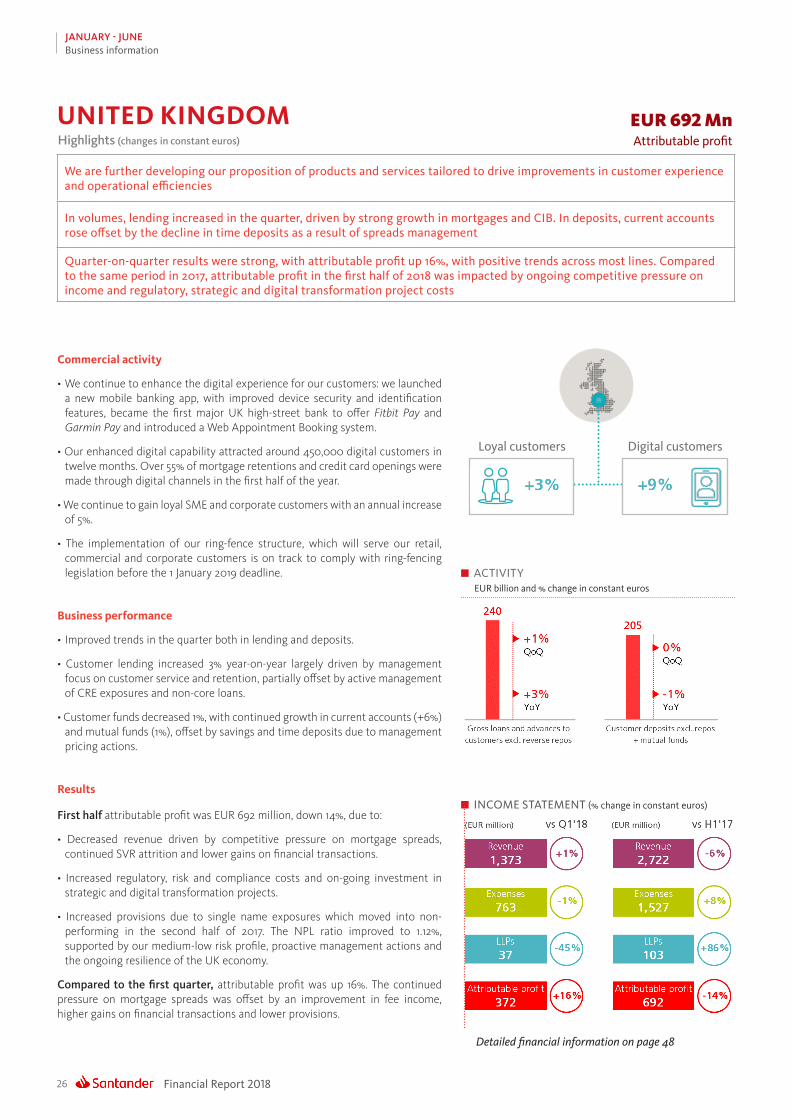
• We continue to enhance the digital experience for our customers: we launched a new mobile banking app, with improved device security and identification features, became the first major UK high-street bank to offer Fitbit Pay and Garmin Pay and introduced a Web Appointment Booking system.
• Our enhanced digital capability attracted around 450,000 digital customers in twelve months. Over 55% of mortgage retentions and credit card openings were made through digital channels in the first half of the year.
• We continue to gain loyal SME and corporate customers with an annual increase of 5%.
• The implementation of our ring-fence structure, which will serve our retail, commercial and corporate customers is on track to comply with ring-fencing legislation before the 1 January 2019 deadline.
Business performance
• Improved trends in the quarter both in lending and deposits.
• Customer lending increased 3% year-on-year largely driven by management focus on customer service and retention, partially offset by active management of CRE exposures and non-core loans.
• Customer funds decreased 1%, with continued growth in current accounts (+6%) and mutual funds (1%), offset by savings and time deposits due to management pricing actions.
Results
First half attributable profit was EUR 692 million, down 14%, due to:
• Decreased revenue driven by competitive pressure on mortgage spreads, continued SVR attrition and lower gains on financial transactions.
• Increased regulatory, risk and compliance costs and on-going investment in strategic and digital transformation projects.
• Increased provisions due to single name exposures which moved into non-performing in the second half of 2017. The NPL ratio improved to 1.12%, supported by our medium-low risk profile, proactive management actions and the ongoing resilience of the UK economy.
Compared to the frst quarter, attributable profit was up 16%. The continued pressure on mortgage spreads was offset by an improvement in fee income, higher gains on financial transactions and lower provisions.
EUR 692 MnAttributable profitHighlights (changes in constant euros)
We are further developing our proposition of products and services tailored to drive improvements in customer experience and operational efficiencies
In volumes, lending increased in the quarter, driven by strong growth in mortgages and CIB. In deposits, current accounts rose offset by the decline in time deposits as a result of spreads management
Quarter-on-quarter results were strong, with attributable profit up 16%, with positive trends across most lines. Compared to the same period in 2017, attributable profit in the first half of 2018 was impacted by ongoing competitive pressure on income and regulatory, strategic and digital transformation project costs
UNITED KINGDOM
27Financial Report 2018
JANUARY - JUNEBusiness information
Commercial activity
We continued to progress in our commercial and digital initiatives. Of note:
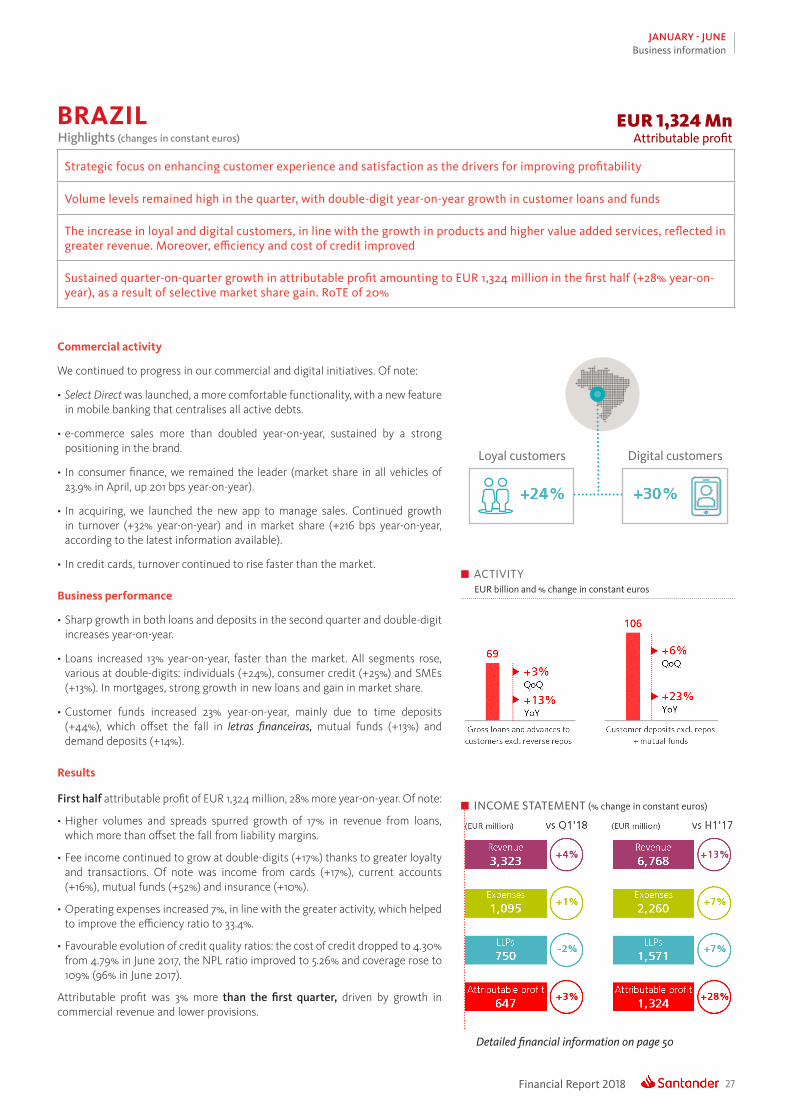
• Select Direct was launched, a more comfortable functionality, with a new feature in mobile banking that centralises all active debts.
• e-commerce sales more than doubled year-on-year, sustained by a strong positioning in the brand.
• In consumer finance, we remained the leader (market share in all vehicles of 23.9% in April, up 201 bps year-on-year).
• In acquiring, we launched the new app to manage sales. Continued growth in turnover (+32% year-on-year) and in market share (+216 bps year-on-year, according to the latest information available).
• In credit cards, turnover continued to rise faster than the market.
Business performance
• Sharp growth in both loans and deposits in the second quarter and double-digit increases year-on-year.
• Loans increased 13% year-on-year, faster than the market. All segments rose, various at double-digits: individuals (+24%), consumer credit (+25%) and SMEs (+13%). In mortgages, strong growth in new loans and gain in market share.
• Customer funds increased 23% year-on-year, mainly due to time deposits (+44%), which offset the fall in letras financeiras, mutual funds (+13%) and demand deposits (+14%).
Results
First half attributable profit of EUR 1,324 million, 28% more year-on-year. Of note:
• Higher volumes and spreads spurred growth of 17% in revenue from loans, which more than offset the fall from liability margins.
• Fee income continued to grow at double-digits (+17%) thanks to greater loyalty and transactions. Of note was income from cards (+17%), current accounts (+16%), mutual funds (+52%) and insurance (+10%).
• Operating expenses increased 7%, in line with the greater activity, which helped to improve the efficiency ratio to 33.4%.
• Favourable evolution of credit quality ratios: the cost of credit dropped to 4.30% from 4.79% in June 2017, the NPL ratio improved to 5.26% and coverage rose to 109% (96% in June 2017).
Attributable profit was 3% more than the frst quarter, driven by growth in commercial revenue and lower provisions.
Detailed financial information on page 50
ACTIVITYEUR billion and % change in constant euros
EUR 1,324 MnAttributable profitHighlights (changes in constant euros)
Strategic focus on enhancing customer experience and satisfaction as the drivers for improving profitability
Volume levels remained high in the quarter, with double-digit year-on-year growth in customer loans and funds
The increase in loyal and digital customers, in line with the growth in products and higher value added services, reflected in greater revenue. Moreover, efficiency and cost of credit improved
Sustained quarter-on-quarter growth in attributable profit amounting to EUR 1,324 million in the first half (+28% year-on-year), as a result of selective market share gain. RoTE of 20%
BRAZIL
Digital customersLoyal customers
INCOME STATEMENT (% change in constant euros)

Financial Report 201828
JANUARY - JUNEBusiness information
Commercial activity
The commercial strategy remains focused on boosting use of digital channels, loyalty and attracting new customers, with new products and services such as:
• Launch of the Digital Transformation of Payroll plan to enhance customer attention with efficiencies in time, costs and processes.
• Launch of Hipoteca Plus with a framework that benefits the customer if they have a close relationship with the Bank.
• A new branch distribution model was put into effect in order to transform 300 branches in 2018 (161 already completed).
• In SMEs, we launched the first digital account for SMEs that have the SAS (Sociedad por Acciones Simplificadas) regime created by the Ministry of Economy. We were the first bank in Mexico to do so.
• We continued to develop our digital offering via Súper Móvil, incorporating new functionalities.
• More than 3.8 million customers are registered in the Santander Plus programme, 54% of whom are new clients.
• Greater customer service coverage via agreements with new convenience stores, reaching 30,700 points of sale.
Business performance
• Lending grew 10% year-on-year, without losing sight of profitability. Loans to individuals rose 6% with notable growth in payroll loans (+12%), cards (+6%) and mortgages (+6%). Corporate loans increased 14%, driven by companies (+18%), SMEs (+11%) and CIB (+4%).
• Customer funds increased 9% year-on-year. Deposits rose 9% (individuals +18%), underpinned by time deposits (+14%) and mutual funds (+11%).
Results
Attributable profit in the frst half of EUR 359 million was 13% higher than in the first half of 2017, as follows:
• Net interest income rose 11%, driven by higher interest rates and increased volumes. Fee income grew 11%, mainly from insurance, collections and cards.
• Operating expenses were up 14% due our ongoing multi-channel investment plan.
• Loan-loss provisions improved and were down 11% with a lower cost of credit.
Compared to the frst quarter, attributable profit was up 6%, backed by the strong evolution of commercial revenue, gains on financial transactions and provisions.
Detailed financial information on page 51
ACTIVITYEUR billion and % change in constant euros
EUR 359 MnAttributable profitHighlights (changes in constant euros)
Strategy focused on the commercial transformation of the branch network and digitalisation. This is reflected in customer attraction and increased loyalty, higher volumes, improved asset quality and, as a result, higher revenue and profit
In volume terms, there was faster growth in lending. Of note were companies (+18%) and payroll loans (+12%). In customer funds, growth was driven by campaigns to capture deposits from individuals, SMEs and mutual funds
Good trend in profit. Attributable profit rose 6% quarter-on-quarter and 13% year-on-year, driven by the strong performance of commercial revenue and loan-loss provisions
MEXICO
Digital customersLoyal customers
INCOME STATEMENT (% change in constant euros)
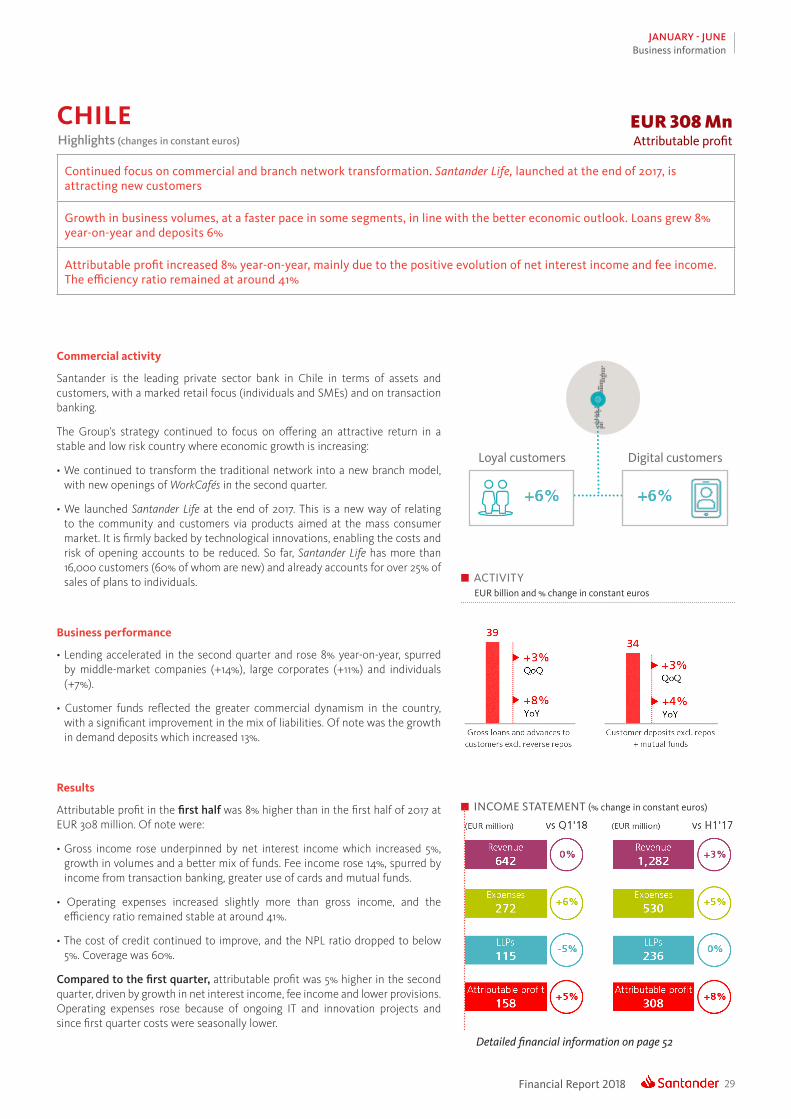
29Financial Report 2018
JANUARY - JUNEBusiness information
Detailed financial information on page 52
ACTIVITYEUR billion and % change in constant euros
Digital customersLoyal customers
INCOME STATEMENT (% change in constant euros)
Commercial activity
Santander is the leading private sector bank in Chile in terms of assets and customers, with a marked retail focus (individuals and SMEs) and on transaction banking.
The Group’s strategy continued to focus on offering an attractive return in a stable and low risk country where economic growth is increasing:
• We continued to transform the traditional network into a new branch model, with new openings of WorkCafés in the second quarter.
• We launched Santander Life at the end of 2017. This is a new way of relating to the community and customers via products aimed at the mass consumer market. It is firmly backed by technological innovations, enabling the costs and risk of opening accounts to be reduced. So far, Santander Life has more than 16,000 customers (60% of whom are new) and already accounts for over 25% of sales of plans to individuals.
Business performance
• Lending accelerated in the second quarter and rose 8% year-on-year, spurred by middle-market companies (+14%), large corporates (+11%) and individuals (+7%).
• Customer funds reflected the greater commercial dynamism in the country, with a significant improvement in the mix of liabilities. Of note was the growth in demand deposits which increased 13%.
Results
Attributable profit in the frst half was 8% higher than in the first half of 2017 at EUR 308 million. Of note were:
• Gross income rose underpinned by net interest income which increased 5%, growth in volumes and a better mix of funds. Fee income rose 14%, spurred by income from transaction banking, greater use of cards and mutual funds.
• Operating expenses increased slightly more than gross income, and the efficiency ratio remained stable at around 41%.
• The cost of credit continued to improve, and the NPL ratio dropped to below 5%. Coverage was 60%.
Compared to the frst quarter, attributable profit was 5% higher in the second quarter, driven by growth in net interest income, fee income and lower provisions. Operating expenses rose because of ongoing IT and innovation projects and since first quarter costs were seasonally lower.
EUR 308 MnAttributable profitHighlights (changes in constant euros)
Continued focus on commercial and branch network transformation. Santander Life, launched at the end of 2017, is attracting new customers
Growth in business volumes, at a faster pace in some segments, in line with the better economic outlook. Loans grew 8% year-on-year and deposits 6%
Attributable profit increased 8% year-on-year, mainly due to the positive evolution of net interest income and fee income. The efficiency ratio remained at around 41%
CHILE
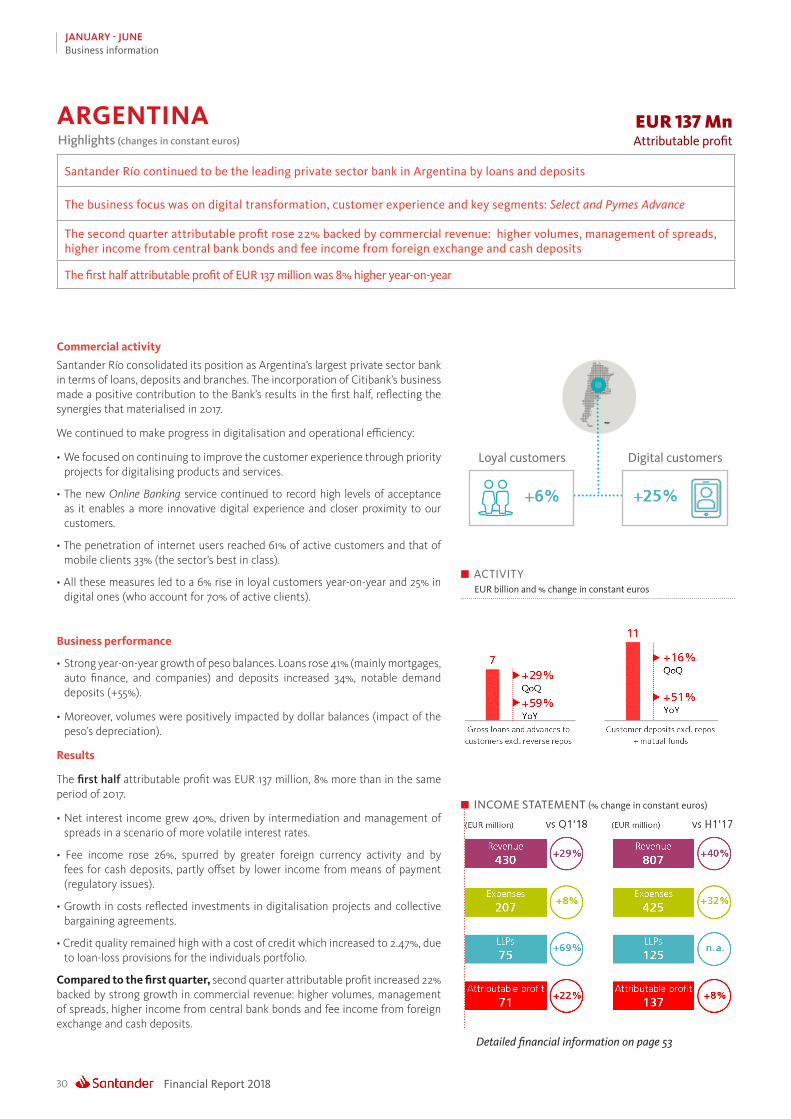
Financial Report 201830
JANUARY - JUNEBusiness information
Detailed financial information on page 53
ACTIVITYEUR billion and % change in constant euros
Digital customersLoyal customers
INCOME STATEMENT (% change in constant euros)
Commercial activity
Santander Río consolidated its position as Argentina’s largest private sector bank in terms of loans, deposits and branches. The incorporation of Citibank’s business made a positive contribution to the Bank’s results in the first half, reflecting the synergies that materialised in 2017.
We continued to make progress in digitalisation and operational efficiency:
• We focused on continuing to improve the customer experience through priority projects for digitalising products and services.
• The new Online Banking service continued to record high levels of acceptance as it enables a more innovative digital experience and closer proximity to our customers.
• The penetration of internet users reached 61% of active customers and that of mobile clients 33% (the sector’s best in class).
• All these measures led to a 6% rise in loyal customers year-on-year and 25% in digital ones (who account for 70% of active clients).
Business performance
• Strong year-on-year growth of peso balances. Loans rose 41% (mainly mortgages, auto finance, and companies) and deposits increased 34%, notable demand deposits (+55%).
• Moreover, volumes were positively impacted by dollar balances (impact of the peso’s depreciation).
Results
The frst half attributable profit was EUR 137 million, 8% more than in the same period of 2017.
• Net interest income grew 40%, driven by intermediation and management of spreads in a scenario of more volatile interest rates.
• Fee income rose 26%, spurred by greater foreign currency activity and by fees for cash deposits, partly offset by lower income from means of payment (regulatory issues).
• Growth in costs reflected investments in digitalisation projects and collective bargaining agreements.
• Credit quality remained high with a cost of credit which increased to 2.47%, due to loan-loss provisions for the individuals portfolio.
Compared to the first quarter, second quarter attributable profit increased 22% backed by strong growth in commercial revenue: higher volumes, management of spreads, higher income from central bank bonds and fee income from foreign exchange and cash deposits.
EUR 137 MnAttributable profitHighlights (changes in constant euros)
Santander Río continued to be the leading private sector bank in Argentina by loans and deposits
The business focus was on digital transformation, customer experience and key segments: Select and Pymes Advance
The second quarter attributable profit rose 22% backed by commercial revenue: higher volumes, management of spreads, higher income from central bank bonds and fee income from foreign exchange and cash deposits
The first half attributable profit of EUR 137 million was 8% higher year-on-year
ARGENTINA

31Financial Report 2018
JANUARY - JUNEBusiness information
Commercial activity
• Santander continued to focus on improving customer satisfaction and increasing loyalty. It took advantage in the first half of regional synergies with Santander Río and launched #el banco de verano, which was widely accepted by customers.
• We continued to advance in the digital transformation strategy and in modernising channels. The number of digital customers increased 33% to over 200,000 (penetration of 54%, up from 44% in June 2017). Transactions via digital channels rose 48% year-on-year. Consumer finance companies also increased placements via digital channels. At Creditel they already account for 32% of new loans.
• Loans grew in target segments, products and currencies: +23% in consumer credit and cards and +16% in the national currency portfolio. Peso deposits grew 20% and foreign currency ones fell 1% year-on-year.
Results
The frst half attributable profit was 40% higher year-on-year at EUR 68 million:
• Gross income rose 17%, driven by net interest income and in general, by the main revenue lines. The efficiency ratio was 43.6%, 5 pp better than in the first half of 2017.
• Despite the rise in provisions because of the entry into force of IFRS 9 regulation and other impacts, the NPL ratio remained at a low level (2.76%), coverage was high (148%) and the cost of credit was 2.54%.
The second quarter attributable profit was 15% higher than the first’s, due to the good performance of gross income (+5%), flat costs and a lower tax charge.
Highlights (changes in constant euros)
The Group continued to be the leading private sector bank in the country, focused on growing in retail banking and improving efficiency and the quality of service
Attributable profit rose 40%, spurred by the good performance of net interest income and fee income, as well as cost control. RoTE of 29%
URUGUAY
• The strategy remained focused on the corporate segment, the country’s large companies and the Group’s global clients.
• The specialised auto finance company continued to increase its revenue at double-digit rates.
• Lending declined 10% compared to June 2017, because of the maturity of a one-off transaction, and deposits rose 22%.
• Attributable profit in the frst half remained virtually unchanged at EUR 16 million. Positive evolution of all income lines more than offset the increase in costs. The efficiency ratio was 37% and NPL coverage remained high (228%). The second quarter profit was 10% higher quarter-on-quarter.
• Activity in Colombia remained focused on CIB clients, large companies and corporates, contributing solutions in treasury, risk hedging, foreign trade and confirming, and developing investment banking products and supporting the country’s infrastructure plan. This offer is in the process of being expanded with a licence for Santander Securities Services Colombia, enabling custody services to be offered.
• We continued the strategy to consolidate the auto financing business. This will enable us to have the critical mass needed to position ourselves in this market in Colombia.
• Lending registered a slight fall year-on-year while deposits rose 15%, thanks to the good evolution of demand and time deposits.
• Once again, quarterly profit was positive contributing to a first half profit of EUR 2 million. Of note was the good performance of gross income (+27%) backed by higher net interest income and gains on financial transactions.
PERU
COLOMBIA
Highlights (changes in constant euros)
Highlights (changes in constant euros)
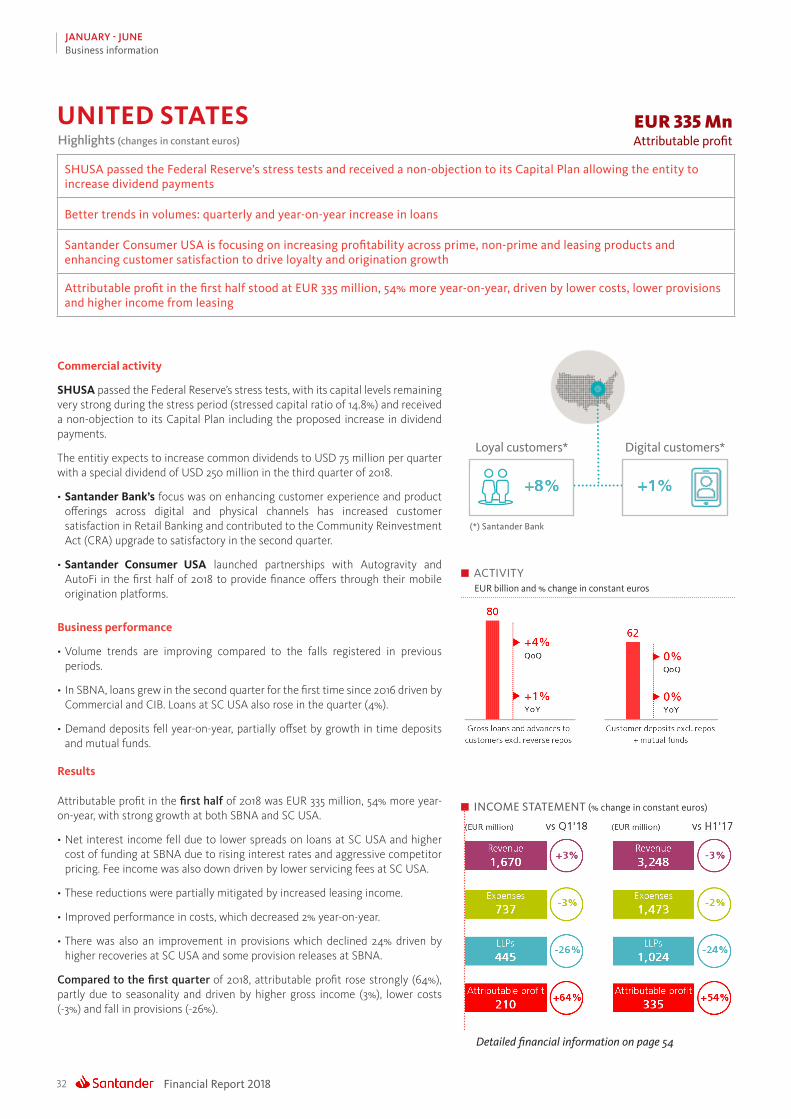
Financial Report 201832
JANUARY - JUNEBusiness information
Detailed financial information on page 54
ACTIVITYEUR billion and % change in constant euros
INCOME STATEMENT (% change in constant euros)
Commercial activity
SHUSA passed the Federal Reserve’s stress tests, with its capital levels remaining very strong during the stress period (stressed capital ratio of 14.8%) and received a non-objection to its Capital Plan including the proposed increase in dividend payments.
The entitiy expects to increase common dividends to USD 75 million per quarter with a special dividend of USD 250 million in the third quarter of 2018.
• Santander Bank’s focus was on enhancing customer experience and product offerings across digital and physical channels has increased customer satisfaction in Retail Banking and contributed to the Community Reinvestment Act (CRA) upgrade to satisfactory in the second quarter.
• Santander Consumer USA launched partnerships with Autogravity and AutoFi in the first half of 2018 to provide finance offers through their mobile origination platforms.
Business performance
• Volume trends are improving compared to the falls registered in previous periods.
• In SBNA, loans grew in the second quarter for the first time since 2016 driven by Commercial and CIB. Loans at SC USA also rose in the quarter (4%).
• Demand deposits fell year-on-year, partially offset by growth in time deposits and mutual funds.
Results
Attributable profit in the frst half of 2018 was EUR 335 million, 54% more year-on-year, with strong growth at both SBNA and SC USA.
• Net interest income fell due to lower spreads on loans at SC USA and higher cost of funding at SBNA due to rising interest rates and aggressive competitor pricing. Fee income was also down driven by lower servicing fees at SC USA.
• These reductions were partially mitigated by increased leasing income.
• Improved performance in costs, which decreased 2% year-on-year.
• There was also an improvement in provisions which declined 24% driven by higher recoveries at SC USA and some provision releases at SBNA.
Compared to the frst quarter of 2018, attributable profit rose strongly (64%), partly due to seasonality and driven by higher gross income (3%), lower costs (-3%) and fall in provisions (-26%).
EUR 335 MnAttributable profitHighlights (changes in constant euros)
SHUSA passed the Federal Reserve’s stress tests and received a non-objection to its Capital Plan allowing the entity to increase dividend payments
Better trends in volumes: quarterly and year-on-year increase in loans
Santander Consumer USA is focusing on increasing profitability across prime, non-prime and leasing products and enhancing customer satisfaction to drive loyalty and origination growth
Attributable profit in the first half stood at EUR 335 million, 54% more year-on-year, driven by lower costs, lower provisions and higher income from leasing
UNITED STATES
Digital customers*Loyal customers*
(*) Santander Bank
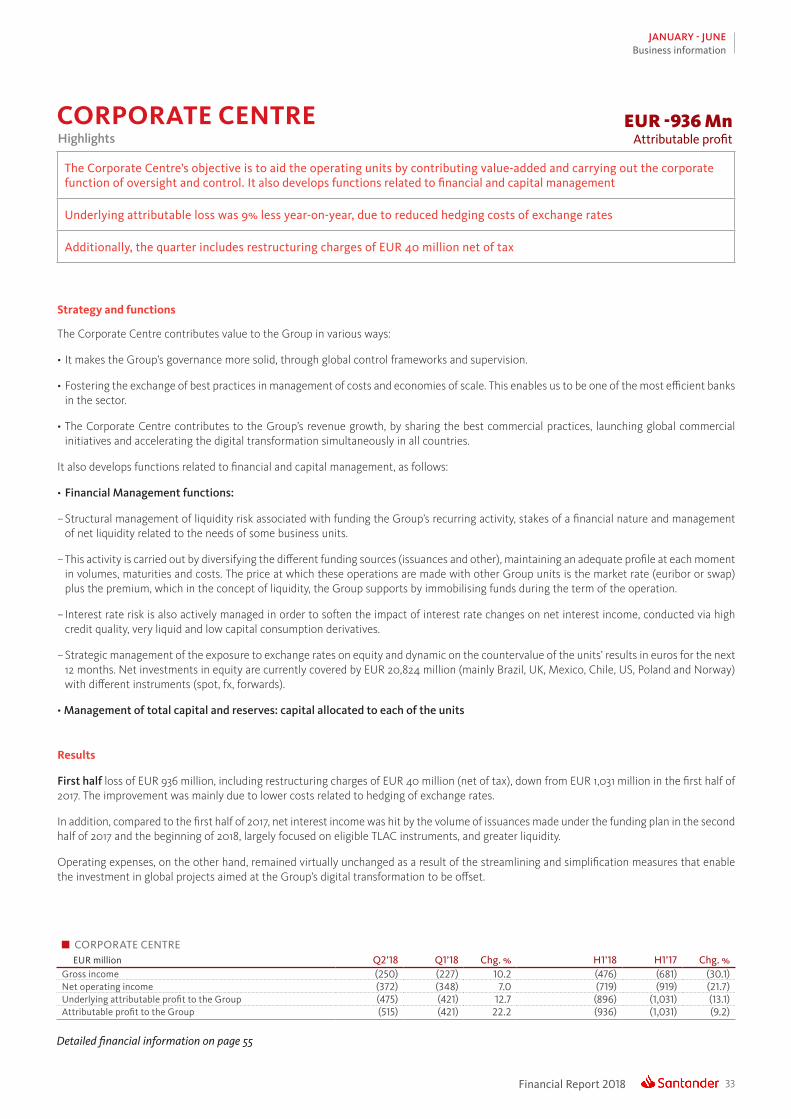
33Financial Report 2018
JANUARY - JUNEBusiness information
Strategy and functions
The Corporate Centre contributes value to the Group in various ways:
• It makes the Group’s governance more solid, through global control frameworks and supervision.
• Fostering the exchange of best practices in management of costs and economies of scale. This enables us to be one of the most efficient banks in the sector.
• The Corporate Centre contributes to the Group’s revenue growth, by sharing the best commercial practices, launching global commercial initiatives and accelerating the digital transformation simultaneously in all countries.
It also develops functions related to financial and capital management, as follows:
• Financial Management functions:
– Structural management of liquidity risk associated with funding the Group’s recurring activity, stakes of a financial nature and management of net liquidity related to the needs of some business units.
– This activity is carried out by diversifying the different funding sources (issuances and other), maintaining an adequate profile at each moment in volumes, maturities and costs. The price at which these operations are made with other Group units is the market rate (euribor or swap) plus the premium, which in the concept of liquidity, the Group supports by immobilising funds during the term of the operation.
– Interest rate risk is also actively managed in order to soften the impact of interest rate changes on net interest income, conducted via high credit quality, very liquid and low capital consumption derivatives.
– Strategic management of the exposure to exchange rates on equity and dynamic on the countervalue of the units’ results in euros for the next 12 months. Net investments in equity are currently covered by EUR 20,824 million (mainly Brazil, UK, Mexico, Chile, US, Poland and Norway) with different instruments (spot, fx, forwards).
• Management of total capital and reserves: capital allocated to each of the units
Results
First half loss of EUR 936 million, including restructuring charges of EUR 40 million (net of tax), down from EUR 1,031 million in the first half of 2017. The improvement was mainly due to lower costs related to hedging of exchange rates.
In addition, compared to the first half of 2017, net interest income was hit by the volume of issuances made under the funding plan in the second half of 2017 and the beginning of 2018, largely focused on eligible TLAC instruments, and greater liquidity.
Operating expenses, on the other hand, remained virtually unchanged as a result of the streamlining and simplification measures that enable the investment in global projects aimed at the Group’s digital transformation to be offset.
EUR -936 MnAttributable profitHighlights
The Corporate Centre’s objective is to aid the operating units by contributing value-added and carrying out the corporate function of oversight and control. It also develops functions related to financial and capital management
Underlying attributable loss was 9% less year-on-year, due to reduced hedging costs of exchange rates
Additionally, the quarter includes restructuring charges of EUR 40 million net of tax
CORPORATE CENTRE
CORPORATE CENTREEUR million Q2’18 Q1’18 Chg. % H1’18 H1’17 Chg. %
Gross income (250) (227) 10.2 (476) (681) (30.1)Net operating income (372) (348) 7.0 (719) (919) (21.7)Underlying attributable profit to the Group (475) (421) 12.7 (896) (1,031) (13.1)Attributable profit to the Group (515) (421) 22.2 (936) (1,031) (9.2)
Detailed financial information on page 55

Financial Report 201834
JANUARY - JUNEBusiness information
Detailed financial information on page 56
ACTIVITYEUR billion and % change in constant euros
EUR 3,675 MnAttributable profitHighlights (changes in constant euros)
Continued focus on three main priorities: customer loyalty, digital transformation and operational excellence
As at end June, the Group had more than 19 million loyal customers and over 28 million digital customers
Underlying attributable profit was EUR 3,935 million, partly driven by the perimeter effect following Popular’s incorporation and the good performance of commercial revenue in Latin America
RETAIL BANKING
Digital customersLoyal customers
INCOME STATEMENT (% change in constant euros)
Commercial activity
Santander is immersed in a commercial transformation process that rests on three main pillars:
1. Continuous improvement in the loyalty of our customers, thanks to measures such as:
– The 1|2|3 strategy continues to be reinforced in most countries. Spain obtained more than 120,000 1|2|3 Profesional accounts in the first three months since launch. In Mexico, Santander Plus already has more than 3.8 million customers, 54% of whom are new clients.
– We continued to differentiate Santander from its competitors with new innovative products. Spain expanded its offering of sustainable and responsible funds, such as Santander Sostenible Acciones. Chile continued to promote Santander Life and in Mexico, we launched the first digital SME account for companies in the SAS regime (Sociedad por Acciones Simplificadas).
– Thanks to these measures, loyal customers increased 17% year-on-year.
2. Promote the digital transformation of channels, products and services:
– In digital platforms, in acquiring Brazil launched a new app for managing sales. New products were offered in Portugal such as the Santander Empresas app. In Spain, the first we.trade operations were launched (a blockchain-based platform that facilitates the internationalisation of companies). In Argentina, the new online banking service continued to be well received.
– As regards payments via mobile phone and other channels, Poland now offers five ways for mobile payments: Apple Pay, Google Pay, Garmin Pay, BLIK and HCE. In the UK, we were the first bank to offer Garmin Pay and Fitbit Pay.
– All these measures led to a 23% rise in digital customers.
3. Improve customer satisfaction and experience. In order to achieve this, we continued to transform the traditional network, with new openings in Chile of WorkCafé branches and the new distribution model of branches in Mexico. We remained focused on becoming the best bank for our customers, as recognised by the market. In Poland, for example, Gold Banker chose us as the bank with the best multichannel service quality. Euromoney magazine named Santander the best bank in Western Europe, Spain, Chile and Uruguay.
Results (in constant euros)
The frst half underlying attributable profit was EUR 3,935 million, 20% more than in the same period of 2017, partly driven by the Popular’s incorporation and the good dynamics in commercial revenue.
Compared to the frst quarter, second quarter underlying attributable was 6% higher, thanks to the good performance of net interest income and fee income and to lower provisions.
(*) Excluding net capital gains and provisions
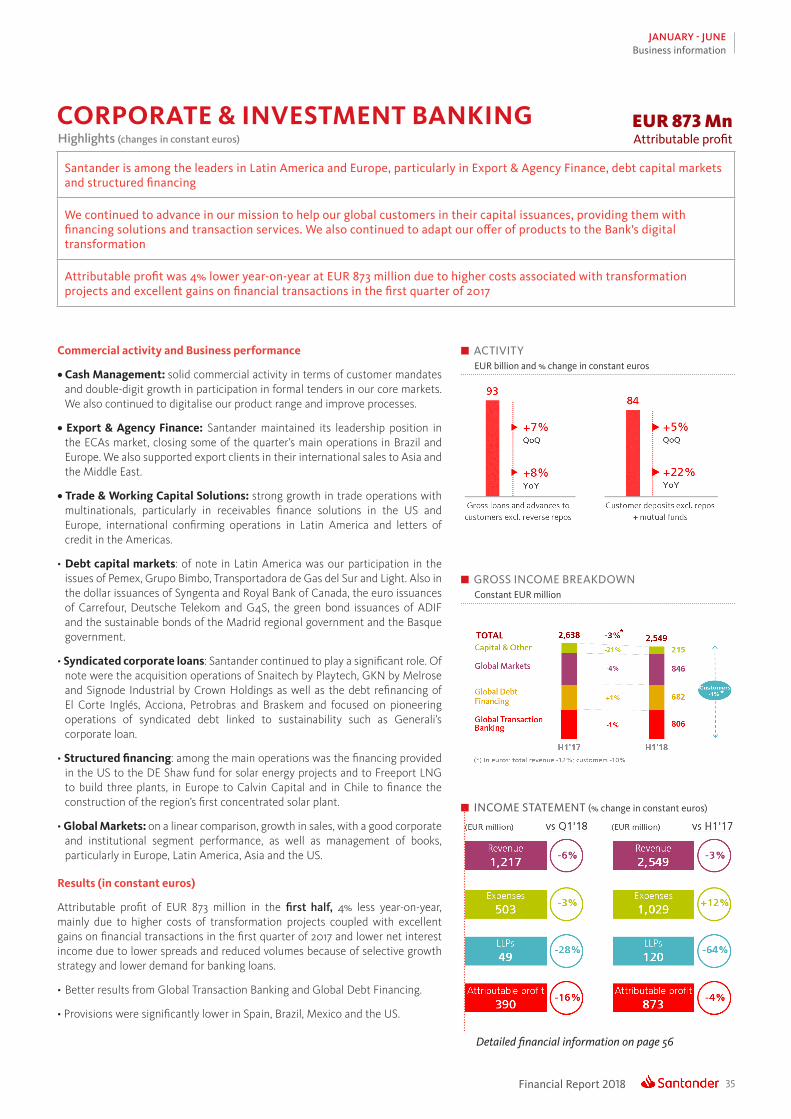
35Financial Report 2018
JANUARY - JUNEBusiness information
Commercial activity and Business performance
• Cash Management: solid commercial activity in terms of customer mandates and double-digit growth in participation in formal tenders in our core markets. We also continued to digitalise our product range and improve processes.
• Export & Agency Finance: Santander maintained its leadership position in the ECAs market, closing some of the quarter’s main operations in Brazil and Europe. We also supported export clients in their international sales to Asia and the Middle East.
• Trade & Working Capital Solutions: strong growth in trade operations with multinationals, particularly in receivables finance solutions in the US and Europe, international confirming operations in Latin America and letters of credit in the Americas.
• Debt capital markets: of note in Latin America was our participation in the issues of Pemex, Grupo Bimbo, Transportadora de Gas del Sur and Light. Also in the dollar issuances of Syngenta and Royal Bank of Canada, the euro issuances of Carrefour, Deutsche Telekom and G4S, the green bond issuances of ADIF and the sustainable bonds of the Madrid regional government and the Basque government.
• Syndicated corporate loans: Santander continued to play a significant role. Of note were the acquisition operations of Snaitech by Playtech, GKN by Melrose and Signode Industrial by Crown Holdings as well as the debt refinancing of El Corte Inglés, Acciona, Petrobras and Braskem and focused on pioneering operations of syndicated debt linked to sustainability such as Generali’s corporate loan.
• Structured financing: among the main operations was the financing provided in the US to the DE Shaw fund for solar energy projects and to Freeport LNG to build three plants, in Europe to Calvin Capital and in Chile to finance the construction of the region’s first concentrated solar plant.
• Global Markets: on a linear comparison, growth in sales, with a good corporate and institutional segment performance, as well as management of books, particularly in Europe, Latin America, Asia and the US.
Results (in constant euros)
Attributable profit of EUR 873 million in the frst half, 4% less year-on-year, mainly due to higher costs of transformation projects coupled with excellent gains on financial transactions in the first quarter of 2017 and lower net interest income due to lower spreads and reduced volumes because of selective growth strategy and lower demand for banking loans.
• Better results from Global Transaction Banking and Global Debt Financing.
• Provisions were significantly lower in Spain, Brazil, Mexico and the US.
Detailed financial information on page 56
ACTIVITYEUR billion and % change in constant euros
GROSS INCOME BREAKDOWNConstant EUR million
EUR 873 MnAttributable profitHighlights (changes in constant euros)
Santander is among the leaders in Latin America and Europe, particularly in Export & Agency Finance, debt capital markets and structured financing
We continued to advance in our mission to help our global customers in their capital issuances, providing them with financing solutions and transaction services. We also continued to adapt our offer of products to the Bank’s digital transformation
Attributable profit was 4% lower year-on-year at EUR 873 million due to higher costs associated with transformation projects and excellent gains on financial transactions in the first quarter of 2017
CORPORATE & INVESTMENT BANKING
INCOME STATEMENT (% change in constant euros)
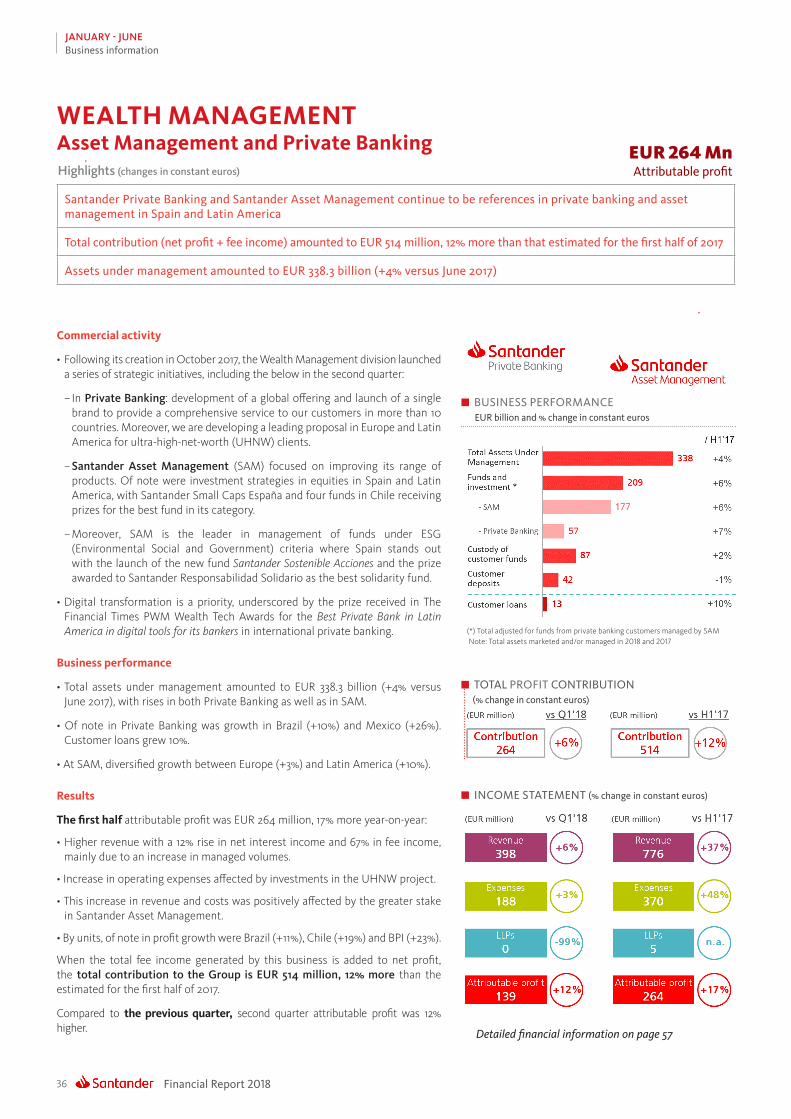
Financial Report 201836
JANUARY - JUNEBusiness information
Detailed financial information on page 57
EUR 264 MnAttributable profitHighlights (changes in constant euros)
Santander Private Banking and Santander Asset Management continue to be references in private banking and asset management in Spain and Latin America
Total contribution (net profit + fee income) amounted to EUR 514 million, 12% more than that estimated for the first half of 2017
Assets under management amounted to EUR 338.3 billion (+4% versus June 2017)
WEALTH MANAGEMENTAsset Management and Private Banking
Commercial activity
• Following its creation in October 2017, the Wealth Management division launched a series of strategic initiatives, including the below in the second quarter:
– In Private Banking: development of a global offering and launch of a single brand to provide a comprehensive service to our customers in more than 10 countries. Moreover, we are developing a leading proposal in Europe and Latin America for ultra-high-net-worth (UHNW) clients.
– Santander Asset Management (SAM) focused on improving its range of products. Of note were investment strategies in equities in Spain and Latin America, with Santander Small Caps España and four funds in Chile receiving prizes for the best fund in its category.
– Moreover, SAM is the leader in management of funds under ESG (Environmental Social and Government) criteria where Spain stands out with the launch of the new fund Santander Sostenible Acciones and the prize awarded to Santander Responsabilidad Solidario as the best solidarity fund.
• Digital transformation is a priority, underscored by the prize received in The Financial Times PWM Wealth Tech Awards for the Best Private Bank in Latin America in digital tools for its bankers in international private banking.
Business performance
• Total assets under management amounted to EUR 338.3 billion (+4% versus June 2017), with rises in both Private Banking as well as in SAM.
• Of note in Private Banking was growth in Brazil (+10%) and Mexico (+26%). Customer loans grew 10%.
• At SAM, diversified growth between Europe (+3%) and Latin America (+10%).
Results
The first half attributable profit was EUR 264 million, 17% more year-on-year:
• Higher revenue with a 12% rise in net interest income and 67% in fee income, mainly due to an increase in managed volumes.
• Increase in operating expenses affected by investments in the UHNW project.
• This increase in revenue and costs was positively affected by the greater stake in Santander Asset Management.
• By units, of note in profit growth were Brazil (+11%), Chile (+19%) and BPI (+23%).
When the total fee income generated by this business is added to net profit, the total contribution to the Group is EUR 514 million, 12% more than the estimated for the first half of 2017.
Compared to the previous quarter, second quarter attributable profit was 12% higher.
INCOME STATEMENT (% change in constant euros)
BUSINESS PERFORMANCEEUR billion and % change in constant euros
(*) Total adjusted for funds from private banking customers managed by SAM Note: Total assets marketed and/or managed in 2018 and 2017
TOTAL PROFIT CONTRIBUTION (% change in constant euros)
37Financial Report 2018
JANUARY - JUNECorporate Governance
CORPORATE GOVERNANCE
Balancedcomposition of
the Board
Maximum transparency
in remuneration
Respect forshareholders’
rights
At the forefront of bestcorporate governance
practices
A responsible bank has a solid governance model with well-defined functions, it manages risks and opportunities prudently and defines its long-term strategy watching out for the interests of all its stakeholders and society in general.
Modification of the corporate by-laws and the board’s regulations
The changes to the by-laws approved at the AGM on 23 March 2018 obtained the corresponding administrative authorisation from the European Central Bank.
At its meeting on 25 June 2018, the board agreed to modify Article 21 of the regulations that govern the Responsible Banking, Sustainability and Culture committee, in order to allow it to be chaired by an independent director.
Changes to the composition of the board’s committees
The board agreed at its meeting on 23 April 2018 to appoint Mr Álvaro Antonio Cardoso de Sousa to the Risk Supervision, Regulation and Compliance committee.
The following changes to the board’s committees were agreed at the board’s meeting on 25 June 2018 and are effective as of 1 July 2018:
• The following are members of the new Responsible Banking, Sustainability and Culture committee:
– Chairman: Mr Ramiro Mato García-Ansorena
– Members: Ms Ana Botín-Sanz de Sautuola y O’Shea
Ms Belén Romana García
Ms Homaira Akbari
Ms Sol Daurella Comadrán
Ms Esther Giménez-Salinas i Colomer
Mr Ignacio Benjumea Cabeza de Vaca
– Secretary: Mr Jaime Pérez Renovales
• Ms Belén Romana García has been appointed to the Executive committee.
• Mr Ignacio Benjumea Cabeza de Vaca is no longer a member of the Appointments committee.
• Mr Guillermo de la Dehesa Romero has ceased to be a member of the Risk Supervision, Regulation and Compliance committee.
• Mr Rodrigo Echenique Gordillo and Ms Esther Giménez-Salinas i Colomer are no longer members of the Innovation and Technology committee.
Appointments to the Group’s top management
On 23 April 2018, the board appointed Mr Dirk Marzluf as the new head of the Group’s Technology and Operations Division, replacing Mr Andreu Plaza. The appoinment, effective next September, is subject to obtaining the corresponding regulatory authorisations.
On 25 June 2018, and effective 1 July 2018, the board appointed Mr Keiran Foad as the new Chief Risk Officer (CRO) replacing Mr José María Nus Badía.

Financial Report 201838
JANUARY - JUNESustainability
SUSTAINABILITYWe develop our activity in a responsible way, contributing to the economic and social progress of the communities in which we operate, taking into account our impact on the environment and fostering stable relationships with our main stakeholders.
Presence in the sociallyresponsible investment
indices
183 millionsocial investment in communities ...
2.1 million peoplehelped in 2017
... of which EUR 129 million were invested in
higher education
Grupo Santander continued to develop new measures within its corporate social responsibility commitment. The main ones in the second quarter were:
Sustainable governance
Santander joined the responsible banking initiative promoted by the United Nations. Together with 25 other big banks from five continents, we will develop principals for adapting the financial sector to the UN’s Sustainable Development Goals and the Paris Agreement on Climate Change. Development of the principals will include consultations with different stakeholders, such as civil society organisations, banking associations, regulatory entities and UN organisations.
Presence in sustainable in indices and investors
Banco Santander was again included in 2017 in the Dow Jones Sustainability Index (DJSI), where it has been present since 2000. It is ranked ninth in the world, second in Europe and first in Spain and achieved a bronze in the banking sector.
According to the Bloomberg Gender-Equality Index, Santander is a leader in diversity. In 2018 Banco Santander was at the top of the 104 companies that comprise the global diversity index.
Investment in communities
At an event presided by HM Queen Letizia, the chairman of Banco Santander awarded on 7 May the ten winning projects of Banco Santander’s 10th Convening of Santander’s Social Projects, chosen from 250 initiatives that were presented by and voted for by the Bank’s employees in Spain. This programme is based on a fund (Euros from your Payroll) which is financed by donations from employees who participate in the programme, and every euro they contribute is matched by the Bank.
More than 3,500 people took part in activities organised at the corporate centre during the 11th edition of the We are Santander Week. Solidarity played a key role during this week, thanks to the volunteers who participate in the various activities. The main event was the Big Food Drive, which was held for the fifth time. A total of 20,800 kg of food was delivered to the Red Cross, meeting the needs of 2,070 families.
Also within the Group’s volunteering framework, the From Woman to Woman programme completed its second edition. Twenty-nine Group professionals acted as mentors for six months for female victims of domestic violence and helped them to get a job.
Environment and climate change
In May, Bank Zachodni WBK made a private issuance of PLN 1,000 million of subordinated bonds, PLN 150 million of which (EUR 36 million) were subscribed by the European Bank for Reconstruction and Development (EBRD). BZ WBK committed itself to assigning 140% of these EBRD funds to finance the construction of commercial and certificated residential greenfield projects, in line with the EBRD’s Green Economy Transition (its main initiative to promote sustainable use of energy and resources).
For the ninth year running, Banco Santander turned off the lights in its most emblematic buildings in its 10 core markets and in its branch network, as part of the World Wildlife Fund’s Earth Hour campaign.
The corporate centre also launched a large campaign of environmental awareness (#MovimientoYoSí), which included various initiatives under the slogan Reduce, Reuse and Recycle.
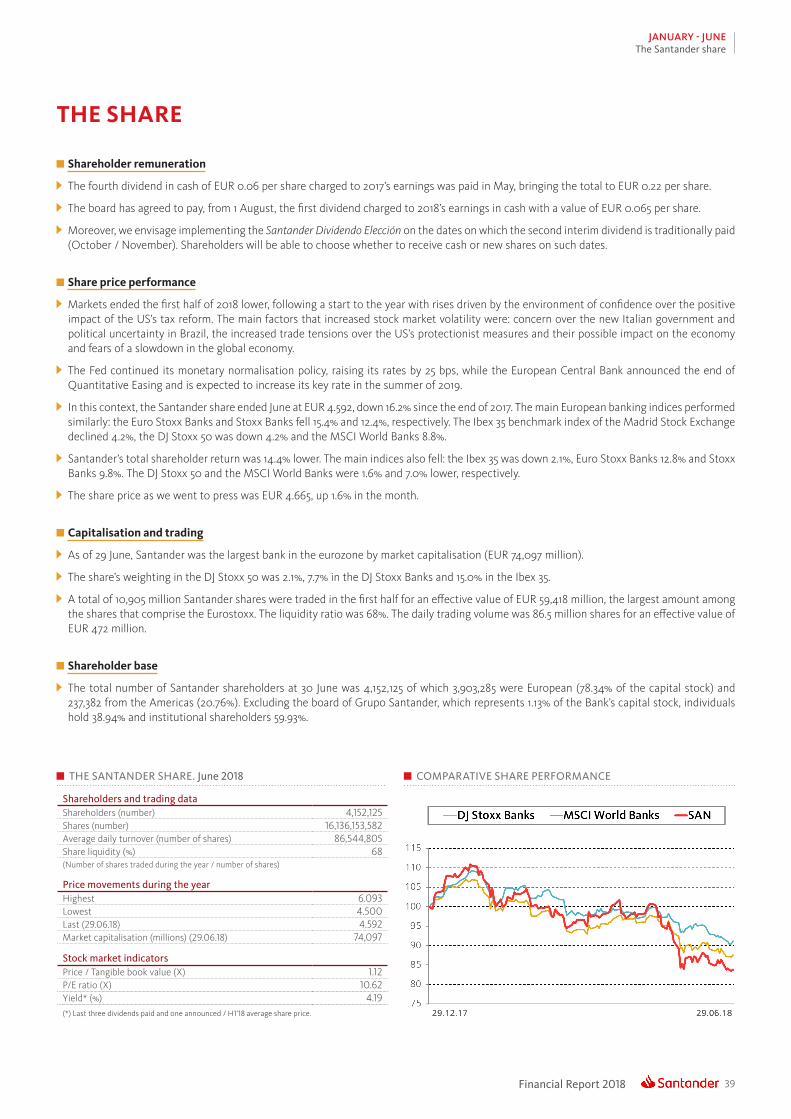
39Financial Report 2018
JANUARY - JUNEThe Santander share
THE SHARE
Shareholder remuneration
The fourth dividend in cash of EUR 0.06 per share charged to 2017’s earnings was paid in May, bringing the total to EUR 0.22 per share.
The board has agreed to pay, from 1 August, the first dividend charged to 2018’s earnings in cash with a value of EUR 0.065 per share.
Moreover, we envisage implementing the Santander Dividendo Elección on the dates on which the second interim dividend is traditionally paid (October / November). Shareholders will be able to choose whether to receive cash or new shares on such dates.
Share price performance
Markets ended the first half of 2018 lower, following a start to the year with rises driven by the environment of confidence over the positive impact of the US’s tax reform. The main factors that increased stock market volatility were: concern over the new Italian government and political uncertainty in Brazil, the increased trade tensions over the US’s protectionist measures and their possible impact on the economy and fears of a slowdown in the global economy.
The Fed continued its monetary normalisation policy, raising its rates by 25 bps, while the European Central Bank announced the end of Quantitative Easing and is expected to increase its key rate in the summer of 2019.
In this context, the Santander share ended June at EUR 4.592, down 16.2% since the end of 2017. The main European banking indices performed similarly: the Euro Stoxx Banks and Stoxx Banks fell 15.4% and 12.4%, respectively. The Ibex 35 benchmark index of the Madrid Stock Exchange declined 4.2%, the DJ Stoxx 50 was down 4.2% and the MSCI World Banks 8.8%.
Santander’s total shareholder return was 14.4% lower. The main indices also fell: the Ibex 35 was down 2.1%, Euro Stoxx Banks 12.8% and Stoxx Banks 9.8%. The DJ Stoxx 50 and the MSCI World Banks were 1.6% and 7.0% lower, respectively.
The share price as we went to press was EUR 4.665, up 1.6% in the month.
Capitalisation and trading
As of 29 June, Santander was the largest bank in the eurozone by market capitalisation (EUR 74,097 million).
The share’s weighting in the DJ Stoxx 50 was 2.1%, 7.7% in the DJ Stoxx Banks and 15.0% in the Ibex 35.
A total of 10,905 million Santander shares were traded in the first half for an effective value of EUR 59,418 million, the largest amount among the shares that comprise the Eurostoxx. The liquidity ratio was 68%. The daily trading volume was 86.5 million shares for an effective value of EUR 472 million.
Shareholder base
The total number of Santander shareholders at 30 June was 4,152,125 of which 3,903,285 were European (78.34% of the capital stock) and 237,382 from the Americas (20.76%). Excluding the board of Grupo Santander, which represents 1.13% of the Bank’s capital stock, individuals hold 38.94% and institutional shareholders 59.93%.
COMPARATIVE SHARE PERFORMANCE THE SANTANDER SHARE. June 2018
Shareholders and trading dataShareholders (number) 4,152,125Shares (number) 16,136,153,582Average daily turnover (number of shares) 86,544,805Share liquidity (%) 68(Number of shares traded during the year / number of shares)
Price movements during the yearHighest 6.093Lowest 4.500Last (29.06.18) 4.592Market capitalisation (millions) (29.06.18) 74,097
Stock market indicatorsPrice / Tangible book value (X) 1.12P/E ratio (X) 10.62Yield* (%) 4.19(*) Last three dividends paid and one announced / H1’18 average share price.

Financial Report 201840
JANUARY - JUNEAppendix
APPENDIX
Financialinformation
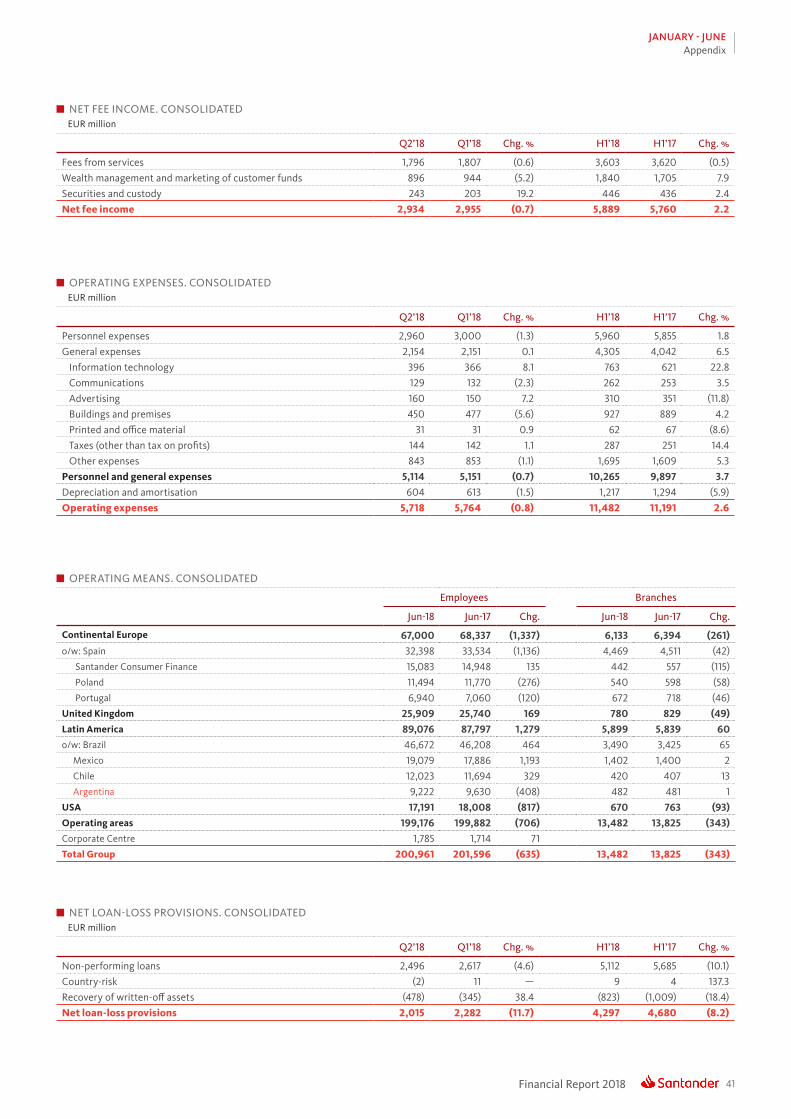
41Financial Report 2018
JANUARY - JUNEAppendix
NET FEE INCOME. CONSOLIDATED EUR million
Q2’18 Q1’18 Chg. % H1’18 H1’17 Chg. %
Fees from services 1,796 1,807 (0.6) 3,603 3,620 (0.5)Wealth management and marketing of customer funds 896 944 (5.2) 1,840 1,705 7.9Securities and custody 243 203 19.2 446 436 2.4Net fee income 2,934 2,955 (0.7) 5,889 5,760 2.2
NET LOAN-LOSS PROVISIONS. CONSOLIDATED EUR million
Q2’18 Q1’18 Chg. % H1’18 H1’17 Chg. %
Non-performing loans 2,496 2,617 (4.6) 5,112 5,685 (10.1)Country-risk (2) 11 — 9 4 137.3Recovery of written-off assets (478) (345) 38.4 (823) (1,009) (18.4)Net loan-loss provisions 2,015 2,282 (11.7) 4,297 4,680 (8.2)
OPERATING EXPENSES. CONSOLIDATED EUR million
Q2’18 Q1’18 Chg. % H1’18 H1’17 Chg. %
Personnel expenses 2,960 3,000 (1.3) 5,960 5,855 1.8General expenses 2,154 2,151 0.1 4,305 4,042 6.5 Information technology 396 366 8.1 763 621 22.8 Communications 129 132 (2.3) 262 253 3.5 Advertising 160 150 7.2 310 351 (11.8) Buildings and premises 450 477 (5.6) 927 889 4.2 Printed and office material 31 31 0.9 62 67 (8.6) Taxes (other than tax on profits) 144 142 1.1 287 251 14.4 Other expenses 843 853 (1.1) 1,695 1,609 5.3Personnel and general expenses 5,114 5,151 (0.7) 10,265 9,897 3.7Depreciation and amortisation 604 613 (1.5) 1,217 1,294 (5.9)Operating expenses 5,718 5,764 (0.8) 11,482 11,191 2.6
OPERATING MEANS. CONSOLIDATED
Employees Branches
Jun-18 Jun-17 Chg. Jun-18 Jun-17 Chg.
Continental Europe 67,000 68,337 (1,337) 6,133 6,394 (261)o/w: Spain 32,398 33,534 (1,136) 4,469 4,511 (42) Santander Consumer Finance 15,083 14,948 135 442 557 (115) Poland 11,494 11,770 (276) 540 598 (58) Portugal 6,940 7,060 (120) 672 718 (46)United Kingdom 25,909 25,740 169 780 829 (49)Latin America 89,076 87,797 1,279 5,899 5,839 60o/w: Brazil 46,672 46,208 464 3,490 3,425 65 Mexico 19,079 17,886 1,193 1,402 1,400 2 Chile 12,023 11,694 329 420 407 13 Argentina 9,222 9,630 (408) 482 481 1USA 17,191 18,008 (817) 670 763 (93)Operating areas 199,176 199,882 (706) 13,482 13,825 (343)Corporate Centre 1,785 1,714 71Total Group 200,961 201,596 (635) 13,482 13,825 (343)

Financial Report 201842
JANUARY - JUNEAppendix
LOANS AND ADVANCES TO CUSTOMERS. CONSOLIDATED EUR million
Jun-18 Jun-17Absolute
change % Dec-17
Commercial bills 30,301 27,130 3,171 11.7 29,287Secured loans 475,428 478,695 (3,267) (0.7) 473,935Other term loans 261,538 257,255 4,283 1.7 257,441Finance leases 29,804 28,038 1,766 6.3 28,511Receivable on demand 9,936 9,386 550 5.9 6,721Credit cards receivable 20,728 21,133 (405) (1.9) 21,809Impaired assets 35,150 49,361 (14,211) (28.8) 36,280Gross loans and advances to customers (excl. reverse repos) 862,885 870,998 (8,113) (0.9) 853,985Reverse repos 23,523 23,912 (389) (1.6) 18,864Gross loans and advances to customers 886,408 894,910 (8,502) (1.0) 872,848Loan-loss allowances 24,316 33,689 (9,373) (27.8) 23,934Loans and advances to customers 862,092 861,221 871 0.1 848,914
CUSTOMER FUNDS. CONSOLIDATED EUR million
Jun-18 Jun-17Absolute
change % Dec-17
Demand deposits 535,084 513,401 21,683 4.2 525,072Time deposits 196,154 200,383 (4,229) (2.1) 199,650Mutual funds 163,790 161,528 2,262 1.4 165,413Customer deposits excl. repos + Mutual funds 895,028 875,312 19,716 2.3 890,135Pension funds 15,900 16,065 (165) (1.0) 16,166Managed portfolios 27,248 27,849 (601) (2.2) 26,393Subtotal 938,176 919,226 18,950 2.1 932,694Repos 43,187 50,552 (7,365) (14.6) 53,009Group customer funds 981,363 969,778 11,585 1.2 985,703
ELIGIBLE CAPITAL (FULLY LOADED) * EUR million
Jun-18 Jun-17Absolute
change % Dec-17
Capital stock and reserves 116,371 104,855 11,516 11.0 111,362Attributable profit 3,752 3,616 136 3.8 6,619Dividends (1,635) (1,377) (258) 18.7 (2,998)Other retained earnings (25,341) (19,919) (5,422) 27.2 (23,108)Minority interests 6,567 7,190 (623) (8.7) 7,228Goodwill and intangible assets (28,726) (28,741) 15 (0.1) (28,537)Other deductions (6,741) (5,312) (1,429) 26.9 (5,004)Core CET1 64,248 60,312 3,937 6.5 65,563Preferred shares and other eligible T1 8,824 7,064 1,760 24.9 7,730Tier 1 73,072 67,376 5,696 8.5 73,293Generic funds and eligible T2 instruments 11,646 14,686 (3,040) (20.7) 14,295Eligible capital 84,718 82,062 2,657 3.2 87,588Risk-weighted assets 594,754 629,411 (34,657) (5.5) 605,064
CET1 capital ratio 10.80 9.58 1.22 10.84T1 capital ratio 12.29 10.70 1.59 12.11Total capital ratio 14.24 13.04 1.20 14.48
(*) Including the capital increase in July 2017, CET1 capital ratio: 10.72%, Tier1: 11.84% and total ratio: 14.17%
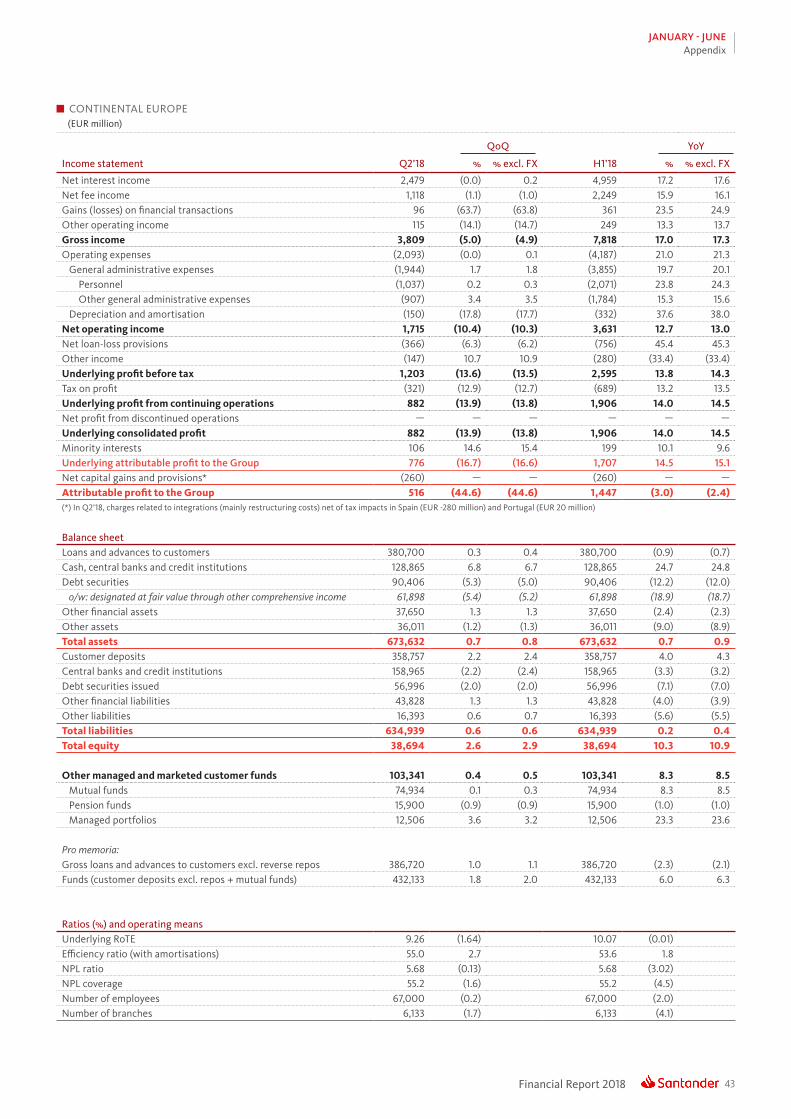
43Financial Report 2018
JANUARY - JUNEAppendix
CONTINENTAL EUROPE (EUR million)
QoQ YoY
Income statement Q2’18 % % excl. FX H1’18 % % excl. FX
Net interest income 2,479 (0.0) 0.2 4,959 17.2 17.6Net fee income 1,118 (1.1) (1.0) 2,249 15.9 16.1Gains (losses) on financial transactions 96 (63.7) (63.8) 361 23.5 24.9Other operating income 115 (14.1) (14.7) 249 13.3 13.7Gross income 3,809 (5.0) (4.9) 7,818 17.0 17.3Operating expenses (2,093) (0.0) 0.1 (4,187) 21.0 21.3 General administrative expenses (1,944) 1.7 1.8 (3,855) 19.7 20.1 Personnel (1,037) 0.2 0.3 (2,071) 23.8 24.3 Other general administrative expenses (907) 3.4 3.5 (1,784) 15.3 15.6 Depreciation and amortisation (150) (17.8) (17.7) (332) 37.6 38.0Net operating income 1,715 (10.4) (10.3) 3,631 12.7 13.0Net loan-loss provisions (366) (6.3) (6.2) (756) 45.4 45.3Other income (147) 10.7 10.9 (280) (33.4) (33.4)Underlying profit before tax 1,203 (13.6) (13.5) 2,595 13.8 14.3Tax on profit (321) (12.9) (12.7) (689) 13.2 13.5Underlying profit from continuing operations 882 (13.9) (13.8) 1,906 14.0 14.5Net profit from discontinued operations — — — — — —Underlying consolidated profit 882 (13.9) (13.8) 1,906 14.0 14.5Minority interests 106 14.6 15.4 199 10.1 9.6Underlying attributable proft to the Group 776 (16.7) (16.6) 1,707 14.5 15.1Net capital gains and provisions* (260) — — (260) — —Attributable profit to the Group 516 (44.6) (44.6) 1,447 (3.0) (2.4)(*) In Q2'18, charges related to integrations (mainly restructuring costs) net of tax impacts in Spain (EUR -280 million) and Portugal (EUR 20 million)
Balance sheetLoans and advances to customers 380,700 0.3 0.4 380,700 (0.9) (0.7)Cash, central banks and credit institutions 128,865 6.8 6.7 128,865 24.7 24.8Debt securities 90,406 (5.3) (5.0) 90,406 (12.2) (12.0) o/w: designated at fair value through other comprehensive income 61,898 (5.4) (5.2) 61,898 (18.9) (18.7)Other financial assets 37,650 1.3 1.3 37,650 (2.4) (2.3)Other assets 36,011 (1.2) (1.3) 36,011 (9.0) (8.9)Total assets 673,632 0.7 0.8 673,632 0.7 0.9Customer deposits 358,757 2.2 2.4 358,757 4.0 4.3Central banks and credit institutions 158,965 (2.2) (2.4) 158,965 (3.3) (3.2)Debt securities issued 56,996 (2.0) (2.0) 56,996 (7.1) (7.0)Other financial liabilities 43,828 1.3 1.3 43,828 (4.0) (3.9)Other liabilities 16,393 0.6 0.7 16,393 (5.6) (5.5)Total liabilities 634,939 0.6 0.6 634,939 0.2 0.4Total equity 38,694 2.6 2.9 38,694 10.3 10.9
Other managed and marketed customer funds 103,341 0.4 0.5 103,341 8.3 8.5 Mutual funds 74,934 0.1 0.3 74,934 8.3 8.5 Pension funds 15,900 (0.9) (0.9) 15,900 (1.0) (1.0) Managed portfolios 12,506 3.6 3.2 12,506 23.3 23.6
Pro memoria:Gross loans and advances to customers excl. reverse repos 386,720 1.0 1.1 386,720 (2.3) (2.1)Funds (customer deposits excl. repos + mutual funds) 432,133 1.8 2.0 432,133 6.0 6.3
Ratios (%) and operating meansUnderlying RoTE 9.26 (1.64) 10.07 (0.01)Efficiency ratio (with amortisations) 55.0 2.7 53.6 1.8NPL ratio 5.68 (0.13) 5.68 (3.02)NPL coverage 55.2 (1.6) 55.2 (4.5)Number of employees 67,000 (0.2) 67,000 (2.0)Number of branches 6,133 (1.7) 6,133 (4.1)

Financial Report 201844
JANUARY - JUNEAppendix
SPAIN (EUR million)
Income statement Q2’18 % QoQ H1’18 % s/ YoY
Net interest income 1,058 2.1 2,095 31.7Net fee income 671 (0.3) 1,344 31.1Gains (losses) on financial transactions 31 (84.9) 237 25.9Other operating income 77 (47.9) 224 6.5Gross income 1,837 (11.0) 3,900 29.4Operating expenses (1,123) (1.9) (2,268) 34.1 General administrative expenses (1,059) 1.6 (2,102) 31.8 Personnel (582) (0.9) (1,169) 39.3 Other general administrative expenses (477) 4.9 (932) 23.5 Depreciation and amortisation (63) (38.4) (166) 71.8Net operating income 714 (22.2) 1,633 23.4Net loan-loss provisions (196) (5.4) (402) 30.8Other income (86) (16.7) (190) 48.1Underlying profit before tax 432 (28.9) 1,040 17.2Tax on profit (107) (30.4) (260) 2.7Underlying profit from continuing operations 326 (28.4) 780 23.0
Net profit from discontinued operations — — — —
Underlying consolidated profit 326 (28.4) 780 23.0Minority interests 0 546.9 0 (96.0)Underlying attributable proft to the Group 325 (28.5) 780 24.9Net capital gains and provisions* (280) — (280) —Attributable profit to the Group 45 (90.0) 500 (19.9)(*) In Q2'18, restructuring costs (EUR -280 million)
Balance sheetLoans and advances to customers 217,754 (0.7) 217,754 (5.7)Cash, central banks and credit institutions 104,762 4.9 104,762 35.1Debt securities 65,645 (7.5) 65,645 (17.6) o/w: designated at fair value through other comprehensive income 46,618 (8.1) 46,618 (23.8)Other financial assets 34,316 1.5 34,316 (3.0)Other assets 20,209 (4.1) 20,209 (12.5)Total assets 442,686 (0.5) 442,686 (0.9)Customer deposits 253,650 1.9 253,650 3.7Central banks and credit institutions 97,122 (6.3) 97,122 (9.8)Debt securities issued 24,196 (3.2) 24,196 (13.3)Other financial liabilities 41,520 1.7 41,520 (4.6)Other liabilities 10,004 (2.0) 10,004 (8.1)Total liabilities 426,491 (0.5) 426,491 (1.9)Total equity 16,195 (0.8) 16,195 35.7
Other managed and marketed customer funds 91,289 0.8 91,289 6.7 Mutual funds 65,574 0.8 65,574 6.2 Pension funds 14,745 (0.9) 14,745 (1.3) Managed portfolios 10,970 3.7 10,970 24.6
Pro memoria:Gross loans and advances to customers excl. reverse repos 218,191 0.6 218,191 (7.5)Funds (customer deposits excl. repos + mutual funds) 318,387 1.6 318,387 5.4
Ratios (%) and operating meansUnderlying RoTE 8.15 (2.97) 9.65 (1.26)Efficiency ratio (with amortisations) 61.1 5.6 58.1 2.0NPL ratio 6.24 (0.03) 6.24 (4.28)NPL coverage 49.0 (2.1) 49.0 (7.6)Number of employees 32,398 (0.7) 32,398 (3.4)Number of branches 4,469 (0.3) 4,469 (0.9)

45Financial Report 2018
JANUARY - JUNEAppendix
SANTANDER CONSUMER FINANCE (EUR million)
QoQ YoY
Income statement Q2’18 % % excl. FX H1’18 % % excl. FX
Net interest income 928 1.4 1.4 1,843 4.3 5.1Net fee income 188 (12.2) (12.1) 403 (10.7) (10.5)Gains (losses) on financial transactions 16 275.1 273.8 20 — —Other operating income (5) — — 1 — —Gross income 1,126 (1.2) (1.2) 2,266 2.2 2.9Operating expenses (507) (0.3) (0.3) (1,016) 2.9 3.6 General administrative expenses (462) (1.4) (1.4) (930) 3.5 4.1 Personnel (219) (0.6) (0.6) (440) 4.1 4.8 Other general administrative expenses (242) (2.0) (2.0) (490) 2.9 3.5 Depreciation and amortisation (46) 11.7 11.8 (86) (2.6) (1.9)Net operating income 619 (1.9) (1.8) 1,250 1.7 2.4Net loan-loss provisions (69) (42.6) (42.7) (189) 60.6 61.1Other income 13 (47.5) (47.8) 36 — —Underlying profit before tax 563 5.2 5.3 1,098 5.5 6.3Tax on profit (151) 3.2 3.3 (298) 3.1 3.8Underlying profit from continuing operations 412 6.0 6.1 800 6.4 7.3Net profit from discontinued operations — — — — — —Underlying consolidated profit 412 6.0 6.1 800 6.4 7.3Minority interests 66 0.1 0.3 131 11.1 11.0Underlying attributable proft to the Group 346 7.2 7.2 669 5.5 6.6Net capital gains and provisions — — — — — —Attributable profit to the Group 346 7.2 7.2 669 5.5 6.6
Balance sheetLoans and advances to customers 91,861 2.4 2.3 91,861 6.3 6.3Cash, central banks and credit institutions 5,197 (12.9) (13.3) 5,197 13.1 12.9Debt securities 3,222 (2.4) (2.0) 3,222 (9.0) (8.6) o/w: designated at fair value through other comprehensive income 1,940 5.2 6.5 1,940 (44.5) (44.2)Other financial assets 21 12.9 12.9 21 (30.6) (30.7)Other assets 3,578 (0.8) (0.8) 3,578 2.1 2.2Total assets 103,879 1.2 1.1 103,879 5.9 5.9Customer deposits 36,774 (0.3) (0.4) 36,774 3.5 3.6Central banks and credit institutions 25,189 8.0 7.9 25,189 24.4 24.5Debt securities issued 27,336 (2.8) (3.0) 27,336 (4.9) (4.9)Other financial liabilities 995 (1.8) (1.6) 995 0.8 0.9Other liabilities 3,687 (3.1) (3.1) 3,687 6.2 6.3Total liabilities 93,980 0.9 0.8 93,980 5.6 5.7Total equity 9,899 4.7 4.6 9,899 8.3 8.4
Other managed and marketed customer funds 8 1.2 1.2 8 5.0 5.0 Mutual funds 1 (1.6) (1.6) 1 (4.2) (4.2) Pension funds 6 1.9 1.9 6 7.3 7.3 Managed portfolios — — — — — —
Pro memoria:Gross loans and advances to customers excl. reverse repos 94,299 2.3 2.3 94,299 6.1 6.1Funds (customer deposits excl. repos + mutual funds) 36,728 (0.3) (0.4) 36,728 3.5 3.6
Ratios (%) and operating meansUnderlying RoTE 17.45 0.81 17.03 (0.05)Efficiency ratio (with amortisations) 45.0 0.4 44.8 0.3NPL ratio 2.44 (0.04) 2.44 (0.17)NPL coverage 107.7 0.5 107.7 1.2Number of employees 15,083 0.7 15,083 0.9Number of branches 442 (13.2) 442 (20.6)

Financial Report 201846
JANUARY - JUNEAppendix
POLAND (EUR million)
QoQ YoY
Income statement Q2’18 % % excl. FX H1’18 % % excl. FX
Net interest income 240 (2.5) (0.6) 487 8.5 7.3Net fee income 114 1.9 3.8 227 6.7 5.5Gains (losses) on financial transactions 16 316.4 321.4 19 (23.7) (24.6)Other operating income 28 — — (2) (35.5) (36.2)Gross income 398 19.8 21.9 731 6.9 5.7Operating expenses (162) 5.4 7.4 (316) 6.6 5.4 General administrative expenses (148) 6.4 8.4 (286) 6.8 5.6 Personnel (83) 1.1 3.1 (165) 4.9 3.8 Other general administrative expenses (65) 14.1 16.2 (121) 9.4 8.1 Depreciation and amortisation (14) (3.8) (1.9) (30) 4.5 3.3Net operating income 236 32.1 34.4 415 7.2 6.0Net loan-loss provisions (41) (10.5) (8.6) (87) 43.5 41.9Other income (34) 162.6 166.1 (48) (4.5) (5.6)Underlying profit before tax 161 34.1 36.3 281 1.4 0.3Tax on profit (29) (4.9) (3.0) (60) (15.9) (16.8)Underlying profit from continuing operations 132 47.5 49.9 221 7.4 6.2Net profit from discontinued operations — — — — — —Underlying consolidated profit 132 47.5 49.9 221 7.4 6.2Minority interests 39 49.5 51.9 65 3.1 1.9Underlying attributable proft to the Group 93 46.7 49.1 156 9.4 8.1Net capital gains and provisions — — — — — —Attributable profit to the Group 93 46.7 49.1 156 9.4 8.1
Balance sheetLoans and advances to customers 22,583 1.1 5.0 22,583 5.4 9.1Cash, central banks and credit institutions 1,617 (10.1) (6.7) 1,617 1.4 4.9Debt securities 8,404 12.8 17.1 8,404 26.7 31.1 o/w: designated at fair value through other comprehensive income 7,115 17.0 21.5 7,115 30.8 35.4Other financial assets 560 11.6 15.9 560 (1.8) 1.6Other assets 1,023 (1.7) 2.1 1,023 10.6 14.5Total assets 34,188 3.2 7.2 34,188 9.7 13.6Customer deposits 25,668 2.7 6.7 25,668 7.9 11.7Central banks and credit institutions 1,708 6.1 10.2 1,708 120.9 128.6Debt securities issued 1,010 58.1 64.2 1,010 35.7 40.4Other financial liabilities 428 32.1 37.2 428 (10.6) (7.5)Other liabilities 767 8.7 12.9 767 2.2 5.8Total liabilities 29,581 4.7 8.7 29,581 11.5 15.4Total equity 4,607 (5.1) (1.5) 4,607 (0.2) 3.2
Other managed and marketed customer funds 3,868 (4.6) (0.9) 3,868 5.0 8.6 Mutual funds 3,757 (4.7) (0.9) 3,757 4.4 8.6 Pension funds — — (1.0) — — 8.1 Managed portfolios 110 (1.5) (1.0) 110 28.4 8.1
Pro memoria:Gross loans and advances to customers excl. reverse repos 23,388 1.0 4.9 23,388 5.6 9.2Funds (customer deposits excl. repos + mutual funds) 28,751 2.3 6.2 28,751 7.6 11.3
Ratios (%) and operating meansUnderlying RoTE 13.01 4.09 11.00 (0.33)Efficiency ratio (with amortisations) 40.7 (5.5) 43.2 (0.2)NPL ratio 4.58 (0.19) 4.58 (0.08)NPL coverage 72.1 0.1 72.1 4.6Number of employees 11,494 (0.2) 11,494 (2.3)Number of branches 540 (4.4) 540 (9.7)
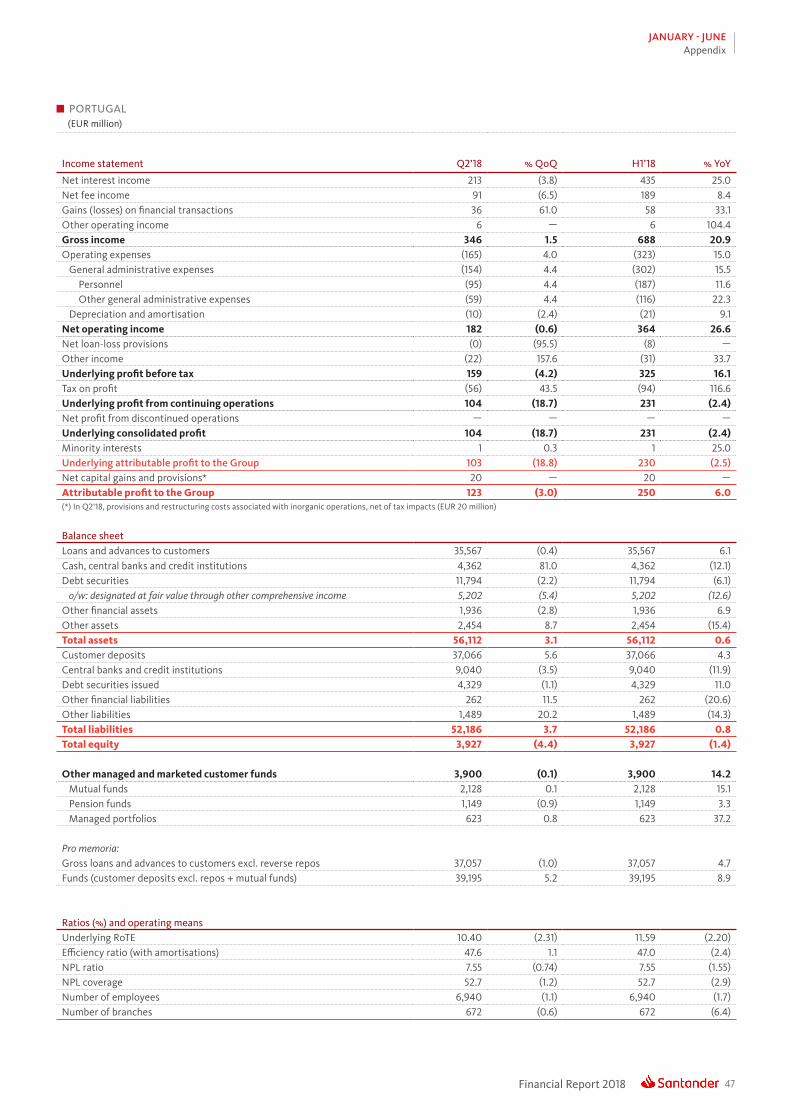
47Financial Report 2018
JANUARY - JUNEAppendix
PORTUGAL (EUR million)
Income statement Q2’18 % QoQ H1’18 % YoY
Net interest income 213 (3.8) 435 25.0Net fee income 91 (6.5) 189 8.4Gains (losses) on financial transactions 36 61.0 58 33.1Other operating income 6 — 6 104.4Gross income 346 1.5 688 20.9Operating expenses (165) 4.0 (323) 15.0 General administrative expenses (154) 4.4 (302) 15.5 Personnel (95) 4.4 (187) 11.6 Other general administrative expenses (59) 4.4 (116) 22.3 Depreciation and amortisation (10) (2.4) (21) 9.1Net operating income 182 (0.6) 364 26.6Net loan-loss provisions (0) (95.5) (8) —Other income (22) 157.6 (31) 33.7Underlying profit before tax 159 (4.2) 325 16.1Tax on profit (56) 43.5 (94) 116.6Underlying profit from continuing operations 104 (18.7) 231 (2.4)Net profit from discontinued operations — — — —Underlying consolidated profit 104 (18.7) 231 (2.4)Minority interests 1 0.3 1 25.0Underlying attributable proft to the Group 103 (18.8) 230 (2.5)Net capital gains and provisions* 20 — 20 —Attributable profit to the Group 123 (3.0) 250 6.0(*) In Q2'18, provisions and restructuring costs associated with inorganic operations, net of tax impacts (EUR 20 million)
Balance sheetLoans and advances to customers 35,567 (0.4) 35,567 6.1Cash, central banks and credit institutions 4,362 81.0 4,362 (12.1)Debt securities 11,794 (2.2) 11,794 (6.1) o/w: designated at fair value through other comprehensive income 5,202 (5.4) 5,202 (12.6)Other financial assets 1,936 (2.8) 1,936 6.9Other assets 2,454 8.7 2,454 (15.4)Total assets 56,112 3.1 56,112 0.6Customer deposits 37,066 5.6 37,066 4.3Central banks and credit institutions 9,040 (3.5) 9,040 (11.9)Debt securities issued 4,329 (1.1) 4,329 11.0Other financial liabilities 262 11.5 262 (20.6)Other liabilities 1,489 20.2 1,489 (14.3)Total liabilities 52,186 3.7 52,186 0.8Total equity 3,927 (4.4) 3,927 (1.4)
Other managed and marketed customer funds 3,900 (0.1) 3,900 14.2 Mutual funds 2,128 0.1 2,128 15.1 Pension funds 1,149 (0.9) 1,149 3.3 Managed portfolios 623 0.8 623 37.2
Pro memoria:Gross loans and advances to customers excl. reverse repos 37,057 (1.0) 37,057 4.7Funds (customer deposits excl. repos + mutual funds) 39,195 5.2 39,195 8.9
Ratios (%) and operating meansUnderlying RoTE 10.40 (2.31) 11.59 (2.20)Efficiency ratio (with amortisations) 47.6 1.1 47.0 (2.4)NPL ratio 7.55 (0.74) 7.55 (1.55)NPL coverage 52.7 (1.2) 52.7 (2.9)Number of employees 6,940 (1.1) 6,940 (1.7)Number of branches 672 (0.6) 672 (6.4)
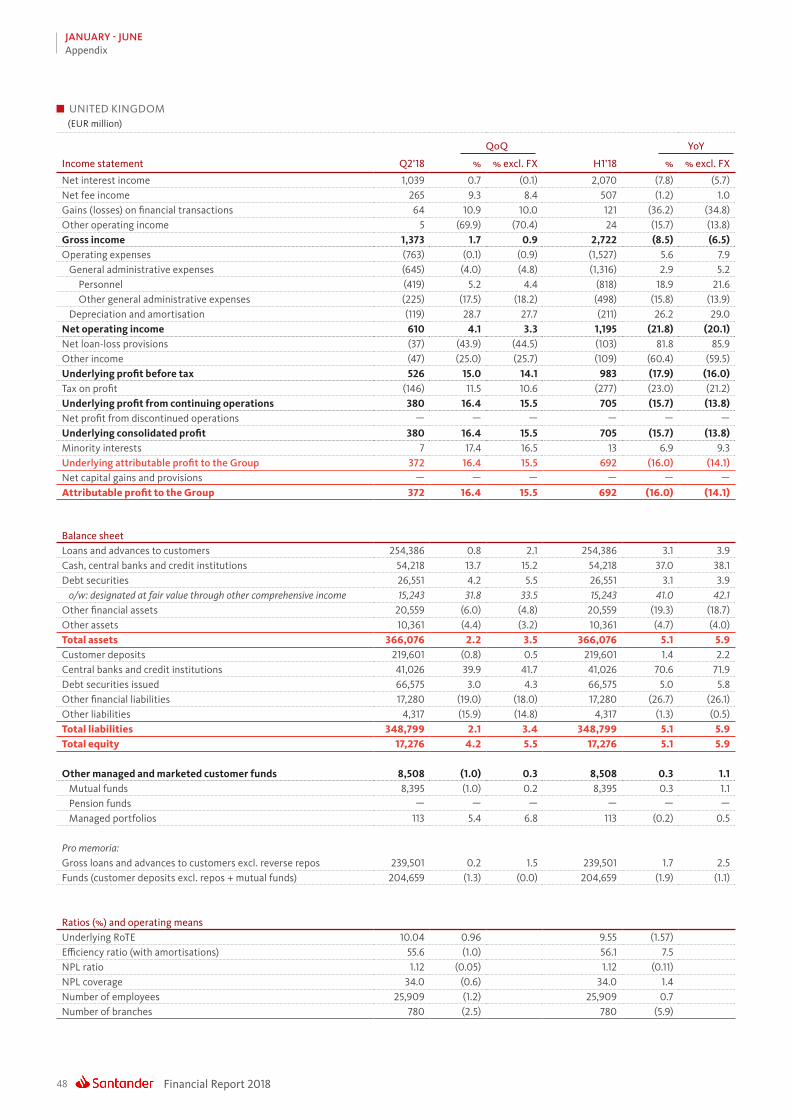
Financial Report 201848
JANUARY - JUNEAppendix
UNITED KINGDOM (EUR million)
QoQ YoY
Income statement Q2’18 % % excl. FX H1’18 % % excl. FX
Net interest income 1,039 0.7 (0.1) 2,070 (7.8) (5.7)Net fee income 265 9.3 8.4 507 (1.2) 1.0Gains (losses) on financial transactions 64 10.9 10.0 121 (36.2) (34.8)Other operating income 5 (69.9) (70.4) 24 (15.7) (13.8)Gross income 1,373 1.7 0.9 2,722 (8.5) (6.5)Operating expenses (763) (0.1) (0.9) (1,527) 5.6 7.9 General administrative expenses (645) (4.0) (4.8) (1,316) 2.9 5.2 Personnel (419) 5.2 4.4 (818) 18.9 21.6 Other general administrative expenses (225) (17.5) (18.2) (498) (15.8) (13.9) Depreciation and amortisation (119) 28.7 27.7 (211) 26.2 29.0Net operating income 610 4.1 3.3 1,195 (21.8) (20.1)Net loan-loss provisions (37) (43.9) (44.5) (103) 81.8 85.9Other income (47) (25.0) (25.7) (109) (60.4) (59.5)Underlying profit before tax 526 15.0 14.1 983 (17.9) (16.0)Tax on profit (146) 11.5 10.6 (277) (23.0) (21.2)Underlying profit from continuing operations 380 16.4 15.5 705 (15.7) (13.8)Net profit from discontinued operations — — — — — —Underlying consolidated profit 380 16.4 15.5 705 (15.7) (13.8)Minority interests 7 17.4 16.5 13 6.9 9.3Underlying attributable proft to the Group 372 16.4 15.5 692 (16.0) (14.1)Net capital gains and provisions — — — — — —Attributable profit to the Group 372 16.4 15.5 692 (16.0) (14.1)
Balance sheetLoans and advances to customers 254,386 0.8 2.1 254,386 3.1 3.9Cash, central banks and credit institutions 54,218 13.7 15.2 54,218 37.0 38.1Debt securities 26,551 4.2 5.5 26,551 3.1 3.9 o/w: designated at fair value through other comprehensive income 15,243 31.8 33.5 15,243 41.0 42.1Other financial assets 20,559 (6.0) (4.8) 20,559 (19.3) (18.7)Other assets 10,361 (4.4) (3.2) 10,361 (4.7) (4.0)Total assets 366,076 2.2 3.5 366,076 5.1 5.9Customer deposits 219,601 (0.8) 0.5 219,601 1.4 2.2Central banks and credit institutions 41,026 39.9 41.7 41,026 70.6 71.9Debt securities issued 66,575 3.0 4.3 66,575 5.0 5.8Other financial liabilities 17,280 (19.0) (18.0) 17,280 (26.7) (26.1)Other liabilities 4,317 (15.9) (14.8) 4,317 (1.3) (0.5)Total liabilities 348,799 2.1 3.4 348,799 5.1 5.9Total equity 17,276 4.2 5.5 17,276 5.1 5.9
Other managed and marketed customer funds 8,508 (1.0) 0.3 8,508 0.3 1.1 Mutual funds 8,395 (1.0) 0.2 8,395 0.3 1.1 Pension funds — — — — — — Managed portfolios 113 5.4 6.8 113 (0.2) 0.5
Pro memoria:Gross loans and advances to customers excl. reverse repos 239,501 0.2 1.5 239,501 1.7 2.5Funds (customer deposits excl. repos + mutual funds) 204,659 (1.3) (0.0) 204,659 (1.9) (1.1)
Ratios (%) and operating meansUnderlying RoTE 10.04 0.96 9.55 (1.57)Efficiency ratio (with amortisations) 55.6 (1.0) 56.1 7.5NPL ratio 1.12 (0.05) 1.12 (0.11)NPL coverage 34.0 (0.6) 34.0 1.4Number of employees 25,909 (1.2) 25,909 0.7Number of branches 780 (2.5) 780 (5.9)
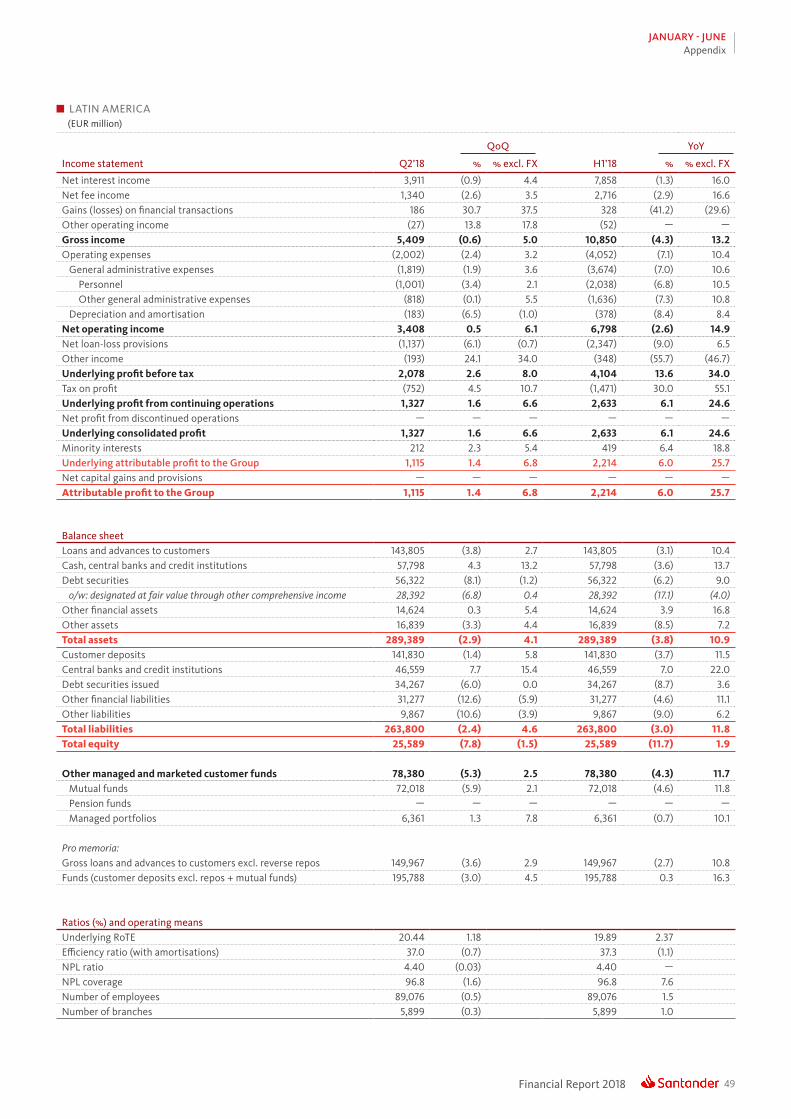
49Financial Report 2018
JANUARY - JUNEAppendix
LATIN AMERICA (EUR million)
QoQ YoY
Income statement Q2’18 % % excl. FX H1’18 % % excl. FX
Net interest income 3,911 (0.9) 4.4 7,858 (1.3) 16.0Net fee income 1,340 (2.6) 3.5 2,716 (2.9) 16.6Gains (losses) on financial transactions 186 30.7 37.5 328 (41.2) (29.6)Other operating income (27) 13.8 17.8 (52) — —Gross income 5,409 (0.6) 5.0 10,850 (4.3) 13.2Operating expenses (2,002) (2.4) 3.2 (4,052) (7.1) 10.4 General administrative expenses (1,819) (1.9) 3.6 (3,674) (7.0) 10.6 Personnel (1,001) (3.4) 2.1 (2,038) (6.8) 10.5 Other general administrative expenses (818) (0.1) 5.5 (1,636) (7.3) 10.8 Depreciation and amortisation (183) (6.5) (1.0) (378) (8.4) 8.4Net operating income 3,408 0.5 6.1 6,798 (2.6) 14.9Net loan-loss provisions (1,137) (6.1) (0.7) (2,347) (9.0) 6.5Other income (193) 24.1 34.0 (348) (55.7) (46.7)Underlying profit before tax 2,078 2.6 8.0 4,104 13.6 34.0Tax on profit (752) 4.5 10.7 (1,471) 30.0 55.1Underlying profit from continuing operations 1,327 1.6 6.6 2,633 6.1 24.6Net profit from discontinued operations — — — — — —Underlying consolidated profit 1,327 1.6 6.6 2,633 6.1 24.6Minority interests 212 2.3 5.4 419 6.4 18.8Underlying attributable proft to the Group 1,115 1.4 6.8 2,214 6.0 25.7Net capital gains and provisions — — — — — —Attributable profit to the Group 1,115 1.4 6.8 2,214 6.0 25.7
Balance sheetLoans and advances to customers 143,805 (3.8) 2.7 143,805 (3.1) 10.4Cash, central banks and credit institutions 57,798 4.3 13.2 57,798 (3.6) 13.7Debt securities 56,322 (8.1) (1.2) 56,322 (6.2) 9.0 o/w: designated at fair value through other comprehensive income 28,392 (6.8) 0.4 28,392 (17.1) (4.0)Other financial assets 14,624 0.3 5.4 14,624 3.9 16.8Other assets 16,839 (3.3) 4.4 16,839 (8.5) 7.2Total assets 289,389 (2.9) 4.1 289,389 (3.8) 10.9Customer deposits 141,830 (1.4) 5.8 141,830 (3.7) 11.5Central banks and credit institutions 46,559 7.7 15.4 46,559 7.0 22.0Debt securities issued 34,267 (6.0) 0.0 34,267 (8.7) 3.6Other financial liabilities 31,277 (12.6) (5.9) 31,277 (4.6) 11.1Other liabilities 9,867 (10.6) (3.9) 9,867 (9.0) 6.2Total liabilities 263,800 (2.4) 4.6 263,800 (3.0) 11.8Total equity 25,589 (7.8) (1.5) 25,589 (11.7) 1.9
Other managed and marketed customer funds 78,380 (5.3) 2.5 78,380 (4.3) 11.7 Mutual funds 72,018 (5.9) 2.1 72,018 (4.6) 11.8 Pension funds — — — — — — Managed portfolios 6,361 1.3 7.8 6,361 (0.7) 10.1
Pro memoria:Gross loans and advances to customers excl. reverse repos 149,967 (3.6) 2.9 149,967 (2.7) 10.8Funds (customer deposits excl. repos + mutual funds) 195,788 (3.0) 4.5 195,788 0.3 16.3
Ratios (%) and operating meansUnderlying RoTE 20.44 1.18 19.89 2.37Efficiency ratio (with amortisations) 37.0 (0.7) 37.3 (1.1)NPL ratio 4.40 (0.03) 4.40 —NPL coverage 96.8 (1.6) 96.8 7.6Number of employees 89,076 (0.5) 89,076 1.5Number of branches 5,899 (0.3) 5,899 1.0

Financial Report 201850
JANUARY - JUNEAppendix
BRAZIL (EUR million)
QoQ YoY
Income statement Q2’18 % % excl. FX H1’18 % % excl. FX
Net interest income 2,424 (2.3) 4.9 4,906 (2.4) 17.5Net fee income 872 (5.3) 1.8 1,792 (2.8) 17.0Gains (losses) on financial transactions 33 (35.1) (29.1) 83 (74.5) (69.3)Other operating income (5) (33.5) (27.4) (13) — —Gross income 3,323 (3.5) 3.7 6,768 (6.2) 12.8Operating expenses (1,095) (6.0) 1.1 (2,260) (11.3) 6.7 General administrative expenses (990) (5.6) 1.5 (2,039) (10.8) 7.3 Personnel (558) (7.5) (0.4) (1,160) (10.6) 7.6 Other general administrative expenses (433) (3.2) 4.0 (879) (11.1) 7.0 Depreciation and amortisation (105) (9.2) (2.2) (220) (15.5) 1.6Net operating income 2,228 (2.3) 5.0 4,508 (3.5) 16.1Net loan-loss provisions (750) (8.7) (1.7) (1,571) (10.8) 7.3Other income (170) 10.6 18.3 (325) (54.1) (44.8)Underlying profit before tax 1,308 0.3 7.6 2,612 18.6 42.6Tax on profit (578) 6.4 13.9 (1,122) 40.0 68.4Underlying profit from continuing operations 730 (4.1) 3.1 1,490 6.3 27.9Net profit from discontinued operations — — — — — —Underlying consolidated profit 730 (4.1) 3.1 1,490 6.3 27.9Minority interests 83 (1.0) 6.3 167 5.4 26.8Underlying attributable proft to the Group 647 (4.5) 2.7 1,324 6.4 28.0Net capital gains and provisions — — — — — —Attributable profit to the Group 647 (4.5) 2.7 1,324 6.4 28.0
Balance sheetLoans and advances to customers 65,258 (6.3) 2.7 65,258 (5.8) 12.4Cash, central banks and credit institutions 34,614 3.6 13.6 34,614 (8.4) 9.3Debt securities 38,191 (10.8) (2.2) 38,191 (4.7) 13.7 o/w: designated at fair value through other comprehensive income 19,200 (8.1) 0.7 19,200 (13.0) 3.8Other financial assets 5,481 (14.0) (5.7) 5,481 (4.7) 13.7Other assets 11,436 (2.8) 6.5 11,436 (8.9) 8.7Total assets 154,981 (5.5) 3.6 154,981 (6.4) 11.7Customer deposits 67,504 (1.7) 7.8 67,504 (5.8) 12.5Central banks and credit institutions 30,637 10.4 21.0 30,637 23.7 47.7Debt securities issued 17,818 (13.3) (5.0) 17,818 (24.3) (9.7)Other financial liabilities 18,510 (23.9) (16.6) 18,510 (13.4) 3.4Other liabilities 6,323 (14.5) (6.2) 6,323 (14.5) 2.1Total liabilities 140,792 (5.3) 3.8 140,792 (5.3) 13.0Total equity 14,189 (7.1) 1.8 14,189 (15.6) 0.7
Other managed and marketed customer funds 55,569 (5.8) 3.2 55,569 (5.2) 13.2 Mutual funds 51,777 (6.4) 2.7 51,777 (5.4) 12.9 Pension funds — — — — — — Managed portfolios 3,792 2.2 12.0 3,792 (2.6) 16.2
Pro memoria:Gross loans and advances to customers excl. reverse repos 69,475 (6.2) 2.8 69,475 (5.3) 13.0Funds (customer deposits excl. repos + mutual funds) 106,121 (3.7) 5.6 106,121 3.4 23.4
Ratios (%) and operating meansUnderlying RoTE 20.10 0.25 19.98 3.59Efficiency ratio (with amortisations) 32.9 (0.9) 33.4 (1.9)NPL ratio 5.26 — 5.26 (0.10)NPL coverage 108.7 (1.7) 108.7 13.2Number of employees 46,672 (1.5) 46,672 1.0Number of branches 3,490 0.2 3,490 1.9

51Financial Report 2018
JANUARY - JUNEAppendix
MEXICO (EUR million)
QoQ YoY
Income statement Q2’18 % % excl. FX H1’18 % % excl. FX
Net interest income 653 0.6 0.9 1,301 1.1 11.1Net fee income 188 0.7 1.0 376 0.6 10.6Gains (losses) on financial transactions 55 208.6 209.3 72 (16.7) (8.4)Other operating income (28) 21.6 22.0 (50) 465.8 521.8Gross income 868 4.5 4.8 1,699 (2.2) 7.4Operating expenses (363) 6.7 7.0 (703) 3.3 13.5 General administrative expenses (330) 7.2 7.6 (639) 3.3 13.5 Personnel (167) 6.5 6.9 (323) 3.4 13.6 Other general administrative expenses (164) 7.9 8.3 (316) 3.1 13.3 Depreciation and amortisation (32) 1.2 1.5 (64) 3.9 14.2Net operating income 505 2.9 3.2 996 (5.8) 3.5Net loan-loss provisions (189) (5.8) (5.5) (389) (18.8) (10.8)Other income (12) 274.8 275.6 (15) 41.7 55.7Underlying profit before tax 305 6.0 6.3 593 4.3 14.6Tax on profit (67) 5.9 6.3 (129) 7.7 18.4Underlying profit from continuing operations 238 6.0 6.4 463 3.4 13.6Net profit from discontinued operations — — — — — —Underlying consolidated profit 238 6.0 6.4 463 3.4 13.6Minority interests 54 7.6 7.9 104 6.5 17.0Underlying attributable proft to the Group 184 5.6 5.9 359 2.5 12.6Net capital gains and provisions — — — — — —Attributable profit to the Group 184 5.6 5.9 359 2.5 12.6
Balance sheetLoans and advances to customers 28,431 0.7 2.3 28,431 (1.7) 9.3Cash, central banks and credit institutions 13,315 15.8 17.7 13,315 7.1 19.0Debt securities 12,314 0.7 2.3 12,314 (11.3) (1.4) o/w: designated at fair value through other comprehensive income 4,141 6.8 8.5 4,141 (44.0) (37.7)Other financial assets 6,176 18.6 20.5 6,176 1.3 12.6Other assets 2,762 5.8 7.5 2,762 (5.9) 4.6Total assets 62,999 5.4 7.1 62,999 (2.0) 9.0Customer deposits 33,310 3.3 5.0 33,310 2.0 13.4Central banks and credit institutions 8,434 3.4 5.0 8,434 (27.4) (19.3)Debt securities issued 5,931 6.8 8.5 5,931 18.8 32.0Other financial liabilities 8,016 18.4 20.3 8,016 2.3 13.8Other liabilities 2,167 17.6 19.4 2,167 16.5 29.5Total liabilities 57,857 6.0 7.7 57,857 (1.9) 9.1Total equity 5,142 (1.4) 0.1 5,142 (3.4) 7.4
Other managed and marketed customer funds 10,588 (0.1) 1.5 10,588 (0.2) 11.0 Mutual funds 10,588 (0.1) 1.5 10,588 (0.2) 11.0 Pension funds — — — — — — Managed portfolios — — — — — —
Pro memoria:Gross loans and advances to customers excl. reverse repos 29,212 1.8 3.4 29,212 (1.2) 9.8Funds (customer deposits excl. repos + mutual funds) 39,039 2.5 4.1 39,039 (1.7) 9.2
Ratios (%) and operating meansUnderlying RoTE 20.33 0.75 19.99 0.39Efficiency ratio (with amortisations) 41.8 0.9 41.4 2.2NPL ratio 2.58 (0.10) 2.58 —NPL coverage 116.1 2.6 116.1 2.3Number of employees 19,079 2.7 19,079 6.7Number of branches 1,402 0.1 1,402 0.1

Financial Report 201852
JANUARY - JUNEAppendix
CHILE (EUR million)
QoQ YoY
Income statement Q2’18 % % excl. FX H1’18 % % excl. FX
Net interest income 495 1.0 1.2 985 1.1 4.9Net fee income 117 5.7 5.9 227 10.0 14.1Gains (losses) on financial transactions 28 (7.7) (7.6) 58 (43.7) (41.6)Other operating income 2 (76.9) (76.8) 12 142.3 151.3Gross income 642 0.3 0.4 1,282 (0.5) 3.2Operating expenses (272) 5.4 5.6 (530) 1.2 4.9 General administrative expenses (245) 6.0 6.2 (477) 1.0 4.7 Personnel (152) 10.3 10.5 (290) 1.0 4.7 Other general administrative expenses (93) (0.3) (0.1) (187) 1.1 4.8 Depreciation and amortisation (27) 0.2 0.4 (53) 2.6 6.4Net operating income 370 (3.2) (3.0) 752 (1.6) 2.0Net loan-loss provisions (115) (5.6) (5.5) (236) (3.4) 0.2Other income 32 48.2 48.4 54 520.6 543.6Underlying profit before tax 287 1.8 1.9 570 7.7 11.7Tax on profit (56) (6.2) (6.1) (115) 18.9 23.3Underlying profit from continuing operations 232 3.9 4.1 454 5.2 9.1Net profit from discontinued operations — — — — — —Underlying consolidated profit 232 3.9 4.1 454 5.2 9.1Minority interests 74 2.0 2.2 146 7.9 12.0Underlying attributable proft to the Group 158 4.8 5.0 308 4.0 7.9Net capital gains and provisions — — — — — —Attributable profit to the Group 158 4.8 5.0 308 4.0 7.9
Balance sheetLoans and advances to customers 38,239 1.2 3.1 38,239 8.3 8.3Cash, central banks and credit institutions 3,892 (3.1) (1.2) 3,892 (1.7) (1.7)Debt securities 4,191 (1.5) 0.5 4,191 10.7 10.8 o/w: designated at fair value through other comprehensive income 3,834 (4.7) (2.8) 3,834 34.0 34.0Other financial assets 2,933 (0.8) 1.1 2,933 33.2 33.2Other assets 1,830 (13.7) (12.0) 1,830 2.6 2.7Total assets 51,084 (0.1) 1.8 51,084 8.6 8.6Customer deposits 26,533 0.5 2.5 26,533 5.1 5.1Central banks and credit institutions 5,241 10.2 12.3 5,241 5.8 5.9Debt securities issued 9,931 1.2 3.1 9,931 14.3 14.4Other financial liabilities 3,896 4.0 6.0 3,896 46.5 46.5Other liabilities 901 (31.9) (30.6) 901 (8.1) (8.0)Total liabilities 46,502 1.0 3.0 46,502 9.3 9.4Total equity 4,582 (10.4) (8.6) 4,582 1.6 1.6
Other managed and marketed customer funds 10,205 0.9 2.9 10,205 0.9 1.0 Mutual funds 7,636 1.2 3.1 7,636 0.5 0.6 Pension funds — — — — — — Managed portfolios 2,570 0.2 2.1 2,570 2.2 2.2
Pro memoria:Gross loans and advances to customers excl. reverse repos 39,396 1.0 3.0 39,396 8.4 8.4Funds (customer deposits excl. repos + mutual funds) 34,126 0.7 2.7 34,126 4.4 4.5
Ratios (%) and operating meansUnderlying RoTE 19.10 1.91 18.25 0.30Efficiency ratio (with amortisations) 42.4 2.1 41.3 0.7NPL ratio 4.86 (0.14) 4.86 (0.14)NPL coverage 60.0 (1.0) 60.0 1.8Number of employees 12,023 0.0 12,023 2.8Number of branches 420 (2.1) 420 3.2
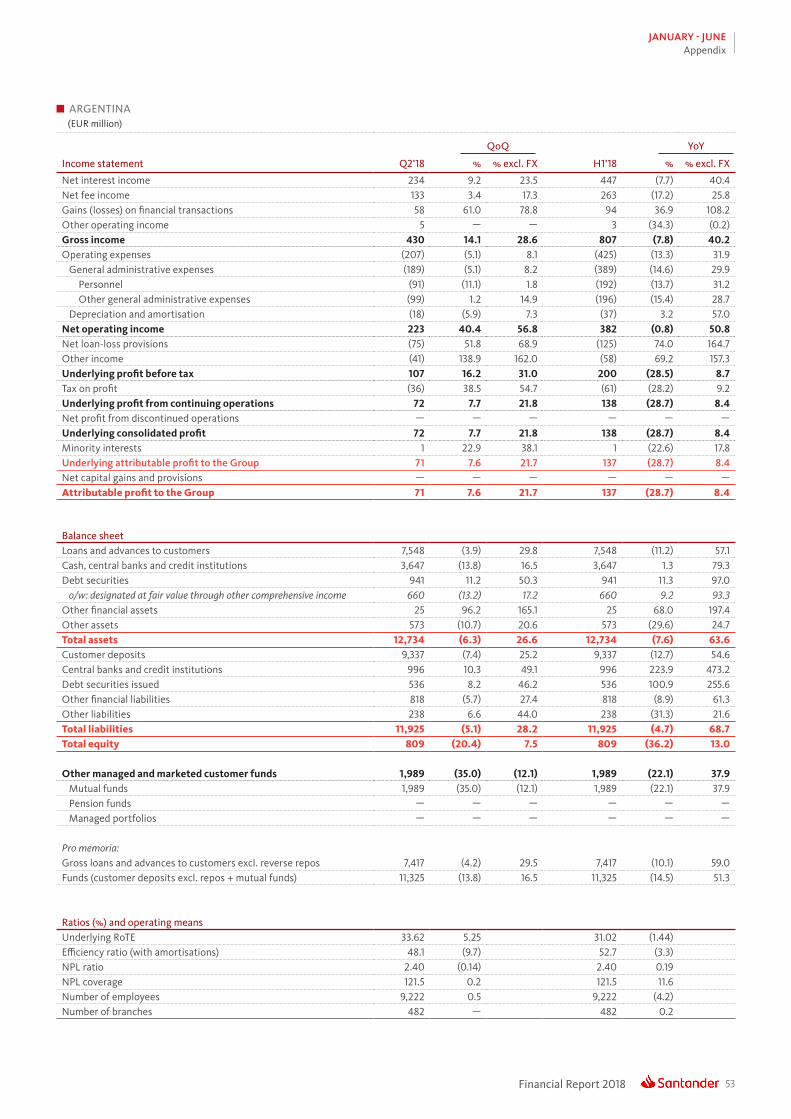
53Financial Report 2018
JANUARY - JUNEAppendix
ARGENTINA (EUR million)
QoQ YoY
Income statement Q2’18 % % excl. FX H1’18 % % excl. FX
Net interest income 234 9.2 23.5 447 (7.7) 40.4Net fee income 133 3.4 17.3 263 (17.2) 25.8Gains (losses) on financial transactions 58 61.0 78.8 94 36.9 108.2Other operating income 5 — — 3 (34.3) (0.2)Gross income 430 14.1 28.6 807 (7.8) 40.2Operating expenses (207) (5.1) 8.1 (425) (13.3) 31.9 General administrative expenses (189) (5.1) 8.2 (389) (14.6) 29.9 Personnel (91) (11.1) 1.8 (192) (13.7) 31.2 Other general administrative expenses (99) 1.2 14.9 (196) (15.4) 28.7 Depreciation and amortisation (18) (5.9) 7.3 (37) 3.2 57.0Net operating income 223 40.4 56.8 382 (0.8) 50.8Net loan-loss provisions (75) 51.8 68.9 (125) 74.0 164.7Other income (41) 138.9 162.0 (58) 69.2 157.3Underlying profit before tax 107 16.2 31.0 200 (28.5) 8.7Tax on profit (36) 38.5 54.7 (61) (28.2) 9.2Underlying profit from continuing operations 72 7.7 21.8 138 (28.7) 8.4Net profit from discontinued operations — — — — — —Underlying consolidated profit 72 7.7 21.8 138 (28.7) 8.4Minority interests 1 22.9 38.1 1 (22.6) 17.8Underlying attributable proft to the Group 71 7.6 21.7 137 (28.7) 8.4Net capital gains and provisions — — — — — —Attributable profit to the Group 71 7.6 21.7 137 (28.7) 8.4
Balance sheetLoans and advances to customers 7,548 (3.9) 29.8 7,548 (11.2) 57.1Cash, central banks and credit institutions 3,647 (13.8) 16.5 3,647 1.3 79.3Debt securities 941 11.2 50.3 941 11.3 97.0 o/w: designated at fair value through other comprehensive income 660 (13.2) 17.2 660 9.2 93.3Other financial assets 25 96.2 165.1 25 68.0 197.4Other assets 573 (10.7) 20.6 573 (29.6) 24.7Total assets 12,734 (6.3) 26.6 12,734 (7.6) 63.6Customer deposits 9,337 (7.4) 25.2 9,337 (12.7) 54.6Central banks and credit institutions 996 10.3 49.1 996 223.9 473.2Debt securities issued 536 8.2 46.2 536 100.9 255.6Other financial liabilities 818 (5.7) 27.4 818 (8.9) 61.3Other liabilities 238 6.6 44.0 238 (31.3) 21.6Total liabilities 11,925 (5.1) 28.2 11,925 (4.7) 68.7Total equity 809 (20.4) 7.5 809 (36.2) 13.0
Other managed and marketed customer funds 1,989 (35.0) (12.1) 1,989 (22.1) 37.9 Mutual funds 1,989 (35.0) (12.1) 1,989 (22.1) 37.9 Pension funds — — — — — — Managed portfolios — — — — — —
Pro memoria:Gross loans and advances to customers excl. reverse repos 7,417 (4.2) 29.5 7,417 (10.1) 59.0Funds (customer deposits excl. repos + mutual funds) 11,325 (13.8) 16.5 11,325 (14.5) 51.3
Ratios (%) and operating meansUnderlying RoTE 33.62 5.25 31.02 (1.44)Efficiency ratio (with amortisations) 48.1 (9.7) 52.7 (3.3)NPL ratio 2.40 (0.14) 2.40 0.19NPL coverage 121.5 0.2 121.5 11.6Number of employees 9,222 0.5 9,222 (4.2)Number of branches 482 — 482 0.2

Financial Report 201854
JANUARY - JUNEAppendix
UNITED STATES (EUR million)
QoQ YoY
Income statement Q2’18 % % excl. FX H1’18 % % excl. FX
Net interest income 1,281 4.9 1.7 2,501 (16.0) (6.1)Net fee income 219 2.3 (0.8) 434 (17.1) (7.3)Gains (losses) on financial transactions 23 43.1 39.2 39 94.9 117.9Other operating income 147 15.4 12.0 274 14.6 28.1Gross income 1,670 5.8 2.6 3,248 (13.6) (3.4)Operating expenses (737) 0.3 (2.9) (1,473) (12.5) (2.1) General administrative expenses (679) 0.2 (3.0) (1,357) (10.4) 0.1 Personnel (382) (3.7) (6.8) (779) (10.7) (0.2) Other general administrative expenses (297) 5.7 2.5 (578) (10.1) 0.5 Depreciation and amortisation (58) 1.3 (1.9) (115) (30.9) (22.8)Net operating income 932 10.6 7.3 1,775 (14.5) (4.5)Net loan-loss provisions (445) (23.1) (25.8) (1,024) (32.0) (24.0)Other income (50) 120.1 115.1 (73) 28.3 43.4Underlying profit before tax 437 81.2 76.8 678 32.2 47.8Tax on profit (139) 107.2 102.3 (206) 46.6 63.9Underlying profit from continuing operations 298 71.2 67.0 472 26.7 41.7Net profit from discontinued operations — — — — — —Underlying consolidated profit 298 71.2 67.0 472 26.7 41.7Minority interests 88 79.2 74.8 137 6.4 18.9Underlying attributable proft to the Group 210 68.1 63.9 335 37.5 53.7Net capital gains and provisions — — — — — —Attributable profit to the Group 210 68.1 63.9 335 37.5 53.7
Balance sheetLoans and advances to customers 76,188 10.3 4.3 76,188 (0.6) 1.5Cash, central banks and credit institutions 11,661 (0.3) (5.7) 11,661 (25.0) (23.4)Debt securities 14,349 5.1 (0.6) 14,349 (19.5) (17.7) o/w: designated at fair value through other comprehensive income 10,951 3.6 (2.0) 10,951 (30.1) (28.6)Other financial assets 4,316 34.7 27.5 4,316 56.5 59.9Other assets 13,307 11.6 5.6 13,307 5.0 7.3Total assets 119,821 9.4 3.5 119,821 (4.5) (2.4)Customer deposits 54,005 6.2 0.4 54,005 (2.7) (0.6)Central banks and credit institutions 13,356 11.6 5.6 13,356 (31.4) (29.9)Debt securities issued 28,517 11.9 5.9 28,517 4.9 7.1Other financial liabilities 3,957 44.5 36.8 3,957 23.9 26.6Other liabilities 3,630 10.1 4.2 3,630 (16.7) (14.9)Total liabilities 103,466 9.7 3.8 103,466 (5.7) (3.7)Total equity 16,355 7.4 1.7 16,355 3.7 5.9
Other managed and marketed customer funds 16,703 5.7 (0.0) 16,703 (3.0) (0.9) Mutual funds 8,436 5.7 0.0 8,436 (0.3) 1.9 Pension funds — — — — — — Managed portfolios 8,267 5.6 (0.0) 8,267 (5.7) (3.6)
Pro memoria:Gross loans and advances to customers excl. reverse repos 79,562 10.1 4.1 79,562 (1.0) 1.1Funds (customer deposits excl. repos + mutual funds) 62,210 6.0 0.3 62,210 (2.4) (0.3)
Ratios (%) and operating meansUnderlying RoTE 6.30 2.37 5.13 1.50Efficiency ratio (with amortisations) 44.2 (2.4) 45.3 0.6NPL ratio 2.91 0.05 2.91 0.27NPL coverage 156.9 (12.2) 156.9 (26.2)Number of employees 17,191 (0.3) 17,191 (4.5)Number of branches 670 (1.3) 670 (12.2)
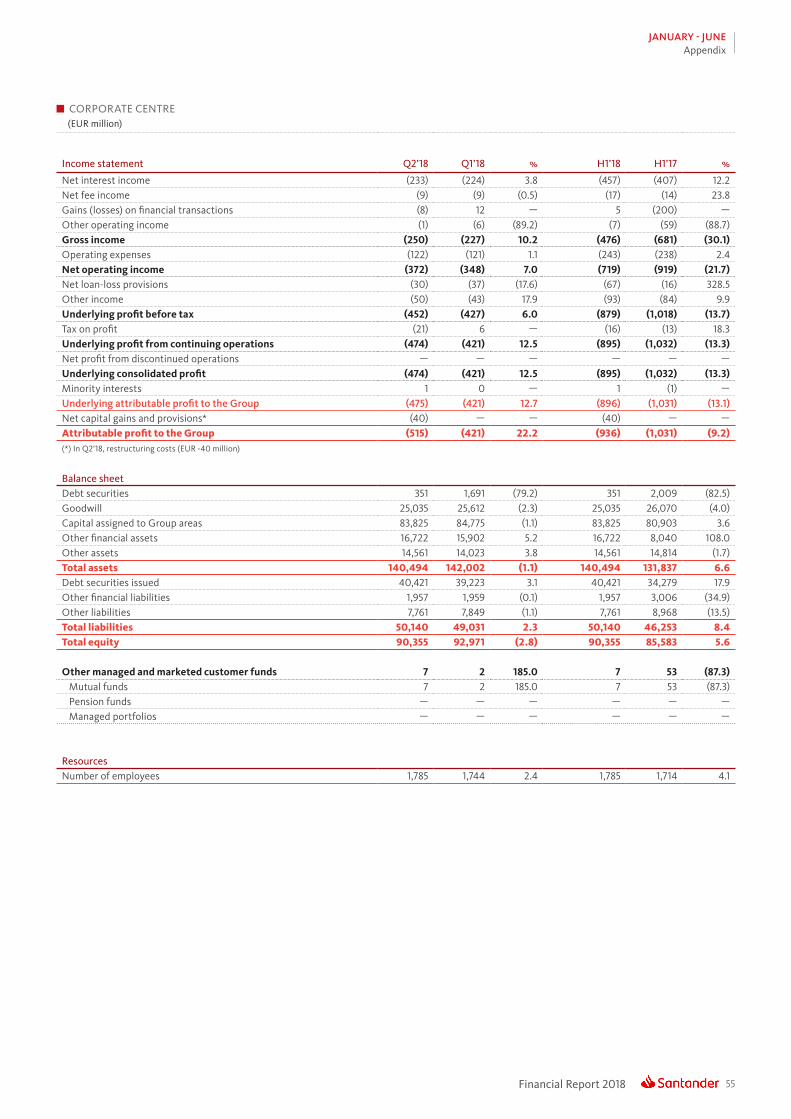
55Financial Report 2018
JANUARY - JUNEAppendix
CORPORATE CENTRE (EUR million)
Income statement Q2’18 Q1’18 % H1’18 H1’17 %
Net interest income (233) (224) 3.8 (457) (407) 12.2Net fee income (9) (9) (0.5) (17) (14) 23.8Gains (losses) on financial transactions (8) 12 — 5 (200) —Other operating income (1) (6) (89.2) (7) (59) (88.7)Gross income (250) (227) 10.2 (476) (681) (30.1)Operating expenses (122) (121) 1.1 (243) (238) 2.4Net operating income (372) (348) 7.0 (719) (919) (21.7)Net loan-loss provisions (30) (37) (17.6) (67) (16) 328.5Other income (50) (43) 17.9 (93) (84) 9.9Underlying profit before tax (452) (427) 6.0 (879) (1,018) (13.7)Tax on profit (21) 6 — (16) (13) 18.3Underlying profit from continuing operations (474) (421) 12.5 (895) (1,032) (13.3)Net profit from discontinued operations — — — — — —Underlying consolidated profit (474) (421) 12.5 (895) (1,032) (13.3)Minority interests 1 0 — 1 (1) —Underlying attributable proft to the Group (475) (421) 12.7 (896) (1,031) (13.1)Net capital gains and provisions* (40) — — (40) — —Attributable profit to the Group (515) (421) 22.2 (936) (1,031) (9.2)(*) In Q2'18, restructuring costs (EUR -40 million)
Balance sheetDebt securities 351 1,691 (79.2) 351 2,009 (82.5)Goodwill 25,035 25,612 (2.3) 25,035 26,070 (4.0)Capital assigned to Group areas 83,825 84,775 (1.1) 83,825 80,903 3.6Other financial assets 16,722 15,902 5.2 16,722 8,040 108.0Other assets 14,561 14,023 3.8 14,561 14,814 (1.7)Total assets 140,494 142,002 (1.1) 140,494 131,837 6.6Debt securities issued 40,421 39,223 3.1 40,421 34,279 17.9Other financial liabilities 1,957 1,959 (0.1) 1,957 3,006 (34.9)Other liabilities 7,761 7,849 (1.1) 7,761 8,968 (13.5)Total liabilities 50,140 49,031 2.3 50,140 46,253 8.4Total equity 90,355 92,971 (2.8) 90,355 85,583 5.6
Other managed and marketed customer funds 7 2 185.0 7 53 (87.3) Mutual funds 7 2 185.0 7 53 (87.3) Pension funds — — — — — — Managed portfolios — — — — — —
ResourcesNumber of employees 1,785 1,744 2.4 1,785 1,714 4.1
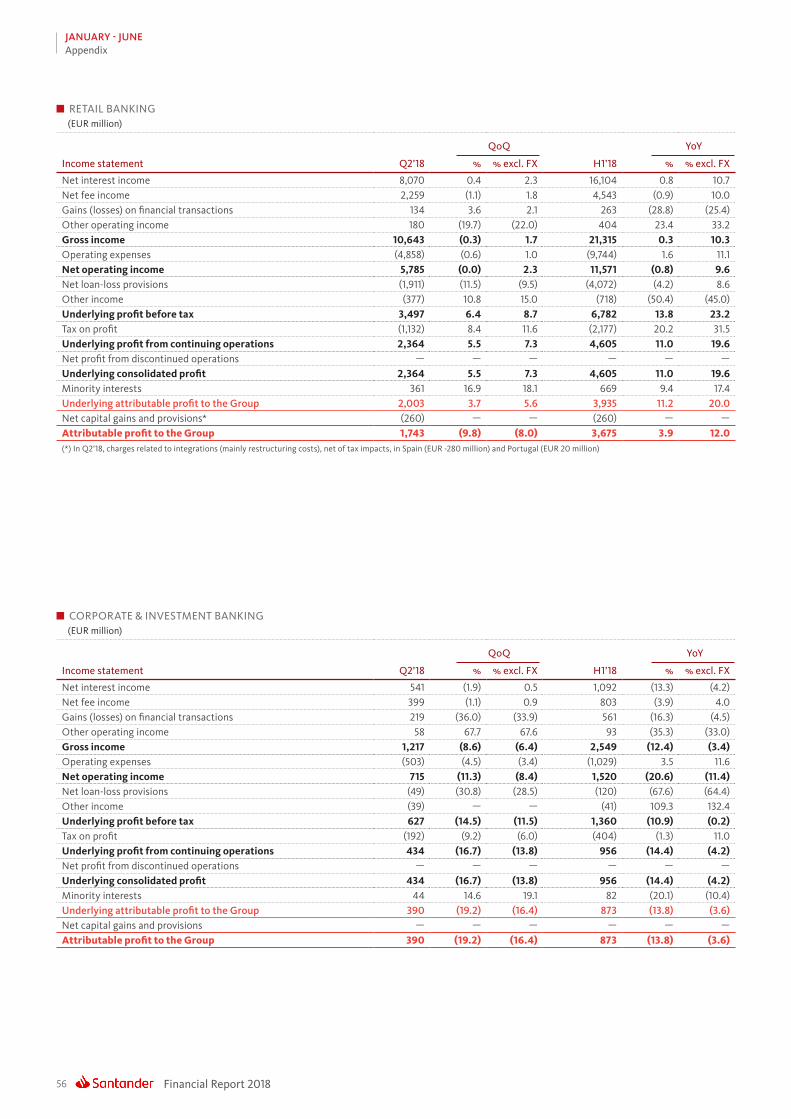
Financial Report 201856
JANUARY - JUNEAppendix
RETAIL BANKING (EUR million)
QoQ YoY
Income statement Q2’18 % % excl. FX H1’18 % % excl. FX
Net interest income 8,070 0.4 2.3 16,104 0.8 10.7Net fee income 2,259 (1.1) 1.8 4,543 (0.9) 10.0Gains (losses) on financial transactions 134 3.6 2.1 263 (28.8) (25.4)Other operating income 180 (19.7) (22.0) 404 23.4 33.2Gross income 10,643 (0.3) 1.7 21,315 0.3 10.3Operating expenses (4,858) (0.6) 1.0 (9,744) 1.6 11.1Net operating income 5,785 (0.0) 2.3 11,571 (0.8) 9.6Net loan-loss provisions (1,911) (11.5) (9.5) (4,072) (4.2) 8.6Other income (377) 10.8 15.0 (718) (50.4) (45.0)Underlying profit before tax 3,497 6.4 8.7 6,782 13.8 23.2Tax on profit (1,132) 8.4 11.6 (2,177) 20.2 31.5Underlying profit from continuing operations 2,364 5.5 7.3 4,605 11.0 19.6Net profit from discontinued operations — — — — — —Underlying consolidated profit 2,364 5.5 7.3 4,605 11.0 19.6Minority interests 361 16.9 18.1 669 9.4 17.4Underlying attributable proft to the Group 2,003 3.7 5.6 3,935 11.2 20.0Net capital gains and provisions* (260) — — (260) — —Attributable profit to the Group 1,743 (9.8) (8.0) 3,675 3.9 12.0(*) In Q2'18, charges related to integrations (mainly restructuring costs), net of tax impacts, in Spain (EUR -280 million) and Portugal (EUR 20 million)
CORPORATE & INVESTMENT BANKING (EUR million)
QoQ YoY
Income statement Q2’18 % % excl. FX H1’18 % % excl. FX
Net interest income 541 (1.9) 0.5 1,092 (13.3) (4.2)Net fee income 399 (1.1) 0.9 803 (3.9) 4.0Gains (losses) on financial transactions 219 (36.0) (33.9) 561 (16.3) (4.5)Other operating income 58 67.7 67.6 93 (35.3) (33.0)Gross income 1,217 (8.6) (6.4) 2,549 (12.4) (3.4)Operating expenses (503) (4.5) (3.4) (1,029) 3.5 11.6Net operating income 715 (11.3) (8.4) 1,520 (20.6) (11.4)Net loan-loss provisions (49) (30.8) (28.5) (120) (67.6) (64.4)Other income (39) — — (41) 109.3 132.4Underlying profit before tax 627 (14.5) (11.5) 1,360 (10.9) (0.2)Tax on profit (192) (9.2) (6.0) (404) (1.3) 11.0Underlying profit from continuing operations 434 (16.7) (13.8) 956 (14.4) (4.2)Net profit from discontinued operations — — — — — —Underlying consolidated profit 434 (16.7) (13.8) 956 (14.4) (4.2)Minority interests 44 14.6 19.1 82 (20.1) (10.4)Underlying attributable proft to the Group 390 (19.2) (16.4) 873 (13.8) (3.6)Net capital gains and provisions — — — — — —Attributable profit to the Group 390 (19.2) (16.4) 873 (13.8) (3.6)
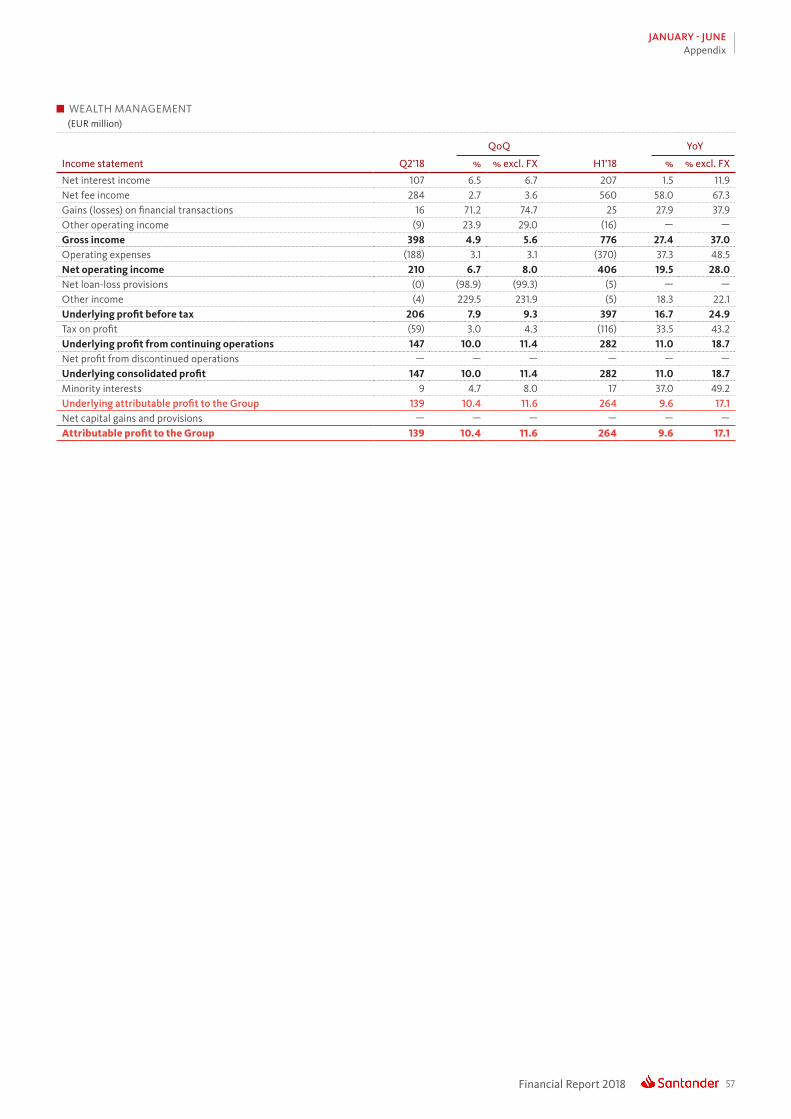
57Financial Report 2018
JANUARY - JUNEAppendix
WEALTH MANAGEMENT (EUR million)
QoQ YoY
Income statement Q2’18 % % excl. FX H1’18 % % excl. FX
Net interest income 107 6.5 6.7 207 1.5 11.9Net fee income 284 2.7 3.6 560 58.0 67.3Gains (losses) on financial transactions 16 71.2 74.7 25 27.9 37.9Other operating income (9) 23.9 29.0 (16) — —Gross income 398 4.9 5.6 776 27.4 37.0Operating expenses (188) 3.1 3.1 (370) 37.3 48.5Net operating income 210 6.7 8.0 406 19.5 28.0Net loan-loss provisions (0) (98.9) (99.3) (5) — —Other income (4) 229.5 231.9 (5) 18.3 22.1Underlying profit before tax 206 7.9 9.3 397 16.7 24.9Tax on profit (59) 3.0 4.3 (116) 33.5 43.2Underlying profit from continuing operations 147 10.0 11.4 282 11.0 18.7Net profit from discontinued operations — — — — — —Underlying consolidated profit 147 10.0 11.4 282 11.0 18.7Minority interests 9 4.7 8.0 17 37.0 49.2Underlying attributable proft to the Group 139 10.4 11.6 264 9.6 17.1Net capital gains and provisions — — — — — —Attributable profit to the Group 139 10.4 11.6 264 9.6 17.1
Financial Report 201858
JANUARY - JUNEAlternative performance measures
Below we set out information on alternative performance measures in order to comply with the Guidelines on Alternative Performance Measures published by the European Securities and Markets Authority, ESMA, on 5 October 2015 (Guidelines on Alternative Performance Measures, ESMA/2015/1415en).
• The Group uses the following indicators for managing its business. They enable profitability and efficiency, credit portfolio quality, the volume of tangible equity per share and the net loan-to-deposit ratio to be measured, analysing their evolution over time and comparing them with those of our competitors.
– The purpose of the profitability and efficiency ratios is to measure the ratio of profit to capital, to tangible capital, to assets and to risk weighted assets, while the efficiency ratio measures how much general administrative expenses (personnel and other) and amortisation costs are needed to generate revenue.
– The credit risk indicators measure the quality of the credit portfolio and the percentage of non-performing loans covered by provisions.
– The capitalisation indicator provides information on the volume of tangible equity per share.
– Other indicators are also included. The loan-to-deposit ratio (LTD) identifies the relationship between net customer loans and advances and customer deposits, assessing the proportion of loans and advances granted by the Group that are funded by customer deposits. The Group also uses gross customer loan magnitudes excluding reverse repurchase agreements (repos) and customer deposits excluding repos. In order to analyse the evolution of the traditional commercial banking business of granting loans and capturing deposits, repos and reverse repos are excluded, as they are mainly treasury business products and highly volatile.
• Impact of exchange rate movements on profit and loss accounts
The Group presents, at both the Group level as well as the business unit level, the real changes in the income statement as well as the changes excluding the exchange rate effect, as it considers the latter facilitates analysis, since it enables businesses movements to be identified without taking into account the impact of converting each local currency into euros.
Said variations, excluding the impact of exchange rate movements, are calculated by converting P&L lines for the different business units comprising the Group into our presentation currency, the euro, applying the average exchange rate for the first half of 2018 to all periods contemplated in the analysis. The average exchange rates for the main currencies in which the Group operates are set out on page 9.
• Impact of exchange rate movements on the balance sheet
The Group presents, at both the Group level as well as the business unit level, the real changes in the balance sheet as well as the changes excluding the exchange rate effect for loans and advances to customers excluding reverse repos and customer funds (which comprise deposits and mutual funds) excluding repos. As with the income statement, the reason is to facilitate analysis by isolating the changes in the balance sheet that are not caused by converting each local currency into euros.
These changes excluding the impact of exchange rate movements are calculated by converting loans and advances to customers excluding reverse repos and customer funds excluding repos, into our presentation currency, the euro, applying the closing exchange rate on the last working day of June 2018 to all periods contemplated in the analysis. The end-of-period exchange rates for the main currencies in which the Group operates are set out on page 9.
• Impact of non-recurring items on the consolidated profit and loss accounts
With regard to the results, a summary of the consolidated profit and loss accounts for the first halves of 2018 and 2017 can be found on page 63. In these accounts, results are included in their corresponding accounting item, even when, in the Group’s opinion, they distort the comparison between periods.
Therefore, summarised profit and loss accounts for the first half of 2018 and of 2017 and for the previous two quarters of 2018 on page 10. In these accounts, results, including those of said items, net of tax and minority interests, are included in a separate line which the Group names net capital gains and provisions just above the Group’s attributable profit. The Group believes that this statement explains more clearly the changes in the income statement. Those capital gains and provisions considered as non-recurring are subtracted from each of the income statement lines where they were naturally recorded.
ALTERNATIVE PERFORMANCE MEASURES (APM)

59Financial Report 2018
JANUARY - JUNEAlternative performance measures
The definitions of each of the previously-mentioned indicators and how they are calculated are given below:
Profitability and Efficiency
Ratio Formula Relevance of the metric
RoE Group’s attributable profit This ratio measures the return that shareholders obtain on the funds invested in the entity and as such measures the company’s ability to pay shareholders.
(Return on equity) Average stockholders’ equity* (excl. minority interests)
RoTE Group’s attributable profit This is a very common indicator, used to evaluate the profitability of the company as a percentage of a its tangible equity. It’s measured as the return that shareholders receive as a percentage of the funds invested in the entity less intangible assets.
(Return on tangible equity)
Average stockholders’ equity* (excl. minority interests) - intangible assets
Underlying RoTE Group’s underlying attributable profit This indicator measures the profitability of the tangible equity of a company arising from ordinary activities, i.e. excluding net capital gains and provisions.
Average stockholders’ equity* (excl. minority interests) - intangible assets
RoA Consolidated profit This metric, commonly used by analysts, measures the profitability of a company as a percentage of its total assets. It is an indicator that reflects the efficiency of the company’s total funds in generating profit over a given period.
(Return on assets) Average total assets
RoRWA Consolidated profit The return adjusted for risk is an derivative of the RoA metric. The difference is that RoRWA measures profit in relation to the bank’s risk weighted assets.
(Return on risk weighted assets)
Average risk weighted assets
Underlying RoRWA Underlying consolidated profit This relates the underlying profit (excluding net capital gains and provisions) to the bank’s risk weighted assets. Average risk weighted assets
Efficiency Operating expenses** One of the most commonly used indicators when comparing productivity of different financial entities. It measures the amount of funds used to generate the bank’s operating income. Gross income
Additionally, for informational purposes, the following table reconciles attributable profit by isolating the non-recurring impacts in the given periods. Further information on “net capital gains and provisions” is included on pages 10 and 11.
ADJUSTED ATTRIBUTABLE PROFIT TO THE GROUPEUR Million
Q2’18 Q1’18 Var. (%) H1’18 H1’17 Var. (%)
Unadjusted attributable profit to the Santander Group 1,698 2,054 -17% 3,752 3,616 +4%
(-) Net capital gains and provisions (300) — — (300) — —
Adjusted attributable profit to the Santander Group 1,998 2,054 -3% 4,052 3,616 +12%
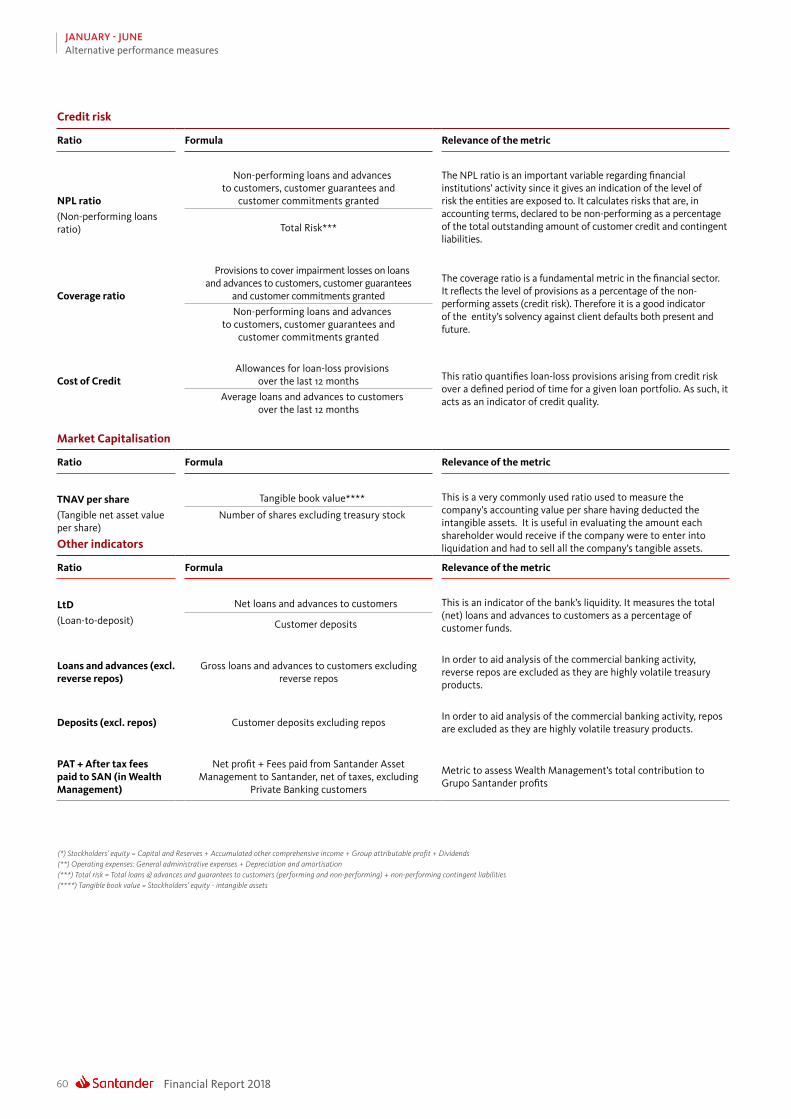
Financial Report 201860
JANUARY - JUNEAlternative performance measures
Credit risk
Ratio Formula Relevance of the metric
NPL ratio
Non-performing loans and advances to customers, customer guarantees and
customer commitments granted
The NPL ratio is an important variable regarding financial institutions’ activity since it gives an indication of the level of risk the entities are exposed to. It calculates risks that are, in accounting terms, declared to be non-performing as a percentage of the total outstanding amount of customer credit and contingent liabilities.
(Non-performing loans ratio) Total Risk***
Coverage ratio
Provisions to cover impairment losses on loans and advances to customers, customer guarantees
and customer commitments granted
The coverage ratio is a fundamental metric in the financial sector. It reflects the level of provisions as a percentage of the non-performing assets (credit risk). Therefore it is a good indicator of the entity’s solvency against client defaults both present and future.
Non-performing loans and advances to customers, customer guarantees and
customer commitments granted
Cost of Credit Allowances for loan-loss provisions
over the last 12 months This ratio quantifies loan-loss provisions arising from credit risk over a defined period of time for a given loan portfolio. As such, it acts as an indicator of credit quality. Average loans and advances to customers
over the last 12 months
Market Capitalisation
Ratio Formula Relevance of the metric
TNAV per share Tangible book value**** This is a very commonly used ratio used to measure the company’s accounting value per share having deducted the intangible assets. It is useful in evaluating the amount each shareholder would receive if the company were to enter into liquidation and had to sell all the company’s tangible assets.
(Tangible net asset value per share)
Number of shares excluding treasury stock
(*) Stockholders’ equity = Capital and Reserves + Accumulated other comprehensive income + Group attributable profit + Dividends(**) Operating expenses: General administrative expenses + Depreciation and amortisation(***) Total risk = Total loans & advances and guarantees to customers (performing and non-performing) + non-performing contingent liabilities(****) Tangible book value = Stockholders’ equity - intangible assets
Other indicators
Ratio Formula Relevance of the metric
LtD Net loans and advances to customers This is an indicator of the bank’s liquidity. It measures the total (net) loans and advances to customers as a percentage of customer funds.
(Loan-to-deposit) Customer deposits
Loans and advances (excl. reverse repos)
Gross loans and advances to customers excluding reverse repos
In order to aid analysis of the commercial banking activity, reverse repos are excluded as they are highly volatile treasury products.
Deposits (excl. repos) Customer deposits excluding reposIn order to aid analysis of the commercial banking activity, repos are excluded as they are highly volatile treasury products.
PAT + After tax fees paid to SAN (in Wealth Management)
Net profit + Fees paid from Santander Asset Management to Santander, net of taxes, excluding
Private Banking customers
Metric to assess Wealth Management’s total contribution to Grupo Santander profits
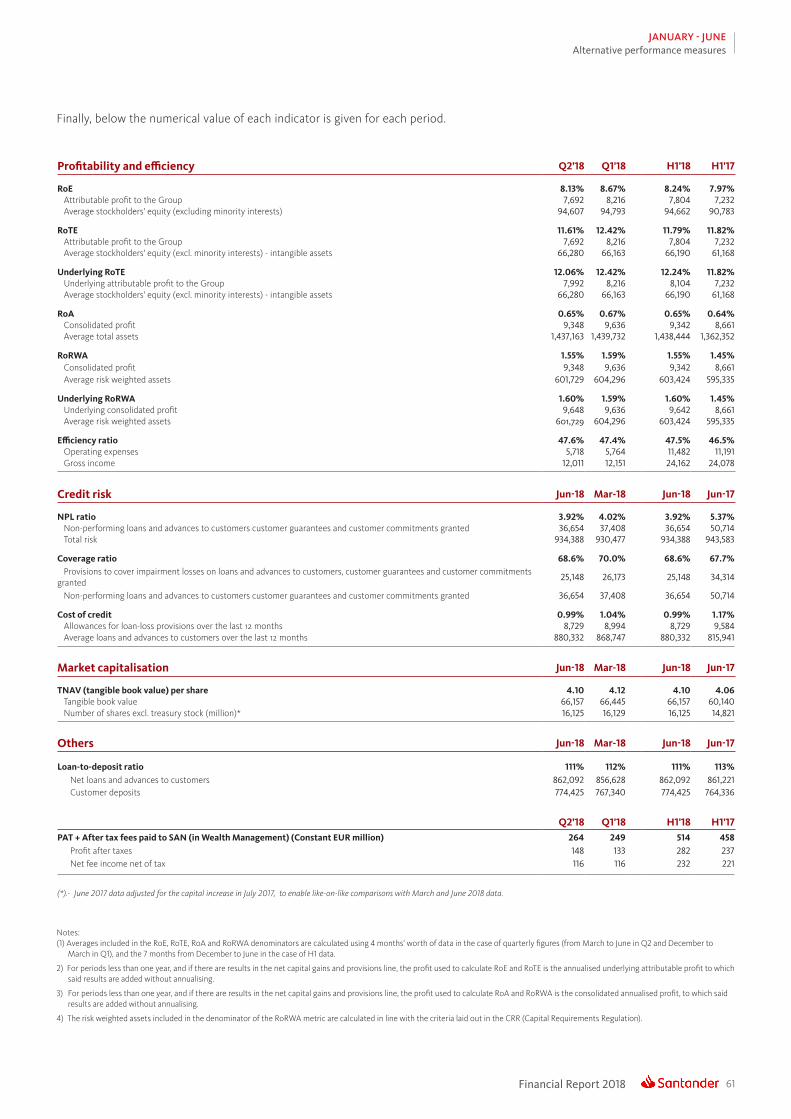
61Financial Report 2018
JANUARY - JUNEAlternative performance measures
Finally, below the numerical value of each indicator is given for each period.
Profitability and efficiency Q2’18 Q1'18 H1'18 H1'17
RoE 8.13% 8.67% 8.24% 7.97% Attributable profit to the Group 7,692 8,216 7,804 7,232 Average stockholders' equity (excluding minority interests) 94,607 94,793 94,662 90,783
RoTE 11.61% 12.42% 11.79% 11.82% Attributable profit to the Group 7,692 8,216 7,804 7,232 Average stockholders' equity (excl. minority interests) - intangible assets 66,280 66,163 66,190 61,168
Underlying RoTE 12.06% 12.42% 12.24% 11.82% Underlying attributable profit to the Group 7,992 8,216 8,104 7,232 Average stockholders' equity (excl. minority interests) - intangible assets 66,280 66,163 66,190 61,168
RoA 0.65% 0.67% 0.65% 0.64% Consolidated profit 9,348 9,636 9,342 8,661 Average total assets 1,437,163 1,439,732 1,438,444 1,362,352
RoRWA 1.55% 1.59% 1.55% 1.45% Consolidated profit 9,348 9,636 9,342 8,661 Average risk weighted assets 601,729 604,296 603,424 595,335
Underlying RoRWA 1.60% 1.59% 1.60% 1.45% Underlying consolidated profit 9,648 9,636 9,642 8,661 Average risk weighted assets 601,729 604,296 603,424 595,335
Efficiency ratio 47.6% 47.4% 47.5% 46.5% Operating expenses 5,718 5,764 11,482 11,191 Gross income 12,011 12,151 24,162 24,078
Credit risk Jun-18 Mar-18 Jun-18 Jun-17
NPL ratio 3.92% 4.02% 3.92% 5.37% Non-performing loans and advances to customers customer guarantees and customer commitments granted 36,654 37,408 36,654 50,714 Total risk 934,388 930,477 934,388 943,583
Coverage ratio 68.6% 70.0% 68.6% 67.7% Provisions to cover impairment losses on loans and advances to customers, customer guarantees and customer commitments granted
25,148 26,173 25,148 34,314
Non-performing loans and advances to customers customer guarantees and customer commitments granted 36,654 37,408 36,654 50,714
Cost of credit 0.99% 1.04% 0.99% 1.17% Allowances for loan-loss provisions over the last 12 months 8,729 8,994 8,729 9,584 Average loans and advances to customers over the last 12 months 880,332 868,747 880,332 815,941
Market capitalisation Jun-18 Mar-18 Jun-18 Jun-17
TNAV (tangible book value) per share 4.10 4.12 4.10 4.06 Tangible book value 66,157 66,445 66,157 60,140 Number of shares excl. treasury stock (million)* 16,125 16,129 16,125 14,821
Others Jun-18 Mar-18 Jun-18 Jun-17
Loan-to-deposit ratio 111% 112% 111% 113% Net loans and advances to customers 862,092 856,628 862,092 861,221 Customer deposits 774,425 767,340 774,425 764,336
Q2’18 Q1'18 H1'18 H1'17PAT + After tax fees paid to SAN (in Wealth Management) (Constant EUR million) 264 249 514 458 Profit after taxes 148 133 282 237 Net fee income net of tax 116 116 232 221
(*).- June 2017 data adjusted for the capital increase in July 2017, to enable like-on-like comparisons with March and June 2018 data.
Notes: (1) Averages included in the RoE, RoTE, RoA and RoRWA denominators are calculated using 4 months’ worth of data in the case of quarterly figures (from March to June in Q2 and December to
March in Q1), and the 7 months from December to June in the case of H1 data.
2) For periods less than one year, and if there are results in the net capital gains and provisions line, the profit used to calculate RoE and RoTE is the annualised underlying attributable profit to which said results are added without annualising.
3) For periods less than one year, and if there are results in the net capital gains and provisions line, the profit used to calculate RoA and RoRWA is the consolidated annualised profit, to which said results are added without annualising.
4) The risk weighted assets included in the denominator of the RoRWA metric are calculated in line with the criteria laid out in the CRR (Capital Requirements Regulation).

Financial Report 201862
JANUARY - JUNECondensed consolidated financial statements
CONDENSED CONSOLIDATED FINANCIAL STATEMENTS• CONSOLIDATED INCOME STATEMENT
• CONSOLIDATED BALANCE SHEET
NOTE: The financial information for the first six months of 2018 and 2017 (attached herewith) corresponds to that included in the consolidated summarised financial statements at these dates, drawn up in accordance with the International Accounting Standards (IAS) 34, Interim Financial Information. The accounting policies and methods used are those established by the International Financial Reporting Standards adopted by the European Union (IFRS-EU), Circular 4/2017 of the Bank of Spain, which replaces Circular 4/2004 for those years starting as of 1 January 2018, and the International Financial Reporting Standards issued by the International Accounting Standards Board (IFRS-IASB).
CONDENSED CONSOLIDATED INCOME STATEMENT (EUR Million)
H1’18 H1’17
Interest income 26,904 28,632Interest expense (9,973) (11,624)Net interest income 16,931 17,008Dividend income 264 279Share of results of entities accounted for using the equity method 354 293Commission income 7,475 7,261Commission expense (1,586) (1,501)Gain or losses on financial assets and liabilities not measured at fair value through profit or loss, net 326 276Gain or losses on financial assets and liabilities held for trading, net 1,197 1,055Gains or losses on non-trading financial assets and liabilities mandatorily at fair value through profit or loss 56Gain or losses on financial assets and liabilities measured at fair value through profit or loss, net 132 (47)Gain or losses from hedge accounting, net 33 (8)Exchange differences, net (890) (416)Other operating income 813 807Other operating expenses (979) (944)Income from assets under insurance and reinsurance contracts 1,756 1,378Expenses from liabilities under insurance and reinsurance contracts (1,720) (1,361)Gross income 24,162 24,080Administrative expenses (10,265) (9,897) Staff costs (5,960) (5,855) Other general administrative expenses (4,305) (4,042)Depreciation and amortisation cost (1,217) (1,294)Provisions or reversal of provisions, net (1,262) (1,377)Impairment or reversal of impairment at financial assets not measured at fair value through profit or loss, net (4,352) (4,713) Financial assets at fair value with changes in other comprehensive income (1) Financial assets at amortized cost (4,351) Financial assets measured at cost (7) Financial assets available-for-sale — Loans and receivables (4,706) Held-to-maturity investments —Impairment of investments in subsidiaries, joint ventures and associates, net — —Impairment on non-financial assets, net (96) (97) Tangible assets (33) (28) Intangible assets (64) (40) Others 1 (29)Gain or losses on non financial assets and investments, net 23 26Negative goodwill recognised in results — —Gains or losses on non-current assets held for sale not classified as discontinued operations (94) (143)Profit or loss before tax from continuing operations 6,899 6,585Tax expense or income from continuing operations (2,378) (2,254)Profit for the period from continuing operations 4,521 4,331Profit or loss after tax from discontinued operations — —Profit for the period 4,521 4,331 Profit attributable to non-controlling interests 769 715 Profit attributable to the parent 3,752 3,616
Earnings per share Basic 0.22 0.23 Diluted 0.22 0.23
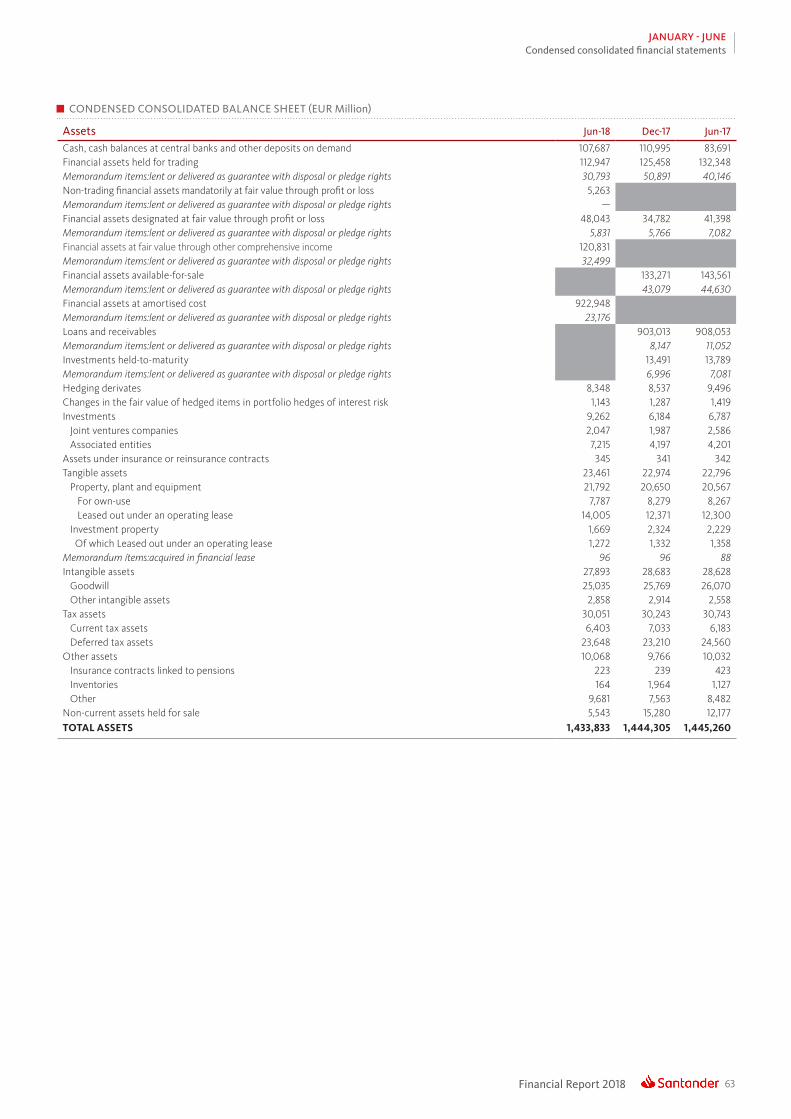
63Financial Report 2018
JANUARY - JUNECondensed consolidated financial statements
CONDENSED CONSOLIDATED BALANCE SHEET (EUR Million)
Assets Jun-18 Dec-17 Jun-17
Cash, cash balances at central banks and other deposits on demand 107,687 110,995 83,691Financial assets held for trading 112,947 125,458 132,348Memorandum items:lent or delivered as guarantee with disposal or pledge rights 30,793 50,891 40,146Non-trading financial assets mandatorily at fair value through profit or loss 5,263Memorandum items:lent or delivered as guarantee with disposal or pledge rights —Financial assets designated at fair value through profit or loss 48,043 34,782 41,398Memorandum items:lent or delivered as guarantee with disposal or pledge rights 5,831 5,766 7,082Financial assets at fair value through other comprehensive income 120,831Memorandum items:lent or delivered as guarantee with disposal or pledge rights 32,499Financial assets available-for-sale 133,271 143,561Memorandum items:lent or delivered as guarantee with disposal or pledge rights 43,079 44,630Financial assets at amortised cost 922,948Memorandum items:lent or delivered as guarantee with disposal or pledge rights 23,176Loans and receivables 903,013 908,053Memorandum items:lent or delivered as guarantee with disposal or pledge rights 8,147 11,052Investments held-to-maturity 13,491 13,789Memorandum items:lent or delivered as guarantee with disposal or pledge rights 6,996 7,081Hedging derivates 8,348 8,537 9,496Changes in the fair value of hedged items in portfolio hedges of interest risk 1,143 1,287 1,419Investments 9,262 6,184 6,787 Joint ventures companies 2,047 1,987 2,586 Associated entities 7,215 4,197 4,201Assets under insurance or reinsurance contracts 345 341 342Tangible assets 23,461 22,974 22,796 Property, plant and equipment 21,792 20,650 20,567 For own-use 7,787 8,279 8,267 Leased out under an operating lease 14,005 12,371 12,300 Investment property 1,669 2,324 2,229 Of which Leased out under an operating lease 1,272 1,332 1,358Memorandum ítems:acquired in financial lease 96 96 88Intangible assets 27,893 28,683 28,628 Goodwill 25,035 25,769 26,070 Other intangible assets 2,858 2,914 2,558Tax assets 30,051 30,243 30,743 Current tax assets 6,403 7,033 6,183 Deferred tax assets 23,648 23,210 24,560Other assets 10,068 9,766 10,032 Insurance contracts linked to pensions 223 239 423 Inventories 164 1,964 1,127 Other 9,681 7,563 8,482Non-current assets held for sale 5,543 15,280 12,177TOTAL ASSETS 1,433,833 1,444,305 1,445,260

Financial Report 201864
JANUARY - JUNECondensed consolidated financial statements
CONDENSED CONSOLIDATED BALANCE SHEET (EUR Million)
Liabilities and equity Jun-18 Dec-17 Jun-17
Financial liabilities held for trading 75,350 107,624 96,137Financial liabilities designated at fair value through profit or loss 58,153 59,616 53,788Memorandum ítems:subordinated liabilities — — —Financial liabilities at amortised cost 1,153,918 1,126,069 1,148,471Memorandum ítems:subordinated liabilities 23,939 21,510 21,058Hedging derivates 6,728 8,044 7,638Changes in the fair value of hedged items in portfolio hedges of interest rate risk 317 330 350Liabilities under insurance or reinsurance contracts 936 1,117 1,693Provisions 13,758 14,489 15,877 Pensions and other post-retirement obligations 5,465 6,345 6,830 Other long term employee benefits 1,525 1,686 1,497 Taxes and other legal contingencies 3,084 3,181 3,742 Contingent liabilities and commitments 855 617 645 Other provisions 2,829 2,660 3,163Tax liabilities 7,659 7,592 8,863 Current tax liabilities 2,481 2,755 2,764 Deferred tax liabilities 5,178 4,837 6,099Other liabilities 12,569 12,591 11,488Liabilities associated with non-current assets held for sale — — —TOTAL LIABILITIES 1,329,388 1,337,472 1,344,305
EquityShareholders’ equity 117,935 116,265 107,564Capital 8,068 8,068 7,291 Called up paid capital 8,068 8,068 7,291 Unpaid capital which has been called up — — —Share premium 51,053 51,053 44,912Equity instruments issued other than capital 542 525 — Equity component of the compound financial instrument — — — Other equity instruments issued 542 525 —Other equity 215 216 154Accumulated retained earnings 56,967 53,437 53,556Revaluation reserves — — —Other reserves (1,552) (1,602) (1,062)(-) Own shares (61) (22) (28)Profit attributable to shareholders of the parent 3,752 6,619 3,616(-) Interim dividends (1,049) (2,029) (875)Other comprehensive income (23,885) (21,776) (18,797) Items not reclassified to profit or loss (2,751) (4,034) (3,869) Items that may be reclassified to profit or loss (21,134) (17,742) (14,928)Non-controlling interest 10,395 12,344 12,188 Other comprehensive income (1,377) (1,436) (1,113) Other elements 11,772 13,780 13,301TOTAL EQUITY 104,445 106,833 100,955TOTAL LIABILITIES AND EQUITY 1,433,833 1,444,305 1,445,260
MEMORANDUM ITEMSLoans commitment granted 210,977 207,671 210,589Financial guarantees granted 13,247 14,499 13,720Other commitments granted 73,061 64,917 80,475
65Financial Report 2018
JANUARY - JUNE
i. Important information
In addition to the financial information prepared under International Financial Reporting Standards (“IFRS”), this report certain alternative per-formance measures (“APMs”) as defined in the Guidelines on Alternative Performance Measures issued by the European Securities and Markets Authority on 5 October 2015 (ESMA/2015/1415en) as well as non-IFRS measures (“Non-IFRS Measures”). The APMs and Non-IFRS Measures are performance measures that have been calculated using the financial information from the Santander Group but that are not defined or detailed in the applicable financial information framework and therefore have neither been audited nor are capable of being completely audited. These APMs and Non-IFRS Measures are been used to allow for a better understanding of the financial performance of the Santander Group but should be considered only as additional information and in no case as a replacement of the financial information prepared under IFRS. Moreo-ver, the way the Santander Group defines and calculates these APMs and Non-IFRS Measures may differ to the way these are calculated by other companies that use similar measures, and therefore they may not be comparable. For further details of the APMs and Non-IFRS Measures used, including its definition or a reconciliation between any applicable management indicators and the financial data presented in the conso-lidated financial statements prepared under IFRS, please also see Section 26 of the Documento de Registro de Acciones for Banco Santander, S.A. (“Santander”) filed with the Spanish Securities Exchange Commission (the “CNMV”) on 28 June 2018 (the “Share Registration Document”) and Item 3A of the Annual Report on Form 20-F filed with the U.S. Securities and Exchange Commission of the United States of America (the “SEC”) on 28 March 2018 (the “Form 20-F”). These documents are available on Santander’s website (www.santander.com).
The businesses included in each of our geographic segments and the accounting principles under which their results are presented here may differ from the included businesses and local applicable accounting principles of our public subsidiaries in such geographies. Accordingly, the results of operations and trends shown for our geographic segments may differ materially from those of such subsidiaries.
Santander cautions that this financial report contains statements that constitute “forward-looking statements” within the meaning of the U.S. Private Securities Litigation Reform Act of 1995. Forward-looking statements may be identified by words such as “expect”, “project”, “an-ticipate”, “should”, “intend”, “probability”, “risk”, “VaR”, “RoRAC”, “RoRWA”, “TNAV”, “target”, “goal”, “objective”, “estimate”, “future” and similar expressions. These forward-looking statements are found in various places throughout this report and include, without limitation, statements concerning our future business development and economic performance and our shareholder remuneration policy. While these forward-loo-king statements represent our judgment and future expectations concerning the development of our business, a number of risks, uncertainties and other important factors could cause actual developments and results to differ materially from our expectations. These factors include, but are not limited to: (1) general market, macro-economic, industry, governmental and regulatory trends; (2) movements in local and international securities markets, currency exchange rates and interest rates; (3) competitive pressures; (4) technological developments; and (5) changes in the financial position or credit worthiness of our customers, obligors and counterparties. Numerous factors, including those reflected in the Form 20-F– under “Key Information-Risk Factors”- and in the Share Registration Document–under “Risk Factors”- could affect the future results of Santander and could result in other results deviating materially from those anticipated in the forward-looking statements. Other unknown or unpredictable factors could cause actual results to differ materially from those in the forward-looking statements.
Forward-looking statements speak only as of the date of this report and are based on the knowledge, information available and views taken on such date; such knowledge, information and views may change at any time. Santander does not undertake any obligation to update or revise any forward-looking statement, whether as a result of new information, future events or otherwise.
The information contained in this report is subject to, and must be read in conjunction with, all other publicly available information, including, where relevant any fuller disclosure document published by Santander. Any person at any time acquiring securities must do so only on the basis of such person’s own judgment as to the merits or the suitability of the securities for its purpose and only on such information as is contained in such public information having taken all such professional or other advice as it considers necessary or appropriate in the circumstances and not in reliance on the information contained in this report. No investment activity should be undertaken on the basis of the information contained in this report. In making this report available Santander gives no advice and makes no recommendation to buy, sell or otherwise deal in shares in Santander or in any other securities or investments whatsoever.
Neither this report nor any of the information contained therein constitutes an offer to sell or the solicitation of an offer to buy any securities. No offering of securities shall be made in the United States except pursuant to registration under the U.S. Securities Act of 1933, as amended, or an exemption therefrom. Nothing contained in this report is intended to constitute an invitation or inducement to engage in investment activity for the purposes of the prohibition on financial promotion in the U.K. Financial Services and Markets Act 2000.
Note: Statements as to historical performance or financial accretion are not intended to mean that future performance, share price or future earnings (including earnings per share) for any period will necessarily match or exceed those of any prior year. Nothing in this report should be construed as a profit forecast.
NOTE

Financial Report 201866
JANUARY - JUNE
www.santander.com
Investor Relations
Ciudad Grupo SantanderEdificio Pereda, 2nd floorAvda de Cantabria s/n28660 Boadilla del MonteMadrid (Spain)Tel: +34 (91) 259 65 14 / +34 (91) 259 65 20Fax: +34 (91) 257 02 45e-mail: [email protected]
Legal Head Office:Paseo Pereda 9-12, Santander (Spain)Tel: +34 (942) 20 61 00
Operational Head Office:Ciudad Grupo SantanderAvda. de Cantabria s/n28660 Boadilla del Monte, Madrid (Spain)