
JANUARY 7, 2017
33
MOVING FOR MEMORY EVALUATION REPORT JANUARY 7, 2017
Transcript of JANUARY 7, 2017

MOVING FOR MEMORY EVALUATION REPORT
JANUARY 7, 2017

1
AUTHORS
Sheldon Kallio, MSc
Jessica Schaub, MPH
Acknowledgments
We would like to thank the Moving for Memory team for their
hard work and dedication in providing this quality program. We
would also like to thank the participants of the MFM program.
Their feedback allows us to develop and improve upon this project
and continue to provide quality service.
This project is funded by the Alberta Health Services Community
Innovation Grant Initiative for People Affected by Dementia.

2
Table of Contents Moving for Memory Overview ...................................................................................................................... 3
Introduction .................................................................................................................................................. 3
Evaluation Overview ..................................................................................................................................... 4
Evaluation Purpose and Use ......................................................................................................................... 4
Evaluation Methods ...................................................................................................................................... 4
Statistical Analyses ........................................................................................................................................ 5
Results ........................................................................................................................................................... 7
Moving for Memory Activity Stats ................................................................................................................ 7
Participants at a Glance ................................................................................................................................ 8
Evaluation Question 1: What is the impact on participants’ physical activity levels? .................................. 9
Evaluation Question 2: What is the impact on cognitive engagement? ..................................................... 14
Evaluation Question 3: What is the impact on participants’ quality of life? .............................................. 16
Evaluation Question 4: How do participants engage with their community? ............................................ 19
Evaluation Question 5: What is the patient perspective on the program? ................................................. 21
Evaluation Question 6: What is the team’s feedback on program developments? .................................... 24
Limitations .................................................................................................................................................. 27
Summary ..................................................................................................................................................... 28
Recommendations ...................................................................................................................................... 30
References .................................................................................................................................................. 31
3
Moving for Memory Overview
Introduction The Moving for Memory (MFM) program supports participants with cognitive impairment through
cognitive and physical activity programming. Traditional wellness and physical activity programs are
typically not built to accommodate the needs of individuals with cognitive impairments. The MFM
program provides an opportunity for people affected by cognitive impairment to participate in a group
exercise program tailored to their unique needs through the integration of cognitive engagement
activities. Further, the MFM program supports social and community connections by encouraging
interactions among participants and supporting community linkages throughout and after completion of
the program. Facilitation of the program is also patient-centred in that topics and discussions are
participant driven. This facilitation style, as well as activities embedded in the group, enable people to
learn from each other and build on their own knowledge.
The program was piloted by the Edmonton Southside Primary Care Network (PCN) in April 2016 with
two sessions. The Alberta Health Services Community Innovation Grant Initiative for People Affected by
Dementia allowed for expansion of the multidisciplinary team and further development and evaluation
of the MFM program.
The team provides a unique programming experience through a combination of cognitive and physical
activity exercises, incorporating the expertise of a healthy aging nurse, exercise specialist and
occupational therapist. The goal is to support participants’ physical and mental health through
education and practical application of physical and mental exercise. Both cognitive and physical activity
exercise have shown positive patient outcomes, including improvements in cognitive decline (Canevelli
et al., 2016; Gajewski & Falkenstein, 2016; Gill et al., 2016), improved physical functioning (Chan et al.,
2016; Laver et al., 2016), and improved quality of life (Chan et al., 2016; Elavsky et al., 2005.; Park et al.,
2014). The current MFM model builds on the former to improve care, expand reach, and allow for timely
evaluation and improvement to the program. Further, the MFM program integrates primary care and
the participants’ medical home, providing ongoing follow-up and linkages to community resources. The
program promotes a patient-centred approach and allows participants to engage in discussion and
shape the program to reach participant needs.
Objectives
The program provides supports for participants experiencing changes in their brain health and promotes
overall patient health. The key objectives are:
1. Promote physical activity in participants experiencing cognitive impairment;
2. Promote cognitive engagement through brain exercise (e.g., memory skills);
3. Promote participant health-related quality of life and overall ability to manage health;
4. Encourage socialization and community connections;
5. Encourage participant engagement in the program through group discussion and ongoing
evaluation.

4
Evaluation Overview
Evaluation Purpose and Use To understand if the MFM program services are effective in improving and maintaining sustained
participant health outcomes. The evaluation will also provide insight into what is working well, gaps in
service delivery, and opportunities for improvement.
Evaluation Questions
Evaluation Methods The project used a mixed methods evaluative approach with data collected between January and
November 2017 and included program data (activity stats, history forms and physical assessment
results), surveys, and interviews.
• Program Data: Program data included activity stats and analysis of participant health history
forms and physical assessment data collected pre-program (baseline) and at the 10-week follow-
up. Physical assessment was measured by two validated tools, the 6-Minute Walk test (6MWT)
and Sit-to-Stand test (SST). The 6MWT assesses functional capacity which is associated with
increased independence, confidence and quality of life. In this test patients walk as far as they
can in six minutes, only stopping for rest if they need to. The SST measures lower body strength
1. What is the impact on participants' physical activity levels?
2. What is the impact on cognitive engagement?
3. What is the impact on participants' quality of life?
4. How do participants engage with their community?
5. What is the patient perspective on the program?
6. What is the team feedback on program developments?

5
which is correlated with an individual’s independence and helps to improve balance thereby
reducing risk of falls. In this test participants sit on a chair and stand up and sit down as many
times as possible in 30 seconds.
• Survey Data: Baseline and 10-week follow-up surveys were collected with participants,
measuring self-reported physical activity levels, cognitive engagement, confidence and activities
in the community. The EQ5D-5L quality of life survey was also administered at both intervals.
The EQ-5D-5L is a patient-reported outcome measure in which participants self-report on a five-
item scale ranging from no issues to severe issues in 5 dimensions- mobility, self-care, usual
activities, pain/discomfort and anxiety/depression. Participants are asked to rate their current
health state on a visual analogue scale from 0 (the worst health imaginable) to 100 (the best
health imaginable).
• Interview Data: Telephone interviews were conducted by the evaluation assistant 2-weeks post
completion of program and 6-months post completion. Participants were asked to provide their
feedback on the program and survey questions, including the EQ-5D-5L, were re-administered
to assess changes over time. Program staff was also interviewed to collect feedback on the
multi-disciplinary team mix, the continuous intake process, and program successes and
challenges.
Statistical Analyses Data were analyzed using: (1) descriptive statistics; (2) Mann-Whitney U-tests; and/or (3) Fisher’s exact
test. Descriptive statistics provided an overview of the range of participant responses (minimums and
maximums) and average responses across participants (means). Descriptive statistics were used
primarily to illustrate participant responses at a single time-point. For comparison across two time-
points, Mann-Whitney U-tests or Fisher’s exact tests were used. Mann-Whitney U-tests were used for
numerical response data and Fisher’s exact tests were used for categorical response data.
Mann-Whitney U-tests were used to compare participant means at baseline and 10-weeks follow-up, 2-
weeks post completion, or 6-months post completion; these tests were used to compare 6-Minute Walk
Test results, Sit-to-Stand results, and Likert-scale response questions. As well, the Mann-Whitney U-test
was used to compare both paired (participants matched between baseline and 10-week follow-up, 2-
week post completion, or 6-month post completion) and unpaired participant data. Paired data are
presented with the corresponding V-statistic and p-value; unpaired data are presented with the
corresponding W-statistic and p-value. Fisher’s exact tests were used to compare contingency tables
(i.e., proportional responses for given categories) at baseline and 10-weeks follow-up, 2-weeks post
completion, or 6-months post completion; these tests were used exclusively to evaluate EQ-5D
absence/presence data. Both the Mann-Whitney U-test and Fisher’s exact test were restricted by
sample sizes at 10-weeks follow-up, 2-weeks post completion, and 6-months post completion.
Specifically, the paired Mann-Whitney U-test was used to account for non-parametric response data and
Fisher’s exact test was used instead of the Chi-squared test to better account for small sample sizes.

6
.
114 registrants
•Baseline data collected for 102 (history form) and 101 (physical function) participants
93 attended at least 1 class
(82%)
•Baseline survey completed on the first class with 86 participants (92%)
52 completed the program (attended at
least 7 sessions)
•Of these, 35 participants completed the 10-week follow-up survey and physical assessment (67%)
51 completed the 2-week follow-up interview
•This included participants who did not complete the program to assess reasons for drop off, in total 54% of all program attendees were interviewed
25 completed the 6-month
interview
•Only 40 participants had reached this time frame at the end of the one year project, of these 63% completed the 6-month interview.
7
Results
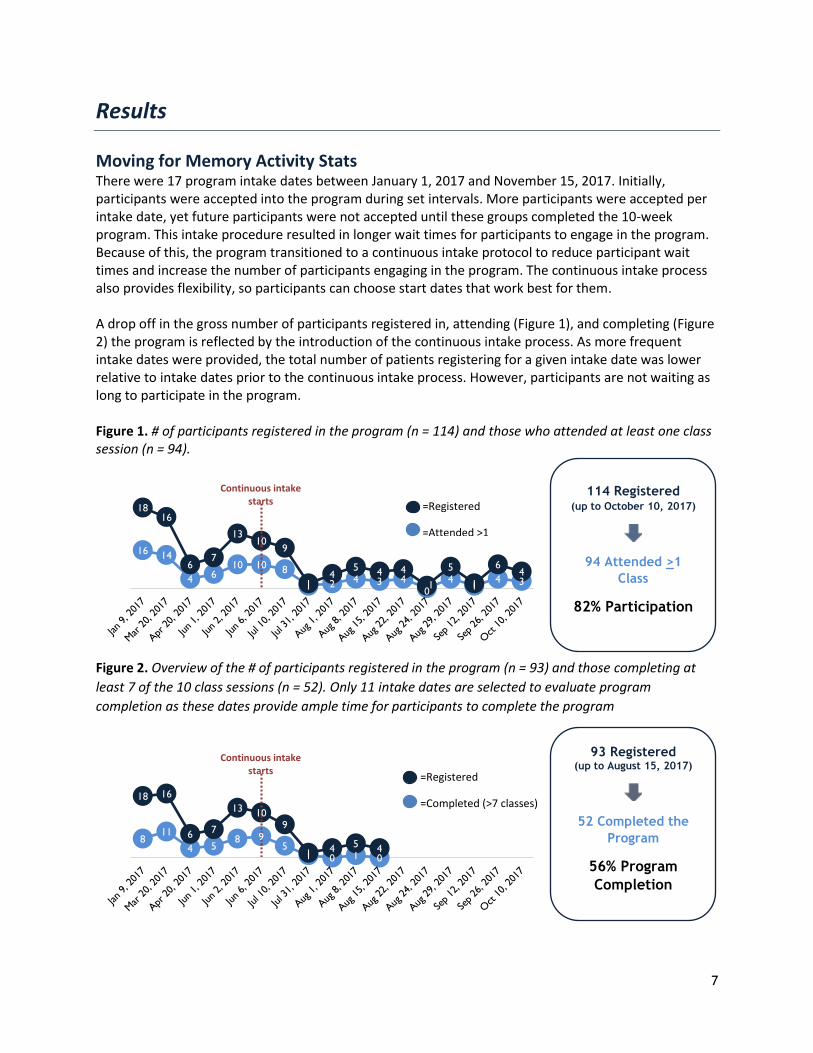
Moving for Memory Activity Stats There were 17 program intake dates between January 1, 2017 and November 15, 2017. Initially, participants were accepted into the program during set intervals. More participants were accepted per intake date, yet future participants were not accepted until these groups completed the 10-week program. This intake procedure resulted in longer wait times for participants to engage in the program. Because of this, the program transitioned to a continuous intake protocol to reduce participant wait times and increase the number of participants engaging in the program. The continuous intake process also provides flexibility, so participants can choose start dates that work best for them. A drop off in the gross number of participants registered in, attending (Figure 1), and completing (Figure 2) the program is reflected by the introduction of the continuous intake process. As more frequent intake dates were provided, the total number of patients registering for a given intake date was lower relative to intake dates prior to the continuous intake process. However, participants are not waiting as long to participate in the program. Figure 1. # of participants registered in the program (n = 114) and those who attended at least one class session (n = 94).
Figure 2. Overview of the # of participants registered in the program (n = 93) and those completing at
least 7 of the 10 class sessions (n = 52). Only 11 intake dates are selected to evaluate program
completion as these dates provide ample time for participants to complete the program
16 14
4 610 10 8
1 2 4 3 40
41
4 3
1816
67
1310
9
14
5 4 4
1
5
1
64
Continuous intake starts
811
4 58 9
51 0 1 0
18 16
6 7
13 109
1 4 5 4
Continuous intake starts
=Registered
=Attended >1
114 Registered (up to October 10, 2017)
94 Attended >1
Class
82% Participation
=Registered
=Completed (>7 classes)
93 Registered (up to August 15, 2017)
52 Completed the
Program
56% Program
Completion

8
On average, participants attended a total of 6 class sessions following the initiation of the continuous
intake process (n = 44). Attendance per class session was highest during the initial three class sessions,
and dropped at the fourth class session and again at the seventh class session.
Participants at a Glance Nearly 70% of participants were female (Figure 3). As well, almost 50% of participants over 81 years of age (Figure 4). Almost half of participants (47%) reported having a chronic medical condition (n = 95). Further, 40% reported that they have cognitive impairment (n = 94) and 40% reported that they have trouble walking (n = 96). Figure 3. Participant gender Figure 4. Participant age distribution
31%
69%
5%12%
37%
46%
51-60 61-70 71-80 81+

9
Evaluation Question 1: What is the impact on participants’
physical activity levels?
Physical Assessment A physical assessment was administered at two time points: (1) baseline and (2) 10-week follow-up.
Each physical assessment included a 6-Minute Walk rest (6MWT) and a Sit-to-Stand test (SST).
6-Minute Walk Test
The 6MWT provides an objective measure of participant functional capacity and has been shown to be
reflective of activities of daily living (Solway et al., 2001). The average distance walked (in metres) for
the 6MWT increased at the 10-week follow-up (W = 360.5, p = 0.36; Table 1). However, only 28% of
participants with baseline results also completed the 10-week follow-up assessment. While this limits
comparability, it is still interesting to note the overall increase in distance walked and decrease in
variation in distance walked (i.e., the standard deviation).
Table 1. Descriptive statistics for the 6-Minute Walk Test at baseline and 10-week follow-up
assessments. # of participants Minimum
distance (m) Maximum distance (m)
Mean distance (m)
Standard deviation (m)
Baseline 88 63 798 372 131 10-week follow-up
25 126 615 408 118
For participants completing both baseline and 10-week follow-up assessments (n = 25), distance walked
(in metres) increased from 385 metres to 408 metres. While the average distance walked increased, this
increase was not statistically significant (V = 180, p = 0.39).
One in two participants (52%) increased their distance walked (Figure 5a). Cognitive assessment was
not measured with MFM participants and cognitive impairment may have varied from mild to more
advanced. This complicates comparisons to Minimal Clinical Important Different Differences (MCID), or
targets for clinically meaningful changes, found in the literature. For example, Ries et al. (2009)
reported people with Alzheimer’s to show a MCID with an increase of at least 33.47 metres and Perera
et al. (2006) reported an MCID of at least 50 metres for a geriatric population (77.6 + 7.6 years). For
illustrative purposes, 40% and 32% of participants (n = 25) met or exceeded the MCID compared to
Alzheimer’s and geriatric populations, respectively (Figure 5b).

10
Figure 5. The a) % of participants with an increase, decrease, or no change in distance walked at 10-
weeks follow-up, and b) % of participants meeting minimal clinical important differences for the 6-
Minute Walk Test for Alzheimer’s and geriatric populations (n = 25).
a)
b)
Sit-to-Stand Test
The SST evaluates participant functional leg strength, balance, and endurance. The average number of
SSTs completed in 30 seconds were identical at baseline and 10-weeks follow-up (W = 299.5, p = 0.64;
Table 2). Like the 6MWT, less than 30% of participants completed the 10-week follow-up assessment.
Table 2. Descriptive statistics for the Sit-to-Stand Test at baseline and 10-weeks follow-up. # of participants Minimum
number Maximum number
Mean number Standard deviation
Baseline 89 5 22 10.5 3.6 10-week follow-up
25 5 18 10.6 3.1
For participants completing both assessments (n = 25), the average number of SSTs in 30 seconds did
not change (V = 96, p = 0.32). However, ten participants increased their number of SSTs, of which three
revealed clinically significant improvements in their number of SSTs completed in 30 seconds (Figure 6a
& b). The MCID for the SST for geriatric patients (82.47 + 5.31) with mild cognitive impairment was 3.49
(Blankevoort et al., 2013). Eggermont et al. (2010) assessed the SST with cognitively healthy, mild
cognitive impaired, and Alzheimer’s disease patients and found not difference in SST performance
between the groups; therefore, we took the 3.49 MCID outlined by Blankevoort et al. (2013) as a
reasonable benchmark for improvement in our population.
52%
4%
44%
Increased No Change Decreased
40%
32%
Met MCID (Alzheimer's) Met MCID (Geriatric)

11
Figure 6. The a) % of participants with an increase, decrease, or no change in Sit-to-Stands at the 10-
week follow-up assessment, and b) % of participants meeting minimal clinical important differences for
the Sit-to-Stand Test (n = 25).
a)
b)
Self-Reported Physical Activity
Participants were asked to rate their current activity level at baseline and 6-months post completion of
the program. Activity level was categorized into five States of Change: 1) pre-contemplation (not ready);
2) contemplation (getting ready); 3) preparation (ready); 4) action; and 5) maintenance (Prochaska &
DiCelemente, 1983; Prochaska et al., 1992). Participants generally fell into the ‘preparation’ and ‘action’
categories at both time intervals; however, only 25% of participants (n = 22) were asked to rate their
physical activity level at 6-months post completion. Further, there was no statistically significant
difference between physical activity ratings at baseline and 6-months post completion (V = 57.5, p =
0.60). At 6-months post completion, 36% of participants reported increased activity levels. However,
64% of participants reported either no change (32%) or a decrease (32%) in their physical activity levels.
Nearly 60% of participants reported exercising at least weekly beyond their daily activities at baseline; 20% reported never exercising beyond their daily activities (n = 81). Nineteen participants were asked about their exercise frequency 6-months post completion. Nearly half of participants (47%) reported decreased exercise frequency compared to baseline (Figure 7). However, there was no statistically significant difference between baseline and 6-months post (V = 70.5, p = 0.27). Further, the sample size of the pre-post comparison is insufficient to generalize to the MFM population. Figure 7. % of participants with an increase, decrease, or no change in their self-reported rating of exercise beyond daily activities (n = 19).
Generally, participants who exercised beyond their daily activities would engage in at least 15 minutes of exercise during an exercise session (69%, n = 80). Half of participants (49%) exercised primarily at home including doing stairs, walking on a treadmill, or strength training. 1 in 3 participants (35%) exercising outside by going for walks, while 17% reported exercising at a recreation centre.
38%
12%
50%
Increased No Change Decreased
12%
88%
Met MCID Did not meet MCID
26%
26%
47%
Increased
No Change
Decreased

12
Overall, participant confidence in being physically active remained moderate (>6 on an 11-point Likert scale) at 10-weeks follow-up and 6-months post completion (Table 3). There were no statistically significant changes between any of the time periods. Table 3. Descriptive statistics for participant confidence about being physically active at baseline, 10-weeks follow-up, and 6-months post completion, where 0 = Not very confident and 10 = Very confident. # of
participants Minimum score
Maximum score
Mean score Standard deviation
Baseline 80 0 10 6.2 2.6 10-week follow-up 34 2 10 7.1 2.3 6-month post completion 25 0 10 6.6 2.9
Participant Perspectives 1 in 4 participants (24%) said that the physical exercise component of the program was most enjoyable and 41% mentioned that they learned most from the physical exercise component. Particularly, participants enjoyed exercising alongside peers, while feeling supported and motivated by the instructors. A few commented on their personal exercise goals; the exercise component built on participant confidence and physical functioning to help participants work toward their goals.
“Got a little exercise [out of the program]. I don’t think I will get back to my old self, but it is a step in the right direction. Trying to get to the point where I can go out and dance with my wife. I can dance now, but only for half a song. I would like to be able to dance through a
whole song.” At the 2-week follow-up, 40% of participants had continued with the physical exercises learned in class; 36% reported not continuing with the exercises but they were thinking about incorporating them into their lives (n = 45). Those that continued with the exercises mostly said they enjoyed walking and stretching. “I try to do exercise every morning. I do the stretches and I try to get outside.” Motivation was a limiting factor for some participants thinking about incorporating more exercise into their life. The encouragement provided by the facilitators helped keep participants motivated and exercising at home was difficult without an external motivator. For others, life got in the way of exercise. “I’ve been so busy. I will come back in the fall. With holidays and spending time with family I have been active, but I have not continued with the exercises from the program.” Participants that did not continue with physical activity usually reported that either a medical condition prevented them from exercising or that they had forgotten the exercises and had not thought to do them at home. This was the same pattern at the 6-month follow-up (only 40% were continuing with the exercise learned in class). Those who did not continue reported that their lives were busy, not affording them time to follow the exercises learned in class. Others reported laziness, forgetfulness, or health issues as contributing factors leading to a drop-off in sustained behaviours. “Unfortunately, I’m lazy. You know, you get busy and then you forget.” While most participants were completely satisfied with the exercise component of the program, a few
suggested activities that would make the program more enjoyable. “Maybe add dancing for older
people. Something like Zumba.” Others commented that they would enjoy more balance-related
exercises and that more physical exercise could be incorporated into the program.

13
Key Findings
❖ Distance walked during the 6-Minute Walk Test increased following the program but the
difference was not statistically significant. However, 40% and 32% of participants met the
minimal clinically important difference (MCID) when comparing to Alzheimer’s and geriatric
populations, respectively. Number of Sit-to-Stands remained stable following the program; 12%
of participants met the MCID for a mild cognitive impaired population.
❖ Over half of participants (60%) exercised at least weekly at the beginning of the program. 1 in 2
participants (52%) had increased or maintained their exercise frequency.
❖ 40% of participants continued with the physical exercises at home. Participants that did not
continue with physical activity usually reported that either a medical condition or forgetfulness
prevented them from continuing with the exercises learned.

14
Evaluation Question 2: What is the impact on cognitive
engagement?
Daily Activities
Increased engagement in activities that stimulate brain activity have been linked to lower risk of dementia (Verghese et al., 2003). These include common daily activities that participants could easily do at home, such as watching television or reading. Participants were asked how often they engaged in nine daily activities at baseline and 6-months post completion. At baseline, most participants reported watching television (96%) or reading (84%) at least several times per month (n = 82). Over half also reported listening to music (79%), baking or cooking (68%), or writing (56%) several times per month. Fewer played games (38%), did crossword puzzles (30%), played an instrument (11%), or drew or painted (7%). Response rates were relatively the same across most activities at the 6-month follow-up. However, participants were more likely to report doing crosswords (55%) or playing games (45%). It is interesting that both these activities were initially incorporated in the program, which may attribute to increased activity. However, none of the changes were significant and the sample size was small (n=20).
Self-Reported Cognitive Engagement 3 in 4 participants (75%) were either ‘confident’ or ‘very confident’ in applying the memory tools they learned in class into their everyday life at the 10-week follow-up (n = 20). Further, nearly all participants (95%) were at least ‘somewhat confident’ in using the memory tools they learned (Figure 8). It is important to the note that different memory tools and activities were emphasized in the classes as the program evolved. Figure 8. Participant confidence in use memory tools learned in class in their everyday life (n = 20).
5%
20%
30%
45%
Not confident
Somewhat confident
Confident
Very confident

15
Participant Perspectives One-third of participants (32%) said they learned the most from the memory tools and activities portion of the program. Particularly, participants said they learned how memories are stored, how memory works, and how to use the tricks and tools learned in class to help improve their memory. At the 2-week follow-up 62% of participants interviewed said they had implemented memory tools from class into their lives (n = 45) and at 6-months this decreased to less than half (43%). Specifically, participants enjoyed crosswords and other puzzle games (e.g., Sudoku). “I will start with crosswords. That helps cognition. I also do Sudoku because [the instructors] said that it is good. I do that daily.” Using verbal expressions, such as thinking out loud, helped some participants with their memory. “I speak verbally to help remember and make things stick.” Some participants who did not continue said they enjoyed the games and tools in class, but did not enjoy them as much at home. A few also said that they had forgot about the memory tools, although would like to include more of the memory tools into their life if they could remember to use them.
“I suppose [I continued with the memory tools]. Like when you leave and think “Did I turn off
the stove?” To say it out loud so it sticks with you better. Most [tools] reinforced what I
already knew. Playing word games… I do Sudoku. They said it was good. Each time they
reinforce something.”
Those that continued said they used thinking out loud and writing things down techniques to help with their memory. “I write everything down and work hard at it.” The main reason for those not continuing was forgetfulness. However, a few participants said they had stopped using the memory tools but were thinking about using them again.
Key Findings
❖ Nearly all participants (95%) felt confident using the memory tools learned in class in their daily
life.
❖ Despite the memory tools and activities evolving over the duration of the project, 6 in 10
participants (62%) at the 2-week follow-up used brain games and memory tools learned in class;
doing puzzles and using thinking out loud techniques were popular. This decreased to 43% at 6-
months, with participants saying forgetting was the main reason for not using.

16
Evaluation Question 3: What is the impact on participants’
quality of life?
Managing Health Problems Overall, participant confidence in managing their health problems increased slightly following the
program (Figure 9). However, there was no statistical differences when comparing over the time
periods.
Figure 9. Average participant rating of their ability to manage their own health at baseline, 10-follow-up,
and 6-month post completion, where 0 = Not very confident and 10 = Very confident.
Quality of Life
The number of participants completing the EQ-5D-5L at six months is very small (n=23), as such the
analysis is exploratory only.
What did we learn by using this tool? MFM participants reported a significantly higher proportion of
individuals experiencing problems in mobility, self-care, usual activities, and anxiety/depression at
baseline compared to Alberta norms (HQCA, 2014; Table 4). Alberta norm data was averaged for
Albertans aged 50 years or older to be a better comparison for our population. The most difference is
for anxiety/depression, 55% of participants had an issue with anxiety/depression compared to 27% for
the Alberta population norms. Comparison of the follow-up intervals is provided in Table 4, however
sample sizes are small. There appears like a positive trend in the anxiety/depression category (from 55%
at baseline to 47% at the 10 week follow-up and 38% at 6-months). Due to the social aspect of the
program this is a positive trend that needs further investigation.
EQ-5D can also be analyzed by looking at the percentage of participants who improve, worsen or do not
change by dimension. The small size prevented this analysis in a meaningful way but should be explored
further.
6.9
7.7
7.9
Baseline
10-week post completion
6-month post completion

17
Table 4. Participant problems across EQ-5D dimensions at baseline, 10-weeks follow-up, and 6-months
post completion. No problems refer to participants without issues in each respective dimension;
problems refer to participants with issues in a given dimension. Fisher’s exact test was used to compare
between: a) baseline and 10-week follow-up, and b) baseline and 6-month post completion.
EQ-5D Dimension Alberta Norms*
Baseline (n = 76)
10-week follow-up (n = 32)
6-month post completion
(n = 24)
% N % N % N %
MOBILITY
No problems 60% 33 43% 15 47% 12 50% Problems 40% 43 57% 16 50% 12 50%
p-value
0.673
0.641
SELF-CARE
No problems 91% 63 83% 26 81% 23 96% Problems 9% 12 16% 6 19% 1 4%
p-value
0.780
0.178
USUAL ACTIVITIES
No problems 68% 39 51% 20 63% 14 58% Problems 32% 37 49% 11 34% 10 42%
p-value
0.284
0.642
PAIN/DISCOMFORT
No problems 31% 16 21% 11 34% 8 33% Problems 69% 59 78% 21 66% 16 67%
p-value
0.223
0.277
ANXIETY/DEPRESSION
No problems 73% 34 45% 17 53% 15 63% Problems 27% 42 55% 15 47% 9 38%
p-value
0.527
0.162 *Alberta norms were averaged for Albertan’s 50 years of age or older (HQCA, 2014) for a better comparison to the MFM population. Fisher’s
exact test (p < 0.05) was used to evaluate statistical differences between Alberta norms and the MFM population. Results of these analyses are
not presented in the table, but are described below.
Average health status on the Visual Analogue Scale (VAS) remained stable following the program.
Participants rated their health status relatively high at baseline, 10-weeks follow-up, and 6-months post
completion (>70, Figure 10). Participants with paired VAS data showed a statistically significant increase
in their health status rating between baseline and 10-week follow-up (V = 63, p = 0.04), however no
statistically significant difference was observed between baseline and 6-month post completion VAS
scores (V = 101, p = 0.25).
Figure 10. Average VAS scores at baseline, 10-weeks follow-up, and 6-months post completion. Error
bars represent standard deviations in VAS scores.
0 20 40 60 80 100
6-month post completion (n = 23)
10-week follow-up (n = 33)
Baseline (n = 78)

18
Key Findings
❖ Participants’ confidence in managing their own health problems increased slightly but was not
statistically significant.
❖ MFM participants reported a significantly higher proportion of individuals experiencing
problems in mobility, self-care, usual activities, and anxiety/depression at baseline compared to
Alberta norms (HQCA, 2014; Table 4). The most difference is for anxiety/depression, 55% of
participants had an issue with anxiety/depression compared to 27% for the Alberta population
norms.
❖ There appears like a positive trend in the anxiety/depression category (from 55% at baseline to
47% at the 10 week follow-up and 38% at 6-months). Due to the social aspect of the program
this is a positive trend that warrants further investigation.

19
Evaluation Question 4: How do participants engage with their
community?
Community Engagement On average, participants get out of the house at least a couple of times per week (> 5 on a six-level
scale; Table 6). At 6-months post completion participants continue to be out of the house frequently.
Table 6. Descriptive statistics for participant frequency for getting out of the house, where 1 = Less than
once a month and 6 = Every day.
# of participants
Minimum score
Maximum score
Mean score Standard deviation
Baseline 81 3 6 5.4 0.8 6-month post completion 20 1 6 5.2 1.3
Many seniors experience social isolation, which may result from living along, having a small social
network, infrequent participation in social activities, and feelings of loneliness (Cornwell and Waite,
2009). This is exacerbated for those experiencing cognitive decline. The MFM program helps connect
seniors with their community by providing an environment where participants can get out and socialize
with their peers. Participation in community activities may also be limited by transportation. To assist
these participants, the program connected participants without transportation to the LIFT Drive
Happiness program (Drive Happiness, 2017). Drive Happiness program provides seniors with
transportation to and from the program, to support participant independence. From November 2016 to
November 2017, 43 participants used Drive Happiness services to engage with the MFM program, for a
total of 452 rides.
Many participants commented that the social aspect of the program was a highlight for them, as it gave
them an opportunity to get out of the house and interact with their peers. “[I enjoyed] the social aspect.
Lots of shared problems between the people. It really broadened my outlook and feel not so isolated.”
Connecting with peers experiencing similar physical and/or cognitive decline helped participants
understand that they are not alone in their ailments and that there are supports available to them.
“I feel I am given an opportunity to be a part of a group and a part of the community. I
thought I would be alone, but they help me live life to the fullest with the PCN.”
At the six-months follow-up participants were asked if they were more active in their community and
whether they had engaged in any new activities. 1 in 4 participants (25%) said they were more active in
their community following the program. These participants mentioned that they had enrolled in more
programs with the PCN and had increased their socialization with friends and family. “I’m more active. I
visit my family more and visit friends for coffee.” One participant also said they had moved, but the
program had motivated them to find an exercise program in their new area, so they could continue
being active. Many others maintained or decreased their activity in their community for a variety of
reasons. For example, one participant said “I’m going to be 90. I am happy to live my life”.
20
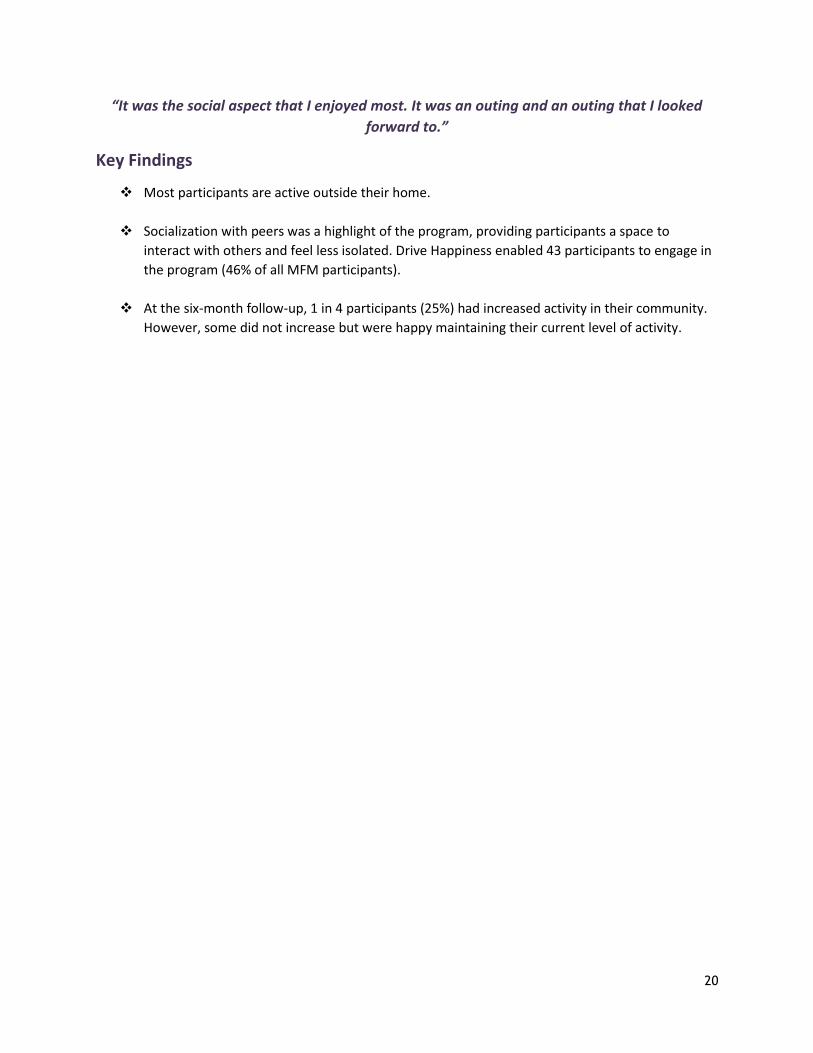
“It was the social aspect that I enjoyed most. It was an outing and an outing that I looked
forward to.”
Key Findings
❖ Most participants are active outside their home.
❖ Socialization with peers was a highlight of the program, providing participants a space to
interact with others and feel less isolated. Drive Happiness enabled 43 participants to engage in
the program (46% of all MFM participants).
❖ At the six-month follow-up, 1 in 4 participants (25%) had increased activity in their community.
However, some did not increase but were happy maintaining their current level of activity.
21
Evaluation Question 5: What is the patient perspective on the
program?
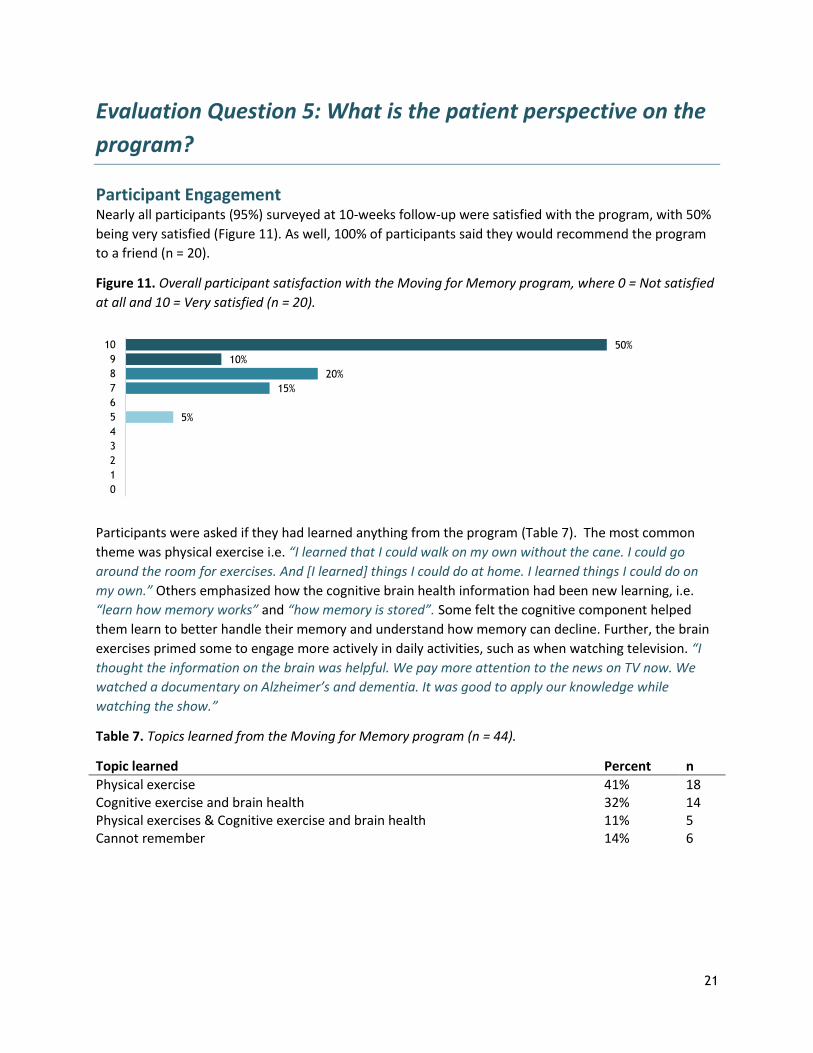
Participant Engagement Nearly all participants (95%) surveyed at 10-weeks follow-up were satisfied with the program, with 50%
being very satisfied (Figure 11). As well, 100% of participants said they would recommend the program
to a friend (n = 20).
Figure 11. Overall participant satisfaction with the Moving for Memory program, where 0 = Not satisfied
at all and 10 = Very satisfied (n = 20).
Participants were asked if they had learned anything from the program (Table 7). The most common
theme was physical exercise i.e. “I learned that I could walk on my own without the cane. I could go
around the room for exercises. And [I learned] things I could do at home. I learned things I could do on
my own.” Others emphasized how the cognitive brain health information had been new learning, i.e.
“learn how memory works” and “how memory is stored”. Some felt the cognitive component helped
them learn to better handle their memory and understand how memory can decline. Further, the brain
exercises primed some to engage more actively in daily activities, such as when watching television. “I
thought the information on the brain was helpful. We pay more attention to the news on TV now. We
watched a documentary on Alzheimer’s and dementia. It was good to apply our knowledge while
watching the show.”
Table 7. Topics learned from the Moving for Memory program (n = 44).
Topic learned Percent n
Physical exercise 41% 18 Cognitive exercise and brain health 32% 14 Physical exercises & Cognitive exercise and brain health 11% 5 Cannot remember 14% 6
50%
10%
20%
15%
5%
10
9
8
7
6
5
4
3
2
1
0

22
While some participants reported not learning anything, they mentioned that they still enjoyed the
program. “I quite enjoyed the program. Did I learn anything? I don’t know. I really enjoyed the program
though.” Some participants could not remember if they had learned anything from the program. “I
probably learned how much I don’t remember.”
Nearly all participants said they enjoyed the program (Table 8). “I just enjoyed the whole program.
Especially the exercise. I enjoyed the cognitive support. They let me know that it is not unusual and that
you can work on improving and cope with [memory loss].” The most frequent theme was enthusiastic
facilitators who provided a fun and supportive environment to get active and learn to train their brains.
Other themes included enjoying the physical exercise component and the social activities. “It gave me
half a day to do something and meet people.”
Table 8. Areas of enjoyment for Moving for Memory participants (n = 45).
Area of enjoyment Percent n*
Facilitators 31% 14 Physical exercises 24% 11 Whole program 22% 10 Social opportunities 20% 9 Cognitive exercises and brain health 9% 4 *Participants may have reported enjoyment in one or multiple areas of the program. Participants are double counted in the ‘n’ column if they
reported enjoyment in more than one area. As such, the total of the ‘n’ column exceeds the number of participants interviewed (n = 45).
When asked about opportunities for improvement, a few participants mentioned that the classes could
be repetitious or boring. It was suggested that more interaction between participants and the
facilitators could help improve the lectures. Related, it was mentioned that more handouts would be
appreciated so that participants could review the material outside of class. This could assist with
sustaining behaviours learned from the class, providing resources for participants to reflect on and
incorporate into the daily lives. It was also mentioned that sometimes the discussions required
moderation by the facilitators.
“People would ask questions when it wasn’t their turn. We couldn’t hear the questions in the
back. Ask you questions and have the instructor repeat the question so that everyone can
hear, and then respond to the whole group.”
It is important to note that suggestions were often made by 1 or 2 individuals; nonetheless they can
provide important insights for the team to consider (Table 9).
23
Table 9. Suggested areas for improvement for the Moving for Memory program
Area of improvement
a. b c d.
More interactive lectures Help moderate group to keep everyone on track Handouts so that participants could review material outside class and have reminders Increase the duration of the program to provide better support for participants requiring more support and motivation
e. Provide more class times to accommodate participant schedules f. Provide more practical information for participants to learn and review g. Include advanced levels for participants that may not be challenged by the base program h. Increase awareness of the program to reach people that could benefit from the program i. Test participant memory throughout the program to access change in cognitive ability j. Include more information on nutrition
Key Findings
❖ Nearly all participants (95%) were satisfied with the program, and all participants would
recommend the program to a friend.
❖ Most participants learned new physical and cognitive exercises from the program. Those that
did not learn anything mentioned that they still enjoyed the program or had forgotten what
they had learned.
❖ Participants enjoyed the whole program, including the physical and cognitive exercise, the
facilitators, and the social aspect of the program. The program helped participants connect with
peers while learning ways to stay active and improve brain health.

24
Evaluation Question 6: What is the team’s feedback on
program developments?
Multi-Disciplinary Team The multi-disciplinary team consists of: (1) facilitators (exercise specialists, healthy aging nurse, and
occupational therapist) and (2) an administrative team. Together the multi-disciplinary team
collaborates to provide quality programming for participants with cognitive impairment. Collaboration
between the different disciplines has been vital to the success of the program. The facilitators have
worked well to organize the program and bring their own experiences to each lesson. It is beneficial to
the participants to have three disciplines speak to the same topic, while approaching the topic of
cognitive impairment from different perspectives. This better allows for the participants to engage with
the physical and cognitive training while working toward improving overall health and brain health.
Further, the multi-disciplinary team interacts directly with the participants each week. They see first-
hand as participants progress and improve throughout the program. The multi-disciplinary team also
provides a fun and enjoyable program that participants look forward to attending.
“Overall, we are meeting the needs of the patient population. As well, the program is
popular, and patients enjoy coming to it.”
Occupational Therapist
The addition of the occupational therapist (OT) has been well-received by the multi-disciplinary team.
The OT brings a fresh perspective to cognitive health, drawing on her knowledge and expertise to deliver
a coherent brain exercise program for the participants. Using “out-of-the-box ideas” has improved the
memory training and cognitive exercise component of the program, helping engage participants in the
content and understand “why brain health is important”.
Prior to the OT, physical exercise was more emphasized in the program. However, the program now
offers a more comprehensive cognitive component that has been integral to the growth and success of
the program. While participants benefit from her expertise firsthand in class, the other facilitators and
members of the multi-disciplinary team also benefit from her expertise. This transfer of knowledge
allows the other facilitators to better engage with participants in both the physical and mental health
components of the program.
A challenge with the addition of the OT is the part-time nature of her position. With a limited amount of
time at the PCN, there can be issues with communication between the OT and the other facilitators.
Before each class, the facilitators have a short window to discuss the upcoming class. However, the
multi-disciplinary team noted that while communication between facilitators can be a challenge, the
benefit of the OT’s addition far outweighs these issues.

25
Continuous Intake
The program initially included a fixed participant intake approach; participants were accepted into a
fixed 10-week program and new participants were not accepted until the completion of the set
program. This limited the number of participants that could benefit from the program, so a continuous
intake approach was adopted. The continuous intake approach allows new participants to enter the
program every two-weeks. Participants may engage in the program for as long as they desire, and are
not restricted to a fixed 10-week cycle.
For participants, the continuous intake approach has been well-received. Participants no longer must
wait extended periods to be accepted into the program. As such, participants have access the benefits of
program much sooner. The flexibility of this approach also better fits to the participants schedules.
“The best part is that participants aren’t waiting to get into the program.”
For the facilitators, there are some challenges with the continuous intake approach. It is not possible to
carry over topics from one week to the next with new participants entering the program every two
weeks. As such, each lesson must be a stand-alone lesson so that even first-time participants can follow
along with the content. Not all participants will have the same knowledge and lesson content needs to
be assessible to the entire group. Further, facilitators do not always know what week each participant is
on to best follow-up with participants’ progress through the program. Participant attendance is tracked,
but different approaches are required to better understand who the participants are week to week.
Dates, which were not always included in the attendance tracking, have helped to improve participant
tracking.
Program Challenges
Challenges brought forth by the multi-disciplinary team include:
a) Communication and collaboration between facilitators;
b) Class planning and organization; and,
c) Managing the continuous intake process.
Communication and collaboration is integral to the success of the program. While the facilitators and
the rest of the multi-disciplinary team work to improve transparency and open communication between
disciplines, there are still challenges with getting everyone on the same page. This is partly attributed to
the growth of the program. With this growth, the program has evolved to include a greater emphasis on
brain health, which was less of a focus before the addition of the OT. Further, collaboration can be a
challenge when trying to integrate three disciplines into each class.
These challenges also feed into class planning and organization. Preparation for classes can be a
challenge when the team do not always have adequate time to discuss daily activities. “We’re not
always sure what everyone is doing. It’s like going into each week blind.” With each class being stand-
alone to accommodate the continuous intake process, there is not a set progression of class material to
rely on. More participants are coming through the program, but it is not possible to follow the structure
of the original 10-week program.

26
However, the multi-disciplinary team is working to address and overcome these issues. The team has
started work on creating a manual to outline the progression of the program, the materials covered by
each discipline, and provide clear program objectives. This will help address issue in communication,
collaboration, and class planning. While the manual is a work in progress, it is intended to clarify each
facilitator’s role, while allowing the facilitators to pull in the correct content for each class and improve
consistency. Further, this allows for each facilitator to step into each other’s role in the event of
absences and continue to provide the best program possible for the participants.
Solutions to better manage the continuous intake process revolve around better participant tracking
and communication with the facilitators. Participant tracking needs to be clear and accessible by the
facilitators to best monitor participant progression through the program.
Program Improvements
The multi-disciplinary team provided suggestions for improvements to the program. Most revolved
around improving participant engagement and increasing awareness, including:
a) Incorporate ice-breakers into the program to better acquaint participants with their peers;
b) Include whole-group games and exercises to improve group engagement (e.g., large Murder
Mystery game with the full class);
c) Incorporate computer-learning activities for cognitive engagement;
d) Invite guest speakers to speak on topics such as nutrition and brain health; and
e) Advertise the program to increase awareness.
Key Findings
❖ The program has improved with the combined knowledge and expertise provided by the
exercise specialists, healthy aging nurse, and occupational therapist. The addition of the
occupational therapist has been an asset and has helped shape the program.
❖ Transitioning to a continuous intake process has been a challenge, yet more participants are
able to engage in the program while not having to wait for services.

27
Limitations Study Design: A control group (i.e., a similar cohort not enrolled in the program) would allow for direct comparison between those enrolled and not enrolled in the program, and participant outcomes could better be attributed to the intervention of the program. However, using a control group was not feasible for this evaluation as restricting access would prevent some from experiencing and benefiting from the program. As well, the use of a control group would require substantially more time and financial resources to adequately assess the overall impact of the program which was beyond the scope of this evaluation. However, to counter the use of a control group, we implemented a pre/post evaluation design to monitor participant change over time. This approach is also influenced by the fact cognitive impairment declines over time.
Sample Size: Completeness of post completion data was limited. Not all participants were assessed at the 10-week follow-up. Interview data was also limited by our ability to contact participants by phone. Time was also a limiting factor- our small sample sizes at the 6-month follow-up were due to the fact only the first three groups enrolled in the program reached the 6-month post completion stage during the one year of the project. This hampered our use of statistical tests, making interpretations difficult.
Cognitive Assessment: Our data did not include a measure of cognitive assessment which would have allowed us to do additional exploratory analysis.

28
Summary
Given that dementia is a progressive disease success should be measured by maintenance as opposed to
improvements. Overall the evaluation results of the MFM program are positive as they indicate
maintenance of physical function.
Impact on physical activity
❖ Distance walked during the 6-Minute Walk Test increased following the program but the difference was not statistically significant. However, 40% and 32% of participants met the minimal clinically important difference (MCID) when comparing to Alzheimer’s and geriatric populations, respectively. Number of Sit-to-Stands remained stable following the program; 12% of participants met the MCID for a mild cognitive impaired population.
❖ Over half of participants (60%) exercised at least weekly at the beginning of the program. 1 in 2 participants (52%) had increased or maintained their exercise frequency.
❖ 40% of participants continued with the physical exercises at home. Participants that did not continue with physical activity usually reported that either a medical condition or forgetfulness prevented them from continuing with the exercises learned.
Impact on
cognitive
engagement
❖ Nearly all participants (95%) felt confident using the memory tools learned in class in their daily life.
❖ Despite the memory tools and activities evolving over the duration of the project, 6 in 10 participants (62%) at the 2-week follow-up used brain games and memory tools learned in class; doing puzzles and using thinking out loud techniques were popular. This decreased to 43% at 6-months, with participants saying forgetting was the main reason for not using.
Impact on quality of
life
❖ Participants’ confidence in managing their own health problems increased slightly but was not statistically significant.
❖ MFM participants reported a significantly higher proportion of individuals experiencing problems in mobility, self-care, usual activities, and anxiety/depression at baseline compared to Alberta norms (HQCA, 2014; Table 4). The most difference is for anxiety/depression, 55% of participants had an issue with anxiety/depression compared to 27% for the Alberta population norms.
❖ There appears like a positive trend in the anxiety/depression category (from 55% at baseline to 47% at the 10 week follow-up and 38% at 6-months). Due to the social aspect of the program this is a positive trend that warrants further investigation.
Impact on
community
engagement
❖ Most participants are active outside their home. ❖ Socialization with peers was a highlight of the program, providing participants
a space to interact with others and feel less isolated. Drive Happiness enabled 43 participants to engage in the program, or 46% of all participants.
❖ At the six-month follow-up, one-quarter of participants (25%) had increased activity in their community. However, some did not increase their activity in

29
the community, but were happy maintaining their current level of activity.
Patient
perspective
❖ Nearly all participants (95%) were satisfied with the program, and all participants would recommend the program to a friend.
❖ Most participants learned new physical and cognitive exercises from the program. Those that did not learn anything mentioned that they still enjoyed the program or had forgotten what they had learned.
❖ Participants enjoyed the whole program, including the physical and cognitive exercise, the facilitators, and the social aspect of the program. The program helped participants connect with peers while learning ways to stay active and improve brain health.
Team feedback
❖ The program has improved with the combined knowledge and expertise provided by the exercise specialists, healthy aging nurse, and occupational therapist. The addition of the occupational therapist has been an asset and has helped shape the program.
❖ Transitioning to a continuous intake process has been a challenge, yet more participants are able to engage in the program while not having to wait for services.

30
Recommendations
Evaluation: Future evaluation activities of the program should:
❖ Incorporate a short cognitive screen ❖ Collect a larger sample size over a longer period of time with consistent data collection points to
strengthen the evaluation, in particular quality of life ❖ Ensure cognitive activities and strategies that are emphasized in class are clearly defined and
then reflected in the evaluation plan
Team:
❖ Focus on developing strategies to improve team communication to support class planning and
organization
Program Improvements:
❖ Continue to work on ways to address challenges of continuous intake programming for program
content and delivery
❖ Look at ways to improve how participants can engage and interact during class
❖ Review feedback from participants on class content and delivery and look for opportunities for
improvement
❖ Continue to monitor program activity levels and trial new ways to recruit for the program

31
References
Andersen, C. K., Wittrup-Jensen, K. U., Lolk, A., Andersen, K., & Kragh-Sorenson, P. 2004. Ability to
perform activities of daily living is the main factor affecting quality of life in patients with dementia.
Health and Quality of Life Outcomes 2: 52.
Blankevoort C.G., Heuvelen, M.J.G., & Scherder, E.J.A. 2013. Reliability of six physical performance tests
in older people with dementia. Physical Therapy 89(8): 69-78.
Canevelli, M., Grande, G., Lacorte, E., Quarchioni, E., Cesari, M., Mariani, C., Bruno, G., & Vanacore, N.
2016. Spontaneous reversion of mild cognitive impairment to normal cognition: a systematic review of
literature and meta-analysis. JAMDA 17: 943-948.
Chan, W.C., Lautenschlager, N., Dow, B., Ma, S.L., Wong, C.S.M., & Lam, L.C.W. 2016. A home-based
exercise intervention for caregivers of persons with dementia: study protocol for a randomised controlled
study. Trials 17: 460-467.
Cornwell, E.Y. & Waite, L.J. 2009. Social disconnectedness, perceived isolation, and health among older
adults. Journal of Health and Social Behavior 50: 31-48.
Drive Happiness. 2017. Senior Assisted Transportation Program. Retrieved from:
https://www.drivehappiness.ca/ihhsa-services/transportation/
Elavsky, S., McAuley, E., Motl, R.W., Konopack, J.F., Marquez, D.X., Hu, L., Jerome, G.J., & Diener, E.
2005. Physical activity enhances long-term quality of life in older adults: efficacy, esteem, and affective
influences. Annals of Behavioral Medicine 30(2): 138-145.
Eggermont, L.H., Gavett, B.E., Volkers, K.M., Blankevoort, C.G., Scherder, E.J., Jefferson, A.L., Steinberg,
E., Nair, A., Green, R.C., & Stern, R.A. 2010. Lower-extremity function in cognitively healthy aging, mild
cognitive impairment, and Alzheimer’s disease. Archives of Physical Medicine and Rehabilitation 91: 584-
588.
Gajewski, P.D. & Falkenstein, M. 2016. Physical activity and neurocognitive functioning in aging – a
condensed updated review. European Review of Aging and Physical Activity. 13: 1-7.
Gauthier, S., Reisberg, B., Zaudig, M., Petersen, R. C., Ritchie, K., Broich, K., Belleville, S., Brodaty, H.,
Bennett, D., Chertkow, H., Cummings, J. L., de Leon, M., Feldman, H., Ganguli, M., Hampel, H., Scheltens,
P., Tierney, M. C., Whitehouse, P., & Winblad, B. 2006. Mild cognitive impairment. The Lancet 367: 1262-
1270.
Gill, D.P., Grogory, M.A., Zou, G., Liu-Amborse, T., Shigenmatsu, R., Hachinski, V., Fitzgerald, C., &
Petrella, R.J. 2016. The healthy mind, healthy mobility trial: a novel exercise program for older adults.
Med Sci Sports Exerc 48(2): 297-306.
Health Quality Council of Alberta. 2014. 2014 Alberta population norms for EQ-5D-5L. Retrieved from:
http://hqca.ca/studies-and-reviews/health-outcomes-measurement/

32
Laver, K., Dyer, S., Whitehead, C., Clemson, L., & Crotty, M. 2016. Interventions to daily functional
decline in people with dementia: a systematic review of systematic reviews. BMJ Open 6:e010767. Doi:
10.1136/bmjopen-2015-010767.
McClure N, Al Sayah F, Xie F, Luo N, & Johnson JA. 2015. Instrument-defined estimates of minimally
important difference in EQ-5D-5L index score for Canadian, Chinese and Spanish scoring algorithms.
ISOQOL 22nd Annual Conference, Vancouver, Canada, October 21-24, 2015.
Park, S., Sun Han, K., & Kang, C. 2014. Effects of exercise programs on depressive symptoms, quality of
life, and self-esteem in older people: a systematic review of randomized controlled trials. Applied Nursing
Research 27(4): 2019-226.
Perera, S., Mody, S.H., Woodman, R.C., & Studenski, S.A., 2006. Meaningful change and responsiveness
in common physical performance measures in older adults. Journal of the American Geriatric Society
54(5): 743-749.
Prochaska, J. O. & DiClemente, C. C. 1983. Stages and processes of self-change of smoking: Toward an
integrative model of change. Journal of Consulting and Clinical Psychology 51: 390-395.
Prochaska, J.O., DiClemente, C.C., & Norcross, J.C. 1992. In search of how people change: Applications to
the addictive behaviors. American Psychologist 47: 1102-1114.
Ries, J.D., Echternach, J.L., Nof, L., & Gagnon Blodgett, M. 2009. Test-retest reliability and minimal
detectable change scores for the timed “up & go” test, the six-minute walk test, and gait speed in people
with Alzheimer disease. Physical Therapy 89(6): 569-579.
Solway, S., Brooks D., Lacasse Y. & Thomas S. 2001. A qualitative systematic overview of the
measurement properties of functional walk tests used in the cardiorespiratory domain. Chest 119: 256-
270.
Vergheese, J., Lipton, R.B., Katz, M.J., Hall, C.B., Derby, C.A., Kuslansky, G., Ambrose, A.F., Sliwinski, M.,
& Buschke, H. 2003. Leisure activities and the risk of dementia in the elderly. The New England Journal of
Medicine 348: 2508-2516.


![[Slideshare] tafaqqahu-#6-(january-2017)-lesson-#1-introduction-to-restart module-(7-january-2017)](https://static.fdocuments.us/doc/165x107/587271f61a28ab31498b6c41/slideshare-tafaqqahu-6-january-2017-lesson-1-introduction-to-restart.jpg)


