January 7 2010 Attribution of Evolving Climate Conditions Outline for Today’s Call Preliminary...
31
January 7 2010 ribution of Evolving Climate Condi Outline for Today’s Call Preliminary Assessment of 2009 Climate ° NCDC Snow Cover Conditions…Plenty to Shovel ° ESRL Northern Annual Mode…Off the Charts ° ESRL Cooling of NH Extr SSTs…Possible Consequenc ° ESRL 1
-
Upload
phebe-newton -
Category
Documents
-
view
215 -
download
1
Transcript of January 7 2010 Attribution of Evolving Climate Conditions Outline for Today’s Call Preliminary...
January 7 2010
Attribution of Evolving Climate Conditions
Outline for Today’s Call
Preliminary Assessment of 2009 Climate° NCDC Snow Cover Conditions…Plenty to Shovel° ESRL Northern Annual Mode…Off the Charts° ESRL Cooling of NH Extr SSTs…Possible Consequence° ESRL
1
2
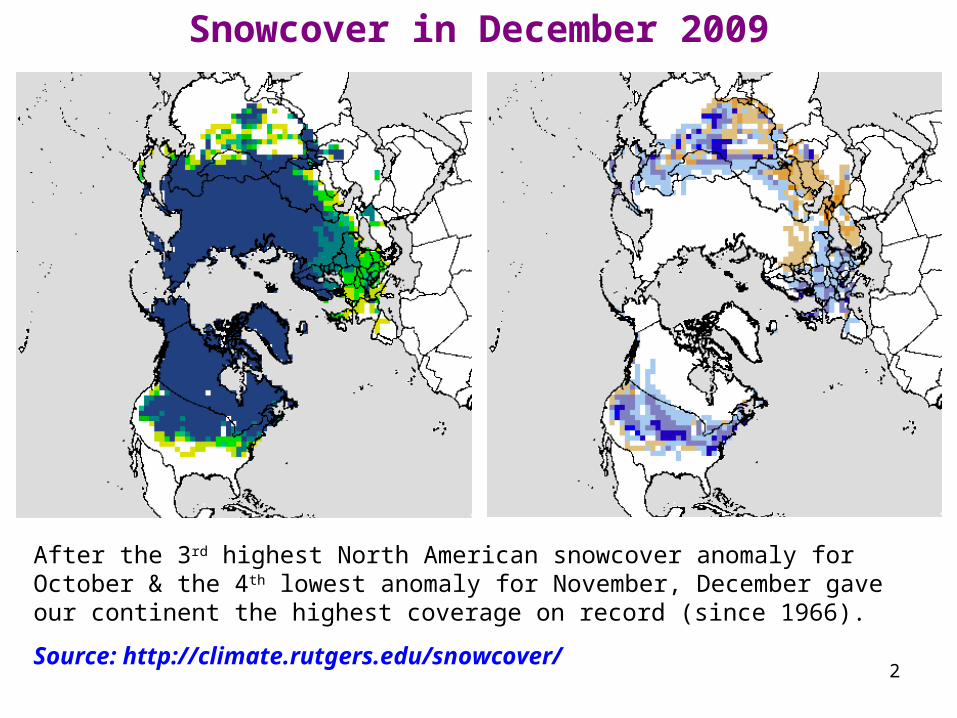
Snowcover in December 2009
After the 3rd highest North American snowcover anomaly for October & the 4th lowest anomaly for November, December gave our continent the highest coverage on record (since 1966).
Source: http://climate.rutgers.edu/snowcover/
3
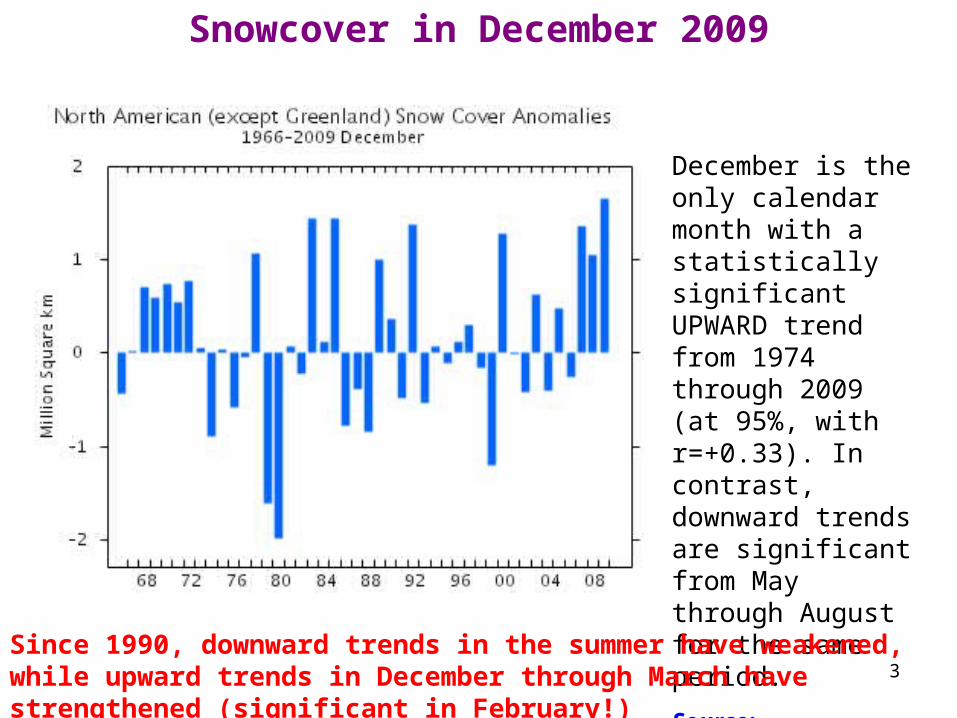
Snowcover in December 2009
December is the only calendar month with a statistically significant UPWARD trend from 1974 through 2009 (at 95%, with r=+0.33). In contrast, downward trends are significant from May through August for the same period.
Source: http://climate.rutgers.edu/snowcover/
Since 1990, downward trends in the summer have weakened, while upward trends in December through March have strengthened (significant in February!)
4
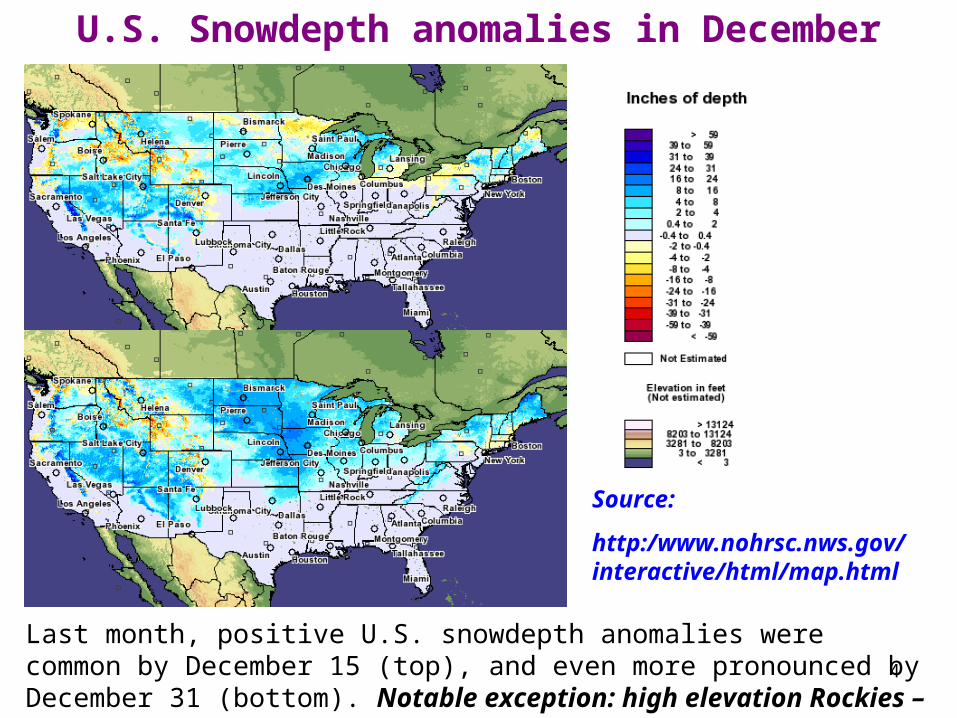
U.S. Snowdepth anomalies in December
Last month, positive U.S. snowdepth anomalies were common by December 15 (top), and even more pronounced by December 31 (bottom). Notable exception: high elevation Rockies – consistent with El Niño impacts.
Source:
http:/www.nohrsc.nws.gov/interactive/html/map.html
5
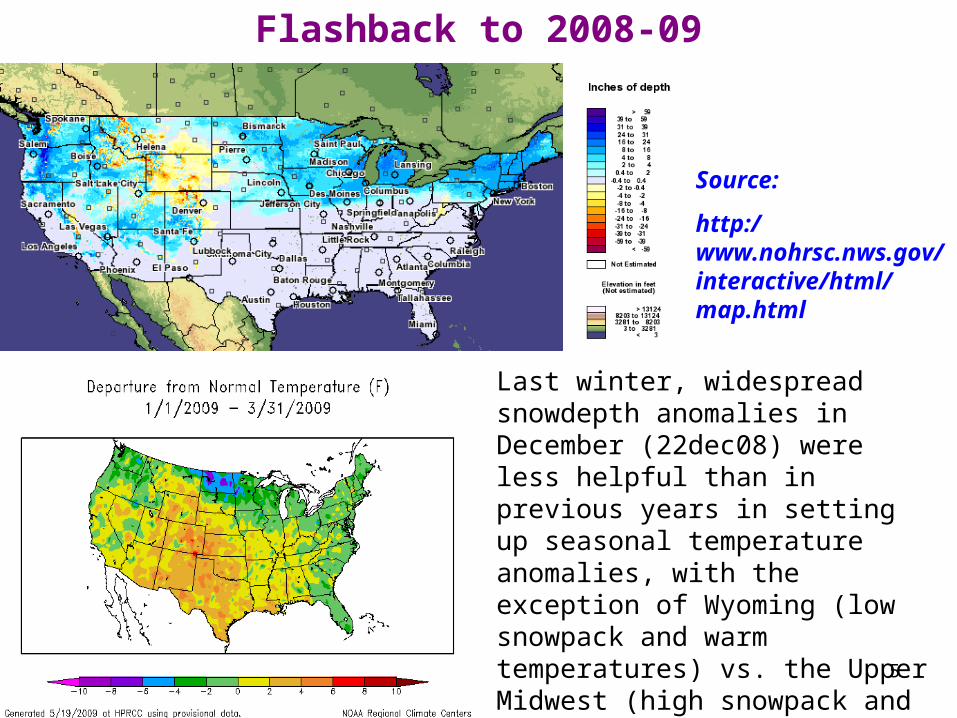
Flashback to 2008-09
Last winter, widespread snowdepth anomalies in December (22dec08) were less helpful than in previous years in setting up seasonal temperature anomalies, with the exception of Wyoming (low snowpack and warm temperatures) vs. the Upper Midwest (high snowpack and cold temperatures).
Source: http://www.hprcc.unl.edu/maps/current/
Source:
http:/www.nohrsc.nws.gov/interactive/html/map.html
6
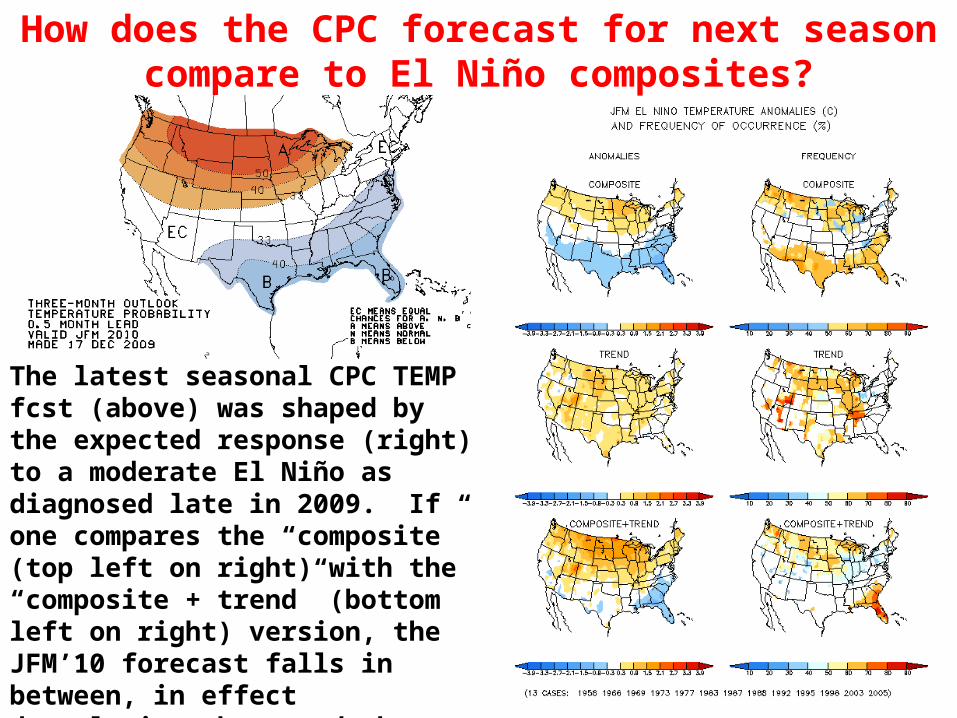
How does the CPC forecast for next season compare to El Niño composites?
The latest seasonal CPC TEMP fcst (above) was shaped by the expected response (right) to a moderate El Niño as diagnosed late in 2009. If one compares the “composite” (top left on right) with the “composite + trend” (bottom left on right) version, the JFM’10 forecast falls in between, in effect downplaying the trend that has been ‘unreliable’ in recent years (‘OCN’ skill poor).
7
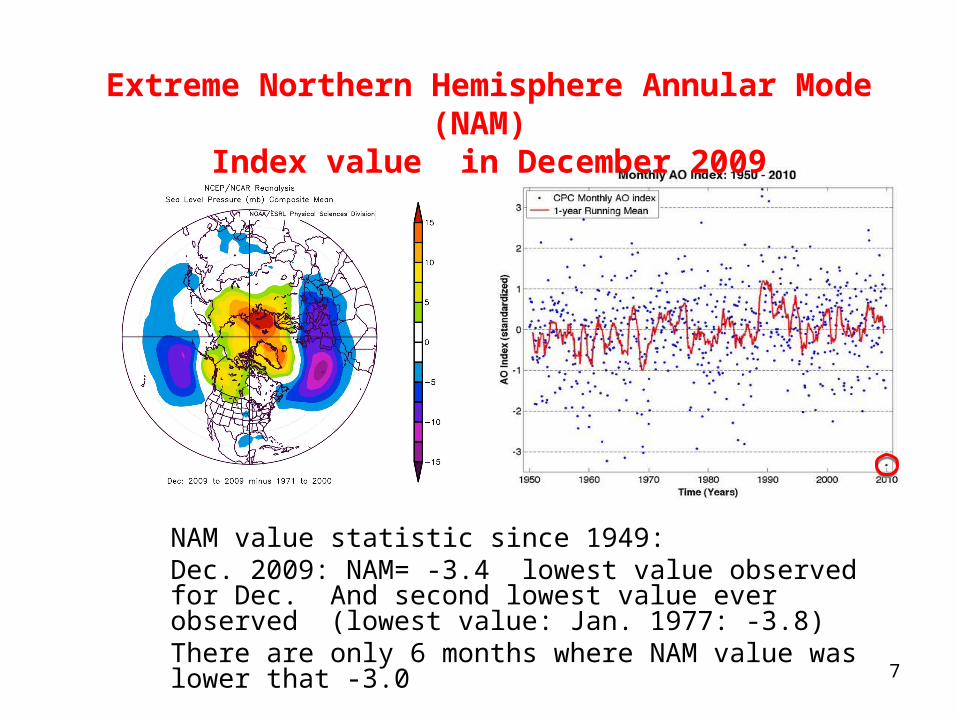
NAM value statistic since 1949: Dec. 2009: NAM= -3.4 lowest value observed for Dec. And second lowest value ever observed (lowest value: Jan. 1977: -3.8)There are only 6 months where NAM value was lower that -3.0
Extreme Northern Hemisphere Annular Mode (NAM) Index value in December 2009
8
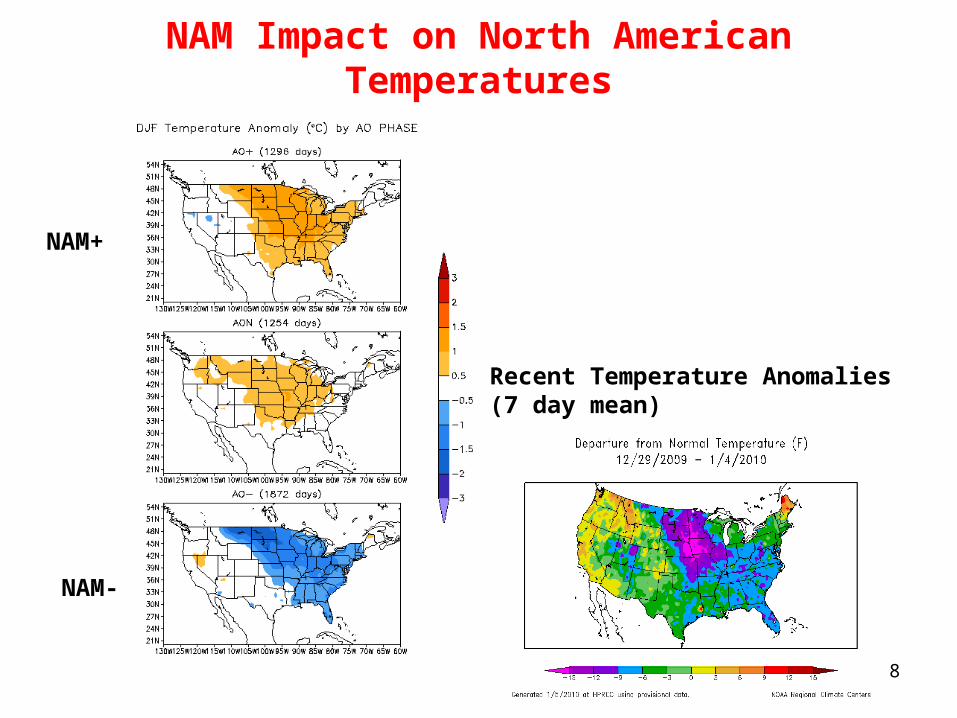
NAM Impact on North American Temperatures
NAM+
NAM-
Recent Temperature Anomalies (7 day mean)
9
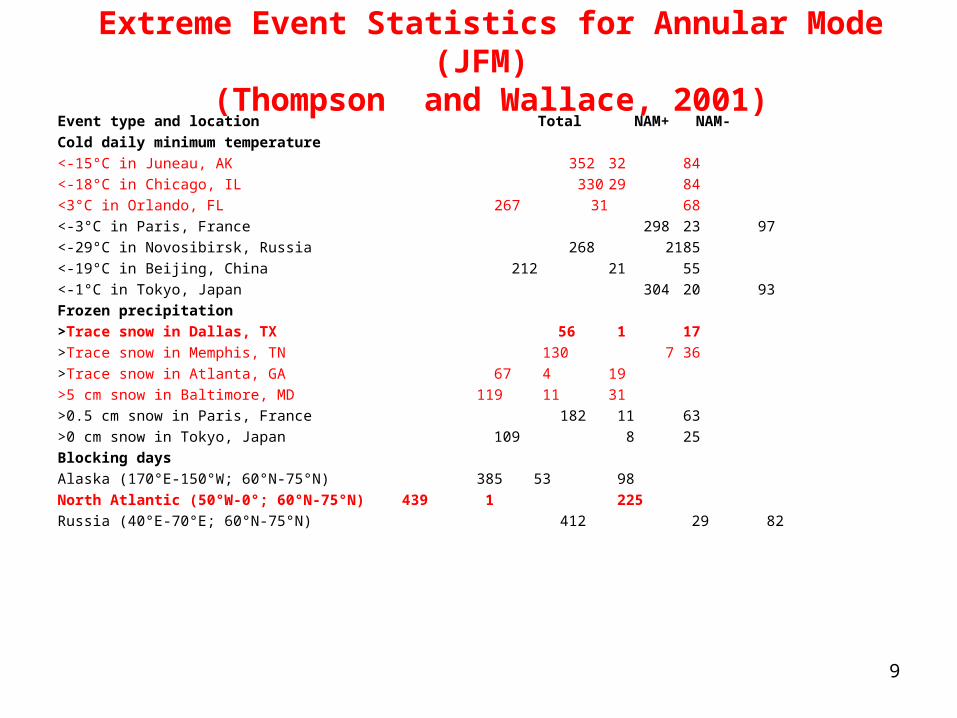
Extreme Event Statistics for Annular Mode (JFM) (Thompson and Wallace, 2001)
Event type and location Total NAM+ NAM-
Cold daily minimum temperature
<-15°C in Juneau, AK 352 32 84
<-18°C in Chicago, IL 330 29 84
<3°C in Orlando, FL 267 31 68
<-3°C in Paris, France 298 23 97
<-29°C in Novosibirsk, Russia 268 21 85
<-19°C in Beijing, China 212 21 55
<-1°C in Tokyo, Japan 304 20 93
Frozen precipitation
>Trace snow in Dallas, TX 56 1 17
>Trace snow in Memphis, TN 130 7 36
>Trace snow in Atlanta, GA 67 4 19
>5 cm snow in Baltimore, MD 119 11 31
>0.5 cm snow in Paris, France 182 11 63
>0 cm snow in Tokyo, Japan 109 8 25
Blocking days
Alaska (170°E-150°W; 60°N-75°N) 385 53 98
North Atlantic (50°W-0°; 60°N-75°N) 439 1 225
Russia (40°E-70°E; 60°N-75°N) 412 29 82
10
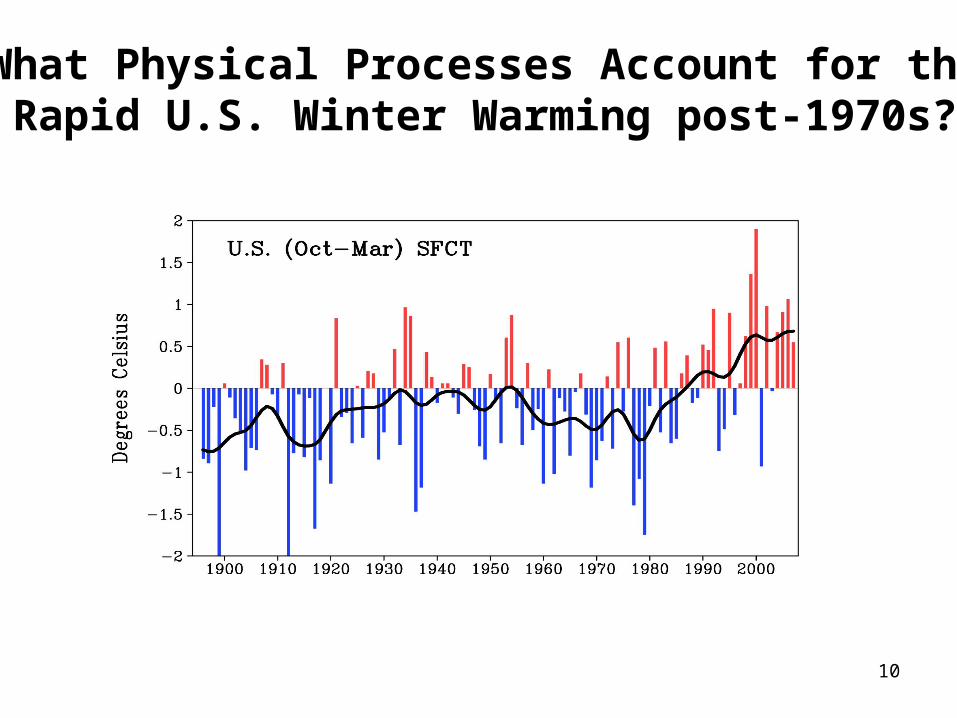
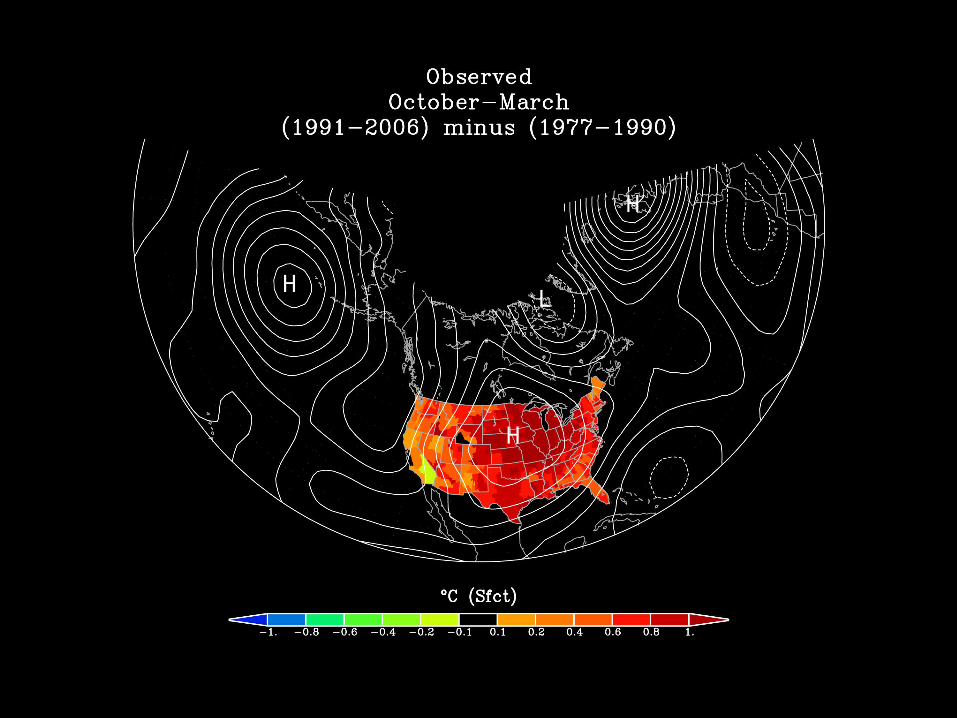
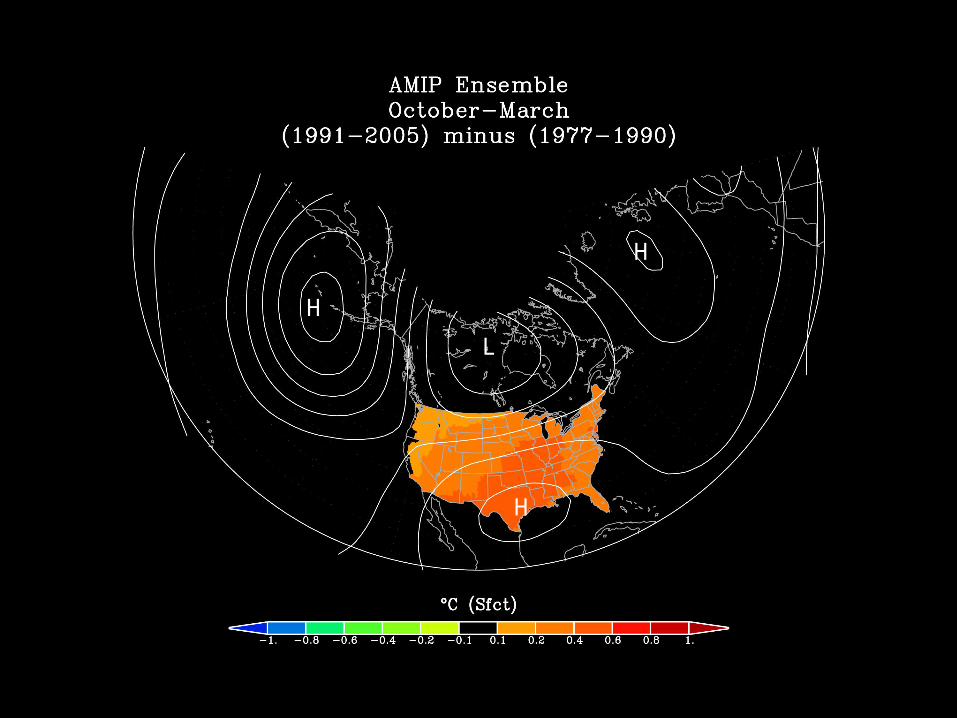
What Physical Processes Account for the Rapid U.S. Winter Warming post-1970s?
11
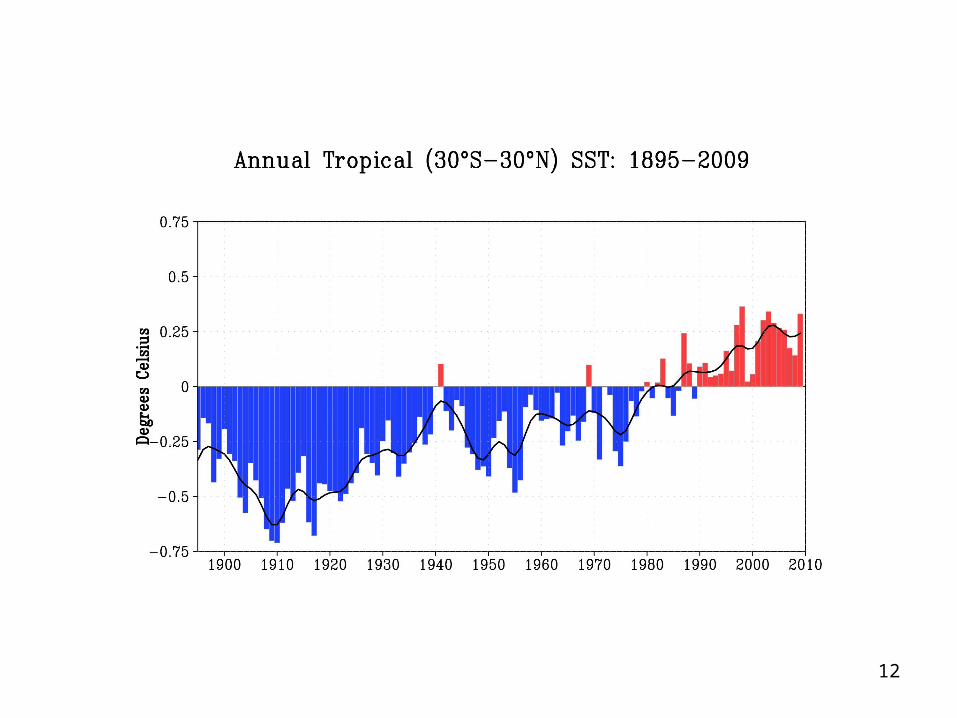
12
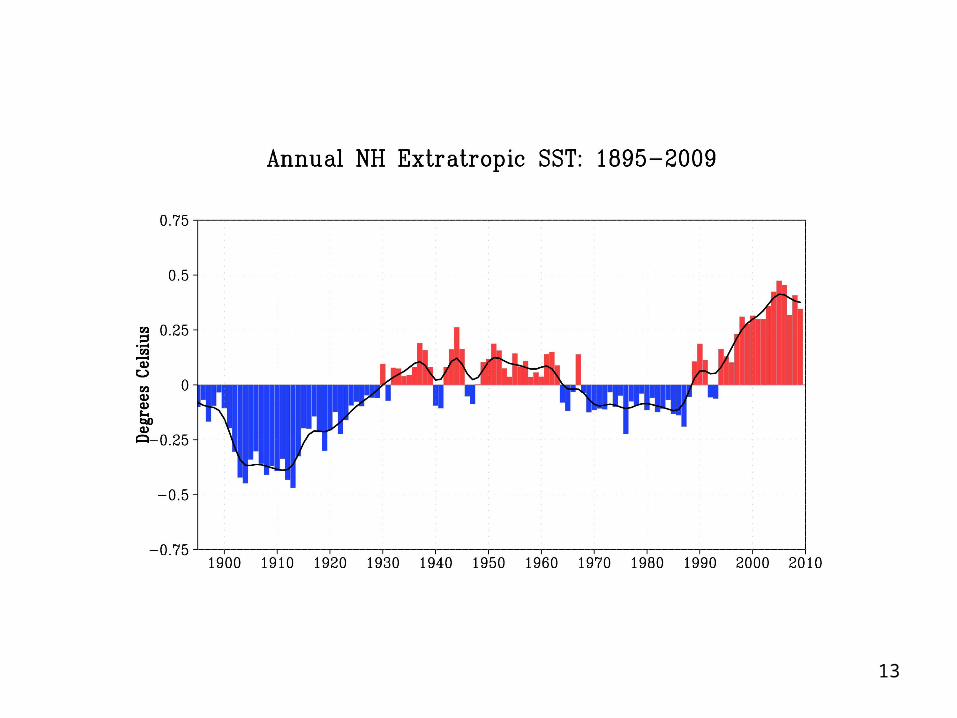
13
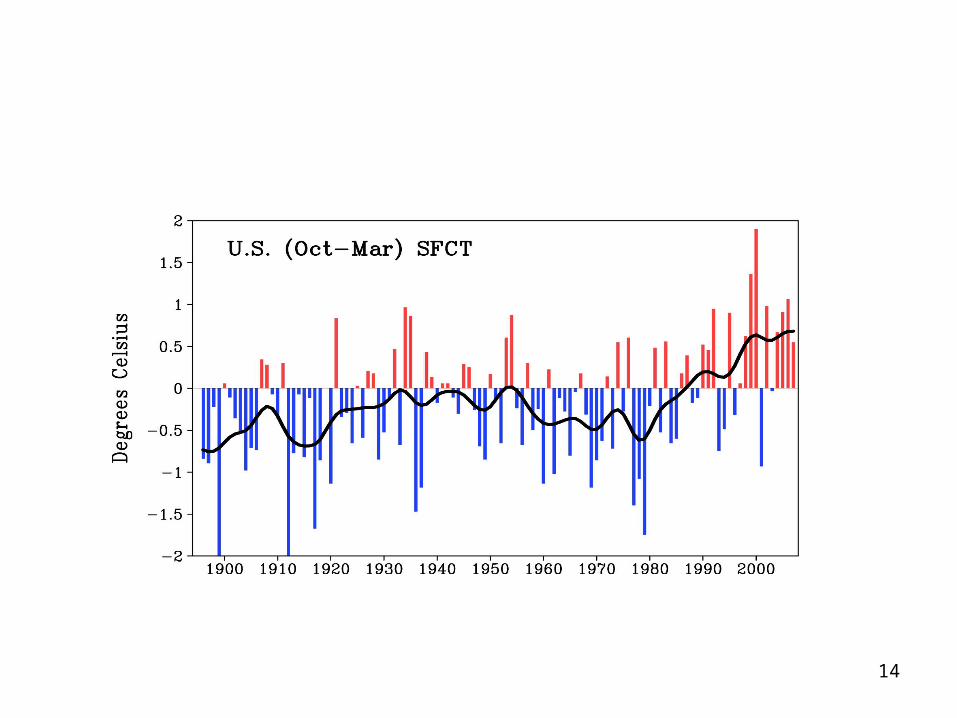
14
H
H
H
L
15
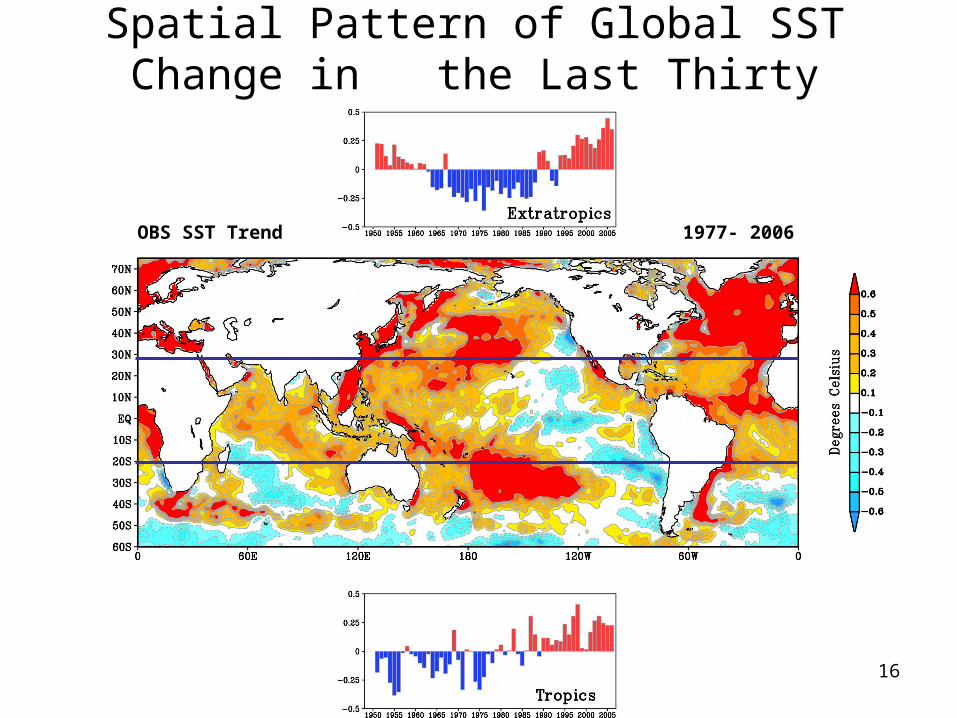
Spatial Pattern of Global SST Change in the Last Thirty
Years
OBS SST Trend 1977- 2006
16
Q1: Is the Atmospheric Circulation Change TheImmediate Cause for the Recent US Warming?
Q2: If so, What Has Caused the Circulation?What, if any, Effect by SST Changes?
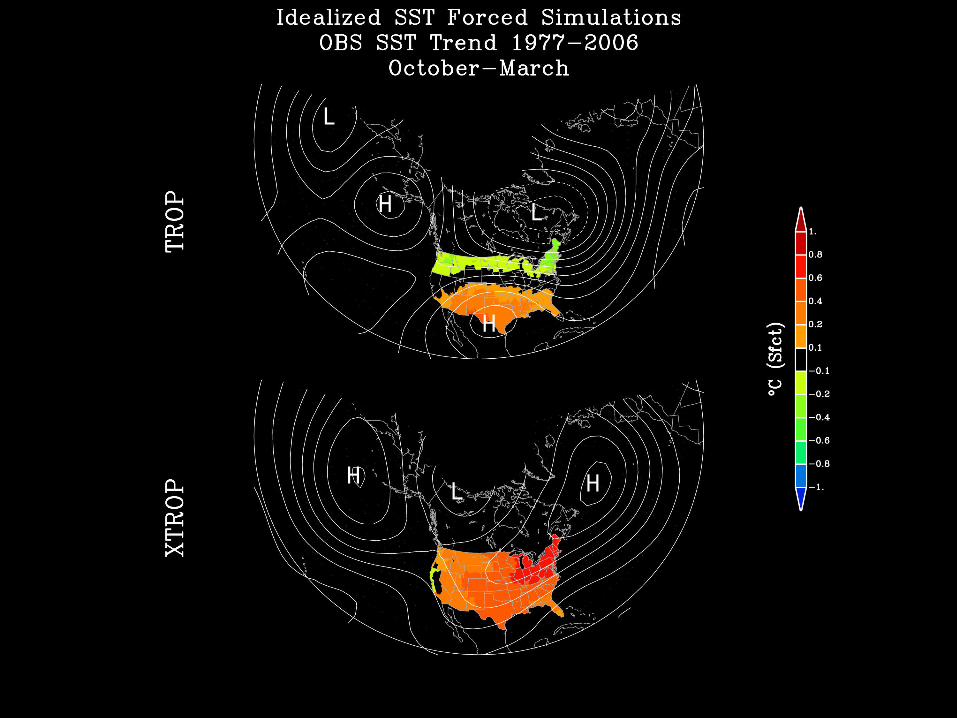
To assess the relation between circulation,SST and US sfcT, we diagnose the following:
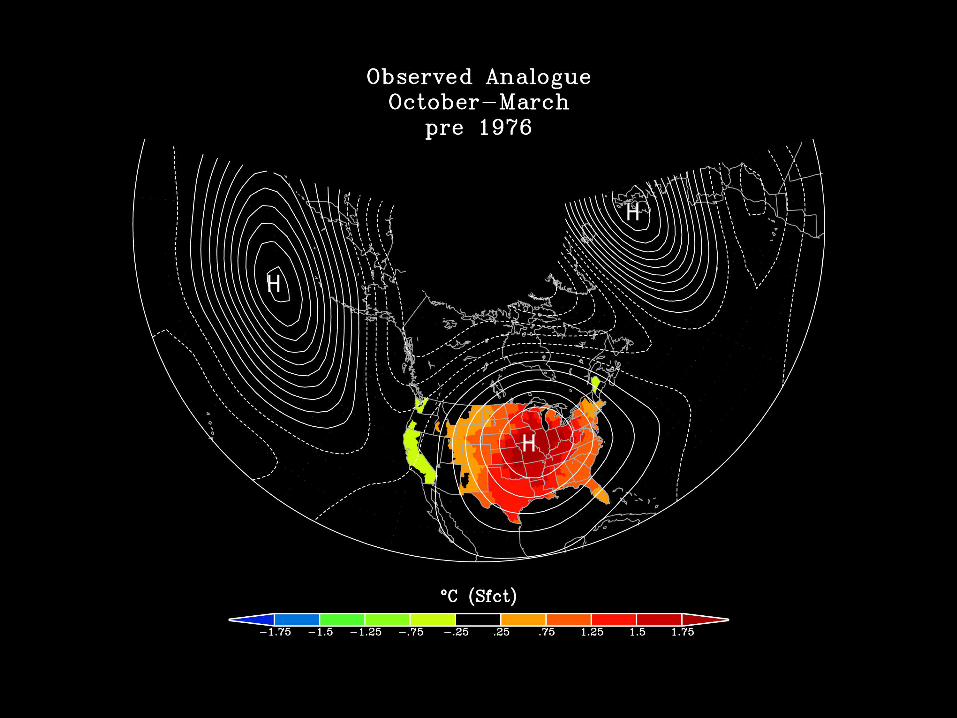
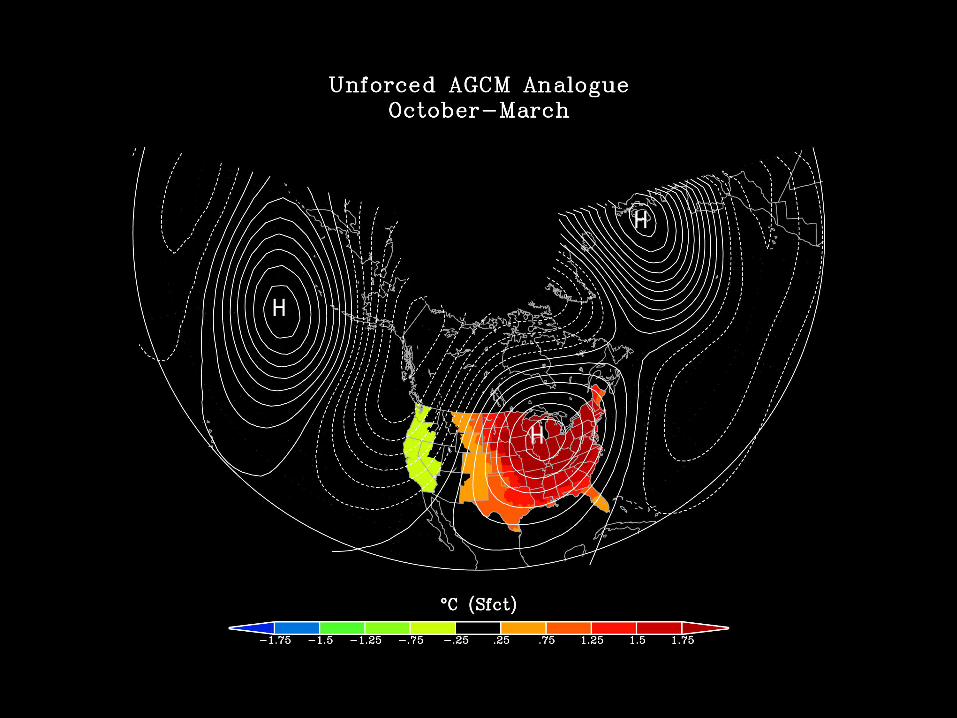
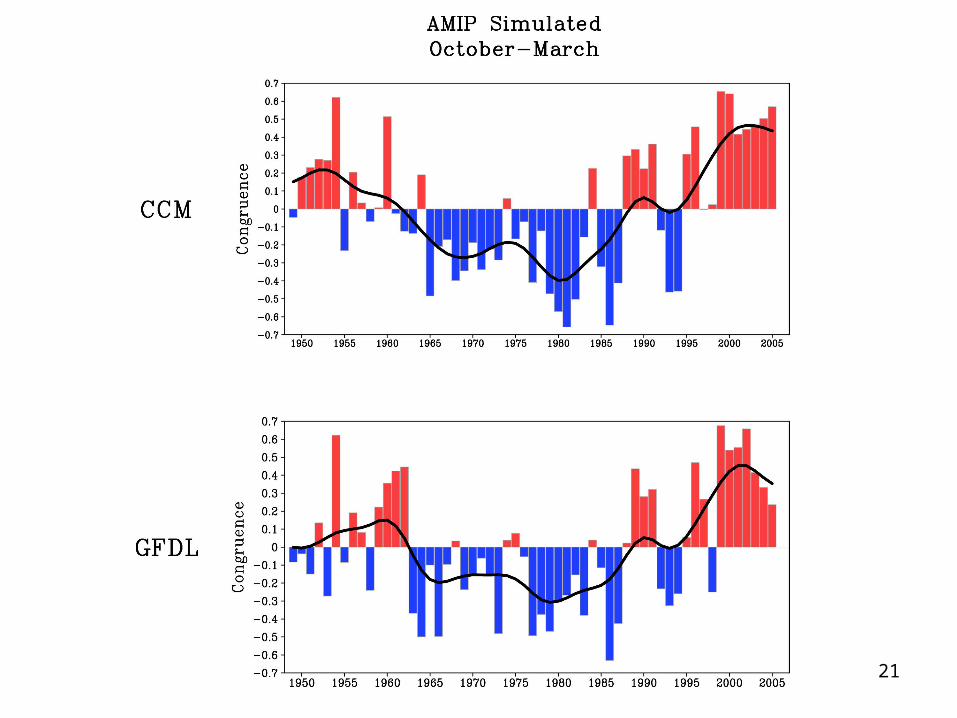
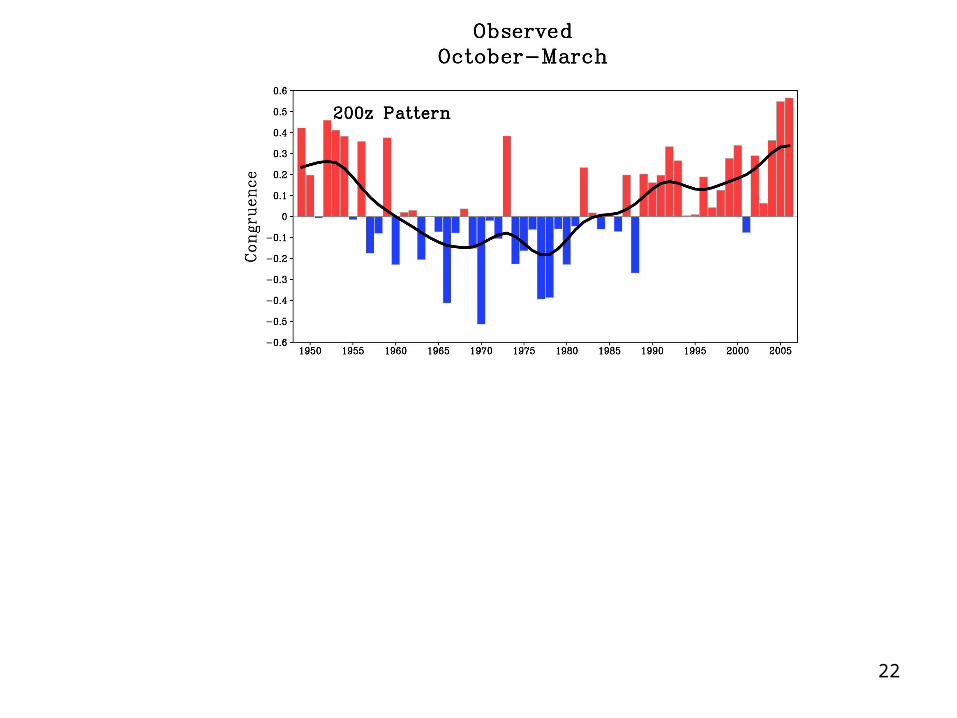
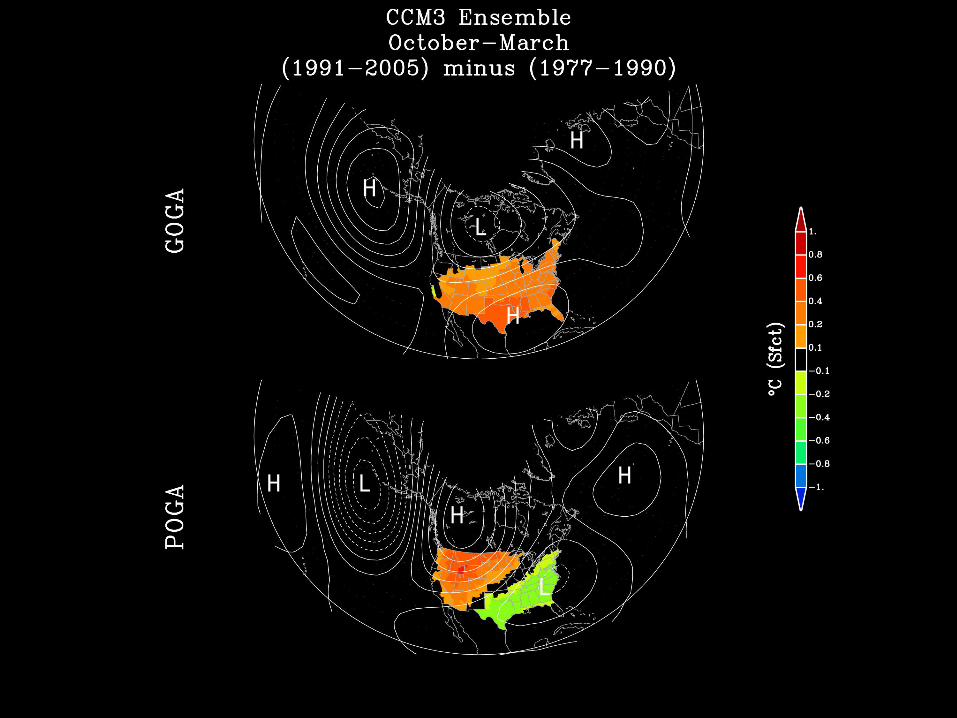
° Observed circulation analogues: pre-1976.° AGCM analogues from unforced control simulations.° AGCM simulations driven by SST changes post-1976
17
H
H
H
18
H
H
H
19
H
H
H
L
20
L
21
22
L
H
H
H
L
H
HH L
L
23
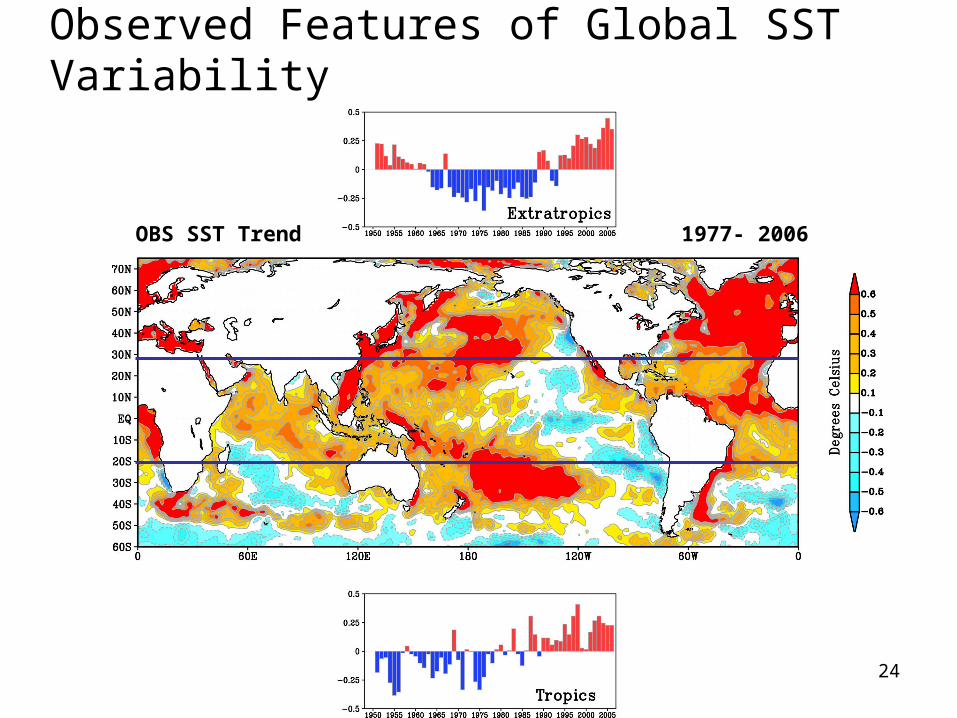
Observed Features of Global SST Variability
OBS SST Trend 1977- 2006
24
25
L
H
H
L
L
LH H
26
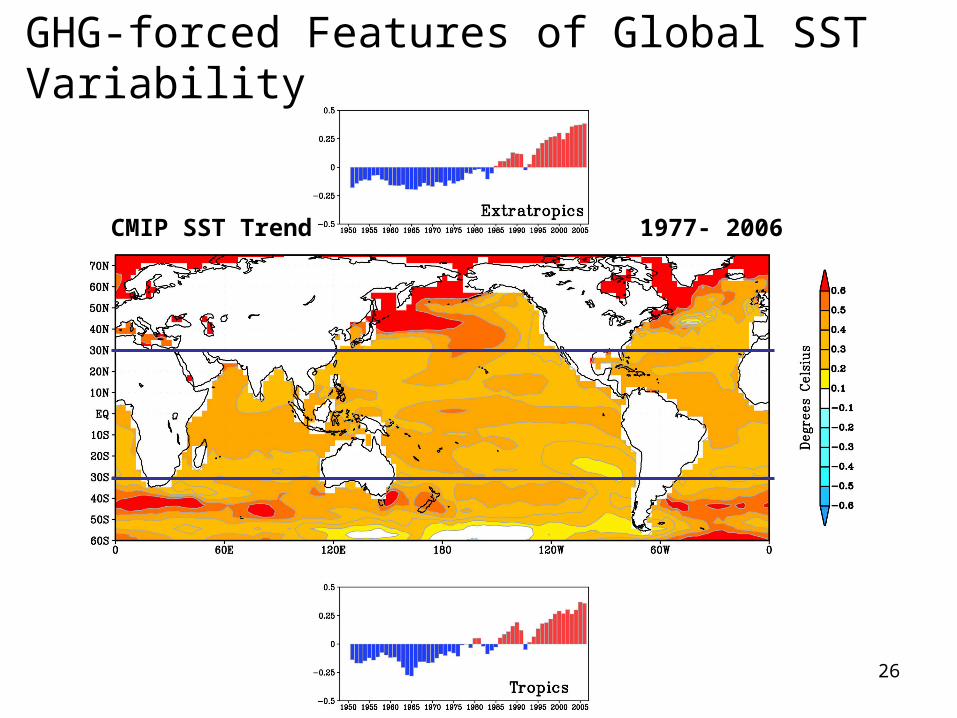
GHG-forced Features of Global SST Variability
CMIP SST Trend 1977- 2006
27
H
H
H
H
L
L
L
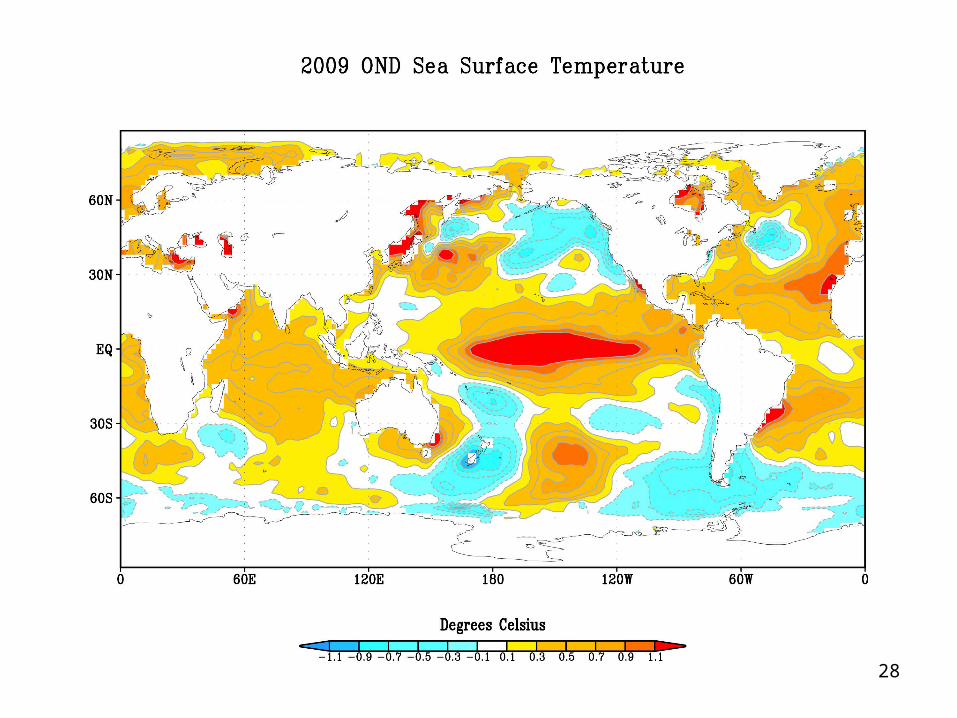
28
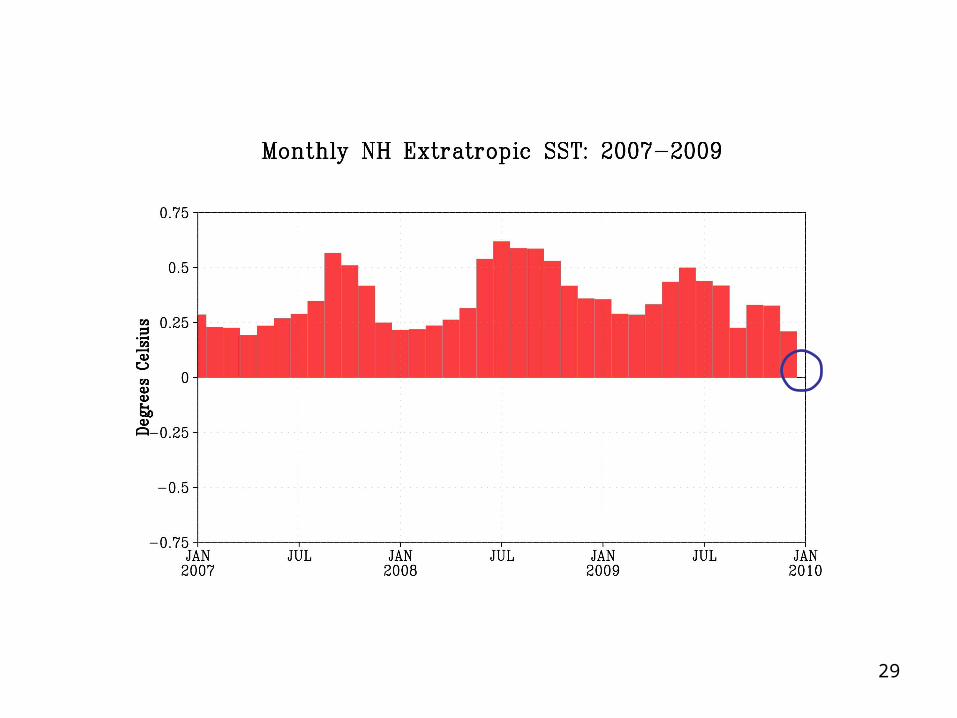
29
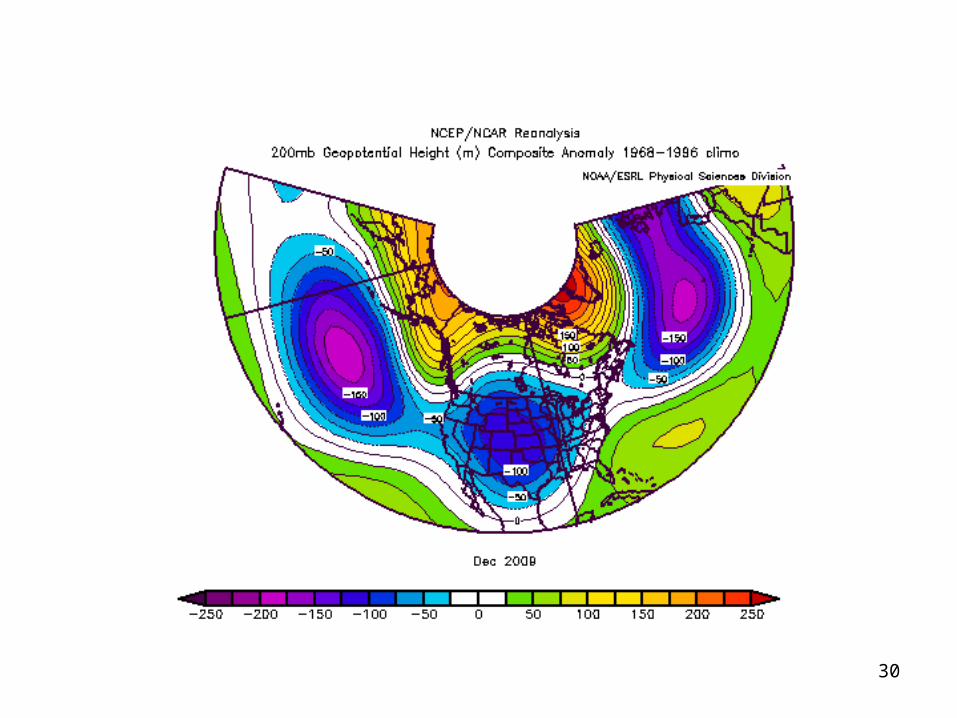
30
31
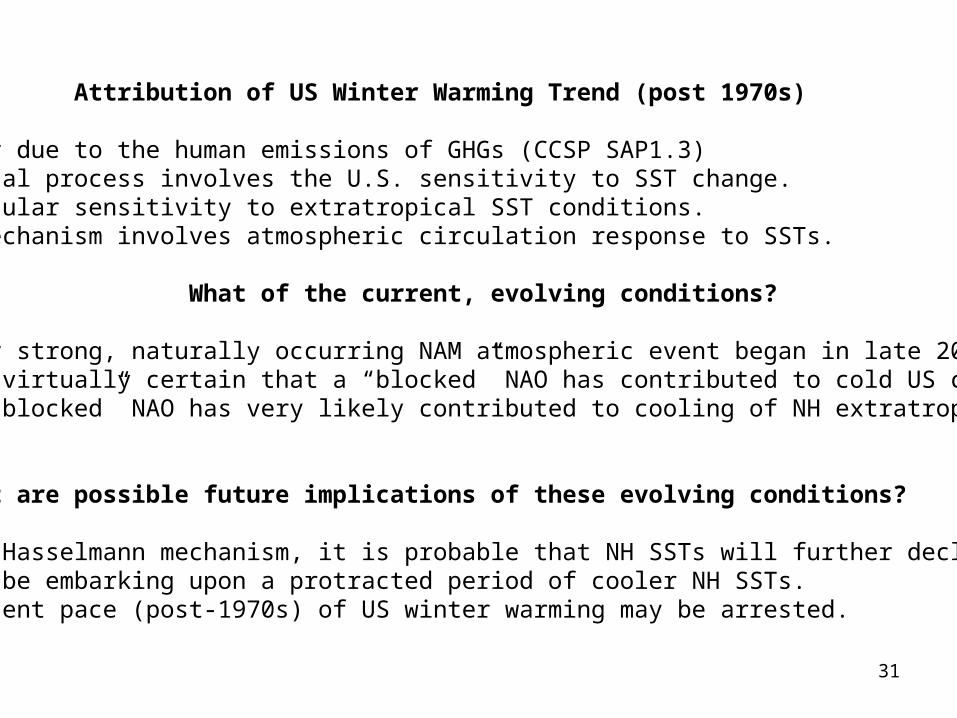
Attribution of US Winter Warming Trend (post 1970s)
° Likely due to the human emissions of GHGs (CCSP SAP1.3)° Physical process involves the U.S. sensitivity to SST change.° Particular sensitivity to extratropical SST conditions.° The mechanism involves atmospheric circulation response to SSTs.
What of the current, evolving conditions?
° A very strong, naturally occurring NAM atmospheric event began in late 2009° It is virtually certain that a “blocked” NAO has contributed to cold US conditions.° This “blocked” NAO has very likely contributed to cooling of NH extratropical SSTs
What are possible future implications of these evolving conditions?
° As per Hasselmann mechanism, it is probable that NH SSTs will further decline.° We may be embarking upon a protracted period of cooler NH SSTs.° The recent pace (post-1970s) of US winter warming may be arrested.