January 30, 2019aapa.files.cms-plus.com/2019Seminars/Shifting/AAPA2019_Hurwitz_FINAL.pdfVessel...
28
2019 AAPA Planning for Shifting Trade – Tampa, FL Joshua Hurwitz January 30, 2019
Transcript of January 30, 2019aapa.files.cms-plus.com/2019Seminars/Shifting/AAPA2019_Hurwitz_FINAL.pdfVessel...
2019 AAPA Planning for Shifting Trade – Tampa, FL
Joshua Hurwitz
January 30, 2019
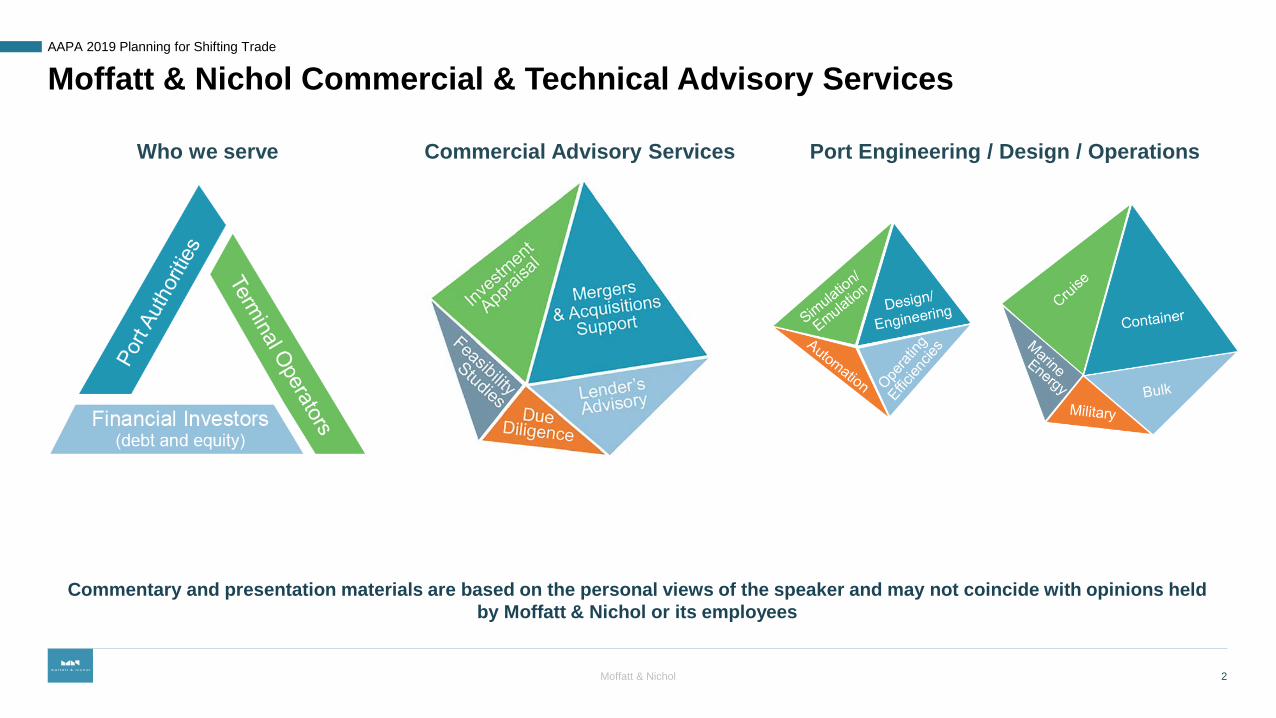
Moffatt & Nichol Commercial & Technical Advisory Services
Who we serve Port Engineering / Design / Operations
2
AAPA 2019 Planning for Shifting Trade
Commercial Advisory Services
Moffatt & Nichol
Commentary and presentation materials are based on the personal views of the speaker and may not coincide with opinions held by Moffatt & Nichol or its employees
Agenda
1. You don't know where you're going until you know where you've been2. We don’t know what will happen in the future, but we know what may happen
and therefore can plan for it3. Ports are, and should be, champions of infrastructure development4. Conclusion
3
AAPA 2019 Planning for Shifting Trade
Moffatt & Nichol
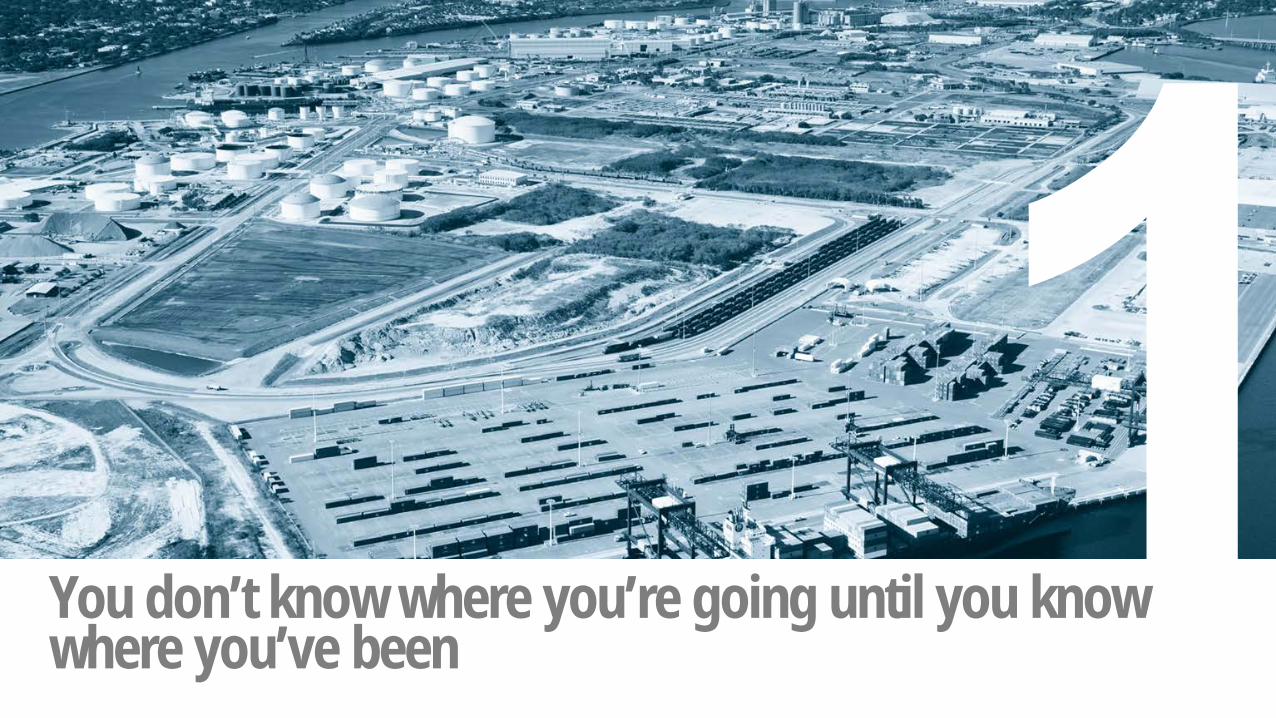
You don’t know where you’re going until you know where you’ve been
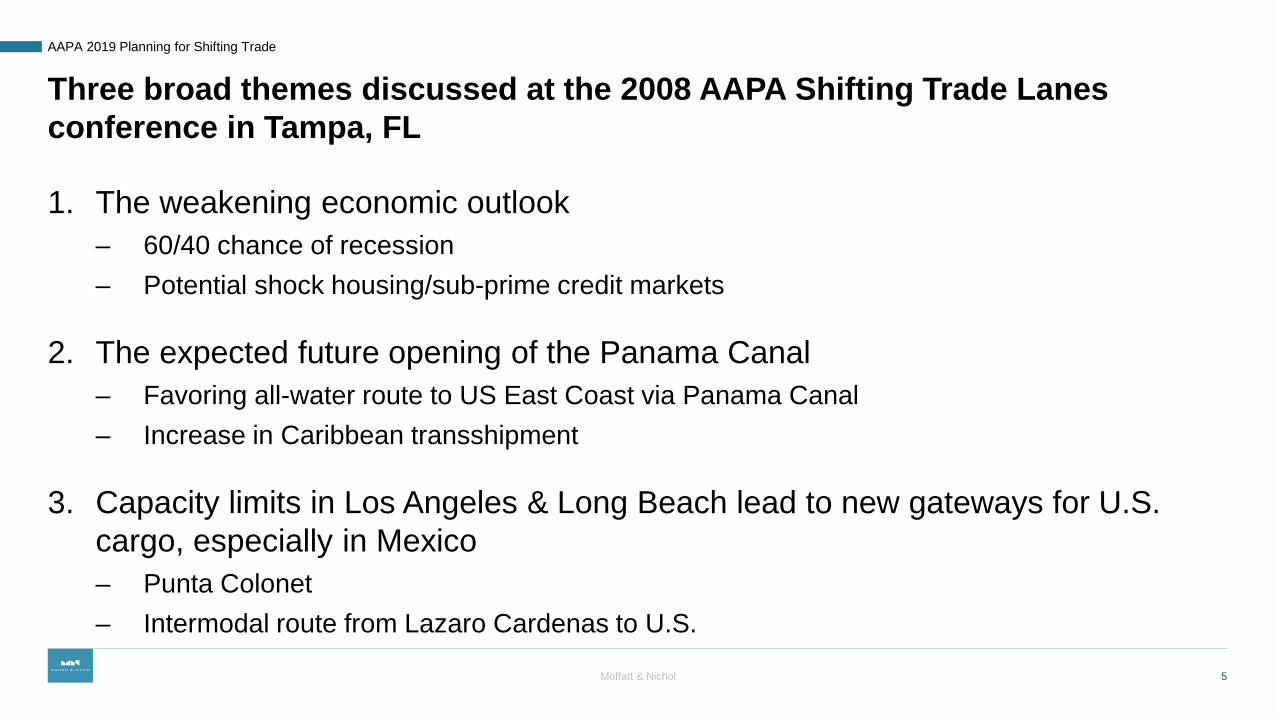
Three broad themes discussed at the 2008 AAPA Shifting Trade Lanes conference in Tampa, FL
1. The weakening economic outlook– 60/40 chance of recession– Potential shock housing/sub-prime credit markets
2. The expected future opening of the Panama Canal– Favoring all-water route to US East Coast via Panama Canal– Increase in Caribbean transshipment
3. Capacity limits in Los Angeles & Long Beach lead to new gateways for U.S. cargo, especially in Mexico– Punta Colonet– Intermodal route from Lazaro Cardenas to U.S.
5
AAPA 2019 Planning for Shifting Trade
Moffatt & Nichol
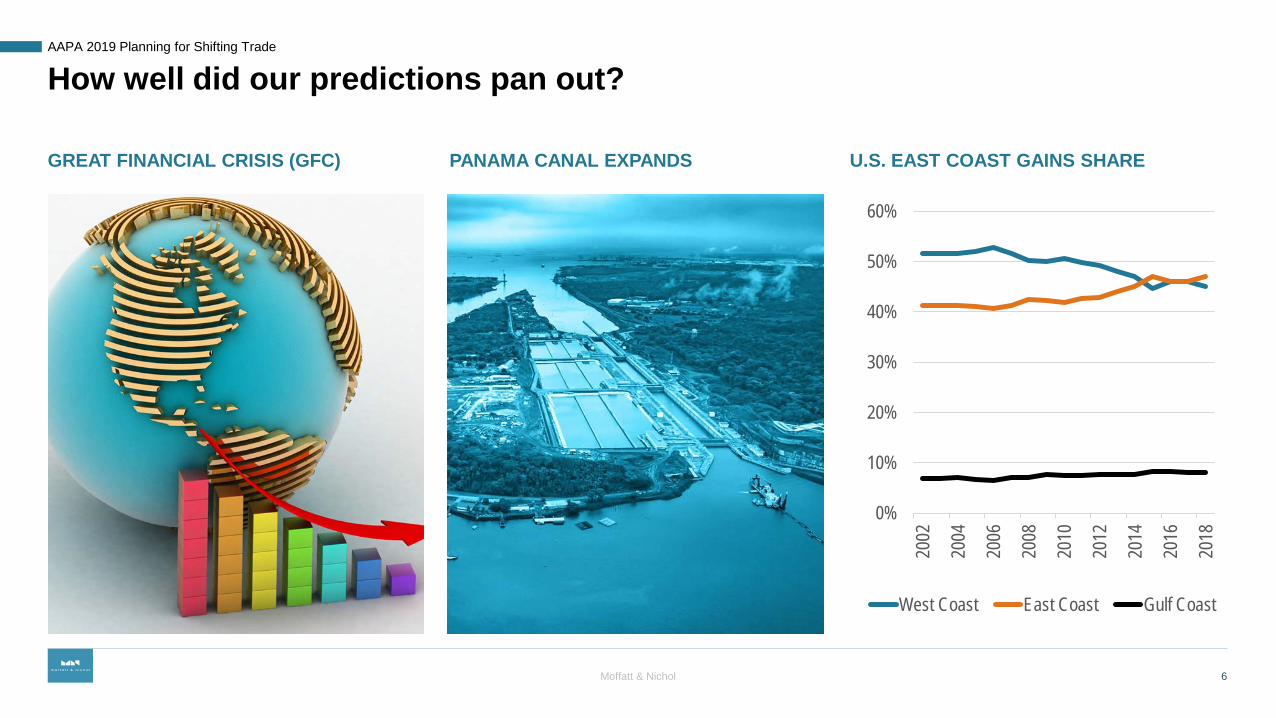
How well did our predictions pan out?
GREAT FINANCIAL CRISIS (GFC) U.S. EAST COAST GAINS SHARE
6
AAPA 2019 Planning for Shifting Trade
PANAMA CANAL EXPANDS
Moffatt & Nichol
0%
10%
20%
30%
40%
50%
60%
2002
2004
2006
2008
2010
2012
2014
2016
2018
West Coast East Coast Gulf Coast

US container trade growth continues to outpace overall economic growth at roughly 1.8X GDP
U.S. TOTAL CONTAINER TRADE (2002 – 2018)
Source: AAPA; MN
U.S. CONTAINER TRADE GROWTH & GDP
1.0
1.5
2.0
2.5
3.0
3.5
4.0
-20%
-10%
0%
10%
20%
2002 2004 2006 2008 2010 2012 2014 2016 2018Mu
ltiplie
r
YOY%
Gro
wth
Multiplier (RHS) GDP Growth TEU GrowthSource: AAPA; MN
AAPA 2019 Planning for Shifting Trade
7
1.8X Avg Multiplier
3.0X Avg Multiplier
-
10
20
30
40
50
60
2002 2004 2006 2008 2010 2012 2014 2016 2018
TEU
(Milli
ons)
4.2% CAGR

Alliances dominate the Transpacific trade lane, less so on Transatlantic
SHARE OF ALLIANCE SERVICES FROM DEPLOYED CAPACITY
Source: Bluewater
AAPA 2019 Planning for Shifting Trade
8
0%
25%
50%
75%
100%
Global - TEU Trans Pacific - TEU Global - TEU Trans Pacific - TEU Trans Atlantic - TEU
Early 2012 2018 YTD (July)
No Alliance 2M Alliance THE Alliance OCEAN Alliance CKYH Alliance G6 Alliance Grand Alliance New World Alliance
Vast majority of Trans-Pac capacity is in alliance services
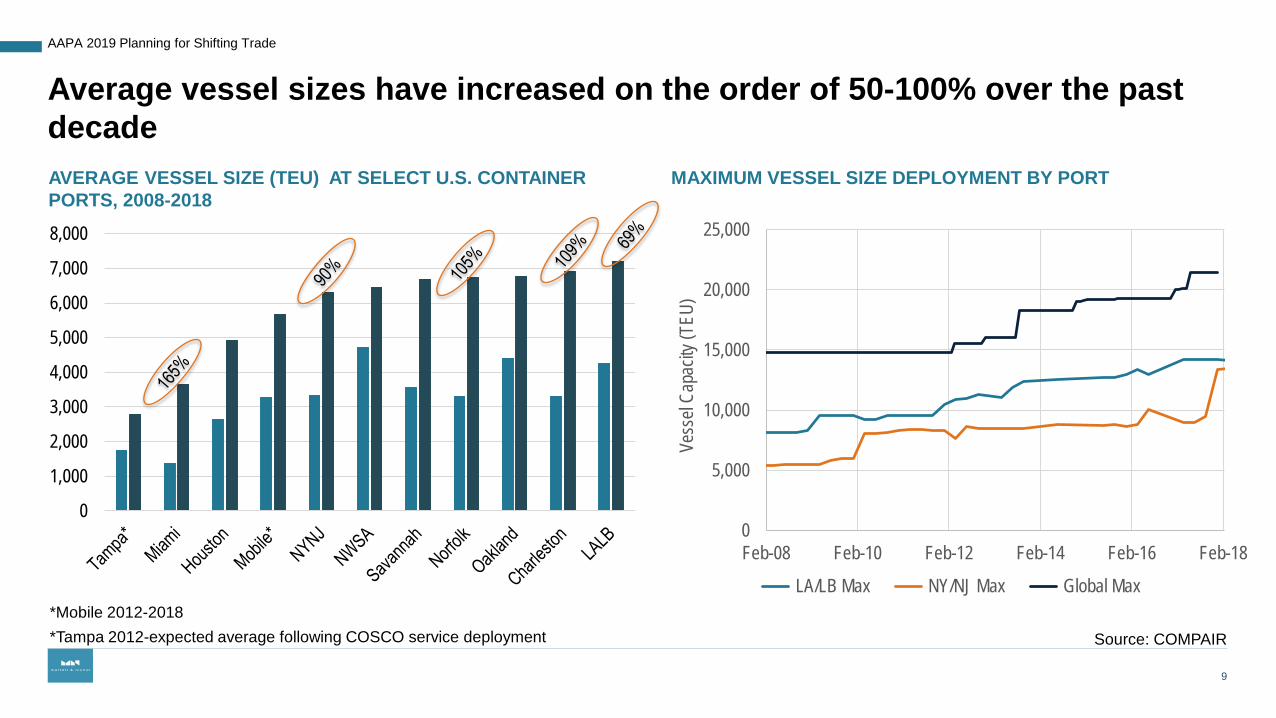
Average vessel sizes have increased on the order of 50-100% over the past decadeAVERAGE VESSEL SIZE (TEU) AT SELECT U.S. CONTAINER PORTS, 2008-2018
Source: COMPAIR
9
AAPA 2019 Planning for Shifting Trade
0
1,000
2,000
3,000
4,000
5,000
6,000
7,000
8,000
*Mobile 2012-2018 *Tampa 2012-expected average following COSCO service deployment
0
5,000
10,000
15,000
20,000
25,000
Feb-08 Feb-10 Feb-12 Feb-14 Feb-16 Feb-18
Vess
el Ca
pacit
y (TE
U)
LA/LB Max NY/NJ Max Global Max
MAXIMUM VESSEL SIZE DEPLOYMENT BY PORT

Liner Consolidation and Alliances
10
AAPA 2019 Planning for Shifting Trade
Moffatt & Nichol
COSCO acquires OOCL
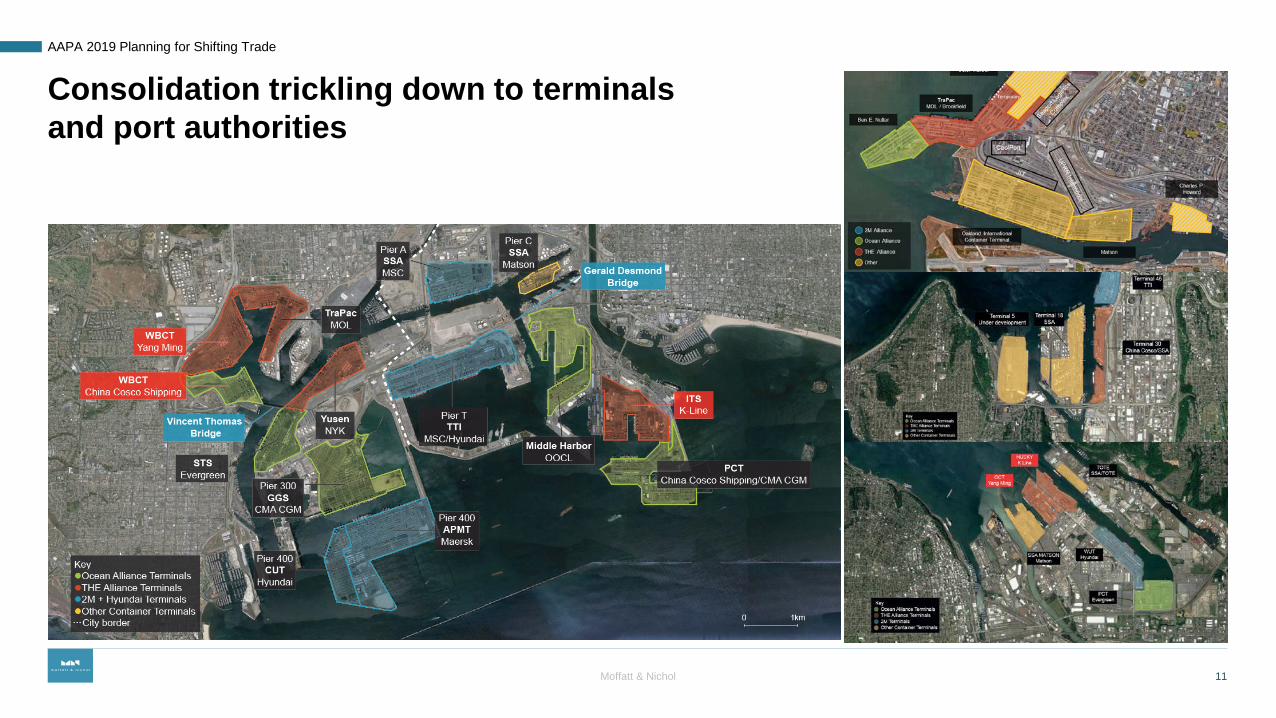
Consolidation trickling down to terminals and port authorities
11
AAPA 2019 Planning for Shifting Trade
Moffatt & Nichol
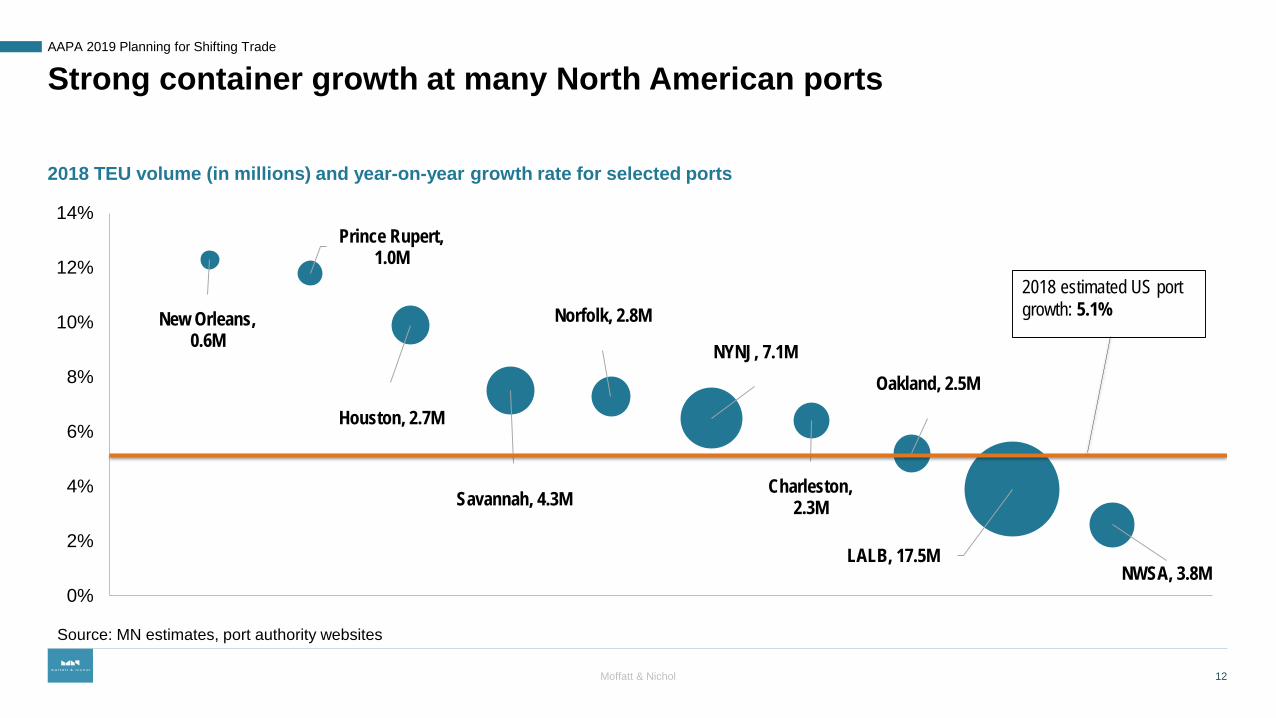
Strong container growth at many North American ports
New Orleans, 0.6M
Prince Rupert, 1.0M
Houston, 2.7M
Savannah, 4.3M
Norfolk, 2.8M
NYNJ, 7.1M
Charleston, 2.3M
Oakland, 2.5M
LALB, 17.5MNWSA, 3.8M
0%
2%
4%
6%
8%
10%
12%
14%
2018 estimated US port growth: 5.1%
12
AAPA 2019 Planning for Shifting Trade
2018 TEU volume (in millions) and year-on-year growth rate for selected ports
Moffatt & Nichol
Source: MN estimates, port authority websites

We don’t know what will happen in the future, but we know what may happen and therefore can plan for it

In the U.S., economic fundamentals look ok for now, but headwinds exist and policy uncertainty looms over the near term
14
-6%
-4%
-2%
0%
2%
4%
6%
115
120
125
130
135
140
145
150
155
2004 2006 2008 2010 2012 2014 2016 2018 2020
Payr
olls
(Milli
ons)
NonFarm Payrolls YOY%
AAPA 2019 Planning for Shifting Trade
Fed Funds Rate
0.0%
1.0%
2.0%
3.0%
4.0%
5.0%
6.0%
2004 2006 2008 2010 2012 2014 2016 2018 2020
Effe
ctiv
e Fe
d Fu
nds
Rat
e
Effective Fed Funds Rate
Retail Sales
-12%
-9%
-6%
-3%
0%
3%
6%
9%
12%
$-
$50
$100
$150
$200
$250
2004 2006 2008 2010 2012 2014 2016 2018 2020
Ret
ail S
ales
($Bi
llions
)
Retail Sales YOY%
New Home Sales
-50%-40%-30%-20%-10%0%10%20%30%40%50%
0
200
400
600
800
1000
1200
1400
2004 2006 2008 2010 2012 2014 2016 2018
New
Sal
es (T
hous
ands
)
New Home Sales YOY%
! !
Employment
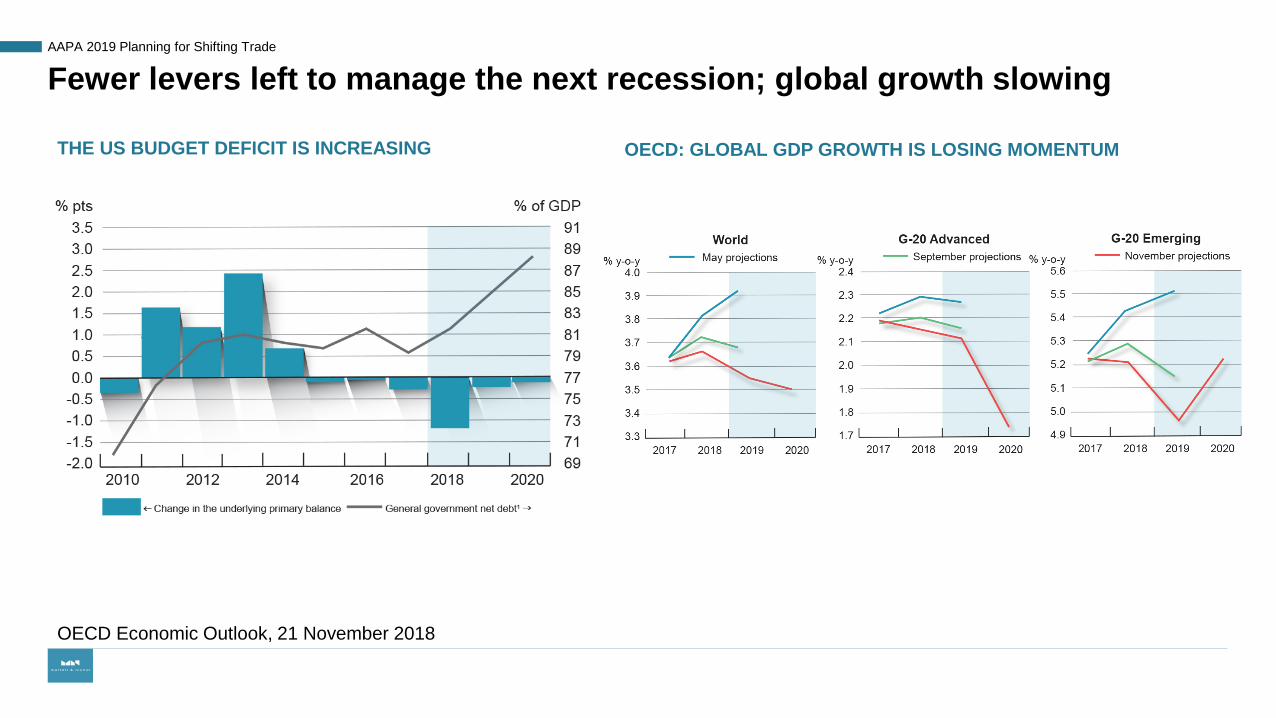
Fewer levers left to manage the next recession; global growth slowingAAPA 2019 Planning for Shifting Trade
THE US BUDGET DEFICIT IS INCREASING OECD: GLOBAL GDP GROWTH IS LOSING MOMENTUM
OECD Economic Outlook, 21 November 2018

1997 1998 1999 2000 2001 2002 2003 2004 2005 2006 2007 2008 2009 2010 2011 2012 2013 2014 2015 2016 2017 2018Global EPU Index
There is a lot of near-term uncertainty, but infrastructure is long-term
16
2019 AAPA Annual Conference
GLOBAL ECONOMIC POLICY UNCERTAINTY, JANUARY 1997 TO DECEMBER 2018
Source: PolicyUncertainty.com; Baker, Bloom and Davis
Moffatt & Nichol
Asian & Russian Financial Crises
9/11 Invasion of Iraq
Global Financial Crisis
Eurozone Crisis, U.S. Fiscal Battles, China Leadership Transition
Brexit Referendum
Immigration Crisis, China
Economy Fears
U.S. Elections & Politics in Brazil, China, France, South Korea and the UK
Shifting global economy, Brexit, US
government shutdown, tariff policy
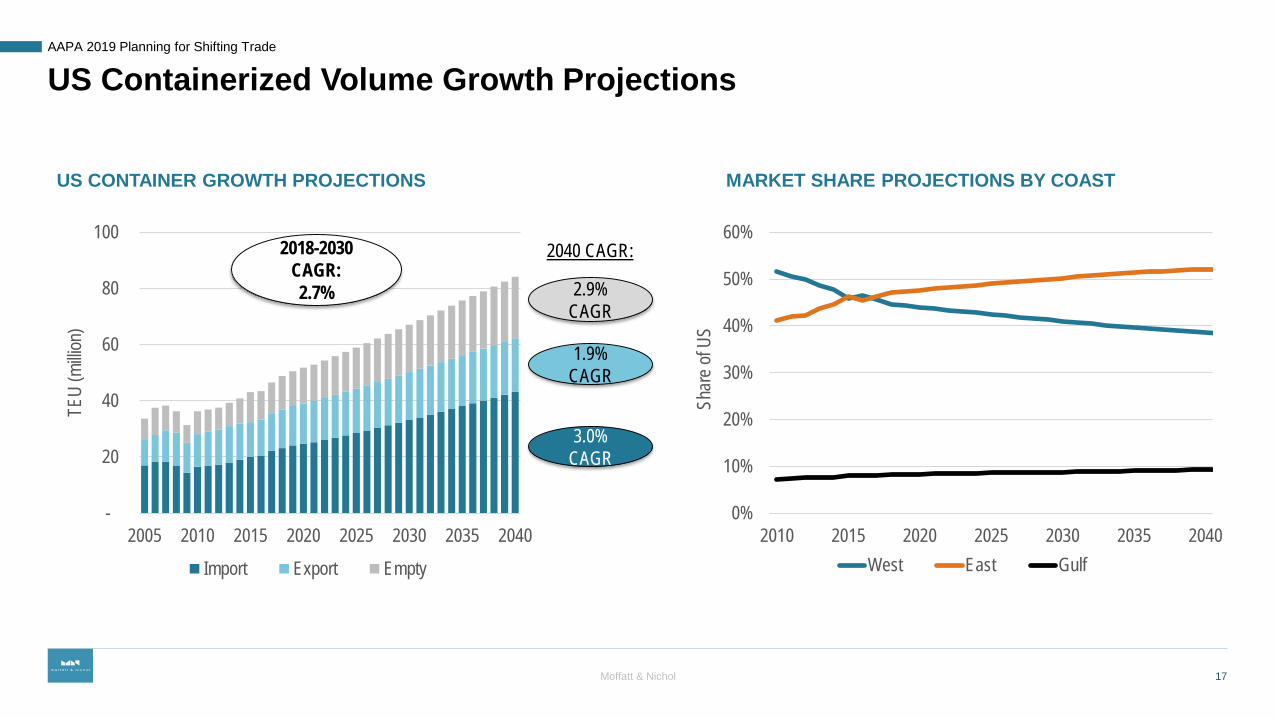
US Containerized Volume Growth Projections
17
AAPA 2019 Planning for Shifting Trade
Moffatt & Nichol
-
20
40
60
80
100
2005 2010 2015 2020 2025 2030 2035 2040
TEU
(milli
on)
Import Export Empty
3.0% CAGR
1.9% CAGR
2.9% CAGR
US CONTAINER GROWTH PROJECTIONS
0%
10%
20%
30%
40%
50%
60%
2010 2015 2020 2025 2030 2035 2040
Shar
e of U
S
West East Gulf
MARKET SHARE PROJECTIONS BY COAST
2018-2030 CAGR: 2.7%
2040 CAGR:
Several factors have the potential to alter our planning for trade lane growth
18
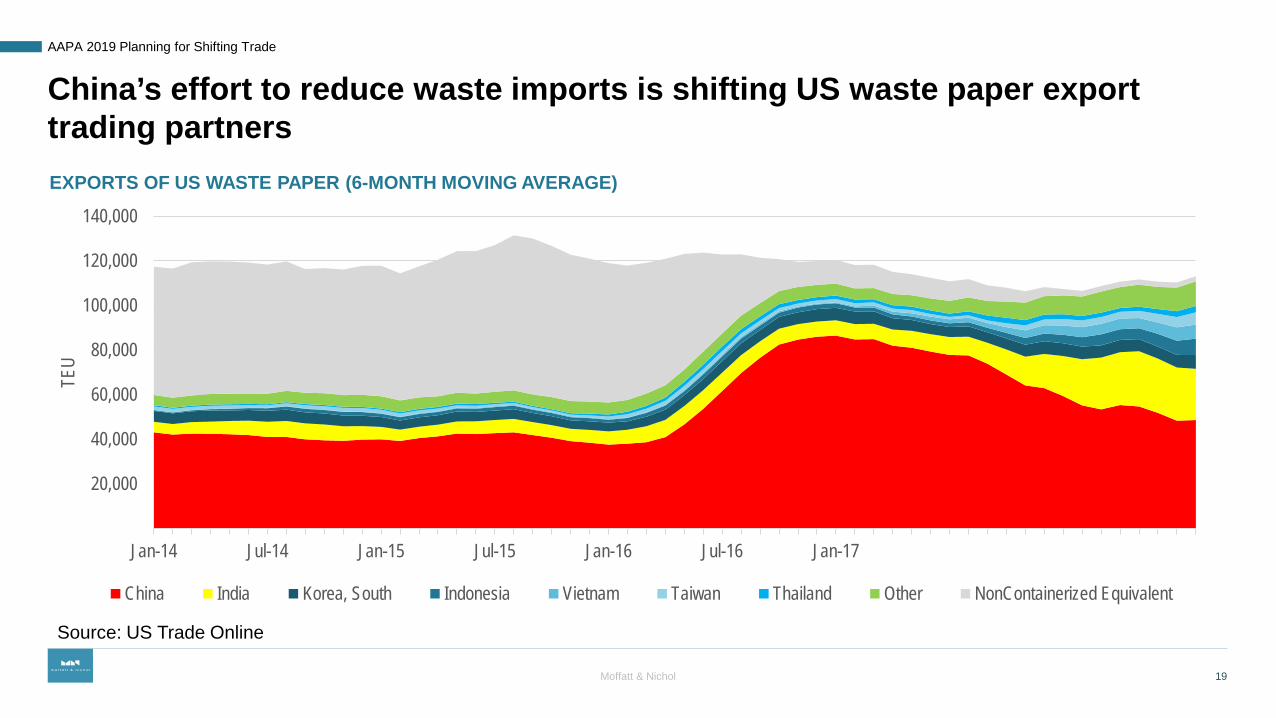
China’s effort to reduce waste imports is shifting US waste paper export trading partners
19
AAPA 2019 Planning for Shifting Trade
Moffatt & Nichol
EXPORTS OF US WASTE PAPER (6-MONTH MOVING AVERAGE)
Source: US Trade Online
20,000
40,000
60,000
80,000
100,000
120,000
140,000
Jan-14 Jul-14 Jan-15 Jul-15 Jan-16 Jul-16 Jan-17
TEU
China India Korea, South Indonesia Vietnam Taiwan Thailand Other NonContainerized Equivalent
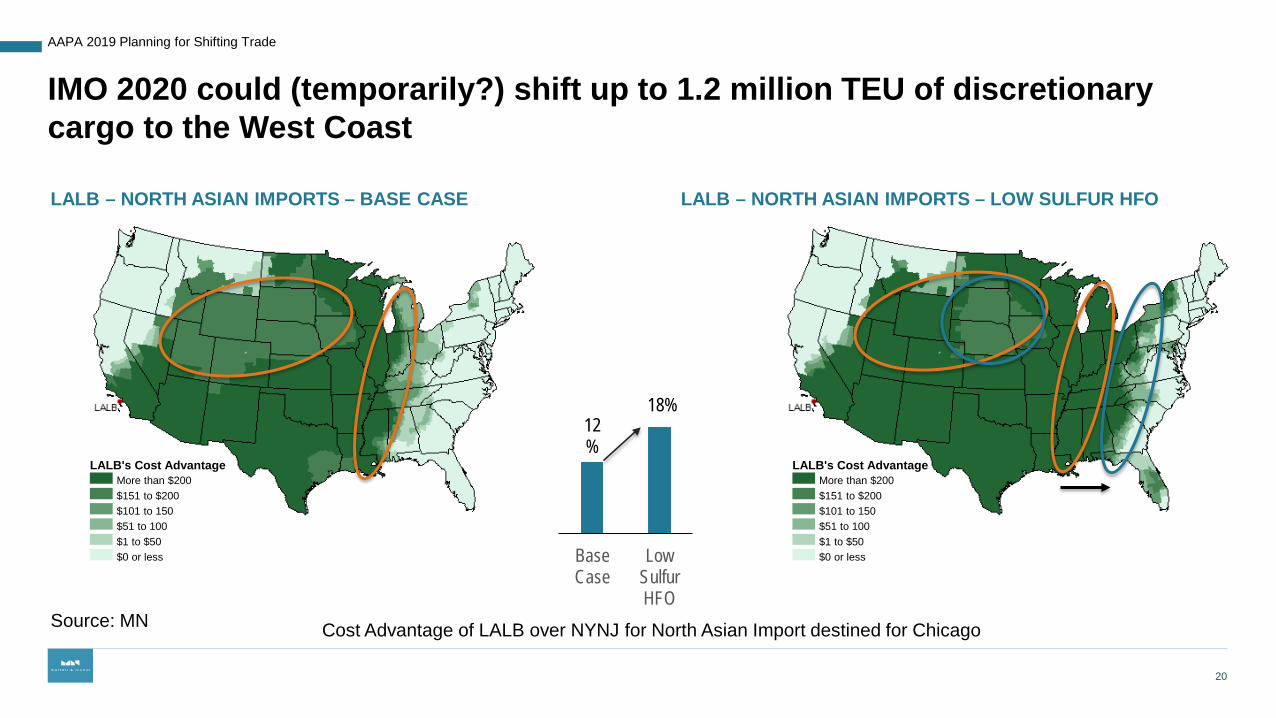
IMO 2020 could (temporarily?) shift up to 1.2 million TEU of discretionary cargo to the West Coast
Cost Advantage of LALB over NYNJ for North Asian Import destined for Chicago
LALB – NORTH ASIAN IMPORTS – BASE CASE LALB – NORTH ASIAN IMPORTS – LOW SULFUR HFO
Source: MN
20
AAPA 2019 Planning for Shifting Trade
LALB's Cost AdvantageMore than $200$151 to $200$101 to 150$51 to 100$1 to $50$0 or less
12%
18%
BaseCase
LowSulfurHFO
LALB's Cost AdvantageMore than $200$151 to $200$101 to 150$51 to 100$1 to $50$0 or less
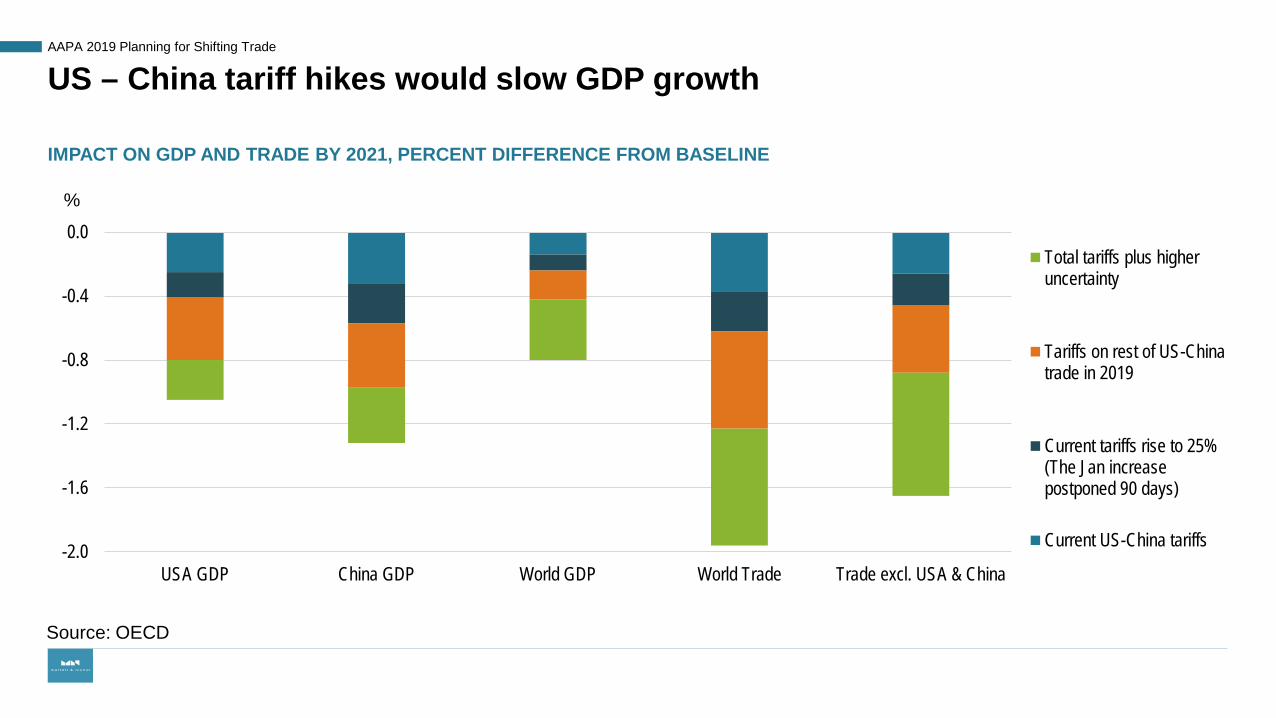
US – China tariff hikes would slow GDP growth
-2.0
-1.6
-1.2
-0.8
-0.4
0.0
USA GDP China GDP World GDP World Trade Trade excl. USA & China
%
Total tariffs plus higheruncertainty
Tariffs on rest of US-Chinatrade in 2019
Current tariffs rise to 25%(The Jan increasepostponed 90 days)
Current US-China tariffs
AAPA 2019 Planning for Shifting Trade
IMPACT ON GDP AND TRADE BY 2021, PERCENT DIFFERENCE FROM BASELINE
Source: OECD
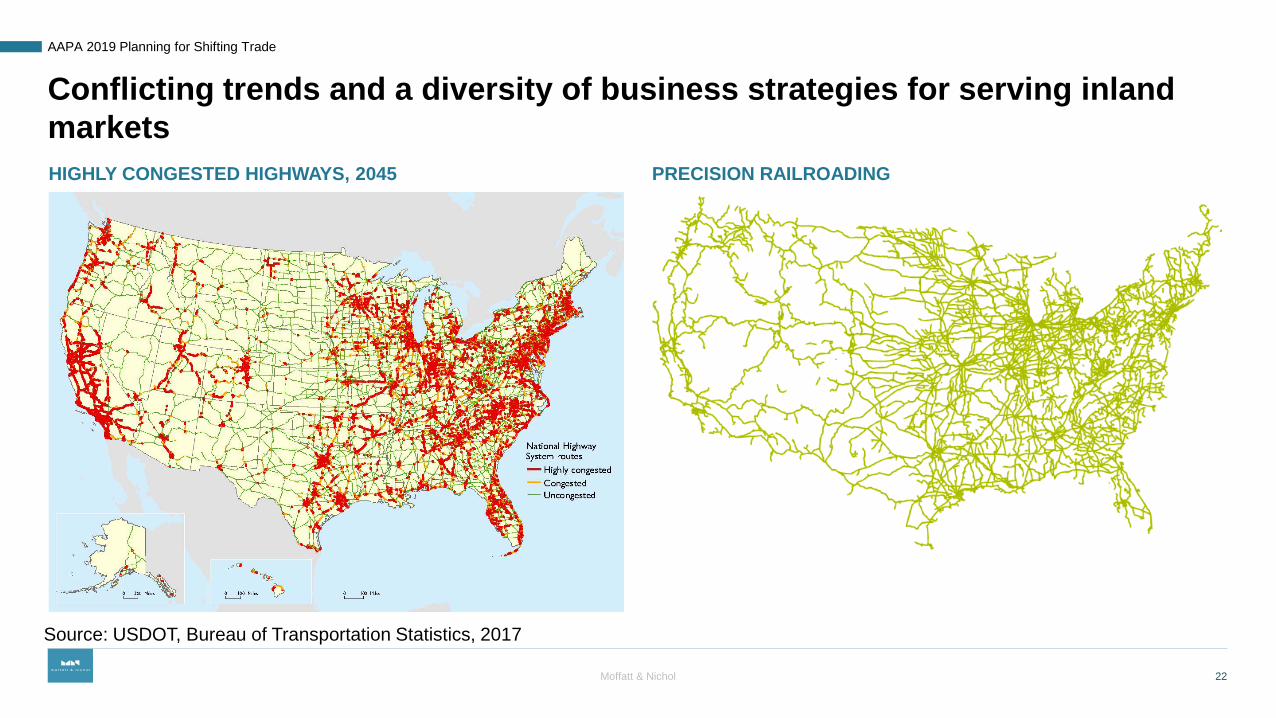
Conflicting trends and a diversity of business strategies for serving inland marketsHIGHLY CONGESTED HIGHWAYS, 2045 PRECISION RAILROADING
22
AAPA 2019 Planning for Shifting Trade
Moffatt & Nichol
Source: USDOT, Bureau of Transportation Statistics, 2017

Ports are, and should be, champions of infrastructure development
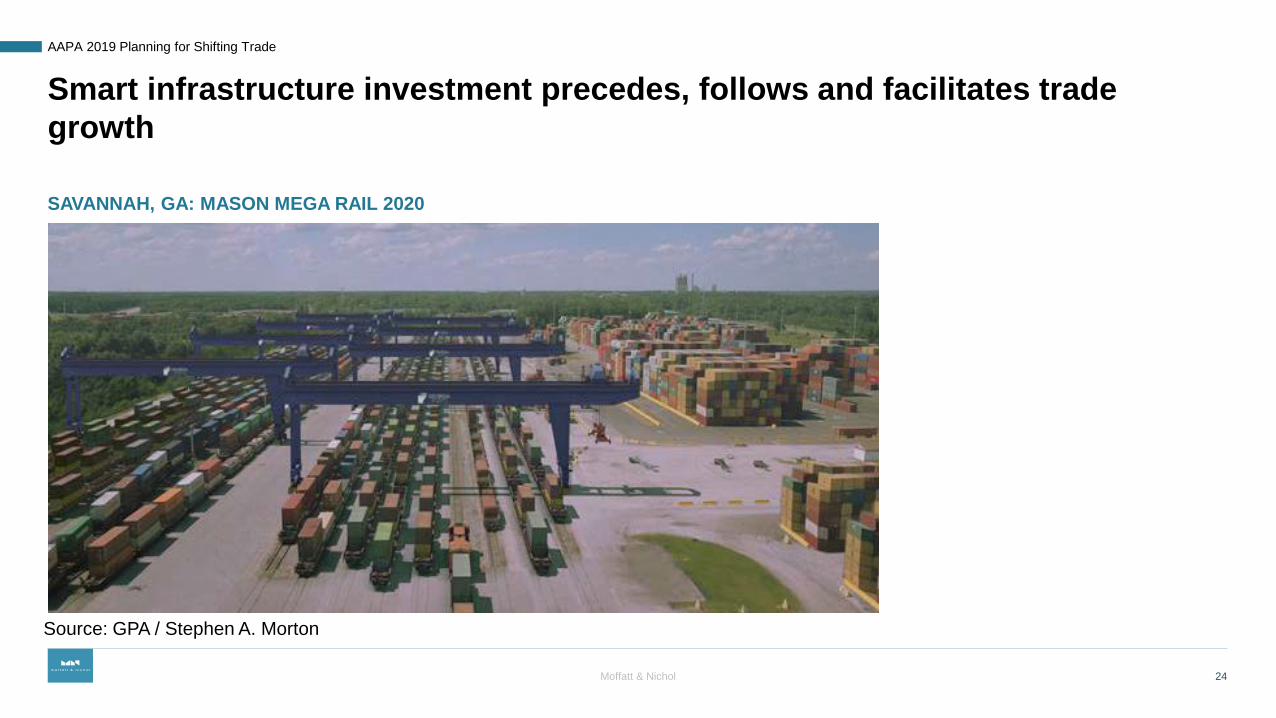
Smart infrastructure investment precedes, follows and facilitates trade growth
SAVANNAH, GA: MASON MEGA RAIL 2020
24
AAPA 2019 Planning for Shifting Trade
Moffatt & Nichol
Source: GPA / Stephen A. Morton
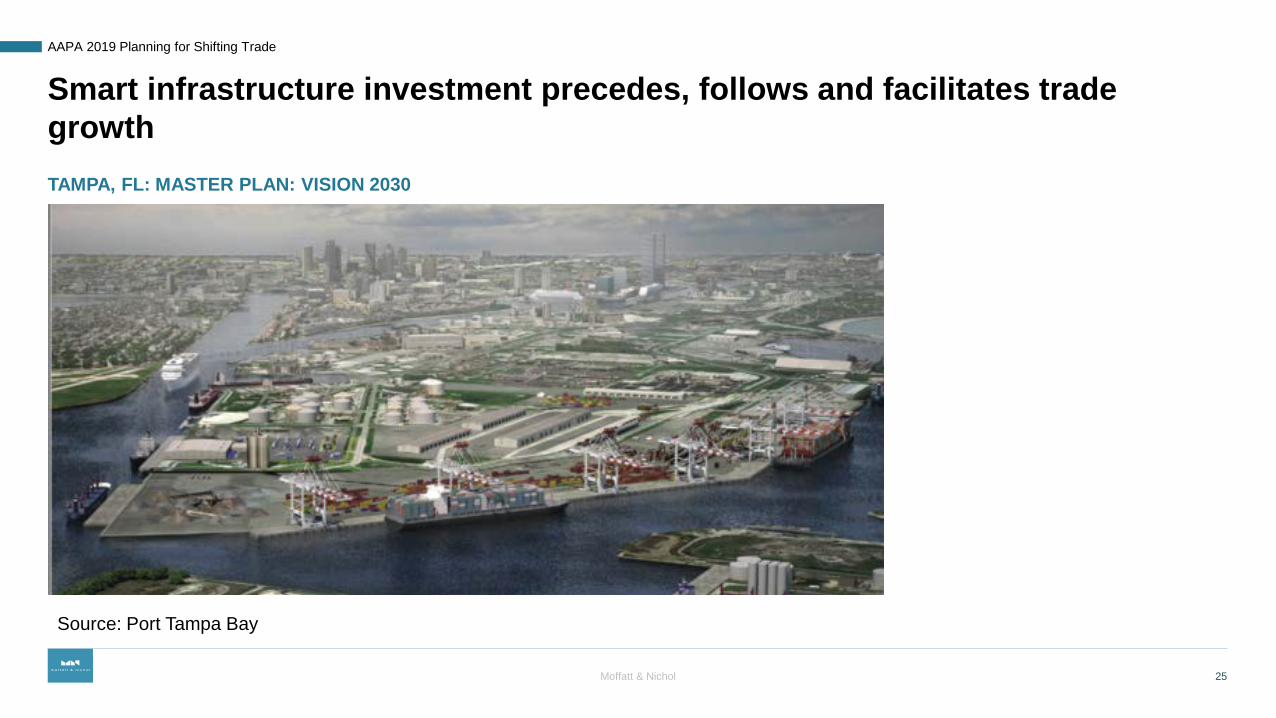
Smart infrastructure investment precedes, follows and facilitates trade growthTAMPA, FL: MASTER PLAN: VISION 2030
25
AAPA 2019 Planning for Shifting Trade
Moffatt & Nichol
Source: Port Tampa Bay

Conclusion
Major Themes
1. US economy strong but showing signs of weakness; Global growth slowing2. Near-term uncertainty over major economic policies, including trade policy3. IMO 2020 has potential to cause short-term congestion challenges in West
Coast4. Longer-term macro fundamentals favor continuation of slow shift to East and
Gulf Coasts, provided proper planning5. Landside connectivity is an evolving challenge6. Efficient freight networks require multiple entities working together7. Infrastructure needs a champion: port authorities are that champion
27
AAPA 2019 Planning for Shifting Trade
Moffatt & Nichol

THANK YOU
Josh u a Hu r w i t zMof fa t t & N i ch o ljh u r w i t z @ mof fa t tn i ch o l . com510-788-8963