Janney-MBMM-Dec-2014-Outlook-2015
18
MUNICIPAL BOND MARKET MONTHLY JANNEY FIXED INCOME STRATEGY December 16, 2014 JANNEY MONTGOMERY SCOTT www.janney.com © 2014 Janney Montgomery Scott LLC Member: NYSE, FINRA, SIPC MUNICIPAL MONTHLY • PAGE 1 TOM KOZLIK Municipal Credit Analyst 215.665.4422 [email protected] ALAN SCHANKEL Managing Director 215.665.6088 [email protected] See page 18 for important information regarding certifications, our ratings system as well as other disclaimers. CONTENTS PAGE STRONG OVERWEIGHT CALL FOR 2015 2 INTEREST RATE EXPECTATIONS 2 SUPPLY FORECASTS 3 MUNICIPAL SECTOR CREDIT OUTLOOKS 4 CREDIT COMMENTARY 4 PENSION CLOUD 7 INSURANCE COMEBACK 9 POLITICAL INFLUENCE 10 LATEST ON PUERTO RICO 11 TECHNICAL MARKET INDICATORS 13 SELECT RATING CHANGES 14 STATE ISSUER RATINGS 15 MUNICIPAL RATING DEFINITIONS 16 JANNEY MUNICIPAL PUBLICATIONS 17 DISCLOSURE 18 Everything Investors Need to Successfully Navigate the Municipal Bond Market in 2015 • What is your total return weighting for the municipal sector? The strongest “Over- weight” conviction call in our Fixed Income Market Strategy Outlook for 2015 is for municipals. • Most optimistic about for 2015? We think credit quality will remain high for the majority of municipal issuers. We see no near term stresses likely to shake our confidence in 2015. • Negatives going into 2015? Some issuers, including about 20% of local governments, are not adjusting to the new lower growth and depressed revenue reality and there has still been a lack of effective attention to pension funding by some. • Will interest rates rise this year? Yes - we expect to see Fed movement on rates as early as Sept. 2015. Interest rates may fall on the long end of the curve, however. • Will municipal bond primary market issuance be lower in 2015? Yes – we expect a declining issuance trend and we forecast total primary market volume will be between $225 and $275 billion in 2015. • Is municipal credit quality still high? Yes – municipal credit quality is still generally very high. The median rating for U.S. states is Aa1 and the median rating for U.S. local government is still Aa3. • The U.S. economic recovery has lasted over five straight years. Has municipal cred- it quality “recovered” also? By most measures the U.S. economy has recovered from the depths of the World Financial Crisis and the Great Recession. We think it is misleading to sug- gest “all” municipal credit quality has recovered. Many credits have stabilized, but some are struggling to maintain their credit standing. This is because the U.S. economic recovery and municipal credit quality are not necessarily the same thing. • Why is this the case? Moderating but better economic growth and improving tax revenues have helped many municipal credits stabilize. However, there is a troubling number of municipal issuers (including some state govts) that have not adjusted spending to reflect the new financial reality of lower revenues. • Will downgrades outpace upgrades in 2015 again? Yes – over 50% of downgrades in a recent sample occurred because of multi-year structural imbalances. This is difficult to remedy and we have not seen indications that the trend will reverse anytime soon. • What can investors do to protect themselves against buying a municipal bond that may be downgraded in 2015? Municipal investing requires discipline and we still think credit selection is very important going into 2015. Investors must recognize that not all issuers’ credit profiles have advanced despite the economic recovery. • What are you most concerned about regarding pensions? For 2015, we are concerned other more traditional state (especially in the states of IL, NJ and PA) and local government spending will be crowded out by pension funding requirements. Also, pension reform has not proven very effective yet. There is still time, but the clock is ticking. • Is there still value for investors in municipal bond insurance? The value proposition is there for municipal bond insurance as shown with positive experience from Detroit, Stockton, San Bernardino, Jefferson County and Harrisburg. We think individual investors should view insurance as an additional security feature. • What is the macro-problem with Puerto Rico? There is still too much debt and weak economic results have persisted within the island’s contracting economy. • Will there be a Puerto Rico default in 2015? Yes. It is likely that the Puerto Rico Electric
-
Upload
tom-kozlik -
Category
Documents
-
view
47 -
download
0
Transcript of Janney-MBMM-Dec-2014-Outlook-2015

MUNICIPAL BOND MARKET MONTHLYJANNEY FIXED INCOME STRATEGYDecember 16, 2014
JANNEY MONTGOMERY SCOTT
www.janney.com
© 2014 Janney Montgomery Scott LLC
Member: NYSE, FINRA, SIPC
MUNICIPAL MONTHLY • PAGE 1
TOM KOZLIK Municipal Credit [email protected]
ALAN SCHANKEL Managing [email protected]
See page 18 for important information regarding certifi cations, our ratings system as well as other disclaimers.
CONTENTS PAGE
STRONG OVERWEIGHT CALL FOR 2015 2
INTEREST RATE EXPECTATIONS 2
SUPPLY FORECASTS 3
MUNICIPAL SECTOR CREDIT OUTLOOKS 4
CREDIT COMMENTARY 4
PENSION CLOUD 7
INSURANCE COMEBACK 9
POLITICAL INFLUENCE 10
LATEST ON PUERTO RICO 11
TECHNICAL MARKET INDICATORS 13
SELECT RATING CHANGES 14
STATE ISSUER RATINGS 15
MUNICIPAL RATING DEFINITIONS 16
JANNEY MUNICIPAL PUBLICATIONS 17
DISCLOSURE 18
Everything Investors Need to Successful ly Navigate the Municipal Bond Market in 2015• What is your total return weighting for the municipal sector? The strongest “Over-
weight” conviction call in our Fixed Income Market Strategy Outlook for 2015 is for municipals.
• Most optimistic about for 2015? We think credit quality will remain high for the majority of municipal issuers. We see no near term stresses likely to shake our confi dence in 2015.
• Negatives going into 2015? Some issuers, including about 20% of local governments, are not adjusting to the new lower growth and depressed revenue reality and there has still been a lack of effective attention to pension funding by some.
• Will interest rates rise this year? Yes - we expect to see Fed movement on rates as early as Sept. 2015. Interest rates may fall on the long end of the curve, however.
• Will municipal bond primary market issuance be lower in 2015? Yes – we expect a declining issuance trend and we forecast total primary market volume will be between $225 and $275 billion in 2015.
• Is municipal credit quality still high? Yes – municipal credit quality is still generally very high. The median rating for U.S. states is Aa1 and the median rating for U.S. local government is still Aa3.
• The U.S. economic recovery has lasted over fi ve straight years. Has municipal cred-it quality “recovered” also? By most measures the U.S. economy has recovered from the depths of the World Financial Crisis and the Great Recession. We think it is misleading to sug-gest “all” municipal credit quality has recovered. Many credits have stabilized, but some are struggling to maintain their credit standing. This is because the U.S. economic recovery and municipal credit quality are not necessarily the same thing.
• Why is this the case? Moderating but better economic growth and improving tax revenues have helped many municipal credits stabilize. However, there is a troubling number of municipal issuers (including some state govts) that have not adjusted spending to refl ect the new fi nancial reality of lower revenues.
• Will downgrades outpace upgrades in 2015 again? Yes – over 50% of downgrades in a recent sample occurred because of multi-year structural imbalances. This is diffi cult to remedy and we have not seen indications that the trend will reverse anytime soon.
• What can investors do to protect themselves against buying a municipal bond that may be downgraded in 2015? Municipal investing requires discipline and we still think credit selection is very important going into 2015. Investors must recognize that not all issuers’ credit profi les have advanced despite the economic recovery.
• What are you most concerned about regarding pensions? For 2015, we are concerned other more traditional state (especially in the states of IL, NJ and PA) and local government spending will be crowded out by pension funding requirements. Also, pension reform has not proven very effective yet. There is still time, but the clock is ticking.
• Is there still value for investors in municipal bond insurance? The value proposition is there for municipal bond insurance as shown with positive experience from Detroit, Stockton, San Bernardino, Jefferson County and Harrisburg. We think individual investors should view insurance as an additional security feature.
• What is the macro-problem with Puerto Rico? There is still too much debt and weak economic results have persisted within the island’s contracting economy.
• Will there be a Puerto Rico default in 2015? Yes. It is likely that the Puerto Rico Electric

MUNICIPAL BOND MARKET MONTHLYDecember 16, 2014
JANNEY MONTGOMERY SCOTT
www.janney.com
© 2014 Janney Montgomery Scott LLC
Member: NYSE, FINRA, SIPC
MUNICIPAL MONTHLY • PAGE 2
The strongest “Overweight” conviction call in our Fixed Income Market Strategy Out-look for 2015 is for the mu-nicipal bond sector.
Authority, which is currently in restructuring negotiations with stakeholders, will default.
• Is there a threat to the municipal bond tax-exemption? No – not this year. But, you can still expect headline risk, potential tax reform, and new BAB proposals throughout 2015 from and in the press.
• New Hampshire’s outlook raised by S&P; New Mexico’s outlook lowered by S&P; Vermont’s out-look lowered by S&P; California upgraded by S&P; Hawaii outlook raised by S&P; and Miami’s rating raised two notches by Fitch.
MUNICIPAL STRATEGY COMMENTARY
The Municipal Market is Our Favorite Sector “Overweight” for 2015
The strongest “Overweight” conviction call in our Fixed Income Market Strategy Outlook for 2015 is for the municipal bond sector. The sector’s strong tax-adjusted income feature and the potential for falling Municipal to Treasury Ratios (M/T Ratios) will remain drivers of outperformance. We still think the sector is likely to continue to be an attractive relative value play for fi xed income investors. The Janney Fixed Income Strategy 2014 Outlook had an “Overweight” rating and we are keeping it unchanged going into 2015. Tom Kozlik
TECHNICAL MUNICIPAL MARKET COMMENTARY
Interest Rate Expectations
Again this year we start our forward looking commentary by letting investors know that we expect Fed movement on interest rates by the 2nd half of 2015. Janney’s Fixed Income Strategy’s Interest Rate expectations are as shown in the below table. The fi rst interest rate hike is likely to occur in September 2015, but risks are skewed toward a later fi rst rate increase which might not even occur in 2015.
We still think the sector is likely to continue to be an at-tractive relative value play for fi xed income investors.
The fi rst interest rate hike is likely to occur in September 2015, but risks are skewed toward a later fi rst rate in-crease which might not even occur in 2015.
Janney Interest Rate Strategy: Forecast Detail, December 1, 2014Central Bank
RatesCurrent 4Q 2014 1Q 2015 2Q 2015 3Q 2015 4Q 2015 2Q 2016 4Q 2016
FedFunds O/N*
0.13% 0.13% 0.13% 0.13% 0.38% 0.63% 1.00% 1.50%
Treasury Curve
Current 4Q 2014 1Q 2015 2Q 2015 3Q 2015 4Q 2015 2Q 2016 4Q 2016
3m Bill 0.02% 0.06% 0.07% 0.17% 0.40% 0.71% 1.26% 1.50%2yr Note 0.47% 0.53% 0.64% 0.78% 0.83% 1.13% 1.36% 1.42%5yr Note 1.47% 1.33% 1.34% 1.45% 1.45% 1.43% 1.50% 1.47%10yr Note 2.16% 2.18% 2.20% 2.44% 2.44% 2.47% 2.46% 2.43%30yr Bond 2.89% 2.85% 2.75% 2.83% 2.83% 2.80% 2.78% 2.77%
2s/10s 170 bps 165 bps 157 bps 155 bps 161 bps 134 bps 110 bps 100 bps5s/30s 143 bps 152 bps 141 bps 143 bps 137 bps 138 bps 127 bps 130 bps10s/30s 73 bps 66 bps 54 bps 48 bps 39 bps 34 bps 31 bps 34 bps
LIBOR/Swaps Curve
Current 4Q 2014 1Q 2015 2Q 2015 3Q 2015 4Q 2015 2Q 2016 4Q 2016
1m LIBOR 0.15% 0.19% 0.27% 0.35% 0.57% 0.87% 1.40% 1.60%3m LIBOR 0.23% 0.25% 0.27% 0.37% 0.60% 0.91% 1.46% 1.70%2yr Swap 0.68% 0.74% 0.85% 0.99% 1.05% 1.34% 1.58% 1.63%10yr Swap 2.30% 2.31% 2.34% 2.46% 2.58% 2.65% 2.66% 2.68%30yr Swap 2.88% 2.80% 2.68% 2.70% 2.73% 2.75% 2.78% 2.82%
Source: Janney Fixed Income Strategy and Research (FISR). All are period end forecasts. *Represents midpoint corr.

MUNICIPAL BOND MARKET MONTHLYDecember 16, 2014
JANNEY MONTGOMERY SCOTT
www.janney.com
© 2014 Janney Montgomery Scott LLC
Member: NYSE, FINRA, SIPC
MUNICIPAL MONTHLY • PAGE 3
At the beginning of 2014, we published bond issuance forecasts anticipating mu-nicipal volume to come in not only lower in 2014 versus 2013, but lower every year until 2017.
Please see page 13 of the Janney Outlook 2015 Rate Forecasts for more info. Aside from likely drops in security values, higher rates could be happily accepted on the investor side, especially for those with new investable funds or for those with maturities coming due and who are able to reinvest at the higher (relatively) interest rate levels. From the issuer side, it is more complicated. Higher rates mean less refundings will be in the money for debt service savings; therefore, we recommend that issuers execute any refundings still available as soon as possible. Higher rates also means higher interest costs on new money debt. The expected increases in debt costs will not signifi cantly move the needle as far as issuers are concerned with regard to adding new debt. Tom Kozlik
MUNICIPAL BOND VOLUME FORECASTS
Still Expecting Lower Issuance Trend
At the beginning of 2014, we published bond issuance forecasts anticipating municipal volume to come in not only lower in 2014 versus 2013, but lower every year until 2017. (See “The Rime of Municipal Issuance”) It was the fi rst time we had published an in-depth forecast and review of mu-nicipal volume. We thought it was imperative to add to the discussion on potential issuance because of the massive shifts occurring in the issuer and bond market worlds. The resulting forecasts were and still are (at least for some) very much outside of the consensus.
For 2014, it looks like we were spot on with the majority of our thesis. Total issuance for 2014 is likely going to be just about $330 billion, very close to 2013. This is a little higher than the $250-$275 billion we forecast, but the difference is completely explained by lower interest rates enjoyed by issuers who took advantage. Lower interest rates resulted in much more refunding issuance than we planned for.
Our new money issuance expectation was right on target. We expected the new money portion of overall issuance, because it is supported by stagnant revenues and lower economic growth, to remain closer to levels issuers sold in the mid and late 1990s and nowhere close to those levels sold from 2002 to 2010. Refunding levels will be related to interest rates, but refundings should decrease as interest rates rise. These factors will keep issuance lower in coming years:
• Lower revenue growth trends across all sectors means austerity measures will continue and expenditure demands will continue to crowd out other spending;
• We see minimal political and voter support (or public policy support) for higher government spending in the form of higher taxes and user fees that could result in higher issuance;
• Higher interest rates will curtail refundings, especially in the last half of the year;
• Alternative debt products (like direct bank loans);
We thought it was imperative to add to the discussion on potential issuance because of the massive shifts occurring in the issuer and bond mar-ket worlds.
For 2014, it looks like we were spot on with the major-ity of our thesis.
A History of Municipal Bond Issuance
Source: Thomson Reuters through November and Janney FIS. Combined amounts are split between each.
0%
1%
2%
3%
4%
5%
6%
7%
$0
$100
$200
$300
$400
$500
90 92 94 96 98 00 02 04 06 08 10 12 14
New Money (Left) Refunding (Left) 10 Year MMD (Right)
Near term issuance levels will be closer to mid & late 1990s

MUNICIPAL BOND MARKET MONTHLYDecember 16, 2014
JANNEY MONTGOMERY SCOTT
www.janney.com
© 2014 Janney Montgomery Scott LLC
Member: NYSE, FINRA, SIPC
MUNICIPAL MONTHLY • PAGE 4
An extended low interest rate environment is the number one near barrier that would keep issuance above our ex-pectations.
• Demographic shifts and other cultural dynamics.
Potential Barriers to Our Lower Issuance Thesis
An extended low interest rate environment is the number one near barrier that would keep issuance above our expectations. This would result in more refunding volume. New money issuance did not jump despite the U.S. economic recovery, and we expect it to remain modest. Tom Kozlik
JANNEY MUNICIPAL SECTOR CREDIT OUTLOOKS
“Stable” Sector Credit Outlooks Outnumber ”Cautious” Outlooks
We now have six “Stable” sector outlooks versus fi ve “Cautious” for our Janney Municipal Sector Credit Outlook summary. Our latest changes include those to transportation related sectors. In Oc-tober 2014, we increased our credit outlook on the Toll Facility sector to “Stable” from “Cautious”. In February we upped the outlook on the Airport sector to “Stable” from Cautious. Tom Kozlik.
MUNICIPAL CREDIT COMMENTARY
Municipal Credit Quality is Still High
We still like the municipal bond sector and strongly recommend investors stick with the asset class, but credit selection is going to continue to be very important going into 2015. We want municipal bond investors to remain disciplined and on the look-out for deteriorating credits.
Municipal bond credit quality is still high, and this is especially true when comparing municipal bonds to other asset classes. The Moody’s median rating for U.S. States is an Aa1. The median rating for local governments is an Aa3. Moody’s recently noted also that 34 of the top 50 cities (ranked by population) have maintained or improved their credit quality since the 2008 recession. The median rating for these 34 “successful” large cities is Aa1. These cities benefi t from healthy tax bases, able
We now have six “Stable” sector outlooks versus fi ve “Cautious” for our Janney Municipal Sector Credit Out-look summary.
Credit selection is going to continue to be very important going into 2015.
Janney Municipal Sector Credit Outlook and Review
Source: Barclay’s Capital as of Nov 30, 2014 and Janney.
Municipal Bond Market Primary Issuance Will Continue to Fall in Coming Years
Actual Issuance Janney Forecasts2010 2011 2012 2013 2014 2014 2015 2016 2017$433 $288 $380 $334 330* $250-275 $225-275 $200-250 $175-225
Source: Thomson Reuters and Janney FISR. $ in billions. *Total 2015 issuance will come in around $330 billion.
SectorJanney Credit
Outlook
Last Month Change
Barclay's 12 Month
ReturnKey Sector Trends
Recent Janney Sector Review
Municipal Bond Index - - 8.23% Barclay's Muni Index, 46k issues -
State Government Stable Same 6.66% Tax revs mostly stable, Structural imbalances IL, PA, NJ Oct 2014 Note
Local Government Cautious Same 7.89% Downgrades outpace upgrades, some imbalances Sept 2014 MBMM
School Districts Cautious Same - State aid cuts could be problematic, squeeze budgets Sept 2014 MBMM
Airports Stable Same 9.95% Sector stabilizing, consolidations largely fi nished May 2014 Note
Health Care Cautious Same 11.41% Reimbursement uncertainty, margins pressured Feb 2014 MBMM
Higher Education Cautious Same 8.58% Slow rev growth, lower support, spending pressures Feb 2014 MBMM
Housing Stable Same 8.46% HFA balance sheets have mostly recovered Feb 2014 MBMM
Public Power (Elec.) Stable Same 7.49% Essential purpose nature enhances stability Feb 2014 MBMM
Tobacco Cautious Same N/A More downgrades, consumption dropping Setp 2014 Weekly
Toll Facilities Stable Same 9.95% Activity stablized near 2004 levels, debt rising Oct 2014 MBMM
Water and Sewer Stable Same 9.00% Essentiality factor, system upgrades looming Feb 2014 MBMM
MUNICIPAL BOND MARKET MONTHLYDecember 16, 2014
JANNEY MONTGOMERY SCOTT
www.janney.com
© 2014 Janney Montgomery Scott LLC
Member: NYSE, FINRA, SIPC
MUNICIPAL MONTHLY • PAGE 5
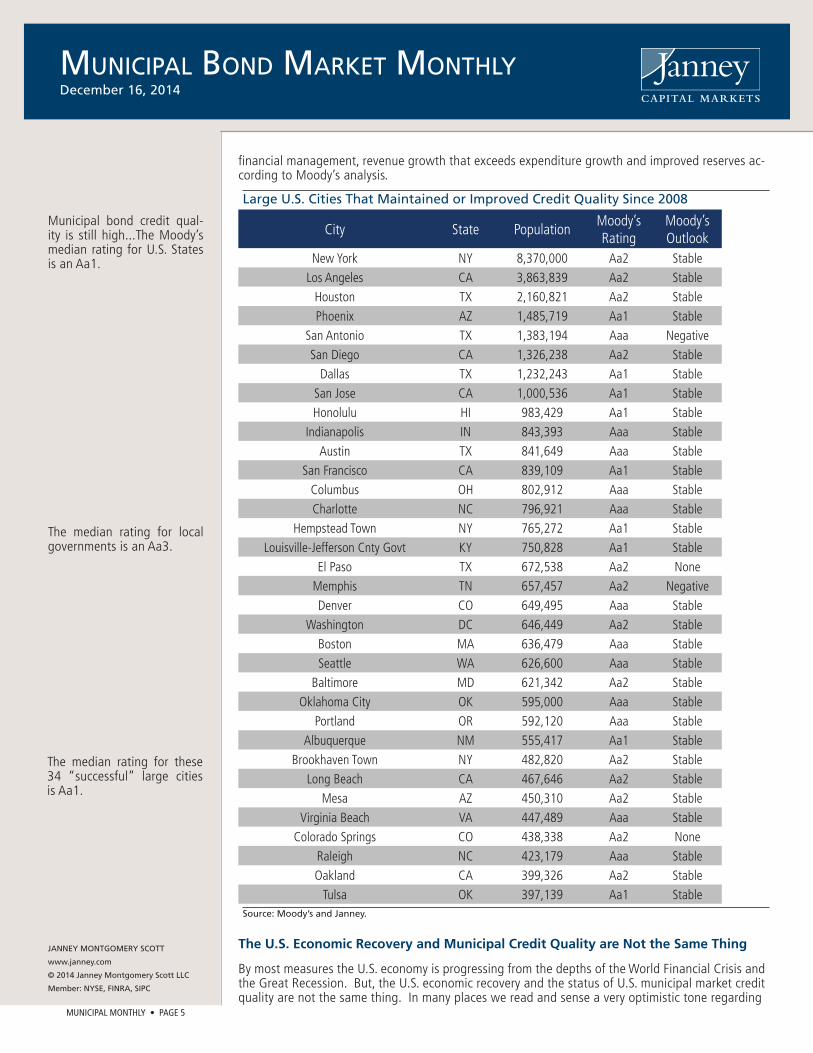
Municipal bond credit qual-ity is still high...The Moody’s median rating for U.S. States is an Aa1.
fi nancial management, revenue growth that exceeds expenditure growth and improved reserves ac-cording to Moody’s analysis.
The U.S. Economic Recovery and Municipal Credit Quality are Not the Same Thing
By most measures the U.S. economy is progressing from the depths of the World Financial Crisis and the Great Recession. But, the U.S. economic recovery and the status of U.S. municipal market credit quality are not the same thing. In many places we read and sense a very optimistic tone regarding
The median rating for local governments is an Aa3.
The median rating for these 34 “successful” large cities is Aa1.
Large U.S. Cities That Maintained or Improved Credit Quality Since 2008
City State PopulationMoody’s Rating
Moody’s Outlook
New York NY 8,370,000 Aa2 StableLos Angeles CA 3,863,839 Aa2 Stable
Houston TX 2,160,821 Aa2 StablePhoenix AZ 1,485,719 Aa1 Stable
San Antonio TX 1,383,194 Aaa NegativeSan Diego CA 1,326,238 Aa2 Stable
Dallas TX 1,232,243 Aa1 StableSan Jose CA 1,000,536 Aa1 StableHonolulu HI 983,429 Aa1 Stable
Indianapolis IN 843,393 Aaa StableAustin TX 841,649 Aaa Stable
San Francisco CA 839,109 Aa1 StableColumbus OH 802,912 Aaa StableCharlotte NC 796,921 Aaa Stable
Hempstead Town NY 765,272 Aa1 StableLouisville-Jefferson Cnty Govt KY 750,828 Aa1 Stable
El Paso TX 672,538 Aa2 NoneMemphis TN 657,457 Aa2 NegativeDenver CO 649,495 Aaa Stable
Washington DC 646,449 Aa2 StableBoston MA 636,479 Aaa StableSeattle WA 626,600 Aaa Stable
Baltimore MD 621,342 Aa2 StableOklahoma City OK 595,000 Aaa Stable
Portland OR 592,120 Aaa StableAlbuquerque NM 555,417 Aa1 Stable
Brookhaven Town NY 482,820 Aa2 StableLong Beach CA 467,646 Aa2 Stable
Mesa AZ 450,310 Aa2 StableVirginia Beach VA 447,489 Aaa Stable
Colorado Springs CO 438,338 Aa2 NoneRaleigh NC 423,179 Aaa StableOakland CA 399,326 Aa2 Stable
Tulsa OK 397,139 Aa1 StableSource: Moody’s and Janney.

MUNICIPAL BOND MARKET MONTHLYDecember 16, 2014
JANNEY MONTGOMERY SCOTT
www.janney.com
© 2014 Janney Montgomery Scott LLC
Member: NYSE, FINRA, SIPC
MUNICIPAL MONTHLY • PAGE 6
The U.S. economic recovery and the status of U.S. munici-pal market credit quality are not the same thing.
municipal credit quality. This tone in the majority of situations is rightfully deserving but in some cases is overly optimistic. We think investors should proceed with a touch of caution because some municipal credits are covering uncharted territory, and investors need to be aware of risks inherent in such exploration of dangerous fi nancial waters.
The moderate economic recovery from the Financial Crisis of 2008 has entered its 65th month but nearly all the major fi nancial data that drives U.S. public fi nance credit quality are still below their 2007 peak levels. And if above the 2007 peak, they are still usually no-where near trends steep enough to sustain pre-2007 spending levels. This dynamic is helping to defi ne what we are referring to as a “New Financial Reality” for the U.S. municipal bond sector that municipal issuers must quickly adjust to or risk future credit deterioration.
Importance of Credit Selection in the “New Financial Reality”
The new fi nancial reality we are describing is one driven by lower than historical economic growth and that is having consequences on U.S. municipal bond market credit quality. Some municipal cred-its have been slow to adjust spending levels and bring costs closer in line with lower growth trends.
Most have discovered this new fi nancial reality and adjusted spending levels (like the “Successful” cities listed above mostly have). A limited number of issuers across different sectors have even been upgraded. The problem is that while most issuers understand the new fi nancial reality, and have ad-justed spending levels and maintained (or even improved in some cases) credit quality, a disturbingly large number of issuers have not recognized the new fi nancial reality and adjusted spending levels.
In those cases we are still seeing expenditure demand outpace revenue increases. Too often this relationship is still blamed on leftover effects from the most recent recession. There are some munici-pal issuers who are fi ghting an uphill battle because of aggressive spending habits formed a decade ago that have not been curtailed.
Downgrades Will Continue to Outpace Upgrades in 2015
The result of this new fi nancial reality has been that Moody’s public fi nance downgrades have out-paced upgrades for 23 straight quarters (as of 3Q2014). This downgrade activity is highlighted by certain high-profi le states such as Illinois, New Jersey and Pennsylvania which have been down-graded and will likely experience future downgrades if swift changes are not made. There has also been a concentration of downgrades in the local government and school district sectors. This is not just falling credit quality on the fringes. It is also not occurring just because of pension obligations. Pension obligations often apply pressure to credit profi les, but it is not the only spending line-item these issuers are dealing with.
Some municipal credits have been slow to adjust spending levels and bring costs closer in line with lower growth trends.
The result of this new fi nancial reality has been that Moody’s public fi nance downgrades have outpaced upgrades for 23 straight quarters.
Public Finance Downgrades Will Continue to Outpace Upgrades in 2015
Source: Moody’s and Janney.
-300
-200
-100
0
100
200
300
1Q02 4Q03 3Q05 2Q07 1Q09 4Q10 3Q12 2Q14
Moody's Upgrades (#) Moody's Downgrades (#)
Factors causing downgrades are not easily repairable
We estimate over 20% of local governments may have been downgraded since the
end of 2008
We expect pace of downgrades to continue, in the
near term

MUNICIPAL BOND MARKET MONTHLYDecember 16, 2014
JANNEY MONTGOMERY SCOTT
www.janney.com
© 2014 Janney Montgomery Scott LLC
Member: NYSE, FINRA, SIPC
MUNICIPAL MONTHLY • PAGE 7
Credit selection has been and should continue to be a pri-ority for investors going into 2015.
It is possible that too many municipal market issuers and voters became intoxicated with revenue streams that were artifi cially enhanced by past higher growth and the recent housing bubble. A dif-fi cult phase of spending reductions needs to occur for municipal credit quality to become balanced again. Only after such a phase occurs could we expect downgrades will no longer outpace upgrades. We do not think a recovering housing market is the solution to these imbalances.
Investor Recommendation
Credit selection has been and should continue to be a priority for investors going into 2015. Some issuers will continue to grapple with revenues that are lower than expenditure demand calls for and as a result will likely be downgraded further if spending priorities are not made. We want investors to concentrate their investment dollars on high quality municipal issuers that understand the new fi nancial reality and have made or are making budget adjustments. Tom Kozlik
THE MUNICIPAL MARKET PENSION CLOUD
Crowding Out of Other Municipal Spending
Growing public pension liabilities will compete with, and in some cases crowd out, other state and local spending priorities. Pension funding is illustrated by dividing assets by liabilities, but a series of assumptions make the accurate calculation of liabilities challenging. Moody’s revised methodol-ogy offers the ability to more accurately compare and assess funding levels of public pension plans. Under new GASB accounting standards, the optics of pension funding will shed a harsher light on poorly funded pension plans.
Pension funding continues to be the largest cloud overhanging public fi nance. In recent travels through the Janney branch system I saw fading signs of autumn in South Carolina and snow in upstate New York, but common ground across locales was concern about state and local pension funding. From a political view, pension funding is a 30 year problem being addressed by leaders with time horizons often dictated by 2-year or 4-year election cycles. Analyzing pension funding is made particularly challenging by the lack of uniformity and timeliness in reporting. Recent changes to reporting standards as established by the Government Accounting Standards Board (GASB) should improve transparency and comparability.
Pension Funding Basics
Pension funding is basically calculated by dividing assets by liabilities. In fi nancial statements dated June 30, 2012 (using June 2011 data), Detroit reported $6.9 billion of assets and $7.5 billion of liabilities which indicated a funding ratio of 91% for its two employee pension plans. The assets, which are held in trust and cannot be legally diverted to creditors other than retirees, were comprised of investments in a variety of asset classes including stocks, bonds, real estate, private placements and mortgage loans.
Liabilities are more diffi cult to calculate than assets, since a series of actuarial assumptions about future wages, cost of living adjustments, amortization period, and perhaps most importantly an adj-
Pension funding continues to be the largest cloud over-hanging public fi nance.
When added to debt liabili-ties, as illustrated in the table of the six largest US cities (plus Detroit), this ratio offers a useful point of comparison across issuers.
Moody’s Pension Methodology Makes for More Accurate Comparison
Ratings City Popul- CAFRUAAL ($B)
Moody'sANPL ($B)
Discount Rate Percent of Annual Rev Percent of Prop. Value
ation City Moody's Pension Debt Total Pension Debt Total
Aa2/AA/AA New York 8.4M 38.75 68.99 8.0% 6.2% 106% 108% 215% 8.7% 8.9% 17.6%
Aa2/AA-/AA- Los Angeles 3.8M 7.81 19.13 7.8% 5.7% 325% 77% 402% 3.6% 0.9% 4.5%
Baa1/A+/A- Chicago 2.7M 16.30 31.68 8.0% 4.4% 678% 211% 889% 12.6% 3.9% 16.5%
Aa2/AA+/AA Houston 2.2M 2.29 7.28 8.5% 5.5% 312% 171% 483% 4.3% 2.3% 6.6%
A2/A+/A- Philadelphia 1.6M 4.94 8.53 8.2% 5.5% 187% 109% 297% 11.6% 6.8% 18.4%
Aa1/AA+/NR Phoenix 1.5M 1.84 3.97 8.0% 5.7% 240% 176% 416% 2.2% 1.6% 3.8%
Ca/D/NR Detroit 688k 0.62 3.02 7.5% 5.5% 157% 172% 330% 10.8% 12% 22.6%CAFR UAAL - Unfunded pension liability as reported in City Comprehensive Annual Financial Report, Moody's ANPL - Unfunded pension liability adjusted for discount rate, smoothing, plan overlap and other factors, Data is from September 2013 Moody's report and refl ects city data from 2010-2012

MUNICIPAL BOND MARKET MONTHLYDecember 16, 2014
JANNEY MONTGOMERY SCOTT
www.janney.com
© 2014 Janney Montgomery Scott LLC
Member: NYSE, FINRA, SIPC
MUNICIPAL MONTHLY • PAGE 8
Based on a revised method-ology (April 2013), Moody’s analysis of pension funding makes a series of adjust-ments to develop an adjusted net pension liability (ANPL), supporting an apples to ap-ples comparison across vari-ous state and local pension systems.
ustment factor in the form of a discount rate which in theory projects investment returns for future years, must be incorporated into the arithmetic. As the table illustrates, discount rates range from 7.5% to 8.5%, which in the context of historical experience of investment returns are not realistic.
Based on a revised methodology (April 2013), Moody’s analysis of pension funding makes a series of adjustments to develop an adjusted net pension liability (ANPL), supporting an apples to apples comparison across various state and local pension systems. ANPL, which uses a more realistic dis-count rate, is derived by subtracting the adjusted liability for future payments from the amount of assets. The $620 million of unfunded pension liabilities reported by Detroit in 2012 for FY 2011 became $3 billion after application of Moody’s adjustments, including a more realistic discount rate of 5.5%. Rather than use the reported funding ratio (assets divided by liabilities) Moody’s compares the ANPL to the city or state’s annual revenue as well as the full amount of property value. When added to debt liabilities, as illustrated in the table of the six largest US cities (plus Detroit), this ratio offers a useful point of comparison across issuers.
New GASB Standards
Earlier this month, New Jersey released pension liability data using the new GASB standards. Com-paring this updated data to similar information, released a year earlier, highlights the major impact that the new rules will have on disclosure and transparency. Previously, the value of assets in a plan (actuarial value of assets) was determined using average asset value over a fi ve year period. Values under the new standards (fi duciary net position) are based on asset values in the year being reported. The previous standard’s “actuarial accrued liability” used a somewhat arbitrary investment return assumption for discounting future liabilities, in the case of New Jersey 7.9%, but the new standard requires that a more market based rate be applied on the unfunded portion of “total pen-sion liability”, which was 4.29% for New Jersey. The old “funded ratio” becomes the “net position as a percent of total pension liability.” Across all 7 of New Jersey’s plans, application of the new standards was largely responsible for lowering the actuarial estimate of the state’s pension funding level from a very low 57% to an extremely low 33% one year later. In dollar terms, the estimate of underfunding rose from $34 billion to $83 billion.
The newest data includes estimated dates by which pension assets will be depleted. When/if this occurs, pension payments will become pay-as-you-go as part of the state’s budget. A Moody’s report about New Jersey’s pension challenges notes that benefi t payments from the two largest plans, PERS and TPAF, totaled $4.9 billion in FY 2013, yet state contributions to those plans that year were only $878 million. These payments of less than the actuarially determined annual required contribution (ARC) are the reason funding levels have deteriorated for so many state and local plans. According to Moody’s, New Jersey has not contributed the full ARC in at least 17 years.
Pension Liability is Debt
Another element of the reporting changes is that in the Comprehensive Annual Financial Report (CAFR), the unfunded portion of pension plans will be included in the state or municipal balance sheet as a liability, just as bonds are. Under previous standards, pension liabilities were handled as
Earlier this month, New Jer-sey released pension liabil-ity data using the new GASB standards.
According to Moody’s, New Jersey has not contributed the full ARC in at least 17 years.
Under New GASB Standards the Optics of NJ’s Funding Levels are Worse
Source: Moody’s, NJ financials and Janney.
6-30-13 Financials Using Old GASB
As of 6-30-14 based on New GASB
Actuarial Value of Assets
Actuarial Accrued Liability
Unfunded Actuarial Liability
Funded Ratios
PlansFiduciary
Net Position
Total Pension Liability
Net Pension Liability
Net Position %
of TPLDepletion Date
9,512 19,384 9,872 49% PERS 8,650 30,976 22,327 28% 6/30/2024
31,214 52,637 21,423 59% TPAF 27,327 80,140 52,813 34% 6/30/2027
2,074 4,027 1,953 52% PFRS 1,888 6,622 4,734 29% 6/30/2027
2,264 3,386 1,123 67% Other 2,180 5,081 2,901 43% 2021 to 2032
45,064 79,434 34,370 57% Total 40,045 122,819 82,774 33%Amounts in millions of US dollars. PERS = Public Employee Retirement System. TPAF = Teacher's Pension and Annuity Fund. PFRS = Police and Fireman's Retirement System.
MUNICIPAL BOND MARKET MONTHLYDecember 16, 2014
JANNEY MONTGOMERY SCOTT
www.janney.com
© 2014 Janney Montgomery Scott LLC
Member: NYSE, FINRA, SIPC
MUNICIPAL MONTHLY • PAGE 9
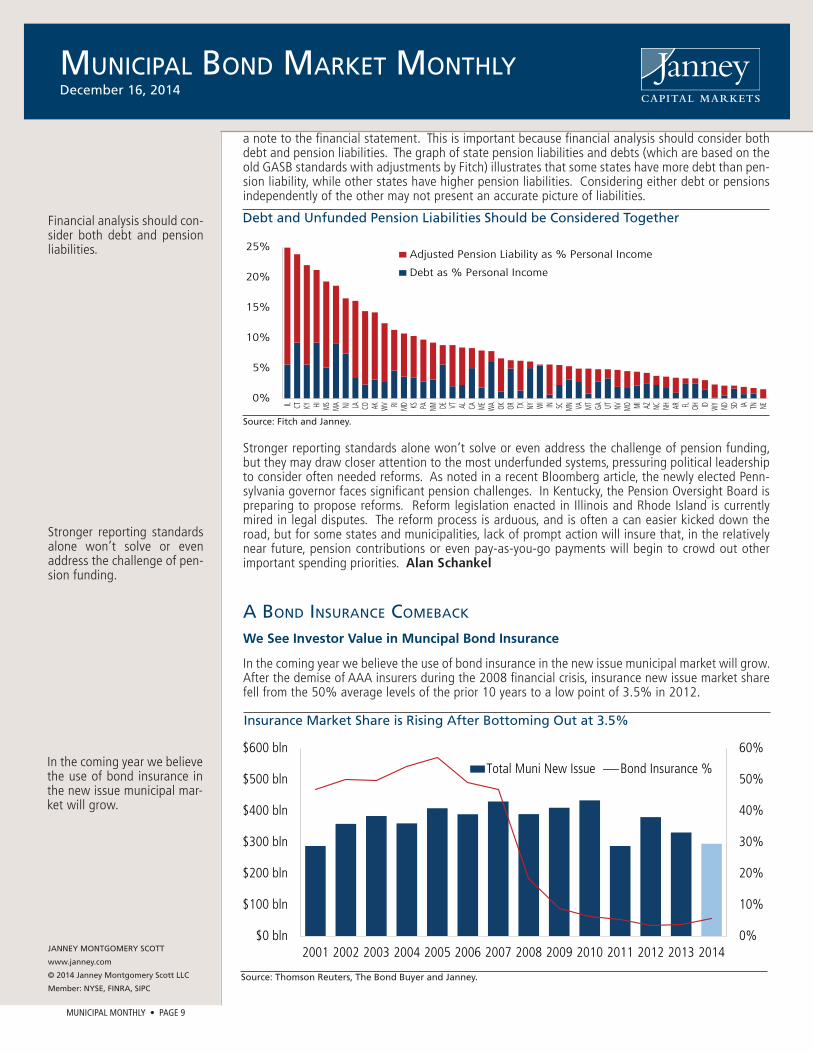
Financial analysis should con-sider both debt and pension liabilities.
a note to the fi nancial statement. This is important because fi nancial analysis should consider both debt and pension liabilities. The graph of state pension liabilities and debts (which are based on the old GASB standards with adjustments by Fitch) illustrates that some states have more debt than pen-sion liability, while other states have higher pension liabilities. Considering either debt or pensions independently of the other may not present an accurate picture of liabilities.
Stronger reporting standards alone won’t solve or even address the challenge of pension funding, but they may draw closer attention to the most underfunded systems, pressuring political leadership to consider often needed reforms. As noted in a recent Bloomberg article, the newly elected Penn-sylvania governor faces signifi cant pension challenges. In Kentucky, the Pension Oversight Board is preparing to propose reforms. Reform legislation enacted in Illinois and Rhode Island is currently mired in legal disputes. The reform process is arduous, and is often a can easier kicked down the road, but for some states and municipalities, lack of prompt action will insure that, in the relatively near future, pension contributions or even pay-as-you-go payments will begin to crowd out other important spending priorities. Alan Schankel
A BOND INSURANCE COMEBACK
We See Investor Value in Muncipal Bond Insurance
In the coming year we believe the use of bond insurance in the new issue municipal market will grow. After the demise of AAA insurers during the 2008 fi nancial crisis, insurance new issue market share fell from the 50% average levels of the prior 10 years to a low point of 3.5% in 2012.
Stronger reporting standards alone won’t solve or even address the challenge of pen-sion funding.
In the coming year we believe the use of bond insurance in the new issue municipal mar-ket will grow.
Debt and Unfunded Pension Liabilities Should be Considered Together
Source: Fitch and Janney.
0%
5%
10%
15%
20%
25%
IL CT KY HI MS MA NJ LA CO AK WV RI MD KS PA NM DE VT AL CA ME WA OK OR TX NY WI IN SC MN VA MT GA UT NV MO MI AZ NC NH AR FL OH ID W
Y ND SD IA TN NE
Adjusted Pension Liability as % Personal Income
Debt as % Personal Income
0%
10%
20%
30%
40%
50%
60%
$0 bln
$100 bln
$200 bln
$300 bln
$400 bln
$500 bln
$600 bln
2001 2002 2003 2004 2005 2006 2007 2008 2009 2010 2011 2012 2013 2014
Total Muni New Issue Bond Insurance %
Insurance Market Share is Rising After Bottoming Out at 3.5%
Source: Thomson Reuters, The Bond Buyer and Janney.
MUNICIPAL BOND MARKET MONTHLYDecember 16, 2014
JANNEY MONTGOMERY SCOTT
www.janney.com
© 2014 Janney Montgomery Scott LLC
Member: NYSE, FINRA, SIPC
MUNICIPAL MONTHLY • PAGE 10
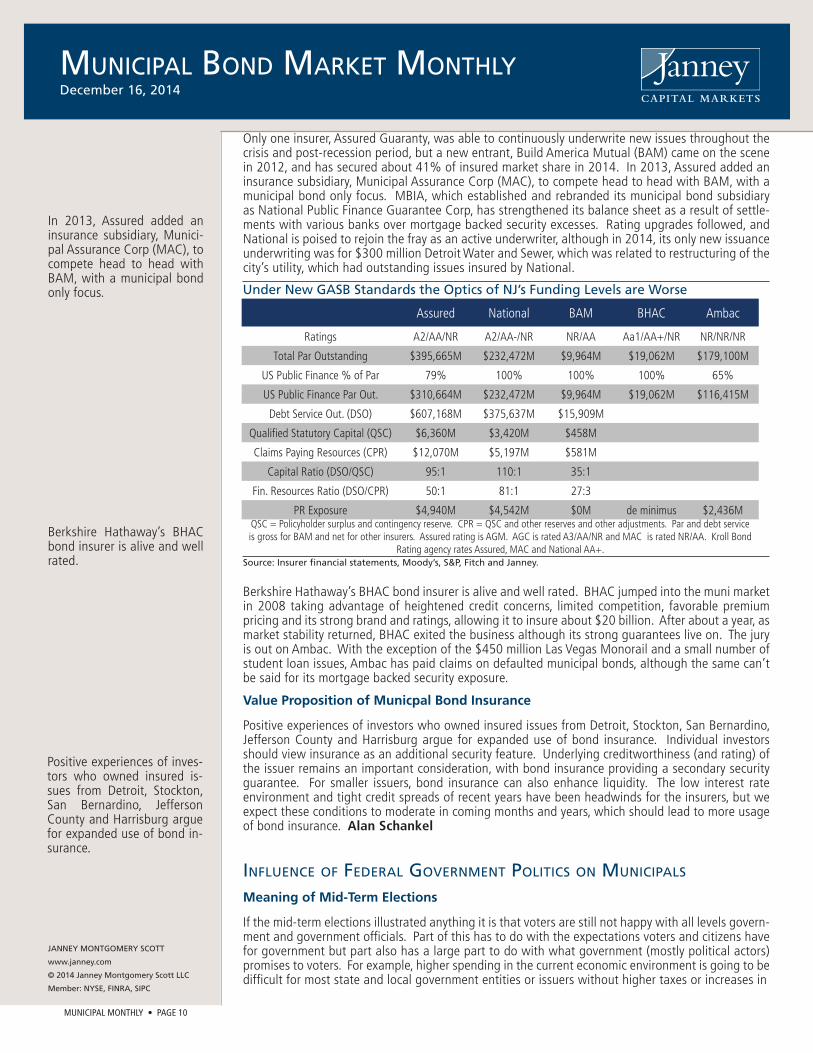
In 2013, Assured added an insurance subsidiary, Munici-pal Assurance Corp (MAC), to compete head to head with BAM, with a municipal bond only focus.
Only one insurer, Assured Guaranty, was able to continuously underwrite new issues throughout the crisis and post-recession period, but a new entrant, Build America Mutual (BAM) came on the scene in 2012, and has secured about 41% of insured market share in 2014. In 2013, Assured added an insurance subsidiary, Municipal Assurance Corp (MAC), to compete head to head with BAM, with a municipal bond only focus. MBIA, which established and rebranded its municipal bond subsidiary as National Public Finance Guarantee Corp, has strengthened its balance sheet as a result of settle-ments with various banks over mortgage backed security excesses. Rating upgrades followed, and National is poised to rejoin the fray as an active underwriter, although in 2014, its only new issuance underwriting was for $300 million Detroit Water and Sewer, which was related to restructuring of the city’s utility, which had outstanding issues insured by National.
Berkshire Hathaway’s BHAC bond insurer is alive and well rated. BHAC jumped into the muni market in 2008 taking advantage of heightened credit concerns, limited competition, favorable premium pricing and its strong brand and ratings, allowing it to insure about $20 billion. After about a year, as market stability returned, BHAC exited the business although its strong guarantees live on. The jury is out on Ambac. With the exception of the $450 million Las Vegas Monorail and a small number of student loan issues, Ambac has paid claims on defaulted municipal bonds, although the same can’t be said for its mortgage backed security exposure.
Value Proposition of Municpal Bond Insurance
Positive experiences of investors who owned insured issues from Detroit, Stockton, San Bernardino, Jefferson County and Harrisburg argue for expanded use of bond insurance. Individual investors should view insurance as an additional security feature. Underlying creditworthiness (and rating) of the issuer remains an important consideration, with bond insurance providing a secondary security guarantee. For smaller issuers, bond insurance can also enhance liquidity. The low interest rate environment and tight credit spreads of recent years have been headwinds for the insurers, but we expect these conditions to moderate in coming months and years, which should lead to more usage of bond insurance. Alan Schankel
INFLUENCE OF FEDERAL GOVERNMENT POLITICS ON MUNICIPALS
Meaning of Mid-Term Elections
If the mid-term elections illustrated anything it is that voters are still not happy with all levels govern-ment and government offi cials. Part of this has to do with the expectations voters and citizens have for government but part also has a large part to do with what government (mostly political actors) promises to voters. For example, higher spending in the current economic environment is going to be diffi cult for most state and local government entities or issuers without higher taxes or increases in
Berkshire Hathaway’s BHAC bond insurer is alive and well rated.
Positive experiences of inves-tors who owned insured is-sues from Detroit, Stockton, San Bernardino, Jefferson County and Harrisburg argue for expanded use of bond in-surance.
Under New GASB Standards the Optics of NJ’s Funding Levels are Worse
Source: Insurer financial statements, Moody’s, S&P, Fitch and Janney.
Assured National BAM BHAC Ambac
Ratings A2/AA/NR A2/AA-/NR NR/AA Aa1/AA+/NR NR/NR/NR
Total Par Outstanding $395,665M $232,472M $9,964M $19,062M $179,100M
US Public Finance % of Par 79% 100% 100% 100% 65%
US Public Finance Par Out. $310,664M $232,472M $9,964M $19,062M $116,415M
Debt Service Out. (DSO) $607,168M $375,637M $15,909M
Qualifi ed Statutory Capital (QSC) $6,360M $3,420M $458M
Claims Paying Resources (CPR) $12,070M $5,197M $581M
Capital Ratio (DSO/QSC) 95:1 110:1 35:1
Fin. Resources Ratio (DSO/CPR) 50:1 81:1 27:3
PR Exposure $4,940M $4,542M $0M de minimus $2,436MQSC = Policyholder surplus and contingency reserve. CPR = QSC and other reserves and other adjustments. Par and debt service is gross for BAM and net for other insurers. Assured rating is AGM. AGC is rated A3/AA/NR and MAC is rated NR/AA. Kroll Bond
Rating agency rates Assured, MAC and National AA+.

MUNICIPAL BOND MARKET MONTHLYDecember 16, 2014
JANNEY MONTGOMERY SCOTT
www.janney.com
© 2014 Janney Montgomery Scott LLC
Member: NYSE, FINRA, SIPC
MUNICIPAL MONTHLY • PAGE 11
If the mid-term elections il-lustrated anything it is that voters are still not happy with all levels government and government offi cials.
user fees. There is not a strong political will for increases in taxes or higher user fees. Our impres-sion is that taxpayers feel as though they already hand over a large chuck of their earnings and the government needs to fi gure out a better or more effi cient method to handle those revenues or balance expectations. Therefore, it is up to government to fi gure out how to handle the increasing expenditure demands with revenue streams that are not growing as fast as they were historically. This is especially relevant in an environment where most wages have not grown all that much in recent years.
No Imminent Threat to the Tax-Exemption Tax Expenditure in 2015
We have read several accounts that include analysis expecting tax reform as a result of changes made in Congress. And while discussions about this topic might occur throughout 2015 and propos-als even fl oated, we are currently seeing the threat to the tax exemption at its lowest point in many years. We do not expect Congress will act on legislation relating to the tax-exemption tax expendi-ture until post the 2016 Presidential election, at the very earliest. Proposals for Build America Bond (BAB) like products and media accounts of tax reform are expected, but actually movement on the issue is not. Political actors like to propose programs with BAB-like products, problem is that issuers were burned once because the federal government allowed a portion of the BAB subsidy to roll off as part of the Sequester-cuts. So, we know of hardly any issuers who would support such a product in the near term with a similar structure.
Example of Recent Headline Risk
A recent example of the type of headline risk investors can expect to see in the near term came recently in the form of a report from Senator Tom Coburn, a Republican from Oklahoma. Senator Coburn released a 92 page report entitled, “Tax Decoder”. The Bond Buyer immediately ran an article titled, “Sen. Coburn: Eliminate the Muni Tax Exemption.” The article cited anti-muni bond statements from the report and portions from a statement Senator Coburn sent to the Bond Buyer including:
• ”There is little economic reason to encourage state and local governments to issue debt rather than spend their money in other ways.”;
• ”Tax-exempt interest for municipal bonds functions largely as a subsidy for state and local debt, and results in a big tax break for the wealthy, at a cost of more than $40 billion every year,”;
• ”Like many other provisions outlined in Tax Decoder, it is another ineffi cient tax break that meddles in the market and results in higher debt and taxes for the general public.”
Our Opinion
We believe the municipal tax exemption is an effective and effi cient method way to fi nance munici-pal projects, including infrastructure. There is the potential for the tax-exemption to come under threat as a result of potential tax reform. But, it is unlikely that the threat becomes notable until after the 2016 election, at the earliest. In the meantime, investors will need to shift through reports and articles like this and please refer to our analysis. Tom Kozlik
A CLOSER LOOK AT WHAT 2015 HOLDS FOR PUERTO RICO
Puerto Rico’s Macro Problem(s): Too Much Debt & Contracting Economy
Although Puerto Rico’s governor and legislature have racked up signifi cant fi scal accomplishments over the past two years, the macro problem(s) for Puerto Rico’s bond investors remains unchanged - too much debt and a contracting economy. With March’s $3.5 billion general obligation issue, the Commonwealth demonstrated market access and was able to refi nance multiple short term obliga-tions with long term debt; however, although total public debt increased by about 5% with the is-sue, no bond proceeds were invested in infrastructure or employment or the economy, which is the traditional purpose of long term debt. The legislature recently passed legislation that will increase the island’s per barrel petroleum tax to $15.50 from $9.25 (from $3.00 before July 2013), which will support the issuance of as much as $2.9 billion of new debt. Modifi cations of the legislation are possible, since constraints about interest rates in the law could inhibit marketing of new debt. In any case, as with the March GO issue, new loans will be used to pay down short term debt, not to invest in infrastructure.
Therefore, it is up to govern-ment to fi gure out how to handle the increasing expen-diture demands with revenue streams that are not growing as fast as they were histori-cally.
The macro problem(s) for Puerto Rico’s bond investors remains unchanged - too much debt and a contracting economy.
MUNICIPAL BOND MARKET MONTHLYDecember 16, 2014
JANNEY MONTGOMERY SCOTT
www.janney.com
© 2014 Janney Montgomery Scott LLC
Member: NYSE, FINRA, SIPC
MUNICIPAL MONTHLY • PAGE 12
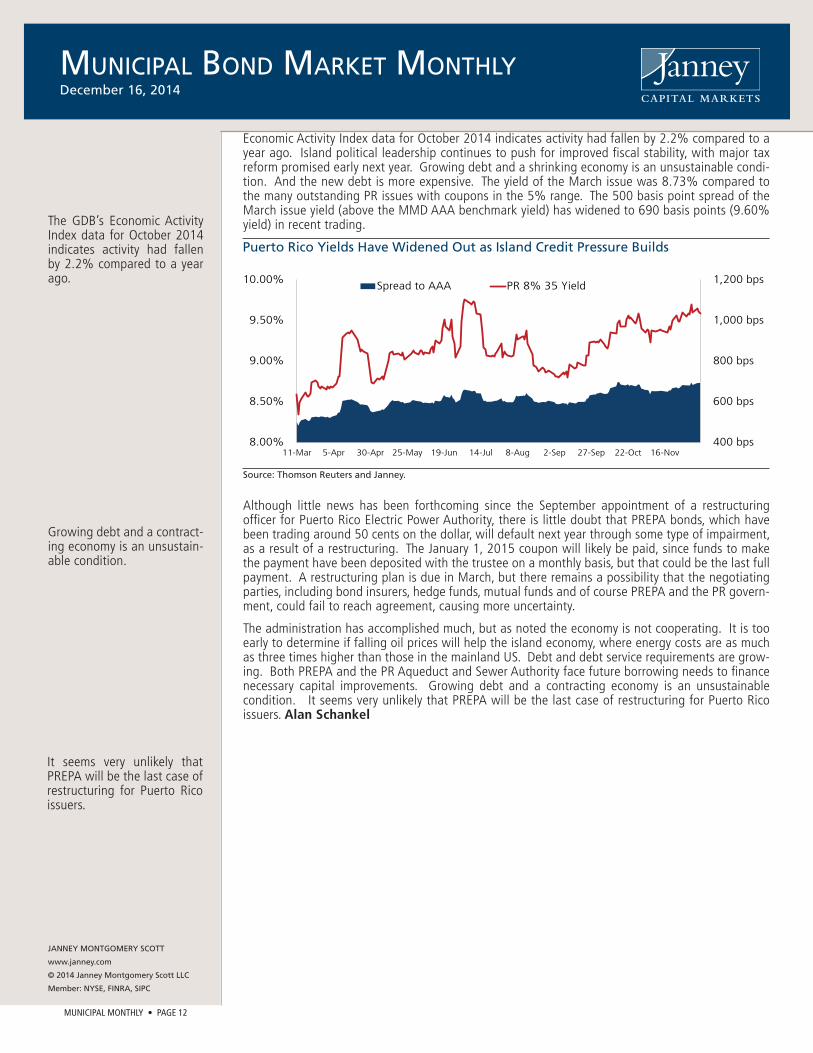
The GDB’s Economic Activity Index data for October 2014 indicates activity had fallen by 2.2% compared to a year ago.
Economic Activity Index data for October 2014 indicates activity had fallen by 2.2% compared to a year ago. Island political leadership continues to push for improved fi scal stability, with major tax reform promised early next year. Growing debt and a shrinking economy is an unsustainable condi-tion. And the new debt is more expensive. The yield of the March issue was 8.73% compared to the many outstanding PR issues with coupons in the 5% range. The 500 basis point spread of the March issue yield (above the MMD AAA benchmark yield) has widened to 690 basis points (9.60% yield) in recent trading.
Although little news has been forthcoming since the September appointment of a restructuring offi cer for Puerto Rico Electric Power Authority, there is little doubt that PREPA bonds, which have been trading around 50 cents on the dollar, will default next year through some type of impairment, as a result of a restructuring. The January 1, 2015 coupon will likely be paid, since funds to make the payment have been deposited with the trustee on a monthly basis, but that could be the last full payment. A restructuring plan is due in March, but there remains a possibility that the negotiating parties, including bond insurers, hedge funds, mutual funds and of course PREPA and the PR govern-ment, could fail to reach agreement, causing more uncertainty.
The administration has accomplished much, but as noted the economy is not cooperating. It is too early to determine if falling oil prices will help the island economy, where energy costs are as much as three times higher than those in the mainland US. Debt and debt service requirements are grow-ing. Both PREPA and the PR Aqueduct and Sewer Authority face future borrowing needs to fi nance necessary capital improvements. Growing debt and a contracting economy is an unsustainable condition. It seems very unlikely that PREPA will be the last case of restructuring for Puerto Rico issuers. Alan Schankel
Growing debt and a contract-ing economy is an unsustain-able condition.
It seems very unlikely that PREPA will be the last case of restructuring for Puerto Rico issuers.
Puerto Rico Yields Have Widened Out as Island Credit Pressure Builds
Source: Thomson Reuters and Janney.
400 bps
600 bps
800 bps
1,000 bps
1,200 bps
8.00%
8.50%
9.00%
9.50%
10.00%
11-Mar 5-Apr 30-Apr 25-May 19-Jun 14-Jul 8-Aug 2-Sep 27-Sep 22-Oct 16-Nov
Spread to AAA PR 8% 35 Yield
MUNICIPAL BOND MARKET MONTHLYDecember 16, 2014
MUNICIPAL MONTHLY • PAGE 13
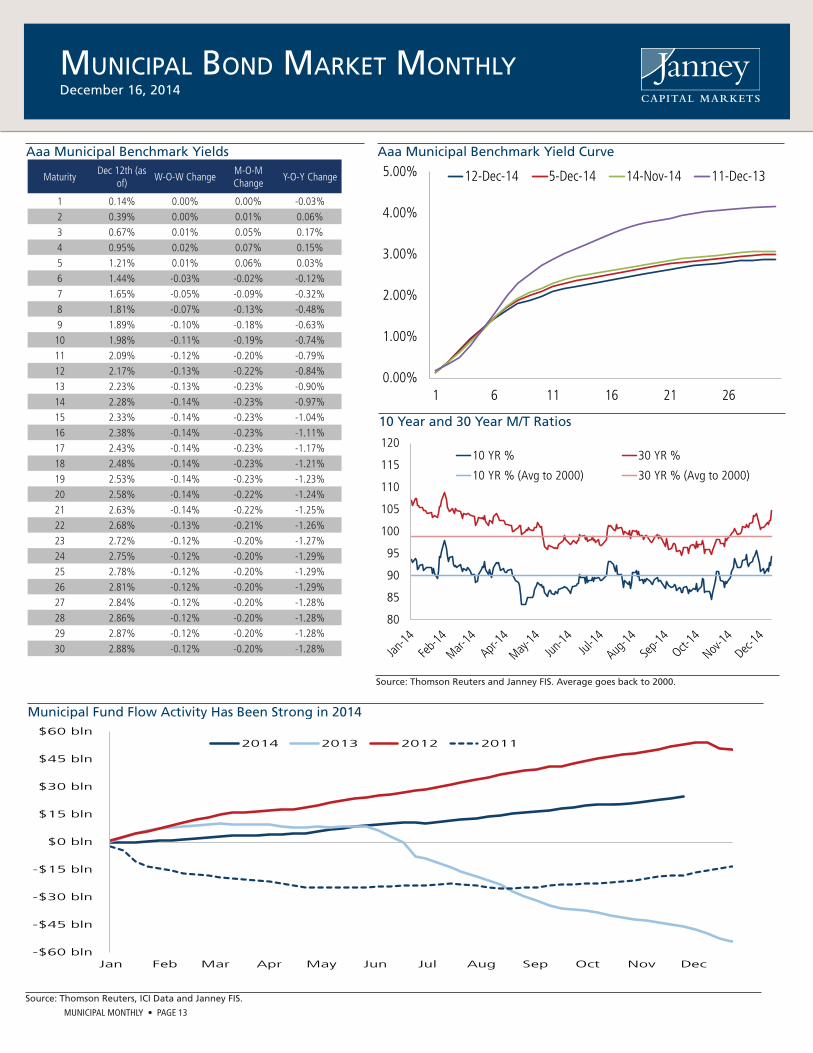
Aaa Municipal Benchmark Yields Aaa Municipal Benchmark Yield Curve
10 Year and 30 Year M/T Ratios
Municipal Fund Flow Activity Has Been Strong in 2014
Source: Thomson Reuters and Janney FIS. Average goes back to 2000.
-$60 bln
-$45 bln
-$30 bln
-$15 bln
$0 bln
$15 bln
$30 bln
$45 bln
$60 bln
Jan Feb Mar Apr May Jun Jul Aug Sep Oct Nov Dec
2014 2013 2012 2011
Source: Thomson Reuters, ICI Data and Janney FIS.
0.00%
1.00%
2.00%
3.00%
4.00%
5.00%
1 6 11 16 21 26
12-Dec-14 5-Dec-14 14-Nov-14 11-Dec-13
80
85
90
95
100
105
110
115
12010 YR % 30 YR %
10 YR % (Avg to 2000) 30 YR % (Avg to 2000)
MaturityDec 12th (as
of)W-O-W Change
M-O-M Change
Y-O-Y Change
1 0.14% 0.00% 0.00% -0.03%2 0.39% 0.00% 0.01% 0.06%3 0.67% 0.01% 0.05% 0.17%4 0.95% 0.02% 0.07% 0.15%5 1.21% 0.01% 0.06% 0.03%6 1.44% -0.03% -0.02% -0.12%7 1.65% -0.05% -0.09% -0.32%8 1.81% -0.07% -0.13% -0.48%9 1.89% -0.10% -0.18% -0.63%10 1.98% -0.11% -0.19% -0.74%11 2.09% -0.12% -0.20% -0.79%12 2.17% -0.13% -0.22% -0.84%13 2.23% -0.13% -0.23% -0.90%14 2.28% -0.14% -0.23% -0.97%15 2.33% -0.14% -0.23% -1.04%16 2.38% -0.14% -0.23% -1.11%17 2.43% -0.14% -0.23% -1.17%18 2.48% -0.14% -0.23% -1.21%19 2.53% -0.14% -0.23% -1.23%20 2.58% -0.14% -0.22% -1.24%21 2.63% -0.14% -0.22% -1.25%22 2.68% -0.13% -0.21% -1.26%23 2.72% -0.12% -0.20% -1.27%24 2.75% -0.12% -0.20% -1.29%25 2.78% -0.12% -0.20% -1.29%26 2.81% -0.12% -0.20% -1.29%27 2.84% -0.12% -0.20% -1.28%28 2.86% -0.12% -0.20% -1.28%29 2.87% -0.12% -0.20% -1.28%30 2.88% -0.12% -0.20% -1.28%
MUNICIPAL BOND MARKET MONTHLYDecember 16, 2014
MUNICIPAL MONTHLY • PAGE 14
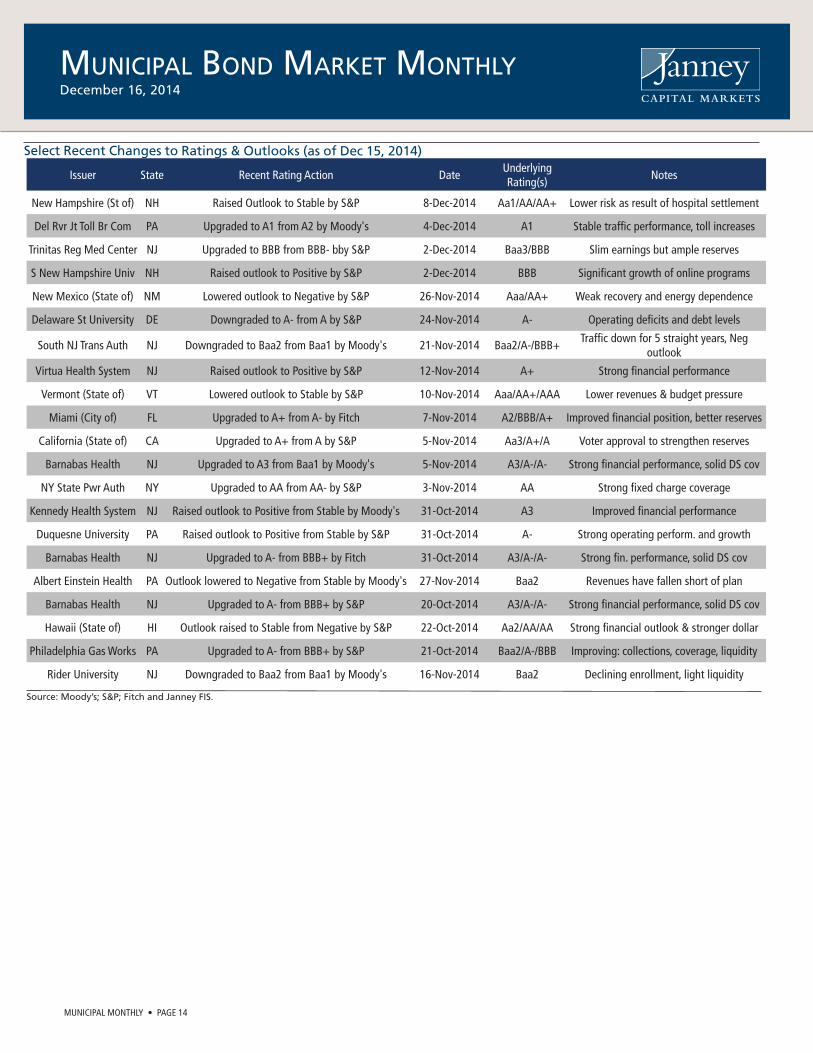
Select Recent Changes to Ratings & Outlooks (as of Dec 15, 2014)
Source: Moody’s; S&P; Fitch and Janney FIS.
Issuer State Recent Rating Action DateUnderlying Rating(s)
Notes
New Hampshire (St of) NH Raised Outlook to Stable by S&P 8-Dec-2014 Aa1/AA/AA+ Lower risk as result of hospital settlement
Del Rvr Jt Toll Br Com PA Upgraded to A1 from A2 by Moody's 4-Dec-2014 A1 Stable traffi c performance, toll increases
Trinitas Reg Med Center NJ Upgraded to BBB from BBB- bby S&P 2-Dec-2014 Baa3/BBB Slim earnings but ample reserves
S New Hampshire Univ NH Raised outlook to Positive by S&P 2-Dec-2014 BBB Signifi cant growth of online programs
New Mexico (State of) NM Lowered outlook to Negative by S&P 26-Nov-2014 Aaa/AA+ Weak recovery and energy dependence
Delaware St University DE Downgraded to A- from A by S&P 24-Nov-2014 A- Operating defi cits and debt levels
South NJ Trans Auth NJ Downgraded to Baa2 from Baa1 by Moody's 21-Nov-2014 Baa2/A-/BBB+Traffi c down for 5 straight years, Neg
outlook
Virtua Health System NJ Raised outlook to Positive by S&P 12-Nov-2014 A+ Strong fi nancial performance
Vermont (State of) VT Lowered outlook to Stable by S&P 10-Nov-2014 Aaa/AA+/AAA Lower revenues & budget pressure
Miami (City of) FL Upgraded to A+ from A- by Fitch 7-Nov-2014 A2/BBB/A+ Improved fi nancial position, better reserves
California (State of) CA Upgraded to A+ from A by S&P 5-Nov-2014 Aa3/A+/A Voter approval to strengthen reserves
Barnabas Health NJ Upgraded to A3 from Baa1 by Moody's 5-Nov-2014 A3/A-/A- Strong fi nancial performance, solid DS cov
NY State Pwr Auth NY Upgraded to AA from AA- by S&P 3-Nov-2014 AA Strong fi xed charge coverage
Kennedy Health System NJ Raised outlook to Positive from Stable by Moody's 31-Oct-2014 A3 Improved fi nancial performance
Duquesne University PA Raised outlook to Positive from Stable by S&P 31-Oct-2014 A- Strong operating perform. and growth
Barnabas Health NJ Upgraded to A- from BBB+ by Fitch 31-Oct-2014 A3/A-/A- Strong fi n. performance, solid DS cov
Albert Einstein Health PA Outlook lowered to Negative from Stable by Moody's 27-Nov-2014 Baa2 Revenues have fallen short of plan
Barnabas Health NJ Upgraded to A- from BBB+ by S&P 20-Oct-2014 A3/A-/A- Strong fi nancial performance, solid DS cov
Hawaii (State of) HI Outlook raised to Stable from Negative by S&P 22-Oct-2014 Aa2/AA/AA Strong fi nancial outlook & stronger dollar
Philadelphia Gas Works PA Upgraded to A- from BBB+ by S&P 21-Oct-2014 Baa2/A-/BBB Improving: collections, coverage, liquidity
Rider University NJ Downgraded to Baa2 from Baa1 by Moody's 16-Nov-2014 Baa2 Declining enrollment, light liquidity

MUNICIPAL BOND MARKET MONTHLYDecember 16, 2014
MUNICIPAL MONTHLY • PAGE 15
Source: Moody’s; S&P; Fitch and Janney FIS. (*) Denotes a Lease or Issuer Credit Rating.
State and Other Select Issuer Ratings (Dec 15, 2014) Moody's S&P Fitch
State Rating Outlook Last Rating Outlook Last Rating Outlook LastAlabama Aa1 Stable 4/16/2010 AA Positive 11/27/2013 AA+ Stable 5/3/2010Alaska Aaa Stable 11/22/2010 AAA Stable 1/5/2012 AAA Stable 1/7/2013
Arizona (*) Aa3 Positive 11/26/2013 AA- Stable 12/23/2011 NR - -Arkansas Aa1 Stable 4/16/2010 AA Stable 1/10/2003 NR - -California Aa3 Stable 6/25/2014 A+ Stable 11/5/2014 A Stable 8/5/2013
Colorado (*) Aa1 Stable 4/16/2010 AA Stable 7/10/2007 NR - -Connecticut Aa3 Stable 1/20/2012 AA Stable 9/26/2003 AA Negative 7/2/2013Delaware Aaa Stable 4/30/2010 AAA Stable 2/22/2000 AAA Stable 4/13/2006
Dist. of Columbia Aa2 Stable 8/2/2013 AA- Stable 3/21/2013 AA- Stable 4/5/2010Florida Aa1 Stable 4/16/2010 AAA Stable 7/12/2011 AAA Stable 8/23/2013Georgia Aaa Stable 4/16/2010 AAA Stable 7/29/1997 AAA Stable 4/13/2006Hawaii Aa2 Stable 5/17/2011 AA Stable 11/22/2014 AA Stable 6/15/2011
Idaho (*) Aa1 Stable 4/16/2010 AA+ Stable 3/30/2011 AA Stable 4/5/2010Illinois A3 Negative 6/6/2013 A- Negative 6/23/2014 A- Negative 6/3/2013
Indiana (*) Aaa Stable 4/16/2010 AAA Stable 7/18/2008 AA+ Stable 4/5/2010Iowa (*) Aaa Stable 4/16/2010 AAA Stable 9/11/2008 AAA Stable 4/5/2010
Kansas (*) Aa2 Stable 4/30/2014 AA Negative 8/6/2014 None None NoneKentucky (*) Aa2 Stable 6/2/2014 AA- Negative 1/31/2013 A+ Stable 11/8/2012
Louisiana Aa2 Stable 4/16/2010 AA Stable 5/4/2011 AA Stable 4/5/2010Maine Aa2 Stable 6/4/2014 AA Stable 5/24/2012 AA Stable 1/23/2013
Maryland Aaa Stable 7/19/2013 AAA Stable 5/7/1992 AAA Stable 4/13/2006Massachusetts Aa1 Stable 4/16/2010 AA+ Stable 9/16/2011 AA+ Stable 4/5/2010
Michigan Aa2 Positive 3/28/2013 AA- Stable 6/17/2014 AA Stable 4/2/2013Minnesota Aa1 Stable 7/30/2013 AA+ Stable 9/29/2011 AA+ Stable 7/7/2011Mississippi Aa2 Stable 4/16/2010 AA Stable 11/30/2005 AA+ Negative 11/15/2013Missouri Aaa Stable 7/19/2013 AAA Stable 2/16/1994 AAA Stable 4/13/2006Montana Aa1 Stable 4/16/2010 AA Stable 5/5/2008 AA+ Stable 4/5/2010
Nebraska (*) Aa2 Stable 4/16/2010 AAA Stable 5/5/2011 NR - -Nevada Aa2 Stable 3/24/2011 AA Stable 3/10/2011 AA+ Stable 4/5/2010
New Hampshire Aa1 Stable 4/16/2010 AA Stable 12/8/2014 AA+ Stable 4/5/2010New Jersey A1 Negative 5/13/2014 A Stable 9/10/2014 A Negative 9/5/2014New Mexico Aaa Stable 7/19/2013 AA+ Negative 11/26/2014 NR - -
New York Aa1 Stable 6/16/2014 AA+ Stable 7/23/2014 AA+ Stable 6/25/2014North Carolina Aaa Stable 1/12/2007 AAA Stable 6/25/1992 AAA Stable 4/13/2006
North Dakota (*) Aa1 Stable 4/16/2010 AAA Stable 12/13/2013 NR - -Ohio Aa1 Stable 3/16/2012 AA+ Stable 7/19/2011 AA+ Stable 4/11/2011
Oklahoma Aa2 Stable 4/16/2010 AA+ Stable 9/5/2008 AA+ Stable 4/5/2010Oregon Aa1 Stable 4/16/2010 AA+ Stable 3/10/2011 AA+ Stable 4/5/2010
Pennsylvania Aa3 Stable 7/21/2014 AA- Stable 9/25/2014 AA- Stable 9/23/2013Puerto Rico B2 Negative 7/1/2014 BB Negative 7/11/2014 BB- Negative 7/9/2014
Rhode Island Aa2 Stable 10/6/2014 AA Stable 6/18/2014 AA Stable 7/18/2011South Carolina Aaa Stable 12/7/2011 AA+ Stable 7/11/2005 AAA Stable 4/13/2006
South Dakota (*) Aa2 Stable 5/27/2010 AA+ Stable 3/25/2011 AA Positive 8/1/2014Tennessee Aaa Stable 12/7/2011 AA+ Stable 11/5/2013 AAA Stable 4/5/2010
Texas Aaa Stable 4/16/2010 AAA Stable 9/27/2013 AAA Stable 4/5/2010Utah Aaa Stable 4/16/2010 AAA Stable 6/7/1991 AAA Stable 4/13/2006
Vermont Aaa Stable 4/16/2010 AA+ Stable 11/10/2014 AAA Stable 4/5/2010Virginia Aaa Stable 7/19/2013 AAA Stable 11/11/1992 AAA Stable 4/13/2006
Washington Aa1 Stable 7/19/2013 AA+ Stable 11/12/2007 AA+ Stable 7/19/2013West Virginia Aa1 Stable 7/9/2010 AA Stable 8/21/2009 AA+ Stable 7/8/2011
Wisconsin Aa2 Stable 4/16/2010 AA Stable 8/15/2008 AA Stable 4/5/2010Wyoming (*) NR - - AAA Stable 5/3/2011 NR - -
MUNICIPAL BOND MARKET MONTHLYDecember 16, 2014
MUNICIPAL MONTHLY • PAGE 16
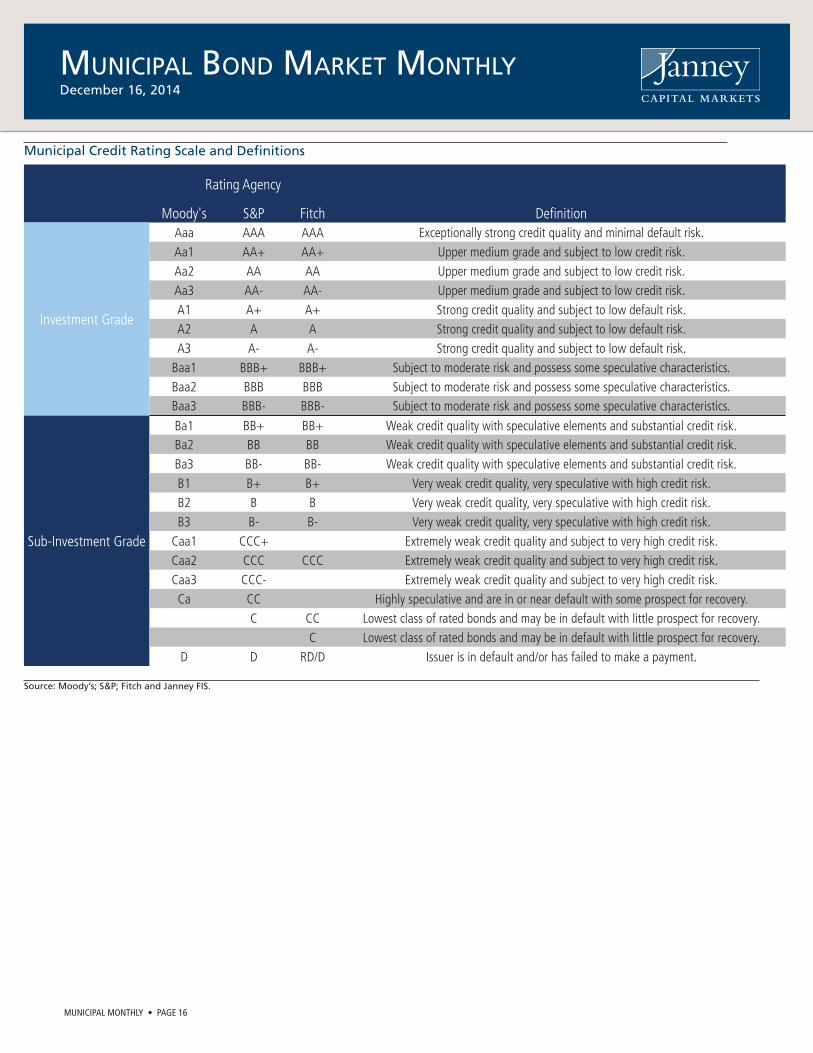
Municipal Credit Rating Scale and Definitions
Source: Moody’s; S&P; Fitch and Janney FIS.
Rating Agency
Moody's S&P Fitch Defi nition
Investment Grade
Aaa AAA AAA Exceptionally strong credit quality and minimal default risk.Aa1 AA+ AA+ Upper medium grade and subject to low credit risk.Aa2 AA AA Upper medium grade and subject to low credit risk.Aa3 AA- AA- Upper medium grade and subject to low credit risk.A1 A+ A+ Strong credit quality and subject to low default risk.A2 A A Strong credit quality and subject to low default risk.A3 A- A- Strong credit quality and subject to low default risk.
Baa1 BBB+ BBB+ Subject to moderate risk and possess some speculative characteristics.Baa2 BBB BBB Subject to moderate risk and possess some speculative characteristics.Baa3 BBB- BBB- Subject to moderate risk and possess some speculative characteristics.
Sub-Investment Grade
Ba1 BB+ BB+ Weak credit quality with speculative elements and substantial credit risk.Ba2 BB BB Weak credit quality with speculative elements and substantial credit risk.Ba3 BB- BB- Weak credit quality with speculative elements and substantial credit risk.B1 B+ B+ Very weak credit quality, very speculative with high credit risk.B2 B B Very weak credit quality, very speculative with high credit risk.B3 B- B- Very weak credit quality, very speculative with high credit risk.
Caa1 CCC+ Extremely weak credit quality and subject to very high credit risk.Caa2 CCC CCC Extremely weak credit quality and subject to very high credit risk.Caa3 CCC- Extremely weak credit quality and subject to very high credit risk.Ca CC Highly speculative and are in or near default with some prospect for recovery.
C CC Lowest class of rated bonds and may be in default with little prospect for recovery.C Lowest class of rated bonds and may be in default with little prospect for recovery.
D D RD/D Issuer is in default and/or has failed to make a payment.
MUNICIPAL BOND MARKET MONTHLYDecember 16, 2014
MUNICIPAL MONTHLY • PAGE 17
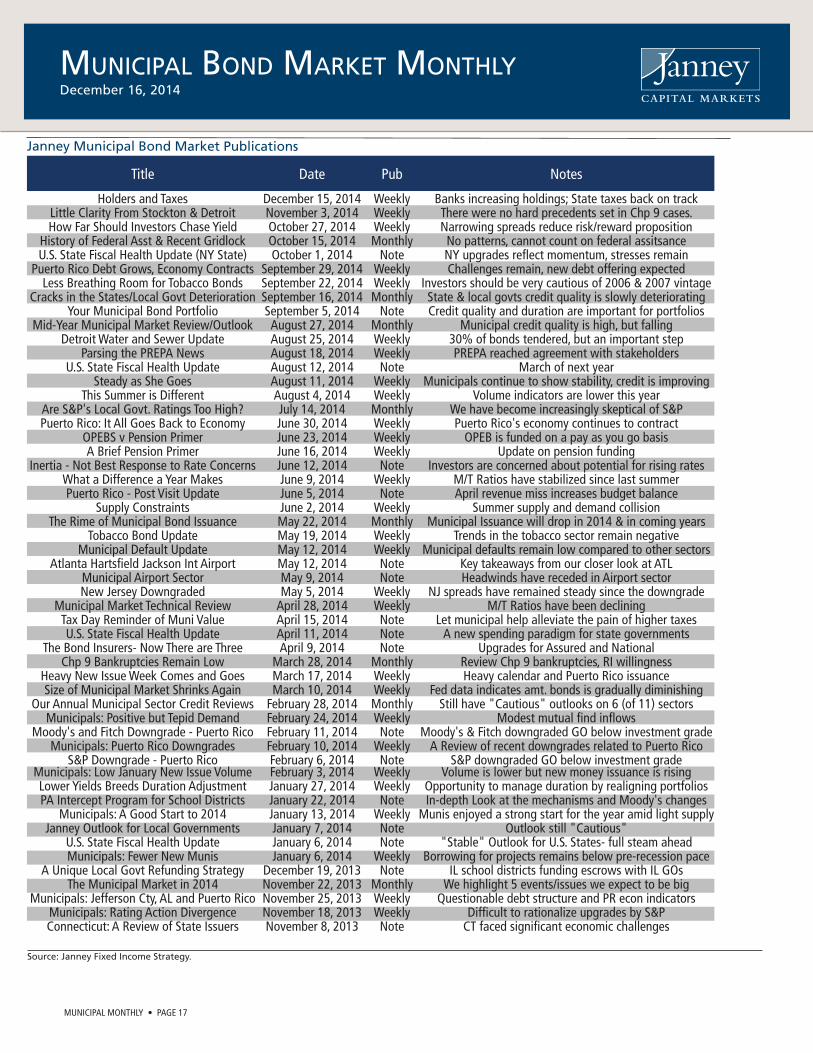
Source: Janney Fixed Income Strategy.
Janney Municipal Bond Market Publications
Title Date Pub Notes
Holders and Taxes December 15, 2014 Weekly Banks increasing holdings; State taxes back on trackLittle Clarity From Stockton & Detroit November 3, 2014 Weekly There were no hard precedents set in Chp 9 cases.How Far Should Investors Chase Yield October 27, 2014 Weekly Narrowing spreads reduce risk/reward proposition
History of Federal Asst & Recent Gridlock October 15, 2014 Monthly No patterns, cannot count on federal assitsanceU.S. State Fiscal Health Update (NY State) October 1, 2014 Note NY upgrades refl ect momentum, stresses remain
Puerto Rico Debt Grows, Economy Contracts September 29, 2014 Weekly Challenges remain, new debt offering expectedLess Breathing Room for Tobacco Bonds September 22, 2014 Weekly Investors should be very cautious of 2006 & 2007 vintage
Cracks in the States/Local Govt Deterioration September 16, 2014 Monthly State & local govts credit quality is slowly deterioratingYour Municipal Bond Portfolio September 5, 2014 Note Credit quality and duration are important for portfolios
Mid-Year Municipal Market Review/Outlook August 27, 2014 Monthly Municipal credit quality is high, but fallingDetroit Water and Sewer Update August 25, 2014 Weekly 30% of bonds tendered, but an important step
Parsing the PREPA News August 18, 2014 Weekly PREPA reached agreement with stakeholders U.S. State Fiscal Health Update August 12, 2014 Note March of next year
Steady as She Goes August 11, 2014 Weekly Municipals continue to show stability, credit is improvingThis Summer is Different August 4, 2014 Weekly Volume indicators are lower this year
Are S&P's Local Govt. Ratings Too High? July 14, 2014 Monthly We have become increasingly skeptical of S&PPuerto Rico: It All Goes Back to Economy June 30, 2014 Weekly Puerto Rico's economy continues to contract
OPEBS v Pension Primer June 23, 2014 Weekly OPEB is funded on a pay as you go basisA Brief Pension Primer June 16, 2014 Weekly Update on pension funding
Inertia - Not Best Response to Rate Concerns June 12, 2014 Note Investors are concerned about potential for rising ratesWhat a Difference a Year Makes June 9, 2014 Weekly M/T Ratios have stabilized since last summerPuerto Rico - Post Visit Update June 5, 2014 Note April revenue miss increases budget balance
Supply Constraints June 2, 2014 Weekly Summer supply and demand collisionThe Rime of Municipal Bond Issuance May 22, 2014 Monthly Municipal Issuance will drop in 2014 & in coming years
Tobacco Bond Update May 19, 2014 Weekly Trends in the tobacco sector remain negativeMunicipal Default Update May 12, 2014 Weekly Municipal defaults remain low compared to other sectors
Atlanta Hartsfi eld Jackson Int Airport May 12, 2014 Note Key takeaways from our closer look at ATLMunicipal Airport Sector May 9, 2014 Note Headwinds have receded in Airport sectorNew Jersey Downgraded May 5, 2014 Weekly NJ spreads have remained steady since the downgrade
Municipal Market Technical Review April 28, 2014 Weekly M/T Ratios have been decliningTax Day Reminder of Muni Value April 15, 2014 Note Let municipal help alleviate the pain of higher taxesU.S. State Fiscal Health Update April 11, 2014 Note A new spending paradigm for state governments
The Bond Insurers- Now There are Three April 9, 2014 Note Upgrades for Assured and NationalChp 9 Bankruptcies Remain Low March 28, 2014 Monthly Review Chp 9 bankruptcies, RI willingness
Heavy New Issue Week Comes and Goes March 17, 2014 Weekly Heavy calendar and Puerto Rico issuanceSize of Municipal Market Shrinks Again March 10, 2014 Weekly Fed data indicates amt. bonds is gradually diminishing
Our Annual Municipal Sector Credit Reviews February 28, 2014 Monthly Still have "Cautious" outlooks on 6 (of 11) sectorsMunicipals: Positive but Tepid Demand February 24, 2014 Weekly Modest mutual fi nd infl ows
Moody's and Fitch Downgrade - Puerto Rico February 11, 2014 Note Moody's & Fitch downgraded GO below investment gradeMunicipals: Puerto Rico Downgrades February 10, 2014 Weekly A Review of recent downgrades related to Puerto Rico
S&P Downgrade - Puerto Rico February 6, 2014 Note S&P downgraded GO below investment gradeMunicipals: Low January New Issue Volume February 3, 2014 Weekly Volume is lower but new money issuance is risingLower Yields Breeds Duration Adjustment January 27, 2014 Weekly Opportunity to manage duration by realigning portfoliosPA Intercept Program for School Districts January 22, 2014 Note In-depth Look at the mechanisms and Moody's changes
Municipals: A Good Start to 2014 January 13, 2014 Weekly Munis enjoyed a strong start for the year amid light supplyJanney Outlook for Local Governments January 7, 2014 Note Outlook still "Cautious"
U.S. State Fiscal Health Update January 6, 2014 Note "Stable" Outlook for U.S. States- full steam aheadMunicipals: Fewer New Munis January 6, 2014 Weekly Borrowing for projects remains below pre-recession pace
A Unique Local Govt Refunding Strategy December 19, 2013 Note IL school districts funding escrows with IL GOsThe Municipal Market in 2014 November 22, 2013 Monthly We highlight 5 events/issues we expect to be big
Municipals: Jefferson Cty, AL and Puerto Rico November 25, 2013 Weekly Questionable debt structure and PR econ indicatorsMunicipals: Rating Action Divergence November 18, 2013 Weekly Diffi cult to rationalize upgrades by S&PConnecticut: A Review of State Issuers November 8, 2013 Note CT faced signifi cant economic challenges

MUNICIPAL BOND MARKET MONTHLYDecember 16, 2014
JANNEY MONTGOMERY SCOTT
www.janney.com
© 2014 Janney Montgomery Scott LLC
Member: NYSE, FINRA, SIPC
MUNICIPAL MONTHLY • PAGE 18
Analyst Certifi cation
We, Tom Kozlik and Alan Schankel, the Primarily Responsible Analysts for this report, hereby certify that all of the views expressed in this report accurately refl ect our personal views about any and all of the subject sectors, industries, securities, and issuers. No part of our compensation was, is, or will be, directly or indirectly, related to the specifi c recommendations or views expressed in this research report.
Defi nition of Outlooks
Positive: Janney FIS believes there are apparent factors which point towards improving issuer or sector credit quality which may result in potential credit ratings upgrades
Stable: Janney FIS believes there are factors which point towards stable issuer or sector credit quality which are unlikely to result in either potential credit ratings upgrades or downgrades.
Cautious: Janney FIS believes there are factors which introduce the potential for declines in issuer or sector credit quality that may result in potential credit ratings downgrades.
Negative: Janney FIS believes there are factors which point towards weakening in issuer credit quality that will likely result in credit ratings downgrades.
Defi nition of Ratings
Overweight: Janney FIS expects the target asset class or sector to outperform the comparable benchmark (below) in its asset class in terms of total return
Marketweight: Janney FIS expects the target asset class or sector to perform in line with the comparable benchmark (below) in its asset class in terms of total return
Underweight: Janney FIS expects the target asset class or sector to underperform the comparable benchmark (below) in its asset class in terms of total return
Benchmarks
Asset Classes: Janney FIS ratings for domestic fi xed income asset classes including Treasuries, Agencies, Mortgages, Investment Grade Credit, High Yield Credit, and Municipals employ the “Barclay’s U.S. Aggregate Bond Market Index” as a benchmark.
Treasuries: Janney FIS ratings employ the “Barclay’s U.S. Treasury Index” as a benchmark.
Agencies: Janney FIS ratings employ the “Barclay’s U.S. Agency Index” as a benchmark.
Mortgages: Janney FIS ratings employ the “Barclay’s U.S. MBS Index” as a benchmark.
Investment Grade Credit: Janney FIS ratings employ the “Barclay’s U.S. Credit Index” as a benchmark.
High Yield Credit: Janney FIS ratings for employ “Barclay’s U.S. Corporate High Yield Index” as a benchmark.
Municipals: Janney FIS ratings employ the “Barclay’s Municipal Bond Index” as a benchmark.
Disclaimer
Janney or its affi liates may from time to time have a proprietary position in the various debt obligations of the issuers mentioned in this publication.
Unless otherwise noted, market data is from Bloomberg, Barclays, and Janney Fixed Income Strategy & Research (Janney FIS).
This report is the intellectual property of Janney Montgomery Scott LLC (Janney) and may not be reproduced, distributed, or published by any person for any purpose without Janney’s express prior written consent.
This report has been prepared by Janney and is to be used for informational purposes only. In no event should it be construed as a solicitation or offer to purchase or sell a security. The information presented herein is taken from sources believed to be reliable, but is not guaranteed by Janney as to accuracy or completeness. Any issue named or rates mentioned are used for illustrative purposes only, and may not represent the specifi c features or securities available at a given time. Preliminary Offi cial Statements, Final Offi cial Statements, or Prospectuses for any new issues mentioned herein are available upon request. The value of and income from investments may vary because of changes in interest rates, foreign exchange rates, securities prices, market indexes, as well as operational or fi nancial conditions of issuers or other factors. Past performance is not necessarily a guide to future performance. Estimates of future performance are based on assumptions that may not be realized. We have no obligation to tell you when opinions or information contained in Janney FIS publications change.
Janney Fixed Income Strategy does not provide individually tailored investment advice and this document has been prepared without regard to the circumstances and objectives of those who receive it. The appropriateness of an investment or strategy will depend on an investor’s circumstances and objectives. For investment advice specifi c to your individual situation, or for additional information on this or other topics, please contact your Janney Financial Consultant and/or your tax or legal advisor.