JANEZ DEMSAR AND B Z From Experimental Machine Learning to
15
white paper 1 data mining fruitful&fun Orange is a comprehensive, component-based framework for both experienced data mining and machine learning users and developers, and for those just entering the field that can interface Orange through short Python scripts or visually design data mining applications using Orange Canvas and widgets. Q uite a few years ago, we were (each!) writing our own code for attribute scoring, decision tree induction, ten-fold cross validation and alike (not to mention routines for loading the data and pretty-printing). We got bored. Knowing that coding of the basic set of tools from the ground up was within the job description of just about any researcher in machine learning did not help. At the time quite a few machine learning programs like C4.5 and CN2 were available, but they were coded separately, used different data file formats, and were incompatible in every other respect. There were very few machine learning suites available, which did not offer much in terms of easy prototyping and flexibility in experimenting. Then, thanks to Donald Michie, in 1997 came a meeting called WebLab. Taking place at a romantic site (Lake Bled), it called for at a time rather rule-breaking initiative to build a flexible experimental benchmark where one could easily add his own algorithms, record the experiments through scripts, and do all sorts of data analysis and machine learning. The benchmark would support both scripting and graphical user’s interface. WebLab meeting generated a number of good ideas, but never took on a project it was aiming for. Nevertheless, though, it inspired us, and in that year we have started to work on Orange, a machine learning and data mining suite that had occupied us ever since. Orange, the Data Mining Framework Orange is a library of C++ core objects and routines that includes a large vari- ety of standard and not-so-standard machine learning and data mining algo- rithms, plus routines for data input and manipulation. Orange is also a script- able environment for fast prototyping of new algorithms and testing schemes. It is a collection of Python-based modules that sit over the core library and im- plement some functionality for which execution time is not crucial and which is easier done in Python than in C++. This includes a variety of tasks such as pretty-print of decision trees, attribute subset, bagging and boosting, and alike. Orange is also a set of graphical widgets that use methods from core library and Orange modules and provide a nice user’s interface. Widgets support sig- nal-based communication and can be assembled together into an application by a visual programming tool called Orange Canvas. JANEZ DEMSAR AND BLAZ ZUPAN From Experimental Machine Learning to Interactive Data Mining
Transcript of JANEZ DEMSAR AND B Z From Experimental Machine Learning to
white paper 1
data mining
fruitful&fun
Orange is a comprehensive, component-based framework for both experienced data mining and machine learning users and developers, and for those just entering the field that can interface Orange through short Python scripts or visually design data mining applications using Orange Canvas and widgets.
Q uite a few years ago, we were (each!) writing our own code for attribute
scoring, decision tree induction, ten-fold cross validation and alike (not to
mention routines for loading the data and pretty-printing). We got bored.
Knowing that coding of the basic set of tools from the ground up was within
the job description of just about any researcher in machine learning did not
help. At the time quite a few machine learning programs like C4.5 and CN2
were available, but they were coded separately, used different data file formats,
and were incompatible in every other respect. There were very few machine
learning suites available, which did not offer much in terms of easy prototyping
and flexibility in experimenting.
Then, thanks to Donald Michie, in 1997 came a meeting called WebLab. Taking
place at a romantic site (Lake Bled), it called for at a time rather rule-breaking
initiative to build a flexible experimental benchmark where one could easily
add his own algorithms, record the experiments through scripts, and do all
sorts of data analysis and machine learning. The benchmark would support
both scripting and graphical user’s interface. WebLab meeting generated a
number of good ideas, but never took on a project it was aiming for.
Nevertheless, though, it inspired us, and in that year we have started to work
on Orange, a machine learning and data mining suite that had occupied us
ever since.
Orange, the Data Mining Framework
Orange is a library of C++ core objects and routines that includes a large vari-
ety of standard and not-so-standard machine learning and data mining algo-
rithms, plus routines for data input and manipulation. Orange is also a script-
able environment for fast prototyping of new algorithms and testing schemes. It
is a collection of Python-based modules that sit over the core library and im-
plement some functionality for which execution time is not crucial and which
is easier done in Python than in C++. This includes a variety of tasks such as
pretty-print of decision trees, attribute subset, bagging and boosting, and alike.
Orange is also a set of graphical widgets that use methods from core library
and Orange modules and provide a nice user’s interface. Widgets support sig-
nal-based communication and can be assembled together into an application
by a visual programming tool called Orange Canvas.
JANEZ DEMSAR AND BLAZ ZUPAN
From Experimental Machine Learning to Interactive Data Mining

white paper 2
data mining
fruitful&fun
All these together make an Orange, a comprehensive, component-based frame-
work for machine learning and data mining. Orange is intended for both ex-
perienced users and researchers in machine learning who want to develop and
test their own algorithms while reusing as much of the code as possible, and
for those just entering the field who can either write short Python scripts for
data analysis or enjoy a powerful while easy-to-use visual programming envi-
ronment.
Data Mining, Fruitful and Fun
Orange provides a versatile environment for developers, researchers and data
mining practitioners. Thanks to Python, a new generation scripting language
and programming environment, your data mining scripts may be simple but
powerful. To further allow for fast prototyping, Orange employs a component-
based approach: you can implement your analysis method just like putting to-
gether the LEGO bricks, or even use an existing algorithm and replace some of
its standard components with your own ones. What are Orange components to
scripting are Orange widgets to visual programming. Widgets employ a spe-
cially designed communication mechanism for passing objects like data sets,
attribute lists, learners, classifiers, regressors and alike, allowing to easily build
rather complex data mining schemes that use state-of-the-art approaches and
techniques.
Orange core objects and Python modules support various data mining tasks
that span from data preprocessing to modeling and evaluation. Among other
are techniques for:
Data input, providing the support for various popular data formats,
Data manipulation and preprocessing, like sampling, filtering, scaling, dis-
cretization, construction of new attributes, and alike,
Methods for development of classification models, including classification
trees, naïve Bayesian classifier, instance-based approaches, logistic regres-
sion and support vector machines,
Regression methods, including linear regression, regression trees, and in-
stance-based approaches,
Various wrappers, like those for calibration of probability predictions of
classification models,
Ensemble approaches, like boosting and bagging,
Various state-of-the-art constructive induction methods, including function

white paper 3
data mining
fruitful&fun
decomposition,
Association rules and data clustering methods,
Evaluation methods, different hold-out schemes and range of scoring meth-
ods for prediction models including classification accuracy, AUC, Brier
score, and alike. Various hypothesis testing approaches are also supported,
Methods to export predictive models to PMML.
The guiding principle in Orange is not to cover just about any method and as-
pect in machine learning and data mining (although through years of develop-
ment quite a few have been build up), but to cover those that are implemented
deeply and thoroughly, building them from reusable components that expert
users can change or replace with the newly prototyped ones. For instance, Or-
ange’s top-down induction of decision trees is a method build of various com-
ponents of which any can be prototyped in Python and used in place of the
original one. Orange widgets are not just graphical objects that provide a
graphical interface for a particular method in Orange – they also include versa-
tile signaling mechanism that is for communication and exchange of objects
like data sets, learners, classification models, objects that store the results of the
evaluation, … All these concepts are important, and together distinguish Or-
ange from other data mining frameworks.
Orange framework was carefully designed to balance between speed of execu-
tion and speed of development: time-critical components are implemented in
C++, while the code that glues them together is in Python.
Orange Scripting
You can access Orange objects, write your own components, and design your
test schemes and machine learning applications through scripting. Orange in-
terfaces to Python, a modern easy-to-use scripting language with clear but
powerful syntax and extensive set of additional libraries. Just like any scripting
language, Python can be used to test some ideas interactively, on-the-fly, or to
develop more elaborate scripts and programs.
To give you a taste of how easy it is to use Python and Orange, here is a set of
examples. We start with a simple script that reads the data set and prints the
number of attributes used and instances defined. We will use a classification
data set called “voting” from UCI Machine Learning Repository that records six-
teen key votes of each of the U.S. House of Representatives Congressmen and
labels each instance (congressman) with a party membership:

white paper 4
data mining
fruitful&fun
import orange
data = orange.ExampleTable('voting.tab')
print 'Instances:', len(data)
print 'Attributes:', len(data.domain.attributes)
Notice that the script first loads in the Orange library, reads the data file and
prints out what we were interested in. If we store this script in script.py, and
run it by a shell command “python script.py” – making sure that the data file is
in the same directory – we get:
Instances: 435
Attributes: 16
Let us continue with our script (that is, use the same data), build a naïve
Bayesian classifier and print the classification of the first five instances:
model = orange.BayesLearner(data)
for i in range(5):
print model(data[i])
This is simple! To induce the classification model, we have just called Orange’s
object called BayesLearner and gave it the data set: it returned another object
(naïve Bayesian classifier), that when given an instance returns the label of
most probable class. Here is the output of this part of the script:
republican
republican
republican
democrat
democrat
To find out what the right classifications were, we can print the original labels
of our five instances:
for i in range(5):
print model(data[i]), 'originally', data[i].getclass()
What we find out is that naïve Bayesian classifier has misclassified the third
instance:
republican originally republican
republican originally republican
republican originally democrat
democrat originally democrat
white paper 5
data mining
fruitful&fun
democrat originally democrat
All classifiers implemented in Orange are probabilistic, e.g. they estimate the
class probabilities. So is the naïve Bayesian classifier, and we may be interested
in how much we have missed in the third case:
p = model(data[2], orange.GetProbabilities)
print data.domain.classVar.values[0], ':', p[0]
Notice that Python’s indices start with 0 and that classification model returns a
probability vector when a classifier is called with argument orange.-
GetProbabilities. Well, our model was unjustly overconfident here, estimating
a very high probability for a republican:
republican : 0.995421469212
Now, we could go on like this, but we won’t. For some more illustrative exam-
ples check the three somewhat more complex scripts in the sidebars. There are
many more examples available in Orange’s distribution and at Orange’s web
pages and described in accompanying tutorials and documentation.
Evaluation and Comparison of Classifiers
Here is a simple script that uses 10-fold cross validation to test a naïve Bayes-
ian classifier and k-nearest neighbors algorithm on a voting data set.
import orange, orngTest, orngStat
# set up the learners
bayes = orange.BayesLearner(name='naive bayes')
knn = orange.kNNLearner(name='knn')
learners = [bayes, knn]
# compute accuracies on data
data = orange.ExampleTable("voting")
results = orngTest.crossValidation(learners, data, folds=10)
cdt = orngStat.computeCDT(results) # req. for AUC
# output the results
print "Learner CA IS Brier AUC"
for i in range(len(learners)):
print "%-8s %5.3f %5.3f %5.3f %5.3f" %
(learners[i].name,
white paper 6
data mining
fruitful&fun
orngStat.CA(results)[i],
orngStat.IS(results)[i],
orngStat.BrierScore(results)[i],
orngStat.AROCFromCDT(cdt[i])[7])
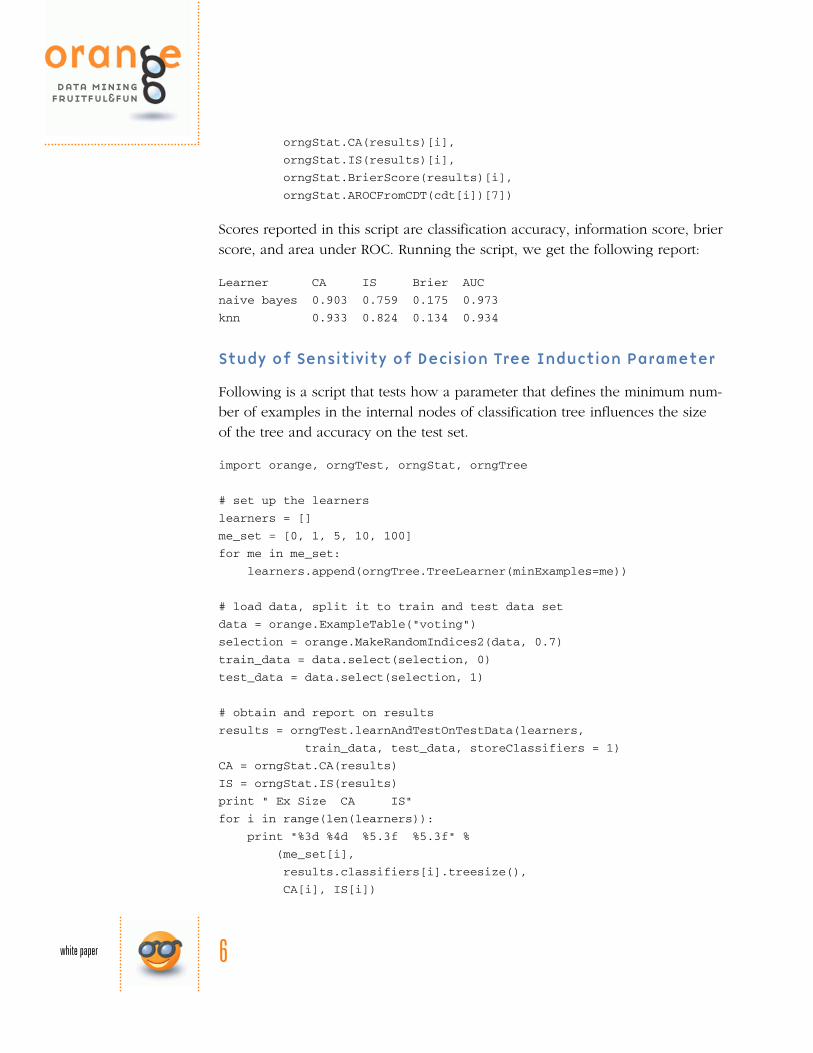
Scores reported in this script are classification accuracy, information score, brier
score, and area under ROC. Running the script, we get the following report:
Learner CA IS Brier AUC
naive bayes 0.903 0.759 0.175 0.973
knn 0.933 0.824 0.134 0.934
Study of Sensitivity of Decision Tree Induction Parameter
Following is a script that tests how a parameter that defines the minimum num-
ber of examples in the internal nodes of classification tree influences the size
of the tree and accuracy on the test set.
import orange, orngTest, orngStat, orngTree
# set up the learners
learners = []
me_set = [0, 1, 5, 10, 100]
for me in me_set:
learners.append(orngTree.TreeLearner(minExamples=me))
# load data, split it to train and test data set
data = orange.ExampleTable("voting")
selection = orange.MakeRandomIndices2(data, 0.7)
train_data = data.select(selection, 0)
test_data = data.select(selection, 1)
# obtain and report on results
results = orngTest.learnAndTestOnTestData(learners,
train_data, test_data, storeClassifiers = 1)
CA = orngStat.CA(results)
IS = orngStat.IS(results)
print " Ex Size CA IS"
for i in range(len(learners)):
print "%3d %4d %5.3f %5.3f" %
(me_set[i],
results.classifiers[i].treesize(),
CA[i], IS[i])

white paper 7
data mining
fruitful&fun
For testing, the script splits the voting data set to train (70%) and test set (30%
of all instances). To report on the sizes of the resulting classification trees,
evaluation method has to store all the classifiers induced. The output of the
script is:
Ex Size CA IS
0 615 0.802 0.561
1 465 0.840 0.638
5 151 0.931 0.800
10 85 0.939 0.826
100 25 0.954 0.796
Working with Components
Machine learning algorithms often rely on common procedures, such as condi-
tional probability estimation, scoring of attributes, data filtering and selection,
random sampling, and others. Orange embeds these procedures in compo-
nents, and develops its methods by assembling components into algorithms.
But the real power comes with designing new components: one can prototype
them in Python, use them in place of the default components in some of Or-
ange’s algorithms or use them together with an existing set of components to
develop a completely new algorithm.
Not to be driven astray with too abstract descriptions, here is a simple exam-
ple. We’ll take Orange’s algorithm for induction of decision trees which is itself
assembled from components like those for attribute ranking, condition-based
data splitting and a component that implements the evaluation for a stopping
criterion. The induction procedure for classification trees uses some heuristics
to pick the best attribute on which to split the data set, so what if instead we
simply randomly choose the attribute? Here is a script that designs the new
learner by replacing the split component of a standard classification tree
learner with a newly constructed one that randomly selects the attribute. To see
if that makes a difference, we build a standard classification tree and a tree
with a random choice of attributes in nodes and measure their size (number of
tree nodes):
import orange, random
def randomChoice(instances, *args):
attr = random.choice(instances.domain.attributes)
cl = orange.ClassifierFromVar(whichVar=attr, classVar=attr)
return cl, attr.values, None, 1

white paper 8
data mining
fruitful&fun
data = orange.ExampleTable('voting.tab')
treeLearner = orange.TreeLearner()
rndLearner = orange.TreeLearner()
rndLearner.split = randomChoice
tree = treeLearner(data)
rndtree = rndLearner(data)
print tree.treesize(), 'vs.', rndtree.treesize()
A function randomChoice does the whole trick: in the first line it randomly se-
lects an attribute from the list, and in the second returns what a split compo-
nent for decision tree would need to return. The rest of the script is trivial, and
if you run it, you will find out that the random tree is substantially bigger (as
was expected).
Data Models in Orange are Structured Objects
And so is virtually everything else returned by any Orange object or function.
But just like Orange methods which are modular and component based, so are
the objects. The advantage? Classification trees in Orange are not just trees one
can print out, but are structures that, for instance, one can iterate through,
count the number of nodes that satisfy some criteria, devise one’s own meth-
ods for printing them out, or inspect them to find frequently appearing and
related attribute pairs. To get a feeling for this, the sidebar example shows how
to count how many times each attribute appears in the constructed classifica-
tion tree. And just like classification trees, association rules are something that
one can dissect to any detail: in Python, they are a regular list of tuples that
can be accessed in dissected to any desired detail. This helps if, for instance,
one wants to implement his own scoring functions, or some particular rule fil-
ter, or even some nice graphical presentation of the rules. For an illustration, in
a sidebar we give an example of counting the rules that include a specific at-
tribute rule’s condition.
Attribute Frequency in Classification Trees
Here is a script which shows why we really like Python. We intend to count
the number of times each attribute appears in the node of the classification
tree. For this we need the dictionary which stores the frequencies of the attrib-
utes (initialized to 0). We also need a function which recursively traverses the
tree and for each node adds 1 to the corresponding attribute’s count in the dic-

white paper 9
data mining
fruitful&fun
tionary. Once you get used to it, programming with dictionaries and lists in
Python is really fun.
import orange
data = orange.ExampleTable("voting")
classifier = orange.TreeLearner(data)
# a dictionary to store attribute frequencies
freq = dict([(a,0) for a in data.domain.attributes])
# tree traversal
def count(node):
if node.branches:
freq[node.branchSelector.classVar] += 1
for branch in node.branches:
if branch: # make sure not a null leaf
count(branch)
# count frequencies starting from root, and print out results
count(classifier.tree)
for a in data.domain.attributes[:3]:
print freq[a], 'x', a.name
This script reports on the frequencies of the first three attributes in the data do-
main:
14 x handicapped-infants
16 x water-project-cost-sharing
4 x adoption-of-the-budget-resolution
Induction and Filtering of Association Rules
The following script builds a list of association rules from imports-85 data set
(attribute-based descriptions of cars imported to US in 1985). We discretize the
continuously-valued attributes and use only first ten attributes in analysis.
import orange, orngAssoc
# read and preprocess data
data = orange.ExampleTable("imports-85")
data = orange.Preprocessor_discretize(data, \
method=orange.EquiNDiscretization(numberOfIntervals=3))
data = data.select(data.domain.attributes[:10])

white paper 10
data mining
fruitful&fun
# build a list of association rules with required support
minSupport = 0.4
rules = orngAssoc.build(data, minSupport)
print "%i rules found (support >= %3.1f)" % (len(rules), minSupport)
# choose first five rules, print them out
subset = rules[0:5]
subset.printMeasures(['support','confidence'])
The script reports on the number of rules and prints out the first five rules to-
gether with information on their support and confidence:
87 rules found (support >= 0.4)
supp conf rule
0.888 0.984 fuel-type=gas -> engine-location=front
0.888 0.901 engine-location=front -> fuel-type=gas
0.805 0.982 aspiration=std -> engine-location=front
0.805 0.817 engine-location=front -> aspiration=std
0.785 0.958 aspiration=std -> fuel-type=gas
We can now count how many of the 87 rules include attribute on fuel type in
their condition:
att = "fuel-type"
subset = filter(lambda x: x.left[att]<>"~", rules)
print "%i rules with %s in conditional part" % (len(subset), att)
And here is what we find out:
31 rules with fuel-type in conditional part
Programming with other data models and objects in Orange is as easy as work-
ing with classification trees and association rules. The guiding principle in de-
signing Orange was to make most of the data structures used in C++ routines
available to scripts in Python.

white paper 11
data mining
fruitful&fun
Orange Widgets
Orange widgets provide a graphical user’s interface to Orange’s data mining
and machine learning methods. They include widgets for data entry and pre-
processing, data visualization, classification, regression, association rules and
clustering, a set of widgets for model evaluation and visualization of evaluation
results, and widgets for exporting the models into PMML or Decisions@Hand
model files.
Widgets communicate by tokens that are passed from the sender to receiver
widget. For example, a file widget outputs the data object, which can be re-
ceived by a widget classification tree learner widget, which builds a classifica-
tion model that can then be sent to a widget that graphically shows the tree.
Or, an evaluation widget may receive a data set from the file widget and ob-
jects that learn the classification models (say, from logistic regression and naïve
Bayesian learner widgets). It can then cross-validate the learners, presenting
the results in the table while at the same time passing the object that stores the
results to a widget for interactive visualization of ROC graphs.
Widgets usually support a number of standardized signals, and can be crea-
tively combined to build a desired application. While being inspired by some
popular data flow visual programming environments (admittedly, SGI’s Data
Explorer influenced us most), the innovative part of Orange Widgets is that on
interactivity and signals. For instance, clicking on a classification tree node will
make that widget output a data set which is associated with the node, and as
this signal can be fed to any data processing widget like those for data visuali-
zation, one can interactively walk through the tree in one widget and have the
visualization of a particular data set at the other widget.

white paper 12
data mining
fruitful&fun
Orange widgets for classification tree visualization (top), classifica-tion tree learner (middle) and sieve diagram (bottom).

white paper 13
data mining
fruitful&fun
Orange Canvas, with a schema that compares two different learners (classification tree learner and naïve Bayesian classifier) on a selected data set. Evaluation results are also studied through calibration and ROC plots.
Data Mining by Visual Programming
Applications that include widgets are therefore a data flow schemes, where
widgets process the information and provide for the user’s interface. One can
script such applications by hand, or use Orange Canvas, our visual program-
ming environment, to interactively design the scheme. Like any visual program-
ming environment, Orange Canvas is simple and fun to use.
Orange widgets and Orange Canvas are all written in pure Python, using Qt
graphical user’s interface library. This allows Orange to run on various plat-
forms, including MS Windows and Linux.

white paper 14
data mining
fruitful&fun
If you use Orange or any of its components for research and publish the results, please cite the following whitepaper: Demsar J, Zupan B: Orange: From Experimental Machine Learning to Interactive Data Mining, White Paper (www.ailab.si/orange), Faculty of Computer and Information Science, University of Ljubljana, 2004. Also, your applications may use additional Orange modules made available by other research-ers, so other citations may be in place as well.
Starting With Orange
Orange is available at http://magix.fri.uni-lj.si/orange. The site includes orange
distribution for Windows, Linux and Macintosh OS X, the documentation, the
extensive set of more that one hundred examples of Orange scripts, and a
browsable repository of data sets.
To start with Orange scripting, we suggest downloading and unpacking Or-
ange, and then going through Orange for Beginners, a tutorial that teaches the
basics of Orange and Python programming. If you have done any program-
ming previously, this may be almost enough to start writing your own scripts.
If Python will look like something worth investigating further, there is a wealth
of resources and documentation available at http://www.python.org.
Orange is released under General Programming License (GPL) and as such is
free if you use it under these terms. We do, however, oblige the users to cite
the following white paper together with any other work that accompanied Or-
ange any time you use Orange in your publications:
Demsar J, Zupan B (2004) Orange: From Experimental Machine Learning
to Interactive Data Mining, White Paper (www.ailab.si/orange), Faculty of
Computer and Information Science, University of Ljubljana.
And if you will become an Orange user, we won’t mind getting a postcard
from you. Please use the following address:
Orange, AI Lab, Faculty of Computer and Informations Science, Univer-
sity of Ljubljana, Trzaska 25, SI-1000 Ljubljana, Slovenia.
white paper 15
data mining
fruitful&fun
If you use Orange, you can send us a postcard with any comments and wishes for further development. Please use the following address: Orange, AI Lab, Faculty of Computer and Information Science, Trzaska 25, SI-1000 Slovenia.
Acknowledgements
We are thankful for comments, encouragements and contributions of our col-
leagues and friends. We would first like to thank members of our AI Laboratory
in Ljubljana for all the help and support in the development of the framework.
Particular thanks go to Gregor Leban, Tomaz Curk, Aleks Jakulin, Martin Moz-
ina, Peter Juvan, and Ivan Bratko. Marko Kavcic developed the first prototype
of widget communication mechanism and tested it on first few widgets. Some
of association rules algorithms were implemented by Matjaz Jursic. Martin Zni-
darsic helped us in development of several very useful methods and in beta
testing. Jure Zabkar programmed several modules in Python. Matjaz Kukar was
involved in early conversations about Orange and, most importantly, intro-
duced us to Python. Chad Shaw helped us with discussions on kernel-based
probability estimators continuous attributes and classification. Gaj Vidmar was
always available to help us answering questions on various problems we had
with statistics. Martin Znidarsic and Daniel Vladusic used Orange even in times
of its greatest instability and thus contributed their share by annoying us with
bug reports. In porting Orange to various platforms we are in particular thank-
ful to Ljupco Todorovski and Mark E. Fenner (Linux), Daniel Rubin (Solaris)
and Larry Bugbee (Mac OS X).
Orange exists thanks to a number of open source projects. Python is used as a
scripting language that connects the core components coded in C++. Qt saved
us from having to prepare and maintain separate graphical interfaces for MS
Windows, Linux and Mac OS X. Python to Qt interface is taken care by PyQt.
Additional packets used are Qwt (a set of Qt widgets for technical applications)
among with PyQwt that allows us to use it from Python, and Numeric Python
(a linear algebra module).
A number of Orange components were built as an implementation of methods
that stem from our research. This was generously supported by Slovene Minis-
try of Education, Science and Sport (the Program Grant on Artificial Intelli-
gence), Slovene Ministry of Information Society (two smaller grants on devel-
opment of open source programs), American Cancer Society (in collaboration
with Baylor College of Medicine, grant on predictive models for outcomes of
prostate cancer treatments), and USA’s National Institute of Health (in collabo-
ration with Baylor College of Medicine, program grant on functional genomics
of D. discoideum).