Jan Sj¶gren Process Improvement Analysis of Sysmex - Theseus
72
Jan Sjögren Process Improvement Analysis of Sysmex Dealership in Roche Diagnostics Oy Helsinki Metropolia University of Applied Sciences Bachelor of Business Administration International Business and Logistics Thesis 06.01.2013
Transcript of Jan Sj¶gren Process Improvement Analysis of Sysmex - Theseus
Jan Sjögren Process Improvement Analysis of Sysmex Dealership in Roche Diagnostics Oy
Helsinki Metropolia University of Applied Sciences
Bachelor of Business Administration
International Business and Logistics
Thesis
06.01.2013
1
Author(s) Title Number of Pages Date
Jan Sjögren Process Improvement analysis of Sysmex Dealership in Roche Diagnostics Oy 72 pages + 1 appendices 6 January 2013
Degree Bachelor of Business Administration
Degree Programme International Business and Logistics
Specialisation option
Instructor(s)
Kaija Haapasalo, Senior Lecturer
This thesis is a process improvement analysis of operational work processes used to manage a global dealership contract in a Finnish company. It aims to improve the efficiency of the workflow, ensure policy compliancy and identify and reduce risks embedded in the process. The changes suggested to the processes also consider minimizing the differences between other processes. The thesis is as a practical development project and is highly pragmatic. Its deliverables are detailed process description at its current state, change plan and change control document. The scope of the research is limited to the work performed by the Order Management Coordinator responsible of Sysmex dealership management and further limited to few relevant product groups. The process flow starts from forecasting purchases and continues in their procurement, warehousing and delivery. The process is first described as it is currently, followed by qualitative research on possible improvement areas and concludes in description of suggested changes to the process. The research utilizes relevant operations management and process management techniques and theory. Main approach is that process is analysed in greatest detail and visualised by using flowcharts.
Keywords Process improvement analysis
2
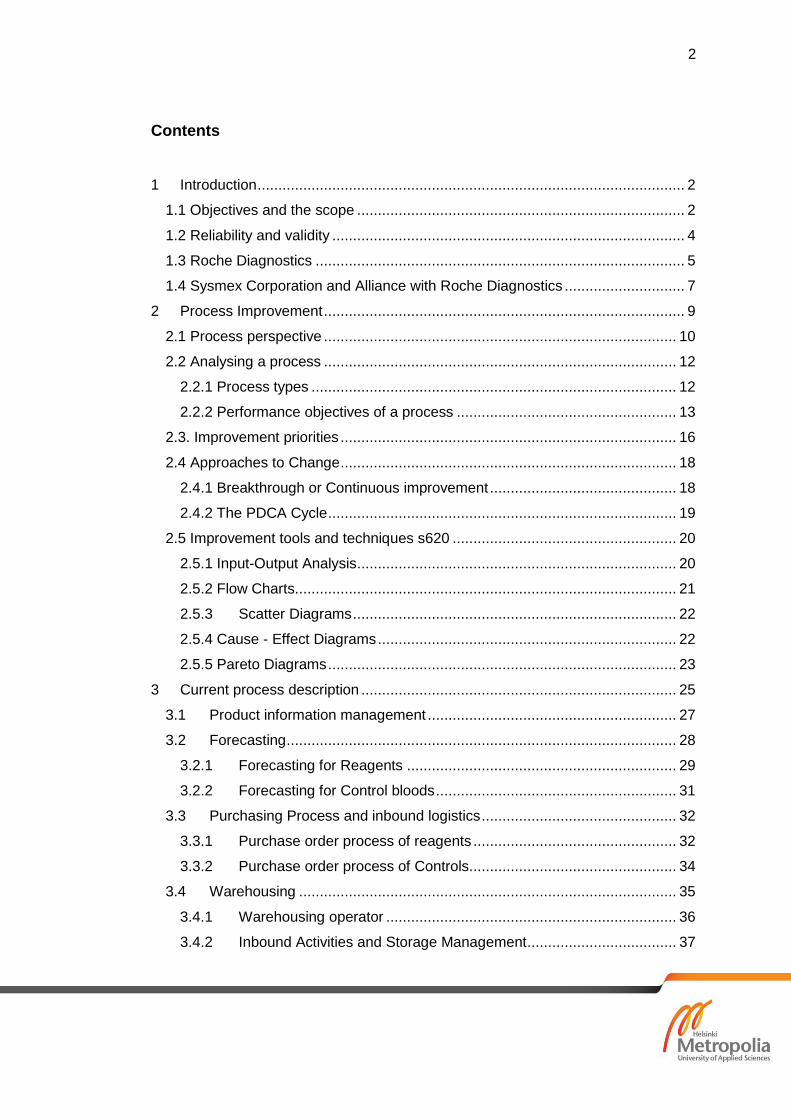
Contents
1 Introduction ....................................................................................................... 2
1.1 Objectives and the scope ............................................................................... 2
1.2 Reliability and validity ..................................................................................... 4
1.3 Roche Diagnostics ......................................................................................... 5
1.4 Sysmex Corporation and Alliance with Roche Diagnostics ............................. 7
2 Process Improvement ....................................................................................... 9
2.1 Process perspective ..................................................................................... 10
2.2 Analysing a process ..................................................................................... 12
2.2.1 Process types ........................................................................................ 12
2.2.2 Performance objectives of a process ..................................................... 13
2.3. Improvement priorities ................................................................................. 16
2.4 Approaches to Change ................................................................................. 18
2.4.1 Breakthrough or Continuous improvement ............................................. 18
2.4.2 The PDCA Cycle .................................................................................... 19
2.5 Improvement tools and techniques s620 ...................................................... 20
2.5.1 Input-Output Analysis ............................................................................. 20
2.5.2 Flow Charts............................................................................................ 21
2.5.3 Scatter Diagrams .............................................................................. 22
2.5.4 Cause - Effect Diagrams ........................................................................ 22
2.5.5 Pareto Diagrams .................................................................................... 23
3 Current process description ............................................................................ 25
3.1 Product information management ............................................................ 27
3.2 Forecasting .............................................................................................. 28
3.2.1 Forecasting for Reagents ................................................................. 29
3.2.2 Forecasting for Control bloods .......................................................... 31
3.3 Purchasing Process and inbound logistics ............................................... 32
3.3.1 Purchase order process of reagents ................................................. 32
3.3.2 Purchase order process of Controls .................................................. 34
3.4 Warehousing ........................................................................................... 35
3.4.1 Warehousing operator ...................................................................... 36
3.4.2 Inbound Activities and Storage Management .................................... 37
3
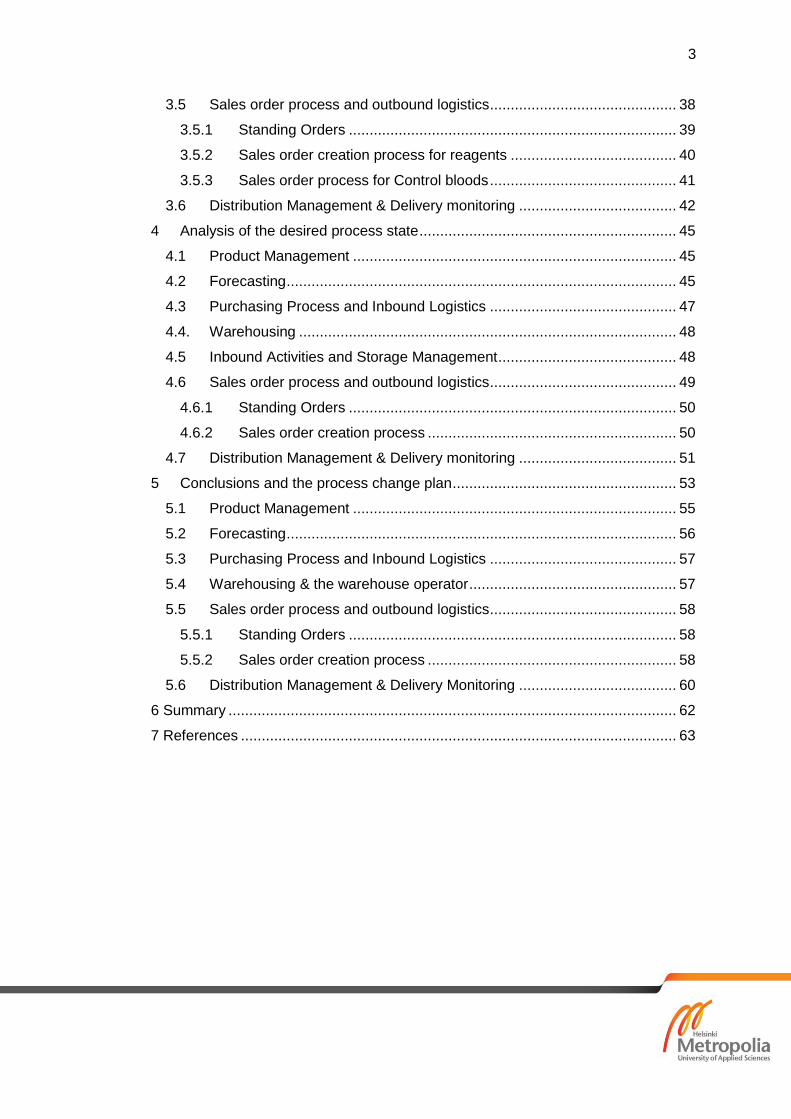
3.5 Sales order process and outbound logistics ............................................. 38
3.5.1 Standing Orders ............................................................................... 39
3.5.2 Sales order creation process for reagents ........................................ 40
3.5.3 Sales order process for Control bloods ............................................. 41
3.6 Distribution Management & Delivery monitoring ...................................... 42
4 Analysis of the desired process state .............................................................. 45
4.1 Product Management .............................................................................. 45
4.2 Forecasting .............................................................................................. 45
4.3 Purchasing Process and Inbound Logistics ............................................. 47
4.4. Warehousing ........................................................................................... 48
4.5 Inbound Activities and Storage Management ........................................... 48
4.6 Sales order process and outbound logistics ............................................. 49
4.6.1 Standing Orders ............................................................................... 50
4.6.2 Sales order creation process ............................................................ 50
4.7 Distribution Management & Delivery monitoring ...................................... 51
5 Conclusions and the process change plan ...................................................... 53
5.1 Product Management .............................................................................. 55
5.2 Forecasting .............................................................................................. 56
5.3 Purchasing Process and Inbound Logistics ............................................. 57
5.4 Warehousing & the warehouse operator .................................................. 57
5.5 Sales order process and outbound logistics ............................................. 58
5.5.1 Standing Orders ............................................................................... 58
5.5.2 Sales order creation process ............................................................ 58
5.6 Distribution Management & Delivery Monitoring ...................................... 60
6 Summary ............................................................................................................ 62
7 References ......................................................................................................... 63
1
List of abbreviations
3rd Party Person or entity that is not actively involved in relationship DMS Diagnostics Master System EMEA Europe Middle East and Africa regions KAM Key Account Manager OM Order Management, a department in Roche Diagnostics Oy OMT Order Management Team OMC Order Management Coordinator SAP Enterprise Resource Management software SO Sales Order PO Purchase Order PPM Purchasing Proposal Master-file RPD Roche Professional Diagnostics SKM Sysmex Kontrollikäyttäjät Master-file WDOM Warehousing and Distribution Outsourcing Manual
2
1 Introduction
1.1 Objectives and the scope
This document is a thesis work of Jan Sjögren, International Business and Logistics
student in Metropolia Business School, currently employed in Roche Diagnostics Oy
as Order Management Coordinator, in the Order Management Team (Later OMT).
Roche Diagnostics Oy represents Sysmex Corporation as a retailer in Finland and
Sysmex product catalog has a special significance in the Order Management Team.
The dealership as a whole has grown in value and volumes since its beginning 1999
and from the perspective of the OMT there is need to analyze and update the
business processes. This is especially important now when a new contract for
distribution, sales and service has been established between the companies for the
next 10 years.
In this thesis the current purchasing, warehousing and sales processes of a chosen
product groups of Roche Diagnostics Oy in Finland are described. The main target
of this qualitative research is to identify the current situation in the case company
and to analyze it based on both secondary and primary research. Secondary
research is based on literature about process development theories and primary
research mainly on interviews and observations made by the writer himself. The
target is to make a development proposal and a change plan for the case company
accompanied with a change control document (see Appendix 1).
Due to its special nature the Sysmex dealership has developed apart from the rest
of the core business of Roche Diagnostics Oy and can be considered to have
special case stigma. This stigma has led into a situation where the dealership is a
responsibility of just one person and most of the knowledge required to run the daily
operations are not documented.
In addition to the main goal of this thesis, which was to get an in-depth look into the
dealership process and to analyze it based on the process improvement theories
and tools, the secondary goal is also to create new metrics for follow-up and to
3
improve the speed, efficiency and security of the workflow. This will be achieved by
very detailed description of the different parts of the process and by using process
mapping tools such as flow charts in order to visualize the different processes and
to identify wastes in time, potential risk points and general weaknesses. The final
target of this thesis is to suggest changes to correct and to improve the current
processes.
One objective of the research is that the processes will be evaluated against current
internal policy documents and thus secured that the different phases of the
processes will comply with them. There are several internal policy documents that
are relevant for the research and these documents demand certain changes to the
processes. The documents will be named and described in more detail in the later
part of the thesis.
Another objective is to identify such changes to certain parts of the process that
would remove the special stigma of the dealership and make the process more
dynamically manageable by the whole Order Management Team without product
specific knowledge or training.
The thesis and the processes analyzed within will limit its scope to cover only the
work performed by the Order Management Coordinator responsible of Sysmex
dealership management, only the work that is related to the dealership, and only the
Reagent and Control blood product groups. Other intertwined processes are
described, but they will be only evaluated and analyzed from the perspective of the
Order Management Team. This thesis will limit outside the scope the environment
in, and tools the processes are performed with, considering them as static and
unchangeable.
4
1.2 Reliability and validity
As the dealership was the responsibility of the researcher of this thesis from April 1st
2012 to September 30th, most of the research was done during that time with help of
open interviews and conversations with the members of the Order Management
Team. Due to the confidentiality of the research results no numerical data about the
dealership is allowed to be published in this thesis and all the names of the people
involved with the dealership have been altered or removed in order to protect the
privacy and to follow the rules of the case company.
Company information was collected from publicly available information, combined
with public press releases and reliable internal documents. Relevant theory has
been collected from publicly available university course books and publications.
Approaches and techniques learned from the theory have been applied to the
qualitative research. A small number of supply chain management specialists
surveyed the progress of the research and have evaluated the results to increase
the validity of the research. The open interviews with the key personnel were
conducted to answer specific questions and to get input or guidance
As the motive of the research was to find solutions to existing problems the motive
itself contained some of its results. The narrow scope of the research and the
casually connected problems brought to light by it would suggest strong reliability of
the findings. Strong reliability is also provided by the fact that majority of the
suggested changes conform to the company policies and guidance received from
the managers of the operation.
The narrow scope of the research and the fairly specific case in general lower the
generalization value of the results. However, the aptitude of the systematic
approach, the techniques used can be generalized to any similar office processes.
5
1.3 Roche Diagnostics
Headquartered in Basel, Switzerland, the case company of this thesis, Roche
Diagnostics is a leader in research-focused healthcare with combined strengths in
pharmaceuticals and diagnostics. Roche is the world’s largest biotech company with
truly differentiated medicines in oncology, virology, inflammation, and metabolism.
Roche is also the world leader in in-vitro diagnostics, tissue-based cancer
diagnostics and a pioneer in diabetes management. Roche’s personalized
healthcare strategy aims at providing medicines and diagnostic tools that enable
tangible improvements in the health, quality of life and survival of patients. In 2011,
Roche had over 81,000 employees worldwide and sells its products in over 150
countries. The Group posted total sales of 35 billion EUR. Roche Group is divided
into Pharmaceutical division and Diagnostics division, the Diagnostics division is
responsible of 22% of the group’s sales equaling to 7 billion EUR in 2011. Exactly
50% of this is derived from what is known as EMEA: Europe Middle East and Africa
regions. (Hoffmann-La Roche Ltd., 2012)
Roche Diagnostics is active in all market segments from point-of-care testing
devices at doctor’s office to high-throughput analyzers for hospitals and commercial
diagnostics laboratories and state-of-the-art instruments for all life science research.
(Hoffmann-La Roche Ltd., 2012)
The product portfolio is categorized by business areas. Roche Professional
Diagnostics’ (RPD) products support clinical decision making in commercial and
hospital labs, medical centers and laboratory networks. These products utilize blood
serum testing, cardiac markers, blood gases and blood glucose. Combined with
other diagnostic disciplines such as hematology and urinalysis RPD provides fully to
all parts of in-vitro diagnostics (diagnosis from samples). (Hoffmann-La Roche Ltd.,
2012)
Roche’s Molecular Diagnostics develops and manufactures innovative tests based
on the Nobel Prize winning polymerase chain reaction (PCR) technology. These
tests concentrate on the molecular characteristics of a disease or sample and allow
doctors to monitor patient response to therapy, identify chemicals in samples or
6
ensure safety of products used in medical procedures. (Hoffmann-La Roche Ltd.,
2012)
Ventana Medical Systems Inc., a member of the Roche group, provides Roche
Diagnostic with Tissue Diagnostics knowhow and innovates and manufactures
instruments and reagents that automate tissue processing and slide staining for
cancer diagnostics. (Hoffmann-La Roche Ltd., 2012)
Roche Applied Science supplies a broad and growing range of instruments and
highly specific reagents and test kits for use in the life science research market and
for industrial applications. These products are especially strong in genomics and
cellomics, sciences that are crucial in understanding and treatment of diseases.
(Hoffmann-La Roche Ltd., 2012)
Roche Diabetes Care product portfolio covers every aspect of diabetes, helping
diabetes patients to live healthy, productive lives and to manage diabetes easier.
These products integrate blood glucose monitoring and dynamic insulin delivery
mimicking as close as possible a healthy pancreas. (Hoffmann-La Roche Ltd.,
2011)
In Finland Roche Diagnostics’ portfolio is sold and distributed by Roche Diagnostics
Oy the offices of which are located in Espoo and in Kuopio. Employing
approximately 70 people Roche Diagnostics Oy reports net sales of 72million EUR
at 2011. From the 70 people 19 are working in service support, rest are divided up
into marketing, sales and support functions. Currently there is no R&D in Finland.
(Annual Report 2011)
Roche Diagnostics’ four largest customers are HUSLAB, a public sector
organization for capital region health care district, ISLAB which is similar for eastern
Finland, VSSHP for western Finland and FIMLAB which is the largest private
laboratory network in the country, located most in Pirkanmaa and Kanta-Häme
regions. (Hoffmann-La Roche Ltd., 2012)
7
1.4 Sysmex Corporation and Alliance with Roche Diagnostics
Sysmex Corporation is a world leader in clinical laboratory systemization and
solutions, including laboratory diagnostics, laboratory automation and clinical
information systems. The company was created in 1968 with a name TOA Medical
Electronics as part of TOA Corporation and separated as its own brand in 1978.
Sysmex focuses on technological leadership in diagnostic science, information
systems and manufacture and sale of laboratory testing reagents and laboratory
equipment. The company, headquartered in Kobe, Japan, has 48 subsidiaries in 29
countries and employs more than 4,500 employees worldwide. The company boasts
1,32 billion EUR net sales at 2011, from which net income was 117,6 million EUR.
(Sysmex Corporation, 2012)
Since its establishment Sysmex has concentrated on field of in-vitro diagnostics,
where the Company has played integral role in the testing of blood and urine
samples. While also strong in research and development, Sysmex has also
expanded in the fields of hemostasis, immunochemistry, and clinical chemistry. The
product line up of hematology and urinalysis instruments, software and reagents
provides for everyone from small practitioners’ office to large-scale hospitals and
testing centers. Sysmex Corporation is by a vast gap the leading company in
hematology and urinalysis markets. (Sysmex Corporation, 2012)
Sysmex Europe GmbH is a subsidiary of Sysmex Corporation, located in Hamburg
Germany the subsidiary co-ordinates marketing and service activities and supplies
the European market with all Sysmex products. Majority of the reagents sold in
Europe are made just 70km outside Hamburg in a city of Neumünster. 1999
Sysmex Corporation entered into Distribution Sales and Service (DDS) agreement
with Roche Diagnostics in 1999. This successful agreement was renewed in April
2012. Since this agreement Sysmex and Roche have applied their mutual strengths
to expand market share while building favorable relationship. Leaders of both
parties agree that there is a unique synergy between the companies:
Based on Sysmex’ industry leadership allied with Roche’s unique position as the
global market leader in in vitro diagnostics, the collaboration underlines our objective of
8
bringing a maximum of industry expertise in hematology to health professionals Hisashi
Ietsugu, President and CEO of Sysmex Corporation. (Hoffmann-La Roche Ltd.
2012)
“The breadth of the Sysmex portfolio combined with Roche’s Cobas analyzer
platforms allow customers to choose from the broadest set of instruments available
for each laboratory setting. This embraces our goal to strengthen and to expand
Roche’s offering in central laboratories in hospitals and commercial laboratories”
Colin Brown, Head of Roche Professional Diagnostics (Hoffmann-La Roche Ltd.
2012)
In Finland Sysmex Corporation is represented through Roche Diagnostics Oy in all
marketing, sales and support activities. Based on 2009 Market Analysis by Roche
Diagnostics Oy Roche’s hematology market share was 76% from total 4,8 million
EUR market, since then the market has grown close to 6 million EUR. In Urinalysis
Roche’s market share was 30% at 2009 and has since grown significantly. (Roche
Diagnostics Oy, 2009)
Combining hematology and urinalysis portfolios the products can be categorized
into three categories:
1. Instruments: the diagnostics machinery and their parts
2. Reagents: the chemicals the machines consume
3. Controls: specific products that are used in calibrating the instruments for
perfect function.
Roche Diagnostics Oy buys these products from Sysmex Europe and stores a local
stock of them in a warehouse in the south-west of Finland and all sales go through
Roche Diagnostics Oy. (Roche Diagnostics Oy, 2009)

9
2 Process Improvement
The idea that work should be optimized and some of its components eliminated is
not new. It can be traced to the scientific management approach used by Frederic
Talyor (1856-1915) who originally used the approach to optimize the speed of work
of individual workers in a factory environment. However, the core ideas of this
approach are still valid today and make up the fundamentals of process
improvement theory.
Any type of process can be studied for the purpose of improving its efficiency and all
improving activities can be categorized under the following three groups:
- Eliminate non-value-adding aspects of the activity
- Reduce the number of repetitions of the activity
- Increase the speed at which the activity is performed
It is an obvious observation that some of the work done in a process is not essential
for the product or service provided, thus is it natural for individuals involved to
identify and attempt to eliminate the unnecessary steps or avoid non-essential
tasks. It is not always apparent which tasks do add value to the customer or the
organization. (Ravi Anupindi et al. 2004)
One significant advantage of process analysis and improvement is that each activity
can be systematically challenged in attempt to improve the process. In this thesis
the whole workflow of a single 3rd party dealership inside an organization is studied.
In the highest level the process flow (figure 1) looks solid and it would be impossible
to reduce any phases.
Figure 1. The highest level the Sysmex dealership process.
10
When observed closer and by utilization of tools from operations management and
process management theory one can find that the processes that together make the
whole there is much that can be improved.
It is common that existing processes are not always well defined or described. This
may be because they have developed over time without being formally recorded or
they might have also been changed informally by the individuals who work in the
process. Processes that are not formally defined or are not defined at the depth
level they are performed can be interpreted in different ways, leading to confusion
and hindering their improvement. So it is important to obtain a view from all
individuals involved in the process and to be able to visualize the process in a way
that all can understand and agree upon.
2.1 Process perspective
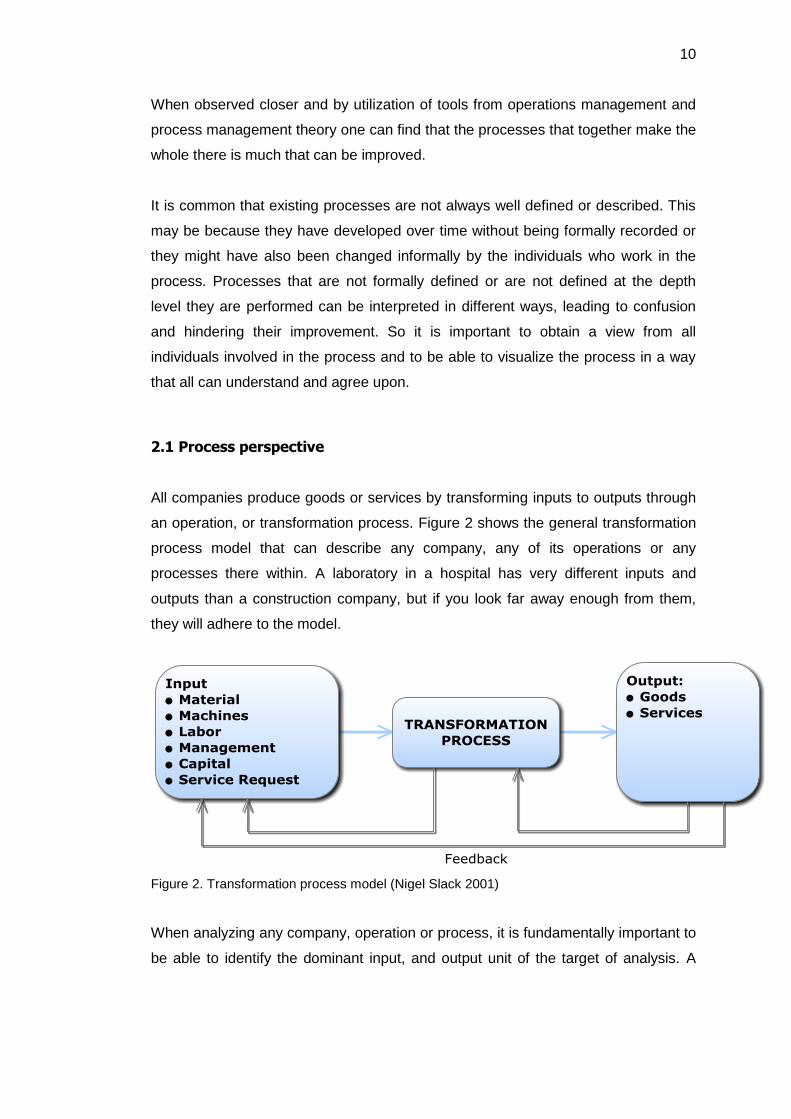
All companies produce goods or services by transforming inputs to outputs through
an operation, or transformation process. Figure 2 shows the general transformation
process model that can describe any company, any of its operations or any
processes there within. A laboratory in a hospital has very different inputs and
outputs than a construction company, but if you look far away enough from them,
they will adhere to the model.
Figure 2. Transformation process model (Nigel Slack 2001)
When analyzing any company, operation or process, it is fundamentally important to
be able to identify the dominant input, and output unit of the target of analysis. A
11
post office devotes part of its time to serve customers, taking in packages for
delivery and delivering them. A customer could be considered one post office’s input
units. Post also spends considerable amount of its energy to communicate its
customers about the state of the delivery, the information is definitely its throughput
unit. As customers we might be unhappy about the service we receive, or the lack of
information we receive from our delivery, but we would be most unhappy if the
package is lost or damaged. This would mean that the most important, dominant
throughput unit is the package. (Nigel Slack 2001)
To design a new process, or to analyze and existing one, it is crucial to be able to
define the layers and hierarchies of the processes that make up the operation. By
defining the inputs of the process we can categorize the process itself into being a
material process, an information process or a customer process. Identifying the
dominant throughput unit makes us center on only single unit throughout the
process, and perhaps consider defining other throughput units separately. Defining
the building blocks that allow the transformation process to happen, the staff and
facilities, we also define the resource requirements, risk areas and costs. Describing
the expected output creates also the performance meters that allow the whole
process to be evaluated against. (Nigel Slack 2001)
In reality following the throughput unit can be difficult, or it can travel between
departments or change form that it is difficult to recognize. Concentrating on the
transformation process model at all levels of the operation allows construction of a
logical big picture of the flow of throughput units through all processes. At single
process levels the model makes sure that factors are defined and each possibility of
improvement is brought to in the open. When the throughput unit is followed through
many processes, the problems between the processes come to light. Analysis of
this sort also allows contrast of each phase of the process against market
requirements, ask if it aids to fill customer needs or question its purposefulness
totally. (Nigel Slack 2001)
12
2.2 Analysing a process
2.2.1 Process types
Oxford University professor of Operations Management Terry Hill, who is an author
of broad range of operations management and process analysis theory, suggests
that processes can be categorized into five main groups.
- Project processes. Highly customized products, relatively long timescale for
manufacturing, significant interval between production cycles. Example:
Buildings.
- Jobbing processes. High variety, low volumes, shared resources with other
similar products. Never repeating exactly the same outcome. Example: Cars,
hand crafts.
- Batch processes. More than one exactly the same as another product,
generally consists of repetition. Example: Restaurant meals, industry
machinery.
- Mass processes. High volume production, narrow variety, product always
fundamentally same. Example: Car production
- Continuous processes. Higher volume than mass processes, even less
variety, usually long periods of ongoing operation. Example: Electricity
generation, steel making.
Even as these process groups are derived from manufacturing concepts, Terry Hill
argues that the typology could be equally used also for service delivery processes
and in his books he gives examples of both sectors. (Terry Hill, 2005)
Other operations management authors recognize that there is distinction between
the manufacturing and service sectors, and their processes are fundamentally so
different that they cannot be categorized the same way. Less of an agreement
exists on what the groups should be called, but Nigel Slack proposes the following
three:
- Professional services. High contact time with the customer, high levels of
customization and adaptation to customer needs. Usually people based
services. Usually provided by specialists. Example: Consulting.
13
- Mass services. Limited contact time with limited little customization. Product
or equipment based. Usually provided by non-professionals, based on
preset procedures. Example: Ticket sales
- Service shops. Belong between mass services and professional services.
Generally provided by professionals, for longer period of times than mass
services, with medium level of customization or options for it. Example:
Banks, schools. (Slack, 2001)
The processes described and analyzed in this thesis are micro level parts of a larger
service shop type of process. Some customer service phases of the processes
could be considered a jobbing process for their nature of having high variety and
low volume, but in principle delivering similar outcomes. Alternatively a recording or
documenting process could be considered a batch process, as it is fundamentally
repetition of the same with very little variation in the outcome.
2.2.2 Performance objectives of a process
The performance objectives fall down to the process level from all the way to the
top. The reason for a company to exist is to satisfy its stakeholders, this idea is
behind all the decisions that create the strategy, and strategy then translates down
to operational level. At business plan and strategy level the objectives might appear
different, but at the operational level they appear more or less the same across all
companies. There are five performance objectives for any company, any operation
and any process therein.
The quality objective stands for doing things the right way. One would not want to
make mistakes or provide the customer with faulty products, but rather deliver
services that suit their needs or produce products that meet or exceed their
expectations. The things that should be done the right way vary between
companies, but the quality objective is always present. Doing things the right way
also directly reduces the costs because of fewer defects or less conflicts within the
processes and high quality process would also take into consideration all possible
risks, increasing the total dependability of the process. High quality performance is
14
particularly important object in reaching customer satisfaction, which is a direct
source for competitive advantage.
The speed objective culminates to achieving the shortest time between customers
intent of purchase to customers receiving the product in full. This can be achieved in
many ways, such as increasing availability or shortening production times, reducing
queue lengths or increasing capacity. Inside the company speed has other
beneficial effects. Being able to deliver one process cycle of any kind quicker will
reduce the need of inventories, as also the inventories would be refilled quicker. The
less time the customer or the inventory spends in the process lesser the risks
involved. Speedier process cycle will also speed up the time required to spot
defects and mistakes, and to correct them.
Dependability objective means keeping your promises. Dependability is generally
judged at the end of a transaction with the customer, when the product is delivered
or the invoice arrives. If your product, service or organization is not dependable the
judgment will be negative, over time this will remove the possibility to sustain the
business. Unpredictable or negative outcomes of any processes will have a
negative effect on anything around them internally as well, in the end any lack in
dependability of the processes will cost the organization valuable time. With
maintaining high level of dependability performance, the company can start building
customer and internal relations based on trust, which can act as a multiplier in the
bottom line values.
The flexibility objective means the ability to change the operation some way to react
to external pressure of any kind. This might be changing what the operation does, or
how it is done. In practice this translates into having flexible products/services,
having variety of types and variety of quantities available and being able to deliver
with different means and times.
Ultimately combining the above and adding its own objectives is the cost objective.
Even if all the four above also improve cost effectiveness, there is staff, facilities,
technology, equipment and material costs to be considered. In some organizations
the other objectives have large effect on the costs, in others the costs can change
without negative or even with positive change on the other objectives.
15
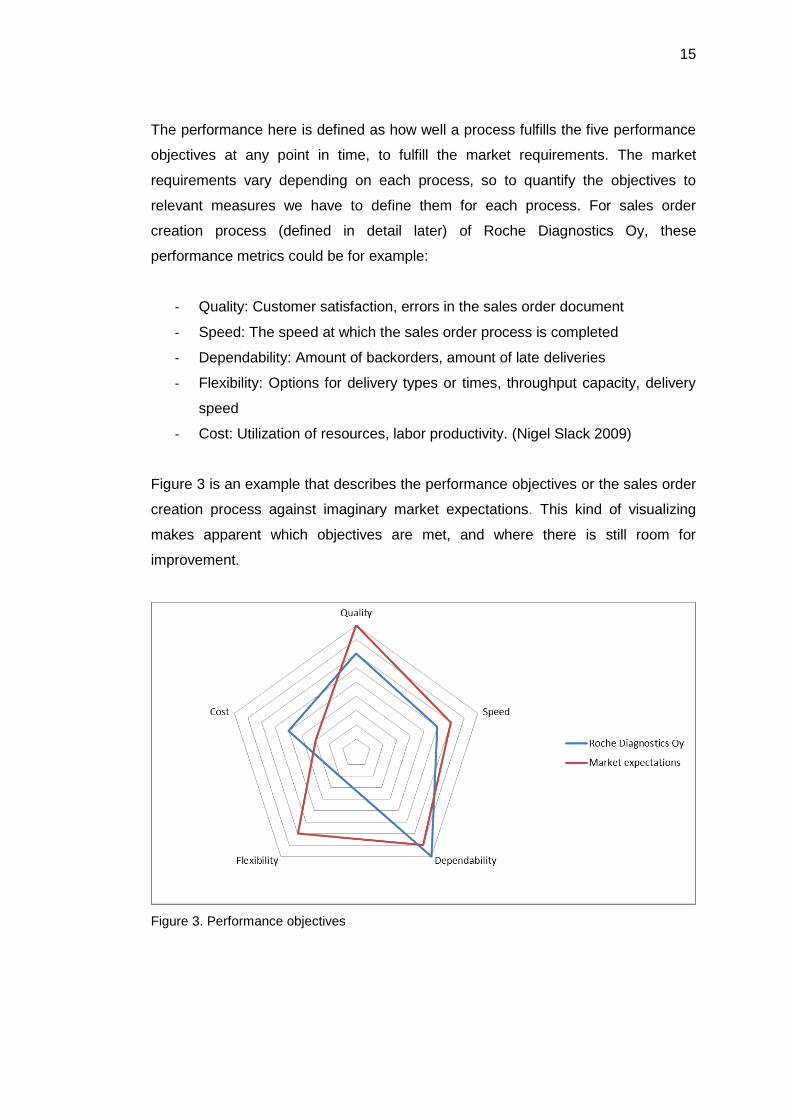
The performance here is defined as how well a process fulfills the five performance
objectives at any point in time, to fulfill the market requirements. The market
requirements vary depending on each process, so to quantify the objectives to
relevant measures we have to define them for each process. For sales order
creation process (defined in detail later) of Roche Diagnostics Oy, these
performance metrics could be for example:
- Quality: Customer satisfaction, errors in the sales order document
- Speed: The speed at which the sales order process is completed
- Dependability: Amount of backorders, amount of late deliveries
- Flexibility: Options for delivery types or times, throughput capacity, delivery
speed
- Cost: Utilization of resources, labor productivity. (Nigel Slack 2009)
Figure 3 is an example that describes the performance objectives or the sales order
creation process against imaginary market expectations. This kind of visualizing
makes apparent which objectives are met, and where there is still room for
improvement.
Figure 3. Performance objectives

16
2.3. Improvement priorities
Monitoring and improving performance of a process alone is not enough. Limited
time and resources usually make it hard to be able to excel at everything, it is also
not economically wise to waste time on increasing performance that does not bring
benefits. An organization must decide which performance metrics require particular
attention and they should be compared against the needs and preferences of the
customers and the performance and activities of the direct competition.
Both importance and performance must be analyzed together in order to make good
decisions. It might be that a performance metric is extremely important to the
customer, but it might already be performing at optimal level, making improving it
only economically unwise. Judging the importance of a performance metrics to
customers can be thought as the likelihood of this performance metric to causing
the customer to choose our product. The order winning performance metric provides
the crucial competitive advantages over competition, and if the performance of that
metric declines lower than the competitors it becomes higher priority for
improvement. A qualifying performance metric means for example an industry
standard, which as such does not cause product to be selected, but without it the
product would be in big trouble to make sales. This can also be considered a
business standard or being within the expected norm.
Figure 4. The importance-performance matrix. (Nigel Slack 1994)

17
As figure 4 illustrates, the performance metric can also be on the level of excess,
where its improvement would not bring any gains. In the other hand a performance
can also show values of worse than competition, but the metric itself is not crucial in
gaining business, so it is not a priority for improvement. (Nigel Slack 1994)

18
2.4 Approaches to Change
2.4.1 Breakthrough or Continuous improvement
The breakthrough improvement or innovation-based improvement is the idea that
change should happen dramatically in ground shaking waves. It could be an
introduction to completely new software of the whole organization, or new
generation of machinery. The effects of change done this way are generally sudden
and possibly even drastic. Because of the idea being fast leaps of change every so
often it requires a different set of competences and strategies to manage its
challenges its counterpart.
The continuous improvement ideology adopts the idea of small steps of change
whenever possible. Continuous improvement ideology has become popular in past
decade and it is now also known by Japanese word “Kaizen”, which promptly
means continuing improvement involving everything and everyone. For the Kaizen,
momentum of change is more important than the rate of it. (Nigel Slack 2001)
While the breakthrough ideology is straight forward bringing a new idea into reality,
managing the change period and reaping the benefits, the Kaizen ideology is
considered to be more fundamentally intertwined organizational change. It suggests
that organizations should adapt skills and attitudes that allow and support
continuous improvement. Professor Joseph Tidd jr. Brighton University specify six
generic organizational abilities that make up the CI ideology (Jote Tidd, 2005)
- Making continuous improvement a habit. Developing ways to keep
employees constantly involved in change projects
- Focusing on continuous improvement. Generating the link between
continuous change and strategic goals of the company
- Spreading the word. Generating cross functional groups for continuous
improvement projects, tearing down the organizational boundaries.
- Creating a CI system. Defined CI process than can be monitored, developed
and used as strategic tool.
19
- Walking the talk. Management style has to reflect the CI atmosphere, share
the belief of small step change, value of everyone’s contribution and learning
form mistakes.
- Building a learning organization. Generate the ability to learn through CI
projects, all learning is shared, management accepts and deploy learned
behaviors across the organization.
The breakthrough ideology encourages free thinking and individualism without much
respect to what is possible. Starting from empty table or rethinking the fundamentals
is normal for this ideology. Typical is also utilization of business process re-
engineering principles, which stands for radically rethinking the way something is
done, taking it into parts and rebuilding it from the beginning to strive for dramatic
improvements. The continuous improvement appears less ambitious in the short
run, however as it supports teamwork, attention to detail, and making the
organization a self-evolving community its achievements in the long run can surpass
those of the breakthrough ideology. (Jote Tidd, 2005)
2.4.2 The PDCA Cycle
The never ending nature of continuous improvement ideology has been by what is
called the PDCA cycle. It is a mnemonic that stands for Plan, Do, Check Act and is
visualized in figure 5
The plan stage involves examination of the current way of doing things that has
caused a problem or could be improved. In this stage one collect enough
information that a plan of improvement can be devised. The do phase naturally is
the implementation of the plan and trying it in practice. In the check phase the
performance of the new way of doing things is evaluated in the act phase the new
way is consolidated into new standard and a new cycle starts. So in the wake of
PDCA cycle there is always a new standard of doing things, and the quality (or
performance metrics) of the process is improved. (Nigel Slack 2001)

20
Figure 5. The PDCA Cycle adaptation based on Nigel Slack
2.5 Improvement tools and techniques s620
The tools given by the operations management and process management theory
are ones that concentrate on clarifying the process steps and force the researcher
to take into consideration each aspect and possibility of otherwise simple matters
and to maintain concentration on the key issues through the change projects. Key
underlying purpose of all these techniques and tools is systematic definition and
challenging of each step of the process against what actually increases value.
(Nigel Slack 2001)
2.5.1 Input-Output Analysis
Clearly identifying the inputs and outputs define the process that particular
throughput unit goes through. Knowing the sources of inputs and the destination of
output puts the process into its place in the greater web of processes. Identifying the
outputs performance metrics against customer’s requirements will tell how well the
process is set up and what might be needed from the quality of the input and the
transformation process to improve the performance of the process.
Input-output analysis also defines the dominant throughput units that may shift
concentration from less relevant processes to the more relevant ones. Conducting
this analysis can also bring up outputs that are not used anywhere, or that might be
21
worth productizing. For example a professional company that provides specialized
equipment can be producing documentation or waste materials that are no longer
relevant or not used anywhere. Same company can also consider productizing and
selling separately the excess staff capacity if some exists. (Nigel Slack 2001)
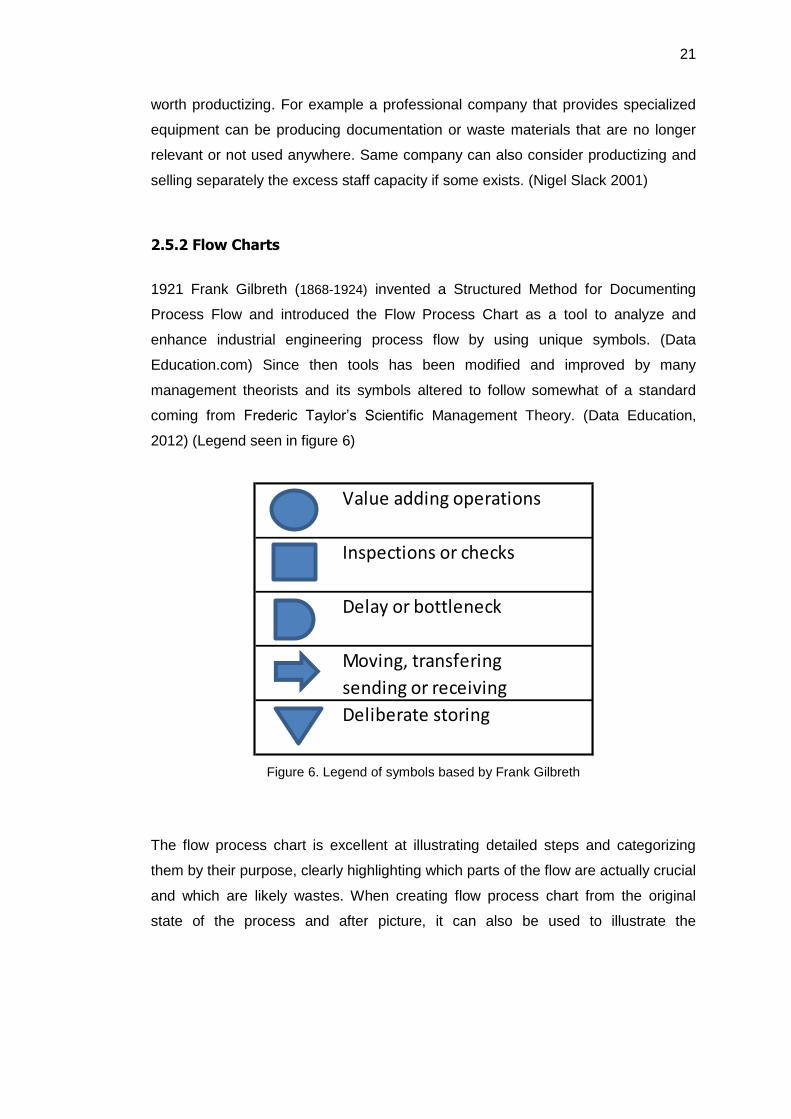
2.5.2 Flow Charts
1921 Frank Gilbreth (1868-1924) invented a Structured Method for Documenting
Process Flow and introduced the Flow Process Chart as a tool to analyze and
enhance industrial engineering process flow by using unique symbols. (Data
Education.com) Since then tools has been modified and improved by many
management theorists and its symbols altered to follow somewhat of a standard
coming from Frederic Taylor’s Scientific Management Theory. (Data Education,
2012) (Legend seen in figure 6)
Value adding operations
Inspections or checks
Delay or bottleneck
Moving, transfering
sending or receiving
Deliberate storing
Figure 6. Legend of symbols based by Frank Gilbreth
The flow process chart is excellent at illustrating detailed steps and categorizing
them by their purpose, clearly highlighting which parts of the flow are actually crucial
and which are likely wastes. When creating flow process chart from the original
state of the process and after picture, it can also be used to illustrate the
22
significance of achieved change and to ensure that the process outcome remains
the same.
Each of the process steps is categorized into operations, checking activities, delays,
moving and storing. Making these distinctions one is always forced to consider
which parts of the process truly add value. The value considered here is the value to
the correctness of the outcome of the process and it does not always directly mean
money. Inspections and delays are the most common unnecessary steps but they
might be crucial the outcome or to the following steps. In a process that has to do
with physical materials such as manufacturing, the moving of goods is often
measured also in distance, time and quantity. (Nigel Slack 2009)
2.5.3 Scatter Diagrams
If the process analyzed is such that it has many repetitions and different types of
results can be measured, scatter plots can be used to quickly identify if there is a
correlation between how it was done and the result. Scatter plots are generally used
when vast amount of data is available to identify if example different materials make
different amount of defect end product in a production mill. Scatter diagram
measures the strength at which two or more events increase the likelihood of
another, as such they are fully relying the type of data collected and the formula
they are meant to solve, therefore a scatter diagram can only show correlation and
never a causality of the events. (Nigel Slack 2001)
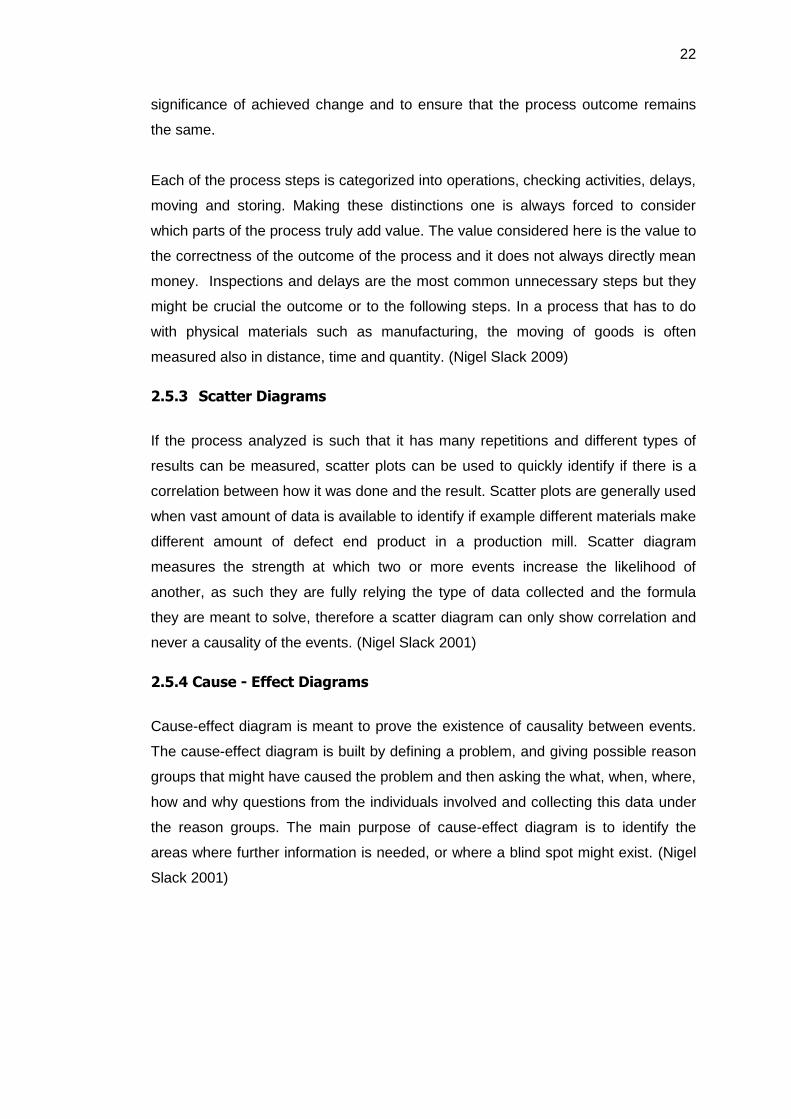
2.5.4 Cause - Effect Diagrams
Cause-effect diagram is meant to prove the existence of causality between events.
The cause-effect diagram is built by defining a problem, and giving possible reason
groups that might have caused the problem and then asking the what, when, where,
how and why questions from the individuals involved and collecting this data under
the reason groups. The main purpose of cause-effect diagram is to identify the
areas where further information is needed, or where a blind spot might exist. (Nigel
Slack 2001)
23
Figure 7. Cause-effect diagram adaptation based on Nickel Slack
In cause-effect diagram the possible reasons for the problem are gathered as
arrows that visualize the causality of the reasons that cause the problem. Figure 7
shows possible reasons for incorrect deliveries, these reasons can be found out
from customer feedback or doing a dedicated questionnaire. After the reasons have
been collected, their importance or impact to the process quality can be weighted
with Pareto diagram. (Nigel Slack 2001)
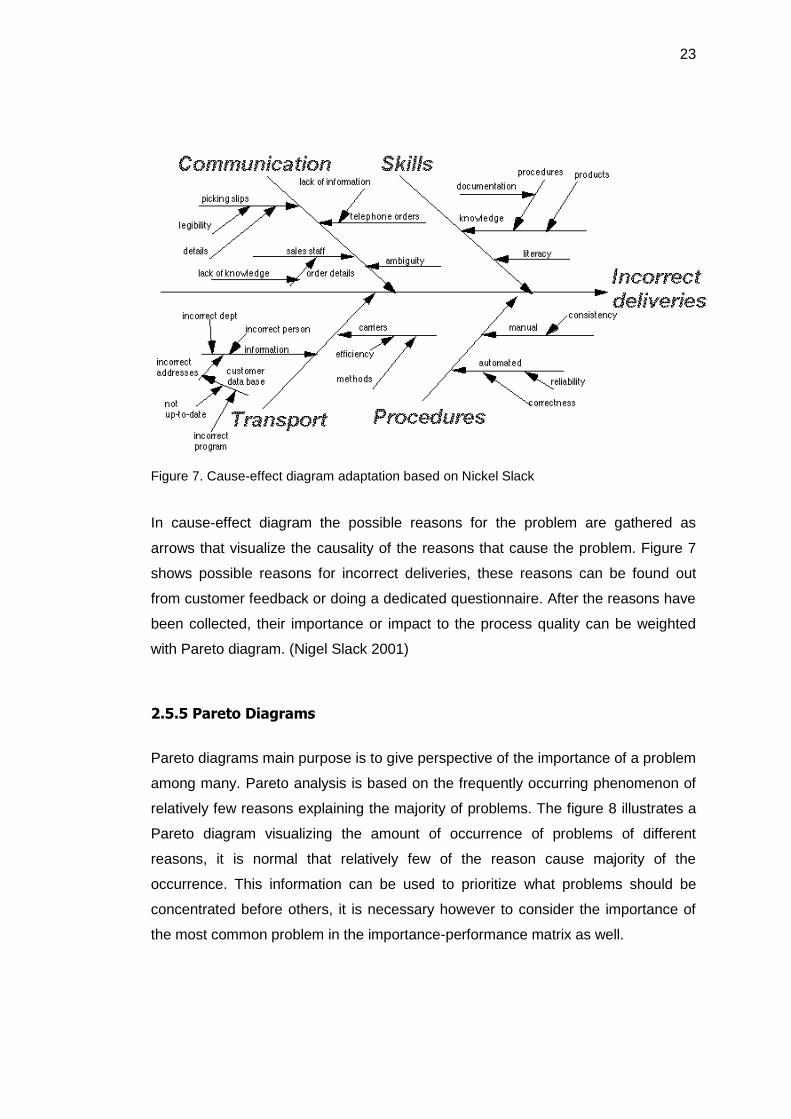
2.5.5 Pareto Diagrams
Pareto diagrams main purpose is to give perspective of the importance of a problem
among many. Pareto analysis is based on the frequently occurring phenomenon of
relatively few reasons explaining the majority of problems. The figure 8 illustrates a
Pareto diagram visualizing the amount of occurrence of problems of different
reasons, it is normal that relatively few of the reason cause majority of the
occurrence. This information can be used to prioritize what problems should be
concentrated before others, it is necessary however to consider the importance of
the most common problem in the importance-performance matrix as well.
24
Figure 8. A Pareto chart example
25
3 Current process description
The process mapping techniques and flow chart tool from the Frank Gilbreth’s
Structured Method for Documenting Process Flow was chosen to this research
since it defines the current process in required detail. This process mapping tool
was selected for its ability to bring forth the errors in process of this type, and that all
three processes in the scope of the research could be analyzed comparably and
side by side. It also allows delivering of the results of the change suggestions in
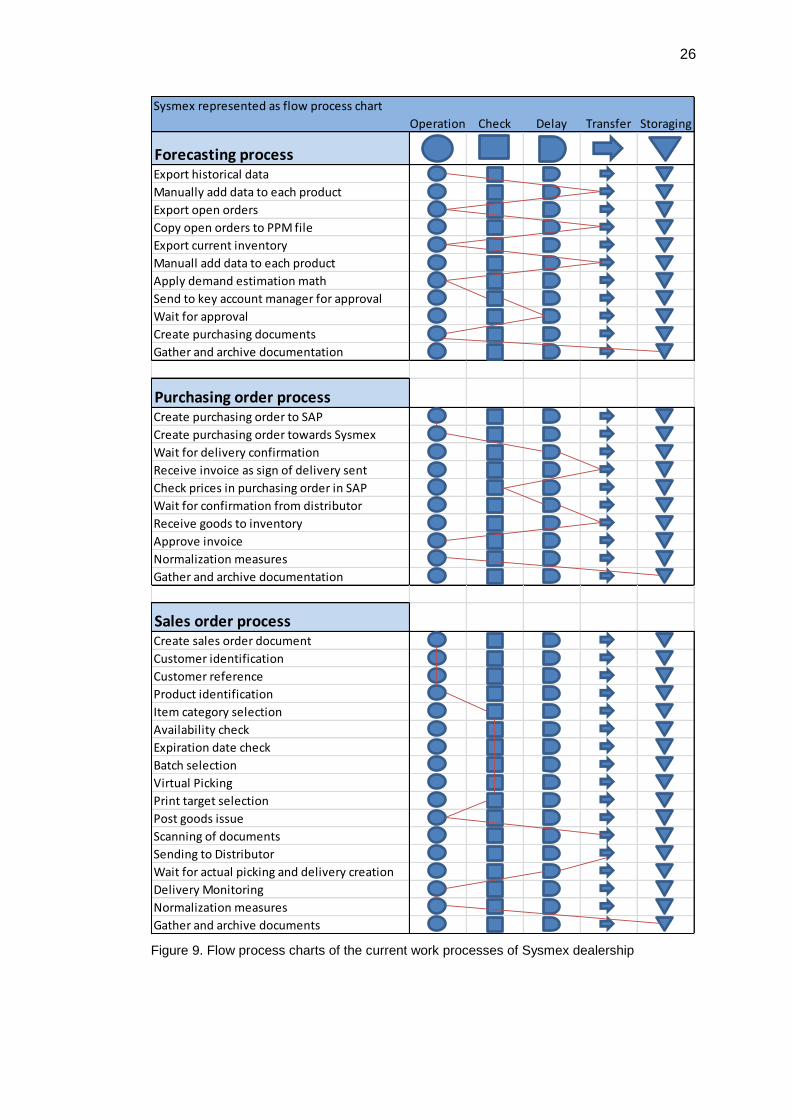
clear visualized manner. Current process steps can be seen in the figure 9
In the following chapters these different processes are explained and opened up in
more detail, and in the end of the document there is a similar process chart where
unnecessary steps are removed and the process is developed so that with fewer
steps the same process output is delivered.
26
Sysmex represented as flow process chart
Operation Check Delay Transfer Storaging
Forecasting processExport historical data
Manually add data to each product
Export open orders
Copy open orders to PPM file
Export current inventory
Manuall add data to each product
Apply demand estimation math
Send to key account manager for approval
Wait for approval
Create purchasing documents
Gather and archive documentation
Purchasing order processCreate purchasing order to SAP
Create purchasing order towards Sysmex
Wait for delivery confirmation
Receive invoice as sign of delivery sent
Check prices in purchasing order in SAP
Wait for confirmation from distributor
Receive goods to inventory
Approve invoice
Normalization measures
Gather and archive documentation
Sales order processCreate sales order document
Customer identification
Customer reference
Product identification
Item category selection
Availability check
Expiration date check
Batch selection
Virtual Picking
Print target selection
Post goods issue
Scanning of documents
Sending to Distributor
Wait for actual picking and delivery creation
Delivery Monitoring
Normalization measures
Gather and archive documents
Figure 9. Flow process charts of the current work processes of Sysmex dealership

27
3.1 Product information management
Product master data management is the fundamental requisite for all other parts of
the process to function smoothly. Many of the problems that arise in other parts of
the process can be traced back to, or could be fixed by modifying the way product
data is managed in the system.
For all normal products Roche Diagnostics Oy uses single backbone SAP server,
known as Diagnostics Master System at its Global Material Master department in
the corporation headquarters that contains all the product information master data.
Products are opened and changed there and DMS feeds all other regionally used
SAP versions with this data (Global Supply Chain manual). This kind of setup is
mandatory for the purposes of statistical data extraction from the system for the
purposes of financial reporting and internal metrics.
In the interview with Eija M. and Brien L., who are responsible for the product
master data change requests, several weaknesses of the Sysmex product material
data was identified. These weaknesses have become apparent one by one through
the analysis of the other parts of the process. When collected into a single package
they show a clear prolonged state of mismanagement of product information of the
Sysmex dealership products. This is most likely due to the special nature of the
dealership and minimal amount of people involved in the Sysmex process.
Both Eija M. and Lampen-Smith agreed that one of the main reasons why Sysmex
has a special nature-status is the expertise required in the product information at
system level. Other product groups do not require similar knowledge of the products
themselves for their sales order creation process. This barrier of knowledge is
mostly artificial and caused by missing or broken information in the master data.
Main problems in filling the product data into the SAP-system are listed below:
1. The purchasing prices of the majority of the products are not updated to the
latest price. This creates a wrong valuation of the open purchasing orders,

28
as in the purchasing process the price on the open purchasing order is
corrected only moments before accepting the order. Some of the products
have no purchasing prices set at all
2. Products which have been added during the past year have not had their
weights set into the system. This causes an extra step to the process of
creating both a purchasing order and a sales order, one step for each
product bought or sold. This causes a major delay in order creation for no
justified reason.
3. All products have their item category set to a wrong default value. This
creates again an extra step, one per item, every time when creating a sales
order as the order needs to be modified every time to change the default
value to the actual correct value.
4. All products have their default source warehouse value set to none. Another
extra step easily avoided by defaulting it to the only warehouse in use.
3.2 Forecasting
Forecasting process in Roche Diagnostics is governed by Compendium Forecasting
Process & Forecast Accuracy manual. This document mainly sets the rules and
standards for the internal forecasting process within the Roche Corporation and it is
applied primarily for Roche’s own product lines. However, it also sets the standards
of forecasting to all third parties to follow as well.
Forecasting and purchasing of Sysmex products is separated into two separate
processes due to the differences in product categories. These two processes for
reagents and Control bloods are described in more detail in chapters 3.2.1 and
3.2.2.
29
3.2.1 Forecasting for Reagents
Reagent is a product group in which there are 100 different articles most of which
chemicals which the diagnostics instruments will consume in normal day to day
usage to produce test results. However, this product group consists of also common
spare parts and accessories. These chemicals share the characteristic of similar
long expiration dates and have mostly the same transportation requirements.
Reagents are ordered 90 days in advance and they have on average of 180 days of
usage time when they arrive. New order is created every 30 days. In case of
emergency there is an emergency stock from which a small amount of each reagent
can be ordered but with significantly higher delivery costs.
For Reagents there exists an excel file known as the Purchasing Proposal Master
file which turns all information inputs into the purchasing proposal.
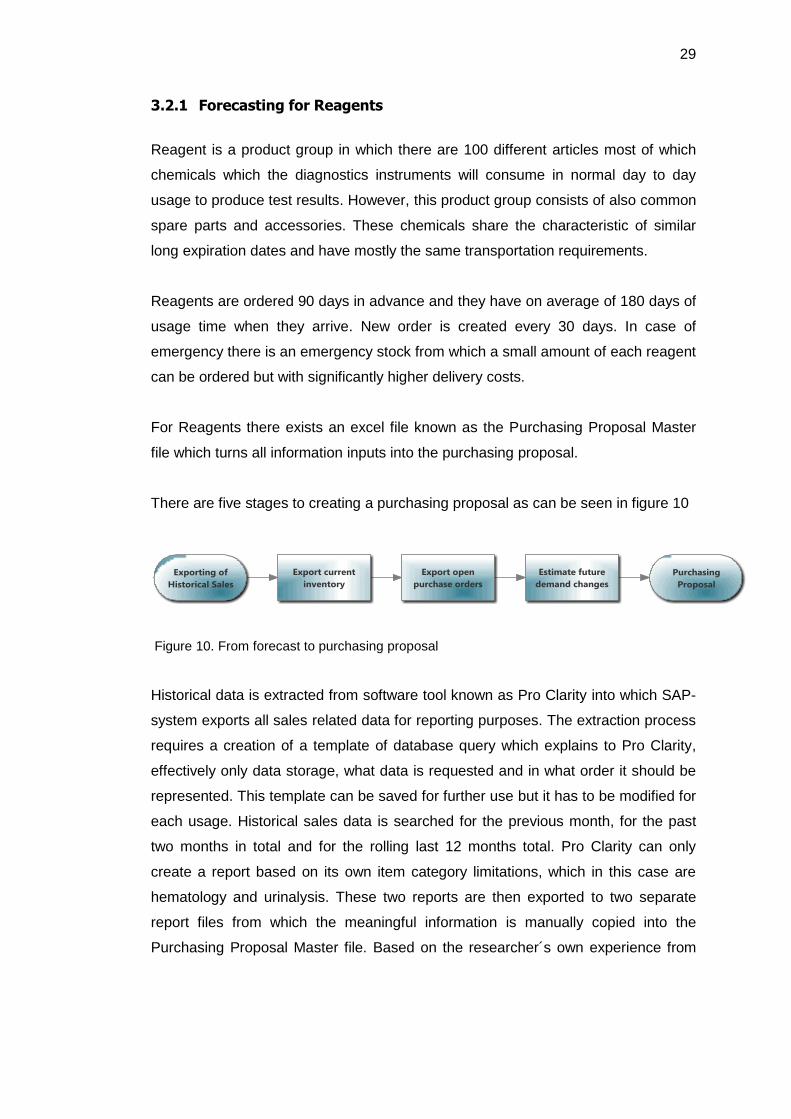
There are five stages to creating a purchasing proposal as can be seen in figure 10
Figure 10. From forecast to purchasing proposal
Historical data is extracted from software tool known as Pro Clarity into which SAP-
system exports all sales related data for reporting purposes. The extraction process
requires a creation of a template of database query which explains to Pro Clarity,
effectively only data storage, what data is requested and in what order it should be
represented. This template can be saved for further use but it has to be modified for
each usage. Historical sales data is searched for the previous month, for the past
two months in total and for the rolling last 12 months total. Pro Clarity can only
create a report based on its own item category limitations, which in this case are
hematology and urinalysis. These two reports are then exported to two separate
report files from which the meaningful information is manually copied into the
Purchasing Proposal Master file. Based on the researcher´s own experience from
30
the past 6 months updating new sales values into the PPM-file takes on average 30
minutes.
Current inventory data is searched from the SAP database. Currently it has proven
to be fastest to extract the data directly from the SAP by taking a full list of products
in stock and simply updating the PPM-file manually for each product. This part of
the process takes on average 10 minutes.
Before demand estimation can be conducted the user has to extract purchasing
order data from the past monthly orders and add them to the PPM-file and modify
the file itself so that it is ready to be used to process the inputs. This part of the
process takes no more than 5 minutes.
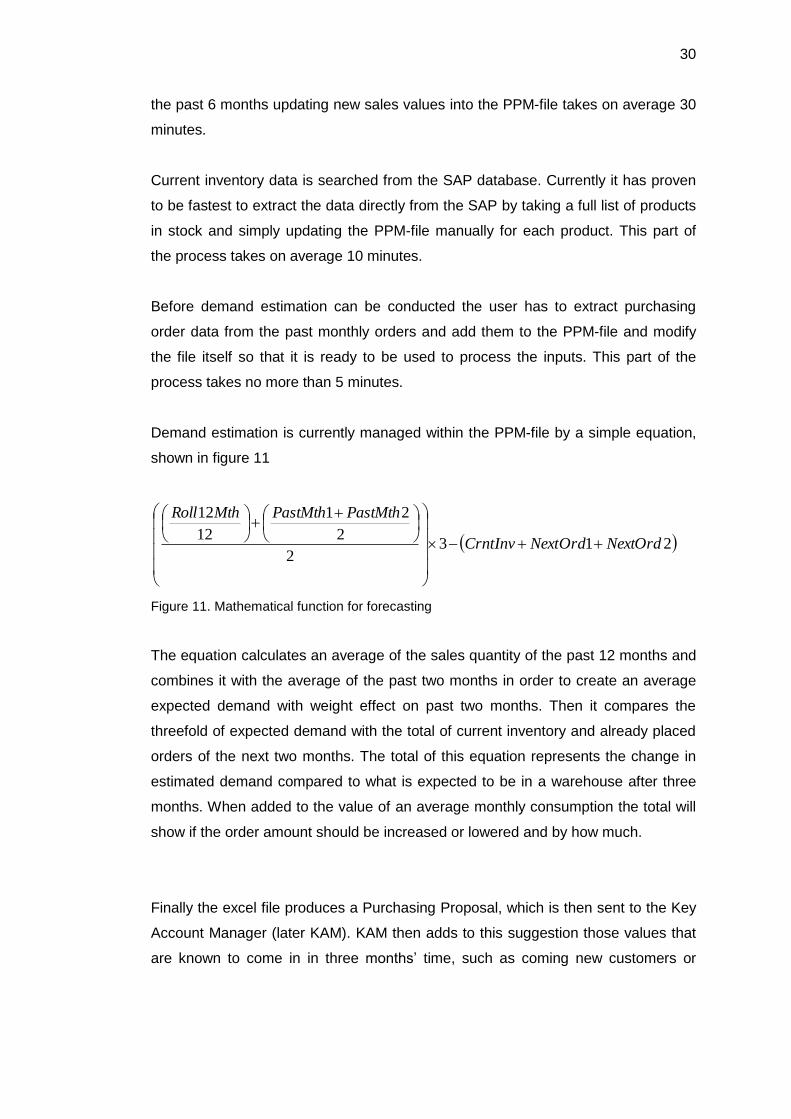
Demand estimation is currently managed within the PPM-file by a simple equation,
shown in figure 11
2132
2
21
12
12
NextOrdOrdNextInvCrnt
PastMthPastMthMthRoll
Figure 11. Mathematical function for forecasting
The equation calculates an average of the sales quantity of the past 12 months and
combines it with the average of the past two months in order to create an average
expected demand with weight effect on past two months. Then it compares the
threefold of expected demand with the total of current inventory and already placed
orders of the next two months. The total of this equation represents the change in
estimated demand compared to what is expected to be in a warehouse after three
months. When added to the value of an average monthly consumption the total will
show if the order amount should be increased or lowered and by how much.
Finally the excel file produces a Purchasing Proposal, which is then sent to the Key
Account Manager (later KAM). KAM then adds to this suggestion those values that
are known to come in in three months’ time, such as coming new customers or
31
instrument installations and their effect on the future demand. The file as a whole is
sent to the KAM for inspection, and it returns with added input and comments on
each product line. From the experience of the researcher, there can be a significant
delay before the KAM has the time to approve the purchasing proposal and there is
some proof that would justify that this approval does not necessarily increase the
reliability of the process, even though the commentary input to the predictable
demand changes is considered as valuable information.
PPM-File must then be modified one more time with updated values after which a
PO (Purchase Order) is placed in the SAP and the PPM-file generates a document
with agreed template which is then sent to the Sysmex sales representative. Finally
PO document is combined with order confirmation and all commentary from the
KAM and it is then placed into a binder. The PPM-file is saved into agreed location.
3.2.2 Forecasting for Control bloods
A product group of chemically treated and stabilized blood is known as the Control
blood. This blood is created from normal donated human blood which is treated to
have a certain level of certain characteristics, such as known red blood cell count.
They are used to test and control that the instruments used give out the desired
results. Controls come in 5 different varieties, which each have their own separate
ordering cycle. All Control bloods are produced according to pre-orders, hardly any
buffers exists on the manufacturer’s site.
The delivery time is from 80 to 100 days on a pre-agreed cut off and delivery dates.
All the controls share the requirement of having cold chain from the supplier’s
warehouse all the way to the instrument at the customer´s site. They are all small in
quantity and size but require that strict safety protocols are followed. Controls have
also long delivery time and very limited expiration dates and due to this they are
generally not held in stock. For Control bloods customer information and order
management there exists a Sysmex Kontrollikäyttäjät Master File (later SKM-file)
which is the source of all necessary information needed to maintain the flow of
Control bloods to the customers.
32
The SKM-file contains data of all the customers who have Sysmex instruments
which demand Control blood for operation, as well as the information of how much
of the control blood they need. Each type of blood has its own customer lists and
the file compiles this information into purchasing proposal template separately for
each blood type. Each blood type has their own ordering cycle but they all share the
same characteristics of 90 days delivery time and direct delivery from the supplier to
the end customer. Updating of the SKM-file, demand estimation, purchasing
proposal creation and purchasing is a part of the daily operation of the Order
Manager Coordinator.
A minimal buffer of one or two units of each product type is allowed and this is
usually enough to support a new customer until they become a natural part of the
ongoing cycle. There exists also the option to order more of each blood from the
supplier with greatly increased price in such a case that the local buffer stock runs
out.
3.3 Purchasing Process and inbound logistics
Purchasing of Sysmex reagents and controls is part of ongoing daily tasks due to
the nature of Control bloods but also because unpredictable changes in demand of
reagents. The long delivery times and spread out ordering cycles mean that OMC is
faced with a situation where ten to twenty purchase orders are open and in different
phases of their ordering cycle. This demands a strong documentation during the
purchasing process cycle.
Currently purchasing process as a process is well planned and documented and
mistakes happen rarely and managing the different phases has been taken into
consideration. There are few steps taken that are unnecessary and some that
should be added to meet the Global Supply Chain standards. For example the
documentation process does not comply with the policy of collecting data of errors.
3.3.1 Purchase order process of reagents
33
Purchasing process of 3rd party reagents is a normal part of OMC’s daily operation,
however due to the nature of Sysmex products and the management of a separate
warehouse, purchasing of these products has different level of importance. This is
also the only part of Sysmex process which is currently documented and where a
user manual exists.
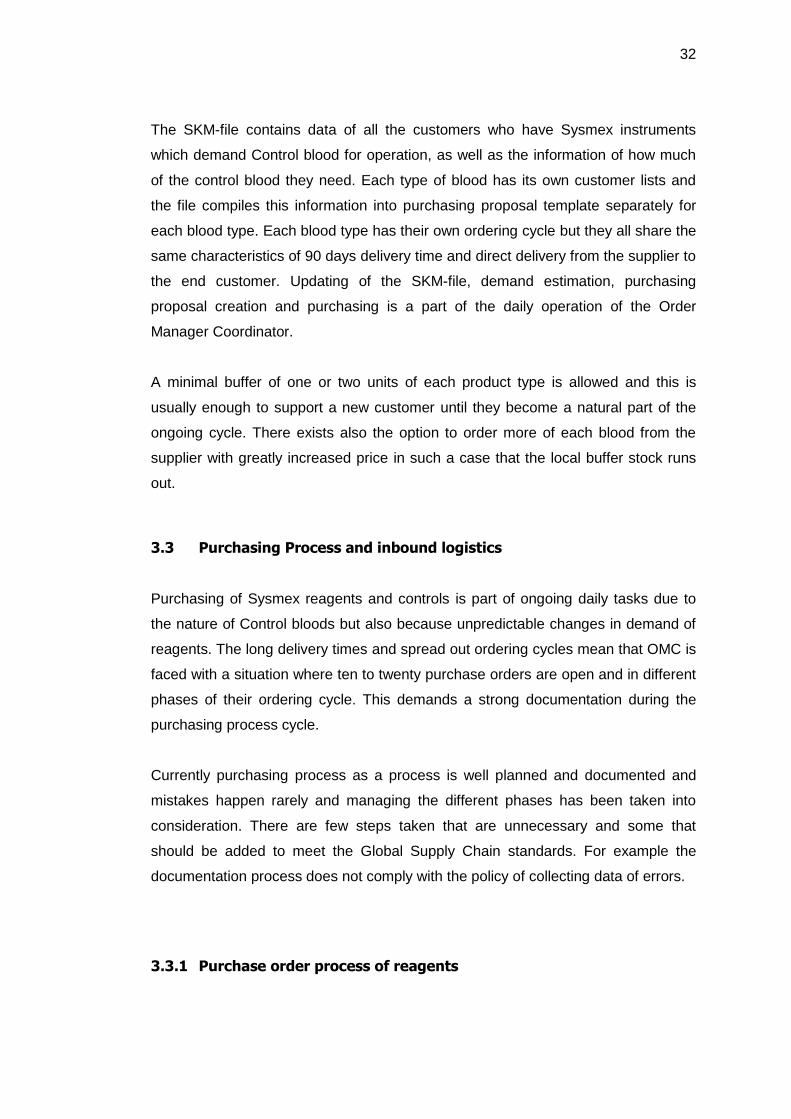
This process is initiated several times over the duration of a month but culminates at
the time when a monthly order is started by receiving accepted PPM-file from the
KAM. Purchase Order document is created into the SAP system based on the
information on the PPM-file. This creates a PO document print which is a key
document when the rest of the process phases are followed and when trying to
avoid losing the track of any of the initiated purchases. The purchase order process
flow of reagents is visualized in figure 12
Figure 12. Purchase order process for reagents
A copy of the PO is translated into Sysmex product numbers with the help of the
PPM-file and then e-mailed to the representative of the supplier, who answers with
delivery confirmation on those products that can be delivered at requested times or
discussion ensues of those that cannot. Usually not later than two days later a
delivery confirmation document will be received and it is connected with the PO
document to track the progress of the purchase.
Invoice will be generated at the same time as the delivery leaves the suppliers site
and OMC receives this document by email. It is normal that delivery will be split into
several vehicles depending on the characteristics of the products, so it is normal

34
that several invoices are normally targeting a single purchase order document.
These documents are collected together with the purchase order until the whole
order can be confirmed fulfilled. At the arrival of the invoice it is also normal to notify
the distribution warehouse about the inbound delivery, especially if it is significant in
quantity.
The invoice also acts as a price check between supplier’s price and price in the
SAP-system. The prices in the SAP system for Sysmex products have not been
updated properly and their fluctuations are mainly ignored. OMC has to change
prices in the PO document in the SAP-System so that they match with the ones in
the invoice. Missing this step would cause the invoice to differ from the purchasing
documents value, and thus when the invoice is paid the value of the goods in the
stock will be wrong. This inherently causes further problems in accounting, financial
reporting and stock insurance costs.
When goods arrive at the distribution warehouse their representative sends a copy
of the packing list to the Order Management Team. The packing list contains the
batch number and expiration date data of each product and it is then used to accept
the goods stated on the document into inventory with correct information. Next the
packing list is connected with the printed PO document to note that goods have
been received.
The distributor company checks the delivery for damages and. When goods can be
agreed to have been received in good condition and this is communicated back to
the OM, the invoices are released for payment. Copies of the invoices are
connected to the original PO document and archived as to indicate a completed
process.
3.3.2 Purchase order process of Controls
The purchase order process for Control bloods revolves around the SKM-file in
which all the customers are listed. Next to the customer information is the number
and types of Control bloods they require and this information is used as a simple list
of the amount of Controls to order. As stated earlier all Control bloods are produced
35
according to pre-orders and the delivery time is from 80 to 100 days and the
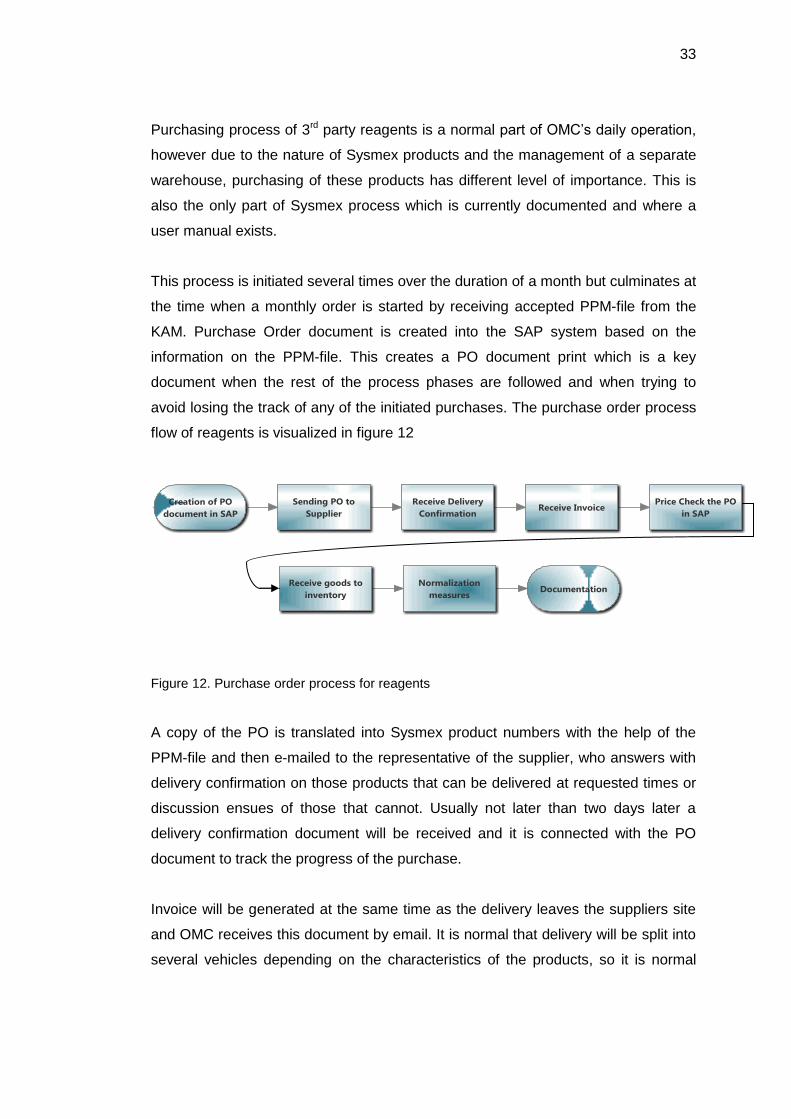
manufacturer keeps hardly any buffer stocks. The Control blood process flow is
visualized in the figure 13
Figure 13. The purchasing process of the Control blood products
It falls on Roche Diagnostics to be responsible for maintaining a buffer for new
instrument installations or replacements in case of damages to or errors in the
product. As the flow of the goods is constantly known and new instrument
installations are generally also known the buffer is maintained manually as flat 1-2
units of each product type. By far the buffer has been enough to maintain all
installation events and to guarantee high customer satisfactions.
3.4 Warehousing
Sysmex products are stored mainly in outsourced distribution center in South West
Finland. The 3rd party operator manages inbound clearance, storage, picking &
packing and distribution of all Sysmex reagents and instruments from this location.
Roche Diagnostics follows “Warehousing and Distribution Outsourcing Manual” in
managing the outsourced warehousing activities. This document states the policies,
limitations and requirements for the operator.
The general ideology in the manual is that the operator must become a part of
Roche Diagnostics Supply Chain, and adhere to all its requirements:

36
Whenever the local warehousing and distribution function is outsourced to an
external partner, this partner will become an integrated part of the Roche Diagnostics Global
Supply Chain and therefore has to be in full compliance with the Roche Diagnostics Global
Supply Chain requirements as well as with local laws and regulations. (Warehousing and
Distribution Outsourcing Manual, 2011).
Due to the different nature of the control blood products they come by airplane
directly from the manufacturer. When they arrive at the Finnish customs the
representative of the operator at the airport is sent all the sales orders and relevant
documentation so that these blood products can be delivered straight to the
customer´s sites.
3.4.1 Warehousing operator
The representative of the distributor, Mr. Virtanen, was interviewed. Based on this
interview the current situation, its challenges, strengths and shortcomings is
described in the following chapters.
The operator has not changed in nearly a decade but the processes have been
changing and Sysmex dealership has been growing over the time. However, the
operator’s daily activities are mostly routine tasks. The responsibility of the operator
begins from receiving the incoming delivery and continues by physical inspection of
the goods. This is followed by requirement maintain the storing of the goods and
ends at successful delivery of the goods to the customer based on sales orders
received from the Order Management Team. It hardly could be a simpler process
but with high quality requirements and demand on perfect accuracy and with limited
manpower, it quickly gets difficult to deliver.
Mr. Virtanen operates as Special Customer Manager and is concentrating on the
responsibility of Roche Diagnostics as a customer and all to the customer service
aspects from unloading, picking, packing and delivering of shipments,
communicating with Order Management team and managing the warehouse. During
the discussion with Mr. Virtanen the current situation was clarified as to be a result
of evolution of a long co-operation and that most routines have been established
37
through trial and error. The strength of the current situation is this co-operation that
has allowed the warehouse and respectfully large throughput amount to be
managed by just one dedicated employer but with full organizational support. At the
same time this is the greatest challenge of the current setup since the limit of
throughput capacity is causing significant problems when customer demand cannot
be predicted and delivery assignments pile up more than can be managed by a
single employee.
Together with Mr. Virtanen we substantiated the notion that currently the operator
together with the Order Management team does not fulfill all the monitoring
requirements of Roche Diagnostics Distribution and Outsourcing manual.
In several conversations in the Order Management team members it has also
become apparent that the warehousing operator has a weak capability for adjusting
to demand fluctuation and to special delivery situations. In multiple occasions the
operator has failed in providing on time delivery because of lack of manpower or it
has failed to fulfill quality requirements on special delivery situation. This is
especially alarming notion when Sysmex dealership’s constant growth and
importance of the products is taken into consideration.
3.4.2 Inbound Activities and Storage Management
When received, each incoming delivery is checked against the relevant purchasing
order and each pallet and box is physically verified for contamination, tampering and
damage. The quality, quantity, required warning labels, batch numbers and
expiration dates are all documented and photos are taken where possible, these
documents are then shared with the Order Management team. Receiving of inbound
delivery by the operator has been errorless and it that part of the process fully
complies with the standards stated in the Warehousing and Distribution Outsourcing
Manual and in the Global Supply Chain standards.
The operator lacks warehousing software which would be capable of interfacing with
Roche Diagnostic’s IT- systems or offering an online interface so that all inventory
38
management could be handled over email. After inspection inbound deliveries are
reported to the Order Management Team and the sales order documents are
delivered to the operator by email and twice a week a general inventory level
checkup is done manually by sending inventory lists over email. This is not an
optimal situation but it fulfills the current needs and the relevant requirements.
Topic 7.1.3 in the Warehousing and Distribution Outsourcing Manual states that the
storage area must be temperature controlled, records of controlled values and
records of the calibration of the controlling equipment should be available for review
at all times. These parameters are critical to the quality of the products and they are
currently not monitored or recorded at all. Currently also no financial control or
verifying of the invoicing correctness demanded by the outsourcing manual exists.
3.5 Sales order process and outbound logistics
Sales Order (SO) is a document in the SAP system which defines the following
information: customer as “sold-to”, customers delivery address as “ship-to”,
additional references and markings expected by the customer in the relevant
documents and the products ordered. The process starts from the purchase order
received from the customer, from which then the SO document is created and ends
when the completed document is archived.
Sales Order creation, monitoring of distribution and error correction is the majority of
Order Management team’s daily activities and therefore a fast and risk free creation
process is crucial for reducing the work load. Currently Sysmex product group
requires specific knowledge of each of its products in the SO creation process. This
is mainly due to the mismanagement of product information in the SAP system and
lack of process development effort.
From sales order creation perspective the products themselves are not drastically
different when Control bloods are excluded. The SO creation process follows the
same general structure as other Roche Diagnostics products. However there
currently exist few steps in the process that make it unique from the others and for
this reason Sysmex SO creation has been dedicated to just one person. In case of
39
sick leave or vacations this one-person-approach increases the risk of problems
when they’re gone and multiplies the efforts trying to normalize the situation later. It
is also considered a business risk if this person is forced resign for some
unforeseen reason.
3.5.1 Standing Orders
Standing orders are pre-agreed contracts with the key customers for preset
deliveries at preset intervals and they are a key component at enabling non-stop
functioning of the instruments at the customers´ sites. The share of value of
standing orders from all deliveries is roughly 50 to 70% and thus they act as a
primary source for purchase order creation process.
Customers often contact the order management team to adjust the standing orders
according to the fluctuations of the reagent consumption of the instruments in use. A
standing order can thus effectively change the question from the customer’s
perspective from “Should I order more or not” to “How much should I order in order
to be able to conduct all foreseeable tests”. Thus standing orders are the preferred
ordering style when possible. Standing order model also ensures the least possible
amount of special orders and situations where the laboratory has ran out of
reagents that effectively might save lives. Having a functioning and well managed
standing order system is a basis for steady, safe and on time deliveries while greatly
also supporting sales growth.
Currently standing orders are managed as documents in binders that describe the
customer, the products, amounts and arrival dates the customer expects for these
goods. The binder is accompanied by a standing order timetable document which
shows to the employee responsible of them the order dates in chronological order
for simple overview of coming orders and for other team members a quick access to
the correct information. The current situation is considered strong and stable.
40
The timetable document is used to notify the distributor about the dates when the
standing orders are piled up on same dates. This is done to avoid situations where
the distributor’s resources for packing and delivery would become a bottleneck.
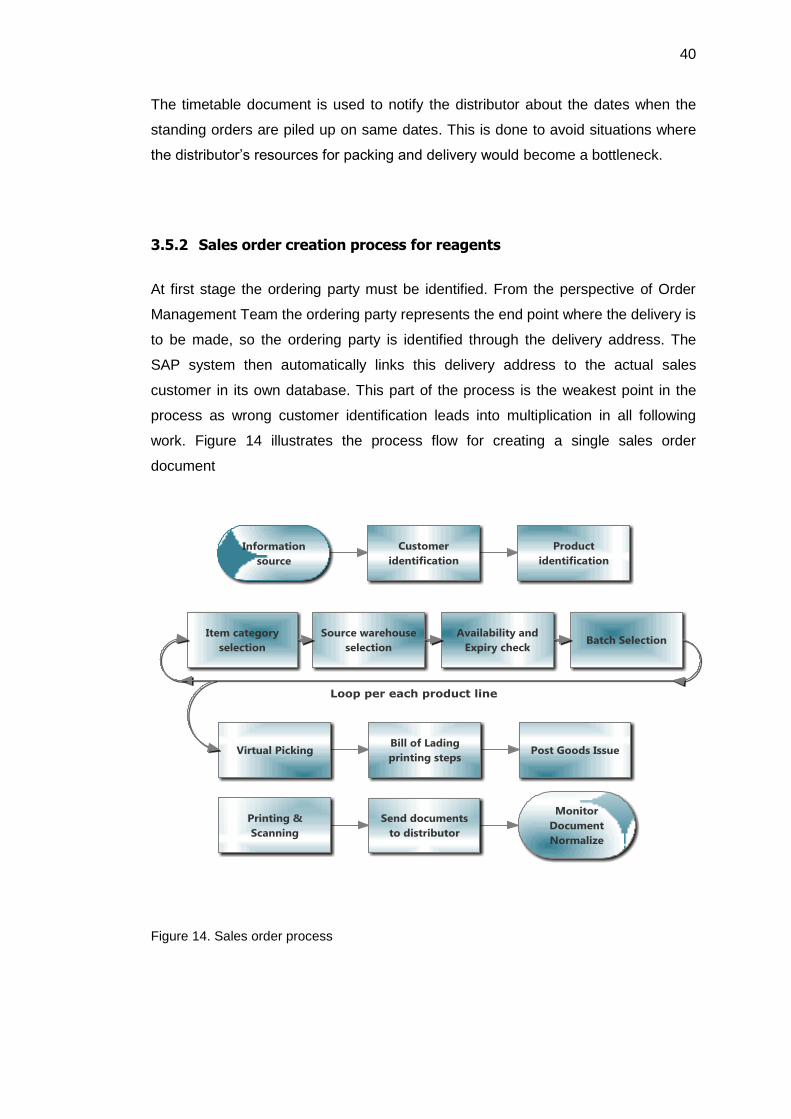
3.5.2 Sales order creation process for reagents
At first stage the ordering party must be identified. From the perspective of Order
Management Team the ordering party represents the end point where the delivery is
to be made, so the ordering party is identified through the delivery address. The
SAP system then automatically links this delivery address to the actual sales
customer in its own database. This part of the process is the weakest point in the
process as wrong customer identification leads into multiplication in all following
work. Figure 14 illustrates the process flow for creating a single sales order
document
Figure 14. Sales order process
41
Second stage is registering customer’s markings, reference numbers or internal
comments to the SO document. Followed by the identification of the products
customer wishes to order. Identification is done preferably by product numbers,
which in a vast majority of the cases the customer knows beforehand.
For every product identified follows a loop of follow up actions special for Sysmex
product group. They take place on each and every product line of this type, but
depending on the individual product the options selected in each phase differ. They
are, however, always the same for each time.
- Item category must be changed to identify the product as 3rd party
- Source warehouse must be selected.
- Availability check
- Expiring date check
- Batch selection
After the full list of products has been created, the order must be virtually picked in
the system, which means filling up the order document with the amount of products
to be picked. Actual picking happens later at the distributor’s warehouse but the
system demands picking before the posting of the delivery documentation can be
created. The creation of packing list in SAP is currently a manual process and takes
quite a while. It is also repeated exactly the same way for each following order so its
meaningfulness it is constantly questioned.
The printed packing list documents are then scanned as email attachments and
sent to the distributor where they are used as picking lists and attached to the
delivery as bills of lading. A copy of the packing list represents the SO document in
the system and is archived in Order Management Team office with all necessary
reference material, such as the source of the order document.
3.5.3 Sales order process for Control bloods
Control bloods follow the same sales order creation process with the difference that
the information source for order creation is always the Sysmex Kontrollikäyttäjät
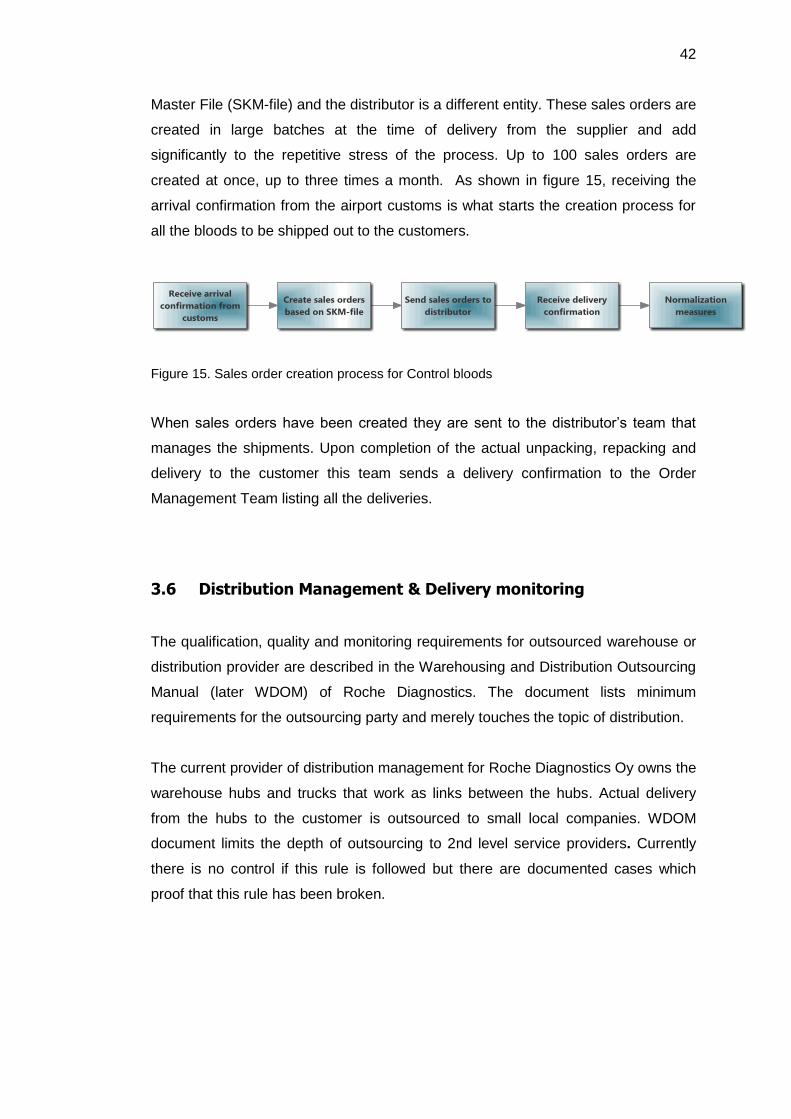
42
Master File (SKM-file) and the distributor is a different entity. These sales orders are
created in large batches at the time of delivery from the supplier and add
significantly to the repetitive stress of the process. Up to 100 sales orders are
created at once, up to three times a month. As shown in figure 15, receiving the
arrival confirmation from the airport customs is what starts the creation process for
all the bloods to be shipped out to the customers.
Figure 15. Sales order creation process for Control bloods
When sales orders have been created they are sent to the distributor’s team that
manages the shipments. Upon completion of the actual unpacking, repacking and
delivery to the customer this team sends a delivery confirmation to the Order
Management Team listing all the deliveries.
3.6 Distribution Management & Delivery monitoring
The qualification, quality and monitoring requirements for outsourced warehouse or
distribution provider are described in the Warehousing and Distribution Outsourcing
Manual (later WDOM) of Roche Diagnostics. The document lists minimum
requirements for the outsourcing party and merely touches the topic of distribution.
The current provider of distribution management for Roche Diagnostics Oy owns the
warehouse hubs and trucks that work as links between the hubs. Actual delivery
from the hubs to the customer is outsourced to small local companies. WDOM
document limits the depth of outsourcing to 2nd level service providers. Currently
there is no control if this rule is followed but there are documented cases which
proof that this rule has been broken.
43
WDOM document under topic 7.1.4.Outbound Activities states “Where appropriate,
the use of temperature monitoring devices is required to assure the product
integrity”. At the topic 7.2.2 Ground Transportation it states clearly that it is
distributor’s responsibility to maintain temperature logging and proof of cold chain
management throughout the delivery. Currently the cold chain for refrigerated
products is not monitored at all. Cold chain is ensured by only allowing the cold
products to leave from Monday to Wednesday, so that theoretically they are not left
at the hubs on the route over the weekend, there are no documented cases when
this precaution has not been enough. However, there exists an unacceptable
amount of documented cases where products have been frozen during the delivery
at winter, clearly stating that the special requirement of the products is not properly
under Roche Diagnostic’s control. These events cause the product to be
unacceptable for use, cause minor expenses from its destruction and major
expenses and delays in operation from the need to replace the product at the
customer site as fast as possible, free of charge. The distributor in general takes the
responsibility of these events but the contract allows crediting only based on weight
of the delivery, and the general trend with the reagents is that the less it weighs the
higher the value.
The manual demands documented procedures for picking and packing. These
documents do not exist. Due to the nature of the outsourcing having unknown 3rd
party companies handling the last part the delivery, it is rare but repeating
occurrence that deliveries are piled up on top of each other even against the rules
and markings on the deliveries themselves. The main reason for of the damages
caused this way might be connected with the lack of clearly documented
instructions of the picking and packing procedures.
Documentation of completed dispatches is required by the company policy.
Currently this documentation is freely available only for Control blood deliveries.
This connects together with the IT-system interface issue described under the
chapter 3.5.1. Sales order process. The issue will be cleared out when the It-
systems of both companies will be connected. This documentation supports
product traceability throughout the supply chain and falls also under the quality
policy for storage of relevant documentation.
44
WDOM describes at topic 10. Complaints & Logistics Claims Handling and topic 11
Deviation Handling that the outsourced distributor is responsible of resolving
customer complaints and recording them, as well as having an adequate deviation
management and reporting system. In Finland’s case the Order Management Team
manages all complaints, claims and deviations in co-operation with the distributor.
Even as OMT manages the complaints, they should be recorded as described in the
policy. The WDOM lists the following topics to be recorded:
A procedure which ensures that all complaints (oral & written) are
processed and evaluated in a uniform and timely manner
A procedure which ensures that all complaints are documented and
maintained in designated files or a validated IT system.
There should be a written report available which documents all complaints
related to Roche products and customers.
The deviation report shall include a brief description of the event,
determination of the cause, quality impact and possible corrective and/or
preventive actions.
The distributor must trend its deviations on a regular basis to monitor the
performance and the quality of its processes. This trending shall be
performed in written form and will be available for Roche on a regular basis.
Deviations in delivery or customer complaints are currently not recorded in
single designated location with the required detail. The distributor does not
trend its deviations nor report the quality of its processes at set intervals as
demanded by the policy.

45
4 Analysis of the desired process state
The desired state of the purchasing and inbound logistics process of the Sysmex
dealership in Order Management team is as much simplified and automated as
possible with a detailed documentation that allows the process to be handled by
anyone without significant special skills or product knowledge required. Being the
only major process where 3rd party supplier is involved in the processes of Roche
Diagnostics, the Sysmex dealership process should be refined to a point where it
can function as a benchmark against which other later evolving 3rd party supplier
relationships can be compared to. The complete process from forecasting to
invoicing must be brought into the extent of Roche Diagnostics Global Supply Chain
Standards.
4.1 Product Management
In the desired state of product information there would be no extra steps required in
creation of purchasing and sales documents. Each product would have all required
information placed in the master data file in such detail that the steps would not be
necessary. Due to the nature of the product data coming from DMS and same
product information being in use in the whole EMEA region it might not be possible
to change all the variables. Product information should also follow the Roche
Diagnostics Global Logistics Standards document.
4.2 Forecasting
The biggest weakness in forecasting is the Purchasing Proposal Master file. It
requires experienced user to maintain and utilize it and it still provides mediocre
results at best for forecasting purposes. Without a working forecasting tool many
decisions have to be made based on educated guess and experience. This is an
obvious business risk in case of unforeseen absences or change in the personnel. A
mistake done in forecasting of demand or simply managing the file can cause
drastic financial results if the mistake is allowed to go over to purchasing phase.
46
There exist no rules of when the current inventory is taken from the SAP system, so
the information uploaded to the PPM-file does not always represent a cycle of whole
month. A week’s difference can cause that previous month’s delivery has just
arrived to the stock, causing a situation where it would appear that stock is more full
than it actually is, which then causes the PPM-file to suggest minimal order size and
thus directly causing drastic problem when it is delivered in 3 months
The current forecasting math in the PPM-file also takes under consideration a yearly
average and rolling past two months. This is inadequate if the order amounts should
be adjusted to seasonal changes in demand. The math also ignores minimum order
quantity, minimum stock level, efficient delivery quantity and shelf life of products.
Ignoring these factors directly causes price differences in the delivery costs and in
the scrapping amounts.
There is also no input from KAM or other external sources about the changes in
demand such as new instrument installations or instrument removals. These factors
are dependent completely on memory of the user.
The information input structure of the PPM-file should also be completely
redesigned so that it can create purchasing proposals directly from exported
information from the Clarify- and the SAP systems to reduce the amount of manual
work that is mandatory for its maintenance. This way a more holistic amount of
information could be uploaded with less manual work and at the same time
providing clearer foundation, control over and quality for the purchase proposal.
Forecasting for Control blood products currently operates at peak performance.
Kontrollikäyttäjät Master File (later SKM-file) holds all relevant customer information
and the process which brings new customers to the list already takes into
consideration the long lead time. Current buffer levels are adequate, and no
performance would be gained by changing the current situation.
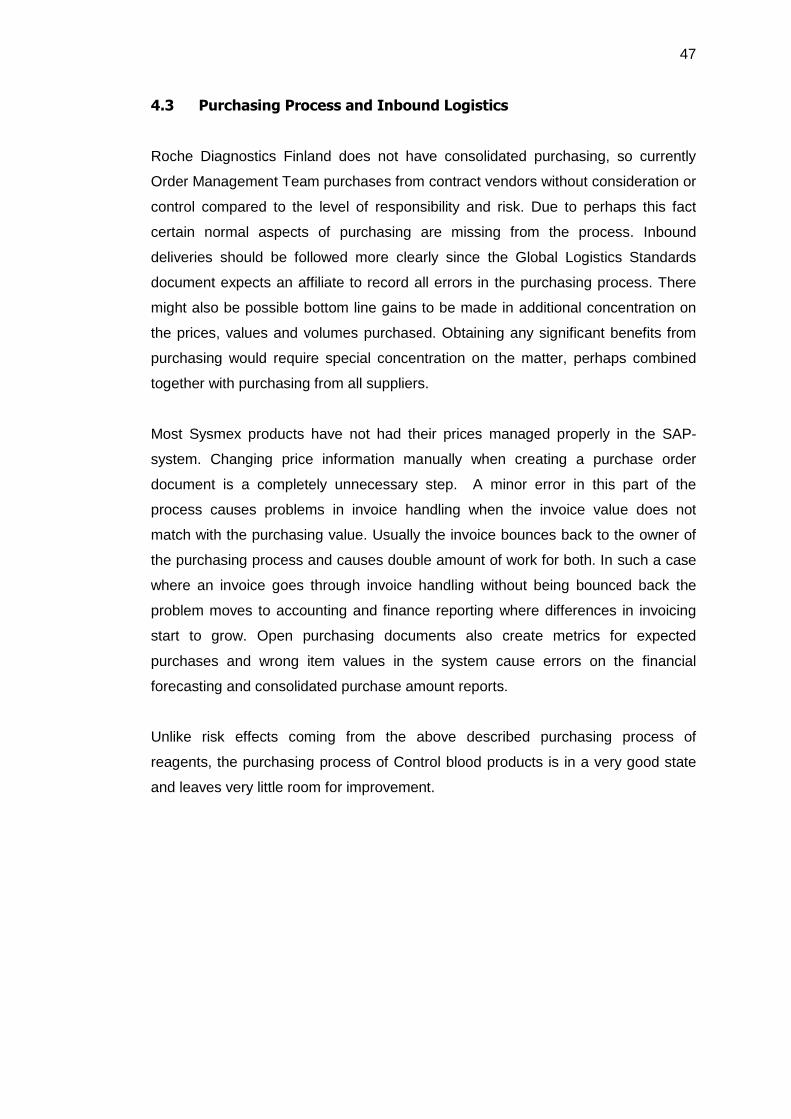
47
4.3 Purchasing Process and Inbound Logistics
Roche Diagnostics Finland does not have consolidated purchasing, so currently
Order Management Team purchases from contract vendors without consideration or
control compared to the level of responsibility and risk. Due to perhaps this fact
certain normal aspects of purchasing are missing from the process. Inbound
deliveries should be followed more clearly since the Global Logistics Standards
document expects an affiliate to record all errors in the purchasing process. There
might also be possible bottom line gains to be made in additional concentration on
the prices, values and volumes purchased. Obtaining any significant benefits from
purchasing would require special concentration on the matter, perhaps combined
together with purchasing from all suppliers.
Most Sysmex products have not had their prices managed properly in the SAP-
system. Changing price information manually when creating a purchase order
document is a completely unnecessary step. A minor error in this part of the
process causes problems in invoice handling when the invoice value does not
match with the purchasing value. Usually the invoice bounces back to the owner of
the purchasing process and causes double amount of work for both. In such a case
where an invoice goes through invoice handling without being bounced back the
problem moves to accounting and finance reporting where differences in invoicing
start to grow. Open purchasing documents also create metrics for expected
purchases and wrong item values in the system cause errors on the financial
forecasting and consolidated purchase amount reports.
Unlike risk effects coming from the above described purchasing process of
reagents, the purchasing process of Control blood products is in a very good state
and leaves very little room for improvement.
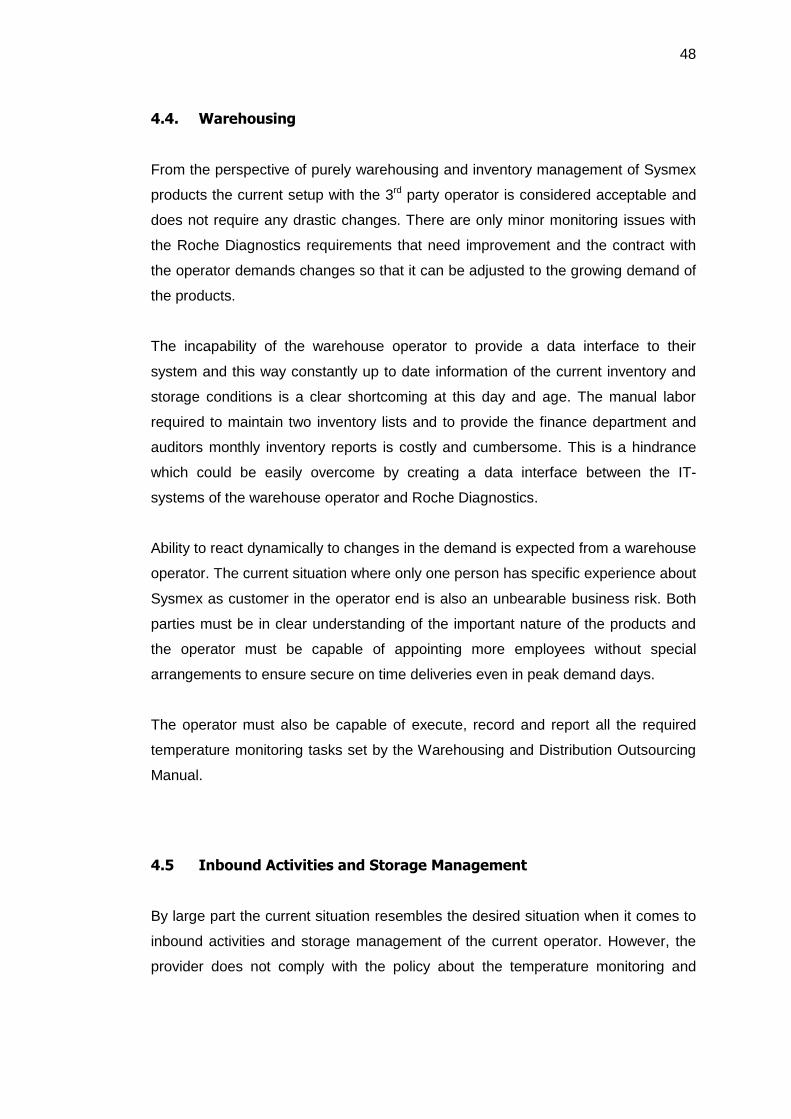
48
4.4. Warehousing
From the perspective of purely warehousing and inventory management of Sysmex
products the current setup with the 3rd party operator is considered acceptable and
does not require any drastic changes. There are only minor monitoring issues with
the Roche Diagnostics requirements that need improvement and the contract with
the operator demands changes so that it can be adjusted to the growing demand of
the products.
The incapability of the warehouse operator to provide a data interface to their
system and this way constantly up to date information of the current inventory and
storage conditions is a clear shortcoming at this day and age. The manual labor
required to maintain two inventory lists and to provide the finance department and
auditors monthly inventory reports is costly and cumbersome. This is a hindrance
which could be easily overcome by creating a data interface between the IT-
systems of the warehouse operator and Roche Diagnostics.
Ability to react dynamically to changes in the demand is expected from a warehouse
operator. The current situation where only one person has specific experience about
Sysmex as customer in the operator end is also an unbearable business risk. Both
parties must be in clear understanding of the important nature of the products and
the operator must be capable of appointing more employees without special
arrangements to ensure secure on time deliveries even in peak demand days.
The operator must also be capable of execute, record and report all the required
temperature monitoring tasks set by the Warehousing and Distribution Outsourcing
Manual.
4.5 Inbound Activities and Storage Management
By large part the current situation resembles the desired situation when it comes to
inbound activities and storage management of the current operator. However, the
provider does not comply with the policy about the temperature monitoring and
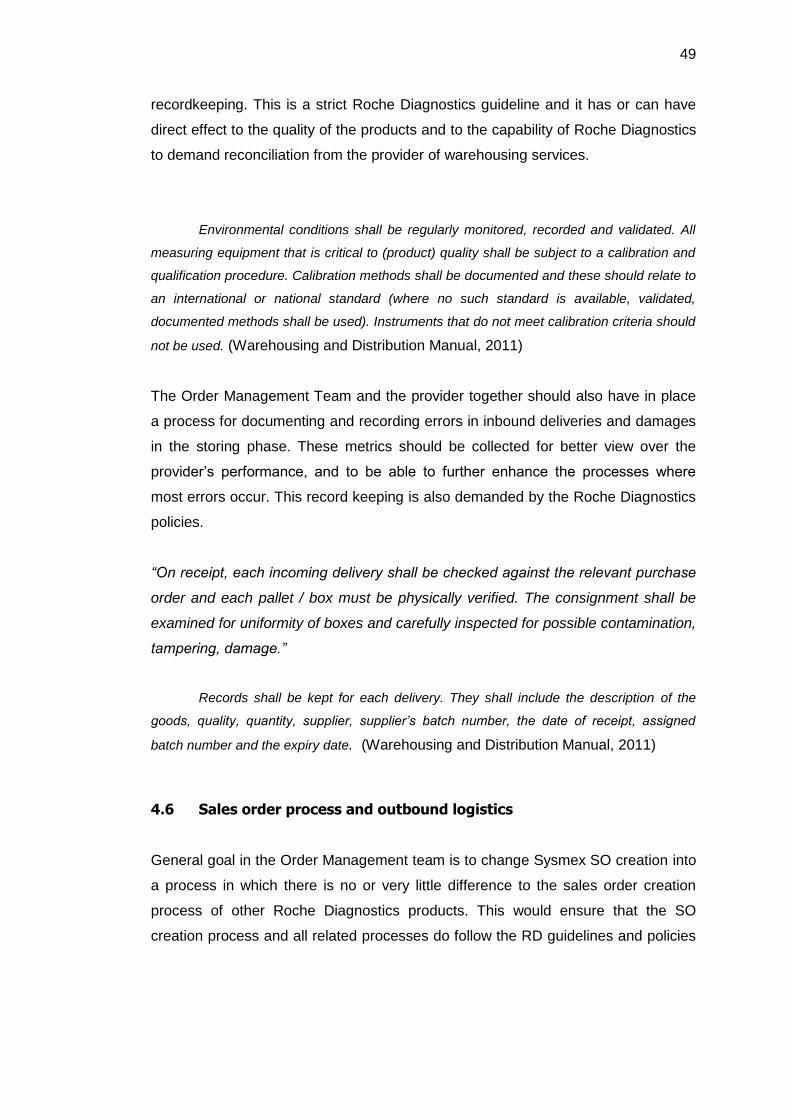
49
recordkeeping. This is a strict Roche Diagnostics guideline and it has or can have
direct effect to the quality of the products and to the capability of Roche Diagnostics
to demand reconciliation from the provider of warehousing services.
Environmental conditions shall be regularly monitored, recorded and validated. All
measuring equipment that is critical to (product) quality shall be subject to a calibration and
qualification procedure. Calibration methods shall be documented and these should relate to
an international or national standard (where no such standard is available, validated,
documented methods shall be used). Instruments that do not meet calibration criteria should
not be used. (Warehousing and Distribution Manual, 2011)
The Order Management Team and the provider together should also have in place
a process for documenting and recording errors in inbound deliveries and damages
in the storing phase. These metrics should be collected for better view over the
provider’s performance, and to be able to further enhance the processes where
most errors occur. This record keeping is also demanded by the Roche Diagnostics
policies.
“On receipt, each incoming delivery shall be checked against the relevant purchase
order and each pallet / box must be physically verified. The consignment shall be
examined for uniformity of boxes and carefully inspected for possible contamination,
tampering, damage.”
Records shall be kept for each delivery. They shall include the description of the
goods, quality, quantity, supplier, supplier’s batch number, the date of receipt, assigned
batch number and the expiry date. (Warehousing and Distribution Manual, 2011)
4.6 Sales order process and outbound logistics
General goal in the Order Management team is to change Sysmex SO creation into
a process in which there is no or very little difference to the sales order creation
process of other Roche Diagnostics products. This would ensure that the SO
creation process and all related processes do follow the RD guidelines and policies

50
and when less specific knowledge is needed it allows the Order Management team
to take more dynamically responsibility of Sysmex orders.
4.6.1 Standing Orders
The predictability of standing order system is a strength that cannot be ignored.
Currently the predictability is not necessarily used to its full capacity. Mainly the
reason is that they’re done by many individuals separately, this has resulted to a
situation where standing order delivery dates pile up to certain, albeit logical, dates
such as the beginning or the end of the month. It is the whole Order Management
Team’s desire to message to the Key Account Managers the situation on the
standing order timetable, so that it could be used as the basis to change the delivery
dates of some of the standing orders in order to reduce congestion at key dates.
The predictability of standing orders could also be tied up to the forecasting
procedure and with the Purchasing Proposal Master-file. Even with customer’s
ability and right to change the standing order quantities at their whim, the average
consumption of the standing orders could be used as foundation for forecasting.
As is the nature of documents managed in several places, especially on paper,
some of the standing order templates stored in the binders are helplessly outdated.
Customer and product identification relies only on the standing order template and if
the document is outdated or unclear, the ability for anyone in the team to take the
responsibility of them is jeopardized.
4.6.2 Sales order creation process
The source of information for SO creation is no different than with other Roche
Diagnostics products. The key element that makes SO creation with Sysmex
reagent products to require special knowledge is that there are small steps which
have to be taken when entering the product lines in the orders. Managing these
products in the SAP system would remove the barrier for the whole Order
Management team to create SO’s for Sysmex. In the desired process state the
steps of item category selection, warehouse selection, availability and batch
selection should not exist.
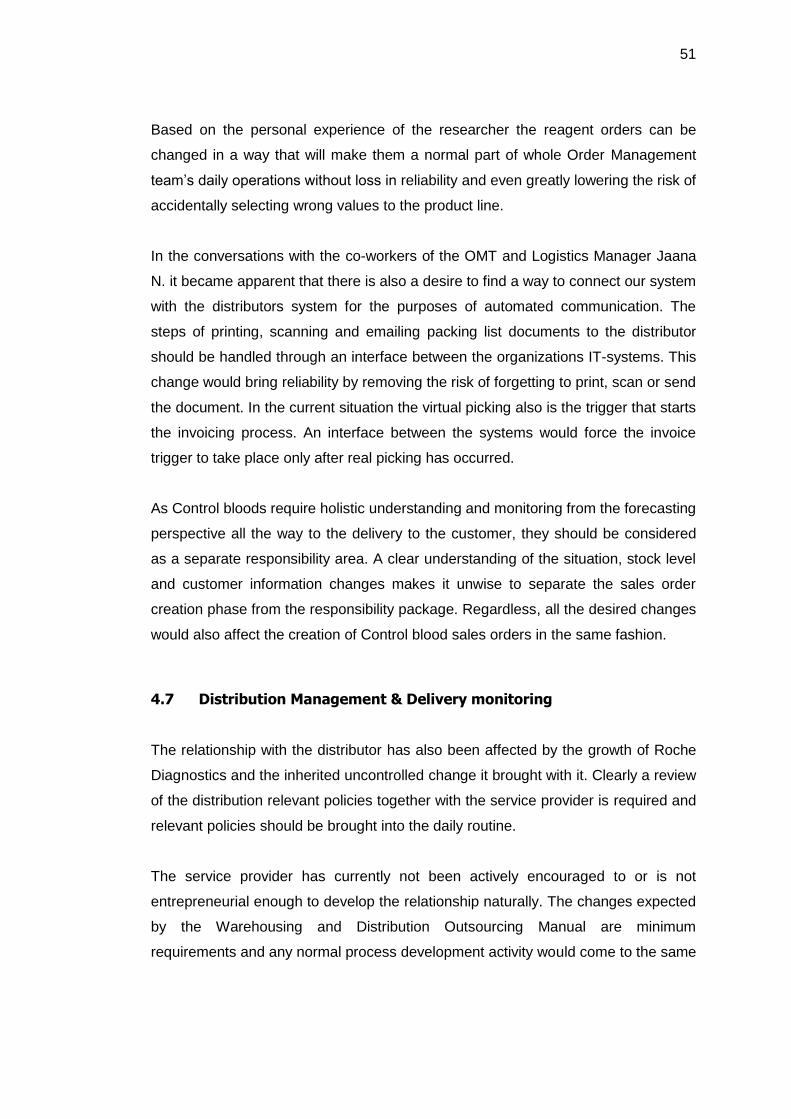
51
Based on the personal experience of the researcher the reagent orders can be
changed in a way that will make them a normal part of whole Order Management
team’s daily operations without loss in reliability and even greatly lowering the risk of
accidentally selecting wrong values to the product line.
In the conversations with the co-workers of the OMT and Logistics Manager Jaana
N. it became apparent that there is also a desire to find a way to connect our system
with the distributors system for the purposes of automated communication. The
steps of printing, scanning and emailing packing list documents to the distributor
should be handled through an interface between the organizations IT-systems. This
change would bring reliability by removing the risk of forgetting to print, scan or send
the document. In the current situation the virtual picking also is the trigger that starts
the invoicing process. An interface between the systems would force the invoice
trigger to take place only after real picking has occurred.
As Control bloods require holistic understanding and monitoring from the forecasting
perspective all the way to the delivery to the customer, they should be considered
as a separate responsibility area. A clear understanding of the situation, stock level
and customer information changes makes it unwise to separate the sales order
creation phase from the responsibility package. Regardless, all the desired changes
would also affect the creation of Control blood sales orders in the same fashion.
4.7 Distribution Management & Delivery monitoring
The relationship with the distributor has also been affected by the growth of Roche
Diagnostics and the inherited uncontrolled change it brought with it. Clearly a review
of the distribution relevant policies together with the service provider is required and
relevant policies should be brought into the daily routine.
The service provider has currently not been actively encouraged to or is not
entrepreneurial enough to develop the relationship naturally. The changes expected
by the Warehousing and Distribution Outsourcing Manual are minimum
requirements and any normal process development activity would come to the same

52
conclusions that those requirements should be established at their first opportunity.
There are also no other desired changes to the distribution from the Roche
Diagnostics behalf, as following the minimum policy requirement would solve vast
majority of the existing problems that occur in the deliveries.
In discussion with the Logistics Manager Jaana N. about the quality of current
distribution system she described several improvement ideas. Currently Roche
Diagnostics delivers goods to a HUSLAB Meilahti at approximately 2,4 times a day,
or 12 times a week. There would be obvious benefits of lowering that number to at
least the level of once a day by grouping together deliveries. Jaana N. and the rest
of the Order Management Team would also like to lower the current delivery times
by redesigning supply chain for big or important customers. There is also pressure
of looking into cheaper and more standardized way to manage special deliveries. It
came apparent that these development plans are secondary and will not be
addressed before full policy compliance has been achieved with the distributor.
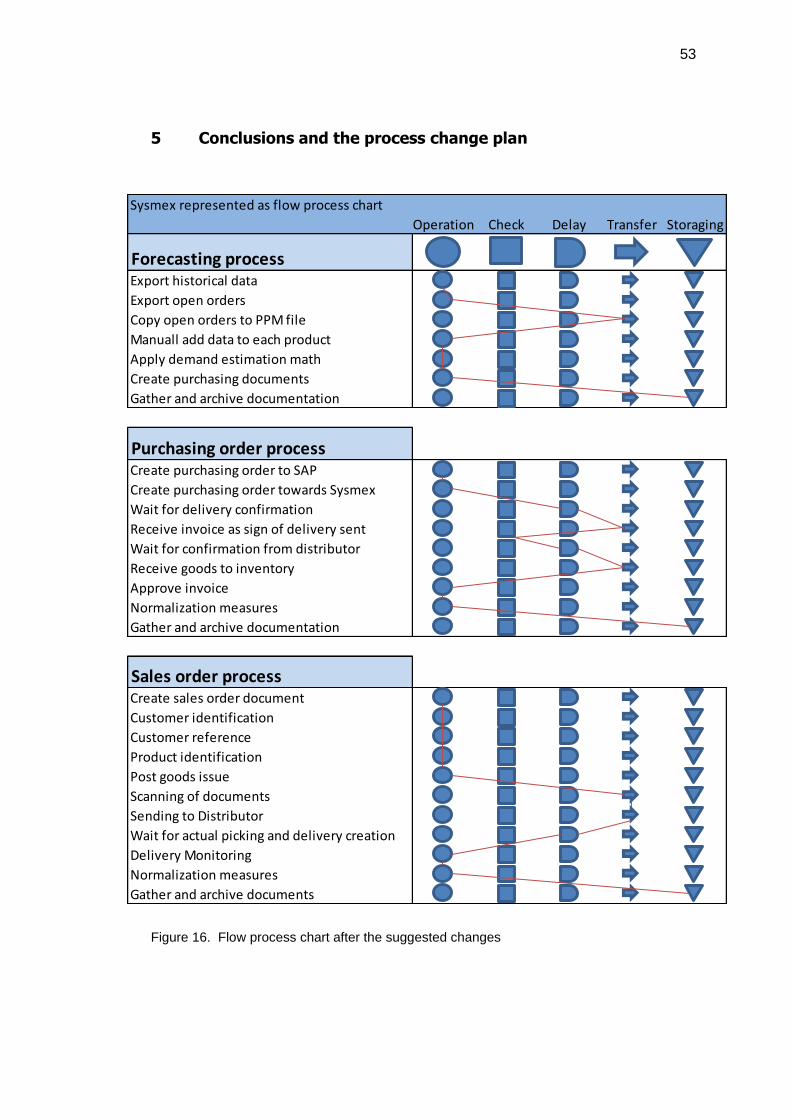
53
5 Conclusions and the process change plan
Figure 16. Flow process chart after the suggested changes
Sysmex represented as flow process chart
Operation Check Delay Transfer Storaging
Forecasting processExport historical data
Export open orders
Copy open orders to PPM file
Manuall add data to each product
Apply demand estimation math
Create purchasing documents
Gather and archive documentation
Purchasing order processCreate purchasing order to SAP
Create purchasing order towards Sysmex
Wait for delivery confirmation
Receive invoice as sign of delivery sent
Wait for confirmation from distributor
Receive goods to inventory
Approve invoice
Normalization measures
Gather and archive documentation
Sales order processCreate sales order document
Customer identification
Customer reference
Product identification
Post goods issue
Scanning of documents
Sending to Distributor
Wait for actual picking and delivery creation
Delivery Monitoring
Normalization measures
Gather and archive documents
54
Figure 16 describes the flow process chart after the suggested (and feasible)
changes to the current processes. The forecasting process can be shortened by
four steps when the updates to the Purchasing Proposal Master file are done and
the approval of the Key Account Manager is removed. It can be seen that the
forecasting process is heavily concentrated on operations that add value to the
output of the process. If a way to export open orders directly to the PPM-file without
doing it product by product is invented then this part of the process concentrates
only to its outcome and becomes very streamlined. Additionally to the qualitative
changes to the forecasting process the outcome is reliable regardless of who
conducts the process.
The purchasing order creation process would lose only one of the steps, which is
the price check of each product before receiving the goods to inventory. Removing
this step also directly affects the reliability of the output of the process and removes
the risk of ending up correcting the same errors multiple times in other departments.
Six steps could be removed from the sales order creation process changing the
process to resemble the sales order processes of Roche’s other product groups and
thus achieving one of the main goals of this thesis. The approximately 50% speed
increase in creation of these sales documents is also considered as direct
improvement in the work efficiency of the team.
Adding all the metrics, reporting and recording changes throughout the process
brings the processes of Sysmex dealership a long way closer to comply with the
company policy standards. These metrics will also have direct use in the further
development of the dealership relationship and delivery accuracy. Completion of
the planned changes would allow Sysmex dealership a controlled growth again for
years to come. Unfortunately the IT-Systems of the distributor are at least for now
not up to date to support those parts of the development that rely on modern IT.
The suggested changes to the different processes are described in more detail in
the following chapters.

55
5.1 Product Management
Conducting all these changes will change Sysmex products from being special
products to being similar with majority of the other products when looked at from the
perspective of the sales order creation process.
All Sysmex products should have their price information checked and updated to the
latest price. This removes the error in valuation of currently open purchasing
orders. Updated prices remove the need for repetitive work of changing the prices
when creating new purchasing orders. Correct prices checked in the system lower
the risk that price check is forgotten in the process before accepting and before
inbound delivery. This has in turn directly caused more work to the finance
department in the form of mismatch between invoice and purchasing order value.
This change also reduces the values added into the price differential account in
bookkeeping and removes the wrong values shown by open purchase orders.
Updating prices will bring the product management of Sysmex products into
accordance with the Global Supply Chain Standards policy.
All Sysmex products which are missing their weight and other product information
should have their information updated. This removes repetitive work in sales order
creation process and lowers the need of special product knowledge.
Sysmex products should have their default item category set to the most commonly
used item category instead of a default value. This removes repetitive work in the
sales order creation process and lowers the need of special product knowledge. It
also removes the risk of order being stuck in the SAP system due to faulty
processing without correct item category value and saves time when all item
category relevant issues are being handled.
Sysmex products should have their default warehouse value set to the most
common value instead of none or simply wrong value. This removes extra step in
sales and purchase order creation process and reduces the risk of order being stuck
in the SAP due to incorrect saving without the information about the source
warehouse.
56
5.2 Forecasting
Purchasing Proposal Master-file should be completely recreated. The new file
should aim to be able to create purchasing proposal which can be trusted as such to
create a purchase order, even without presence of experienced user. It should be
able to understand exports from information source systems and directly convert
this into relevant information. The math in the PPM-file should be rewritten so that it
takes into consideration the rolling past 12 months, yearly average, and estimates
next 3 months seasonal changes as established multipliers. The current stock
needs to be reduced in importance in the math to avoid the inherited risk of
choosing a wrong date in stock take. Minimum stock level and shelf life’s effect on
order quantity should be added to the math. It is important to resolve with the
supplier if minimum order quantity and efficient delivery quantity has an effect to the
delivery costs.
The step of sending the PPM-file to the KAM for approval can be considered
unnecessary due to the fact that the knowledge, control and responsibility for the
stock levels and maintaining the PPM-file is on the Order Management Team. There
is usually a delay in waiting for the approval that can be a day or longer if the Key
Account Manager is not available to accept the suggestion. Based on the OMT’s
experience and documented mistakes from the past, it can be seen that the
approval step does not always increase reliability of the purchase order proposal.
57
5.3 Purchasing Process and Inbound Logistics
The changes in the product information will remove the repetitive work in the
creation process of purchase orders. Changes to the forecasting document
described in the chapter 5.2 will give a reliable information source on what grounds
to create the document even without prior knowledge of the dealership. Purchasing
order creation process is also the only Sysmex process that has a manual for it.
Inbound delivery related errors in the delivery process should be documented at
agreed consolidated location together with distribution performance monitoring. This
provides information to supplier performance analysis and makes purchasing
process comply with the Global Logistics Standards.
Metrics that should be followed in the purchasing process are:
- Delivery time, duration in days
- Damages in inbound delivery, quantity and value
- Fault rates, values
- Picking errors, quantity over period
5.4 Warehousing & the warehouse operator
Development of the interface between the IT-systems used by Roche and the
warehouse operator is strongly suggested. Currently the distributor does not use a
system capable for this, so no process change plan can be made for this.
Temperature monitoring demanded by the Roche policies must be set to place at
the distributor’s refrigerators. This process change ties closely with the suggested
change of temperature monitoring during the outbound deliveries. The instrument
used for this should be certified as is expected by the policy and it should be
capable of producing graphical reports of the temperatures. The records of the
installed instruments should be gathered together with all other distributor
performance metrics in calendar month basis.
58
The possible business risk of the distributor also having only one employee with
product specific and customer (Roche) specific knowledge should be addressed in
the next meeting with the distributor. This reveals possible need for further
documentation of the process expected from the distributor. It would be crucial also
to both parties to recognize the importance of the products for the greater good and
to create measures to avoid situations in which the distributor’s workforce is not able
to deliver all orders at peak demand dates.
5.5 Sales order process and outbound logistics
5.5.1 Standing Orders
A collective meeting is suggested between the Order Management Team and the
Key Account Managers on the topic of congestion on the agreed standing order
delivery dates. Even if it is not really a change into the Sysmex or Order
Management Team process, the effect from the process in which Key Account
Managers create the standing order delivery dates has a direct effect on the quality
of service that the Order Management can maintain. As many standing order
customers are located at or nearly in the same physical location, this suggestion
relates to tightly to the problems noted in distribution management, where one
customer location is visited many times a day.
An update to all standing order template documents managed in the binder would
improve the dynamic nature of the Sysmex dealership. A standard template with all
relevant information for successful customer and product identification would
remove the barrier for anyone in the team to handle these orders. As currently all
Roche’s standing orders are managed the same way, a standardized template
could also be used as foundation to update all of them.
5.5.2 Sales order creation process
Process changes suggested in the chapter 4.1 about Product Management would
effectively remove the repetition loop with item category selection and warehouse
default. Availability check and batch selection is done in practice together with
59
expiration date check. These are possible to automate by modifying the SO creation
transaction in the SAP system. A script should be created which inquires existing
batch values in the warehouse location stated on the sales order and which, if set to
correct default, will return available batch. Then the script looks if this batch fulfills
set requirements for expiration date. A more detailed guide to how to create this
script can be found in SAP SD Analyst Sweta Jain’s guide “Automatic Batch
Determination Based on Shelf Life”
In the interview with the distributor’s representative A. Virtanen it came apparent
that the warehouse management systems in use in their organization are not
capable of creating a direct interface between the systems of Roche Diagnostics.
An alternative suggestion from the Order Management team was that the virtual
picking would be automated with a script that would simply always “pick fully” and
that the same script would deliver the packing list directly to the distributor’s printers,
while also retaining a copy in the local office for archiving and monitoring purposes.
This change suggestion is left out from the Change Control document (Appendix 1)
due to the other ongoing projects that might suggest that any effort would be
deemed waste of time. The suggested changes would however greatly affect the
efficiency of creating Control blood sales order documents as the repetitive work is
brought to minimum and the most time taking tasks are automated.
Creating a normal sales order document with 10 products took the researcher in
210 test runs an average of 2 minutes and 45 seconds. This number contained all
originally existing phases of creating a single sales order and it would be
significantly more if done during phone call with a customer.
Over 20 simulations with suggested changes took the researcher on average 1
minute and 25 seconds, effectively shortening the time spent on one cycle by 49%.
For two product sales order the values were 1 minute and 45 seconds and 55
seconds. Every month the largest Control blood delivery totals to 94 sales orders,
two product rows per order on average, in total 2 hours 44 minutes of continuous
order punching at maximum rate. With the suggested changes this task would be
reduced to 86 minutes or 47% less working time.

60
5.6 Distribution Management & Delivery Monitoring
If we consider how the IT-interface development handles the problem with
confirming completed dispatches and bringing the traceability of the supply chain up
to par with the policy expectations, a total of three other sections of improvement
can be named for distribution management. These are temperature monitoring of
deliveries, picking and packing procedure documentation and establishing delivery
performance reporting process.
In all other Roche Diagnostics deliveries temperature recording devices are placed
into the packages at spot checks and the records of the devices are consolidated at
one location. Together with recorded events of temperature related issues in the
deliveries the data from the recording devices gives an overall image of the status of
temperature control of the service provider. These recording devices and the
process of managing them exist already in the organization, so this improvement is
at its simplest just applying the existing procedure to the Sysmex product category.
This would have the benefit of not confusing the customer with a new process for
temperature monitoring, as they are already used to the process with other
products. This process change ties closely with the warehouse temperature control
and the locations of the documentation should be consolidated together with that
process change.
The service provider has already agreed on inheriting the quality requirements that
Roche Diagnostics demands from itself and on maintaining those requirements at
its own subsidiaries. As a concrete improvement to implement this document that
defines the rules of picking, packing and delivery should be created. This document
would define the requirements of different products, establish the way packing and
delivery requirements are marked on the deliveries and what is generally expected
to maintain the quality of the products through the delivery process. When both
parties are agreeing and aware of this document it becomes easy to define at what
point a deviation from the expected has happened and when it should be recorded.
Topic 3.5, of the Global Supply Chain Standards for Affiliates describes the delivery
performance report currently in use for all Roche’s own products. By adopting this

61
report to the basis for performance reporting of Sysmex products, the distributor and
the OMT will make sure that all policies are followed. The document states that
monitoring should be collected in a consolidated location at calendar month basis
and from the following (relevant) indicators:
- % On Time in Full Delivery (Committed vs. Actual Delivered)
- Claim rate
- Number of special deliveries
- Backorder products as quantity of product shortages over period
From the Warehousing and Distribution Outsourcing Manual it can be derived also
that deviations and damages should be recorded in greater detail, including brief
description of the event and determination of the cause, quality impact and possible
corrective and/or preventive actions. From the practical point of view the researched
would like to suggest of adding all relevant document numbers that refer to the
case. Collecting this information to fulfill the reporting requirement means additional
work to the daily routine with all other relevant actions and adds time needed at the
end of the agreed period cycle for consolidating the information.
As these cases are very often brought up by a customer complaint, the customer
complaint should be recorded as suggested in the Quality Management Policy
document and in internal guidelines.
62
6 Summary
Creating this thesis has taught me the difference of noticing an error in a process, or
lack in its efficiency, and how to take a step back and systematically challenge the
whole process. Only this way you see the larger picture, how the minor points
interact in it and how ultimately changing the small points can and will actually turn
into large valuable change. Conducting this research has brought me quicker and
deeper to the Sysmex dealership contract than would in any other way been
possible and I have managed to turn the results of the research into additional value
for Roche Diagnostics Oy. In the future I will use same systematic challenging and
process mapping tools to analyze any new larger process tree I meet, to understand
it on a deeper level and to find if parts of it could be improved.
I feel that the goals of this thesis has been met, however I could have done more
research with the policy compliance and quality requirements. Applying theory also
proved to be significantly harder than expected, mostly due to the limited scope,
nature of the process and depth of the analysis in it. I believe that without
researching the whole process tree from start to end and collecting all the small
changes into one controlled change project, most of these changes would have
never been made.

63
7 References
Hoffmann-La Roche Ltd. (2011). Global Supply Chain Standards Basel: Hoffmann-
La Roche Ltd.
Hoffmann-La Roche Ltd. (2011). Warehousing and Distribution Outsourcing
Manual. Basel: Hoffmann-La Roche Ltd.
Joe Tidd, et al. (2005). Managing Innovation: Integrating Technological, Market and
Organizational Change. 3rd ed. West Sussex: John Wiley.
Maquire, LK 2012, 'The Staying Power of Process Improvement', Internal Auditor,
69, 3, pp. 55-58, MasterFILE Elite, EBSCOhost, viewed 4 January 2013.
Nigel Slack, "The Importance-Performance Matrix as a Determinant of Improvement
Priority", Int. J. of operations and production Management, Vol. 14, No. 5, pp 59-75,
1994.
Nigel Slack et al. (2001). Operations Management. 3nd ed. Edinburgh: Pearson
Education Limited.
Nigel Slack et al. (2009). Operations and Process Management. 2nd ed. Edinburgh:
Pearson Education Limited. (p143)
Ravi Anupindi et al. (2004). Management Business Process Flows, Principles of
Operations Management. New Jearsey: Pearson Education Limited.
Roche Diagnostics Oy (2009), Market_Finland_TN.ppt, PowerPoint presentation,
Roche Diagnostics Oy, Espoo
Sue Conger (2011). Process Mapping and Management. US: Business Experts.
p33-35.
64
Terry Hill (2005). Operations Management. London: Palgrave MacMillan.
Data Education. (2012). History of Flowchart. Available: http://data-e-
education.com/E016_History_of_Flowchart.html
Last accessed 30th September 2012.
Hoffmann-La Roche Ltd. (2012). Annual Report 2011. Available:
http://www.roche.com/gb11e.pdf Last accessed 30th September 2012.
Hoffmann-La Roche Ltd. (2012). Sysmex and Roche renew successful alliance in
the hematology business. Available:
http://www.roche.com/media/media_releases/med_dia_cb_2012-04-13.htm Last
accessed 30th September 2012.
Sysmex Corporation (2012). Annual Report 2011.
Available: http://www.sysmex.co.jp/file.jsp?id=30795
Last accessed 30th September 2012.
Sweta Jain. (2010). Automatic Batch Detection Based on Shelf Life.
Available:
http://www.sdn.sap.com/irj/scn/go/portal/prtroot/docs/library/uuid/f0caed4a-40f9-
2c10-349a-96ec617a8161?QuickLink=index&overridelayout=true.
Last accessed 30th September 2012.
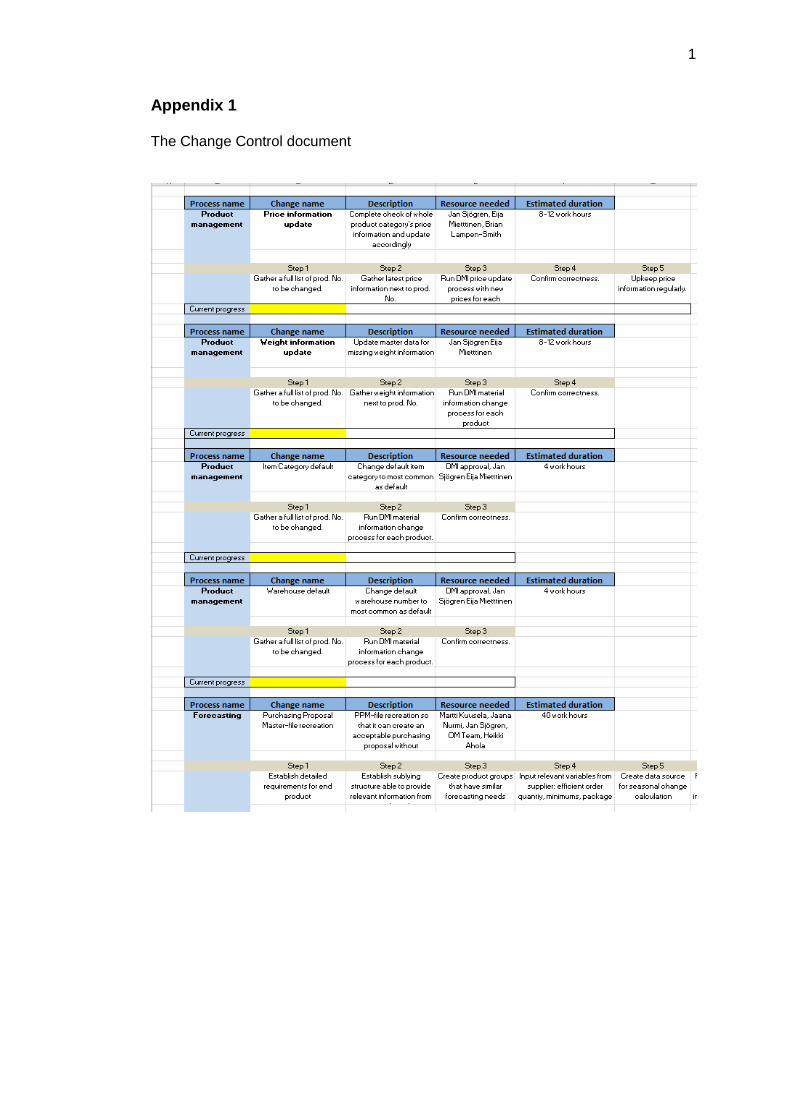
1
Appendix 1 The Change Control document
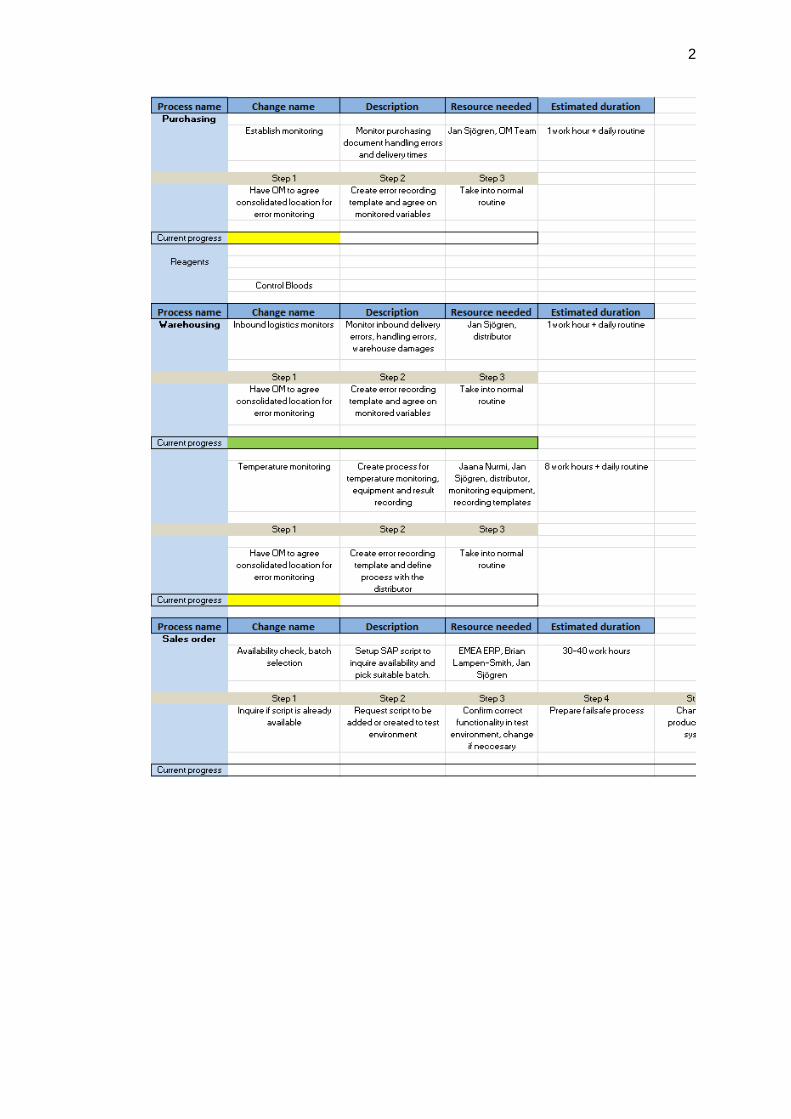
2
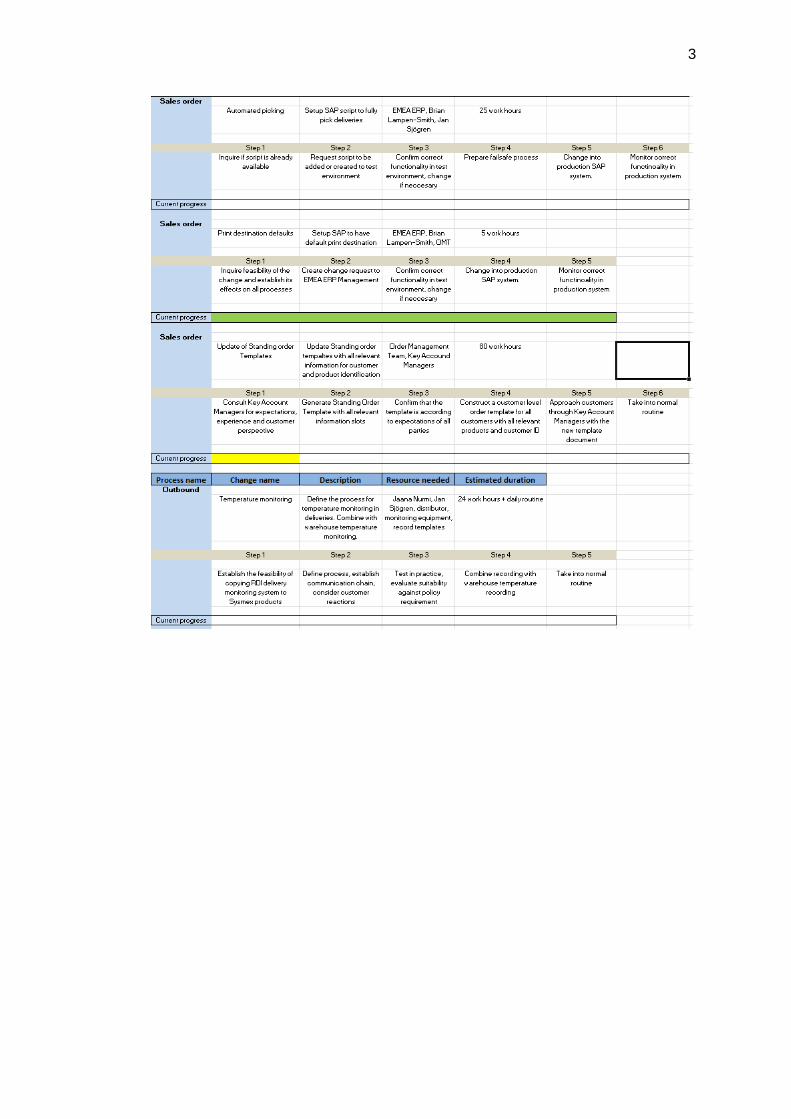
3
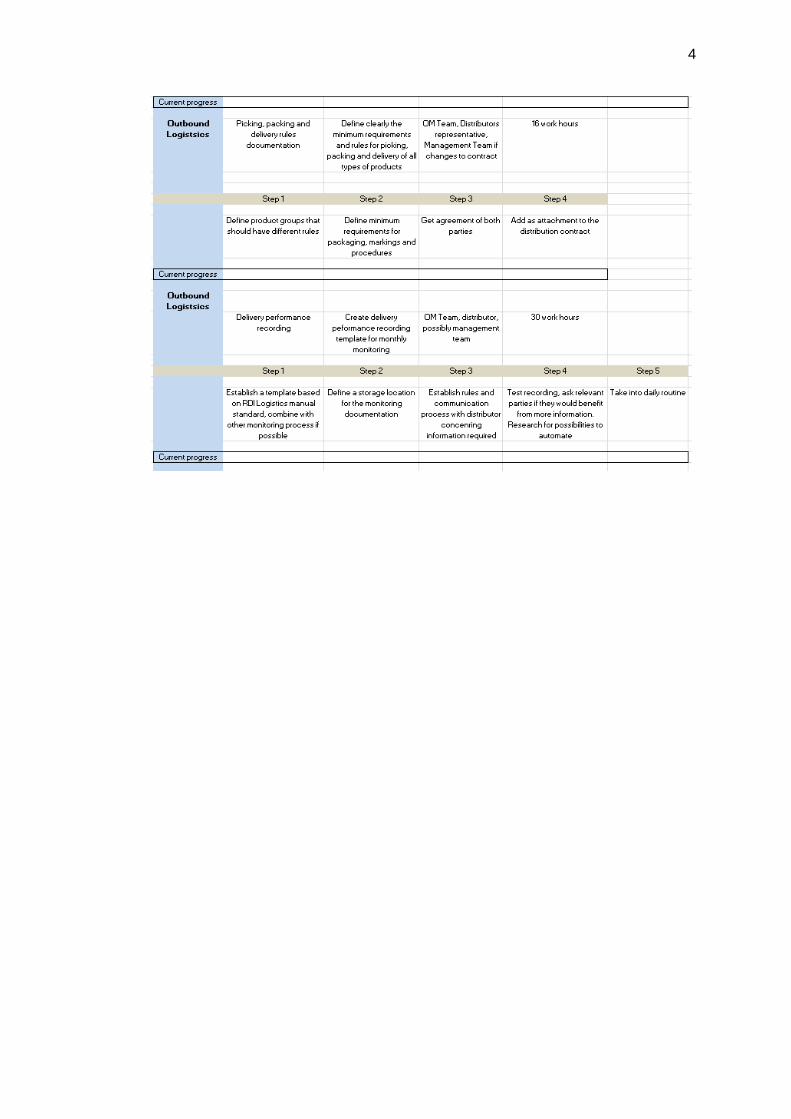
4