Jan Seymour Scout Festa WolfsonDesign Karin...
55
Transcript of Jan Seymour Scout Festa WolfsonDesign Karin...


Exports and imports by Member States of the EU/third countries - Current prices [namq_exi_c]
Last update ##Extracted on ##Source of data Eurostat
Exports of goods and servicesS_ADJ Seasonally adjusted and adjusted data by working daysUNIT Percentage of GDPINDIC_NA
EXPORTAÇÕES DE BENS E SERVIÇOS POR PAÍSEm percentagem do Produto Interno Bruto
trimestre
País 1 2 3 4 1 2 3 4 1 2 3 4 1 2 3 4 1 2 3 4 1 2 3 4 1 2 3 4 1 2 3 4 1 2 3 4 1 2 3 4 1 2 3 4 1 2 3 4 1 2 3 4 1 2 3 4 1 2França 27.7 28.6 29.1 29.8 29.5 28.5 28.4 27.3 27.5 27.9 27.6 27.1 26.5 25.7 25.7 26.0 25.9 26.0 26.1 26.3 25.9 26.1 26.5 26.8 27.2 27.3 26.7 26.9 26.8 27.0 26.9 26.8 27.7 27.4 27.3 25.7 23.9 23.8 23.8 23.9 24.9 25.6 25.9 26.4 27.1 27.5 27.5 27.9 27.7 27.8 27.9 27.8 27.7 28.2 28.0 28.2 28.1 28.1
Itália 26.1 26.1 27.5 27.7 27.2 27.6 26.6 26.0 25.6 25.5 25.4 25.4 24.9 24.1 24.2 24.7 24.6 25.1 25.4 25.2 25.3 25.7 26.2 26.4 27.0 27.5 27.6 28.8 28.8 28.8 28.8 29.0 29.6 28.8 28.5 26.8 23.5 23.2 23.8 24.2 25.0 26.2 26.9 27.8 28.4 28.7 29.1 29.4 30.0 30.0 30.5 30.5 30.1 30.3 30.5 30.7 30.5 30.6
Espanha 28.0 28.9 29.2 30.0 29.5 28.7 28.5 27.5 27.4 27.6 27.2 27.2 26.9 26.3 26.1 26.0 26.1 26.0 25.7 26.0 25.1 26.1 25.7 25.8 26.3 26.2 26.0 26.7 27.0 26.7 27.5 26.4 26.7 27.0 27.4 24.9 23.0 23.6 24.5 24.7 25.6 27.2 27.9 28.7 30.3 30.4 31.3 31.4 31.4 31.6 33.5 34.1 32.7 34.8 34.4 34.6 34.2 34.7
Reino Unido 26.0 27.2 27.2 28.7 28.6 27.6 25.9 25.7 25.7 26.6 26.2 25.0 26.3 25.4 25.2 25.1 24.7 24.8 25.3 26.0 25.3 26.2 27.0 27.9 30.3 31.5 26.9 26.3 26.2 26.7 26.8 26.9 27.6 30.0 30.3 29.7 28.5 27.9 28.1 29.0 29.1 30.5 30.0 30.9 32.5 31.5 31.7 32.6 31.9 31.5 32.1 31.6 31.2 31.8 30.4 : : :
Portugal 28.6 28.2 29.0 29.9 29.0 28.5 27.4 27.4 27.2 27.7 27.7 27.7 28.1 27.2 27.6 27.6 27.8 28.4 27.8 28.2 26.9 27.4 28.1 28.3 29.8 30.7 31.5 31.7 31.9 32.1 32.4 32.4 33.4 33.1 33.2 30.1 26.8 27.4 28.7 29.2 29.4 31.0 32.0 32.8 33.7 35.5 36.3 37.1 38.0 38.6 39.0 39.1 39.8 41.2 40.9 : : :
Grécia 23.5 24.8 24.9 26.3 25.5 24.7 22.9 23.1 20.8 21.6 21.5 20.4 20.0 20.0 19.7 20.3 21.9 22.3 22.4 22.8 22.4 21.8 23.0 22.6 22.5 22.8 22.5 22.1 21.8 22.1 22.9 23.7 23.9 23.7 23.1 23.0 99.6 98.3 91.8 93.9 91.2 20.3 20.7 23.3 21.8 31.0 32.0 32.8 33.7 35.5 36.3 37.1 40.0 40.0 39.0 39.1 39.8 :
Roménia 29.8 31.5 34.1 35.6 34.8 33.9 34.2 30.9 32.7 35.1 37.4 36.9 35.5 34.5 35.5 35.0 36.3 37.1 37.0 34.8 33.0 33.2 34.1 33.2 33.5 33.2 32.5 31.5 30.8 29.2 28.6 30.3 30.8 32.2 30.7 29.2 29.6 29.8 31.9 31.3 30.1 34.9 36.7 39.3 39.4 38.8 40.5 41.3 39.2 40.0 39.9 41.4 40.1 41.5 43.2 : : :
Finlândia 41.7 42.8 44.9 44.9 42.9 41.4 40.5 41.3 40.0 40.8 40.8 40.6 39.4 39.5 38.5 37.5 40.4 38.8 40.0 40.4 41.4 40.5 42.5 42.7 44.5 46.2 45.2 46.2 44.8 46.3 47.2 45.1 47.1 49.2 47.2 43.9 37.2 36.4 35.5 40.5 35.8 40.4 40.6 44.5 41.9 40.5 40.6 41.0 40.9 40.8 40.5 40.2 40.0 39.1 39.3 39.1 38.0 :
Noruega 44.1 45.6 47.3 48.7 47.4 46.3 45.8 43.3 41.7 42.6 40.4 40.1 40.1 40.3 39.4 41.9 41.8 41.7 42.1 41.8 42.5 43.8 44.7 45.2 46.0 45.3 45.3 45.0 43.9 44.0 43.8 45.0 46.0 48.3 47.0 45.4 40.1 39.2 40.3 40.6 40.3 40.3 40.0 41.4 41.7 41.6 42.6 42.0 42.1 41.6 40.2 39.8 38.0 38.9 39.5 39.2 38.8 37.2
Croácia 40.9 41.3 40.6 41.1 42.7 42.4 42.6 42.2 40.6 40.4 40.3 39.7 41.1 41.3 43.0 42.1 42.9 42.4 42.8 42.5 41.3 41.9 42.6 42.4 42.8 42.0 42.5 44.3 42.1 42.7 42.2 43.1 40.4 42.8 43.2 42.6 36.8 36.0 38.2 36.8 39.3 39.6 39.2 41.8 41.9 43.2 42.5 42.9 43.4 43.2 43.7 44.9 42.3 43.6 44.1 43.4 45.0 :
Chipre 55.1 55.9 57.2 56.1 57.1 58.0 55.9 54.9 53.6 52.7 50.6 48.0 47.0 46.5 48.6 48.0 48.9 49.1 47.9 47.6 47.1 47.6 48.8 50.8 49.5 47.6 47.8 47.6 48.5 48.0 48.0 48.3 47.3 46.7 45.3 44.1 42.2 40.7 40.5 40.0 41.3 41.1 42.1 43.3 43.6 43.4 43.4 43.8 44.1 44.2 43.0 42.7 43.8 45.1 46.2 : : :
Polónia 25.6 27.3 26.9 27.9 27.7 26.2 27.2 26.9 26.4 28.3 29.2 30.2 31.1 32.2 34.4 36.3 36.8 38.2 37.3 37.3 36.0 37.0 37.3 38.3 39.4 40.2 40.8 41.2 41.1 40.7 41.0 41.1 40.6 40.5 39.9 39.0 39.5 39.1 39.2 40.3 40.3 42.3 42.8 43.2 44.1 44.5 45.6 46.4 46.7 46.7 46.5 46.9 46.8 47.7 48.3 48.3 48.4 48.6
Suécia 44.8 45.7 47.0 48.6 47.3 46.1 46.2 45.9 45.9 45.2 43.5 43.2 44.0 43.9 43.0 43.6 44.6 46.7 45.8 46.3 46.1 47.7 49.4 49.9 51.0 50.6 50.6 52.2 51.2 51.8 52.1 52.6 55.0 53.7 53.3 52.0 49.3 47.3 47.8 47.5 47.8 49.5 50.0 50.0 49.7 49.5 50.4 49.4 49.6 49.4 48.0 47.3 46.0 45.8 45.9 45.8 46.2 46.3
Alemanha 31.6 32.6 33.5 35.9 34.8 35.0 34.6 35.1 34.8 35.8 35.9 36.5 35.7 35.3 35.8 36.3 37.1 39.0 38.5 39.0 39.8 40.8 41.7 42.6 43.8 44.9 45.5 47.9 46.4 47.1 47.4 48.2 48.5 48.6 48.8 46.5 42.4 41.4 42.3 43.5 44.9 47.5 48.2 49.3 50.3 50.2 50.8 50.8 51.6 52.3 52.3 51.4 50.6 51.0 50.4 51.2 50.6 :
Suiça 44.1 44.8 46.3 46.5 46.6 45.4 43.9 42.7 43.1 43.6 43.5 42.9 41.8 42.4 43.3 44.2 44.8 44.7 45.1 45.5 45.8 47.5 48.0 49.0 49.9 49.7 50.8 52.7 53.6 54.5 54.8 54.6 54.6 55.1 55.3 52.1 49.5 49.3 51.3 51.3 51.5 52.4 51.5 51.6 52.0 51.5 50.4 51.1 51.9 51.7 52.6 53.0 52.4 52.1 51.9 : : :
Dinamarca 43.1 45.1 48.3 49.5 49.0 48.1 46.1 45.7 47.3 47.6 46.6 47.4 46.2 45.0 45.4 44.8 44.5 46.1 45.4 45.3 46.5 48.8 50.1 50.4 52.1 51.2 51.9 53.0 52.3 51.7 52.1 52.7 54.3 56.1 55.4 53.0 48.5 47.3 47.2 47.5 49.1 50.4 51.1 51.2 54.1 53.0 53.5 54.1 54.8 55.5 54.7 54.2 55.0 54.9 54.8 54.8 54.9 54.1
Islândia 31.7 32.8 34.7 34.9 38.4 37.0 39.6 40.0 40.7 38.5 35.2 35.4 35.5 33.3 34.2 34.1 34.0 33.8 34.7 33.9 32.1 34.9 29.5 30.5 29.9 35.4 32.2 31.4 37.0 32.6 29.6 39.5 36.2 47.8 43.4 49.0 50.1 49.5 56.2 55.3 55.6 57.3 55.4 57.2 55.5 59.0 61.2 60.4 57.0 61.6 59.4 59.7 57.4 56.1 58.7 : : :
Áustria 44.5 45.7 46.9 47.9 48.2 48.2 48.1 48.1 48.5 48.6 48.4 48.4 48.3 47.5 48.1 49.1 50.1 51.1 51.6 52.2 53.0 53.5 54.1 54.6 55.5 56.1 57.0 57.8 58.3 58.7 59.2 59.9 60.3 59.8 58.9 55.9 51.9 49.7 49.7 50.6 52.4 54.0 54.8 55.4 56.7 56.9 57.5 57.7 57.3 57.3 57.6 57.4 57.3 57.3 57.5 57.6 57.6 57.6
Letónia 42.3 41.9 41.7 42.7 44.7 43.1 41.4 40.7 41.3 41.9 42.3 40.7 42.4 42.6 42.3 42.3 40.9 43.4 45.2 47.1 48.3 48.9 48.3 48.6 47.3 46.3 44.7 43.4 44.5 42.4 41.6 42.2 42.3 42.5 44.6 42.4 40.4 41.1 45.6 48.9 48.9 52.6 55.9 57.1 58.8 59.4 59.2 59.4 60.1 60.6 62.6 63.0 61.3 59.8 58.5 60.0 59.9 :
Bulgária 49.0 48.5 48.8 54.2 51.4 48.2 47.6 45.1 46.2 46.9 47.6 46.0 50.4 48.2 47.9 45.7 48.9 50.3 52.6 52.4 37.5 40.0 42.3 38.8 60.8 62.6 59.4 59.7 56.1 60.0 58.0 60.4 62.6 62.1 56.5 50.4 46.2 43.7 47.6 50.3 51.1 55.5 59.5 58.6 65.9 62.8 63.5 69.8 65.2 66.5 63.7 68.1 70.3 68.4 68.1 71.1 69.3 69.0
Eslovénia 51.1 53.3 54.4 56.4 56.5 55.7 55.3 53.6 54.8 55.6 55.6 54.8 53.7 53.4 54.0 54.3 55.4 57.4 58.9 59.0 59.2 60.9 63.7 64.5 65.1 65.9 66.6 68.7 69.7 69.9 70.2 68.8 70.7 69.5 68.1 64.0 58.1 58.2 59.1 61.1 62.9 65.7 68.2 68.9 71.4 72.5 73.3 74.5 74.4 76.1 77.0 78.2 78.6 77.7 78.3 78.6 79.0 :
Lituânia 42.9 42.9 46.3 45.3 48.8 51.1 50.7 48.6 51.3 53.7 51.1 54.2 54.1 48.2 49.7 51.8 47.2 50.2 52.3 55.0 55.7 54.1 57.0 62.9 60.5 61.5 57.0 57.8 54.2 55.8 55.2 51.0 56.8 62.0 62.6 54.5 51.8 51.3 55.9 58.7 59.8 66.5 69.4 74.4 76.6 77.8 77.8 77.8 75.7 79.1 87.3 91.4 91.8 84.2 85.4 87.8 81.1 82.9
Rep. Checa 57.7 59.8 61.6 64.7 64.8 62.4 62.3 61.3 60.6 57.4 55.4 57.3 59.7 57.7 58.3 60.6 57.8 65.6 64.7 62.9 60.8 63.7 66.1 66.7 67.4 65.9 66.3 68.6 67.7 68.1 68.4 68.9 67.8 66.5 62.7 60.5 57.9 57.8 59.3 61.1 62.8 65.8 68.1 69.3 72.4 71.9 72.9 74.0 79.0 77.4 78.8 76.9 77.3 78.3 79.1 79.6 86.3 84.5
Bélgica 75.3 77.4 79.2 80.4 79.8 78.3 77.1 76.2 77.0 77.4 76.7 75.8 75.0 73.8 73.0 74.0 73.7 75.8 76.3 77.9 77.9 78.3 78.6 79.8 80.8 80.8 80.9 80.5 81.2 82.2 83.3 83.4 84.5 87.1 87.6 78.4 72.7 72.7 74.2 75.2 76.8 79.2 81.0 82.1 84.9 85.2 85.7 84.0 85.7 86.3 86.9 85.7 84.4 85.8 86.7 86.5 84.6 86.5
Holanda 67.0 69.0 70.6 73.3 69.5 68.0 66.6 64.7 64.2 64.2 63.9 64.0 64.6 61.7 62.3 63.1 63.7 65.8 67.6 68.6 68.4 68.9 70.1 70.9 72.2 72.7 72.8 73.3 73.1 73.8 74.1 75.5 77.3 77.2 77.9 72.6 67.4 66.8 68.9 71.1 75.6 78.1 79.8 81.2 82.4 83.3 84.3 85.2 86.4 88.0 88.6 89.0 88.4 88.5 88.2 87.8 88.2 :
Estónia 81.7 82.2 85.8 87.9 91.0 83.6 72.3 73.2 70.2 72.9 70.3 70.2 66.8 68.9 70.1 70.7 71.4 72.6 74.6 73.4 76.6 75.8 78.4 79.6 73.6 74.9 72.9 69.7 68.0 68.5 65.1 66.8 70.4 69.9 72.5 71.3 61.1 61.8 65.7 66.9 68.5 74.9 79.7 86.3 84.7 85.4 91.2 87.6 91.8 88.6 90.5 89.8 89.8 90.0 86.1 85.1 86.4 86.7
Eslováquia 67.2 69.1 71.2 73.9 74.6 72.8 72.8 70.8 68.7 71.0 73.3 71.3 73.9 73.9 78.0 77.4 73.4 78.8 73.0 73.1 72.9 75.1 77.0 79.7 81.1 81.5 87.1 87.8 87.9 85.5 86.3 87.7 90.0 85.6 82.7 75.6 68.0 68.0 70.9 75.3 75.3 78.8 80.6 86.6 91.6 88.4 87.4 90.8 96.1 95.9 97.3 97.1 96.6 98.4 96.0 99.5 99.5 96.0
Hungria 70.6 72.9 74.4 79.3 76.2 72.1 69.2 68.9 65.1 66.1 61.7 58.8 59.8 59.5 62.4 62.5 63.9 62.9 62.8 63.8 63.5 66.7 65.6 67.5 73.7 75.9 78.5 80.8 79.2 79.4 82.3 82.3 85.1 82.5 79.9 78.8 77.1 76.7 77.1 77.9 78.2 83.8 88.3 88.4 90.5 88.0 90.1 96.2 97.1 96.5 93.2 91.1 94.7 95.4 96.6 95.6 96.4 96.8
Malta 90.2 89.0 90.5 85.2 84.6 79.8 76.2 77.0 77.3 80.2 81.6 81.9 78.6 77.1 78.7 75.8 77.9 77.8 75.9 74.4 74.1 73.7 75.2 77.4 84.5 85.1 89.5 94.5 89.4 94.9 92.2 92.7 95.1 89.7 89.9 90.3 80.3 82.1 83.5 83.4 86.1 91.1 93.1 91.7 94.9 96.7 94.9 102.0 99.7 104.2 100.7 99.6 98.3 91.8 93.9 91.2 90.4 89.2
Irelanda 92.2 95.7 99.2 102.4 102.7 100.1 98.4 97.4 101.1 97.8 91.4 85.5 84.2 82.6 83.9 82.5 84.8 84.0 83.6 81.4 80.6 80.6 82.5 81.6 79.4 80.1 78.6 78.8 79.0 79.8 82.4 80.4 81.3 82.3 82.9 87.2 89.5 90.3 89.8 91.6 94.4 98.5 102.1 104.9 102.0 101.7 103.1 104.2 106.5 106.8 109.2 108.9 104.1 109.8 106.7 : : :
Luxemburgo 147.2 150.4 151.4 151.2 148.8 151.3 146.9 140.0 146.3 142.4 138.9 135.3 134.9 133.6 138.5 141.1 150.1 151.4 151.7 156.1 149.9 151.5 156.9 164.5 167.7 171.3 169.0 171.4 172.6 174.5 176.3 180.0 184.1 189.1 185.1 168.7 159.1 156.6 160.6 171.3 166.2 172.3 169.5 175.0 178.9 181.2 177.9 175.7 176.8 176.9 178.5 177.2 174.2 175.0 174.0 179.7 175.3 :
5.0 <10 15.0 25.0 35.0 45.0 55.0 65.0 75.0 85.0 105.0
Fonte: Eurostat
20052000 2001 2002 2003 2004
60-70 70-80
2006 2007 2008 2009
10-20 20-30 30-40 40-50 50-60 80-90 >90
2012 2013 2014210 2011
18.5 18.9 19.3 19 19.6
33.2 30.1 26.8
29.6 29.8 31.9 31.3 30.1
18.5 18.9 19.3 19 19.6
30.3 29.7
33.2 30.1 26.8 27.4
18.5 18.9
26.8
18.5 18.9
26.8
JORGE CAMÕES
DATA AT WORK
Best practices for creating e�ective charts and
information graphics in Microsoft® Excel®
www.newriders.com

DATA AT WORKBest practices for creating effective charts and information graphics in Microsoft® Excel®Jorge Camões
New RidersFind us on the Web at www.newriders.comNew Riders is an imprint of Peachpit, a division of Pearson Education.To report errors, please send a note to [email protected]
Copyright © 2016 by Jorge Camões
Acquisitions Editor: Nikki Echler McDonaldProduction Editor: Kim WimpsettDevelopment Editor: Dan FosterCopy Editor: Jan SeymourProofreader: Scout Festa Compositor: WolfsonDesignIndexer: Karin ArrigoniCover and Interior Designer: Mimi Heft
NOTICE OF RIGHTS
All rights reserved. No part of this book may be reproduced or transmitted in any form by any means, electronic, mechanical, photocopying, recording, or otherwise, without the prior written permission of the publisher. For information on getting permission for reprints and excerpts, contact [email protected].
NOTICE OF LIABILITY
The information in this book is distributed on an “As Is” basis without warranty. While every precaution has been taken in the preparation of the book, neither the author nor Peachpit shall have any liability to any person or entity with respect to any loss or damage caused or alleged to be caused directly or indirectly by the instructions contained in this book or by the computer software and hardware products described in it.
TRADEMARKS
Many of the designations used by manufacturers and sellers to distinguish their products are claimed as trademarks. Where those designations appear in this book, and Peachpit was aware of a trademark claim, the designations appear as requested by the owner of the trademark. All other product names and services identified throughout this book are used in editorial fashion only and for the benefit of such companies with no intention of infringement of the trademark. No such use, or the use of any trade name, is intended to convey endorsement or other affiliation with this book.
ISBN 13: 9780134268637ISBN 10: 0134268636
9 8 7 6 5 4 3 2 1
Printed and bound in the United States of America

To my family

AcknowledgmentsI’d like to first thank Alberto Cairo. In non-English speaking countries, there are a few oases when it comes to publishing original data visualization books, but the landscape is basically a barren desert. I wanted to help change that, so I wrote the first manuscript of this book in my mother tongue, Portuguese. I then asked Alberto if he would read it.
Not only can Alberto read Portuguese, but we also share a similar view of what we think data visualization is all about, in spite of working in different areas. To make a long story short, he liked the book and introduced me to his acquisitions editor, Nikki McDonald, and so my data visualization journey took a turn. With the help of Nikki, my development editor Dan Foster, copy editor Jan Seymour, and production editor Kim Wimpse�, my poor manuscript became a real book. Alberto read several chapters of the English version and provided invaluable feedback.
Stephen Few also read a few chapters and saved me from myself once or twice, for which I am very appreciative.
If I know how to make a few charts that you can’t find in the Excel charts library, that’s because I learned it from, or was inspired by, Jon Peltier, the true Excel charts master. I’m deeply grateful to Jon for all the knowledge and generosity he shared with the community for well over 10 years.
Andreas Lipphardt’s untimely death was the saddest moment along my data visu-alization journey. I wrote a few posts for his company’s blog, and we talked o�en about working together in the future. I still wonder what would have happened if we had.
Finally, I thank my family. When I was more interested in writing this book than actually make a living, Teresa and the kids were very patient and supportive.
DATA AT WORKiv

About the AuthorJorge Camões studied statistics and information management and has been consulting businesses on how to effectively use information visualizations since 2010, with clients in the top 25 pharma companies and major retailers. Prior to starting his consulting business, Camões worked for 10 years in the business intelligence department of the Portuguese subsidiary of Merck & Co. Camões runs the popular data visualization blog Excelcharts.com. He works from his home in Lisbon, Portugal.
v

Contents
Introduction xiv
1 The Building Blocks of Data Visualization 1Spatial Organization of Stimuli . . . . . . . . . . . . . . . . . . . . . . . . . . . . . . . . . . . . . . . . . . . . . . . . . . . . . . 4Seeing Abstract Concepts . . . . . . . . . . . . . . . . . . . . . . . . . . . . . . . . . . . . . . . . . . . . . . . . . . . . . . . . . . . . . 6
Charts . . . . . . . . . . . . . . . . . . . . . . . . . . . . . . . . . . . . . . . . . . . . . . . . . . . . . . . . . . . . . . . . . . . . . . . . . . . . . . . . . .7Networks . . . . . . . . . . . . . . . . . . . . . . . . . . . . . . . . . . . . . . . . . . . . . . . . . . . . . . . . . . . . . . . . . . . . . . . . . . . . . .9Maps . . . . . . . . . . . . . . . . . . . . . . . . . . . . . . . . . . . . . . . . . . . . . . . . . . . . . . . . . . . . . . . . . . . . . . . . . . . . . . . . . 10Volume: Figurative Visualizations . . . . . . . . . . . . . . . . . . . . . . . . . . . . . . . . . . . . . . . . . . . . . . . . . 11Visualization in Excel . . . . . . . . . . . . . . . . . . . . . . . . . . . . . . . . . . . . . . . . . . . . . . . . . . . . . . . . . . . . . . .12
Retinal Variables . . . . . . . . . . . . . . . . . . . . . . . . . . . . . . . . . . . . . . . . . . . . . . . . . . . . . . . . . . . . . . . . . . . . . . . 12From Concepts to Charts . . . . . . . . . . . . . . . . . . . . . . . . . . . . . . . . . . . . . . . . . . . . . . . . . . . . . . . . . . . . . 16�e Proto-Chart . . . . . . . . . . . . . . . . . . . . . . . . . . . . . . . . . . . . . . . . . . . . . . . . . . . . . . . . . . . . . . . . . . . . . . . . 17Chart Effectiveness . . . . . . . . . . . . . . . . . . . . . . . . . . . . . . . . . . . . . . . . . . . . . . . . . . . . . . . . . . . . . . . . . . . . 18Takeaways . . . . . . . . . . . . . . . . . . . . . . . . . . . . . . . . . . . . . . . . . . . . . . . . . . . . . . . . . . . . . . . . . . . . . . . . . . . . . . . 23
2 Visual Perception 24Perception and Cognition . . . . . . . . . . . . . . . . . . . . . . . . . . . . . . . . . . . . . . . . . . . . . . . . . . . . . . . . . . . . 25
Cognitive Offloading . . . . . . . . . . . . . . . . . . . . . . . . . . . . . . . . . . . . . . . . . . . . . . . . . . . . . . . . . . . . . . . . 26A False Dichotomy . . . . . . . . . . . . . . . . . . . . . . . . . . . . . . . . . . . . . . . . . . . . . . . . . . . . . . . . . . . . . . . . . . 27Charts and Tables . . . . . . . . . . . . . . . . . . . . . . . . . . . . . . . . . . . . . . . . . . . . . . . . . . . . . . . . . . . . . . . . . . . 27
Eye Physiology . . . . . . . . . . . . . . . . . . . . . . . . . . . . . . . . . . . . . . . . . . . . . . . . . . . . . . . . . . . . . . . . . . . . . . . . . . 29�e Retina . . . . . . . . . . . . . . . . . . . . . . . . . . . . . . . . . . . . . . . . . . . . . . . . . . . . . . . . . . . . . . . . . . . . . . . . . . . . 29Cones . . . . . . . . . . . . . . . . . . . . . . . . . . . . . . . . . . . . . . . . . . . . . . . . . . . . . . . . . . . . . . . . . . . . . . . . . . . . . . . . . 30�e Arc of Visual Acuity . . . . . . . . . . . . . . . . . . . . . . . . . . . . . . . . . . . . . . . . . . . . . . . . . . . . . . . . . . . . .31Saccades . . . . . . . . . . . . . . . . . . . . . . . . . . . . . . . . . . . . . . . . . . . . . . . . . . . . . . . . . . . . . . . . . . . . . . . . . . . . . 32Impact of Eye Physiology on Visualization . . . . . . . . . . . . . . . . . . . . . . . . . . . . . . . . . . . . . . . 34
Pre-A�entive Processing . . . . . . . . . . . . . . . . . . . . . . . . . . . . . . . . . . . . . . . . . . . . . . . . . . . . . . . . . . . . . 36Salience . . . . . . . . . . . . . . . . . . . . . . . . . . . . . . . . . . . . . . . . . . . . . . . . . . . . . . . . . . . . . . . . . . . . . . . . . . . . . . 36Impact of Pre-A�entive Processing and Salience on Visualization . . . . . . . . . . . . 37
Working Memory . . . . . . . . . . . . . . . . . . . . . . . . . . . . . . . . . . . . . . . . . . . . . . . . . . . . . . . . . . . . . . . . . . . . . .40Impact of Working Memory on Visualization . . . . . . . . . . . . . . . . . . . . . . . . . . . . . . . . . . . . .41
Gestalt Laws . . . . . . . . . . . . . . . . . . . . . . . . . . . . . . . . . . . . . . . . . . . . . . . . . . . . . . . . . . . . . . . . . . . . . . . . . . . . . 43Law of Proximity . . . . . . . . . . . . . . . . . . . . . . . . . . . . . . . . . . . . . . . . . . . . . . . . . . . . . . . . . . . . . . . . . . . . 47Law of Similarity . . . . . . . . . . . . . . . . . . . . . . . . . . . . . . . . . . . . . . . . . . . . . . . . . . . . . . . . . . . . . . . . . . . . 47
DATA AT WORKvi

Law of Segregation . . . . . . . . . . . . . . . . . . . . . . . . . . . . . . . . . . . . . . . . . . . . . . . . . . . . . . . . . . . . . . . . . 48Law of Connectivity . . . . . . . . . . . . . . . . . . . . . . . . . . . . . . . . . . . . . . . . . . . . . . . . . . . . . . . . . . . . . . . . 48Law of Common Fate . . . . . . . . . . . . . . . . . . . . . . . . . . . . . . . . . . . . . . . . . . . . . . . . . . . . . . . . . . . . . . . 49Law of Closure . . . . . . . . . . . . . . . . . . . . . . . . . . . . . . . . . . . . . . . . . . . . . . . . . . . . . . . . . . . . . . . . . . . . . . 50Law of Figure/Ground . . . . . . . . . . . . . . . . . . . . . . . . . . . . . . . . . . . . . . . . . . . . . . . . . . . . . . . . . . . . . . 50Law of Continuity . . . . . . . . . . . . . . . . . . . . . . . . . . . . . . . . . . . . . . . . . . . . . . . . . . . . . . . . . . . . . . . . . . . . 51Impact of Gestalt Laws on Visualization . . . . . . . . . . . . . . . . . . . . . . . . . . . . . . . . . . . . . . . . . . 52
�e Limits of Perception . . . . . . . . . . . . . . . . . . . . . . . . . . . . . . . . . . . . . . . . . . . . . . . . . . . . . . . . . . . . . . 53Why We Need Grid Lines and Reference Lines: Weber’s Law . . . . . . . . . . . . . . . . . . . .55Being Aware of Distortions: Stevens’ Power Law . . . . . . . . . . . . . . . . . . . . . . . . . . . . . . . . 56Context and Optical Illusions . . . . . . . . . . . . . . . . . . . . . . . . . . . . . . . . . . . . . . . . . . . . . . . . . . . . . . 58Impact of the Limits of Perception on Visualization . . . . . . . . . . . . . . . . . . . . . . . . . . . . . 59
Takeaways . . . . . . . . . . . . . . . . . . . . . . . . . . . . . . . . . . . . . . . . . . . . . . . . . . . . . . . . . . . . . . . . . . . . . . . . . . . . . . .60
3 Beyond Visual Perception 62Social Prägnanz . . . . . . . . . . . . . . . . . . . . . . . . . . . . . . . . . . . . . . . . . . . . . . . . . . . . . . . . . . . . . . . . . . . . . . . . 63Breaking the Rules . . . . . . . . . . . . . . . . . . . . . . . . . . . . . . . . . . . . . . . . . . . . . . . . . . . . . . . . . . . . . . . . . . . . . 64
�e Tragedy of the Commons . . . . . . . . . . . . . . . . . . . . . . . . . . . . . . . . . . . . . . . . . . . . . . . . . . . . . . 65Color Symbolism . . . . . . . . . . . . . . . . . . . . . . . . . . . . . . . . . . . . . . . . . . . . . . . . . . . . . . . . . . . . . . . . . . . . 68Representing Time . . . . . . . . . . . . . . . . . . . . . . . . . . . . . . . . . . . . . . . . . . . . . . . . . . . . . . . . . . . . . . . . . . 69Axis Folding . . . . . . . . . . . . . . . . . . . . . . . . . . . . . . . . . . . . . . . . . . . . . . . . . . . . . . . . . . . . . . . . . . . . . . . . . 69Don’t Make Me �ink! . . . . . . . . . . . . . . . . . . . . . . . . . . . . . . . . . . . . . . . . . . . . . . . . . . . . . . . . . . . . . . 70
Literacy and Experience . . . . . . . . . . . . . . . . . . . . . . . . . . . . . . . . . . . . . . . . . . . . . . . . . . . . . . . . . . . . . .71Graphic Literacy . . . . . . . . . . . . . . . . . . . . . . . . . . . . . . . . . . . . . . . . . . . . . . . . . . . . . . . . . . . . . . . . . . . . .71Familiarity with the Subject . . . . . . . . . . . . . . . . . . . . . . . . . . . . . . . . . . . . . . . . . . . . . . . . . . . . . . . 74Information Asymmetry . . . . . . . . . . . . . . . . . . . . . . . . . . . . . . . . . . . . . . . . . . . . . . . . . . . . . . . . . . . .75
Organizational Contexts . . . . . . . . . . . . . . . . . . . . . . . . . . . . . . . . . . . . . . . . . . . . . . . . . . . . . . . . . . . . . . 75Wrong Messages from the Top . . . . . . . . . . . . . . . . . . . . . . . . . . . . . . . . . . . . . . . . . . . . . . . . . . . . . 76Impression Management . . . . . . . . . . . . . . . . . . . . . . . . . . . . . . . . . . . . . . . . . . . . . . . . . . . . . . . . . . 77
Takeaways . . . . . . . . . . . . . . . . . . . . . . . . . . . . . . . . . . . . . . . . . . . . . . . . . . . . . . . . . . . . . . . . . . . . . . . . . . . . . . . 78
4 Data Preparation 79Problems with the Data . . . . . . . . . . . . . . . . . . . . . . . . . . . . . . . . . . . . . . . . . . . . . . . . . . . . . . . . . . . . . . .80
Structure without Content . . . . . . . . . . . . . . . . . . . . . . . . . . . . . . . . . . . . . . . . . . . . . . . . . . . . . . . . . 80Content without Structure . . . . . . . . . . . . . . . . . . . . . . . . . . . . . . . . . . . . . . . . . . . . . . . . . . . . . . . . . .81
What Does “Well-Structured Data” Mean, Anyway? . . . . . . . . . . . . . . . . . . . . . . . . . . . . 83A Helping Hand: Pivot Tables . . . . . . . . . . . . . . . . . . . . . . . . . . . . . . . . . . . . . . . . . . . . . . . . . . . . . . 84
Extracting the Data . . . . . . . . . . . . . . . . . . . . . . . . . . . . . . . . . . . . . . . . . . . . . . . . . . . . . . . . . . . . . . . . . . . . 86�e PDF Plague . . . . . . . . . . . . . . . . . . . . . . . . . . . . . . . . . . . . . . . . . . . . . . . . . . . . . . . . . . . . . . . . . . . . . . 88
“Can It Export to Excel?” . . . . . . . . . . . . . . . . . . . . . . . . . . . . . . . . . . . . . . . . . . . . . . . . . . . . . . . . . . . . 89
vii� CONTENTS

Cleansing Data . . . . . . . . . . . . . . . . . . . . . . . . . . . . . . . . . . . . . . . . . . . . . . . . . . . . . . . . . . . . . . . . . . . . . . . . . .90Transforming Data . . . . . . . . . . . . . . . . . . . . . . . . . . . . . . . . . . . . . . . . . . . . . . . . . . . . . . . . . . . . . . . . . . . .90Loading the Data Table . . . . . . . . . . . . . . . . . . . . . . . . . . . . . . . . . . . . . . . . . . . . . . . . . . . . . . . . . . . . . . . . 91Data Management in Excel. . . . . . . . . . . . . . . . . . . . . . . . . . . . . . . . . . . . . . . . . . . . . . . . . . . . . . . . . . . 91
Organizing the Workbook. . . . . . . . . . . . . . . . . . . . . . . . . . . . . . . . . . . . . . . . . . . . . . . . . . . . . . . . . . 93Links Outside of Excel . . . . . . . . . . . . . . . . . . . . . . . . . . . . . . . . . . . . . . . . . . . . . . . . . . . . . . . . . . . . . . 93Formulas . . . . . . . . . . . . . . . . . . . . . . . . . . . . . . . . . . . . . . . . . . . . . . . . . . . . . . . . . . . . . . . . . . . . . . . . . . . . . 93Cycles of Production and Analysis . . . . . . . . . . . . . . . . . . . . . . . . . . . . . . . . . . . . . . . . . . . . . . . . 94
Takeaways . . . . . . . . . . . . . . . . . . . . . . . . . . . . . . . . . . . . . . . . . . . . . . . . . . . . . . . . . . . . . . . . . . . . . . . . . . . . . . . 95
5 Data Visualization 96From Pa�erns to Points . . . . . . . . . . . . . . . . . . . . . . . . . . . . . . . . . . . . . . . . . . . . . . . . . . . . . . . . . . . . . . 97
Shape Visualization . . . . . . . . . . . . . . . . . . . . . . . . . . . . . . . . . . . . . . . . . . . . . . . . . . . . . . . . . . . . . . . . 99Point Visualization . . . . . . . . . . . . . . . . . . . . . . . . . . . . . . . . . . . . . . . . . . . . . . . . . . . . . . . . . . . . . . . . 103Outlier Visualization . . . . . . . . . . . . . . . . . . . . . . . . . . . . . . . . . . . . . . . . . . . . . . . . . . . . . . . . . . . . . . 104Data Visualization Tasks . . . . . . . . . . . . . . . . . . . . . . . . . . . . . . . . . . . . . . . . . . . . . . . . . . . . . . . . . . 106
�e Construction of Knowledge . . . . . . . . . . . . . . . . . . . . . . . . . . . . . . . . . . . . . . . . . . . . . . . . . . . .106Data . . . . . . . . . . . . . . . . . . . . . . . . . . . . . . . . . . . . . . . . . . . . . . . . . . . . . . . . . . . . . . . . . . . . . . . . . . . . . . . . . 107Information . . . . . . . . . . . . . . . . . . . . . . . . . . . . . . . . . . . . . . . . . . . . . . . . . . . . . . . . . . . . . . . . . . . . . . . . 108Knowledge . . . . . . . . . . . . . . . . . . . . . . . . . . . . . . . . . . . . . . . . . . . . . . . . . . . . . . . . . . . . . . . . . . . . . . . . . . 108Wisdom . . . . . . . . . . . . . . . . . . . . . . . . . . . . . . . . . . . . . . . . . . . . . . . . . . . . . . . . . . . . . . . . . . . . . . . . . . . . . 109
Defining Data Visualization . . . . . . . . . . . . . . . . . . . . . . . . . . . . . . . . . . . . . . . . . . . . . . . . . . . . . . . . 110Languages, Stories, and Landscapes . . . . . . . . . . . . . . . . . . . . . . . . . . . . . . . . . . . . . . . . . . . . . . . 111Graphical Literacy . . . . . . . . . . . . . . . . . . . . . . . . . . . . . . . . . . . . . . . . . . . . . . . . . . . . . . . . . . . . . . . . . . . . 112Graphical Landscapes . . . . . . . . . . . . . . . . . . . . . . . . . . . . . . . . . . . . . . . . . . . . . . . . . . . . . . . . . . . . . . . . 113
Profiling . . . . . . . . . . . . . . . . . . . . . . . . . . . . . . . . . . . . . . . . . . . . . . . . . . . . . . . . . . . . . . . . . . . . . . . . . . . . . 113Dashboards . . . . . . . . . . . . . . . . . . . . . . . . . . . . . . . . . . . . . . . . . . . . . . . . . . . . . . . . . . . . . . . . . . . . . . . . . .114Infographics . . . . . . . . . . . . . . . . . . . . . . . . . . . . . . . . . . . . . . . . . . . . . . . . . . . . . . . . . . . . . . . . . . . . . . . . .116
A Crossroad of Knowledge . . . . . . . . . . . . . . . . . . . . . . . . . . . . . . . . . . . . . . . . . . . . . . . . . . . . . . . . . .120Statistics . . . . . . . . . . . . . . . . . . . . . . . . . . . . . . . . . . . . . . . . . . . . . . . . . . . . . . . . . . . . . . . . . . . . . . . . . . . . 120Design . . . . . . . . . . . . . . . . . . . . . . . . . . . . . . . . . . . . . . . . . . . . . . . . . . . . . . . . . . . . . . . . . . . . . . . . . . . . . . . 120Applications . . . . . . . . . . . . . . . . . . . . . . . . . . . . . . . . . . . . . . . . . . . . . . . . . . . . . . . . . . . . . . . . . . . . . . . . 120Content and Context . . . . . . . . . . . . . . . . . . . . . . . . . . . . . . . . . . . . . . . . . . . . . . . . . . . . . . . . . . . . . . . .121
Data Visualization in Excel . . . . . . . . . . . . . . . . . . . . . . . . . . . . . . . . . . . . . . . . . . . . . . . . . . . . . . . . . 121�e Good . . . . . . . . . . . . . . . . . . . . . . . . . . . . . . . . . . . . . . . . . . . . . . . . . . . . . . . . . . . . . . . . . . . . . . . . . . . . 122�e Bad . . . . . . . . . . . . . . . . . . . . . . . . . . . . . . . . . . . . . . . . . . . . . . . . . . . . . . . . . . . . . . . . . . . . . . . . . . . . . . 122�e Ugly . . . . . . . . . . . . . . . . . . . . . . . . . . . . . . . . . . . . . . . . . . . . . . . . . . . . . . . . . . . . . . . . . . . . . . . . . . . . . 124Beyond the Excel Chart Library . . . . . . . . . . . . . . . . . . . . . . . . . . . . . . . . . . . . . . . . . . . . . . . . . . 125Don’t Make Excel Charts . . . . . . . . . . . . . . . . . . . . . . . . . . . . . . . . . . . . . . . . . . . . . . . . . . . . . . . . . . 128
Takeaways . . . . . . . . . . . . . . . . . . . . . . . . . . . . . . . . . . . . . . . . . . . . . . . . . . . . . . . . . . . . . . . . . . . . . . . . . . . . . . .131
DATA AT WORKviii

6 Data Discovery, Analysis, and Communication 132Where to Start? . . . . . . . . . . . . . . . . . . . . . . . . . . . . . . . . . . . . . . . . . . . . . . . . . . . . . . . . . . . . . . . . . . . . . . . . 133
�e Visual Information-Seeking Mantra . . . . . . . . . . . . . . . . . . . . . . . . . . . . . . . . . . . . . . . . 134Focus plus Context . . . . . . . . . . . . . . . . . . . . . . . . . . . . . . . . . . . . . . . . . . . . . . . . . . . . . . . . . . . . . . . . . .137
Asking Questions . . . . . . . . . . . . . . . . . . . . . . . . . . . . . . . . . . . . . . . . . . . . . . . . . . . . . . . . . . . . . . . . . . . . . . 138A Classification of Questions . . . . . . . . . . . . . . . . . . . . . . . . . . . . . . . . . . . . . . . . . . . . . . . . . . . . . . 139
Selecting and Collecting the Data . . . . . . . . . . . . . . . . . . . . . . . . . . . . . . . . . . . . . . . . . . . . . . . . . .140Searching for Pa�erns . . . . . . . . . . . . . . . . . . . . . . . . . . . . . . . . . . . . . . . . . . . . . . . . . . . . . . . . . . . . . . . 142Se�ing Priorities . . . . . . . . . . . . . . . . . . . . . . . . . . . . . . . . . . . . . . . . . . . . . . . . . . . . . . . . . . . . . . . . . . . . . . 147Reporting Results . . . . . . . . . . . . . . . . . . . . . . . . . . . . . . . . . . . . . . . . . . . . . . . . . . . . . . . . . . . . . . . . . . . . . 148
Clarification . . . . . . . . . . . . . . . . . . . . . . . . . . . . . . . . . . . . . . . . . . . . . . . . . . . . . . . . . . . . . . . . . . . . . . . . 148�e Human Dimension . . . . . . . . . . . . . . . . . . . . . . . . . . . . . . . . . . . . . . . . . . . . . . . . . . . . . . . . . . . . 149�e Design . . . . . . . . . . . . . . . . . . . . . . . . . . . . . . . . . . . . . . . . . . . . . . . . . . . . . . . . . . . . . . . . . . . . . . . . . . 150
Project: Monthly Births . . . . . . . . . . . . . . . . . . . . . . . . . . . . . . . . . . . . . . . . . . . . . . . . . . . . . . . . . . . . . . .151Defining the Problem . . . . . . . . . . . . . . . . . . . . . . . . . . . . . . . . . . . . . . . . . . . . . . . . . . . . . . . . . . . . . . . 151Collecting the Data . . . . . . . . . . . . . . . . . . . . . . . . . . . . . . . . . . . . . . . . . . . . . . . . . . . . . . . . . . . . . . . . . .152Assessing Data Availability . . . . . . . . . . . . . . . . . . . . . . . . . . . . . . . . . . . . . . . . . . . . . . . . . . . . . . . .152Assessing Data Quality . . . . . . . . . . . . . . . . . . . . . . . . . . . . . . . . . . . . . . . . . . . . . . . . . . . . . . . . . . . . 154Adjusting the Data . . . . . . . . . . . . . . . . . . . . . . . . . . . . . . . . . . . . . . . . . . . . . . . . . . . . . . . . . . . . . . . . . 154Exploring the Data . . . . . . . . . . . . . . . . . . . . . . . . . . . . . . . . . . . . . . . . . . . . . . . . . . . . . . . . . . . . . . . . . .155Embracing Seasonality . . . . . . . . . . . . . . . . . . . . . . . . . . . . . . . . . . . . . . . . . . . . . . . . . . . . . . . . . . . . 156Communicating Our Findings . . . . . . . . . . . . . . . . . . . . . . . . . . . . . . . . . . . . . . . . . . . . . . . . . . . . .161
Takeaways . . . . . . . . . . . . . . . . . . . . . . . . . . . . . . . . . . . . . . . . . . . . . . . . . . . . . . . . . . . . . . . . . . . . . . . . . . . . . . 162
7 How to Choose a Chart 163Task-Based Chart Classification . . . . . . . . . . . . . . . . . . . . . . . . . . . . . . . . . . . . . . . . . . . . . . . . . . .166Audience Profile . . . . . . . . . . . . . . . . . . . . . . . . . . . . . . . . . . . . . . . . . . . . . . . . . . . . . . . . . . . . . . . . . . . . . . . 170Sharing Visualizations . . . . . . . . . . . . . . . . . . . . . . . . . . . . . . . . . . . . . . . . . . . . . . . . . . . . . . . . . . . . . . . 173
Screens and Projectors . . . . . . . . . . . . . . . . . . . . . . . . . . . . . . . . . . . . . . . . . . . . . . . . . . . . . . . . . . . . .173Smartphones and Vertical Displays . . . . . . . . . . . . . . . . . . . . . . . . . . . . . . . . . . . . . . . . . . . . . . 174PDF Files . . . . . . . . . . . . . . . . . . . . . . . . . . . . . . . . . . . . . . . . . . . . . . . . . . . . . . . . . . . . . . . . . . . . . . . . . . . . 174Excel Files . . . . . . . . . . . . . . . . . . . . . . . . . . . . . . . . . . . . . . . . . . . . . . . . . . . . . . . . . . . . . . . . . . . . . . . . . . .175Sharing Online . . . . . . . . . . . . . . . . . . . . . . . . . . . . . . . . . . . . . . . . . . . . . . . . . . . . . . . . . . . . . . . . . . . . . .175
Takeaways . . . . . . . . . . . . . . . . . . . . . . . . . . . . . . . . . . . . . . . . . . . . . . . . . . . . . . . . . . . . . . . . . . . . . . . . . . . . . . 176
ix� CONTENTS

8 A Sense of Order 177�e Bar Chart. . . . . . . . . . . . . . . . . . . . . . . . . . . . . . . . . . . . . . . . . . . . . . . . . . . . . . . . . . . . . . . . . . . . . . . . . . .180
Vertical and Horizontal Bars . . . . . . . . . . . . . . . . . . . . . . . . . . . . . . . . . . . . . . . . . . . . . . . . . . . . . . .181Color Coding . . . . . . . . . . . . . . . . . . . . . . . . . . . . . . . . . . . . . . . . . . . . . . . . . . . . . . . . . . . . . . . . . . . . . . . . 182Ordering . . . . . . . . . . . . . . . . . . . . . . . . . . . . . . . . . . . . . . . . . . . . . . . . . . . . . . . . . . . . . . . . . . . . . . . . . . . . 182Chart Size . . . . . . . . . . . . . . . . . . . . . . . . . . . . . . . . . . . . . . . . . . . . . . . . . . . . . . . . . . . . . . . . . . . . . . . . . . . 185Breaks in the Scale . . . . . . . . . . . . . . . . . . . . . . . . . . . . . . . . . . . . . . . . . . . . . . . . . . . . . . . . . . . . . . . . . 187Changing Metrics to Avoid Breaks in the Scale . . . . . . . . . . . . . . . . . . . . . . . . . . . . . . . . . 188Evolution and Change . . . . . . . . . . . . . . . . . . . . . . . . . . . . . . . . . . . . . . . . . . . . . . . . . . . . . . . . . . . . . 190A Special Bar Chart: �e Population Pyramid . . . . . . . . . . . . . . . . . . . . . . . . . . . . . . . . . . . 190
Dot Plots . . . . . . . . . . . . . . . . . . . . . . . . . . . . . . . . . . . . . . . . . . . . . . . . . . . . . . . . . . . . . . . . . . . . . . . . . . . . . . . . . 192Slope Charts . . . . . . . . . . . . . . . . . . . . . . . . . . . . . . . . . . . . . . . . . . . . . . . . . . . . . . . . . . . . . . . . . . . . . . . . . . . . 194Strip Plots . . . . . . . . . . . . . . . . . . . . . . . . . . . . . . . . . . . . . . . . . . . . . . . . . . . . . . . . . . . . . . . . . . . . . . . . . . . . . . . 195Speedometers . . . . . . . . . . . . . . . . . . . . . . . . . . . . . . . . . . . . . . . . . . . . . . . . . . . . . . . . . . . . . . . . . . . . . . . . . .196Bullet Charts . . . . . . . . . . . . . . . . . . . . . . . . . . . . . . . . . . . . . . . . . . . . . . . . . . . . . . . . . . . . . . . . . . . . . . . . . . . 197Alerts . . . . . . . . . . . . . . . . . . . . . . . . . . . . . . . . . . . . . . . . . . . . . . . . . . . . . . . . . . . . . . . . . . . . . . . . . . . . . . . . . . . .198Takeaways . . . . . . . . . . . . . . . . . . . . . . . . . . . . . . . . . . . . . . . . . . . . . . . . . . . . . . . . . . . . . . . . . . . . . . . . . . . . . .199
9 Parts of a Whole: Composition Charts 200What Is Composition? . . . . . . . . . . . . . . . . . . . . . . . . . . . . . . . . . . . . . . . . . . . . . . . . . . . . . . . . . . . . . . . 202
Composition or Comparison? . . . . . . . . . . . . . . . . . . . . . . . . . . . . . . . . . . . . . . . . . . . . . . . . . . . . .202Pie Charts . . . . . . . . . . . . . . . . . . . . . . . . . . . . . . . . . . . . . . . . . . . . . . . . . . . . . . . . . . . . . . . . . . . . . . . . . . . . . . 205
Critique . . . . . . . . . . . . . . . . . . . . . . . . . . . . . . . . . . . . . . . . . . . . . . . . . . . . . . . . . . . . . . . . . . . . . . . . . . . . . 205Damage Control . . . . . . . . . . . . . . . . . . . . . . . . . . . . . . . . . . . . . . . . . . . . . . . . . . . . . . . . . . . . . . . . . . . .206
Donut Charts . . . . . . . . . . . . . . . . . . . . . . . . . . . . . . . . . . . . . . . . . . . . . . . . . . . . . . . . . . . . . . . . . . . . . . . . . . .210Donuts as Multi-Level Pies . . . . . . . . . . . . . . . . . . . . . . . . . . . . . . . . . . . . . . . . . . . . . . . . . . . . . . . . 212
Actual Hierarchical Charts: Sunburst Charts and Treemaps . . . . . . . . . . . . . . . . 213Stacked Bar Chart . . . . . . . . . . . . . . . . . . . . . . . . . . . . . . . . . . . . . . . . . . . . . . . . . . . . . . . . . . . . . . . . . . . . . 217Pareto Chart . . . . . . . . . . . . . . . . . . . . . . . . . . . . . . . . . . . . . . . . . . . . . . . . . . . . . . . . . . . . . . . . . . . . . . . . . . . . 218Takeaways . . . . . . . . . . . . . . . . . . . . . . . . . . . . . . . . . . . . . . . . . . . . . . . . . . . . . . . . . . . . . . . . . . . . . . . . . . . . . . 221
10 Scattered Data 222�e Data . . . . . . . . . . . . . . . . . . . . . . . . . . . . . . . . . . . . . . . . . . . . . . . . . . . . . . . . . . . . . . . . . . . . . . . . . . . . . . . . .225Distribution . . . . . . . . . . . . . . . . . . . . . . . . . . . . . . . . . . . . . . . . . . . . . . . . . . . . . . . . . . . . . . . . . . . . . . . . . . . .227
Showing Everything: Transparencies and Ji�ering . . . . . . . . . . . . . . . . . . . . . . . . . . . . 227Quantifying Impressions . . . . . . . . . . . . . . . . . . . . . . . . . . . . . . . . . . . . . . . . . . . . . . . . . . . . . . . . . . 228Mean and Standard Deviation . . . . . . . . . . . . . . . . . . . . . . . . . . . . . . . . . . . . . . . . . . . . . . . . . . . . 229�e Median and the Interquartile Range . . . . . . . . . . . . . . . . . . . . . . . . . . . . . . . . . . . . . . . . 229Outliers . . . . . . . . . . . . . . . . . . . . . . . . . . . . . . . . . . . . . . . . . . . . . . . . . . . . . . . . . . . . . . . . . . . . . . . . . . . . . 230
Box-and-Whisker Plots . . . . . . . . . . . . . . . . . . . . . . . . . . . . . . . . . . . . . . . . . . . . . . . . . . . . . . . . . . . . . .232Z-Scores . . . . . . . . . . . . . . . . . . . . . . . . . . . . . . . . . . . . . . . . . . . . . . . . . . . . . . . . . . . . . . . . . . . . . . . . . . . . 233
DATA AT WORKx

�e Pareto Chart Revisited . . . . . . . . . . . . . . . . . . . . . . . . . . . . . . . . . . . . . . . . . . . . . . . . . . . . . . . . . . 235Excel Maps . . . . . . . . . . . . . . . . . . . . . . . . . . . . . . . . . . . . . . . . . . . . . . . . . . . . . . . . . . . . . . . . . . . . . . . . . . . . .238Histograms . . . . . . . . . . . . . . . . . . . . . . . . . . . . . . . . . . . . . . . . . . . . . . . . . . . . . . . . . . . . . . . . . . . . . . . . . . . . 240
Bin Number and Width . . . . . . . . . . . . . . . . . . . . . . . . . . . . . . . . . . . . . . . . . . . . . . . . . . . . . . . . . . . . 242Histograms and Bar Charts . . . . . . . . . . . . . . . . . . . . . . . . . . . . . . . . . . . . . . . . . . . . . . . . . . . . . . . 245
Cumulative Frequency Distribution . . . . . . . . . . . . . . . . . . . . . . . . . . . . . . . . . . . . . . . . . . . . . 246Takeaways . . . . . . . . . . . . . . . . . . . . . . . . . . . . . . . . . . . . . . . . . . . . . . . . . . . . . . . . . . . . . . . . . . . . . . . . . . . . . 248
11 Change Over Time 249Focus on the Flow: �e Line Chart . . . . . . . . . . . . . . . . . . . . . . . . . . . . . . . . . . . . . . . . . . . . . . . . .250
Scales and Aspect Ratios . . . . . . . . . . . . . . . . . . . . . . . . . . . . . . . . . . . . . . . . . . . . . . . . . . . . . . . . . . 254Focus on the Relationships: Connected Sca�er Plots . . . . . . . . . . . . . . . . . . . . . . . . . .256Sudden Changes: �e Step Chart . . . . . . . . . . . . . . . . . . . . . . . . . . . . . . . . . . . . . . . . . . . . . . . . . .259Seasonality: �e Cycle Plot . . . . . . . . . . . . . . . . . . . . . . . . . . . . . . . . . . . . . . . . . . . . . . . . . . . . . . . . . . 261Sparklines . . . . . . . . . . . . . . . . . . . . . . . . . . . . . . . . . . . . . . . . . . . . . . . . . . . . . . . . . . . . . . . . . . . . . . . . . . . . . .263Animation . . . . . . . . . . . . . . . . . . . . . . . . . . . . . . . . . . . . . . . . . . . . . . . . . . . . . . . . . . . . . . . . . . . . . . . . . . . . . 266Takeaways . . . . . . . . . . . . . . . . . . . . . . . . . . . . . . . . . . . . . . . . . . . . . . . . . . . . . . . . . . . . . . . . . . . . . . . . . . . . . 270
12 Relationships 271Understanding Relationships . . . . . . . . . . . . . . . . . . . . . . . . . . . . . . . . . . . . . . . . . . . . . . . . . . . . . . 273
Curve Fi�ing . . . . . . . . . . . . . . . . . . . . . . . . . . . . . . . . . . . . . . . . . . . . . . . . . . . . . . . . . . . . . . . . . . . . . . . 274�e Sca�er Plot . . . . . . . . . . . . . . . . . . . . . . . . . . . . . . . . . . . . . . . . . . . . . . . . . . . . . . . . . . . . . . . . . . . . . . . .276
Sca�er Plot Design . . . . . . . . . . . . . . . . . . . . . . . . . . . . . . . . . . . . . . . . . . . . . . . . . . . . . . . . . . . . . . . . . 279Clusters and Groupings . . . . . . . . . . . . . . . . . . . . . . . . . . . . . . . . . . . . . . . . . . . . . . . . . . . . . . . . . . . 281Multiple Series and Subsets . . . . . . . . . . . . . . . . . . . . . . . . . . . . . . . . . . . . . . . . . . . . . . . . . . . . . . 282Profiles . . . . . . . . . . . . . . . . . . . . . . . . . . . . . . . . . . . . . . . . . . . . . . . . . . . . . . . . . . . . . . . . . . . . . . . . . . . . . 284
Bubble Charts . . . . . . . . . . . . . . . . . . . . . . . . . . . . . . . . . . . . . . . . . . . . . . . . . . . . . . . . . . . . . . . . . . . . . . . . . 286Takeaways . . . . . . . . . . . . . . . . . . . . . . . . . . . . . . . . . . . . . . . . . . . . . . . . . . . . . . . . . . . . . . . . . . . . . . . . . . . . . . 291
13 Profiling 292�e Need to Solve . . . . . . . . . . . . . . . . . . . . . . . . . . . . . . . . . . . . . . . . . . . . . . . . . . . . . . . . . . . . . . . . . . . . . .295Panel Charts . . . . . . . . . . . . . . . . . . . . . . . . . . . . . . . . . . . . . . . . . . . . . . . . . . . . . . . . . . . . . . . . . . . . . . . . . . . .295Bar Charts with Multiple Series . . . . . . . . . . . . . . . . . . . . . . . . . . . . . . . . . . . . . . . . . . . . . . . . . . 298Horizon Chart. . . . . . . . . . . . . . . . . . . . . . . . . . . . . . . . . . . . . . . . . . . . . . . . . . . . . . . . . . . . . . . . . . . . . . . . . 299Reorderable Matrix . . . . . . . . . . . . . . . . . . . . . . . . . . . . . . . . . . . . . . . . . . . . . . . . . . . . . . . . . . . . . . . . . . 304Small Multiples . . . . . . . . . . . . . . . . . . . . . . . . . . . . . . . . . . . . . . . . . . . . . . . . . . . . . . . . . . . . . . . . . . . . . . . .307Profiling in Excel . . . . . . . . . . . . . . . . . . . . . . . . . . . . . . . . . . . . . . . . . . . . . . . . . . . . . . . . . . . . . . . . . . . . . . 310Takeaways . . . . . . . . . . . . . . . . . . . . . . . . . . . . . . . . . . . . . . . . . . . . . . . . . . . . . . . . . . . . . . . . . . . . . . . . . . . . . . .311
xi� CONTENTS

14 Designing for E�ectiveness 312�e Aesthetic Dimension . . . . . . . . . . . . . . . . . . . . . . . . . . . . . . . . . . . . . . . . . . . . . . . . . . . . . . . . . . . . 315
A Wrong Model . . . . . . . . . . . . . . . . . . . . . . . . . . . . . . . . . . . . . . . . . . . . . . . . . . . . . . . . . . . . . . . . . . . . . 316�e Design Continuum . . . . . . . . . . . . . . . . . . . . . . . . . . . . . . . . . . . . . . . . . . . . . . . . . . . . . . . . . . . . 318
Tools Are Not Neutral: Defaults . . . . . . . . . . . . . . . . . . . . . . . . . . . . . . . . . . . . . . . . . . . . . . . . . . . 320Reason and Emotion . . . . . . . . . . . . . . . . . . . . . . . . . . . . . . . . . . . . . . . . . . . . . . . . . . . . . . . . . . . . . . . . . . 321
A.I.D.A. . . . . . . . . . . . . . . . . . . . . . . . . . . . . . . . . . . . . . . . . . . . . . . . . . . . . . . . . . . . . . . . . . . . . . . . . . . . . . . 321Does Reason Follow Emotion? . . . . . . . . . . . . . . . . . . . . . . . . . . . . . . . . . . . . . . . . . . . . . . . . . . . . 326Emotion and Effectiveness . . . . . . . . . . . . . . . . . . . . . . . . . . . . . . . . . . . . . . . . . . . . . . . . . . . . . . . . 328Occam’s Razor . . . . . . . . . . . . . . . . . . . . . . . . . . . . . . . . . . . . . . . . . . . . . . . . . . . . . . . . . . . . . . . . . . . . . . 329
Designing Chart Components . . . . . . . . . . . . . . . . . . . . . . . . . . . . . . . . . . . . . . . . . . . . . . . . . . . . . . 332Pseudo-3D . . . . . . . . . . . . . . . . . . . . . . . . . . . . . . . . . . . . . . . . . . . . . . . . . . . . . . . . . . . . . . . . . . . . . . . . . . 333Textures . . . . . . . . . . . . . . . . . . . . . . . . . . . . . . . . . . . . . . . . . . . . . . . . . . . . . . . . . . . . . . . . . . . . . . . . . . . . 337Titles . . . . . . . . . . . . . . . . . . . . . . . . . . . . . . . . . . . . . . . . . . . . . . . . . . . . . . . . . . . . . . . . . . . . . . . . . . . . . . . . 338Fonts . . . . . . . . . . . . . . . . . . . . . . . . . . . . . . . . . . . . . . . . . . . . . . . . . . . . . . . . . . . . . . . . . . . . . . . . . . . . . . . . 339Annotations . . . . . . . . . . . . . . . . . . . . . . . . . . . . . . . . . . . . . . . . . . . . . . . . . . . . . . . . . . . . . . . . . . . . . . . . 339Grid Lines . . . . . . . . . . . . . . . . . . . . . . . . . . . . . . . . . . . . . . . . . . . . . . . . . . . . . . . . . . . . . . . . . . . . . . . . . . . 342Clip Art. . . . . . . . . . . . . . . . . . . . . . . . . . . . . . . . . . . . . . . . . . . . . . . . . . . . . . . . . . . . . . . . . . . . . . . . . . . . . . 343�e Secondary Axis . . . . . . . . . . . . . . . . . . . . . . . . . . . . . . . . . . . . . . . . . . . . . . . . . . . . . . . . . . . . . . . . 344Legends . . . . . . . . . . . . . . . . . . . . . . . . . . . . . . . . . . . . . . . . . . . . . . . . . . . . . . . . . . . . . . . . . . . . . . . . . . . . . 346Backgrounds . . . . . . . . . . . . . . . . . . . . . . . . . . . . . . . . . . . . . . . . . . . . . . . . . . . . . . . . . . . . . . . . . . . . . . . 347
Ordering the Data . . . . . . . . . . . . . . . . . . . . . . . . . . . . . . . . . . . . . . . . . . . . . . . . . . . . . . . . . . . . . . . . . . . . .347Number of Series . . . . . . . . . . . . . . . . . . . . . . . . . . . . . . . . . . . . . . . . . . . . . . . . . . . . . . . . . . . . . . . . . . . . . . 351
Chart Type . . . . . . . . . . . . . . . . . . . . . . . . . . . . . . . . . . . . . . . . . . . . . . . . . . . . . . . . . . . . . . . . . . . . . . . . . . 352Grouping . . . . . . . . . . . . . . . . . . . . . . . . . . . . . . . . . . . . . . . . . . . . . . . . . . . . . . . . . . . . . . . . . . . . . . . . . . . . 352Residual Category . . . . . . . . . . . . . . . . . . . . . . . . . . . . . . . . . . . . . . . . . . . . . . . . . . . . . . . . . . . . . . . . . . 353Context. . . . . . . . . . . . . . . . . . . . . . . . . . . . . . . . . . . . . . . . . . . . . . . . . . . . . . . . . . . . . . . . . . . . . . . . . . . . . . 353Small Multiples . . . . . . . . . . . . . . . . . . . . . . . . . . . . . . . . . . . . . . . . . . . . . . . . . . . . . . . . . . . . . . . . . . . . 354
Lying and Deceiving with Charts . . . . . . . . . . . . . . . . . . . . . . . . . . . . . . . . . . . . . . . . . . . . . . . . . . 355Data, Perception, and Cognition . . . . . . . . . . . . . . . . . . . . . . . . . . . . . . . . . . . . . . . . . . . . . . . . . . 356Exaggerating Differences . . . . . . . . . . . . . . . . . . . . . . . . . . . . . . . . . . . . . . . . . . . . . . . . . . . . . . . . . 356Distorting Time Series . . . . . . . . . . . . . . . . . . . . . . . . . . . . . . . . . . . . . . . . . . . . . . . . . . . . . . . . . . . . 357Aspect Ratio . . . . . . . . . . . . . . . . . . . . . . . . . . . . . . . . . . . . . . . . . . . . . . . . . . . . . . . . . . . . . . . . . . . . . . . . 357Omi�ing Points . . . . . . . . . . . . . . . . . . . . . . . . . . . . . . . . . . . . . . . . . . . . . . . . . . . . . . . . . . . . . . . . . . . . 358Mistaking Variation for Evolution . . . . . . . . . . . . . . . . . . . . . . . . . . . . . . . . . . . . . . . . . . . . . . . 358Double Axes . . . . . . . . . . . . . . . . . . . . . . . . . . . . . . . . . . . . . . . . . . . . . . . . . . . . . . . . . . . . . . . . . . . . . . . . 359Pseudo 3D . . . . . . . . . . . . . . . . . . . . . . . . . . . . . . . . . . . . . . . . . . . . . . . . . . . . . . . . . . . . . . . . . . . . . . . . . . . 359Context. . . . . . . . . . . . . . . . . . . . . . . . . . . . . . . . . . . . . . . . . . . . . . . . . . . . . . . . . . . . . . . . . . . . . . . . . . . . . . 360When Everything Goes . . . . . . . . . . . . . . . . . . . . . . . . . . . . . . . . . . . . . . . . . . . . . . . . . . . . . . . . . . . . 362
Takeaways . . . . . . . . . . . . . . . . . . . . . . . . . . . . . . . . . . . . . . . . . . . . . . . . . . . . . . . . . . . . . . . . . . . . . . . . . . . . . .364
DATA AT WORKxii

15 Color: Beyond Aesthetics 365Quantifying Color . . . . . . . . . . . . . . . . . . . . . . . . . . . . . . . . . . . . . . . . . . . . . . . . . . . . . . . . . . . . . . . . . . . . .367
�e RGB Model . . . . . . . . . . . . . . . . . . . . . . . . . . . . . . . . . . . . . . . . . . . . . . . . . . . . . . . . . . . . . . . . . . . . . 368�e HSL Model . . . . . . . . . . . . . . . . . . . . . . . . . . . . . . . . . . . . . . . . . . . . . . . . . . . . . . . . . . . . . . . . . . . . . 368
Stimuli Intensity . . . . . . . . . . . . . . . . . . . . . . . . . . . . . . . . . . . . . . . . . . . . . . . . . . . . . . . . . . . . . . . . . . . . . .370�e Functional Tasks of Color . . . . . . . . . . . . . . . . . . . . . . . . . . . . . . . . . . . . . . . . . . . . . . . . . . . . . . 372
Categorize . . . . . . . . . . . . . . . . . . . . . . . . . . . . . . . . . . . . . . . . . . . . . . . . . . . . . . . . . . . . . . . . . . . . . . . . . . 373Group . . . . . . . . . . . . . . . . . . . . . . . . . . . . . . . . . . . . . . . . . . . . . . . . . . . . . . . . . . . . . . . . . . . . . . . . . . . . . . . 376Emphasize . . . . . . . . . . . . . . . . . . . . . . . . . . . . . . . . . . . . . . . . . . . . . . . . . . . . . . . . . . . . . . . . . . . . . . . . . . 378Sequence . . . . . . . . . . . . . . . . . . . . . . . . . . . . . . . . . . . . . . . . . . . . . . . . . . . . . . . . . . . . . . . . . . . . . . . . . . . . 378Diverge . . . . . . . . . . . . . . . . . . . . . . . . . . . . . . . . . . . . . . . . . . . . . . . . . . . . . . . . . . . . . . . . . . . . . . . . . . . . . . 382Alert . . . . . . . . . . . . . . . . . . . . . . . . . . . . . . . . . . . . . . . . . . . . . . . . . . . . . . . . . . . . . . . . . . . . . . . . . . . . . . . . . 386
Color Symbolism . . . . . . . . . . . . . . . . . . . . . . . . . . . . . . . . . . . . . . . . . . . . . . . . . . . . . . . . . . . . . . . . . . . . 386�e Role of Gray . . . . . . . . . . . . . . . . . . . . . . . . . . . . . . . . . . . . . . . . . . . . . . . . . . . . . . . . . . . . . . . . . . . . . . .387Color Staging . . . . . . . . . . . . . . . . . . . . . . . . . . . . . . . . . . . . . . . . . . . . . . . . . . . . . . . . . . . . . . . . . . . . . . . . . . 389Color Harmony . . . . . . . . . . . . . . . . . . . . . . . . . . . . . . . . . . . . . . . . . . . . . . . . . . . . . . . . . . . . . . . . . . . . . . . .392
General Principles . . . . . . . . . . . . . . . . . . . . . . . . . . . . . . . . . . . . . . . . . . . . . . . . . . . . . . . . . . . . . . . . . 392�e Classical Rules . . . . . . . . . . . . . . . . . . . . . . . . . . . . . . . . . . . . . . . . . . . . . . . . . . . . . . . . . . . . . . . . . 393Complementary Colors . . . . . . . . . . . . . . . . . . . . . . . . . . . . . . . . . . . . . . . . . . . . . . . . . . . . . . . . . . . . 394Split Complementary Colors . . . . . . . . . . . . . . . . . . . . . . . . . . . . . . . . . . . . . . . . . . . . . . . . . . . . . . 394Triadic Harmony . . . . . . . . . . . . . . . . . . . . . . . . . . . . . . . . . . . . . . . . . . . . . . . . . . . . . . . . . . . . . . . . . . . 396Analogous Colors . . . . . . . . . . . . . . . . . . . . . . . . . . . . . . . . . . . . . . . . . . . . . . . . . . . . . . . . . . . . . . . . . . . 396Rectangle . . . . . . . . . . . . . . . . . . . . . . . . . . . . . . . . . . . . . . . . . . . . . . . . . . . . . . . . . . . . . . . . . . . . . . . . . . . 396Warm Colors and Cool Colors . . . . . . . . . . . . . . . . . . . . . . . . . . . . . . . . . . . . . . . . . . . . . . . . . . . . . 398
Sources for Color Pale�es . . . . . . . . . . . . . . . . . . . . . . . . . . . . . . . . . . . . . . . . . . . . . . . . . . . . . . . . . . 399Excel . . . . . . . . . . . . . . . . . . . . . . . . . . . . . . . . . . . . . . . . . . . . . . . . . . . . . . . . . . . . . . . . . . . . . . . . . . . . . . . . 399Beyond Excel . . . . . . . . . . . . . . . . . . . . . . . . . . . . . . . . . . . . . . . . . . . . . . . . . . . . . . . . . . . . . . . . . . . . . . .402Color Blindness . . . . . . . . . . . . . . . . . . . . . . . . . . . . . . . . . . . . . . . . . . . . . . . . . . . . . . . . . . . . . . . . . . . . 403
Takeaways . . . . . . . . . . . . . . . . . . . . . . . . . . . . . . . . . . . . . . . . . . . . . . . . . . . . . . . . . . . . . . . . . . . . . . . . . . . . . 405
16 Conclusion 406It’s All About Pragmatism, Not Aesthetics . . . . . . . . . . . . . . . . . . . . . . . . . . . . . . . . . . . . . . . 407Say Goodbye to the Old Ways . . . . . . . . . . . . . . . . . . . . . . . . . . . . . . . . . . . . . . . . . . . . . . . . . . . . . 407Find Your Own Data Visualization Model . . . . . . . . . . . . . . . . . . . . . . . . . . . . . . . . . . . . . . .408In Business Visualization, Hard Work Is Not Always the Best Work . . . . . . . . . .408Organizational Literacy . . . . . . . . . . . . . . . . . . . . . . . . . . . . . . . . . . . . . . . . . . . . . . . . . . . . . . . . . . .409Reason and Emotion . . . . . . . . . . . . . . . . . . . . . . . . . . . . . . . . . . . . . . . . . . . . . . . . . . . . . . . . . . . . . . .409Play with Constraints . . . . . . . . . . . . . . . . . . . . . . . . . . . . . . . . . . . . . . . . . . . . . . . . . . . . . . . . . . . . . . 410�e Tools . . . . . . . . . . . . . . . . . . . . . . . . . . . . . . . . . . . . . . . . . . . . . . . . . . . . . . . . . . . . . . . . . . . . . . . . . . . . .411
Index 412
xiii� CONTENTS

Exports and imports by Member States of the EU/third countries - Current prices [namq_exi_c]
Last update ##Extracted on ##Source of data Eurostat
Exports of goods and servicesS_ADJ Seasonally adjusted and adjusted data by working daysUNIT Percentage of GDPINDIC_NA
EXPORTAÇÕES DE BENS E SERVIÇOS POR PAÍSEm percentagem do Produto Interno Bruto
trimestre
País 1 2 3 4 1 2 3 4 1 2 3 4 1 2 3 4 1 2 3 4 1 2 3 4 1 2 3 4 1 2 3 4 1 2 3 4 1 2 3 4 1 2 3 4 1 2 3 4 1 2 3 4 1 2 3 4 1 2França 27.7 28.6 29.1 29.8 29.5 28.5 28.4 27.3 27.5 27.9 27.6 27.1 26.5 25.7 25.7 26.0 25.9 26.0 26.1 26.3 25.9 26.1 26.5 26.8 27.2 27.3 26.7 26.9 26.8 27.0 26.9 26.8 27.7 27.4 27.3 25.7 23.9 23.8 23.8 23.9 24.9 25.6 25.9 26.4 27.1 27.5 27.5 27.9 27.7 27.8 27.9 27.8 27.7 28.2 28.0 28.2 28.1 28.1
Itália 26.1 26.1 27.5 27.7 27.2 27.6 26.6 26.0 25.6 25.5 25.4 25.4 24.9 24.1 24.2 24.7 24.6 25.1 25.4 25.2 25.3 25.7 26.2 26.4 27.0 27.5 27.6 28.8 28.8 28.8 28.8 29.0 29.6 28.8 28.5 26.8 23.5 23.2 23.8 24.2 25.0 26.2 26.9 27.8 28.4 28.7 29.1 29.4 30.0 30.0 30.5 30.5 30.1 30.3 30.5 30.7 30.5 30.6
Espanha 28.0 28.9 29.2 30.0 29.5 28.7 28.5 27.5 27.4 27.6 27.2 27.2 26.9 26.3 26.1 26.0 26.1 26.0 25.7 26.0 25.1 26.1 25.7 25.8 26.3 26.2 26.0 26.7 27.0 26.7 27.5 26.4 26.7 27.0 27.4 24.9 23.0 23.6 24.5 24.7 25.6 27.2 27.9 28.7 30.3 30.4 31.3 31.4 31.4 31.6 33.5 34.1 32.7 34.8 34.4 34.6 34.2 34.7
Reino Unido 26.0 27.2 27.2 28.7 28.6 27.6 25.9 25.7 25.7 26.6 26.2 25.0 26.3 25.4 25.2 25.1 24.7 24.8 25.3 26.0 25.3 26.2 27.0 27.9 30.3 31.5 26.9 26.3 26.2 26.7 26.8 26.9 27.6 30.0 30.3 29.7 28.5 27.9 28.1 29.0 29.1 30.5 30.0 30.9 32.5 31.5 31.7 32.6 31.9 31.5 32.1 31.6 31.2 31.8 30.4 : : :
Portugal 28.6 28.2 29.0 29.9 29.0 28.5 27.4 27.4 27.2 27.7 27.7 27.7 28.1 27.2 27.6 27.6 27.8 28.4 27.8 28.2 26.9 27.4 28.1 28.3 29.8 30.7 31.5 31.7 31.9 32.1 32.4 32.4 33.4 33.1 33.2 30.1 26.8 27.4 28.7 29.2 29.4 31.0 32.0 32.8 33.7 35.5 36.3 37.1 38.0 38.6 39.0 39.1 39.8 41.2 40.9 : : :
Grécia 23.5 24.8 24.9 26.3 25.5 24.7 22.9 23.1 20.8 21.6 21.5 20.4 20.0 20.0 19.7 20.3 21.9 22.3 22.4 22.8 22.4 21.8 23.0 22.6 22.5 22.8 22.5 22.1 21.8 22.1 22.9 23.7 23.9 23.7 23.1 23.0 99.6 98.3 91.8 93.9 91.2 20.3 20.7 23.3 21.8 31.0 32.0 32.8 33.7 35.5 36.3 37.1 40.0 40.0 39.0 39.1 39.8 :
Roménia 29.8 31.5 34.1 35.6 34.8 33.9 34.2 30.9 32.7 35.1 37.4 36.9 35.5 34.5 35.5 35.0 36.3 37.1 37.0 34.8 33.0 33.2 34.1 33.2 33.5 33.2 32.5 31.5 30.8 29.2 28.6 30.3 30.8 32.2 30.7 29.2 29.6 29.8 31.9 31.3 30.1 34.9 36.7 39.3 39.4 38.8 40.5 41.3 39.2 40.0 39.9 41.4 40.1 41.5 43.2 : : :
Finlândia 41.7 42.8 44.9 44.9 42.9 41.4 40.5 41.3 40.0 40.8 40.8 40.6 39.4 39.5 38.5 37.5 40.4 38.8 40.0 40.4 41.4 40.5 42.5 42.7 44.5 46.2 45.2 46.2 44.8 46.3 47.2 45.1 47.1 49.2 47.2 43.9 37.2 36.4 35.5 40.5 35.8 40.4 40.6 44.5 41.9 40.5 40.6 41.0 40.9 40.8 40.5 40.2 40.0 39.1 39.3 39.1 38.0 :
Noruega 44.1 45.6 47.3 48.7 47.4 46.3 45.8 43.3 41.7 42.6 40.4 40.1 40.1 40.3 39.4 41.9 41.8 41.7 42.1 41.8 42.5 43.8 44.7 45.2 46.0 45.3 45.3 45.0 43.9 44.0 43.8 45.0 46.0 48.3 47.0 45.4 40.1 39.2 40.3 40.6 40.3 40.3 40.0 41.4 41.7 41.6 42.6 42.0 42.1 41.6 40.2 39.8 38.0 38.9 39.5 39.2 38.8 37.2
Croácia 40.9 41.3 40.6 41.1 42.7 42.4 42.6 42.2 40.6 40.4 40.3 39.7 41.1 41.3 43.0 42.1 42.9 42.4 42.8 42.5 41.3 41.9 42.6 42.4 42.8 42.0 42.5 44.3 42.1 42.7 42.2 43.1 40.4 42.8 43.2 42.6 36.8 36.0 38.2 36.8 39.3 39.6 39.2 41.8 41.9 43.2 42.5 42.9 43.4 43.2 43.7 44.9 42.3 43.6 44.1 43.4 45.0 :
Chipre 55.1 55.9 57.2 56.1 57.1 58.0 55.9 54.9 53.6 52.7 50.6 48.0 47.0 46.5 48.6 48.0 48.9 49.1 47.9 47.6 47.1 47.6 48.8 50.8 49.5 47.6 47.8 47.6 48.5 48.0 48.0 48.3 47.3 46.7 45.3 44.1 42.2 40.7 40.5 40.0 41.3 41.1 42.1 43.3 43.6 43.4 43.4 43.8 44.1 44.2 43.0 42.7 43.8 45.1 46.2 : : :
Polónia 25.6 27.3 26.9 27.9 27.7 26.2 27.2 26.9 26.4 28.3 29.2 30.2 31.1 32.2 34.4 36.3 36.8 38.2 37.3 37.3 36.0 37.0 37.3 38.3 39.4 40.2 40.8 41.2 41.1 40.7 41.0 41.1 40.6 40.5 39.9 39.0 39.5 39.1 39.2 40.3 40.3 42.3 42.8 43.2 44.1 44.5 45.6 46.4 46.7 46.7 46.5 46.9 46.8 47.7 48.3 48.3 48.4 48.6
Suécia 44.8 45.7 47.0 48.6 47.3 46.1 46.2 45.9 45.9 45.2 43.5 43.2 44.0 43.9 43.0 43.6 44.6 46.7 45.8 46.3 46.1 47.7 49.4 49.9 51.0 50.6 50.6 52.2 51.2 51.8 52.1 52.6 55.0 53.7 53.3 52.0 49.3 47.3 47.8 47.5 47.8 49.5 50.0 50.0 49.7 49.5 50.4 49.4 49.6 49.4 48.0 47.3 46.0 45.8 45.9 45.8 46.2 46.3
Alemanha 31.6 32.6 33.5 35.9 34.8 35.0 34.6 35.1 34.8 35.8 35.9 36.5 35.7 35.3 35.8 36.3 37.1 39.0 38.5 39.0 39.8 40.8 41.7 42.6 43.8 44.9 45.5 47.9 46.4 47.1 47.4 48.2 48.5 48.6 48.8 46.5 42.4 41.4 42.3 43.5 44.9 47.5 48.2 49.3 50.3 50.2 50.8 50.8 51.6 52.3 52.3 51.4 50.6 51.0 50.4 51.2 50.6 :
Suiça 44.1 44.8 46.3 46.5 46.6 45.4 43.9 42.7 43.1 43.6 43.5 42.9 41.8 42.4 43.3 44.2 44.8 44.7 45.1 45.5 45.8 47.5 48.0 49.0 49.9 49.7 50.8 52.7 53.6 54.5 54.8 54.6 54.6 55.1 55.3 52.1 49.5 49.3 51.3 51.3 51.5 52.4 51.5 51.6 52.0 51.5 50.4 51.1 51.9 51.7 52.6 53.0 52.4 52.1 51.9 : : :
Dinamarca 43.1 45.1 48.3 49.5 49.0 48.1 46.1 45.7 47.3 47.6 46.6 47.4 46.2 45.0 45.4 44.8 44.5 46.1 45.4 45.3 46.5 48.8 50.1 50.4 52.1 51.2 51.9 53.0 52.3 51.7 52.1 52.7 54.3 56.1 55.4 53.0 48.5 47.3 47.2 47.5 49.1 50.4 51.1 51.2 54.1 53.0 53.5 54.1 54.8 55.5 54.7 54.2 55.0 54.9 54.8 54.8 54.9 54.1
Islândia 31.7 32.8 34.7 34.9 38.4 37.0 39.6 40.0 40.7 38.5 35.2 35.4 35.5 33.3 34.2 34.1 34.0 33.8 34.7 33.9 32.1 34.9 29.5 30.5 29.9 35.4 32.2 31.4 37.0 32.6 29.6 39.5 36.2 47.8 43.4 49.0 50.1 49.5 56.2 55.3 55.6 57.3 55.4 57.2 55.5 59.0 61.2 60.4 57.0 61.6 59.4 59.7 57.4 56.1 58.7 : : :
Áustria 44.5 45.7 46.9 47.9 48.2 48.2 48.1 48.1 48.5 48.6 48.4 48.4 48.3 47.5 48.1 49.1 50.1 51.1 51.6 52.2 53.0 53.5 54.1 54.6 55.5 56.1 57.0 57.8 58.3 58.7 59.2 59.9 60.3 59.8 58.9 55.9 51.9 49.7 49.7 50.6 52.4 54.0 54.8 55.4 56.7 56.9 57.5 57.7 57.3 57.3 57.6 57.4 57.3 57.3 57.5 57.6 57.6 57.6
Letónia 42.3 41.9 41.7 42.7 44.7 43.1 41.4 40.7 41.3 41.9 42.3 40.7 42.4 42.6 42.3 42.3 40.9 43.4 45.2 47.1 48.3 48.9 48.3 48.6 47.3 46.3 44.7 43.4 44.5 42.4 41.6 42.2 42.3 42.5 44.6 42.4 40.4 41.1 45.6 48.9 48.9 52.6 55.9 57.1 58.8 59.4 59.2 59.4 60.1 60.6 62.6 63.0 61.3 59.8 58.5 60.0 59.9 :
Bulgária 49.0 48.5 48.8 54.2 51.4 48.2 47.6 45.1 46.2 46.9 47.6 46.0 50.4 48.2 47.9 45.7 48.9 50.3 52.6 52.4 37.5 40.0 42.3 38.8 60.8 62.6 59.4 59.7 56.1 60.0 58.0 60.4 62.6 62.1 56.5 50.4 46.2 43.7 47.6 50.3 51.1 55.5 59.5 58.6 65.9 62.8 63.5 69.8 65.2 66.5 63.7 68.1 70.3 68.4 68.1 71.1 69.3 69.0
Eslovénia 51.1 53.3 54.4 56.4 56.5 55.7 55.3 53.6 54.8 55.6 55.6 54.8 53.7 53.4 54.0 54.3 55.4 57.4 58.9 59.0 59.2 60.9 63.7 64.5 65.1 65.9 66.6 68.7 69.7 69.9 70.2 68.8 70.7 69.5 68.1 64.0 58.1 58.2 59.1 61.1 62.9 65.7 68.2 68.9 71.4 72.5 73.3 74.5 74.4 76.1 77.0 78.2 78.6 77.7 78.3 78.6 79.0 :
Lituânia 42.9 42.9 46.3 45.3 48.8 51.1 50.7 48.6 51.3 53.7 51.1 54.2 54.1 48.2 49.7 51.8 47.2 50.2 52.3 55.0 55.7 54.1 57.0 62.9 60.5 61.5 57.0 57.8 54.2 55.8 55.2 51.0 56.8 62.0 62.6 54.5 51.8 51.3 55.9 58.7 59.8 66.5 69.4 74.4 76.6 77.8 77.8 77.8 75.7 79.1 87.3 91.4 91.8 84.2 85.4 87.8 81.1 82.9
Rep. Checa 57.7 59.8 61.6 64.7 64.8 62.4 62.3 61.3 60.6 57.4 55.4 57.3 59.7 57.7 58.3 60.6 57.8 65.6 64.7 62.9 60.8 63.7 66.1 66.7 67.4 65.9 66.3 68.6 67.7 68.1 68.4 68.9 67.8 66.5 62.7 60.5 57.9 57.8 59.3 61.1 62.8 65.8 68.1 69.3 72.4 71.9 72.9 74.0 79.0 77.4 78.8 76.9 77.3 78.3 79.1 79.6 86.3 84.5
Bélgica 75.3 77.4 79.2 80.4 79.8 78.3 77.1 76.2 77.0 77.4 76.7 75.8 75.0 73.8 73.0 74.0 73.7 75.8 76.3 77.9 77.9 78.3 78.6 79.8 80.8 80.8 80.9 80.5 81.2 82.2 83.3 83.4 84.5 87.1 87.6 78.4 72.7 72.7 74.2 75.2 76.8 79.2 81.0 82.1 84.9 85.2 85.7 84.0 85.7 86.3 86.9 85.7 84.4 85.8 86.7 86.5 84.6 86.5
Holanda 67.0 69.0 70.6 73.3 69.5 68.0 66.6 64.7 64.2 64.2 63.9 64.0 64.6 61.7 62.3 63.1 63.7 65.8 67.6 68.6 68.4 68.9 70.1 70.9 72.2 72.7 72.8 73.3 73.1 73.8 74.1 75.5 77.3 77.2 77.9 72.6 67.4 66.8 68.9 71.1 75.6 78.1 79.8 81.2 82.4 83.3 84.3 85.2 86.4 88.0 88.6 89.0 88.4 88.5 88.2 87.8 88.2 :
Estónia 81.7 82.2 85.8 87.9 91.0 83.6 72.3 73.2 70.2 72.9 70.3 70.2 66.8 68.9 70.1 70.7 71.4 72.6 74.6 73.4 76.6 75.8 78.4 79.6 73.6 74.9 72.9 69.7 68.0 68.5 65.1 66.8 70.4 69.9 72.5 71.3 61.1 61.8 65.7 66.9 68.5 74.9 79.7 86.3 84.7 85.4 91.2 87.6 91.8 88.6 90.5 89.8 89.8 90.0 86.1 85.1 86.4 86.7
Eslováquia 67.2 69.1 71.2 73.9 74.6 72.8 72.8 70.8 68.7 71.0 73.3 71.3 73.9 73.9 78.0 77.4 73.4 78.8 73.0 73.1 72.9 75.1 77.0 79.7 81.1 81.5 87.1 87.8 87.9 85.5 86.3 87.7 90.0 85.6 82.7 75.6 68.0 68.0 70.9 75.3 75.3 78.8 80.6 86.6 91.6 88.4 87.4 90.8 96.1 95.9 97.3 97.1 96.6 98.4 96.0 99.5 99.5 96.0
Hungria 70.6 72.9 74.4 79.3 76.2 72.1 69.2 68.9 65.1 66.1 61.7 58.8 59.8 59.5 62.4 62.5 63.9 62.9 62.8 63.8 63.5 66.7 65.6 67.5 73.7 75.9 78.5 80.8 79.2 79.4 82.3 82.3 85.1 82.5 79.9 78.8 77.1 76.7 77.1 77.9 78.2 83.8 88.3 88.4 90.5 88.0 90.1 96.2 97.1 96.5 93.2 91.1 94.7 95.4 96.6 95.6 96.4 96.8
Malta 90.2 89.0 90.5 85.2 84.6 79.8 76.2 77.0 77.3 80.2 81.6 81.9 78.6 77.1 78.7 75.8 77.9 77.8 75.9 74.4 74.1 73.7 75.2 77.4 84.5 85.1 89.5 94.5 89.4 94.9 92.2 92.7 95.1 89.7 89.9 90.3 80.3 82.1 83.5 83.4 86.1 91.1 93.1 91.7 94.9 96.7 94.9 102.0 99.7 104.2 100.7 99.6 98.3 91.8 93.9 91.2 90.4 89.2
Irelanda 92.2 95.7 99.2 102.4 102.7 100.1 98.4 97.4 101.1 97.8 91.4 85.5 84.2 82.6 83.9 82.5 84.8 84.0 83.6 81.4 80.6 80.6 82.5 81.6 79.4 80.1 78.6 78.8 79.0 79.8 82.4 80.4 81.3 82.3 82.9 87.2 89.5 90.3 89.8 91.6 94.4 98.5 102.1 104.9 102.0 101.7 103.1 104.2 106.5 106.8 109.2 108.9 104.1 109.8 106.7 : : :
Luxemburgo 147.2 150.4 151.4 151.2 148.8 151.3 146.9 140.0 146.3 142.4 138.9 135.3 134.9 133.6 138.5 141.1 150.1 151.4 151.7 156.1 149.9 151.5 156.9 164.5 167.7 171.3 169.0 171.4 172.6 174.5 176.3 180.0 184.1 189.1 185.1 168.7 159.1 156.6 160.6 171.3 166.2 172.3 169.5 175.0 178.9 181.2 177.9 175.7 176.8 176.9 178.5 177.2 174.2 175.0 174.0 179.7 175.3 :
5.0 <10 15.0 25.0 35.0 45.0 55.0 65.0 75.0 85.0 105.0
Fonte: Eurostat
20052000 2001 2002 2003 2004
60-70 70-80
2006 2007 2008 2009
10-20 20-30 30-40 40-50 50-60 80-90 >90
2012 2013 2014210 2011
18.5 18.9 19.3 19 19.6
33.2 30.1 26.8
29.6 29.8 31.9 31.3 30.1
18.5 18.9 19.3 19 19.6
30.3 29.7
33.2 30.1 26.8 27.4
18.5 18.9
26.8
18.5 18.9
26.8
INTRODUCTION
No data point is an island, Entire of itself, Every data point is a piece of the continent, A part of the pattern.
�e venerable poet John Donne must be turning in his grave with this paraphrase of his beautiful meditation “No man is an island,” but I couldn’t find a be�er way to express the nature of data, which have a context and a web of relationships. �e path to knowledge lies in discovering and making these relationships visible.
Social change and technological progress have made the world a more uncertain place. As another poet, Luís de Camões (not related), said, “Change doesn’t change like it used to.” In an effort to cope with uncertainty, we put technology at the service of mass data production and retrieval. �is has been called by many names over the years. Today we call it “Big Data.”
xiv

Acquiring and storing data has become the goal; the more data, the be�er. But are we missing the point? We no longer need more data if it’s not accompanied by the right skills that turn it into truly be�er data. We need to consider how those who need the data will use it, and for what purpose. Otherwise, it’s pointless to continue accumulating useless data, collecting digital dust in a forgo�en folder on a hard disk. Waiting. Or, worse yet, making pie charts.
A Quantitative ChangeSuppose that the data you work with is now updated daily rather than monthly, multiplying its total volume by 30. As Arthur C. Clark told us, a quantitative change of this magnitude forces a qualitative change in organizational culture, our a�itude toward data, and data’s role in decision making. Just imagine if the data allowed you to react to whatever is happening (rather than merely acknowledging what happened weeks ago) so that you become aware of its impact on all levels of the organization, beginning with how each person interprets their roles and tasks.
Only a planetary catastrophe would prevent the ever escalating volume of data. In the past, much of human experience was absent from our data monitoring systems, but it’s now beginning to be quantified. In a few years, we’ll reminisce affectionately over the complaints about information overload that we have today.
�is is where data visualization begins. But beware. Data visualization is mar-keted today as the miracle cure that will open the doors to success, whatever its shape. We have enough experience to realize that in reality it’s not always easy to distinguish between real usefulness and zealous marketing. A�er the initial excitement over the prospects of data visualization comes disillusionment, and a�er that the possibility of a balanced assessment. �e key is to get to this point quickly, without disappointments and at a lower cost. �is book is designed to help get you there.
A Language for Multiple UsersData visualization helps us manage information. To make the most of this infor-mation, we must first accept the fact that “data visualization” does not exist as a single entity. Instead, think of it as a blanket term: It exists differently for each group of people who use it.
� INTRODUCTION xv
Visualization is like a language. Paraphrasing the Portuguese writer José Saramago, “�ere is no English; there are languages in English.” For example, although people from the United States, Wales, and South Africa all speak English, they’d likely have some difficulty communicating because their versions of English are all so different, having changed from their common core over the years based on their geographical and social contexts.
Data visualization is a graphical language, used differently depending on the “speaker.” A graphic designer, a statistician, or a manager starts from the same foundations of data visualization, but each has different goals, skills, and contexts, which are reflected in their different visualization choices.
A Wrong ModelImagine that we all wish to write poetry. For the unfortunate not blessed with the gi� of rhyming, the word processor offers some models that help with writing reports in the form of folk poetry. Seems absurd? Well, this is what happens with data visualization, too, when we look to spreadsheet chart templates to help overcome our weaknesses.
Graphic designers have made visualization the fashion phenomenon it is today—their poetry meant to be seen by large audiences and evidenced in data journalism, books, blogs, and social networks. Results vary between the brilliance of many visualizations in the New York Times, for instance, and the mediocrity of many infographics created by marketing departments as clickbait.
Meanwhile, millions of charts made with spreadsheets remain hidden within business organizations. �e obscure, everyday users of office tools, unaware of be�er visualization models adapted to their contexts, mistakenly see the design-ers’ work as a reference to imitate, o�en with catastrophic results. Peer pressure, the this-is-what-the-client-wants, vendor sales tactics, and a lack of training feed the illusion that there is beauty in bad poetry.
�ere is not. �e purpose of data visualization in organizations is not to make beautiful charts; it is to make effective charts. And, as we shall see, if your charts are effective, they’re also likely to be beautiful, even in aspects with strong associations to aesthetics, such as the use of color.
DATA AT WORKxvi

A Better ModelVisualizations cra�ed by graphic designers are o�en appealing, but in a busi-ness context we can’t use the same model. At a time when graphic literacy in organizations is still low, we must evaluate this model’s usefulness, beginning with four simple concepts:
� Process. Visual displays of information in business organizations and in the media have different goals and different production and consumption processes, which should not be mixed up.
� Asymmetry. Information asymmetry—whereby one party has more or be�er information than the other—is generally less evident within an organization than, say, between journalists and their readers. Graphical representations must adapt to this difference, adding detail in the former and finding the core message in the la�er.
� Model. If you hire a data visualization expert, make sure she is aligned with your organization’s specific interests or focus, because her data visu-alization model may prove incompatible with the organizational culture, daily work processes, available tools, and skill sets. It’s almost impossible, for example, to convince an Excel user to learn a few lines of code, so this cannot be an expectation.
� Technology. Almost everything you need to understand about data visual-ization can be learned and practiced in a spreadsheet, which is an everyday tool people are familiar with.
Today, business organizations are encouraged to become more efficient and effective. Improving the return on investment (ROI) of their data should be a top priority. �is is achieved by adhering to data visualization principles and best practices, and especially through a change of perspective, which has negligible costs, both in absolute financial terms and when compared to the results of past practices.
In fact, many data visualization best practices are no different from the rules of etique�e. A set of rules that is merely a ritualization of common sense is easy to understand, but must be internalized and practiced.
In short, data visualization in an organizational context has unique characteristics that must be identified and respected. �e display of business data is not art, nor is it an image to a�ract a�ention in a newspaper, or a moment of leisure between
� INTRODUCTION xvii

more serious tasks. Business visualization is first and foremost an effective way to discover and communicate complex information, taking advantage of the noblest of our senses, sight, to support the organization’s mission and goals.
Data Visualization for the MassesI write a blog about data visualization (excelcharts.com), and over the years I have o�en been tempted to move away from the worksheet and devote myself to true visualization tools. �is would be the normal path. But the spreadsheet is the only tool that the vast majority of us have access to in an organizational context, and ge�ing data visualization to the average person must start from this contingency if we want to encourage learning and increase graphical literacy. �en, at some later point, people and organizations will assess whether the tool adequately satisfies their needs and can then make a natural and demanding transition to other applications. Or not.
�is is therefore a book about data visualization for the masses—that is, for those who, with the support of a spreadsheet, use visual representations of data as an analytical and communications tool: students in their academic work, sellers in their sales analysis, product managers in planning their budgets, and managers in their performance assessments.
The Labor MarketTaking into account the economic circumstances of today, is it justified to invest in statistics, data analysis, and data visualization skills? As I mentioned, with the exception of a scenario of global catastrophe, it’s difficult to imagine a future that does not involve an increase in the volume of data and the need to use it. In fact, these skills are becoming central to the vast universe of what we call “knowledge workers.” Compared to other skills, these skills cut across more areas of activity, ensuring some competitive advantages in the labor market within the expected social, economic, and technological trends.
A study¹ by consultants McKinsey & Company on “Big Data” estimates that in 2018, in the United States alone, there will be a shortage of up to 190,000 people with high analytical skills, and a shortage of about 1.5 million managers and analysts with analytical skills to use data in the process of decision-making.
1 McKinsey & Company. Big data: �e next frontier for innovation, competition, and productivity. 2011.
DATA AT WORKxviii

It’s wise to read these reports with some skepticism, of course, considering their unknown agendas. Nevertheless, this study indicates the need for qualified human resources in this area, of which data visualization is an essential part.
My View of Data VisualizationI have on my desk a report that includes hundreds of charts, all of which are inefficient, ugly, and useless. �ere isn’t a single chart I am proud of. And, yes, it was I who made them, many years ago, as one of my first professional tasks. Even more embarrassing is that I remember the report’s commercial success.
I had not yet realized it, but working with data would become as normal for me as breathing. I didn’t pay much a�ention to it at the time, until one day I stumbled upon a book: �e Visual Display of Quantitative Information, by a certain Edward Tu�e. For me, this was the Book of Revelation. In it, I discovered data visualiza-tion as a concept and as a field of study, and it was love at first sight.
Over the years, I realized that there are no universal rules and goals in this field. Subjectivity, personal aesthetic sensibilities, the task at hand, the profile of skills and interests, the audience—these all conspire to minimize things that we take for granted, such as the importance of effectiveness in the transmission of the message.
Within this relativism, the easy answer is to accept that anything goes. �roughout this book, you’ll see examples of dead ends where this path sometimes takes us. But if we accept that there is no one-size-fits-all perspective, and that there are no universal rules, we still must seek a coherent theory for each group of prac-titioners and consumers.
My view of data visualization is an exercise in everyday normality: Simply give the eyes what they need to see, so that the visualization goals are met at minimal cost, in the same natural way we use vision to check whether we can cross a roadway.
To take advantage of vision, we must understand that there is no difference in nature between the physical landscape around us and the graphical landscape we create on a screen or on a sheet of paper.
Organization of the Book�is book follows a narrow path between theory that’s too abstract to be useful for everyday tasks and practice that’s too focused on a concrete task to help us understand the general rules. I tried to follow this path in every chapter, showing
� INTRODUCTION xix

how theory applies in each example and how the specific task always has a theo-retical framework that explains, justifies, and generalizes it. It’s important to understand why, not just how.
To begin to understand data visualization, the first part of this book describes the context in which the action takes place: the characteristics of the human senses, the objects we use when making charts, the role of perception, how knowledge is acquired, and the many ways of defining data visualization.
In the second part of the book, we’ll recognize that a chart is a visual argument, an answer to a question, and that the quality of this answer begins with the chart type you choose. �en, we’ll format the chart. You’ll see that the best chart for-ma�ing serves the content and is not distinguished from it, praising its qualities and reducing its flaws.
�roughout the book, we’ll analyze data visualization in an organizational con-text, including good practices in data management, the Excel chart library, how to avoid bad so�ware defaults, and how to use application flexibility to go beyond what the Excel library seems to offer.
The Limits of This BookI wrote this book with a particular reader profile in mind: those who are not paid professionally for their aesthetic talents and artistic skills.
You might find this problematic, because designing a chart seems to require these skills. But I totally reject that. You need not be artistically talented to create effective charts.
I believe in increasing graphical literacy, and for that to happen we can help build a safety net of basic criteria for producing effective visual representations. I believe this will be useful at the professional level and will also contribute (marginally) to a more critical citizenship.
�is book focuses on identifying the basic principles of data visualization for an organizational environment, as performed by individuals who have certain skills and who use a very specific tool: the spreadsheet. �e intersection of these factors defines the main limits of this book:
� Major visualization types. In the first chapter, you’ll see data visualiza-tion classified into three major groups: charts (we define “charts” in the first chapter), networks, and maps. Although they have some common principles, networks and maps are excluded from this book because they have a specific vocabulary that must be addressed in the proper context.
DATA AT WORKxx

� �e chart. A chart is just one part of the information communication within an organization, just like a single paragraph of a story. Since this is an introductory book, there will be a balance between this concept of the “graphical landscape” and the idea of a chart as the minimum unit of data visualization.
� Excel. �e spreadsheet so�ware I use now is Excel 2016, with which I made all the charts for this book. When it was necessary to refer to application features and capabilities, I tried to be as generic as possible in order to include other versions of Excel and even other spreadsheet programs.
� Chart types. Due to its flexibility, Excel allows us to go beyond its library. �roughout this book, you’ll find many examples of this flexibility. But there are hard limits (charts that Excel just can’t do) and so� limits (charts that would be so difficult to create and with such a low cost–benefit ratio that in practice we should not a�empt to use them regularly). For Excel, networks and maps represent such exceptions.
� Not a manual. Although wri�en with Excel users in mind, this book is not a manual of techniques, tips, and tricks.
� No retouching. It’s important for me to ensure that the charts you’ll find in this book are true to the original made in Excel, so they have not been retouched by additional so�ware, even in the management of text elements, in which Excel is especially limited. However, for inclusion in the book with the highest possible quality, the charts were exported to PDF, which led to some minor changes that I have tried to minimize.
�ere’s also a practical limitation regarding the data. I wanted to use real data, not some fake business indicators, but this poses problems of confidentiality and limited interest. To circumvent that, I used official statistics as a proxy for business data. Except for a few specialized contexts, we can use the same methodology and chart types. Both are in deep need of a more effective approach.
Break the Rules!Data visualization is not a science; it is a crossroads at which certain scientific knowledge is used to justify and frame subjective choices. �is doesn’t mean that rules don’t count. Rules exist and are effective when applied within the context for which they were designed.
You’ll find many rules in this book—so many rules that the temptation to break them (intelligently) may be overwhelming. If this is your case, congratulations,
� INTRODUCTION xxi

that’s the spirit. I myself could not resist and tried to test the limits and possible alternatives. I invite you to do the same.
Companion WebsiteAs I said, this book is not a manual. It will not teach you how to make a chart in Excel. You won’t find even a single formula.
�at’s why we set up a comprehensive companion website for the book:
� dataatworkbook.com
On the website, you’ll find:
� All the relevant original charts in Excel files that you can download and play with. I’ve also included brief comments for each chart to help you learn how to make them. When you see the icon, it means that the chart is available to download.
� Links to the original data sources and, when possible, a dynamic bookmark to the most recent data.
� Links to other content referenced in the book. You’ll find icons sprinkled throughout the book that invite you to read a relevant paper, watch a video, go to a web page, and so on. When you see this icon , it means that you’ll find a link on the companion website.
I welcome your comments, suggestions, and change requests. I ask you to add them liberally on the website for the benefit of all.
I’ll try to be aware of comments and suggestions made on social media and con-sumer reviews on major online book retailers and address them on the book’s website, if needed.
Over time, I’ll add original charts not published in the book as well as additional resources, so be sure to check in o�en.
You can find me on most social media, but I confess that Twi�er is the only service I use regularly. I will tweet about new content, so if you follow me (@camoesjo) you won’t miss it!
DATA AT WORKxxii

Exports and imports by Member States of the EU/third countries - Current prices [namq_exi_c]
Last update ##Extracted on ##Source of data Eurostat
Exports of goods and servicesS_ADJ Seasonally adjusted and adjusted data by working daysUNIT Percentage of GDPINDIC_NA
EXPORTAÇÕES DE BENS E SERVIÇOS POR PAÍSEm percentagem do Produto Interno Bruto
trimestre
País 1 2 3 4 1 2 3 4 1 2 3 4 1 2 3 4 1 2 3 4 1 2 3 4 1 2 3 4 1 2 3 4 1 2 3 4 1 2 3 4 1 2 3 4 1 2 3 4 1 2 3 4 1 2 3 4 1 2França 27.7 28.6 29.1 29.8 29.5 28.5 28.4 27.3 27.5 27.9 27.6 27.1 26.5 25.7 25.7 26.0 25.9 26.0 26.1 26.3 25.9 26.1 26.5 26.8 27.2 27.3 26.7 26.9 26.8 27.0 26.9 26.8 27.7 27.4 27.3 25.7 23.9 23.8 23.8 23.9 24.9 25.6 25.9 26.4 27.1 27.5 27.5 27.9 27.7 27.8 27.9 27.8 27.7 28.2 28.0 28.2 28.1 28.1
Itália 26.1 26.1 27.5 27.7 27.2 27.6 26.6 26.0 25.6 25.5 25.4 25.4 24.9 24.1 24.2 24.7 24.6 25.1 25.4 25.2 25.3 25.7 26.2 26.4 27.0 27.5 27.6 28.8 28.8 28.8 28.8 29.0 29.6 28.8 28.5 26.8 23.5 23.2 23.8 24.2 25.0 26.2 26.9 27.8 28.4 28.7 29.1 29.4 30.0 30.0 30.5 30.5 30.1 30.3 30.5 30.7 30.5 30.6
Espanha 28.0 28.9 29.2 30.0 29.5 28.7 28.5 27.5 27.4 27.6 27.2 27.2 26.9 26.3 26.1 26.0 26.1 26.0 25.7 26.0 25.1 26.1 25.7 25.8 26.3 26.2 26.0 26.7 27.0 26.7 27.5 26.4 26.7 27.0 27.4 24.9 23.0 23.6 24.5 24.7 25.6 27.2 27.9 28.7 30.3 30.4 31.3 31.4 31.4 31.6 33.5 34.1 32.7 34.8 34.4 34.6 34.2 34.7
Reino Unido 26.0 27.2 27.2 28.7 28.6 27.6 25.9 25.7 25.7 26.6 26.2 25.0 26.3 25.4 25.2 25.1 24.7 24.8 25.3 26.0 25.3 26.2 27.0 27.9 30.3 31.5 26.9 26.3 26.2 26.7 26.8 26.9 27.6 30.0 30.3 29.7 28.5 27.9 28.1 29.0 29.1 30.5 30.0 30.9 32.5 31.5 31.7 32.6 31.9 31.5 32.1 31.6 31.2 31.8 30.4 : : :
Portugal 28.6 28.2 29.0 29.9 29.0 28.5 27.4 27.4 27.2 27.7 27.7 27.7 28.1 27.2 27.6 27.6 27.8 28.4 27.8 28.2 26.9 27.4 28.1 28.3 29.8 30.7 31.5 31.7 31.9 32.1 32.4 32.4 33.4 33.1 33.2 30.1 26.8 27.4 28.7 29.2 29.4 31.0 32.0 32.8 33.7 35.5 36.3 37.1 38.0 38.6 39.0 39.1 39.8 41.2 40.9 : : :
Grécia 23.5 24.8 24.9 26.3 25.5 24.7 22.9 23.1 20.8 21.6 21.5 20.4 20.0 20.0 19.7 20.3 21.9 22.3 22.4 22.8 22.4 21.8 23.0 22.6 22.5 22.8 22.5 22.1 21.8 22.1 22.9 23.7 23.9 23.7 23.1 23.0 99.6 98.3 91.8 93.9 91.2 20.3 20.7 23.3 21.8 31.0 32.0 32.8 33.7 35.5 36.3 37.1 40.0 40.0 39.0 39.1 39.8 :
Roménia 29.8 31.5 34.1 35.6 34.8 33.9 34.2 30.9 32.7 35.1 37.4 36.9 35.5 34.5 35.5 35.0 36.3 37.1 37.0 34.8 33.0 33.2 34.1 33.2 33.5 33.2 32.5 31.5 30.8 29.2 28.6 30.3 30.8 32.2 30.7 29.2 29.6 29.8 31.9 31.3 30.1 34.9 36.7 39.3 39.4 38.8 40.5 41.3 39.2 40.0 39.9 41.4 40.1 41.5 43.2 : : :
Finlândia 41.7 42.8 44.9 44.9 42.9 41.4 40.5 41.3 40.0 40.8 40.8 40.6 39.4 39.5 38.5 37.5 40.4 38.8 40.0 40.4 41.4 40.5 42.5 42.7 44.5 46.2 45.2 46.2 44.8 46.3 47.2 45.1 47.1 49.2 47.2 43.9 37.2 36.4 35.5 40.5 35.8 40.4 40.6 44.5 41.9 40.5 40.6 41.0 40.9 40.8 40.5 40.2 40.0 39.1 39.3 39.1 38.0 :
Noruega 44.1 45.6 47.3 48.7 47.4 46.3 45.8 43.3 41.7 42.6 40.4 40.1 40.1 40.3 39.4 41.9 41.8 41.7 42.1 41.8 42.5 43.8 44.7 45.2 46.0 45.3 45.3 45.0 43.9 44.0 43.8 45.0 46.0 48.3 47.0 45.4 40.1 39.2 40.3 40.6 40.3 40.3 40.0 41.4 41.7 41.6 42.6 42.0 42.1 41.6 40.2 39.8 38.0 38.9 39.5 39.2 38.8 37.2
Croácia 40.9 41.3 40.6 41.1 42.7 42.4 42.6 42.2 40.6 40.4 40.3 39.7 41.1 41.3 43.0 42.1 42.9 42.4 42.8 42.5 41.3 41.9 42.6 42.4 42.8 42.0 42.5 44.3 42.1 42.7 42.2 43.1 40.4 42.8 43.2 42.6 36.8 36.0 38.2 36.8 39.3 39.6 39.2 41.8 41.9 43.2 42.5 42.9 43.4 43.2 43.7 44.9 42.3 43.6 44.1 43.4 45.0 :
Chipre 55.1 55.9 57.2 56.1 57.1 58.0 55.9 54.9 53.6 52.7 50.6 48.0 47.0 46.5 48.6 48.0 48.9 49.1 47.9 47.6 47.1 47.6 48.8 50.8 49.5 47.6 47.8 47.6 48.5 48.0 48.0 48.3 47.3 46.7 45.3 44.1 42.2 40.7 40.5 40.0 41.3 41.1 42.1 43.3 43.6 43.4 43.4 43.8 44.1 44.2 43.0 42.7 43.8 45.1 46.2 : : :
Polónia 25.6 27.3 26.9 27.9 27.7 26.2 27.2 26.9 26.4 28.3 29.2 30.2 31.1 32.2 34.4 36.3 36.8 38.2 37.3 37.3 36.0 37.0 37.3 38.3 39.4 40.2 40.8 41.2 41.1 40.7 41.0 41.1 40.6 40.5 39.9 39.0 39.5 39.1 39.2 40.3 40.3 42.3 42.8 43.2 44.1 44.5 45.6 46.4 46.7 46.7 46.5 46.9 46.8 47.7 48.3 48.3 48.4 48.6
Suécia 44.8 45.7 47.0 48.6 47.3 46.1 46.2 45.9 45.9 45.2 43.5 43.2 44.0 43.9 43.0 43.6 44.6 46.7 45.8 46.3 46.1 47.7 49.4 49.9 51.0 50.6 50.6 52.2 51.2 51.8 52.1 52.6 55.0 53.7 53.3 52.0 49.3 47.3 47.8 47.5 47.8 49.5 50.0 50.0 49.7 49.5 50.4 49.4 49.6 49.4 48.0 47.3 46.0 45.8 45.9 45.8 46.2 46.3
Alemanha 31.6 32.6 33.5 35.9 34.8 35.0 34.6 35.1 34.8 35.8 35.9 36.5 35.7 35.3 35.8 36.3 37.1 39.0 38.5 39.0 39.8 40.8 41.7 42.6 43.8 44.9 45.5 47.9 46.4 47.1 47.4 48.2 48.5 48.6 48.8 46.5 42.4 41.4 42.3 43.5 44.9 47.5 48.2 49.3 50.3 50.2 50.8 50.8 51.6 52.3 52.3 51.4 50.6 51.0 50.4 51.2 50.6 :
Suiça 44.1 44.8 46.3 46.5 46.6 45.4 43.9 42.7 43.1 43.6 43.5 42.9 41.8 42.4 43.3 44.2 44.8 44.7 45.1 45.5 45.8 47.5 48.0 49.0 49.9 49.7 50.8 52.7 53.6 54.5 54.8 54.6 54.6 55.1 55.3 52.1 49.5 49.3 51.3 51.3 51.5 52.4 51.5 51.6 52.0 51.5 50.4 51.1 51.9 51.7 52.6 53.0 52.4 52.1 51.9 : : :
Dinamarca 43.1 45.1 48.3 49.5 49.0 48.1 46.1 45.7 47.3 47.6 46.6 47.4 46.2 45.0 45.4 44.8 44.5 46.1 45.4 45.3 46.5 48.8 50.1 50.4 52.1 51.2 51.9 53.0 52.3 51.7 52.1 52.7 54.3 56.1 55.4 53.0 48.5 47.3 47.2 47.5 49.1 50.4 51.1 51.2 54.1 53.0 53.5 54.1 54.8 55.5 54.7 54.2 55.0 54.9 54.8 54.8 54.9 54.1
Islândia 31.7 32.8 34.7 34.9 38.4 37.0 39.6 40.0 40.7 38.5 35.2 35.4 35.5 33.3 34.2 34.1 34.0 33.8 34.7 33.9 32.1 34.9 29.5 30.5 29.9 35.4 32.2 31.4 37.0 32.6 29.6 39.5 36.2 47.8 43.4 49.0 50.1 49.5 56.2 55.3 55.6 57.3 55.4 57.2 55.5 59.0 61.2 60.4 57.0 61.6 59.4 59.7 57.4 56.1 58.7 : : :
Áustria 44.5 45.7 46.9 47.9 48.2 48.2 48.1 48.1 48.5 48.6 48.4 48.4 48.3 47.5 48.1 49.1 50.1 51.1 51.6 52.2 53.0 53.5 54.1 54.6 55.5 56.1 57.0 57.8 58.3 58.7 59.2 59.9 60.3 59.8 58.9 55.9 51.9 49.7 49.7 50.6 52.4 54.0 54.8 55.4 56.7 56.9 57.5 57.7 57.3 57.3 57.6 57.4 57.3 57.3 57.5 57.6 57.6 57.6
Letónia 42.3 41.9 41.7 42.7 44.7 43.1 41.4 40.7 41.3 41.9 42.3 40.7 42.4 42.6 42.3 42.3 40.9 43.4 45.2 47.1 48.3 48.9 48.3 48.6 47.3 46.3 44.7 43.4 44.5 42.4 41.6 42.2 42.3 42.5 44.6 42.4 40.4 41.1 45.6 48.9 48.9 52.6 55.9 57.1 58.8 59.4 59.2 59.4 60.1 60.6 62.6 63.0 61.3 59.8 58.5 60.0 59.9 :
Bulgária 49.0 48.5 48.8 54.2 51.4 48.2 47.6 45.1 46.2 46.9 47.6 46.0 50.4 48.2 47.9 45.7 48.9 50.3 52.6 52.4 37.5 40.0 42.3 38.8 60.8 62.6 59.4 59.7 56.1 60.0 58.0 60.4 62.6 62.1 56.5 50.4 46.2 43.7 47.6 50.3 51.1 55.5 59.5 58.6 65.9 62.8 63.5 69.8 65.2 66.5 63.7 68.1 70.3 68.4 68.1 71.1 69.3 69.0
Eslovénia 51.1 53.3 54.4 56.4 56.5 55.7 55.3 53.6 54.8 55.6 55.6 54.8 53.7 53.4 54.0 54.3 55.4 57.4 58.9 59.0 59.2 60.9 63.7 64.5 65.1 65.9 66.6 68.7 69.7 69.9 70.2 68.8 70.7 69.5 68.1 64.0 58.1 58.2 59.1 61.1 62.9 65.7 68.2 68.9 71.4 72.5 73.3 74.5 74.4 76.1 77.0 78.2 78.6 77.7 78.3 78.6 79.0 :
Lituânia 42.9 42.9 46.3 45.3 48.8 51.1 50.7 48.6 51.3 53.7 51.1 54.2 54.1 48.2 49.7 51.8 47.2 50.2 52.3 55.0 55.7 54.1 57.0 62.9 60.5 61.5 57.0 57.8 54.2 55.8 55.2 51.0 56.8 62.0 62.6 54.5 51.8 51.3 55.9 58.7 59.8 66.5 69.4 74.4 76.6 77.8 77.8 77.8 75.7 79.1 87.3 91.4 91.8 84.2 85.4 87.8 81.1 82.9
Rep. Checa 57.7 59.8 61.6 64.7 64.8 62.4 62.3 61.3 60.6 57.4 55.4 57.3 59.7 57.7 58.3 60.6 57.8 65.6 64.7 62.9 60.8 63.7 66.1 66.7 67.4 65.9 66.3 68.6 67.7 68.1 68.4 68.9 67.8 66.5 62.7 60.5 57.9 57.8 59.3 61.1 62.8 65.8 68.1 69.3 72.4 71.9 72.9 74.0 79.0 77.4 78.8 76.9 77.3 78.3 79.1 79.6 86.3 84.5
Bélgica 75.3 77.4 79.2 80.4 79.8 78.3 77.1 76.2 77.0 77.4 76.7 75.8 75.0 73.8 73.0 74.0 73.7 75.8 76.3 77.9 77.9 78.3 78.6 79.8 80.8 80.8 80.9 80.5 81.2 82.2 83.3 83.4 84.5 87.1 87.6 78.4 72.7 72.7 74.2 75.2 76.8 79.2 81.0 82.1 84.9 85.2 85.7 84.0 85.7 86.3 86.9 85.7 84.4 85.8 86.7 86.5 84.6 86.5
Holanda 67.0 69.0 70.6 73.3 69.5 68.0 66.6 64.7 64.2 64.2 63.9 64.0 64.6 61.7 62.3 63.1 63.7 65.8 67.6 68.6 68.4 68.9 70.1 70.9 72.2 72.7 72.8 73.3 73.1 73.8 74.1 75.5 77.3 77.2 77.9 72.6 67.4 66.8 68.9 71.1 75.6 78.1 79.8 81.2 82.4 83.3 84.3 85.2 86.4 88.0 88.6 89.0 88.4 88.5 88.2 87.8 88.2 :
Estónia 81.7 82.2 85.8 87.9 91.0 83.6 72.3 73.2 70.2 72.9 70.3 70.2 66.8 68.9 70.1 70.7 71.4 72.6 74.6 73.4 76.6 75.8 78.4 79.6 73.6 74.9 72.9 69.7 68.0 68.5 65.1 66.8 70.4 69.9 72.5 71.3 61.1 61.8 65.7 66.9 68.5 74.9 79.7 86.3 84.7 85.4 91.2 87.6 91.8 88.6 90.5 89.8 89.8 90.0 86.1 85.1 86.4 86.7
Eslováquia 67.2 69.1 71.2 73.9 74.6 72.8 72.8 70.8 68.7 71.0 73.3 71.3 73.9 73.9 78.0 77.4 73.4 78.8 73.0 73.1 72.9 75.1 77.0 79.7 81.1 81.5 87.1 87.8 87.9 85.5 86.3 87.7 90.0 85.6 82.7 75.6 68.0 68.0 70.9 75.3 75.3 78.8 80.6 86.6 91.6 88.4 87.4 90.8 96.1 95.9 97.3 97.1 96.6 98.4 96.0 99.5 99.5 96.0
Hungria 70.6 72.9 74.4 79.3 76.2 72.1 69.2 68.9 65.1 66.1 61.7 58.8 59.8 59.5 62.4 62.5 63.9 62.9 62.8 63.8 63.5 66.7 65.6 67.5 73.7 75.9 78.5 80.8 79.2 79.4 82.3 82.3 85.1 82.5 79.9 78.8 77.1 76.7 77.1 77.9 78.2 83.8 88.3 88.4 90.5 88.0 90.1 96.2 97.1 96.5 93.2 91.1 94.7 95.4 96.6 95.6 96.4 96.8
Malta 90.2 89.0 90.5 85.2 84.6 79.8 76.2 77.0 77.3 80.2 81.6 81.9 78.6 77.1 78.7 75.8 77.9 77.8 75.9 74.4 74.1 73.7 75.2 77.4 84.5 85.1 89.5 94.5 89.4 94.9 92.2 92.7 95.1 89.7 89.9 90.3 80.3 82.1 83.5 83.4 86.1 91.1 93.1 91.7 94.9 96.7 94.9 102.0 99.7 104.2 100.7 99.6 98.3 91.8 93.9 91.2 90.4 89.2
Irelanda 92.2 95.7 99.2 102.4 102.7 100.1 98.4 97.4 101.1 97.8 91.4 85.5 84.2 82.6 83.9 82.5 84.8 84.0 83.6 81.4 80.6 80.6 82.5 81.6 79.4 80.1 78.6 78.8 79.0 79.8 82.4 80.4 81.3 82.3 82.9 87.2 89.5 90.3 89.8 91.6 94.4 98.5 102.1 104.9 102.0 101.7 103.1 104.2 106.5 106.8 109.2 108.9 104.1 109.8 106.7 : : :
Luxemburgo 147.2 150.4 151.4 151.2 148.8 151.3 146.9 140.0 146.3 142.4 138.9 135.3 134.9 133.6 138.5 141.1 150.1 151.4 151.7 156.1 149.9 151.5 156.9 164.5 167.7 171.3 169.0 171.4 172.6 174.5 176.3 180.0 184.1 189.1 185.1 168.7 159.1 156.6 160.6 171.3 166.2 172.3 169.5 175.0 178.9 181.2 177.9 175.7 176.8 176.9 178.5 177.2 174.2 175.0 174.0 179.7 175.3 :
5.0 <10 15.0 25.0 35.0 45.0 55.0 65.0 75.0 85.0 105.0
Fonte: Eurostat
20052000 2001 2002 2003 2004
60-70 70-80
2006 2007 2008 2009
10-20 20-30 30-40 40-50 50-60 80-90 >90
2012 2013 2014210 2011
18.5 18.9 19.3 19 19.6
33.2 30.1 26.8
29.6 29.8 31.9 31.3 30.1
18.5 18.9 19.3 19 19.6
30.3 29.7
33.2 30.1 26.8 27.4
18.5 18.9
26.8
18.5 18.9
26.8
79
4
DATA PREPARATION
Jacques Bertin defines his semiology of graphics as a “visual tran-scription of a data table.” In a perfect world, this table materializes in front of us when we need it, ready to use. In everyday reality, however, things involve more sweat and less magic. People coined the expression “data janitor” for a reason.
In a data visualization project, data extraction costs and data prepa-ration are o�en overlooked, either by management that doesn’t understand the level of detail required or by data analysts making overly optimistic assumptions. �is translates into many hours of data cleansing that most people don’t see. If not taken into account, these labor-intensive tasks can consume several times the resources available for a project, whether it’s a simple chart for an upcoming meeting or an organization-wide project.

DATA AT WORK80
Brilliant visualizations cannot redeem bad data, either in content or in struc-ture. Many spreadsheet users are not familiar with well-structured data, and that’s one more reason to discuss data preparation.
We can summarize all preparation work on the data table, regarding both structure and content, by the acronym ETL, for Extract, Transform, and Load. ETL is just as applicable to your Excel files as it is to large, formal systems.
�is chapter is not strictly about data visualization. If the tables you need actually materialize in front of you, ready to use, if you know how to structure the tables to take advantage of pivot tables, and if you organize sheets in your workbook by content type, it’s probably safe to skip this chapter. In a more sophisticated organization, most of the issues discussed here are not relevant, and most of the data comes from internal systems. However, many people still struggle with these basic issues, so if you’re in this category, read on.
Problems with the DataLet’s split data problems into two broad categories: 1) structure without content, and 2) content without structure. �e first category affects our data in particular; the second is common in data we get from other sources.
Structure without Content
Even if you’ve never seen a table for which multiple users can enter data (such as a table for telemarketing operators), you can imagine how much garbage data is collected: incomplete ZIP codes, multiple abbreviations for the same entity, misspellings, logical inconsistencies…you name it.
It’s challenging to define good data validation rules without forcing exclusions: What happens when a few ZIP codes are missing from a lookup table? Suppose, though, that you can maintain a table with a minimum number of errors. Figure 4.1 represents an example of such a table. To make things more interesting, try linking this table to a second table containing other personal data (Figure 4.2). First, you’ll have to split the field Name into Name and Surname, to be able to join both tables. Now, is John Doe in the first table the same person referred to as John F. Doe in the second table? �e solution in these cases is to have common fields in both tables that are not subject to different interpretations (social security or driver’s license numbers are good candidates). If there are no safe common fields,

4 � DATA PREPARATION 81
you’ll need to allocate additional resources to determine whether it’s the same person. Multiply this process by thousands of records and you have a problem on your hands that, if not anticipated, would generate serious time and resource management issues.
A few other special cases also belong to the category of structure without content. One of the most common is a break in a time series, whereby you still get the same measure (an unemployment rate, for example), but changes in methodologies, concepts, technologies, or regional administrative boundaries make comparisons meaningless. Or, at least, comparisons must be carried out with extra care—the same care you should use when comparing countries that use different ways of measuring the same reality. For example, infant mortality rate depends on how a country defines “live birth.” Because the definition is not the same across coun-tries, this may affect country rankings in international comparisons.¹
Content without Structure
Suppose you’re a data provider, perhaps at the U.S. Census Bureau or at a small public relations company. �e moment you release the data, you cease control-ling it. You don’t know how people will read and reuse the data. �ey may want to cross-check it if they suspect that the data is not telling the whole story. Or they will misunderstand the concepts. Whatever they do, first they must have access to the data in a format they can use.
Providers o�en make it hard to use the data beyond the format in which they released it; they’re o�en unaware of this issue or focus on the end user and forget the data professional, who probably needs a more specific format.
1 MacDorman, Marian F. and Ma�hews, T.J. “Behind International Rankings of Infant Mortality: How the United States Compares with Europe.” NCHS Data Brief, No. 23, November 2009.
ID Name Surname Address City Zip Code State1000 John Doe S Main St Torrington CT 06790 Connecticut1001 Mary Poppins SW 11th St Lowton OK 73501 Oklahoma
ID Name Gender Age Height Weight Marital Status Children Occupation1001 Mary T. Poppins Female 34 5.38 182 Married 4 Librarian1000 John F. Doe Male 82 6.17 138 Widower 2 Retired
Figure 4.1 A table with names and addresses.
Figure 4.2 A table with socio-demographic characteristics. To get a better feel for structure without content, imagine that there are many more rows (records) and many entry errors in them.
Go to the web page

DATA AT WORK82
Data providers should then ask themselves two simple questions: How many data reuse issues are we causing by releasing the data in this format? Is this reuse friction level acceptable for our data dissemination goals?² Typical answers are, respectively, “a lot” and “no.” �e end result is that data reuse friction levels can range from none (rare), to mildly annoying, to a source of a barrage of unprint-able curses.
Let me give you an unfair example. Suppose you want to know the military budget as a percentage of GDP in each country. �ere are several sources, but you could start with the CIA’s website publication �e World Factbook. Country profiles in the Factbook contain several sections and subsections.
Figure 4.3 displays the Military section for the United Kingdom. You can manu-ally open this section and copy the data you need for each country, or you could use a scraping tool that automates the process. If you’re unable to automate the process, you’ll have a few long and boring days ahead of you. Because the data are not displayed the way you need it, time and resource costs will increase since you’ll have to structure it first.
2 I’m not implying they do it on purpose; they may not be able to reduce friction due to technological reasons.
Go to the web page
Figure 4.3 UK Military data in the The World Factbook from the CIA.

4 � DATA PREPARATION 83
I said this is an unfair example because the Factbook actually allows us to jump between the country profile level and the list level. At the bo�om of the page on the website, you’ll see “country comparison to the world: 28.” If you click the number 28, you’ll get a list of all countries sorted by military expenditures as a percentage of GDP. �en you can choose a country from that list and return to the profile view. �is nice feature is still quite rare, unfortunately.
�ese two broad categories of structure without content and content without structure try to make sense of the variety of issues when using data presented in an unfriendly format. Hadley Wickham brilliantly captured the difference between well-structured and poorly structured data in an excellent article³ in which he quotes the first paragraph of Leo Tolstoy’s Anna Karenina: “Happy fami-lies are all alike; every unhappy family is unhappy in its own way.” �e “happy family” dataset is structured according to some rules that make it similar to other “happy families,” while there is a virtually infinite number of ways to create an unhappy dataset.
What Does “Well-Structured Data” Mean, Anyway?�e acronym GIGO (garbage in, garbage out) summarizes the issues we deal with every day: Results and insights depend on data quality. We can handle data critically (being aware of the “garbage” and factoring it in to the evaluation of results) or uncritically (“if the data has been subject to extensive processing by the computer, it can’t be wrong”).
Data integrity becomes essential when the volume of data increases and we need to update, filter, and aggregate it, and use data as a basis for derivative calcula-tions. A clean, consistent, and well-structured table means lower update and maintenance costs and more flexibility to multiply the perspectives from which we can analyze the data.
�is may not be good news for the user accustomed to the loose spreadsheet environment, where storage, presentation, intermediate calculations, and parameters o�en share the same sheet. Let’s start untangling this mess with a concrete example.
3 Wickham, Hadley. “Tidy Data.” Journal of Statistical So�ware, Vol. 59, No. 10, August 2014.

DATA AT WORK84
�e first step toward improving data structures is understanding that storing data and presenting data are two very different things. You should never use storage and presentation features together in a single worksheet. Share your source table if requested, of course, but otherwise bury it deep down in a data-only sheet. If you have a well-structured table, you’ll never have to touch it again, except when using a client like a pivot table or when adding a variable. In Excel, tables are for storing data, and pivot tables are for analyzing and presenting data.
A Helping Hand: Pivot Tables
Ah, pivot tables! Pivot tables are great at many levels. �ey can even serve as a litmus test for checking how well a table is structured. If every single cross-tabulation is done easily and you don’t have to change the pivot table following an update, you can be reasonably sure that you have a well-structured table.
Figure 4.4 shows a sample of one of the output formats for the Consumer Expenditure Survey. Assuming we know the meaning of the Series ID, this is the typical manner of presenting the data, with time periods in columns and entities in rows.
Figure 4.4 Sample output from the Consumer Expenditure Survey (Bureau of Labor Statistics).
�ink of the table as a cross tabulation (Series ID × Year) that must be uncrossed so that we can use it. Unlike other output formats from the Bureau of Labor Statistics, you can get all the data you need in a single table, and it’s very easy to reverse it to the right format, resulting in the table you see in Figure 4.5.
Go to the web page

4 � DATA PREPARATION 85
Series ID contains multiple variables, so we must parse it and look for the descrip-tive text for each code. Figure 4.6 shows how the final table will look.
Series ID Year ValueCXU080110LB0101M 1984 35CXU080110LB0101M 1985 30CXU080110LB0101M 1986 30CXU080110LB0101M 1987 28CXU080110LB0101M 1988 28CXU080110LB0101M 1989 33CXU080110LB0101M 1990 30CXU080110LB0101M 1991 31CXU080110LB0101M 1992 28CXU080110LB0101M 1993 30
Figure 4.5 Un-pivoting the data table.
Category Item Quintile Year ValueFood Total Eggs Lowest 20 2012 39Food Total Eggs Lowest 20 2013 40Food Total Eggs Second 20 2012 47Food Total Eggs Second 20 2013 52Food Total Eggs Third 20 2012 49Food Total Eggs Third 20 2013 56Food Total Eggs Fourth 20 2012 59Food Total Eggs Fourth 20 2013 59Food Total Eggs Highest 20 2012 71Food Total Eggs Highest 20 2013 76
Creating dynamic charts in Excel requires knowledge of advanced formulas, but o�en we only need them because the data table is not properly structured. Figure 4.7 shows a simple dynamic chart (not a pivot chart) that you can create without a single formula. It displays the proportion of food expenditure away from home, over the years, for the selected income quintile. Select a different quintile and the chart will update.
From Figure 4.6 we can see that a well-structured table is essentially a list of observations and their characteristics (category and item, income quintile, and time) and the associated measure (expenditure). In a pivot table, measures are usually placed in the Values area, while characteristics go into the Rows, Columns, or Filters areas.
Figure 4.6 A few rows of the final data table.

DATA AT WORK86
In a well-structured table that can be easily used as a pivot table source, the content of each column must be understood as a group (years, quintiles), and the values in each measure should be comparable (expenditure in dollars in a column and expenditure units in a second column).
Reality can get more complicated, and so will the structure. Suppose you get expenditure by gender. Ideally, you’d add a new column (“Gender”) with two values (Male, Female). But if they are averages instead of totals, you can’t aggregate them, and, in this case, you have to add them as measures.
Extracting the DataYou successfully complete the first stage in the ETL process when you access a file that you can edit and manipulate. When you get a text file, you may need to open it in a text editor (such as the free Notepad++ for Windows) to solve multiple small issues with Search and Replace. Do your computer’s regional se�ings and the text share the same symbols for decimal places and thousands separators? (Some may use periods while others use commas.) Are there any strange char-acters? Can they be removed?
Extraction can be a very long and rocky journey, so let’s start with a smooth ex-ample first, again from the Bureau of Labor Statistics. I’m looking for the monthly unemployment rate, at the state level, for a period of several years. Figure 4.8 shows a sample of the output. �ere are several output options, including an Excel file, but for now we’ll work with a tab-delimited text file. I’m ge�ing the data for each state, which means that I’ll have to consolidate them into a single table, removing all unwanted text.
Figure 4.7 A dynamic chart using a pivot table.
Category Food TotalQuintile Highest 20
Percentage Items
Year FoodFood at
homeFood away from
home1984 100% 53% 47%1985 100% 52% 48%1986 100% 51% 49%1987 100% 50% 50%1988 100% 51% 49%1989 100% 49% 51%1990 100% 49% 51%1991 100% 55% 45%1992 100% 55% 45%
40%
45%
50%
55%
60%
1984 1988 1992 1996 2000 2004 2008 2012
FOOD AWAY FROM HOME
Download the original chart

4 � DATA PREPARATION 87
Figure 4.8 Pasting data into Excel, from a web page and from a text editor.
Figure 4.8 explains why you should have a text editor between a web page and the spreadsheet. Scenario 1, on the le�, shows the result of a direct paste from the web page, while scenario 2 shows what happens when you paste to Notepad++ first: Excel recognizes the tab character and automatically parses the text.
As with the example on expenditure, we’ll have to find what the Series ID codes mean. You may want to split the Series ID codes into multiple columns using the Text to Column function in Excel. Also, create a real date from the Year and Period columns.
When extracting data from other public sources, you may run into some limits imposed by the organization. �e United Nations Population Division doesn’t allow you to select more than five variables or countries in each query (Figure 4.9). Other organizations impose limitations at the cell level. �e Eurostat limits each query to 750,000 cells. Depending on how high the limit is or how detailed are the data you need, you may have to run multiple queries to get all the data and then merge the results into a single file.
THE WAY YOU PASTE DATA CHANGES THE OUTPUT
Scenario 1: Direct paste from web page to Excel Scenario 2: From web page to Notepad+ and from Notepad+ to Excel
Series Id: LASST010000000000003 Series Id: LASST010000000000003
Seasonally Adjusted Seasonally AdjustedArea: Alabama Area: AlabamaArea Type: Statewide Area Type: StatewideMeasure: unemployment rate Measure: unemployment rateState/Region/Division: Alabama State/Region/Division: Alabama
Series ID Year Period Value Series ID Year Period ValueLASST010000000000003 2010 M01 11.7 LASST010000000000003 2010 M01 11.7LASST010000000000003 2010 M02 11.6 LASST010000000000003 2010 M02 11.6LASST010000000000003 2010 M03 11.3 LASST010000000000003 2010 M03 11.3LASST010000000000003 2010 M04 10.8 LASST010000000000003 2010 M04 10.8LASST010000000000003 2010 M05 10.4 LASST010000000000003 2010 M05 10.4LASST010000000000003 2010 M06 10.1 LASST010000000000003 2010 M06 10.1LASST010000000000003 2010 M07 10.0 LASST010000000000003 2010 M07 10LASST010000000000003 2010 M08 9.9 LASST010000000000003 2010 M08 9.9LASST010000000000003 2010 M09 10.0 LASST010000000000003 2010 M09 10LASST010000000000003 2010 M10 10.1 LASST010000000000003 2010 M10 10.1LASST010000000000003 2010 M11 10.2 LASST010000000000003 2010 M11 10.2LASST010000000000003 2010 M12 10.3 LASST010000000000003 2010 M12 10.3

DATA AT WORK88
Figure 4.9 Extracting data from the UN Population Division.
The PDF Plague
With more or less pain, the chance of ge�ing a text file from official statistical offices is high. Other data providers, such as professional associations, may have other, more restrictive policies regarding data dissemination.
Many years ago, I needed to get data on the various types of electricity consump-tion (high voltage, low voltage, domestic, industrial, public roads, and so on) at a very detailed regional level. �e data were available only in large sheets of paper, where someone had elegantly handwri�en all these thousands of values. It was an admirable job, almost worthy of a Charles Dickens novel. It also had an unanticipated cost, because my organization had to purchase a copy of all those sheets and hire someone to enter the data manually.
Today, no sane organization would share its data in this format. With all the technology we have in our hands, that would be ridiculous, right? Well, not so fast. Let’s abstract for a moment from the technology and focus on the goal: ge�ing a few thousand values into an editable table. Now tell me: What difference does it make if we have handwri�en numbers on a sheet of paper or a PDF file with such a twisted forma�ing that the cost of extracting the data is higher than entering them by hand? Actually, there is a difference: I found those handwrit-ten sheets only once, while I keep stumbling upon data tables in PDF files, to my despair and exasperation.

4 � DATA PREPARATION 89
If you’re a data provider, you have a degree of control over your data when you share them in a PDF. You might persuade some people not to use the data in a way different than you intend. �is is not wrong if you have a strong reason to do it, but it will anger your users, even if that’s not your plan. Again, make sure that the way you share your data is aligned with your goals. In addition to presenting your data the way you want people to see it by default, provide a link to the raw data. �at way everyone is happy.
If you’re a user of internal data, you might assume that you’ll never have to ex-tract data from PDF files. But, sooner or later, you will. And there will not be a quick fix. You may be able to open simple and well-behaved PDFs in Word 2013 or 2016, so there’s no harm if you try that first. If that doesn’t work, try copying the data from the PDF and pasting it into the text editor (such as Notepad++), and then from the text editor into Excel. �en you can try an additional application, such as the free tool Tabula, to extract the data into CSV or XLS files. None of the solutions will be entirely satisfactory, but the cost of editing the table should be lower than manual data entry.
“Can It Export to Excel?”
Internal business intelligence (BI) systems should allow you full control over the content you want to extract and how you want to extract it. Unfortunately, that’s not always the case. Let me paint a grim and somewhat exaggerated picture here.
First, you have to solve a communications problem. You, the business user, and the IT people apparently don’t speak the same language: �ey don’t understand why a market share above 100 percent is not possible, and you don’t understand that they must have a rule for each of your beloved exceptions. So when you get the data from IT, crosscheck it to make sure you’ve got the right data.
Second, there is a political problem. �e data you want and the way you want it may not fit into the current formal corporate policies regarding access privileges, data security, or data dissemination. You can also be caught in a power struggle between IT and other areas, and they may start dragging their feet to avoid grant-ing you access to the data.
Finally, there may be technical issues. �e eternal question “Can it export to Excel?” forced BI vendors to make this option available. A�er so many years, I think they still hate it, judging from the output files I have to deal with. If the application can export data to CSV or Excel, there’s hardly a reason to create unfriendly table structures that force the user to take additional steps to clean the data. �is means
Go to the web page

DATA AT WORK90
extra work for you, but if in every update the format is wrong but consistent, you might use a macro to correct it and solve the problem.
Cleansing DataI’ll assume that you survived the previous stage of the ETL process and you’re now the proud owner of a nice-looking table. But the smile will vanish from your face if you now find a record of a 123-year-old new mom living in a city called Cincina�i, TX.
�e second stage of ETL, transformation, deals with data manipulation, but the first transformation, data cleansing, is so important and specific that it deserves to be promoted to its own step. Data cleansing suggests, of course, that the data is dirty. Data is dirty because it contains typos or inconsistencies or fails in some way to meet a standard.
All this “dirt” must be cleansed before any serious analysis can take place, and again a pivot table can be very handy for this purpose. If you count every cat-egory in a field, you’d soon find only one reference to Cincina�i, TX, while there are many references to Cincinnati, OH. So, you’ll probably need to change that record because the city name is misspelled and associated with the wrong state. And what about the 123-year old new mom? Check the age range. She’s probably only 23. Please note the word “probably”; just because a value seems strange, that doesn’t mean it’s not real. Be sure to cross-check against a lookup table and against other fields for logical inconsistencies, and don’t forget to have a log that includes all your edits.
Transforming DataOne of the benefits of making data cleansing an autonomous step is that now transformation can focus on adapting the dataset to the goals of the analysis. If you’re using a spreadsheet, you’re now moving from the cell level to the column level where you add, remove, or change variables. Here are a few examples of possible data transformations:

4 � DATA PREPARATION 91
� Encoding: If a column includes answers to an open question (where there are no predefined answers), you must add one or more columns to categorize those answers. For example, if you asked people to name three of their preferred movie actors, you’d have to parse the answer and code every one of the names.
� Aggregation: �e level of detail may be excessive for the purposes of analysis, and we’ll need to aggregate the data at a higher level. Our 23-year-old new mom can belong to a larger category (for example, ages 20–24), or data at the daily level can hide a pa�ern that can only be spo�ed at the week level.
� Derived data: If we’re studying obesity and have weight and height data, we can calculate Body Mass Index (BMI) and add it as a new variable.
� Removal: Changes in project scope may make some of the observations irrelevant, or some variables may only be needed to calculate derived data (like BMI above). Keep in the dataset only the data you need.
� Standardization: If we need to link our new table to other tables in our system, some standardization may be needed, including changes in table structure and in labeling (for example, M/F instead of Male/Female).
Loading the Data Table�e last stage of the ETL process occurs when the data becomes usable. �is can take many forms, such as uploading the file to a system such as a new table, appending the file to an existing table such as an update, or, in Excel, simply changing the data format from a range to a table. In recent Excel versions, you can also add the file to the data model.
Data Management in ExcelIt’s hard to find a tool that, like Excel, combines power, flexibility, and ease of use for some basic tasks when compared to other similar tools. �e problem is that Excel training o�en focuses too much on the tool and leaves out task- specific aspects.
Read the blog post
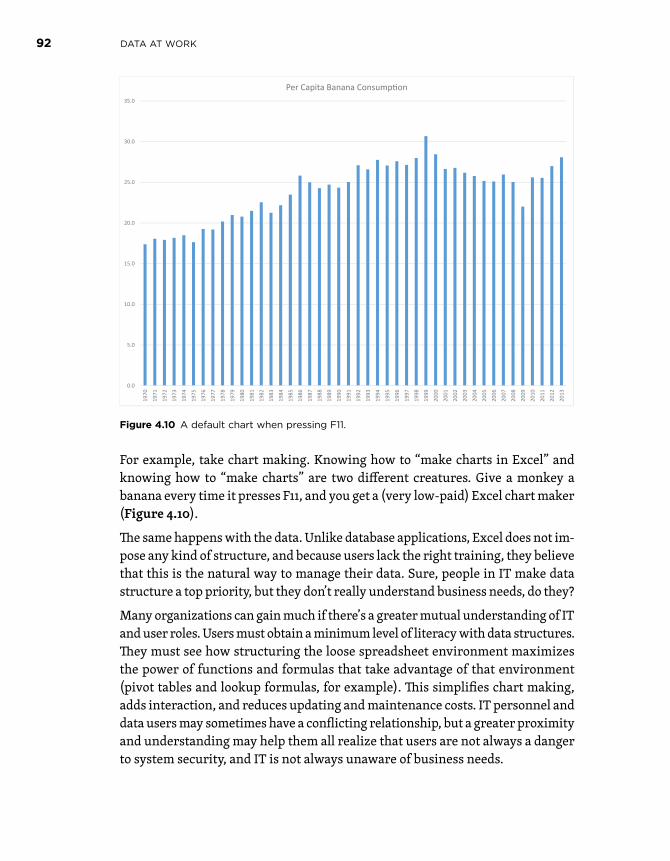
DATA AT WORK92
Figure 4.10 A default chart when pressing F11.
For example, take chart making. Knowing how to “make charts in Excel” and knowing how to “make charts” are two different creatures. Give a monkey a banana every time it presses F11, and you get a (very low-paid) Excel chart maker (Figure 4.10).
�e same happens with the data. Unlike database applications, Excel does not im-pose any kind of structure, and because users lack the right training, they believe that this is the natural way to manage their data. Sure, people in IT make data structure a top priority, but they don’t really understand business needs, do they?
Many organizations can gain much if there’s a greater mutual understanding of IT and user roles. Users must obtain a minimum level of literacy with data structures. �ey must see how structuring the loose spreadsheet environment maximizes the power of functions and formulas that take advantage of that environment (pivot tables and lookup formulas, for example). �is simplifies chart making, adds interaction, and reduces updating and maintenance costs. IT personnel and data users may sometimes have a conflicting relationship, but a greater proximity and understanding may help them all realize that users are not always a danger to system security, and IT is not always unaware of business needs.
0.0
5.0
10.0
15.0
20.0
25.0
30.0
35.0
1970
1971
1972
1973
1974
1975
1976
1977
1978
1979
1980
1981
1982
1983
1984
1985
1986
1987
1988
1989
1990
1991
1992
1993
1994
1995
1996
1997
1998
1999
2000
2001
2002
2003
2004
2005
2006
2007
2008
2009
2010
2011
2012
2013
Per Capita Banana Consumption

4 � DATA PREPARATION 93
Organizing the Workbook
�e number of worksheets in an Excel file is virtually unlimited, and, surprisingly, we can use all we want without incurring extra costs. Hence, an Excel file that has some level of complexity must be organized in a way that clearly separates the results (charts, tables), intermediate calculations, parameters, and data tables in different, specialized sheets.
Links Outside of Excel
An IT-managed BI system in an Excel-centric organization risks becoming a dual BI system in which users get the data from the formal system, but all the actual analysis is done in Excel. �is can quickly get out of control, with isolated file archipelagos in each computer, and impossible-to-reconcile data.
You can’t eradicate Excel as a BI tool unless you uninstall it. �e organization should have a be�er understanding of why users keep using Excel. If the formal BI model can’t address those needs, it should provide direct access to data in a safe and controlled manner, which again requires a closer relationship between users and IT.
�e ideal scenario is to create one or more tables that closely match the user’s needs, connected to her workbook and from where she can refresh data.
Formulas
When one of the papers that shaped recent economic policy worldwide⁴ draws conclusions based on faulty Excel formulas, and when news of millions of dollars being lost due to spreadsheet errors is common, the least we can do is to assume that a formula is a potential threat. With all other things equal, using fewer formulas makes a spreadsheet simpler to maintain, improves performance, and produces fewer errors.
Calculations with a database query are faster and errors are o�en easier to spot (you get to the needle-in-a-haystack frustration level much faster in Excel than when using database queries). You can connect your workbook to a query in an external database that performs all the calculations before feeding the data into the spreadsheet. And there are many other ways to avoid formulas, such as
4 Reinhart, Carmen M. and Kenneth S. Rogoff. “Growth in a Time of Debt.” American Economic Review: Papers and Proceedings, Vol. 100, No. 2: 573-578, 2010.

DATA AT WORK94
using pivot tables instead of aggregate formulas or using a data model instead of lookups. Array formulas and calculations in tables are also safer and faster. Finally, named ranges are your friends; use them extensively.
So, as a mantra, you should think, “Avoid Excel formulas.” �is seems to contradict the very nature of the application, but when you avoid formulas, your workbook becomes safer and more solid. Note that the point is not to turn your workbook into a formula-free zone (that’s almost impossible) but to think about be�er alter-natives. Also, you should infer from the techniques suggested above that “avoid formulas” doesn’t equal “hardcode data” (entering a value instead of a formula).
Cycles of Production and Analysis
�ere is a major difference between business visualization and media infographics.⁵ Unlike most infographics, which aren’t updated a�er they’re published, business visualizations usually include a set of representations that remain useful from cycle to cycle and cut across the organization. Charts on market share and growth are updated for each cycle. �ey are seen at various levels of regional detail and are common to the multiple markets in which the organization operates.
�ink of business charts as the three Rs of ecology:
� �ey should be reused across multiple markets.
� �ey should be recycled by updating the data.
� �eir number should be reduced, making business visualization more cost-effective at multiple levels.
�is does not cover all the data visualization needs in an organization, and you may use many charts only once, but try to evaluate whether a chart has the potential to be used more than once. If the answer is “yes,” you should evaluate whether it makes sense to spend extra resources to prepare it for repurposing (by adding interaction or creating a database query, for example).
�is is just a small part of the many things that relates to data management in Excel. If it were possible to synthesize this management in a single word, that word would be “structure.” Recent Excel versions have introduced new features that suggest more investment in the data structure (including tables, data models, Power Pivot, slicers, PowerBI, and so on). �is, in turn, allows you to manage a growing volume of data more effectively.
5 Check the work of one of my preferred designers, Adolfo Arranz, at Visualoop to make the concept of differences at several levels crystal clear.
Go to the web page
Go to the web page

4 � DATA PREPARATION 95
Takeaways � Data preparation is possibly the least thankful part of any data visualiza-
tion process because it is slow, invisible, and undervalued. If you don’t have access to a properly forma�ed table, assume that you’ll spend much more time than anticipated preparing it.
� Pivot tables can help you structure your data tables.
� Although you can paste a few numbers to make a quick chart, the data source for more permanent charts should reside outside of Excel, and preferably be connected to a database query.
� Bring data into Excel as close as possible to its final format to avoid manipu-lating data inside Excel.
� Assume that formulas are a thread to data integrity, and avoid them whenever possible.
� Structure your workbook so that each sheet has a single purpose.
�����

INDEX2D plane, 9, 11, 233D charts. See also pseudo-3D effects
grid lines in, 334maps, 238–240pie charts, 19, 21, 65, 77, 207, 337
3D effect, 223D Maps, 238–2403D pie charts, 19, 21, 65, 77, 207, 3373D spaces, 11
Aabstract concepts, 6–12Adobe Color CC color pale�e, 403aesthetics, 315–319
considerations, 313, 314described, 23design continuum, 318–319evaluation criteria, 316importance of, 313, 314overvaluing, 408vs. pragmatism, 407
aggregation, 91A.I.D.A. (A�ention, Interest, Desire,
Action), 321–326alerts, 198–199, 386analogous colors, 396, 397anchor points
considerations, 75, 232, 248importance of, 136pie charts and, 203, 204
animations, 266–269charts, 103Keynote, 266pa�ern detection with, 267PowerPoint, 266vs. small multiples, 311time periods, 266–269
annotations, 167, 339–341Anscombe, Francis, 224
Anscombe’s quartet, 223–224applications, 121arc of visual acuity, 31–32, 60area, 6art, clip, 22, 343aspect ratios, 173, 254–256, 357–358a�ention, 27, 33, 65–66A�ention, Interest, Desire, Action
(A.I.D.A.), 321–326audience
a�racting, 65–66considerations, 78literacy, 176messages, 71, 313“tragedy of the commons” and, 65–67
audience profile, 170–172availability, 152–153axes
double, 359plo�ing data along, 16–17secondary, 344–346slope charts, 194
axis folding, 69–70
Bbackgrounds, 22, 326, 347bamboo chart, 72–73, 167bandlines, 266bar charts, 180–192. See also bars
bad defaults for, 321breaks in scale, 187–189, 199chart size, 185–187color coding, 182, 183combining with strip plot, 72–73compression, 185described, 18evolution/change, 190grouped, 298–299vs. histograms, 245, 248
DATA AT WORK412

horizontal vs. vertical, 181–182labels, 181multiple series, 181–182, 298–299, 310ordering values, 182–185overview, 180population pyramids, 190–192, 267–
269, 352stacked, 18, 202, 203, 217–218
bar height, 56bars
comparing, 26, 56, 254, 298, 334considerations, 352distortions and, 56–58vs. dots, 192error, 127in histograms, 245, 248horizontal, 180, 181–182length of, 180non-aligned, 56, 203omi�ing points, 258pseudo 3D and, 359Stevens’ power law, 56–58vertical, 180, 181–182, 219Weber’s law, 56
Bertin, Jacques, 13, 111, 142, 304–306Be�er Life Index, 285Beveridge curve, 170–171BI (business intelligence) systems, 89–90bin number/width, 238, 241, 242–244bins, 241, 242–244births, monthly (project), 151–162black-and-white charts, 387–389blind spot, 30, 32“box,” 232box-and-whisker plots, 232–234, 241bubble charts
considerations, 286, 291distortion and, 56, 57–58example, 286–290lollipop charts, 127, 192–193overview, 286–287relationships, 286–290
bullet charts, 172, 197–198, 199business intelligence (BI) systems, 89–90business visualization, 112, 131
CCairo, Alberto, 116–117, 313categories
charts, 164color, 367, 373–375, 376grouping, 48, 298–299grouping/ordering data, 349, 350residual, 353
categorizing questions, 138–140chart types
3D. See 3D chartsbamboo charts, 72–73, 167bar. See bar chartsbubble. See bubble chartsbullet charts, 172, 197–198, 199combo charts, 166composition. See composition chartsconsiderations, 22data reduction charts, 167–168, 169, 351described, 23, 163donut charts, 18, 210–213fan charts, 208–309Gapminder, 287helium charts, 290, 291hierarchical charts, 212, 213–216horizon charts, 70, 299–303line. See line chartslollipop charts, 127, 192–193maps. See mapsoverview, 352panel charts, 217, 295–297Pareto charts, 218–220, 221, 235–237pie charts. See pie chartspoint comparison, 167–168, 351proportion charts, 166, 212–213, 218, 221proto-charts, 17–18, 21, 23slope charts, 194–195step charts, 259–261strip plots, 18, 72, 73, 195–196, 232sunburst charts, 213, 216task-based classification, 166–169, 176transformations, 17–18
413� INDEX

chartsaesthetics of, 23animating, 103answering questions with, 138–140, 147aspect ratio, 357–358audience profile, 170–172“bad,” 22black-and-white, 387–389categories, 164choosing, 19–21, 163–176combo, 166complex, 131components, 332–347concepts, 16–17considerations, 6, 7, 21, 22consistency, 22defined, 7dynamic, 85, 86effectiveness of. See effectivenessevaluation criteria, 316–317exaggerating differences, 356false dichotomy, 27–28“flat,” 147–148fonts. See fonts“Graphenstein,” 19vs. graphs, 7grayscale, 387–389“high-impact,” 21“hooks,” 150legends. See legendsline, 8, 18, 20low-density, 294lying/deceiving with, 355–363memorable, 66–67multiple series. See multiple series
chartsnumber of series in, 351–355overview, 7–9profile. See profilingreducing use of, 94reusing/recycling, 94seasonality and. See seasonalitysimplification, 44, 52, 329–332size, 34“spaghe�i,” 38–39, 138, 353
subjectivity in, 15vs. tables, 27–28, 76titles. See titlestransformations, 21
classes. See binsclassifications, 166–169cleansing data, 90Cleveland study, 53–56, 58, 179Cleveland, William, 53–56, 60, 254, 357clinical trials, 27clip art, 22, 343closure, law of, 50clusters, 274, 281–282Coase, Ronald, 142cognition, 25–28, 356cognitive offloading, 26cognitive style, 121color, 365–405
aesthetic quality of, 366alerts, 386analogous, 396, 397bar charts, 182, 183categorizing by, 367, 373–375, 376classical rules, 393–394complementary, 394, 395considerations, 22, 42, 367consistency, 22cool, 396diverging scales, 382–385emphasizing items via, 37, 38, 378fill, 21functional qualities of, 366functional tasks of, 372–386grouping data by, 376–377horizon charts, 299–303HSL, 368–370vs. hue, 369for identification, 376–377, 388message tone, 392overview, 365–366pie charts, 48preferences, 367pure, 371quantifying, 367–370rectangle rule, 396, 397
DATA AT WORK414

removing, 387–389RGB, 368role of gray, 387–389sequences, 378–382split complementary, 394, 395standard pale�e, 392stimuli intensity, 366, 370–372suitability to task, 366triadic, 396verbalizing, 367warm, 396
color blindness, 388, 403–404color codes, 42color coding, 182, 183, 198, 374–375color differentiation, 22color harmony, 371, 392–399color pale�es, 399–404
Adobe Color CC, 403ColorBrewer, 402considerations, 371Excel, 131, 399–401LCD-friendly, 173
color ramps, 378–382color staging, 389–391color symbolism, 68, 366, 386–387, 392color wheels, 393–394, 396, 398ColorBrewer color pale�e, 402combo charts, 166common fate, law of, 49commons, tragedy of, 65–67communications, 63, 89comparisons
absolute vs. relative, 360–362bars, 26, 56, 254, 298, 334bubble charts, 286categories, 349charts/tables, 27vs. composition, 202–204considerations, 53, 134, 178–179data points, 167–168, 199, 351dates, 195distributions, 233–234donut charts, 210fan charts, 208overview, 177–179
Pareto charts, 235–237perception and, 27sparklines, 264structure without content, 81
complementary colors, 394, 395composition, 139, 140, 201, 202–204, 221composition charts, 200–221
composition vs. comparison, 202–204considerations, 201–202, 221donut charts, 18, 210–213overview, 200–202Pareto charts, 218–220, 221, 235–237pie charts. See pie chartsstacked bar charts, 18, 217–218sunburst charts, 213, 216treemaps, 21, 213, 214–215, 216
compression, 185concepts
abstract, 6–12charts, 16–17
cones, 30–31connectivity, law of, 48–49, 52constellation naming, 44constraints, 115, 362, 410Consumer Expenditure Survey, 84content
considerations, 74, 80, 121content without structure, 81–83importance, 36–40, 60structure without content, 80–81
context, 353–354considerations, 121focus and, 137–138graphic lies, 360–362optical illusions and, 58–59organizational, 75–78overview, 353–354small multiples, 354–355
context entity, 137continuity, law of, 51–52cool colors, 396coordinate pairs, 7, 16, 23coordinate system, 4–5coordinates, 4, 7, 8, 9, 13, 16, 23Cotgreave, Andy, 192
415� INDEX
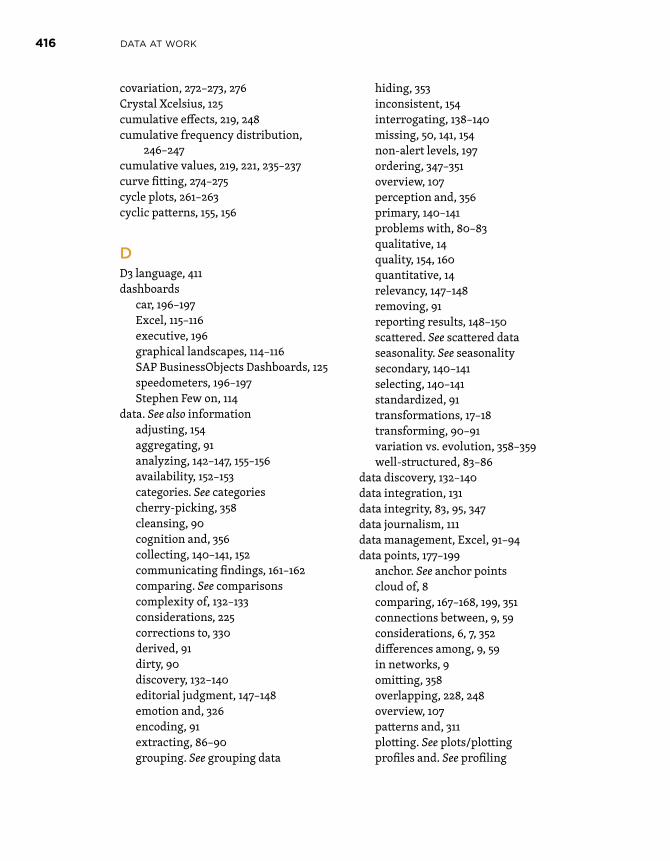
covariation, 272–273, 276Crystal Xcelsius, 125cumulative effects, 219, 248cumulative frequency distribution,
246–247cumulative values, 219, 221, 235–237curve fi�ing, 274–275cycle plots, 261–263cyclic pa�erns, 155, 156
DD3 language, 411dashboards
car, 196–197Excel, 115–116executive, 196graphical landscapes, 114–116SAP BusinessObjects Dashboards, 125speedometers, 196–197Stephen Few on, 114
data. See also informationadjusting, 154aggregating, 91analyzing, 142–147, 155–156availability, 152–153categories. See categoriescherry-picking, 358cleansing, 90cognition and, 356collecting, 140–141, 152communicating findings, 161–162comparing. See comparisonscomplexity of, 132–133considerations, 225corrections to, 330derived, 91dirty, 90discovery, 132–140editorial judgment, 147–148emotion and, 326encoding, 91extracting, 86–90grouping. See grouping data
hiding, 353inconsistent, 154interrogating, 138–140missing, 50, 141, 154non-alert levels, 197ordering, 347–351overview, 107perception and, 356primary, 140–141problems with, 80–83qualitative, 14quality, 154, 160quantitative, 14relevancy, 147–148removing, 91reporting results, 148–150sca�ered. See sca�ered dataseasonality. See seasonalitysecondary, 140–141selecting, 140–141standardized, 91transformations, 17–18transforming, 90–91variation vs. evolution, 358–359well-structured, 83–86
data discovery, 132–140data integration, 131data integrity, 83, 95, 347data journalism, 111data management, Excel, 91–94data points, 177–199
anchor. See anchor pointscloud of, 8comparing, 167–168, 199, 351connections between, 9, 59considerations, 6, 7, 352differences among, 9, 59in networks, 9omi�ing, 358overlapping, 228, 248overview, 107pa�erns and, 311plo�ing. See plots/plo�ingprofiles and. See profiling
DATA AT WORK416

reading, 97–106working with, 103–104
data preparation, 79–95data preprocessing system, 28data reduction charts, 167–168, 169, 351data sensing, 3data stories, 111–112data tables, 16, 91data types, 14, 15data validation rules, 80data visualization, 96–131
aesthetic dimension, 315–319asking questions, 138–140, 147building blocks of, 1–23business visualizations, 112, 131comparisons. See comparisonsconsiderations, 2, 407construction of knowledge, 106–109defining, 97, 110–111effectiveness of. See effectivenessevaluation criteria, 316–317in Excel, 12, 122–130familiarity with subject, 74–75figurative, 6, 11–12graphical landscapes, 111, 112, 113–119,
185graphical literacy. See graphical
literacyimpact of eye physiology on, 34–35impact of working memory on, 41–42,
60interactive, 173, 175knowledge/skills, 120–121languages, 111–112limits of, 59lying/deceiving with, 355–363outliers. See outliersoverview, 1–2, 96–97pa�erns, 97–106points. See data pointsreason vs. emotion, 409–410shapes, 97, 98, 99–103sharing, 173–175stories, 111–112
tasks, 106tools for, 411
data visualization model, 408data-driven annotations, 167dates. See also time entries
comparing, 195considerations, 22meaningful, 41representing, 69
decoration stage, 318, 319demographic indicators, 141demographics, 141, 151, 208, 338dependency ratios, 144–147depth, 23derived data, 91design
annotations, 339backgrounds, 347chart components, 332–347clip art, 343for effectiveness, 312–314exploration stages, 150fonts, 339grid lines, 342–343inconsistencies, 333legends, 346number of series, 351–355Occam’s razor, 329–332ordering data, 347–351pseudo-3D elements, 333–336reason/emotion, 321–332removing clu�er, 330sca�er plots, 279–281secondary axis, 344–346textures, 337titles, 338–339
design continuum, 318–319design skills, 120diagrams, 10dichotomy, false, 27differences, exaggerating, 356DIKW Pyramid, 107–109dimensions, 6, 393display alerts, 198–199
417� INDEX

distances, 8distortion, 56–58, 60, 318distributions, 227–231
comparing, 233–234, 248considerations, 227described, 227ji�ering, 228properties, 223questions about, 139, 140sca�ered data, 227–231shapes, 223studying, 227transparencies, 227–228z-scores, 233–234
diverging scales, 382–385�e Dollar Street project, 149donut charts, 18, 210–213dot plots, 192–193double axes, 359dual-axis charts, 344–346, 359dynamic charts, 85, 86
Eeditorial dimension, 39, 113, 212–213, 355editorial judgment, 147–148effectiveness
charts, 18–23, 408considerations, 164, 313data visualization, 18–23, 408designing for, 312–314emotion and, 328–329information producer/consumer, 326scope, 312–313
Einstein, Albert, 206electrocardiogram, 74elements. See also entities; objects
adding, 330categorizing by color, 367, 373–375, 378emphasizing by color, 378missing, 51–52pseudo-3D, 333–336
emotion, 149, 150, 321–332, 409–410encoding data, 91encoding stage, 318, 319entities, 137, 304, 307. See also elements;
objects
equivalence, 346error bars, 127, 192Escher bonus, 334Escher, M.C., 333ETL (Extract, Transform, and Load)
process, 80, 86–91evolution
vs. change, 190line charts, 251questions about, 139, 140sca�er plots, 256step charts, 259vs. variation, 358–359
Exceladvantages, 122–123alerts, 198color pale�es, 131, 399–401considerations, 122, 411data extraction, 86–87data management in, 91–94data structure, 92data visualization in, 122–130defaults, 320–321disadvantages, 123–125exporting to, 89–90formulas, 93–94links outside of, 80, 93–94, 95networks in, 12profiling in, 124, 310visualization in, 12workbooks, 80, 93–94, 95
Excel 2003, 320Excel 2007, 122Excel 2010, 122Excel 2016, 122–125Excel chart library, 7, 123–127, 164–165, 216Excel charts
considerations, 7, 92, 294, 411default, 92using, 128–130
Excel dashboards, 115–116Excel files, 80, 110, 175, 407Excel histograms, 245Excel library, 295Excel maps, 12, 238–240, 310Excel online, 175Excel visualizations, 411
DATA AT WORK418

exceptions, 139exploded slices, 21, 22, 207exporting to Excel, 89–90Extract, Transform, and Load (ETL)
process, 80, 86–91extracting data, 86–90eye movements, 32–34eye physiology, 29–35eye–brain system, 2, 3, 25, 44, 61
FFairfield, Hannah, 174false dichotomy, 27fan charts, 208–309Few, Stephen
bandlines, 266on dashboards, 114on data visualization, 110, 407on Excel 2007, 122on pie charts, 204, 205simplicity and, 23
figurative visualizations, 6, 11–12figure/ground, law of, 50–51files
Excel, 80, 110, 175, 407PDF, 88–89, 174–175sharing, 173–175
fill color, 21focus, 137–138focus entity, 137focus-plus-context approach, 137–138fonts, 22, 339forma�ing
conditional, 143, 198considerations, 160, 178titles, 339
formslaw of closure and, 50missing data, 50simplification of, 44, 52
formulas, 85, 92, 93–94frames, 22, 55frameworks, 204Freedman–Diaconis’s rule, 242functional stage, 318, 319
GGapminder chart, 287Gapminder Foundation, 149garbage in, garbage out (GIGO), 83geometric primitives, 6, 16, 17, 23geometric shapes, 6Gestalt laws, 43–53, 60GIGO (garbage in, garbage out), 83“gore” fonts, 339graph theory, 7“Graphenstein” charts, 19graphicacy, 112–113graphical illiteracy, 77, 321graphical landscapes, 111, 112, 113–119, 185graphical literacy
considerations, 112, 295described, 112emotional components, 321“epiphanies,” 112–113low, 77, 314, 321, 409overview, 71–74
graphical tables, 384–385graphics
clip art, 22, 343infographics, 313simplification, 44, 52sparklines, 263–266
graphs, 7, 8, 315, 316gray, 387–389grayscale charts, 387–389grid lines, 55–56
in 3D charts, 334overview, 342–343
grouping databy category, 349–350by color, 376–377considerations, 352sca�er plots, 281–282
grouping items. See also ordering itemsbar charts, 298–299by category, 298–299Gestalt laws, 43–53, 60“meaningful groups,” 282–283by theme, 147
groupings, 281–282
419� INDEX

Hhearing, 3Heer, Jeffrey, 300helium charts, 290, 291hierarchical charts, 212, 213–216“high-impact charts,” 21histograms, 240–245, 246, 248horizon charts, 70, 299–303HSL color model, 368–370hues, 369, 372, 373human perspective, 149
Iillusions, optical, 58–59illustrations, 12images. See also graphics
clip art, 22, 343infographics, 313simplification, 44, 52
impressionsmanagement of, 77–78quantifying, 228–229validating, 228–229
inconsistencies, 333infographics
vs. business charts, 94considerations, 116–117graphical landscapes, 111, 112, 113–119,
185increasing audience with, 313Napoleon’s troops, 117–119
information. See also dataasymmetry, 75, 170displaying most important, 114–115loss of, 222new, 17noise, 222overview, 108sharing, 173–175, 328useful vs. useless, 44, 222working memory and, 40–42, 60
information units, 41interactive visualizations, 173, 175interface design, 70, 71interquartile range, 229–230
IT roles, 92
Jjournalism, data, 107, 111journalists, 75, 314JPEG format, 175
KKanizsa’s Triangle, 58key performance indicators (KPIs),
197–198, 199Keynote animations, 266knowledge, 106–109, 120–121Kosslyn, Stephen, 30, 31KPIs (key performance indicators),
197–198, 199Krug, Steve, 70, 71
Llabels/labeling, 41, 60, 181Laffer curve, 273landscapes
drawing with coordinate system, 4–5graphical, 111, 112, 113–119, 185
languages, 111–112law of closure, 50law of common fate, 49law of connectivity, 48–49, 52law of continuity, 51–52law of figure/ground, 50–51law of proximity, 47, 52law of segregation, 48, 52law of similarity, 47–48legends
borders, 346considerations, 22, 34, 35, 41design, 346elimination of, 42overview, 346pie charts and, 22, 207replacing with labels, 60unnecessary, 68
lies/lying, 355–363
DATA AT WORK420

line chartsaspect ratios, 254–256described, 18example of, 8markers, 251, 270overview, 250–254scales, 254–256sparklines, 263–266time periods and, 250–256variables in, 256
linear scale, 248lines
bandlines, 266breaks in, 51–52considerations, 6, 326, 352grid lines. See grid linesin networks, 9reference, 55–56, 57, 279, 291
literacy, 71–74, 409. See also graphical literacy
loading data tables, 91log scale, 240, 247lollipop charts, 127, 192–193low-density charts, 294luminance, 369, 372, 393Lumira, 411
MMackinlay, Jock D., 15macula lutea, 29Magri�e, René, 2makeup stage, 318, 319Malofiej Awards, 117management, wrong messages from,
74–75maps
3D Maps, 238–240considerations, 225in Excel, 12, 238–240, 310overview, 6, 10–11treemaps, 21, 213, 214–215, 216
matrix, reorderable, 304–306McGill, Robert, 53mean, 229median, 229–230
memorization, 40–41memory
cognitive offloading, 26maximum number of objects stored,
351–355working, 40–42, 60
message tone, 392metrics, 188–189Microso� Power BI, 122, 124, 126, 310Minard, Charles Joseph, 117–119mnemonics, 41Monthly Births project, 151–162movies. See animationsmultiple series charts
bar charts, 181–182, 298–299, 310donut charts, 210Excel maps, 310pa�erns and, 58sca�er plots, 282–283
NNapoleon’s troops infographic, 117–119narratives, 111–112National Snow and Ice Data Center
(NSIDC), 295–297network diagram, 10networks, 6, 9–10, 12New York Times, 170, 174noise, 44, 248nominal data type, 15nominal variables, 14, 15, 181, 351NSIDC (National Snow and Ice Data
Center), 295–297
Oobjects. See also elements; entities
common fate of, 49connections, 48–49, 52features of, 60figure vs. ground, 50–51grouping, 44, 45, 48, 52–53maximum number stored, 351–355pre-a�entive processing, 36–40, 60prominence of, 36–40, 60
421� INDEX

proximity, 47, 52roles of, 390segregated, 48, 52similarity, 47–48simplification, 44, 52, 329–332types of, 338
Occam’s razor, 329–332OECD (Organization for Economic
Cooperation and Development), 285Office pale�es, 399online sharing, 175optical illusions, 58–59ordering items
alphabetically, 182–185keys, 199, 347–349, 351questions about, 139, 140values, 182–185
ordinal data type, 15ordinal variables, 14, 15, 372Organization for Economic Cooperation
and Development (OECD), 285organizational contexts, 75–78organizational literacy, 409Ortega y Gasset, José, 63outlier detection chart, 167outlier visualization, 97, 98, 104–105outliers, 230–231
considerations, 228, 274defining, 231dot plots and, 192, 193identifying, 231lollipop charts and, 193overview, 230reading, 97–98working with, 104–105
overstimulation, 78, 192, 394
Ppanel charts, 217, 295–297Pareto charts, 218–220, 221, 235–237Pareto principle, 219parsimony, 329pa�erns
considerations, 58–59
data points and, 311hiding, 311searching for, 142–147time, 267visualizing data, 97–106
PDF files, 88–89, 174–175Penrose triangle, 333perception, 25–28. See also visual
perceptioncharts vs. tables, 27–28cognition and, 25–28, 356comparisons and, 27considerations, 53, 62data and, 356false dichotomy, 27limits of, 53–59overview, 25
perspective, 346photoreceptor cells, 29–30, 367, 368pie charts, 205–209
3D, 19, 21, 77, 207, 337anchor points, 203, 204color, 48considerations, 21, 201, 202, 205–206correcting/improving, 206–207critiques, 19–22, 23, 204, 205–206described, 18, 205donut charts, 18, 210–213examples, 19–21, 22, 66, 201–206exploded slices, 21, 22, 207fan charts, 208–309legends and, 22, 207multi-level, 212–213number of slices, 22popularity of, 201pseudo-3D and, 21, 22, 336, 337reading, 202, 203sectograms, 201slices, 22, 205–207, 212sunburst charts, 213, 216transformations, 21Tu�e on, 205
pivot tables, 84–86, 95plane, 6Planisphærium cœleste, 43
DATA AT WORK422

Playfair, William, 128–129, 253plots/plo�ing
along axes, 16–17box-and-whisker plots, 232–234, 241cycle plots, 261–263dot plots, 192–193overlapping points, 228, 248sca�er plots. See sca�er plotsstrip plots, 18, 72, 73, 195–196, 232
PNG format, 175point comparison charts, 167–168, 351point visualization, 97, 98, 103–104points. See data pointspolitical issues, 89population density charts, 184–185,
192–193population projections, 144–146population pyramids, 190–192, 267–269,
352population statistics, 133–136, 144–147, 267Power BI, 123, 124, 126, 310, 411PowerPoint presentations, 77, 266, 320pragmatism vs. aesthetics, 407prägnanz, 44, 63–64pre-a�entive processing, 36–40, 60presentations, 42, 115, 267, 407primary data, 140–141primus inter pares, 38principle of least effort, 24priorities, se�ing, 147–148profiling, 292–311
bar charts/multiple series, 298–299, 310
described, 294Excel, 124, 310graphical landscapes, 113–114overview, 292–295panel charts, 295–297questions about, 139, 140reorderable matrix, 304–306sca�er plots, 284–285small multiples, 114, 307–310, 354–355
projectors, 173–174proportion, 201proportion charts, 166, 212–213, 218, 221
proto-charts, 17–18, 21, 23proximity, law of, 47, 52pseudo-3D effects, 333–336
considerations, 22data distortion and, 359grid lines and, 334overview, 333–334pie charts and, 21, 22, 336, 337use of, 336
pyramidsDIKW, 107–109population, 190–192, 267–269, 352
Python language, 411
QQlikView, 126, 411qualitative variables, 14quality, data, 154, 160quantifying color, 367–370quantifying impressions, 228–229quantitative data, 14quantitative data type, 15quantitative variables, 14quartiles, 229–230questions, asking, 138–140, 147
RR language, 411ratios
aspect, 173, 254–256, 357–358dependency, 144–147overview, 253–254
reason, 150, 321–332, 409–410rectangles, color, 396, 397redundancy, 346reference lines, 55–56, 57, 279, 291reference points, 311reification, 58relationships, 271–291
analyzing, 273–275bubble charts, 286–290clusters/groupings, 281–282considerations, 113
423� INDEX

correlation, 273, 275, 277–279, 291direction, 273, 275inverted-u shape, 273, 275linear, 273, 275overview, 271–273positive vs. negative, 273, 277questions about, 139, 140sca�er plots. See sca�er plotsshape, 273, 275strength, 273, 275time periods and, 253, 256–259visualization, 274, 275
reorderable matrix, 304–306reporting results, 148–150representations, 2residual category, 353retina, 29–30, 31retinal variables, 12–15, 53–55RGB color model, 368Rice rule, 242river, metaphorical, 249–250Rosling, Hans, 49, 266rules, 63, 64–71, 78, 332
Ssaccade movements, 32–34Sagan, Carl, 75salience, 36–40, 60SAP BusinessObjects Dashboards, 125SAP Lumira, 411Saramago, José, 109saturation, 369, 393scales
breaks in, 187–189, 199common, 54, 264log, 103, 240, 247vertical, 185, 203working with, 254–256
sca�er plots, 276–285clusters/groupings, 281–282connected, 256–259curve fi�ing, 274–275design, 279–281multiple series, 282–283
overview, 276–279profiling, 284–285subsets, 282–283time periods and, 256–259variables, 256–259
sca�ered data, 222–248box-and-whisker plots, 232–234, 241considerations, 225cumulative frequency distribution,
246–247curve fi�ing, 274–275distribution, 227–231Excel maps, 238–240histograms, 240–245, 246, 248overview, 222–225Pareto charts, 235–237, 248
Schwartz, Barry, 164screens, 173–174seasonality, 156–160
considerations, 157, 297cycle plots, 261–263cyclic pa�erns, 155, 156geography and, 157time periods and, 261–263, 296–297working with, 156–160
secondary axis, 344–346secondary data, 140–141sectograms, 201segregation, law of, 48, 52senses, 27sequences, 378–382shape visualization, 97, 98, 99–103shapes
considerations, 99reading, 97–98working with, 99–103
sharing visualizations, 173–175Shneiderman, Ben, 136signal, 44similarity, law of, 47–48simplification, 44, 52, 329–332slices, pie, 22, 205–207, 212. See also pie
chartsslope, 254slope charts, 194–195
DATA AT WORK424
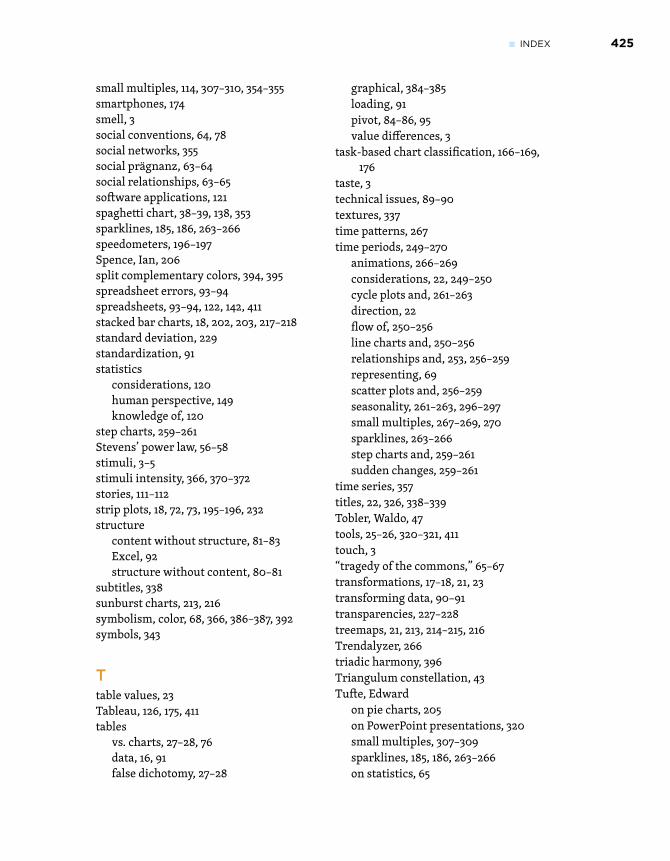
small multiples, 114, 307–310, 354–355smartphones, 174smell, 3social conventions, 64, 78social networks, 355social prägnanz, 63–64social relationships, 63–65so�ware applications, 121spaghe�i chart, 38–39, 138, 353sparklines, 185, 186, 263–266speedometers, 196–197Spence, Ian, 206split complementary colors, 394, 395spreadsheet errors, 93–94spreadsheets, 93–94, 122, 142, 411stacked bar charts, 18, 202, 203, 217–218standard deviation, 229standardization, 91statistics
considerations, 120human perspective, 149knowledge of, 120
step charts, 259–261Stevens’ power law, 56–58stimuli, 3–5stimuli intensity, 366, 370–372stories, 111–112strip plots, 18, 72, 73, 195–196, 232structure
content without structure, 81–83Excel, 92structure without content, 80–81
subtitles, 338sunburst charts, 213, 216symbolism, color, 68, 366, 386–387, 392symbols, 343
Ttable values, 23Tableau, 126, 175, 411tables
vs. charts, 27–28, 76data, 16, 91false dichotomy, 27–28
graphical, 384–385loading, 91pivot, 84–86, 95value differences, 3
task-based chart classification, 166–169, 176
taste, 3technical issues, 89–90textures, 337time pa�erns, 267time periods, 249–270
animations, 266–269considerations, 22, 249–250cycle plots and, 261–263direction, 22flow of, 250–256line charts and, 250–256relationships and, 253, 256–259representing, 69sca�er plots and, 256–259seasonality, 261–263, 296–297small multiples, 267–269, 270sparklines, 263–266step charts and, 259–261sudden changes, 259–261
time series, 357titles, 22, 326, 338–339Tobler, Waldo, 47tools, 25–26, 320–321, 411touch, 3“tragedy of the commons,” 65–67transformations, 17–18, 21, 23transforming data, 90–91transparencies, 227–228treemaps, 21, 213, 214–215, 216Trendalyzer, 266triadic harmony, 396Triangulum constellation, 43Tu�e, Edward
on pie charts, 205on PowerPoint presentations, 320small multiples, 307–309sparklines, 185, 186, 263–266on statistics, 65
425� INDEX
Uumbo, 29units of measurement, 291user interface, 70, 71user roles, 92
Vvalues
cumulative, 219, 221, 235–237ordering, 182–185table, 23
variablescovariation between, 272–273, 276line charts, 256multiple, 283nominal, 14, 15, 181, 351ordinal, 14, 15, 372qualitative, 14quantitative, 14retinal, 12–15sca�er plots, 256–259
variation vs. evolution, 358–359vertical displays, 174vision, 3visual acuity, 31–32, 60Visual Information-Seeking Mantra, 136visual perception, 24–78. See also
perceptionaxis folding, 69–70breaking the rules, 64–71color symbolism, 68, 366, 386–387, 392considerations, 60familiarity with subject, 74–75impression management, 77–78information asymmetry, 75, 170organizational contexts, 75–78resources, 59–60social prägnanz, 63–64“tragedy of the commons,” 65–67wrong messages from management,
76–77
visual rhetoric, 15visual stimuli, 3–5visualization. See data visualizationVisualoop, 117volume, 6, 11–12
WWalmart growth chart, 305–309Ware, Colin, 36, 59warm colors, 396Weber’s law, 55–56, 57“whiskers,” 232Wilkinson, Leland, 111wisdom, 109workbooks, 80, 93–94, 95working memory, 40–42, 60
Xx coordinates, 7
Yy coordinates, 7Yarbus, Alfred, 32, 33
Zz-scores, 233–234
DATA AT WORK426