Jan-Mar Quarter 2008 Results - ir.airasia.com · over time. No assurance can be ... KL – Makassar...
26
Jan-Mar Quarter 2008 Results 29 May 2008 Jan-Mar Quarter 2008 Results 29 May 2008
Transcript of Jan-Mar Quarter 2008 Results - ir.airasia.com · over time. No assurance can be ... KL – Makassar...

Jan-Mar Quarter 2008 Results 29 May 2008 Jan-Mar Quarter 2008 Results 29 May 2008

Disclaimer
Information contained in our presentation is intended solely for your reference. Such information is subject to change without notice, its accuracy is not guaranteed and it may not contain all material information concerning the Company. Neither we nor our advisors make any representation regarding, and assumes no responsibility or liability for, the accuracy or completeness of, or any errors or omissions in, any information contained herein.
In addition, the information may contain projections and forward-looking statements that reflect the company’s current views with respect to future events and financial performance. These views are based on current assumptions which are subject to various risks factors and which may change over time. No assurance can be given that future events will occur, that projections will be achieved, or that the company’s assumptions are correct. Actual results may differ materially from those projected.
This presentation can be distributed without any consent of the Company as this is a publicly available announcement.

Key Highlights
Delivered profit growth and margin expansion – EBIT RM73 million with margins of 13.7% – Net income RM161 with margins of 30.1%
25th consecutive quarter of profitability – the only LCC in Asia that is making money– one of the few airlines that managed to grow profits in the period
Lowest cost airline in the world at 3.30 US cents / ASK– despite fuel prices gaining by 43% year on year
Disciplined growth – Group fleet size of 72 (end of March 2008) – capacity growth of 36% and passenger growth of 21% YoY
3
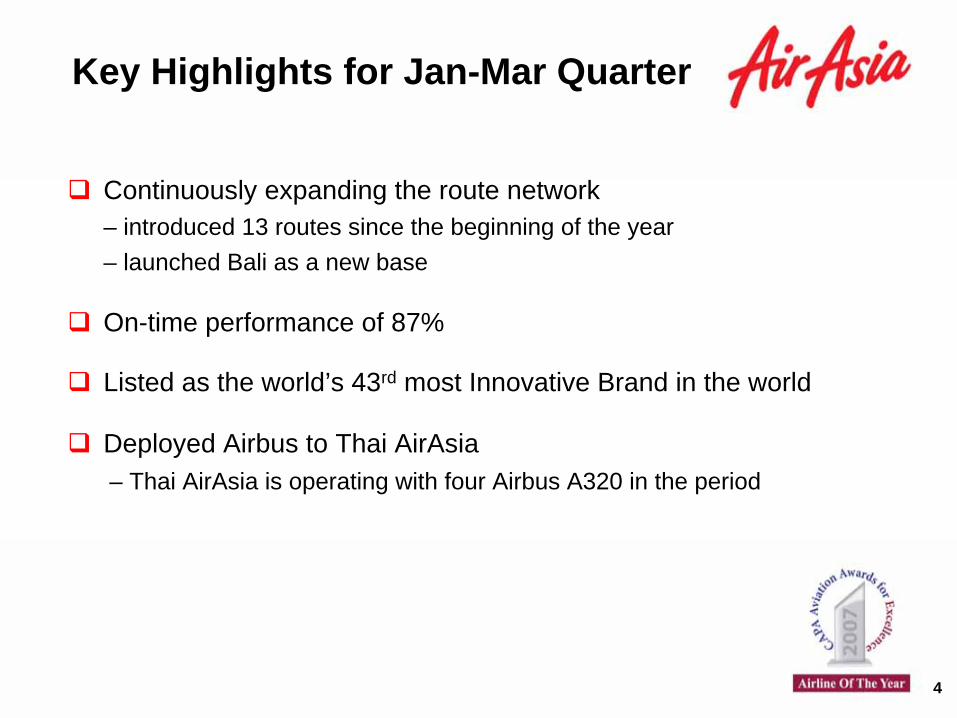
Key Highlights for Jan-Mar Quarter
Continuously expanding the route network – introduced 13 routes since the beginning of the year – launched Bali as a new base
On-time performance of 87%
Listed as the world’s 43rd most Innovative Brand in the world
Deployed Airbus to Thai AirAsia – Thai AirAsia is operating with four Airbus A320 in the period
4

Consistent Passenger Growth
15,335
3,4604,361
12,107
7,370
4,868
2,0941,041
2002 2003 2004 2005 2006 2007 Q1-2007 Q1-2008
Passengers Flown by AirAsia and AirAsia Associates Passengers Flown by AirAsia and AirAsia Associates ((‘‘000)000)
26% growth YoY
5
CAGR 57%

Perpetually Expanding Route Network
Period # Routes Served
Jan 2002 6Jun 2003 11Jun 2004 26Jun 2005 52Jun 2006 65Jun 2007 75NOW 102
KL – Hong Kong KL – Haikou KL – Ho Chi Minh City
Latest Routes
Upcoming RoutesKL – Makassar KL – Tiruchirapalli
6
Presenter
Presentation Notes
Currently we serve 75 routes across ASEAN. We have the densest route network in ASEAN and this in itself is a value. We have 20 unique routes to our name and we will look to build upon this strong network. In addition to our dense network, we also have the most frequency. We fly 6 times a day from KUL-BKK, 10 times KUL-BKI & KCH.

Results CommentaryResults Commentary
Presenter
Presentation Notes
I would like to begin the presentation by first introducing the basic parameters of the offering

Superior Growth with Expanding ProfitsRe v e n u e (RM m i l l i on )
406
535
Jan-Mar 2007 Jan-Mar 2008
Ne t In com e (RM m i l l i on )
87
161
Jan-Mar 2007 Jan-Mar 2008
32%
86%
8
EBITDAR
24.4%
31.3%
Jan-Mar 2007 Jan-Mar 2008
EBIT
13.7%
17.9%
Jan-Mar 2007 Jan-Mar 2008
Net Income
30.1%
21.4%
Jan-Mar 2007 Jan-Mar 2008
PROFIT MARGINS

Profitability Enhancement
Rev / ASK (sen)
12.2712.32
Jan-Mar 2007 Jan-Mar 2008
Cost / ASK (sen)
10.58
10.06
Jan-Mar 2007 Jan-Mar 2008
9
Net Income (RM million)161
87
Jan-Mar 2007 Jan-Mar 2008
5%
86%
10% Higher average fare
Higher ancillary income contribution
Unit Fuel price climbed by 43% to USD110/barrel
Fuel hedge benefits RM8 million
Strong operational performance
Superior cost management
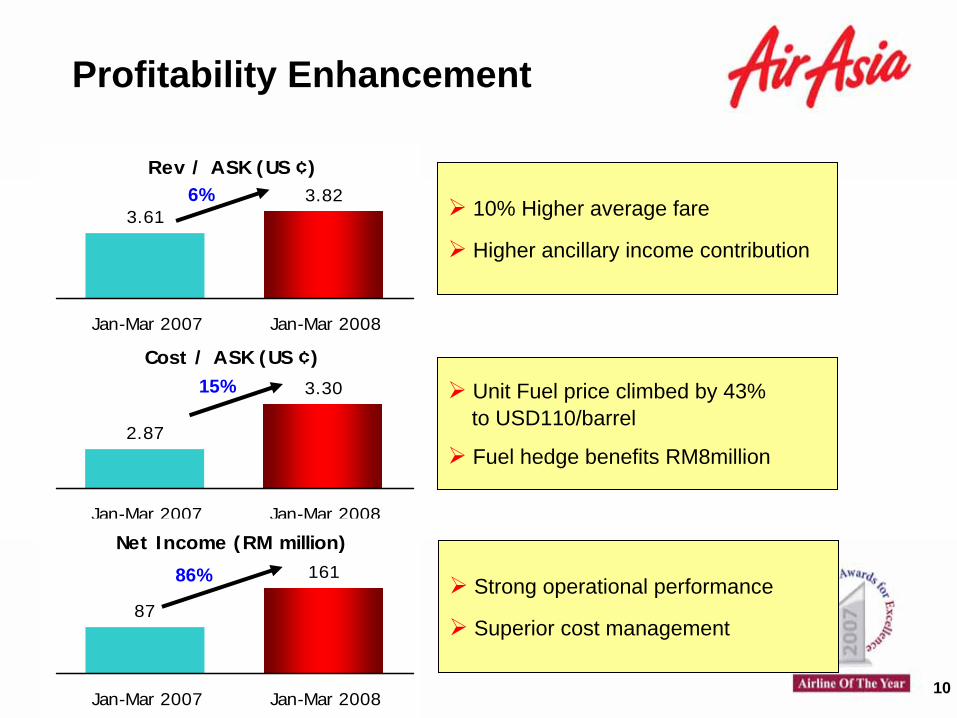
Profitability Enhancement
Rev / ASK (US ¢)3.82
3.61
Jan-Mar 2007 Jan-Mar 2008
Cost / ASK (US ¢)
3.30
2.87
Jan-Mar 2007 Jan-Mar 2008
10
Net Income (RM million)161
87
Jan-Mar 2007 Jan-Mar 2008
15%
86%
6%10% Higher average fare
Higher ancillary income contribution
Unit Fuel price climbed by 43% to USD110/barrel
Fuel hedge benefits RM8million
Strong operational performance
Superior cost management

Cost / ASK – year on year Comparison
Cost Breakdown (US cents / ASK)
Jan-Mar 2008
Jan-Mar 2007
∆
(%)Reason
Staff Costs 0.32 0.34 (5%) Improved productivity
Fuel and Oil 1.93 1.44 34% Higher jet fuel price
User & Station Charges 0.24 0.25 (5%)Productivity benefits of higher capacity Airbus A320
Maintenance and Overhaul 0.16 0.30 (46%) New aircraft requires less work
Cost of Aircraft (0.08) 0.07 Sub-lease income from Thai AirAsia
Depreciation & Amortisation 0.48 0.37 (28%) More owned aircraft in fleet
Sales, Marketing & Others 0.25 0.07 93% Classification of cost line items
Total Cost / ASK 3.30 2.87 15% Higher Fuel Price
Cost / ASK (ex fuel) 1.36 1.43 (5%) Fuel efficient A320 aircraft
11

Year on Year Comparison (Malaysia)
Operating Expenses (RM ‘000) Jan-Mar 2008 Jan-Mar 2007
% Revenue
2008 2007
Revenue 535,321 406,225
− Staff Cost− Fuel and Oil− User & Station Charges− Maintenance & Overhaul
(45,312)(270,576)(33,143)(23,036)
(38,609)(162,308)(28,054)(34,201)
(8.5%)(50.5%)(6.2%)(4.3%)
(9.5%)(40.0%)(6.9%)(8.4%)
EBITDAR- Cost of aircraft
130,74511,287
127,004(7,801)
24.4%2.1%
31.3%(1.9%)
EBITDA- Depreciation & Amortisation
142,032(68,628)
119,203(46,369)
26.5%(12.8%)
29.3%(11.4%)
EBIT 73,404 72,834 13.7% 17.9%
Pretax Profit 101,174 43,072 20.6% 10.6%
Net Income 161,277 86,873 30.1% 21.4%
12

Driving Growth from Ancillary Income
13
Driving promotions harder– increase penetration rate – packaged products to increase yields
Checked baggage fee launched 21 April – revenue contributor and cost savings – no impact to ticket sales demand
Jan-Mar2008
Jan-Mar2007
∆
%
Ancillary Income (RM million) 40.9 25.9 58%
Passenger Spend (RM / pax) 15.7 12.0 31%
% Revenue 7.6% 6.5% 1.1 ppt

Managing Fuel
14
Fuel Hedge up to June– expected savings of USD10 million in second quarter – unhedged thereafter
Looking for opportunities to hedge oil – short term hedges – crude component and refining margin – to reduce the impact of volatile spikes of fuel price

The Best Fuel Consumption Rate
15
Airbus A320 aircraft – furnished with lightest
equipments – operate from non congested
airports
Initiatives to drive down fuel consumption even further
3.54 3.52
3.31
2.892.80
Jun-05 Jun-06 Jun-07 Dec-07 Mar-08
Fuel Consumption (liters per 100 ASK)
(3%)

Borrowings and Gearing
1,959
3,272
3,640
Jun-07 Dec-08 M ar-08
Net Debt (RM million)Net Debt (RM million)
1.18
1.56 1.61
Jun-07 Dec-07 M ar-08
Net Gearing (Net Debt / Equity)Net Gearing (Net Debt / Equity)
16

Updates on Associates
Presenter
Presentation Notes
Now I would like to present you with the key highlights to investing in AirAsia
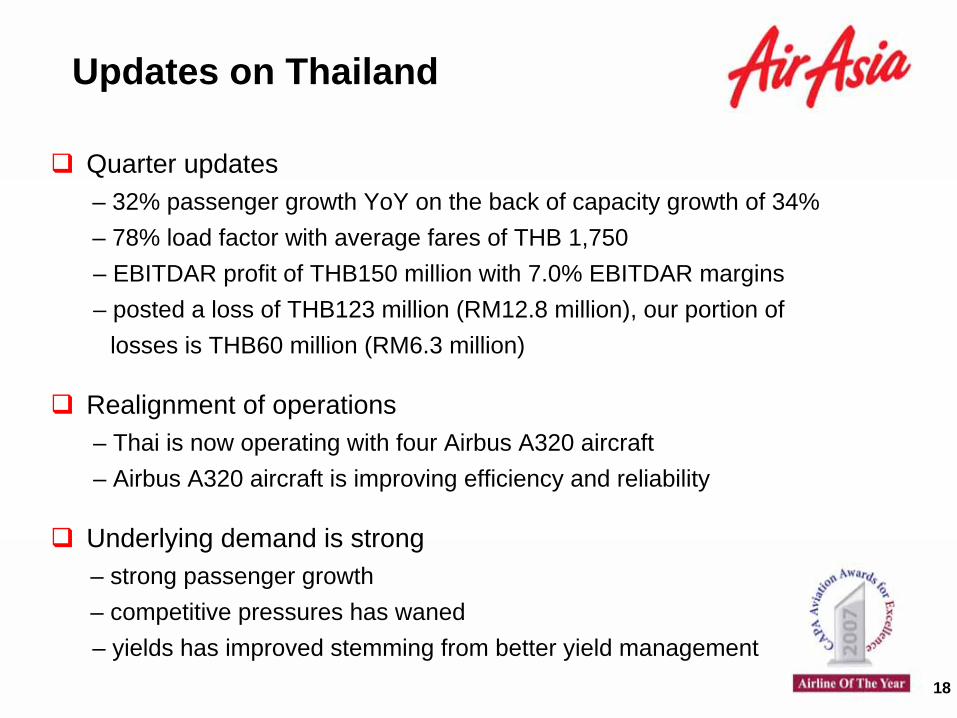
Updates on Thailand
Quarter updates – 32% passenger growth YoY on the back of capacity growth of 34%– 78% load factor with average fares of THB 1,750 – EBITDAR profit of THB150 million with 7.0% EBITDAR margins – posted a loss of THB123 million (RM12.8 million), our portion of
losses is THB60 million (RM6.3 million)
Realignment of operations – Thai is now operating with four Airbus A320 aircraft – Airbus A320 aircraft is improving efficiency and reliability
Underlying demand is strong – strong passenger growth – competitive pressures has waned – yields has improved stemming from better yield management
18

Updates on Indonesia
Quarter updates – 41% passenger growth YoY on the back of capacity growth of 51%– 75% load factor with average fares of IDR 410,323– posted a loss of IDR64.5 billion (RM22.5 million), our portion of
losses is THB31.6 million (RM11.0 million)
Business environment has improved – operational efficiency improving (better reliability and on-time performance) – yields improving due to better yield management – competitive pressure has reduced substantially
19

Summary
Challenging outlook but AirAsia will be profitable – innovation is key to survival – focus on low fares and marketing
Ancillary Income – new products provide huge upside
Most comprehensive route network in Asia – competitors are slowing, we are continuing to expand the network
Strong balance sheet – total cash (cash, deposits) of RM1 billion
AirAsia will emerge stronger in the end – others will fail – consolidation in the market is inevitable
20
AppendixAppendix
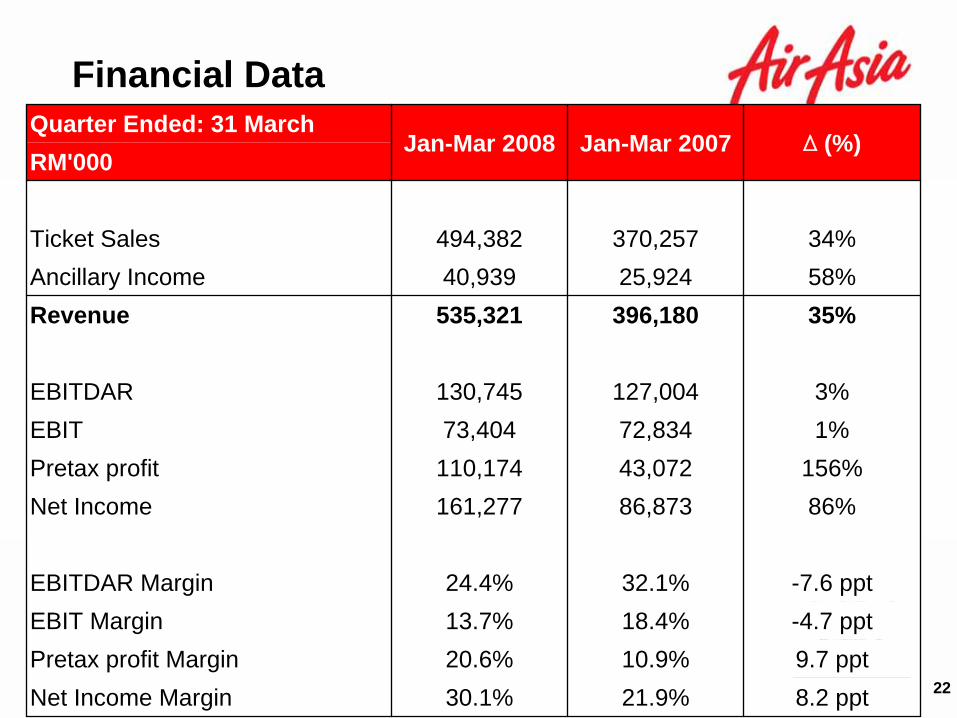
Financial Data
22
Quarter Ended: 31 MarchJan-Mar 2008 Jan-Mar 2007 ∆
(%)RM'000
Ticket Sales 494,382 370,257 34%Ancillary Income 40,939 25,924 58%Revenue 535,321 396,180 35%
EBITDAR 130,745 127,004 3%EBIT 73,404 72,834 1%Pretax profit 110,174 43,072 156%Net Income 161,277 86,873 86%
EBITDAR Margin 24.4% 32.1% -7.6 pptEBIT Margin 13.7% 18.4% -4.7 pptPretax profit Margin 20.6% 10.9% 9.7 pptNet Income Margin 30.1% 21.9% 8.2 ppt

Operating Data
23
Quarter Ended: 31 March Jan-Mar 2008 Jan-Mar 2007 ∆
(%)
Passengers Carried 2,611,556 2,160,360 21%ASK (million) 4,364 3,215 36%RPK (million) 2,970 2,461 21%Seat Load Factor 72.1% 76.5% (4.4) pptAverage Fare (RM) 189 171 10%Rev / ASK (sen) 12.27 12.64 -3%Rev / ASK (US cents) 3.82 3.61 6%Cost / ASK (sen) 10.58 10.06 5%Cost / ASK (US cents) 3.30 2.87 15%Cost / ASK-ex fuel (sen) 4.38 5.01 -13%

Operating Data
24
Quarter Ended: 31 March Jan-Mar 2008 Jan-Mar 2007 ∆
(%)
Average fare (RM) 189.3 171.4 10%Ancillary Income / pax (RM) 15.7 12.0 31%Unit Revenue / pax (RM) 205.0 183.4 12%Fuel consumed ( barrels) 768,665 606,395 27%Unit fuel price ($/barrel) 109.7 76.5 43%Average stage length (km) 1,205 1,096 10%No. of flights 20,685 17,490 18%Average aircraft No. aircraft at end of period
36.042
27.833.0
29%27%

Fleet Composition
25
Aircraft count(including spares) Mar 2008 Now (May) Dec 2008
(tentative)
Malaysia 43 44 40
Thailand 18 17 18
Indonesia 11 12 14
Group Total 72 73 72
Fleet CompositionAirbus A320Boeing 737-300
3933
4231
5517

Base Network as of May 2008
6 bases
102 routes
73 aircraft 26
312 Routes
Johor Bahru
312 Routes
Johor Bahru
14 Routes
Bali
14 Routes
Bali1116 Routes
Jakarta
1116 Routes
Jakarta
512 Routes
Kota Kinabalu
512 Routes
Kota Kinabalu
1722 Routes
Bangkok
1722 Routes
Bangkok
3643 Routes
Kuala Lumpur
3643 Routes
Kuala Lumpur
Presenter
Presentation Notes
Great success with our expansion plans to date We spend a lot of time analyzing the best places to grow Have identified many attractive cities and routes across South America We can more than double our number of markets served within Brazil and, Add several major new international destinations in South America We can serve South America profitably with our business model Transition: Here is why you should invest in Gol: we still have tremendous room for growth… Let me tell you about our great Gol product