Jamie Dannhauser
31
52 ‘There is no example in history of a lasting monetary union that was not linked to one State.’ otmar issing, chief economist of the bundesbank, 1991 Introduction Nearly four years after the collapse of Lehman Brothers, the global finan- cial system is still under immense strain. While turmoil in the euro zone is the proximate cause of recent dislocations, the financial imbalances and distortions in the global economy that built up during the ‘Goldilocks era’ are the root of the problem. They are still a long way from being resolved. At the height of the financial crisis, G20 leaders were able to find common ground – aggressive policy stimulus to prevent a rerun of the 1930s was in everyone’s interest. Three years on, that sense of common purpose has been lost. A major adjustment in the pattern of global demand and output is necessary, if the world economy is to return to a stable growth path. To be successful, it requires the cooperation of both debtor and creditor nations. Retrenchment in one must be offset by reflation in the other. Asymmetric adjustment is likely to be self-defeating, resulting in materially weaker output growth, if not global recession. In many ways, the euro zone is a microcosm of the world at large. Its problems centre on external imbalances that cannot be resolved by one-sided adjustment. For the moment, the ECB’s generous liquidity support to euro zone banks, its promise of unlimited Spanish and Italian 3 THE EURO – THE STORY OF A SUBOPTIMAL CURRENCY AREA Jamie Dannhauser
Transcript of Jamie Dannhauser
52
‘There is no example in history of a lasting monetary union that was not linked to one State.’ot m a r i s s i n g , c h i e f e c o n o m i s t o f t h e b u n d e s ba n k ,
1 9 9 1
Introduction
Nearly four years after the collapse of Lehman Brothers, the global finan-cial system is still under immense strain. While turmoil in the euro zone is the proximate cause of recent dislocations, the financial imbalances and distortions in the global economy that built up during the ‘Goldilocks era’ are the root of the problem. They are still a long way from being resolved. At the height of the financial crisis, G20 leaders were able to find common ground – aggressive policy stimulus to prevent a rerun of the 1930s was in everyone’s interest. Three years on, that sense of common purpose has been lost. A major adjustment in the pattern of global demand and output is necessary, if the world economy is to return to a stable growth path. To be successful, it requires the cooperation of both debtor and creditor nations. Retrenchment in one must be offset by reflation in the other. Asymmetric adjustment is likely to be self-defeating, resulting in materially weaker output growth, if not global recession.
In many ways, the euro zone is a microcosm of the world at large. Its problems centre on external imbalances that cannot be resolved by one-sided adjustment. For the moment, the ECB’s generous liquidity support to euro zone banks, its promise of unlimited Spanish and Italian
3 tHe euro – tHe story oF A suBoPtIMAL currency AreA
Jamie Dannhauser

t h e e u r o – t h e s t o r y o f a s u b o p t i m a l c u r r e n c y a r e a
53
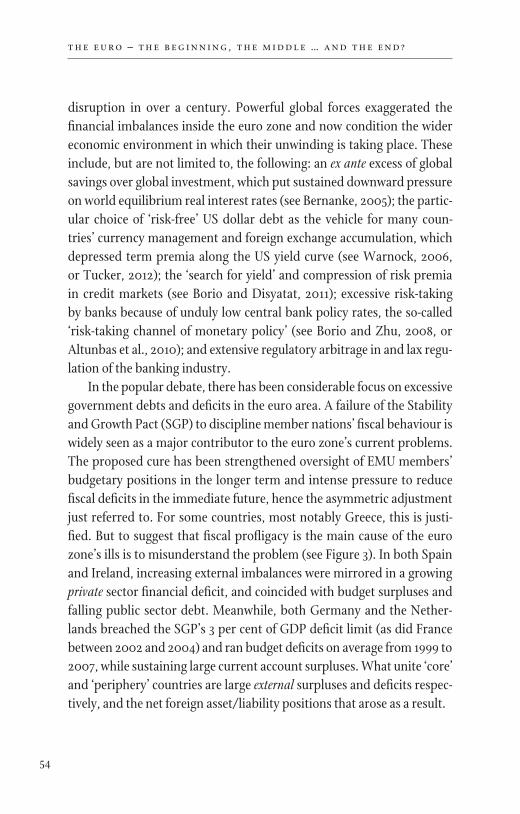
sovereign bond purchases subject to Troika oversight, and international bailout packages for Greece, Portugal and Ireland have prevented an even more severe income collapse in periphery economies; but creditor nations are doing little to help in actively rebalancing domestic demand in the euro area (see Figure 2).
In May 2012, Sir Mervyn King, governor of the Bank of England, suggested that ‘the euro area … was tearing itself apart without any obvious solution’. This chapter will explain why the structure of Economic and Monetary Union (EMU) itself laid the foundations for the crisis which now threatens its future, and why that structure will have to be significantly strengthened and potentially redesigned. It should be noted that monetary union was, and still is, a political project, but this chapter will stray only briefly into those political areas.
Moreover, we should not be blind to the fact that the euro zone crisis is taking place against the backdrop of the most severe banking
Figure 2 Size of euro area fiscal consolidation % of GDP
1
2
3
4
5
6
7
8
9
10
11
12
13
14
15
16
17
18
19
20
21
22
23
24
25
26
27
28
29
30
Source: IMF; author’s calculations
2011 2012 20130.0
0.5
1.0
1.5
2.0
2.5
3.0
3.5
4.0
4.5
5.0 Five periphery countriesRest of euro zone
t h e e u r o – t h e b e g i n n i n g , t h e m i d d l e … a n d t h e e n d ?
54
disruption in over a century. Powerful global forces exaggerated the financial imbalances inside the euro zone and now condition the wider economic environment in which their unwinding is taking place. These include, but are not limited to, the following: an ex ante excess of global savings over global investment, which put sustained downward pressure on world equilibrium real interest rates (see Bernanke, 2005); the partic-ular choice of ‘risk-free’ US dollar debt as the vehicle for many coun-tries’ currency management and foreign exchange accumulation, which depressed term premia along the US yield curve (see Warnock, 2006, or Tucker, 2012); the ‘search for yield’ and compression of risk premia in credit markets (see Borio and Disyatat, 2011); excessive risk-taking by banks because of unduly low central bank policy rates, the so-called ‘risk-taking channel of monetary policy’ (see Borio and Zhu, 2008, or Altunbas et al., 2010); and extensive regulatory arbitrage in and lax regu-lation of the banking industry.
In the popular debate, there has been considerable focus on excessive government debts and deficits in the euro area. A failure of the Stability and Growth Pact (SGP) to discipline member nations’ fiscal behaviour is widely seen as a major contributor to the euro zone’s current problems. The proposed cure has been strengthened oversight of EMU members’ budgetary positions in the longer term and intense pressure to reduce fiscal deficits in the immediate future, hence the asymmetric adjustment just referred to. For some countries, most notably Greece, this is justi-fied. But to suggest that fiscal profligacy is the main cause of the euro zone’s ills is to misunderstand the problem (see Figure 3). In both Spain and Ireland, increasing external imbalances were mirrored in a growing private sector financial deficit, and coincided with budget surpluses and falling public sector debt. Meanwhile, both Germany and the Nether-lands breached the SGP’s 3 per cent of GDP deficit limit (as did France between 2002 and 2004) and ran budget deficits on average from 1999 to 2007, while sustaining large current account surpluses. What unite ‘core’ and ‘periphery’ countries are large external surpluses and deficits respec-tively, and the net foreign asset/liability positions that arose as a result.

t h e e u r o – t h e s t o r y o f a s u b o p t i m a l c u r r e n c y a r e a
55
Increasing external imbalances may have had their genesis in funda-mental forces driving savings and investment in euro zone countries. But by the start of the financial crisis, a configuration of unsustainable external positions between EMU members had arisen. If EMU is going to remain intact, its institutional architecture is going to have to be radically altered, since existing arrangements do not provide a credible mechanism for reducing the extreme financial imbalances that built up before 2008. Investors clearly believe there is meaningful risk that at least one country will leave EMU. The steps that need to be taken, at least in broad terms, are fairly clear. Whether these are achievable in the time available given domestic political constraints is another matter. In ‘periphery’ countries, sustained fiscal retrenchment and disruptive structural reform threaten to undermine support for pro-euro, centrist parties; but there is also a danger for ‘core’ nations, where political
Figure 3 General government net debt in 2007 % of GDP, IMF data
1
2
3
4
5
6
7
8
9
10
11
12
13
14
15
16
17
18
19
20
21
22
23
24
25
26
27
28
29
30
Source: IMF
Finland
Sweden
Australia
Ireland
Netherlands
Canada
SpainKorea
UKAustria
USAGerm
any
EA France
Portugal
Belgium
JapanItaly
Greece
–80
–60
–40
–20
0
20
40
60
80
100
120

t h e e u r o – t h e b e g i n n i n g , t h e m i d d l e … a n d t h e e n d ?
56
backing for ongoing financing of the periphery may falter. History suggests that economic stagnation and political upheaval are frequent bedfellows. Across Europe, disillusionment with the political process is growing: fewer people are choosing to vote, and those that do are increasingly turning away from the centrist parties that have long domi-nated European politics. For many, monetary union in Europe was always a stepping stone to political union – Wim Duisenburg, former president of the ECB, made this point openly. But full political and fiscal union may not be feasible in the economic and political reality of the euro zone today.
the theory of optimal currency areas
In light of recent difficulties, it is far from obvious that all seventeen EMU members are better off, economically and politically, inside the euro area. In the jargon, it is time to ask whether EMU is, or can still become, an optimal currency area. Economists define an optimal currency area to be the optimal geographic domain of a single currency, or of several currencies whose exchange rates are irrevocably pegged and might be unified. Optimality is defined in terms of several optimal currency area criteria or properties which will be detailed below. The more that inde-pendent sovereigns share these properties, the greater the benefits of operating inside a unified monetary system of nation-states. As long as there are sufficiently powerful mechanisms for real adjustment between nations, there will be limited use for domestic monetary policy and a floating nominal exchange rate to foster internal and external balance.
An implicit assumption in much of the optimal currency area litera-ture is that the nominal exchange rate is a useful macroeconomic stabili-sation tool.1 But, as Buiter (2000) has pointed out, changes in a country’s real exchange rate (the nominal exchange rate adjusted for differences
1 Throughout, the assumption of a ‘small’ economy will be maintained, i.e. we abstract from economies, such as the USA, that have sufficient market power to influence prices in world markets for internationally traded goods and services.
t h e e u r o – t h e s t o r y o f a s u b o p t i m a l c u r r e n c y a r e a
57
in prices/costs between countries) are what foster external adjustment. Therefore, a key judgement is the extent to which independent monetary policy and exchange rate flexibility have lasting effects on activity, via shifts in the real exchange rate. Empirically, this will be determined by the severity of nominal rigidities, i.e. the ‘stickiness’ of prices and costs. In a world of fully flexible prices and wages, changes in the nominal exchange rate should have no effect on the real exchange rate.
What criteria need to be met for it to be advantageous for coun-tries to form a monetary union and lose the nominal exchange rate as a stabilisation tool? And what other mechan isms are available to allow constituent economies to adjust to country-specific shocks (or common shocks which have idiosyncratic effects)? Firstly, there are ex ante forces which should prevent demand deviating too far from potential output, and limit the build-up of unsustainable financial imbalances. Secondly, there are ex post mechanisms which aid adjustment over the longer term, if imbalances develop.
Mongelli (2002) provides a useful overview of the standard optimal currency area criteria, which are outlined below.
The degree of nominal rigidities in domestic prices and costs
For the choice of exchange rate regime to matter at all, there must be some inflexibility in the setting of prices and costs. An economy that faces downwardly rigid wages and prices will lose some degree of real flexibility if the nominal exchange rate is unable to adjust. Constraints on the adjustment of wages and prices in nominal terms should not, however, be confused with so-called real rigidities, which prevent real variables from returning to their equilibrium levels. The choice of monetary regime will not alter the economy’s ability to adjust to shocks if real rigidities are present.
t h e e u r o – t h e b e g i n n i n g , t h e m i d d l e … a n d t h e e n d ?
58
The mobility of labour and physical capital
A high degree of mobility in factors of production can be an effective substitute for changes in nominal exchange rates. Indeed, unlike the latter, which cannot bring about a permanent real adjustment in the face of asymmetric shocks, mobility of capital and labour is a route by which long-term adjustment can be achieved (see Mundell, 1961).
The dispersion in inflation, or more specifically expected inflation, rates
Large variations in expected inflation between countries would imply significant differences in short- and long-term real interest rates were those countries to be in a monetary union. This need not be a problem if, for instance, those differentials came about because poorer coun-tries were ‘catching up’ with richer ones, e.g. via the so-called Balassa–Samuelson effect.2 Inflation differentials may, however, reflect different cyclical positions, divergent labour market institutions, etc., which drive real interest rates away from their desired level.
The diversification of production
Countries with greater diversification in production should suffer a smaller macroeconomic impact in the face of idiosyncratic shocks to particular sectors. Thus, the need for terms of trade adjustments via the nominal exchange rate will be reduced, the more varied a country’s output (see Kenen, 1969).
2 Prices in low-income countries may increase persistently faster than those in high-income nations. If poorer countries have faster productivity growth in their tradable sectors than rich countries, this would put upward pressure on wages in the tradable and non-tradable sectors in that country. Even if the prices of trad able goods are equalised over time, an inflation differential will remain because of faster growth of wages, and therefore prices, in the poor country’s non-tradable sectors.
t h e e u r o – t h e s t o r y o f a s u b o p t i m a l c u r r e n c y a r e a
59
The similarity of economic shocks
With a ‘one size fits all’ monetary policy, the cost of joining a monetary union will partly depend on the severity of asymmetric shocks but also on the extent to which common shocks have an asymmetric impact on activity and employment. Greater commonality of economic shocks (or reactions to shocks) reduces the need for nominal exchange rate flexi-bility.3 In addition, the more a group of countries satisfies this criterion, the less they need to satisfy other conditions, e.g. the flexibility of wages/prices or factor mobility.
The extent of economic openness
In countries highly open to international markets, domestic costs and prices are more likely to be affected by changes in the nominal exchange rate and fluctuations in international prices. Because the nominal exchange rate will have a smaller impact on the real exchange rate in the short term, it will be less useful as a macroeconomic stabilisation tool.
The extent of financial market integration
The greater the degree of financial market integration, the greater the opportunities for households and companies to smooth income shocks. Monetary union itself should foster deeper financial integration, increasing the opportunities for consumption smoothing in member countries. Deeper financial integration, however, may make it more likely that unsustainable financial imbalances will emerge between countries. In a world of imperfect capital markets, in which risks may be inaccurately priced, market interest rates may be pushed far away from their desirable level. To the extent that supervision and implicit support
3 Buiter (2000) makes the important point that the use of the nominal exchange rate to re-spond to shocks is potentially limited to demand shocks. Economic theory does not offer any concrete guidance on the desired response of the nominal exchange rate to aggregate supply shocks.

t h e e u r o – t h e b e g i n n i n g , t h e m i d d l e … a n d t h e e n d ?
60
for banks remain national (as in EMU today), monetary union makes it more, not less, likely that a self-fulfilling loss of confidence in banks and sovereigns will take hold. Moreover, it increases the likelihood of desta-bilising financial contagion from ‘periphery’ to ‘core’ economies.
The degree of fiscal integration
Fiscal transfers by a supranational authority inside a monetary union should make it easier for member countries to adjust in the face of asymmetric demand shocks. This has been a standard argument in the optimal currency area literature since Kenen (1969). But for this argument to hold any weight, fiscal policy must be an effective stabili-sation tool. In a Ricardian world without liquidity constraints, where consumers fully internalise the government’s budget constraint, fiscal policy will be ineffective. In reality, though, the conditions for fiscal policy to be ineffective are very unlikely to be met. In the real world, a significant proportion of households will either be liquidity constrained or non-Ricardian in their behaviour. Moreover, that proportion is likely to be higher in exactly the kind of environment where fiscal transfers between member states are most needed to smooth economic shocks, e.g. in the aftermath of a financial crisis (see Corsetti et al., 2012).
The degree of political integration
For some authors, the political will to integrate is considered to be the most important factor that will determine the success of a monetary union. The extent to which other optimal currency area properties are satisfied ex post should be increased by a stronger desire for close polit-ical cooperation – institutional integration begets economic integration. If anything, however, the optimal currency area literature may have understated the need for deep political ties within a monetary union. Little attention was given to the nexus that exists between national banking systems and national governments and its potential to spawn
t h e e u r o – t h e s t o r y o f a s u b o p t i m a l c u r r e n c y a r e a
61
financial dislocation within a monetary union. There is now almost universal agreement that it has to be severed if EMU is to survive.4
eMu as an optimal currency area in practice – fact or fiction?The pro-EMU consensus
The previous section detailed the theoretical considerations that have been highlighted in the optimal currency area literature. This raises the question whether EMU satisfies those criteria. Even if the seventeen members do not constitute an optimal currency area, might the process of monetary integration itself create the conditions which help to sustain EMU in the future, the core argument in the endogenous optimal currency area literature? This seems to have been the broad conclusion of many authors in the years after the introduction of the euro.
There is a considerable body of work which tries to assess whether EMU is, or will become, an optimal currency area. This chapter will not attempt to review this literature – Mongelli (2008) is a useful starting point for that – but it will draw out its main conclusions. The widely cited One market, one money report into the costs and benefits of forming a monetary union in Europe, released by the European Commission in 1990, suggested the optimal currency area literature could not deliver clear policy guidance on this matter. In the subsequent twenty years, however, the balance of academic opinion has shifted in favour of monetary union in Europe. Earlier work on optimal currency areas was thought to overstate the costs of giving up monetary sovereignty and give too little emphasis to the benefits of a single currency. The ‘endog-eneity of optimal currency areas’ gave further strength to this argument.
In the ‘endogeneity of optimal currency area’ paradigm, membership
4 This would include an EMU-wide deposit guarantee fund, direct bank recapital isations via the European Stability Mechanism (ESM) and supranational supervision of financial institutions, potentially but not necessarily conducted by the ECB. Tentative steps to-wards a ‘banking union’ in Europe have recently been taken, but there remains consider-able political opposition, particularly in Germany, towards some of these changes.
t h e e u r o – t h e b e g i n n i n g , t h e m i d d l e … a n d t h e e n d ?
62
of a monetary union should not be judged on the basis that a country, or group of countries, satisfies specific criteria at the outset, but instead whether the necessary characteristics emerge out of membership of the monetary union (see Frankel and Rose, 1997). The main argument is that monetary integration leads to a deepening of reciprocal trade and more synchronised business cycles. But several authors have suggested that monetary integration can do more than just deepen trade linkages: it can further financial integration, reduce the asymmetry of shocks, foster policies which increase product and labour market flexibility, and increase political cooperation.
On balance, academic opinion has suggested that ex post tests will show that EMU is an optimal currency area. The closing remarks in Mongelli (2008) sum up that view: ‘all in all … the benefits [of EMU] outweigh the costs. There is greater resilience of the euro area as a whole, low actual and expected inflation, low interest rates and greater macro-economic stability.’ In light of recent developments, the consensus needs to be challenged critically.
Current account imbalances – sustainable or unsustainable?
Huge financial imbalances have emerged between member states. Although rising external surpluses/deficits in the ‘core’/‘periphery’ economies can partly be explained by ‘fundamentals’, their scale and persistence suggest otherwise. Several authors previously suggested that the emergence of large external imbalances and the accompa-nying divergence of price competitiveness were sustainable equilibrium phenomena, driven by the ‘Balassa–Samuelson effect’. Capital markets tell a different story – investors clearly do not believe that periphery debts are sustainable. This is not simply about the quantum of debt that has been built up; it is also about the accumulation of large external liabilities and the perceived inability of those countries to generate the external surpluses necessary to reduce those debt stocks over time inside a monetary union (see King, 2012).
t h e e u r o – t h e s t o r y o f a s u b o p t i m a l c u r r e n c y a r e a
63
In recent years, non-EMU countries have also built up large current account and net external debt positions – for example, the USA and Britain. The global driving forces behind these developments affected euro zone countries as well. What makes the problem so intractable for euro zone economies is the structure of EMU itself – a monetary union with fiscal policy determined nationally, an integrated financial market with national banking systems supported solely by host sovereigns, and a single labour market riddled with both nominal and real rigidities.
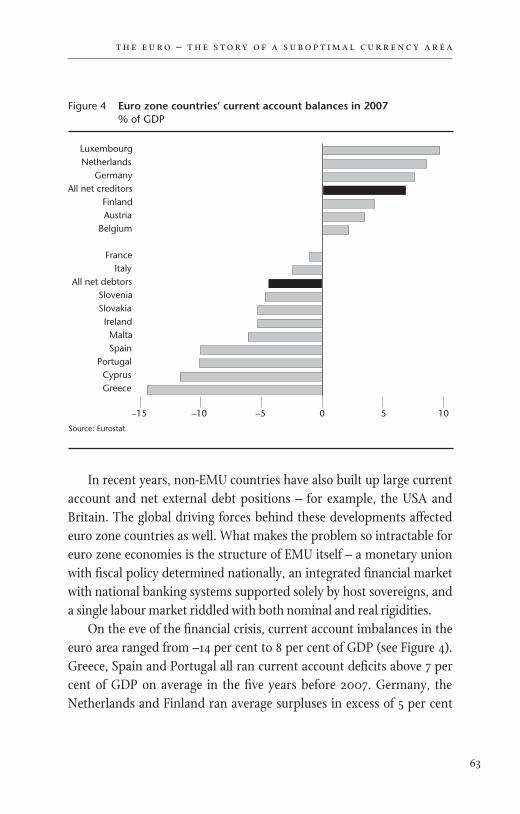
On the eve of the financial crisis, current account imbalances in the euro area ranged from –14 per cent to 8 per cent of GDP (see Figure 4). Greece, Spain and Portugal all ran current account deficits above 7 per cent of GDP on average in the five years before 2007. Germany, the Netherlands and Finland ran average surpluses in excess of 5 per cent
Figure 4 Euro zone countries’ current account balances in 2007 % of GDP
1
2
3
4
5
6
7
8
9
10
11
12
13
14
15
16
17
18
19
20
21
22
23
24
25
26
27
28
29
30
Source: Eurostat
GreeceCyprus
PortugalSpainMalta
IrelandSlovakiaSlovenia
All net debtorsItaly
France
BelgiumAustriaFinland
All net creditorsGermany
NetherlandsLuxembourg
–15 –10 –5 0 5 10

t h e e u r o – t h e b e g i n n i n g , t h e m i d d l e … a n d t h e e n d ?
64
of GDP over the same period. These averages are not dissimilar to the figures for the USA and China, the most conspicuous external debtor and creditor economies respectively. But whereas the US current account deficit peaked at 6 per cent of GDP in 2006, it did so at 15 per cent, 13 per cent and 10 per cent respectively for Greece, Portugal and Spain.
External debt and foreign asset positions
It is the dispersion of net foreign asset positions in the euro area, however – i.e. external stocks rather than flows – which is really striking. Despite sustained current account deficits in the USA over the last three decades, its stock of net external debt peaked only at 23 per cent of GDP (or $3.3 trillion) in 2008. This is only marginally larger than the equiva-lent figure for the euro area in aggregate. Cumulative current account deficits are far larger than this, suggesting sizeable valuation gains and beneficial currency moves. Meanwhile, China’s stock of net foreign assets peaked at 34 per cent of GDP in 2007. Cumulative current account surpluses exceed the peak net foreign assets position, as might be expected for a country which has experienced a sustained upward move in its nominal exchange rate.
In 2007, three euro zone countries, Greece, Portugal and Spain, had net external debt in excess of 80 per cent of GDP. By 2009, Ireland could be added to that list. As a share of GDP, Italian net external debt was more limited, but it was still sizeable in cash terms. Between them, the five troubled euro zone economies had net external debts of roughly 72.5 trillion in 2010 (see Figure 4). Germany, the Netherlands and Belgium, the largest creditor nations in the euro area, had accumulated net foreign assets of 71.3 trillion (38 per cent of GDP), 70.2 trillion (29 per cent of GDP) and 70.4 trillion (77 per cent of GDP). Analysis of all OECD countries since the mid-1980s suggests these imbalances are extreme by past comparison: the inter-quartile range for OECD members’ net foreign asset positions between 1985 and 2008 was –25 per cent to 10 per cent, according to Barnes et al. (2010a).

t h e e u r o – t h e s t o r y o f a s u b o p t i m a l c u r r e n c y a r e a
65
Unsustainable external imbalances important in EMU – the role of the government and non-financial sectors
In theory, external imbalances need not be unsustainable. International saving and borrowing, as reflected in current account imbalances, is an important mechanism by which economies can adjust to economic shocks, share risk and accumulate wealth. Fundamental factors, such as demographics, risk preferences and future growth opportunities, may drive foreign borrowing and lending. It is entirely rational, for instance, for a relatively low-income country to borrow from abroad to finance productive investments in excess of domestic savings. Slower-growing, high-income economies with ageing societies may accumulate assets abroad as a way to fund future consumption.
Barnes et al. (2010b) confirm that these fundamental forces have
Figure 5 Net foreign asset positions of selected countries in 2010 % of GDP
1
2
3
4
5
6
7
8
9
10
11
12
13
14
15
16
17
18
19
20
21
22
23
24
25
26
27
28
29
30
Dashed black lines show upper and lower quartiles for entire OECD sample between 1985 and 2008.Source: IMF; OECD; author’s calculations
Portugal
Ireland
Greece
SpainItaly
USAEuro Area
Austria
France
Netherlands
ChinaGerm
any
JapanBelgium
–150
–100
–50
0
50
100

t h e e u r o – t h e b e g i n n i n g , t h e m i d d l e … a n d t h e e n d ?
66
played a role in fostering external imbalances within the euro area during the 2000s. The scale of the imbalances, however, cannot be fully explained by historical relationships. The unexplained component of the current account surpluses in Germany and the Netherlands, and the deficits in Spain, Portugal and Greece, are sizeable and ‘noticeably larger than for earlier periods’, according to the authors.
In Greece, and to a lesser extent Portugal, the main counterpart to the current account deficits and net external debt was excessive govern-ment borrowing. Both countries ran large and persistent budget deficits before the financial crisis, and amassed large stocks of government debt (see Figure 3). Much of this was financed by external borrowing – figures from the ECB suggest that less than 40 per cent of Greek and Portuguese government debt is owned domestically. Italy too has built up a large stock of public debt, and was running a budget deficit pre-crisis. But, as is also true of Belgium, which had amassed a stock of public debt equal to 84 per cent of GDP on the eve of the crisis, this largely reflects pre-1990 fiscal profligacy. Italy’s overall budgetary position was unchanged before the financial crisis, with the government maintaining a primary surplus (general government net lending before interest payments) until the recession of 2008/09.
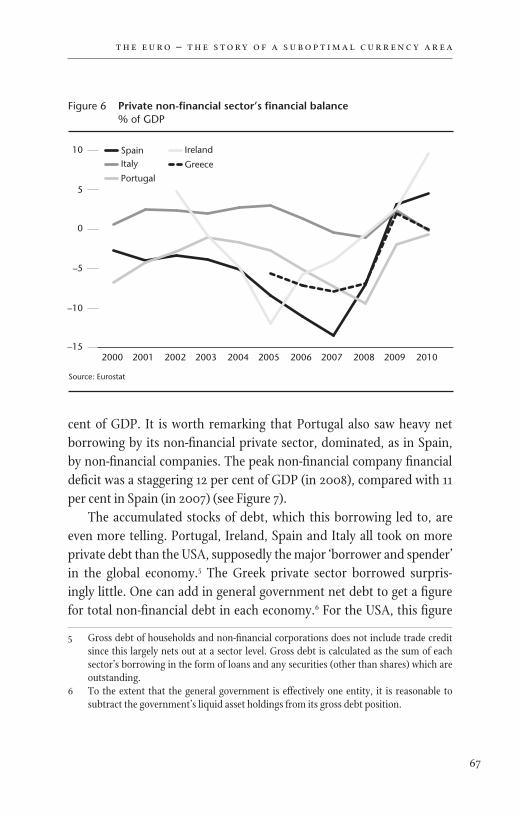
Spain and Ireland, by contrast, had very low levels of public sector net debt when the crisis struck. The Spanish and Irish governments both maintained primary surpluses for at least a decade before the crisis. Moreover, their overall budget balance actually improved in the period when their external positions deteriorated most rapidly. Instead, it was a dramatic increase in the non-financial private sector’s investment relative to its savings which drove their current account deficits (see Figure 6). Net borrowing by households and non-financial companies in Spain and Ireland peaked at 14 per cent and 12 per cent of GDP respec-tively. In Ireland, it was driven mainly by households and an explosion in residential mortgage debt. By contrast, Spanish non-financial corpo-rations were the primary driver of private sector borrowing, although by 2007 households were also running a financial deficit equal to 3 per
t h e e u r o – t h e s t o r y o f a s u b o p t i m a l c u r r e n c y a r e a
67
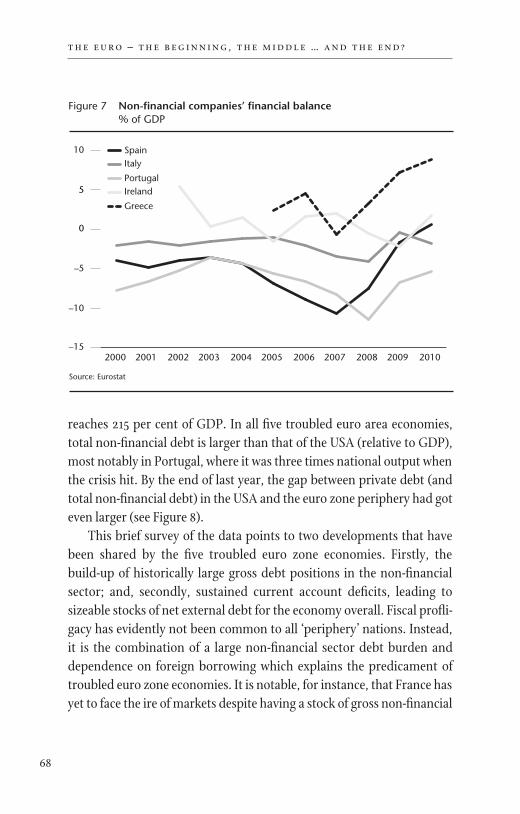
cent of GDP. It is worth remarking that Portugal also saw heavy net borrowing by its non-financial private sector, dominated, as in Spain, by non-financial companies. The peak non-financial company financial deficit was a staggering 12 per cent of GDP (in 2008), compared with 11 per cent in Spain (in 2007) (see Figure 7).
The accumulated stocks of debt, which this borrowing led to, are even more telling. Portugal, Ireland, Spain and Italy all took on more private debt than the USA, supposedly the major ‘borrower and spender’ in the global economy.5 The Greek private sector borrowed surpris-ingly little. One can add in general government net debt to get a figure for total non-financial debt in each economy.6 For the USA, this figure
5 Gross debt of households and non-financial corporations does not include trade credit since this largely nets out at a sector level. Gross debt is calculated as the sum of each sector’s borrowing in the form of loans and any securities (other than shares) which are outstanding.
6 To the extent that the general government is effectively one entity, it is reasonable to subtract the government’s liquid asset holdings from its gross debt position.
Figure 6 Private non-financial sector’s financial balance % of GDP
1
2
3
4
5
6
7
8
9
10
11
12
13
14
15
16
17
18
19
20
21
22
23
24
25
26
27
28
29
30
Source: Eurostat
2000 2001 2002 2003 2004 2005 2006 2007 2008 2009 2010–15
–10
–5
0
5
10 SpainItaly
Portugal
Ireland
Greece
t h e e u r o – t h e b e g i n n i n g , t h e m i d d l e … a n d t h e e n d ?
68
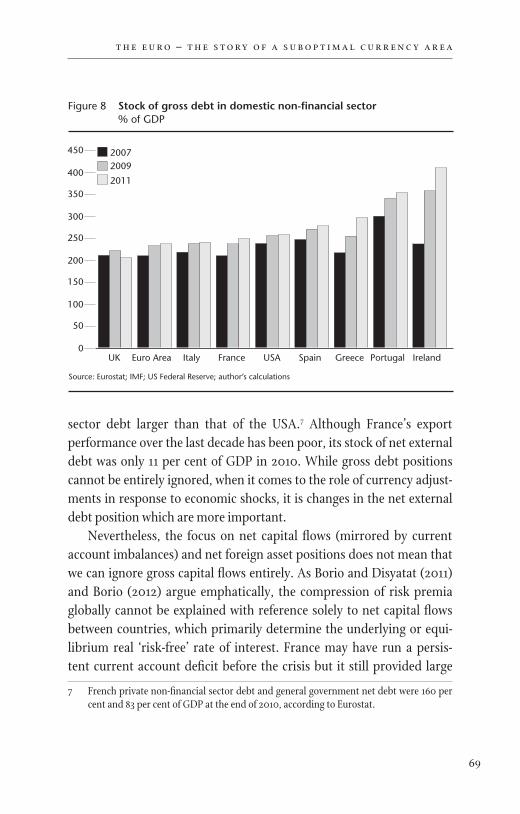
reaches 215 per cent of GDP. In all five troubled euro area economies, total non-financial debt is larger than that of the USA (relative to GDP), most notably in Portugal, where it was three times national output when the crisis hit. By the end of last year, the gap between private debt (and total non-financial debt) in the USA and the euro zone periphery had got even larger (see Figure 8).
This brief survey of the data points to two developments that have been shared by the five troubled euro zone economies. Firstly, the build-up of historically large gross debt positions in the non-financial sector; and, secondly, sustained current account deficits, leading to sizeable stocks of net external debt for the economy overall. Fiscal profli-gacy has evidently not been common to all ‘periphery’ nations. Instead, it is the combination of a large non-financial sector debt burden and dependence on foreign borrowing which explains the predicament of troubled euro zone economies. It is notable, for instance, that France has yet to face the ire of markets despite having a stock of gross non-financial
Figure 7 Non-financial companies’ financial balance % of GDP
1
2
3
4
5
6
7
8
9
10
11
12
13
14
15
16
17
18
19
20
21
22
23
24
25
26
27
28
29
30
Source: Eurostat
2000 2001 2002 2003 2004 2005 2006 2007 2008 2009 2010–15
–10
–5
0
5
10 SpainItaly
PortugalIreland
Greece
t h e e u r o – t h e s t o r y o f a s u b o p t i m a l c u r r e n c y a r e a
69
sector debt larger than that of the USA.7 Although France’s export performance over the last decade has been poor, its stock of net external debt was only 11 per cent of GDP in 2010. While gross debt positions cannot be entirely ignored, when it comes to the role of currency adjust-ments in response to economic shocks, it is changes in the net external debt position which are more important.
Nevertheless, the focus on net capital flows (mirrored by current account imbalances) and net foreign asset positions does not mean that we can ignore gross capital flows entirely. As Borio and Disyatat (2011) and Borio (2012) argue emphatically, the compression of risk premia globally cannot be explained with reference solely to net capital flows between countries, which primarily determine the underlying or equi-librium real ‘risk-free’ rate of interest. France may have run a persis-tent current account deficit before the crisis but it still provided large
7 French private non-financial sector debt and general government net debt were 160 per cent and 83 per cent of GDP at the end of 2010, according to Eurostat.
Figure 8 Stock of gross debt in domestic non-financial sector% of GDP
1
2
3
4
5
6
7
8
9
10
11
12
13
14
15
16
17
18
19
20
21
22
23
24
25
26
27
28
29
30
Source: Eurostat; IMF; US Federal Reserve; author’s calculations
UK Euro Area Italy France USA Spain Greece Portugal Ireland0
50
100
150
200
250
300
350
400
450 20072009
2011
t h e e u r o – t h e b e g i n n i n g , t h e m i d d l e … a n d t h e e n d ?
70
amounts of gross funding to periphery countries. Data from the Bank for International Settlements (BIS) show French-owned banks’ claims on the five troubled euro zone economies amounting to $950 billion at their peak in 2008. German-owned banks’ claims on these economies were, in fact, marginally lower on the eve of the crisis, despite the country being a large net creditor.
Capital flows were not used to finance productive investment
Any analysis of the euro zone crisis has to go farther than current account balances and net foreign asset positions in explaining the debt overhang in some EMU member states and the loss of confidence by investors. External imbalances within the euro zone may have been exaggerated by factors that had nothing to do with the structure of EMU itself. Even so, the fact remains that internal adjustment mechanisms within EMU did not prevent the emergence of unsustainable external positions between member states. Moreover, those mechanisms that are available do not appear sufficient to make the imbalances sustainable in the future.
Pre-crisis, the following argument was often heard: periphery coun-tries with relatively low levels of real GDP per capita were catching up with richer north European economies. Greater growth opportunities and expectations of faster productivity growth justified elevated levels of fixed investment relative to the pool of domestic savings, hence the need for a current account deficit. Demand was likely to be high relative to supply capacity, pushing up inflation and depressing real interest rates. A rising real exchange rate would result. Rapid growth in private debt, net foreign liabilities and relative unit labour costs were all part of the adjustment to a new equilibrium. In this sense, the loss of price competi-tiveness in the ‘periphery’ is more apparent than real – productivity-enhancing investments today will help to reduce future unit labour cost growth as compared with foreign competitors.
The reality was somewhat different. Sustained current account
t h e e u r o – t h e s t o r y o f a s u b o p t i m a l c u r r e n c y a r e a
71
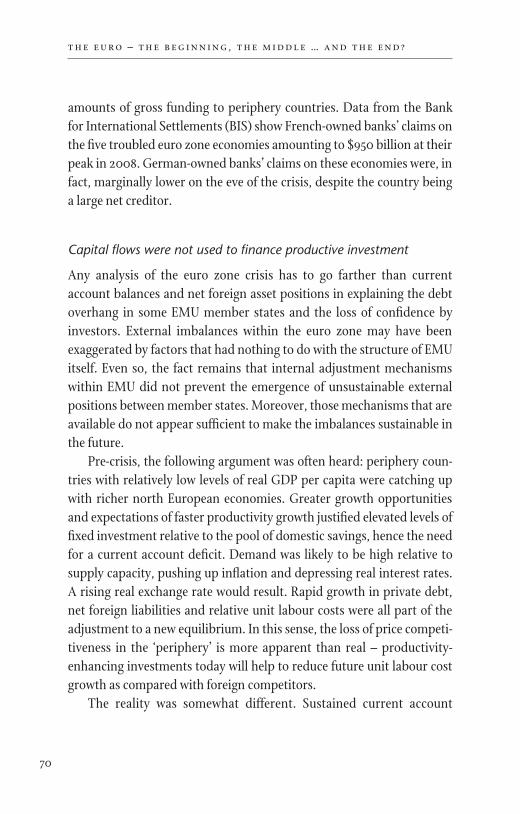
deficits were by and large not used to finance investment in productive assets. Greece and Portugal borrowed from abroad to finance exces-sive government spending. Spain and Ireland both witnessed remark-able construction booms, which have now imploded. Spain did have a relatively high rate of non-residential fixed investment; but sustained weakness in labour and total factor productivity growth, and returns on capital, does not suggest this has had a meaningful impact on supply capacity or corporate profitability (see Dannhauser, 2011). In fact, with the exception of Ireland, productivity growth across the periphery was feeble pre-crisis (see Figure 9).
Figure 9 Output per hour in manufacturing, average annual growth 1997–2007%
1
2
3
4
5
6
7
8
9
10
11
12
13
14
15
16
17
18
19
20
21
22
23
24
25
26
27
28
29
30
Source: EU KLEMS growth and productivity database
0
1
2
3
4
5
6
7
8
ItalySpain
Greece
Portugal
Germany
France
Netherlands
UKAustria
USAFinland
Ireland
t h e e u r o – t h e b e g i n n i n g , t h e m i d d l e … a n d t h e e n d ?
72
Monetary policy does not have uniform effects even in a monetary union
Short-term and long-term nominal market interest rates were very similar across euro zone countries.8 Expected inflation differentials would have led to some variation in ex ante real interest rates from the point of view of borrowers. Households or firms in periphery countries, for example, might have expected higher inflation and would therefore have perceived themselves as borrowing at lower real rates of interest. But what if monetary conditions, particularly the supply of bank credit, are determined by far more than just expectations of the future nominal short-term interest rates and inflation? What if the level of short-term interest rates itself affects risk-taking by banks? Are there not, in reality, powerful feedback loops between activity, asset prices and the money supply working through the balance sheets of borrowers and lenders (the so-called ‘balance sheet’ and ‘bank-lending’ channels) which might cause capital to be misallocated?
Monetary conditions were best conveyed by growth rates of broad money and bank credit, which show far greater variation between EMU members. While Germany saw average broad money growth of 4 per cent between 2002 and 2007, it grew by 12 per cent and 18 per cent in Spain and Ireland respectively. The suggestion that such differences can be ascribed to Balassa–Samuelson effects is far-fetched. Most obviously, the expansion of private credit in both Spain and Ireland centred on real estate and construction, where growth rates averaged in excess of 35 per cent in both countries in the run-up to the crisis. There was no evidence that either country was under-built at the start of the 2000s, or that this investment has boosted underlying productivity. Instead, rapid money and credit growth in Spain and Ireland went hand in hand with massive construction and property bubbles, which now threaten banking and government solvency.
8 To the extent that unsustainable imbalances were accumulating, this is clearly one of the adjustment mechanisms that failed to operate effectively before the crisis. Real long-term interest rates should have risen to reflect the increasing credit risk in periphery countries.
t h e e u r o – t h e s t o r y o f a s u b o p t i m a l c u r r e n c y a r e a
73
One important consideration in the formation of a monetary union is the similarity of responses to common shocks and the extent to which the single monetary stance is transmitted equally to member states. The view before the crisis was that euro zone countries showed considerable cyclical convergence and responded in a similar fashion to changes in euro area monetary policy. Business cycle asymmetries were deemed to be small and comparable with those of US regions, and the bulk of output fluctuations in euro zone economies were thought to arise from common shocks (see Giannone and Reichlin, 2006). The optimal currency area literature often glossed over variations in local legal systems, and the structure of domestic banking systems and financial markets. It turns out that such differences contributed to wildly different monetary conditions across euro zone countries. The transmission of ECB monetary policy and global liquidity trends did not simply vary between core and periphery; even within each grouping, there seem to have been vastly different reactions to common monetary shocks.
Membership of a monetary union exaggerated the accumulation of external debts and loss of price competitiveness. Sub optimal increases in countries’ real exchange rates are particularly problematic given the loss of nominal exchange rate adjustment. The most extreme upswings in real exchange rates were witnessed in Greece, Spain and Italy before 2007.9 The German real exchange rate declined by over 10 per cent between 1997 and 2007. Divergent unit labour cost trends explain most of the discrepancy in real exchange rates between EMU members. These in turn reflect a combination of faster growth in employee compensation and sluggish productivity growth in the tradable sectors of the periphery countries. The weakness of growth in manufacturing output per hour in Italy, Spain, Greece and Portugal is a particularly notable feature of
9 Throughout, real exchange rates are calculated on the basis of relative unit labour costs in manufacturing. Data are provided by the European Commission and are calculated on the basis of trade weights with all EU countries and nine additional major economies, the IC-36. Real exchange rate trends, encompassing more countries and based on relative CPIs, do not differ markedly.

t h e e u r o – t h e b e g i n n i n g , t h e m i d d l e … a n d t h e e n d ?
74
the pre-crisis environment. It is worth noting as an exception, however, the extraor dinarily strong productivity performance in Irish manufac-turing. This might suggest that Ireland is better placed than the rest of the periphery to undertake the internal devaluation necessary to restore external balance in a monetary union. Indeed, with Irish manufacturing unit labour costs down by 35 per cent relative to trading partners since 2008, this process would seem to be well advanced.
The real exchange rate and relative labour costs are not, however, the only determinant of a country’s ability to generate external surpluses over time. Export volumes will also be affected by geographical and product specialisation and a country’s industrial structure will deter-mine the extent to which domestic production can substitute for
Figure 10 EU countries’ export performance and cumulative real exchange rate moves, 1997–2007
1
2
3
4
5
6
7
8
9
10
11
12
13
14
15
16
17
18
19
20
21
22
23
24
25
26
27
28
29
30
Source: OECD; author’s calculations
–30
–20
–10
0
10
20
30
40
–40 –30
Spain
France
–20 –10 0 10 20 30 40 50
Cum
ulat
ive
% c
hang
e in
RER
, 200
7 vs
199
7
% change in export market share, 2007 vs 1997
t h e e u r o – t h e s t o r y o f a s u b o p t i m a l c u r r e n c y a r e a
75
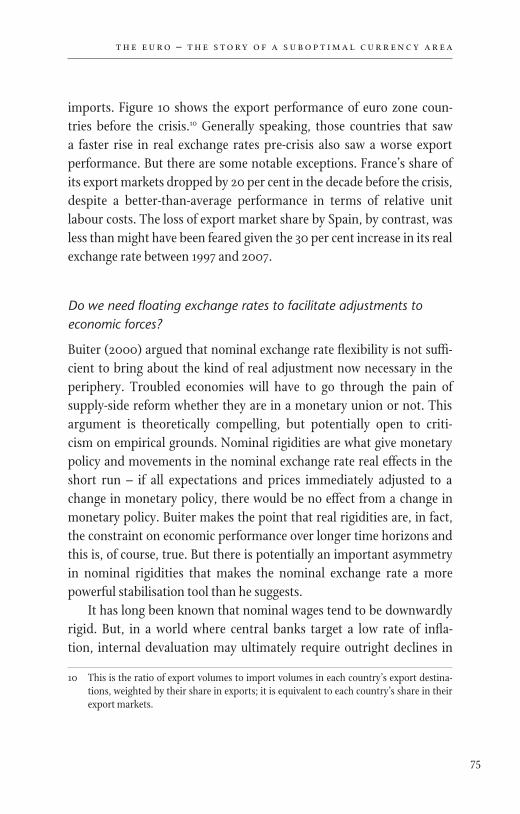
imports. Figure 10 shows the export performance of euro zone coun-tries before the crisis.10 Generally speaking, those countries that saw a faster rise in real exchange rates pre-crisis also saw a worse export performance. But there are some notable exceptions. France’s share of its export markets dropped by 20 per cent in the decade before the crisis, despite a better-than-average performance in terms of relative unit labour costs. The loss of export market share by Spain, by contrast, was less than might have been feared given the 30 per cent increase in its real exchange rate between 1997 and 2007.
Do we need floating exchange rates to facilitate adjustments to economic forces?
Buiter (2000) argued that nominal exchange rate flexibility is not suffi-cient to bring about the kind of real adjustment now necessary in the periphery. Troubled economies will have to go through the pain of supply-side reform whether they are in a monetary union or not. This argument is theoretically compelling, but potentially open to criti-cism on empirical grounds. Nominal rigidities are what give monetary policy and movements in the nominal exchange rate real effects in the short run – if all expectations and prices immediately adjusted to a change in monetary policy, there would be no effect from a change in monetary policy. Buiter makes the point that real rigidities are, in fact, the constraint on economic performance over longer time horizons and this is, of course, true. But there is potentially an important asymmetry in nominal rigidities that makes the nominal exchange rate a more powerful stabilisation tool than he suggests.
It has long been known that nominal wages tend to be downwardly rigid. But, in a world where central banks target a low rate of infla-tion, internal devaluation may ultimately require outright declines in
10 This is the ratio of export volumes to import volumes in each country’s export destina-tions, weighted by their share in exports; it is equivalent to each country’s share in their export markets.

t h e e u r o – t h e b e g i n n i n g , t h e m i d d l e … a n d t h e e n d ?
76
nominal wages. For the USA, at least, there is already evidence of signifi-cant resistance to nominal wage cuts and an increase in the share of workers affected by downward nominal rigidities (see Daly et al., 2012). Past work has not suggested any material difference in nominal rigidities between the USA and the euro zone. It should be noted that the impact of these nominal rigidities is the same regardless of the source of the need for adjustment within the euro zone. Even if the analysis above is not accepted, there is an undeniable need for adjustment and, in future decades, of course, different economic events might give rise to shocks that also require adjustment.
In today’s unusual circumstances, a lack of nominal exchange rate flexibility may significantly extend the time frame over which real adjustment takes place, particularly given the labour and product market rigidities in EU countries. To some extent, labour mobility could help to offset this. The evidence, however, does not suggest that labour flows in the euro zone are particularly sensitive to economic condi-tions. Labour mobility within the euro area remains very limited by all accounts (see Zimmerman, 2009): relative to interstate and intra-state mobility in the USA, several studies have found it to be significantly lower. It is possible that the lack of labour movement arises because wages are sticky. For those who remain in employment, the absence of adjustments to real wages may be a disincentive to migrate. But it is likely that the constraints on intra-EMU labour flows have deeper roots. Language barriers are an obvious problem. Limited cross-border porta-bility of social protection and pension rights is another. Given extensive regulation of professions across the euro zone, reciprocal recognition of qualifications has also been identified as a major constraint. Specific to this crisis, in Spain and Ireland in particular, is the problem of negative equity, which can inhibit labour mobility for owner-occupiers with an outstanding mortgage.
The Buiter critique may fail to hold in current circumstances for another reason. Normally, it is entirely reasonable to assume, as Buiter does, that the choice of exchange rate regime will have no significant,
t h e e u r o – t h e s t o r y o f a s u b o p t i m a l c u r r e n c y a r e a
77
lasting impact on the path of potential output or the natural rate of unemployment. The long-run Phillips curve is vertical and the econ-omy’s long-run real equilibrium is determined by real factors alone. But, in the aftermath of the biggest financial crisis in a century, this is not obviously true. Hysteresis-type effects may well be important when activity is a long way below potential and the banking system is impaired as it is today. Faster demand growth in the short run may have permanent effects on an economy’s supply capacity. The channels through which this might theoretically take place are numerous,11 and have been discussed at length elsewhere. Their empirical relevance is an open question. The Great Depression is the only period of comparable economic stress, making econometric analysis all but impossible. Even then, the similarity is not perfect: in many ways, the recent crisis was more global in nature and even more threatening to the global financial system; moreover, economic activity in the second half of the 1930s was significantly boosted by re armament in the run-up to World War II. To the extent that a country outside EMU retains nominal exchange rate flexibility, hence influence over the real exchange rate in the short term, it may, in today’s unusual circumstances, be able to influence the level of real activity over the long term.
There is also a political dimension that should not be overlooked. If a country maintains influence over real exchange rates in the short run, or is able to allow changes in nominal and real exchange rates to respond to economic shocks, there will be a smaller upswing in unemployment and loss of output in response to shocks. It should then be less difficult for the government to build the electoral coalition necessary for supply-side reforms to remove the real rigidities that will restrict the level of real activity in the long run.
11 Including, for example, the deterioration of skills over the medium term, which makes it more difficult for those who are unemployed to find employment. As the period of unem-ployment lengthens, skills deteriorate further, and so on.

t h e e u r o – t h e b e g i n n i n g , t h e m i d d l e … a n d t h e e n d ?
78
The British experience
In terms of the benefit granted by monetary independence, the compar-ison between the UK and troubled euro zone economies is notable. Households and businesses in Britain amassed a huge stock of debt before the financial crisis (see Figure 8). This was largely responsible for the bubble in residential and commercial property prices. Public sector debt has subsequently ballooned (to 71 per cent and 85 per cent of GDP at the end of 2011 for net and gross debt respectively, according to the IMF), in part because of the equity stakes taken by the UK government in two of the country’s major banks. Yet, despite these structural frail-ties, Britain continues to enjoy ‘safe-haven’ status. At the time of writing, ten-year government bonds were yielding 2.1 per cent, a spread of only 15 and 55 basis points over US treasuries and German bunds respectively. Why might this be so? It could be because investors have greater confi-dence in the UK’s ability to grow, and hence to service its debts, over the long term – the supply side of the economy, particularly the labour market, is deemed more flexible than elsewhere in Europe; the coun-try’s demographic prospects are also less gloomy. It is also possible that the government is perceived as more willing and able to implement the necessary fiscal consolidation and structural reforms. The UK’s safe-haven status surely also rests, however, on the belief that monetary and currency flexibility provides the UK with the means to generate short-term output growth in the face of fiscal retrenchment, achieve the neces-sary rebalancing of the pattern of demand and production, and avoid the self-fulfilling losses of confidence that have historically plagued troubled economies inside fixed exchange rate systems.
concluding remarks
Monetary union in Europe has ultimately been a political, rather than an economic, project. In fact, as Willem Buiter, now chief econo-mist at Citibank, once put it: ‘the whole European integration experi-ment … has been a political wolf in economic sheep’s clothing’. At the

t h e e u r o – t h e s t o r y o f a s u b o p t i m a l c u r r e n c y a r e a
79
outset, there was general scepticism that EMU members constituted an optimal currency area. The balance of opinion before the financial crisis, however, was that EMU would develop the characteristics of an optimal currency area over time. Supporters of the ‘endogenous optimal currency area hypothesis’ seemed to win the day.
In light of recent events, this conclusion needs to be challenged. Even the strongest supporters of ‘the European project’ now accept the need for EMU’s structure to be overhauled rad ically. If the euro zone is to evolve into an optimal currency area, it is going to need deeper political integration, including some form of fiscal burden-sharing and a banking union, involving supranational oversight and resolution of large finan-cial institutions. The links between national governments and the banking systems they stand behind, which are ignored in the optimal currency area literature, have proved to be hugely relevant in the context of a monetary union. They are central to explaining the self-fulfilling losses of confidence we have witnessed across the euro zone’s periphery. Deeper financial integration between EMU members has been a double-edged sword.
Limited labour mobility and the lack of a common fiscal policy were frequently cited as constraints on the effective operation of EMU. In hindsight, these have been less relevant than many authors had expected. It is highly unlikely that increased cross-border labour flows or larger fiscal transfers between EMU members would have prevented the accumulation of unsustainable financial imbalances. There was concern that, without nominal exchange rate flexibility, countries would not be able to adjust to country-specific shocks. In the end, it was not so much an asymmetry of shocks, but asymmetric reactions to common global shocks and a common monetary policy which were the euro zone’s undoing. Distinctly national financial systems, inside a euro zone-wide financial market, help to explain why these divergences became so extreme.
Fundamental factors may explain some of the imbalances between member states; but their scale and persistence suggest that the euro area
t h e e u r o – t h e b e g i n n i n g , t h e m i d d l e … a n d t h e e n d ?
80
did not have sufficiently powerful ex ante adjustment mechanisms to prevent the emergence of unsustainable gross non-financial debt stocks in the periphery and net foreign asset positions across the euro zone. The dislocation in financial markets suggests that EMU, in its current form, does not have the ex post means for reducing those imbalances or debt levels either.
European leaders are in the process of redesigning EMU in order to cope with the current crisis and prevent the emergence of imbal-ances farther down the road. It is too early to tell whether they will be successful. Investors still believe that there is a risk of at least one country exiting EMU. This is not because EMU cannot be reformed in principle but, rather, because of the political constraints with which governments are faced. Disagreements about the future of Europe, which have shaped political and monetary integration over several decades, have not been resolved. And now a new threat is emerging. Periphery nations face a gruelling period of economic rebalancing. The cure for their ills is fiscal retrenchment and supply-side adjustment. It is far from clear, however, that we have the political leaders to sustain such reforms, or more importantly the electoral appetite to allow them to be sustained.
references
Altunbas, Y., L. Gambacorta and D. Marques-Ibanez (2010), ‘Does monetary policy affect bank risk-taking?’, BIS Working Paper 298.
Barnes, S., J. Lawson and A. Radziwill (2010a), ‘Current account imbalances in the euro area: a comparative perspective’, OECD Economics Department Working Paper no. 826.
Barnes, S., J. Lawson and A. Radziwill (2010b), ‘Resolving and avoiding unsustainable imbalances in the euro area’, OECD Economics Department Working Paper no. 827.
Bernanke, B. (2005), ‘The global savings glut and the US current account deficit’, Remarks at Sandridge Lecture, Virginia Association of Economists.
t h e e u r o – t h e s t o r y o f a s u b o p t i m a l c u r r e n c y a r e a
81
Borio, C. (2012), ‘The financial cycle and macroeconomics: what have we learnt?’, BIS Working Paper 395.
Borio, C. and P. Disyatat (2011), ‘Global imbalances and the financial crisis: link or no link?’, BIS Working Paper 346.
Borio, C. and H. Zhu (2008), ‘Capital regulation, risk-taking and monetary policy: a missing link in the transmission mechanism?’, BIS Working Paper 268.
Buiter, W. H. (2000), ‘Optimal currency areas: why does the exchange rate regime matter?’, Centre for Economic Performance Discussion Paper no. 462.
Corsetti, G., A. Meier and G. Müller (2012), ‘What determines government spending multipliers?’, IMF Working Paper 12/150.
Daly, M., B. Hobijn and B. Lucking (2012), ‘Why has wage growth stayed strong?’, Federal Reserve Bank of San Francisco Economic Letter 10/2012.
Dannhauser, J. (2011), ‘Spain as the new Japan? Possible, maybe even likely’, Monthly Review no. 269, Lombard Street Research.
Frankel, J. A. and A. K. Rose (1997), ‘The endogeneity of the optimum currency area criteria’, Economic Journal, 108(449): 1009–25.
Giannone, D. and L. Reichlin (2006), ‘Trends and cycles in the euro area: how much heterogeneity and should we worry about it?’, Working Paper Series 595, European Central Bank.
Kenen, P. (1969), ‘The theory of optimum currency areas: an eclectic view’, in R. A. Mundell and A. K. Swoboda (eds), Monetary Problems in the International Economy, Chicago, IL: University of Chicago Press.
King, M. (2012), Speech at the Lord Mayor’s Banquet for Bankers and Merchants of the City of London at Mansion House.
Mongelli, F. P. (2002), ‘New views on the optimum currency area theory: what is EMU telling us?’, Working Paper Series 138, European Central Bank.
Mongelli, F. P. (2008), ‘European economic and monetary integration, and the optimum currency area theory’, European Economy
t h e e u r o – t h e b e g i n n i n g , t h e m i d d l e … a n d t h e e n d ?
82
Economic Papers 302, Directorate General Economic and Monetary Affairs, European Commission.
Mundell, R. (1961), ‘A theory of optimum currency areas’, American Economic Review, 51(4): 657–65.
Tucker, P. (2012), ‘National balance sheets and macro policy: lessons from the past’, Speech at Society of Business Economists’ annual dinner.
Viera, C. and I. Viera (2011), ‘Assessing the endogeneity of OCA conditions in EMU’, GEE Papers 0042, Gabinete de Estratégia e Estudos, Ministério da Economia e da Inovação, Portugal, revised November 2011.
Warnock, F. E. (2006), ‘East Asian reserves accumulation and US interest rates’, Testimony for ‘China’s financial system and monetary policies: the impact on US exchange rates, capital markets, and interest rates’.
Zimmerman, K. F. (2009), ‘Labour mobility and the integration of European labour markets’, Deutsches Institut für Wirtschaftsforschung Discussion Paper no. 862.