James W. Grice Oklahoma State University Department of Psychology Presented to researchers and staff...
47
James W. Grice Oklahoma State University Department of Psychology Presented to researchers and staff of Walter Reed Army Research Institute, Silver Spring, MD, April 14 th , 2015. Alternatives to Null Hypothesis Significance Testing and Variable-Based Modeling
-
Upload
scott-thomas -
Category
Documents
-
view
216 -
download
1
Transcript of James W. Grice Oklahoma State University Department of Psychology Presented to researchers and staff...
James W. Grice
Oklahoma State UniversityDepartment of Psychology
Presented to researchers and staff of Walter Reed Army Research Institute, Silver Spring, MD, April 14th, 2015.
Alternatives to Null Hypothesis Significance Testing and Variable-Based Modeling
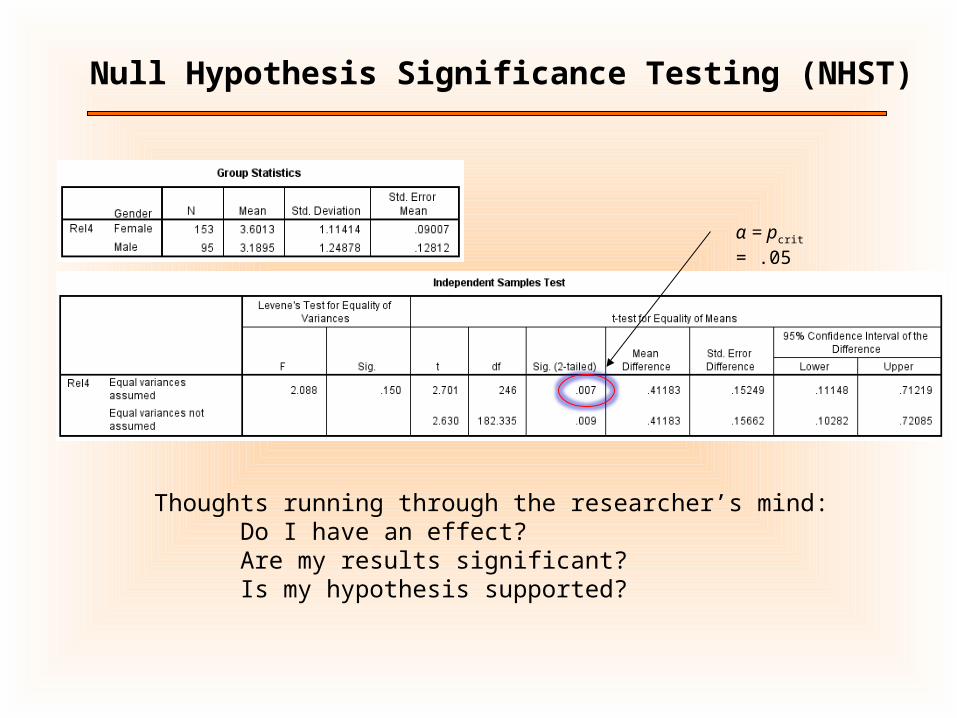
Null Hypothesis Significance Testing (NHST)
Thoughts running through the researcher’s mind: Do I have an effect? Are my results significant? Is my hypothesis supported?
α = pcrit = .05
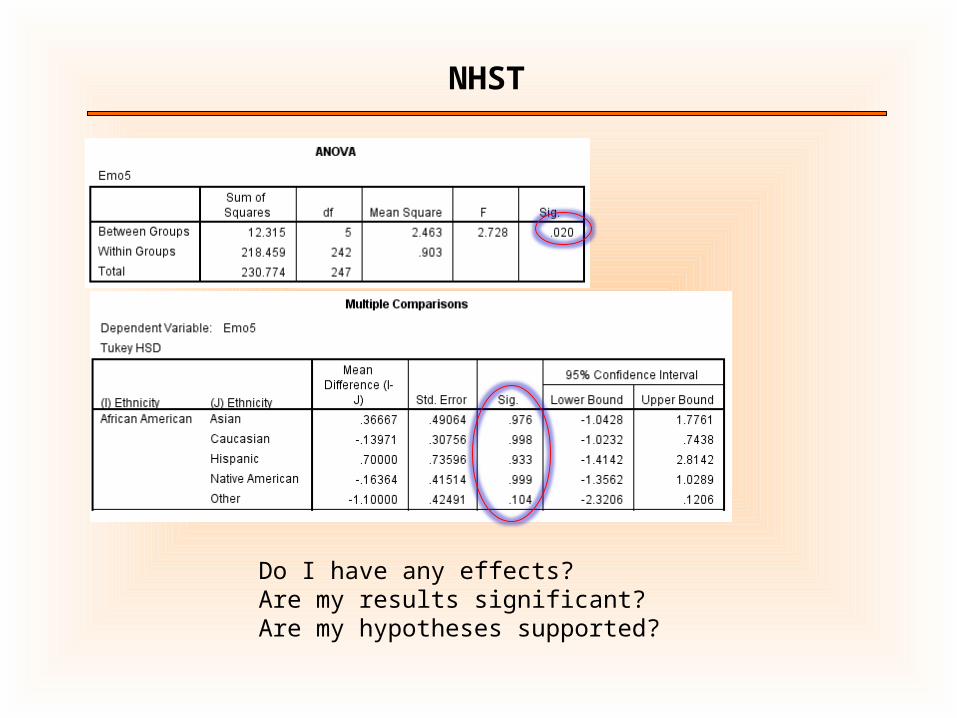
NHST
Do I have any effects? Are my results significant? Are my hypotheses supported?
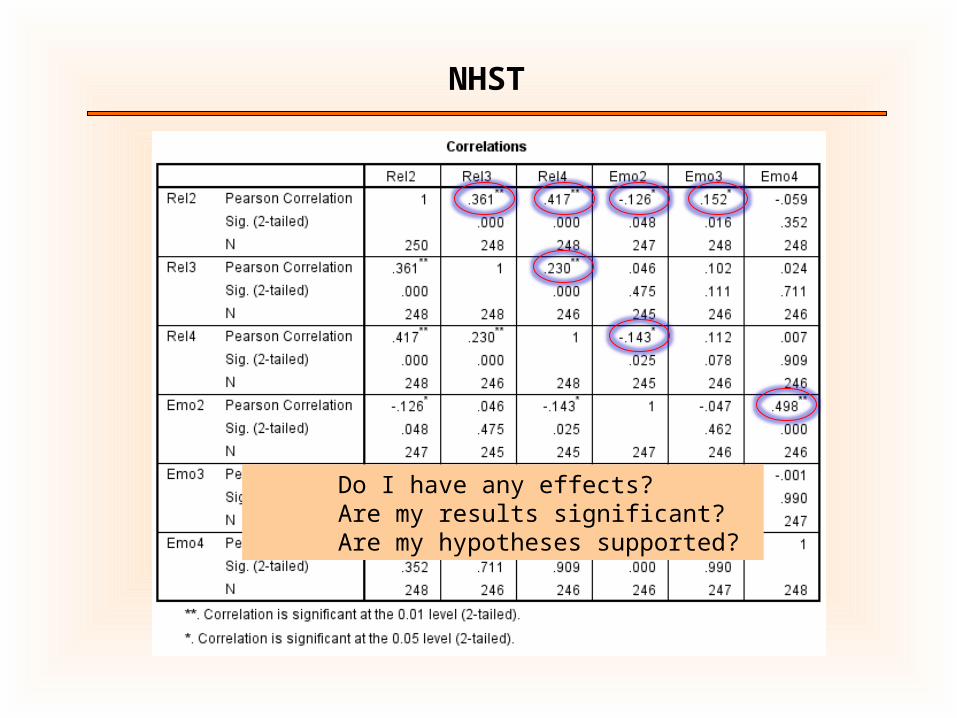
NHST
Do I have any effects? Are my results significant? Are my hypotheses supported?
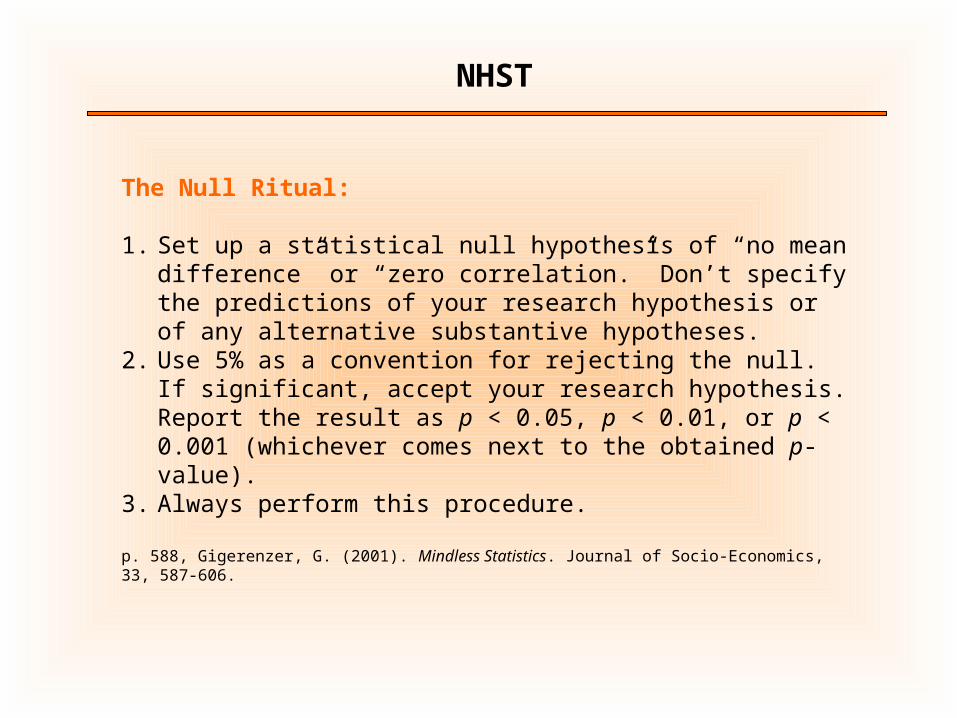
The Null Ritual:
1. Set up a statistical null hypothesis of “no mean difference” or “zero correlation.” Don’t specify the predictions of your research hypothesis or of any alternative substantive hypotheses.
2. Use 5% as a convention for rejecting the null. If significant, accept your research hypothesis. Report the result as p < 0.05, p < 0.01, or p < 0.001 (whichever comes next to the obtained p-value).
3. Always perform this procedure.
p. 588, Gigerenzer, G. (2001). Mindless Statistics. Journal of Socio-Economics, 33, 587-606.
NHST

Optimism Delay visit to doctor
-.18*
rz z
xyx y
n 1.18
Assumption-laden NHST
Assumptions• Linearity• Random Sampling• Bivariate Normal Population Distribution• Homoscedasticity• Continuous variables• Independence of pairs of observations• Ho is true• “p ≤ .05” is proper significance level
Goal is to estimate a population parameter; here, the population correlation
NHST
Linear relationship between optimism and visiting a doctor after detecting a lump in the breast.

NHST
Hypotheses:
Ho : ρxy = 0
HA : ρxy > 0 or ρxy < 0
where ρxy is the population correlation
Assumptions• Linearity• Random Sampling• Bivariate Normal Population Distribution• Homoscedasticity• Continuous variables• Independence of pairs of observations• Ho is true• “p ≤ .05” is proper significance level

NHST
Ho : ρxy = 0
Sampling Distribution : Distribution of possible outcomes (r values) with assumptions being fulfilled.
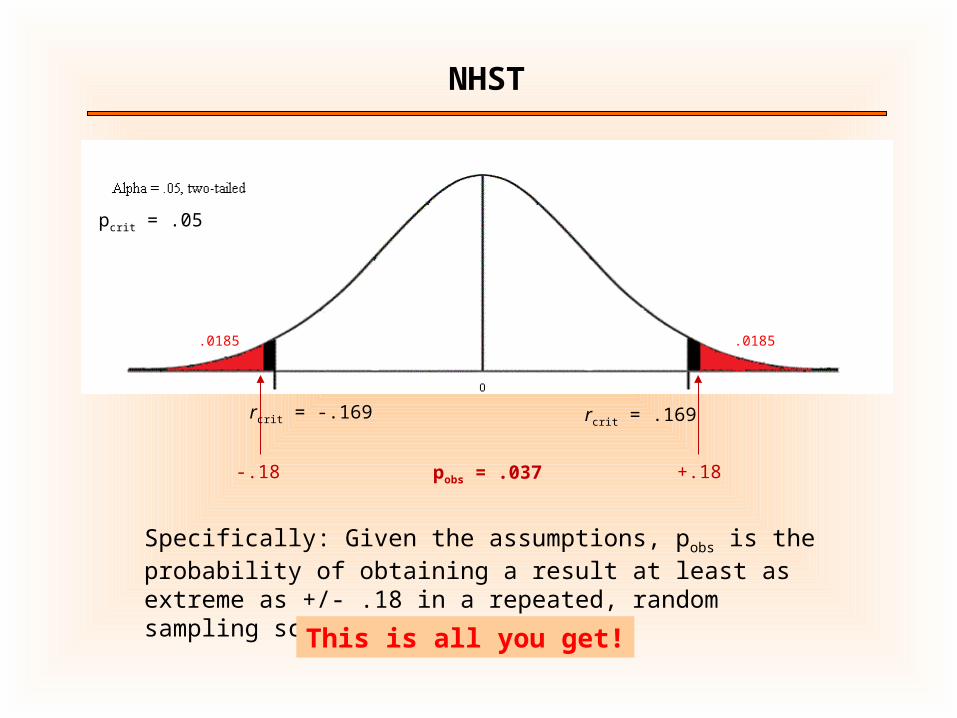
pcrit = .05
rcrit = -.169 rcrit = .169

NHST
pcrit = .05
-.18 +.18pobs = .037
rcrit = -.169 rcrit = .169
Specifically: Given the assumptions, pobs is the probability of obtaining a result at least as extreme as +/- .18 in a repeated, random sampling scheme.
This is all you get!
.0185.0185
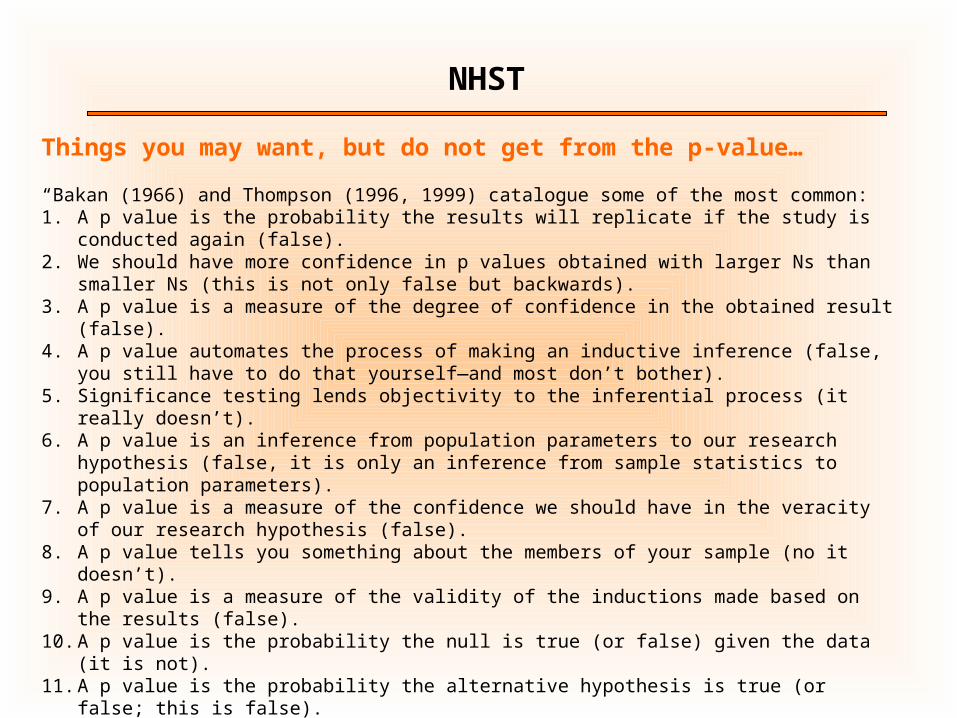
Things you may want, but do not get from the p-value…
“Bakan (1966) and Thompson (1996, 1999) catalogue some of the most common:1. A p value is the probability the results will replicate if the study is conducted again (false).2. We should have more confidence in p values obtained with larger Ns than smaller Ns (this is not
only false but backwards).3. A p value is a measure of the degree of confidence in the obtained result (false).4. A p value automates the process of making an inductive inference (false, you still have to do that
yourself—and most don’t bother).5. Significance testing lends objectivity to the inferential process (it really doesn’t).6. A p value is an inference from population parameters to our research hypothesis (false, it is only an
inference from sample statistics to population parameters).7. A p value is a measure of the confidence we should have in the veracity of our research hypothesis
(false).8. A p value tells you something about the members of your sample (no it doesn’t).9. A p value is a measure of the validity of the inductions made based on the results (false).10. A p value is the probability the null is true (or false) given the data (it is not).11. A p value is the probability the alternative hypothesis is true (or false; this is false).12. A p value is the probability that the results obtained occurred due to chance (very popular but
nevertheless false).”
p. 73. Lambdin, C. (2011) Significance tests as sorcery: Science is empirical—significance tests are not. Theory & Psychology, 22(1) 67–90.
NHST
NHST
pcrit = .05
-.18 +.18pobs = .037
rcrit = -.169 rcrit = .169
Specifically: Given the assumptions, pobs is the probability of obtaining a result at least as extreme as +/- .18 in a repeated, random sampling scheme.
This is all you get!
.0185.0185
NHST
“The 16th edition of a highly influential textbook, Gerrig and Zimbardo’s Psychology and Life (2002), portrays the null ritual as statistics per se and calls it the ‘backbone of psychological research’ ” (p. 46).
p. 589, Gigerenzer, G. (2001). Mindless Statistics. Journal of Socio-Economics, 33, 587-606.

NHST
Optimism Delay visit to doctor
-.18*
Assumptions• Linearity• Random Sampling• Bivariate Normal Population Distribution• Homoscedasticity• Continuous variables• Independence of pairs of observations• Ho is true
Hypotheses:
Ho : ρxy = 0
HA : ρxy > 0 or ρxy < 0
Goal: ? ≤ ρxy ≤ ?
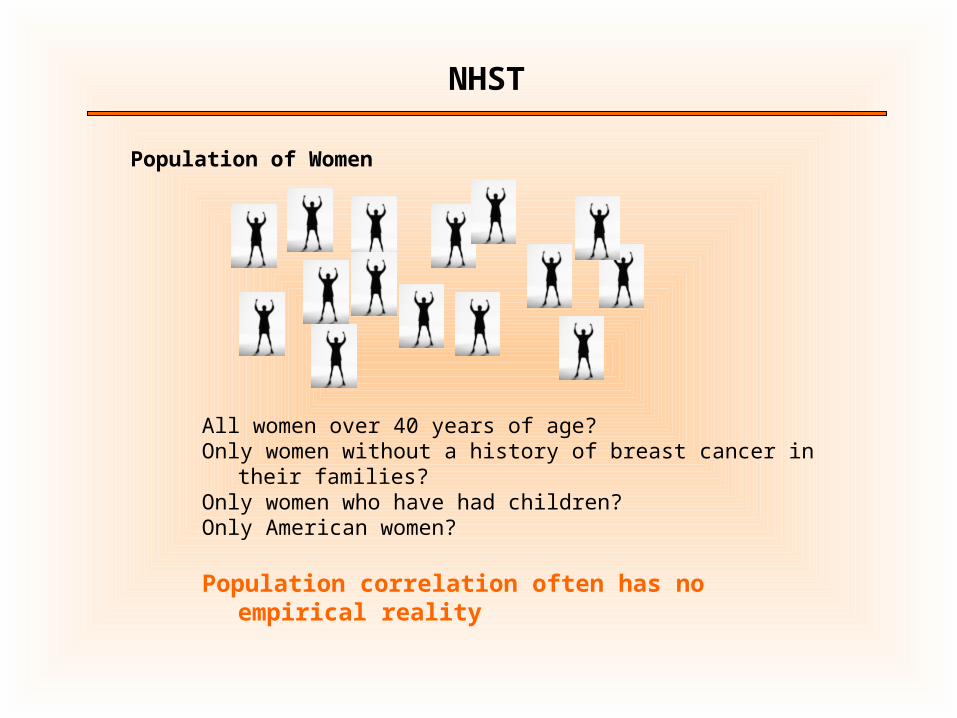
Population of Women
All women over 40 years of age?Only women without a history of breast cancer in their families?Only women who have had children?Only American women?
Population correlation often has no empirical reality
NHST
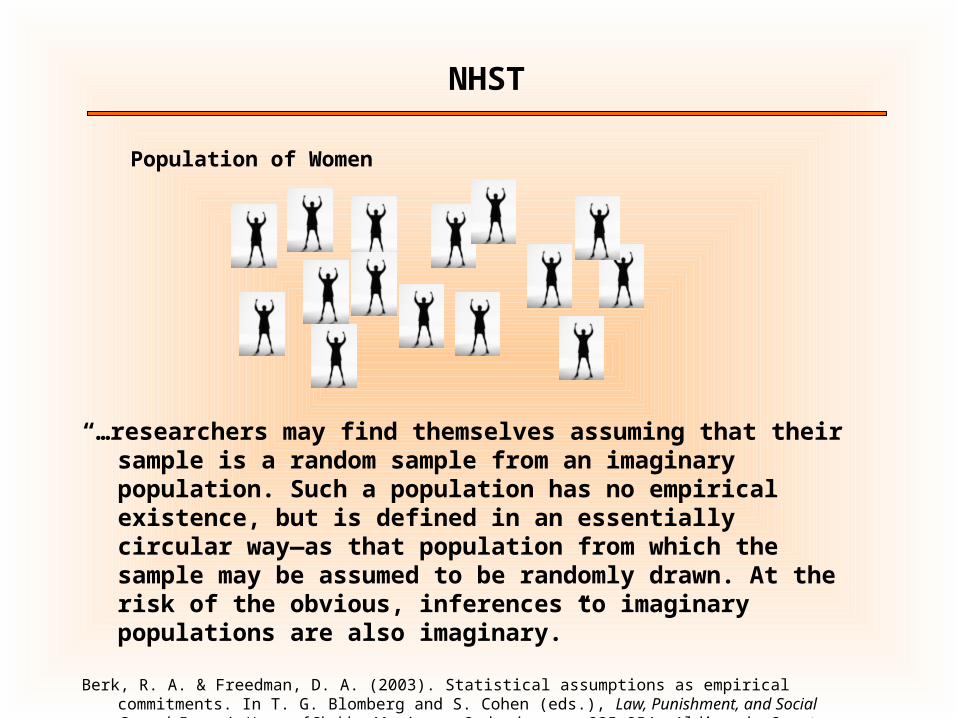
Population of Women
“…researchers may find themselves assuming that their sample is a random sample from an imaginary population. Such a population has no empirical existence, but is defined in an essentially circular way—as that population from which the sample may be assumed to be randomly drawn. At the risk of the obvious, inferences to imaginary populations are also imaginary.”
Berk, R. A. & Freedman, D. A. (2003). Statistical assumptions as empirical commitments. In T. G. Blomberg and S. Cohen (eds.), Law, Punishment, and Social Control: Essays in Honor of Sheldon Messinger, 2nd ed., pp. 235-254, Aldine de Gruyter.
NHST
NHST
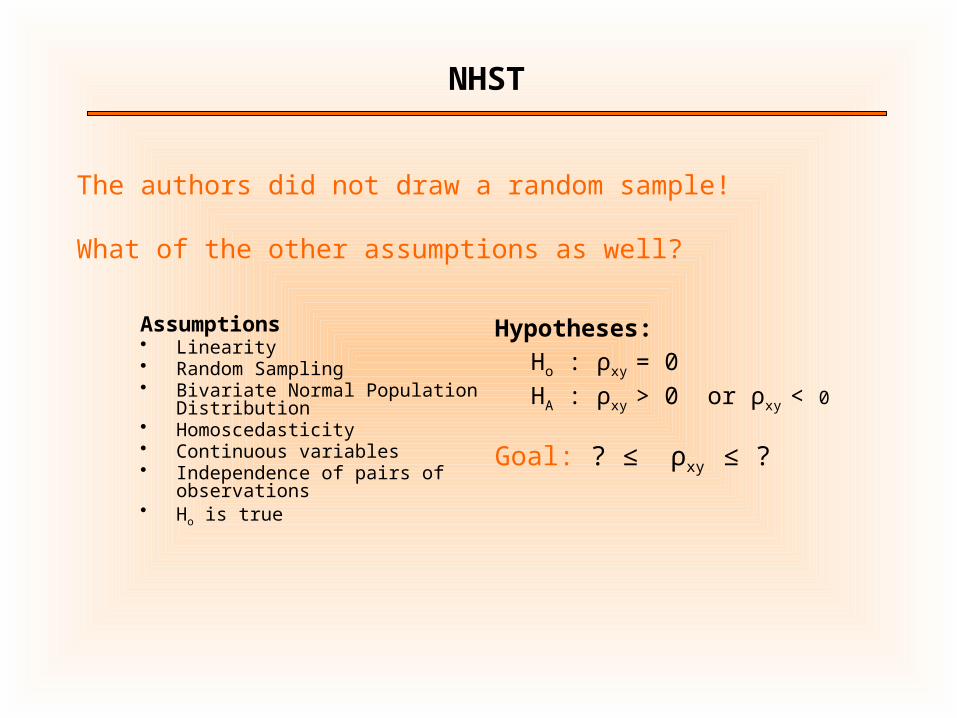
Assumptions• Linearity• Random Sampling• Bivariate Normal Population Distribution• Homoscedasticity• Continuous variables• Independence of pairs of observations• Ho is true
Hypotheses:
Ho : ρxy = 0
HA : ρxy > 0 or ρxy < 0
Goal: ? ≤ ρxy ≤ ?
The authors did not draw a random sample!
What of the other assumptions as well?
NHST
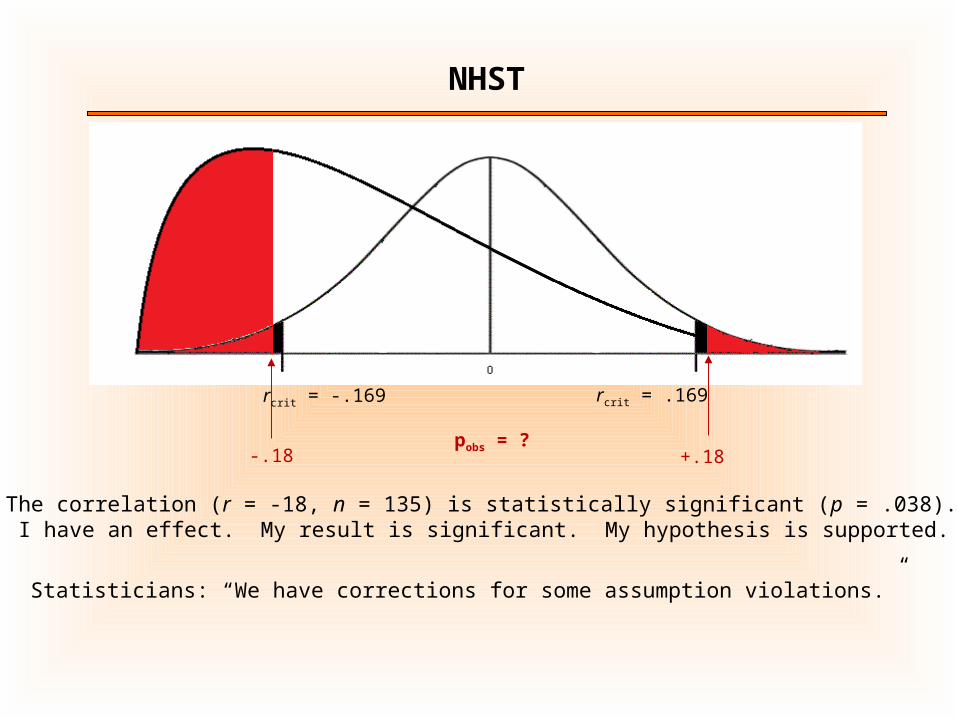
The correlation (r = -18, n = 135) is statistically significant (p = .038). I have an effect. My result is significant. My hypothesis is supported.
Statisticians: “We have corrections for some assumption violations.”
-.18 +.18pobs = ?
rcrit = -.169 rcrit = .169
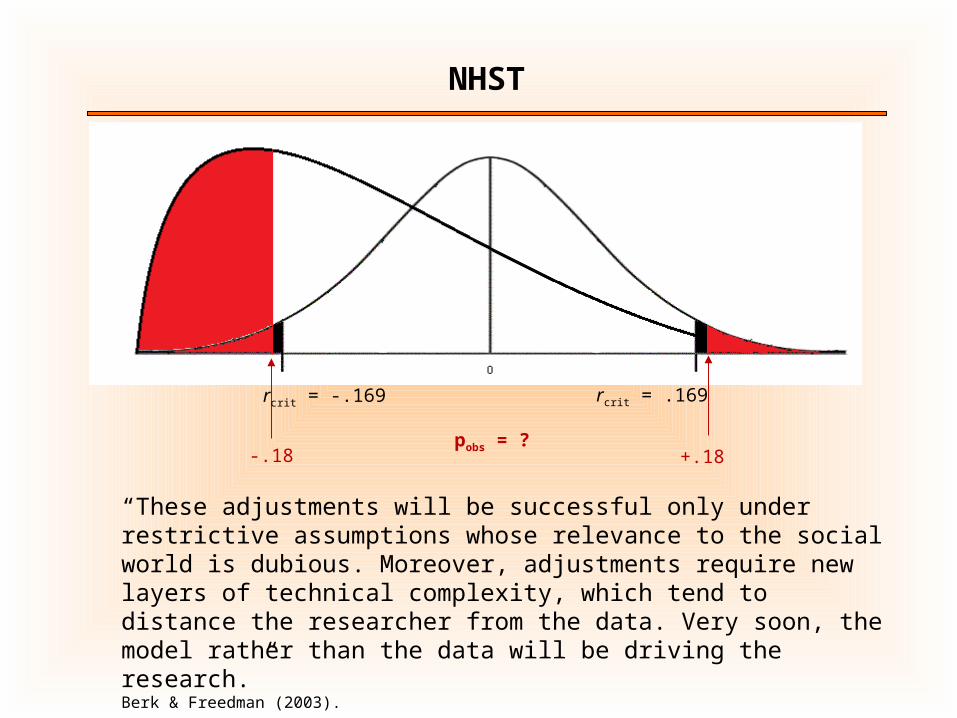
NHST
“These adjustments will be successful only under restrictive assumptions whose relevance to the social world is dubious. Moreover, adjustments require new layers of technical complexity, which tend to distance the researcher from the data. Very soon, the model rather than the data will be driving the research.” Berk & Freedman (2003).
-.18 +.18pobs = ?
rcrit = -.169 rcrit = .169
NHST
Paul Meehl: NHST is “one of the worst things that ever happened in the history of psychology” (p. 817; Journal of Consulting and Clinical Psychology, 46, 806-834).
Ioannidis, J. P. (2005). Why most published research findings are false. PLoS Med, 2(8), e124.
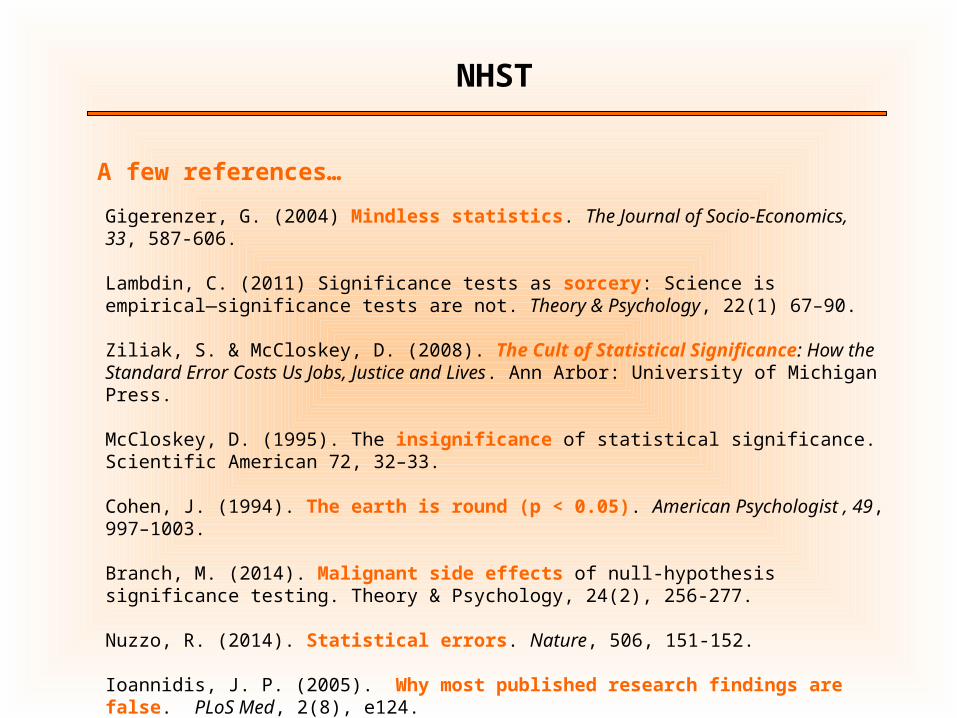
A few references…
NHST
Gigerenzer, G. (2004) Mindless statistics. The Journal of Socio-Economics, 33, 587-606.
Lambdin, C. (2011) Significance tests as sorcery: Science is empirical—significance tests are not. Theory & Psychology, 22(1) 67–90.
Ziliak, S. & McCloskey, D. (2008). The Cult of Statistical Significance: How the Standard Error Costs Us Jobs, Justice and Lives. Ann Arbor: University of Michigan Press.
McCloskey, D. (1995). The insignificance of statistical significance. Scientific American 72, 32–33.
Cohen, J. (1994). The earth is round (p < 0.05). American Psychologist , 49, 997–1003.
Branch, M. (2014). Malignant side effects of null-hypothesis significance testing. Theory & Psychology, 24(2), 256-277.
Nuzzo, R. (2014). Statistical errors. Nature, 506, 151-152.
Ioannidis, J. P. (2005). Why most published research findings are false. PLoS Med, 2(8), e124.
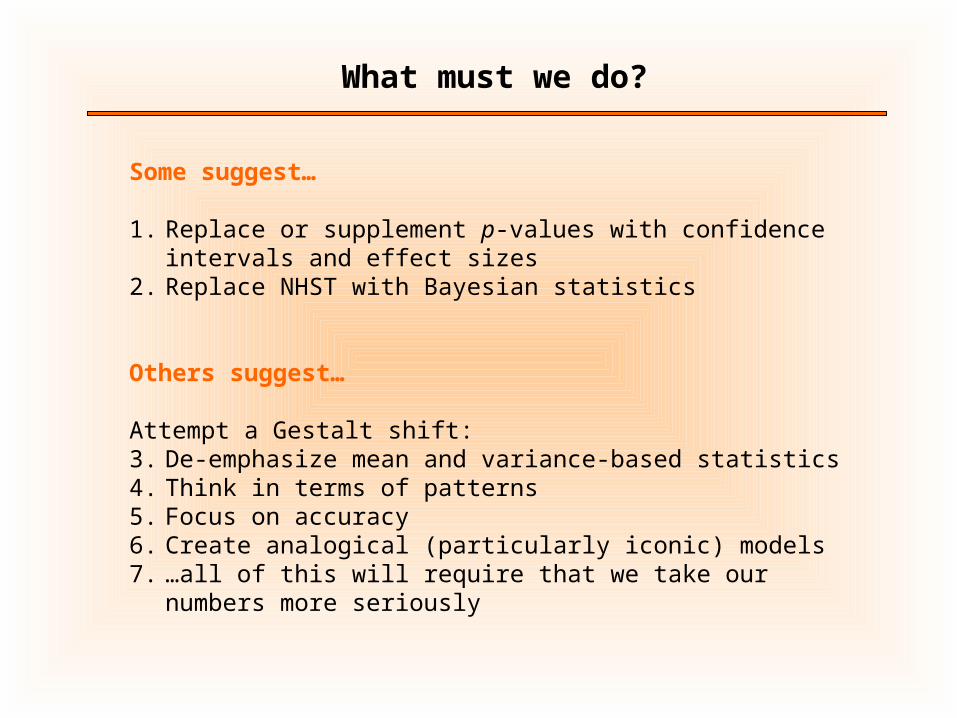
Some suggest…
1. Replace or supplement p-values with confidence intervals and effect sizes
2. Replace NHST with Bayesian statistics
Others suggest…
Attempt a Gestalt shift: 3. De-emphasize mean and variance-based statistics4. Think in terms of patterns5. Focus on accuracy6. Create analogical (particularly iconic) models7. …all of this will require that we take our numbers more seriously
What must we do?

Effect Sizes and Confidence Intervals
1. R2 = .67; p = .002; CI.95 = .40 to .94
2. R2 = .67; p = .002; CI.95 = .40 to .94
3. R2 = .67; p = .002; CI.95 = .40 to .94
4. R2 = .67; p = .002; CI.95 = .40 to .94
Notice the large effect sizes, small p-values, and moderately wide confidence intervals (df = 1,10)
Hypothetical Results from Four Studies:
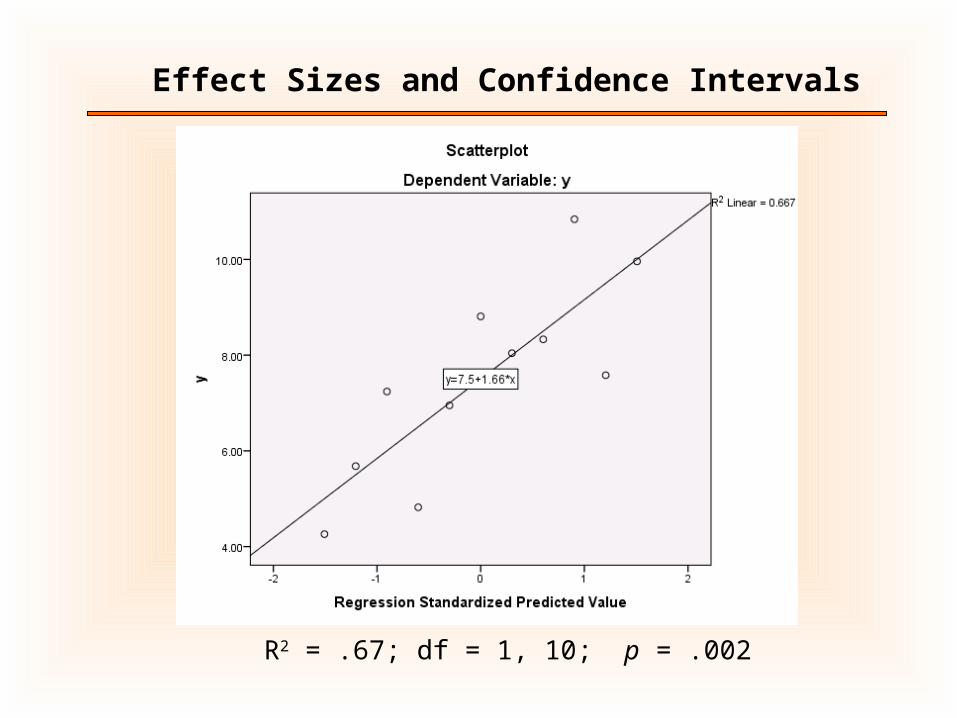
R2 = .67; df = 1, 10; p = .002
Effect Sizes and Confidence Intervals
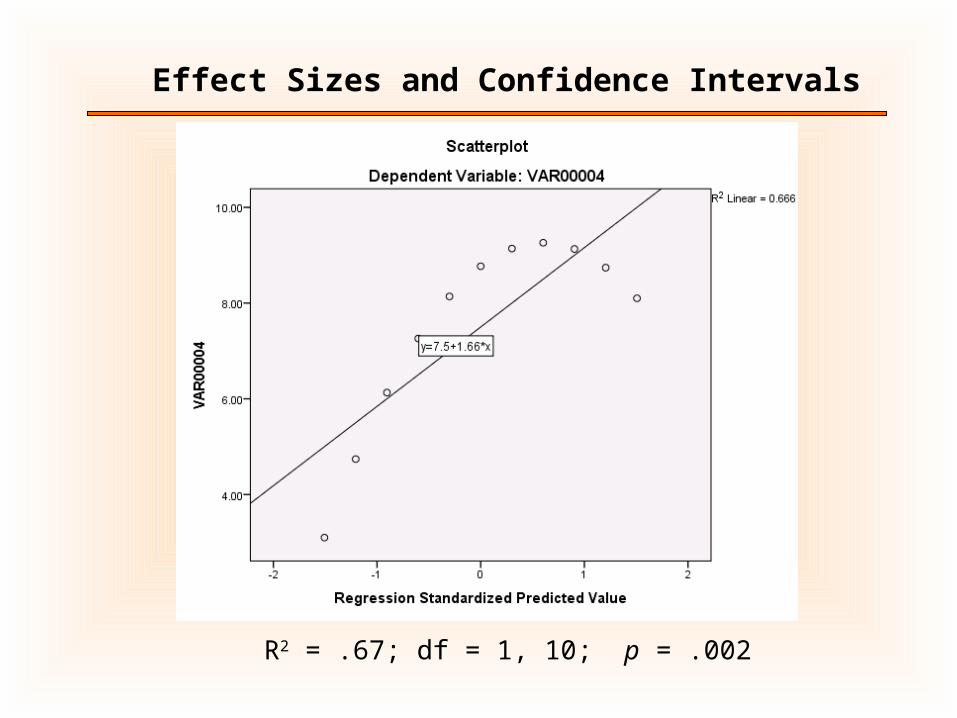
R2 = .67; df = 1, 10; p = .002
Effect Sizes and Confidence Intervals

R2 = .67; df = 1, 10; p = .002
Effect Sizes and Confidence Intervals

R2 = .67; df = 1, 10; p = .002
Effect Sizes and Confidence Intervals

• “LOT [optimism] scores were related inversely to delay…”• “Consistent with theory and prior research, overall, optimism
explained both delay and…” (p. 205)
• Optimism was a significant predictor of delay
Effect Sizes and Confidence Intervals
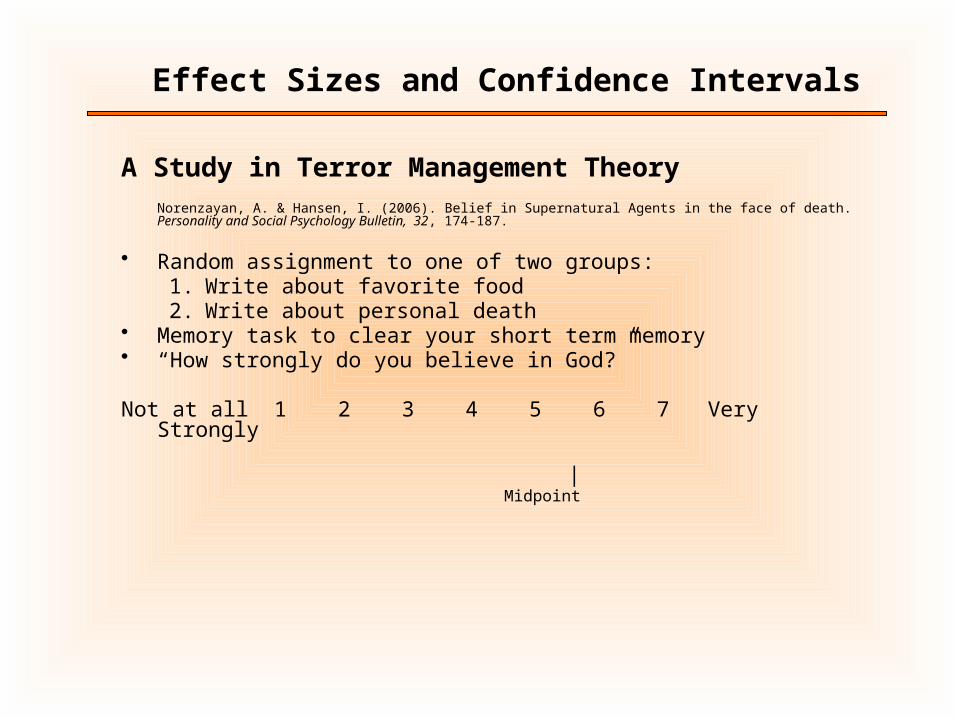
A Study in Terror Management TheoryNorenzayan, A. & Hansen, I. (2006). Belief in Supernatural Agents in the face of death. Personality and Social Psychology Bulletin, 32, 174-187.
• Random assignment to one of two groups:1. Write about favorite food2. Write about personal death
• Memory task to clear your short term memory• “How strongly do you believe in God?”
Not at all 1 2 3 4 5 6 7 Very Strongly
| Midpoint
Effect Sizes and Confidence Intervals

Thought of Death
Belief in God
t(64) = 2.18*
tx x
obsD F
s
n
s
np2
D
p2
F
Assumption-laden NHST
Assumptions• Random assignment (or sampling)• Normal population distributions• Homogeneity of population variances• Continuous dependent variable• Independence of observations• Ho is true• “p ≤ .05” is proper significance level
Goal is to estimate two population parameters, µDeath and µFood, and the difference between them.
Effect Sizes and Confidence Intervals
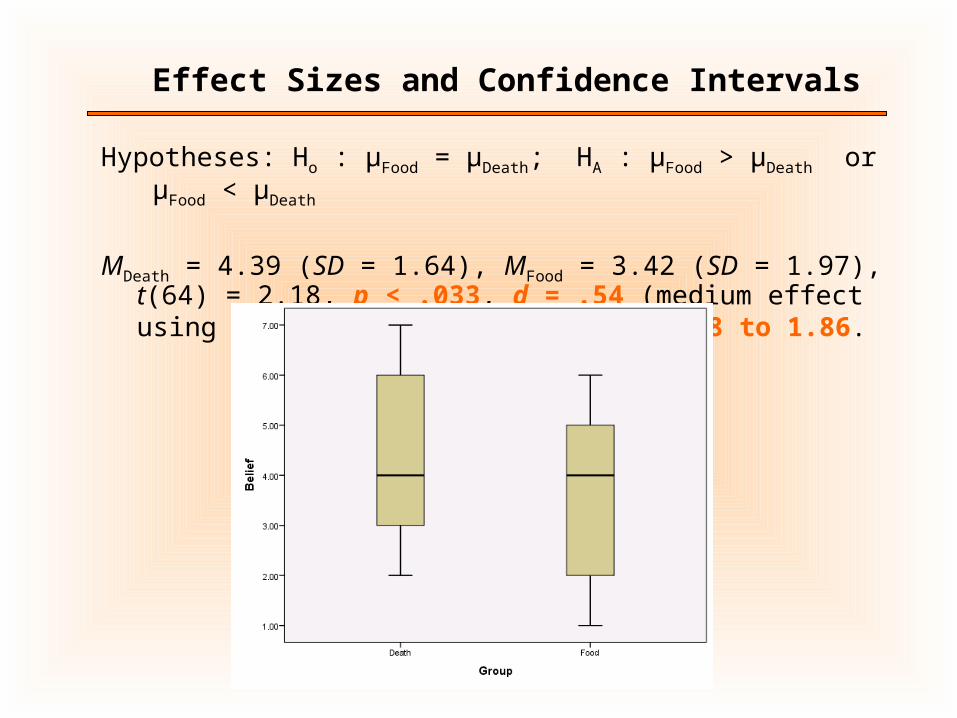
Hypotheses: Ho : μFood = μDeath; HA : μFood > μDeath or μFood < μDeath
MDeath = 4.39 (SD = 1.64), MFood = 3.42 (SD = 1.97), t(64) = 2.18, p < .033, d = .54 (medium effect using Cohen’s conventions), CI.95: .08 to 1.86.
Effect Sizes and Confidence Intervals

Effect Sizes and Confidence Intervals
Output from a Bayesian estimation program
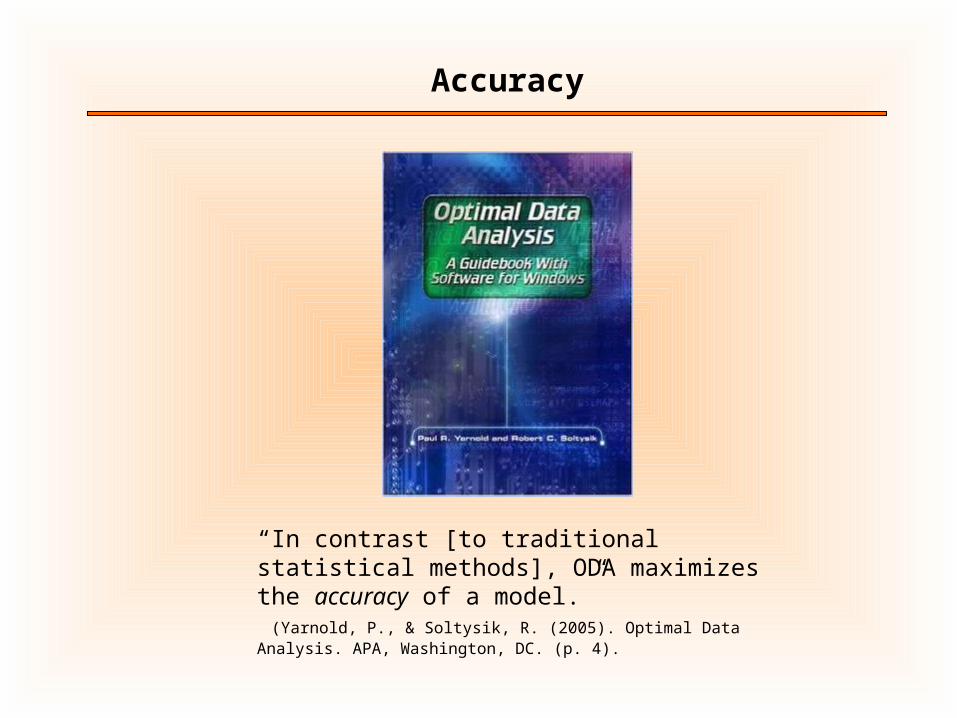
Accuracy
“In contrast [to traditional statistical methods], ODA maximizes the accuracy of a model.” (Yarnold, P., & Soltysik, R. (2005). Optimal Data Analysis. APA, Washington, DC. (p. 4).

Accuracy & Patterns
Focus on patterns and accuracy using the Percent Correct Classification (PCC) index

Thoughtof Death
IncreasedReligiosity
OOM shows the pattern of results makes no sense with regard to Terror Management Theory when examined at the level of the individuals in the study and when we attempt to take our numbers seriously
MDeath = 4.39 (SD = 1.64), MFood = 3.42 (SD = 1.97), t(64) = 2.18, p < .033, d = .54 (medium effect using Cohen’s conventions), CI.95: .08 to 1.86.
t(64) = 2.18*
Accuracy & Patterns
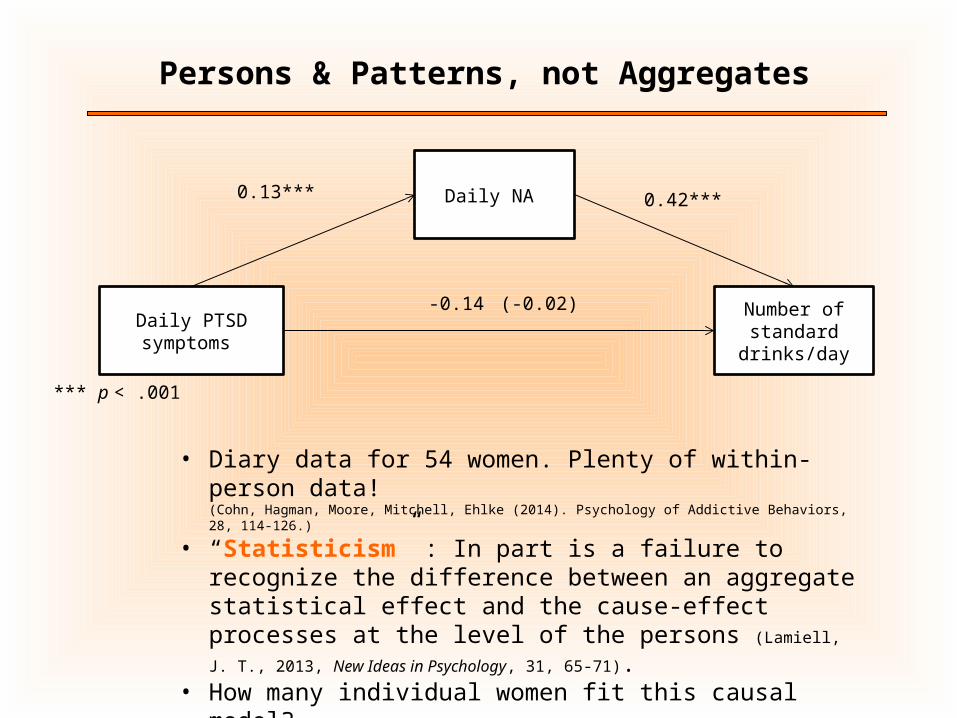
Daily NA
Daily PTSD symptoms
Number of standard
drinks/day
0.13*** 0.42***
-0.14
*** p < .001
(-0.02)
Persons & Patterns, not Aggregates
• Diary data for 54 women. Plenty of within-person data! (Cohn, Hagman, Moore, Mitchell, Ehlke (2014). Psychology of Addictive Behaviors, 28, 114-126.)
• “Statisticism” : In part is a failure to recognize the difference between an aggregate statistical effect and the cause-effect processes at the level of the persons (Lamiell, J. T., 2013, New Ideas in
Psychology, 31, 65-71).• How many individual women fit this causal model?

“Indeed, only six women responded to the survey on all 14 days, and the median number of completed days was equal to 11. The median PCC value was equal to 44.35, indicating general incongruity between the relative changes in PTSD and negative affect observations across all days and all women. More specifically, PCC values for only 23 women exceeded 50%, and of those only eight patterns 1) passed the eye test, 2) included seven or more days of observations, and 3) showed some variability in the observations.” Grice et al., in press.
Persons & Patterns, not Aggregates

Inferences
1. An inference to a population parameter : ? ≤ µDeath - µFood ≤ ?
2. An inference about aggregate statistics (in Bayesian analysis)
Rather than seeking:
We are seeking:
Inference to best explanation. Why are the data patterned in such and such a manner?

Aristotle
• Philosophical Realism : AKA “Reasoned common sense”
• Natural science (epistēmē) is demonstrable knowledge of nature through its causes
• Causes inhere in the things themselves and are knowable; this is causality
• Thing-based rather than event-based ontology• Cause : Material, Formal, Efficient, and Final
Philosophical Realism

Philosophical Realism
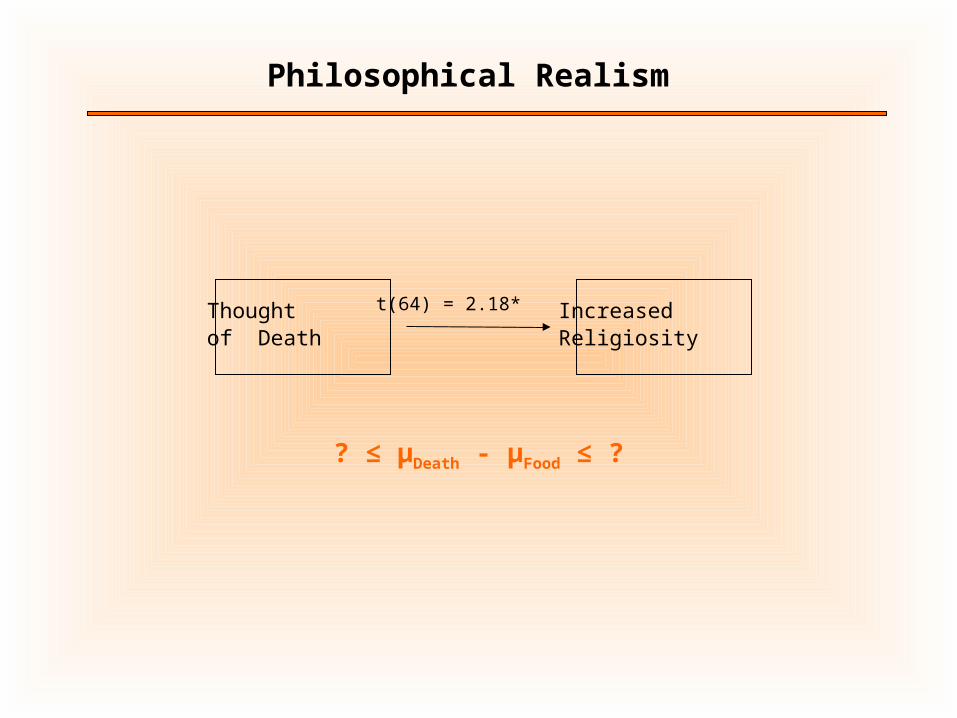
Thoughtof Death
IncreasedReligiosity
t(64) = 2.18*
? ≤ µDeath - µFood ≤ ?
Philosophical Realism

St. Thomas AquinasPhilosophical Realist
Philosophical Realism

Analogical (Iconic) Models
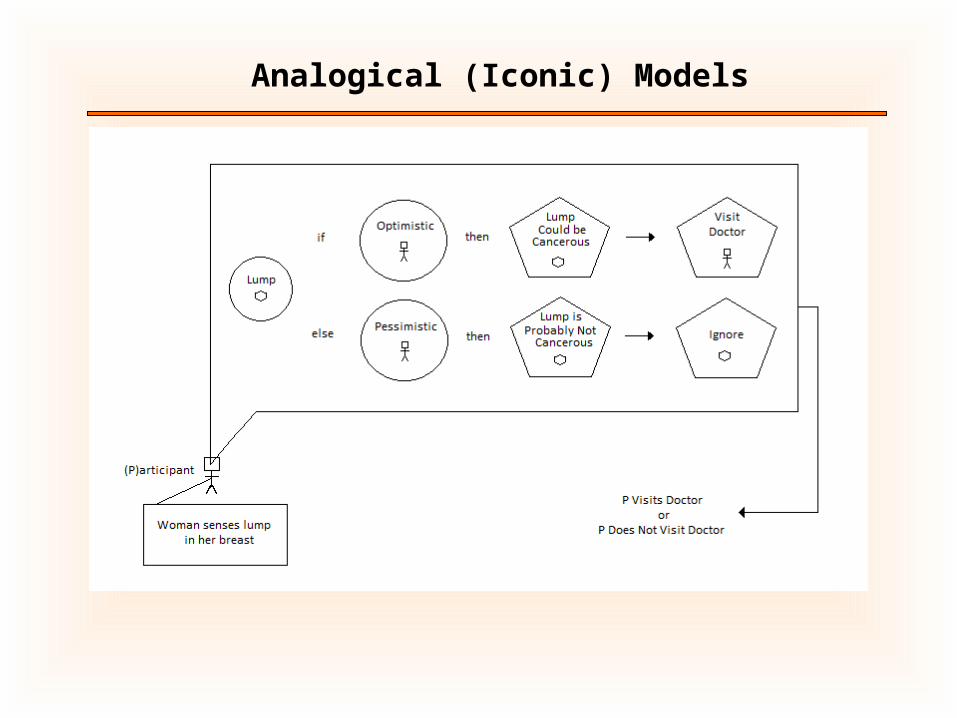
Analogical (Iconic) Models
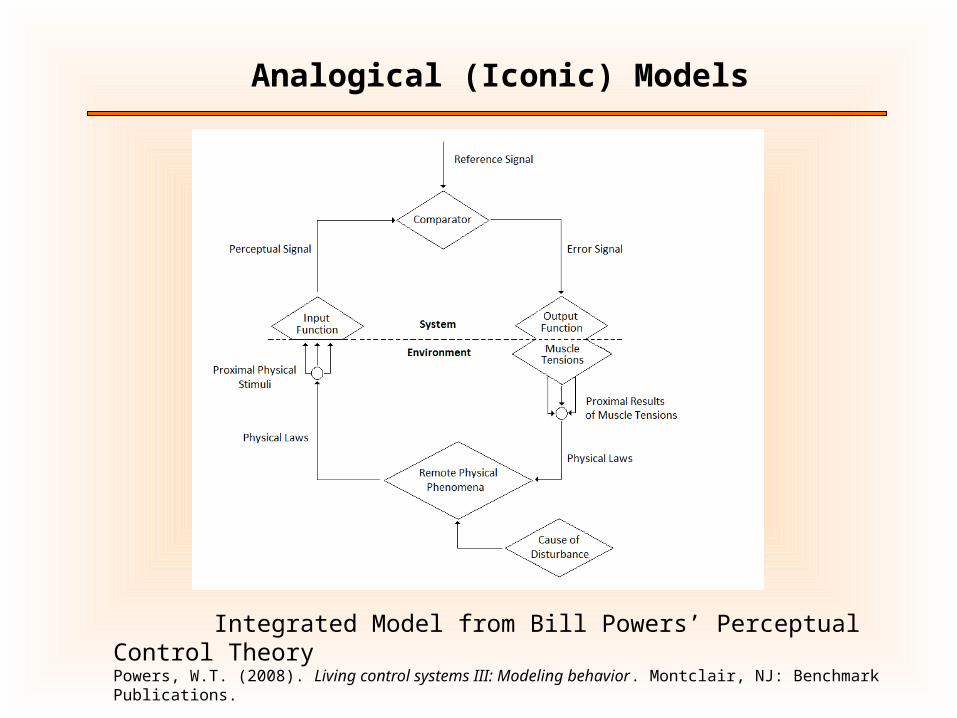
Integrated Model from Bill Powers’ Perceptual Control TheoryPowers, W.T. (2008). Living control systems III: Modeling behavior. Montclair, NJ: Benchmark Publications.
Analogical (Iconic) Models
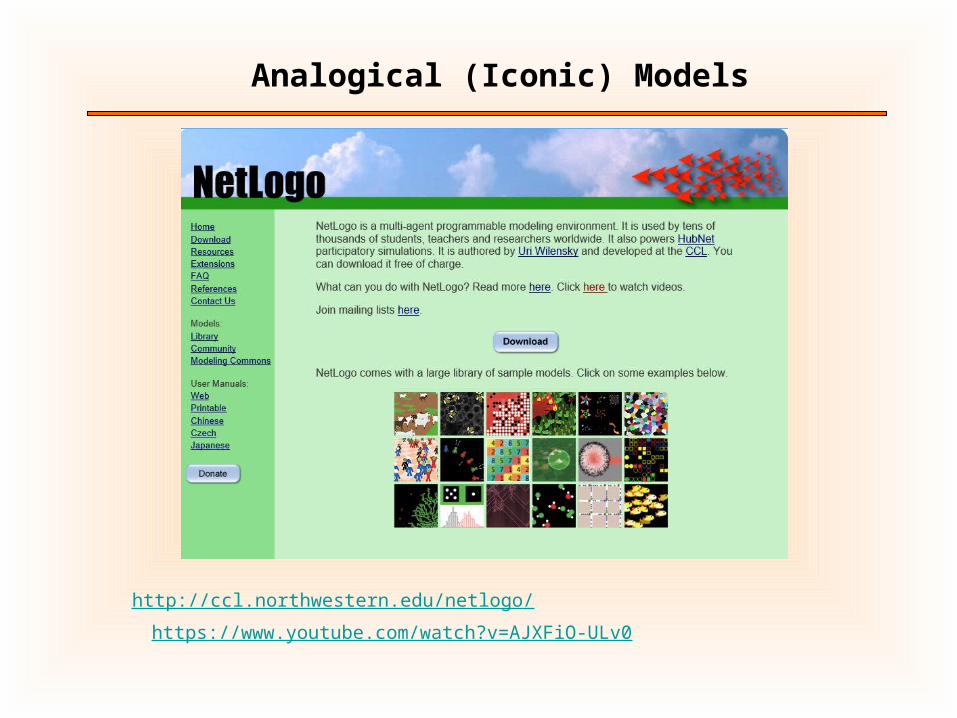
https://www.youtube.com/watch?v=AJXFiO-ULv0
http://ccl.northwestern.edu/netlogo/
Analogical (Iconic) Models
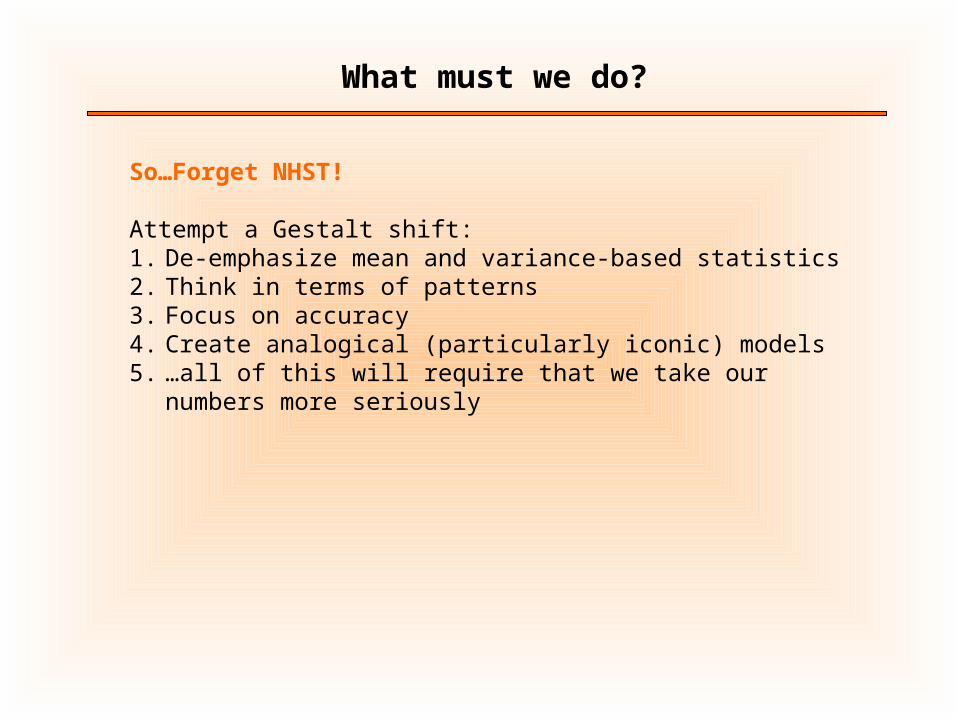
So…Forget NHST!
Attempt a Gestalt shift: 1. De-emphasize mean and variance-based statistics2. Think in terms of patterns3. Focus on accuracy4. Create analogical (particularly iconic) models5. …all of this will require that we take our numbers more seriously
What must we do?

The End
http://www.idiogrid.com/OOM