research.brighton.ac.uk James Thesis Final.pdfThe purpose of this thesis was to optimise preparation...
292
Optimising strategies to enhance endurance running performance under hot and humid conditions Carl James May 2016 School of Sport and Service Management
Transcript of research.brighton.ac.uk James Thesis Final.pdfThe purpose of this thesis was to optimise preparation...

Optimising strategies to enhance
endurance running performance under hot
and humid conditions
Carl James
May 2016
School of Sport and Service Management

II
Abstract
The purpose of this thesis was to optimise preparation for endurance runners competing
in a hot environment. A multidisciplinary approach was adopted, investigating acute and
chronic interventions to identify the most effective preparation. The determinants of
endurance performance model (Bassett & Howley 2000) facilitated simultaneous investigation
of the efficacy of interventions as well as the physiological mechanisms through which
interventions influence performance. Finally, a retrospective analysis was conducted to identify
the relationship between physiological markers and endurance running in the heat, in order to
inform training prioritisation.
Study 1 investigated the validity and reliability of skin temperature (TSKIN) measurement
tools at rest and during treadmill running, to identify an appropriate measurement tool for use
in subsequent studies, without restrictive trailing wires. A thermal camera provided insufficient
levels of validity and reliability for safe monitoring of TSKIN, while telemetry thermistors
provided a viable and more convenient alternative to the criterion measure of hard-wired
thermistors.
Study 2 investigated the effect of evidenced and practical internal (eg. ice slurry ingestion)
and external precooling (eg. ice packs, forearm immersion and cold garments) strategies during
incremental running in the heat. No differences were observed across the determinants of
endurance performance between cooling techniques, with both eliciting modest reductions in
blood lactate accumulation, compared with no cooling, which may prevent a decrement in the
lactate turnpoint speed under heat stress. However, external cooling elicited a greater
reduction in TSKIN and thermal sensation, alleviating perceived thermal strain further than
internal cooling.
Study 3 investigated ischaemic preconditioning (IP), which may enhance endurance
performance through haemodynamic and/or metabolic mechanisms, prior to incremental
running in the heat. IP had no effect on the determinants of endurance performance. The
thermoregulatory responses to exercise-induced hyperthermia may supersede previously
reported effects of IP, which is not recommended as an ergogen prior to exercise in the heat.
Study 4 investigated the effect of a chronic strategy, involving five days of controlled
hyperthermia heat acclimation (HA), on the determinants of endurance performance and a 5
km time trial in the heat. Heat acclimation improved VO2max, the lactate thresholds and 5 km
performance. Alleviated physiological, thermal and metabolic strain were observed, likely
attributable to enhanced cardiovascular stability and heat dissipation. Five days of controlled
hyperthermia HA appears to be a potent strategy to support endurance running in the heat.
Study 5 directly compared acute (external precooling), chronic (HA) and combined
(precooling & HA) strategies during 5 km running. Precooling did not improve performance
following HA, despite modest alleviation of physiological strain, which may indicate an
inappropriate pacing strategy. Heat acclimation improved performance further than precooling
(HA +6.6%, precooling +3.7%), indicating HA should be prioritised, although precooling appears
beneficial when acclimation is not possible.
Multiple, linear regression indicated the physiological determinants of endurance
performance do not accurately predict endurance performance in the heat (R2=0.72, standard
error of the estimate =105.6 s). The unexplained variation during endurance performance in
the heat may reflect a greater prominence of perceptual measures to influence running in the

III
heat. Preparation for competition in the heat should therefore prioritise improving perceived
thermal and exertional strain under heat stress, alongside improving traditional physiological
markers.

IV
Table of Contents
Abstract ...........................................................................................................................................II
Table of Contents ...................................................................................................................... IV
List of Figures ............................................................................................................................. X
List of Tables ........................................................................................................................... XIV
List of equations ...................................................................................................................... XVI
List of abbreviations ............................................................................................................... XVII
Acknowledgements ................................................................................................................. XIX
Declaration .............................................................................................................................. XXI
1 Introduction ............................................................................................................................1
2 Literature review .....................................................................................................................6
2.1 Endurance performance .................................................................................................6
2.1.1 Determinants of endurance performance ..............................................................6
2.1.2 VO2max ......................................................................................................................9
2.1.3 Blood lactate response......................................................................................... 12
2.1.4 Running Economy ................................................................................................ 19
2.1.5 Velocity at VO2max ................................................................................................. 22
2.1.6 Assessment of endurance exercise ...................................................................... 24
2.2 Human thermoregulation, heat stress and heat strain ............................................... 30
2.2.1 Heat exchange ...................................................................................................... 30
2.2.2 Human thermoregulation .................................................................................... 36
2.2.3 Interaction of heat stress and body temperature ............................................... 40
2.2.4 Quantifying heat stress and heat strain ............................................................... 42
2.3 Physiological effects of heat strain .............................................................................. 44
2.3.1 Skin blood flow ..................................................................................................... 44
2.3.2 Cardiovascular system ......................................................................................... 47
2.3.3 Sudomotor function ............................................................................................. 49
2.3.4 Skeletal muscle metabolism ................................................................................ 50
2.4 Endurance performance in the heat ............................................................................ 51
2.4.1 Effect of heat stress on the determinants of endurance performance ............... 55
2.4.2 Effect of heat stress during free-paced exercise ................................................. 58
2.4.3 Determinants of fatigue in endurance running ................................................... 62
2.5 Chronic strategies for exercise in the heat .................................................................. 63
2.5.1 Physiological adaptations to heat acclimation .................................................... 64
V
2.5.2 Endurance performance following heat acclimation ........................................... 73
2.5.3 Models of heat acclimation ................................................................................. 76
2.5.4 Induction and decay of heat acclimation ............................................................. 79
2.6 Acute strategies for exercise in the heat ..................................................................... 80
2.6.1 Precooling ............................................................................................................ 80
2.6.2 Ischemic Preconditioning ..................................................................................... 87
2.7 Conclusion .................................................................................................................... 92
2.8 Research Questions and Hypotheses ........................................................................... 95
3 General Methods ................................................................................................................. 97
3.1 Health and safety ......................................................................................................... 97
3.2 Participants .................................................................................................................. 97
3.3 Pre-trial diet and standardisation ................................................................................ 98
3.4 Exercise protocol .......................................................................................................... 99
3.5 Ambient Environment ................................................................................................ 101
3.6 Physiological measures .............................................................................................. 102
3.6.1 Anthropometry .................................................................................................. 102
3.6.2 Hydration ........................................................................................................... 103
3.6.3 Determinants of endurance performance ......................................................... 104
3.6.4 Blood glucose concentration ............................................................................. 108
3.6.5 Core temperature .............................................................................................. 109
3.6.6 Skin temperature ............................................................................................... 112
3.6.7 Heart rate ........................................................................................................... 113
3.6.8 Perceived exertion ............................................................................................. 113
3.6.9 Thermal sensation .............................................................................................. 114
3.6.10 Sweat rate .......................................................................................................... 114
3.7 Calculations ................................................................................................................ 114
3.7.1 Change in Plasma Volume .................................................................................. 114
3.7.2 Physiological strain index ................................................................................... 114
3.7.3 Mean skin temperature ..................................................................................... 114
3.8 Statistical analyses ..................................................................................................... 114
4 Reliability and validity of skin temperature measurement by telemetry thermistors and a
thermal camera during exercise in the heat .............................................................................. 116
4.1 Abstract ...................................................................................................................... 116
4.2 Introduction ............................................................................................................... 116
4.3 Methods ..................................................................................................................... 119

VI
4.3.1 Participants ........................................................................................................ 119
4.3.2 Experimental design ........................................................................................... 119
4.3.3 Measurement tools ............................................................................................ 119
4.3.4 Procedures ......................................................................................................... 120
4.3.5 Statistical Analyses ............................................................................................. 122
4.4 Results ........................................................................................................................ 125
4.4.1 Waterbath reliability comparison ...................................................................... 125
4.4.2 Waterbath validity comparison ......................................................................... 126
4.4.3 Skin temperature reliability at rest and during exercise.................................... 128
4.4.4 Skin temperature validity comparison ............................................................... 131
4.5 Discussion ................................................................................................................... 134
4.5.1 Waterbath validity comparison ......................................................................... 134
4.5.2 Waterbath reliability comparison ...................................................................... 135
4.5.3 Skin temperature validity comparison ............................................................... 135
4.5.4 Skin temperature reliability comparison ........................................................... 137
5 Physiological responses to incremental exercise in the heat following internal and external
precooling .................................................................................................................................. 139
5.1 Abstract ...................................................................................................................... 139
5.2 Introduction ............................................................................................................... 139
5.3 Method ...................................................................................................................... 142
5.3.1 Participants ........................................................................................................ 142
5.3.2 Experimental design ........................................................................................... 142
5.3.3 Cooling interventions ......................................................................................... 143
5.3.4 Graded exercise tests ......................................................................................... 144
5.3.5 Physiological measures ...................................................................................... 144
5.3.6 Statistical Analyses and Derivative Calculations ................................................ 145
5.4 Results ........................................................................................................................ 145
5.4.1 Physiological responses ..................................................................................... 145
5.4.2 Thermoregulatory responses ............................................................................. 147
5.4.3 Perceptual measures.......................................................................................... 150
5.5 Discussion ................................................................................................................... 151
5.5.1 Effects of cooling ................................................................................................ 151
5.5.2 Responses to internal and external precooling ................................................. 153
6 Ischaemic preconditioning does not alter the determinants of endurance running
performance in the heat. ........................................................................................................... 156

VII
6.1 Abstract ...................................................................................................................... 156
6.2 Introduction ............................................................................................................... 156
6.3 Methods ..................................................................................................................... 159
6.3.1 Participants ........................................................................................................ 159
6.3.2 Experimental Design .......................................................................................... 159
6.3.3 Ischaemic Preconditioning ................................................................................. 159
6.3.4 Graded exercise tests ......................................................................................... 160
6.3.5 Physiological measures ...................................................................................... 161
6.3.6 Statistical Analyses and Derivative Calculations ................................................ 161
6.4 Results ........................................................................................................................ 163
6.5 Discussion ................................................................................................................... 167
7 Short term heat acclimation improves the determinants of endurance performance and
running time trial performance in the heat. .............................................................................. 173
7.1 Abstract ...................................................................................................................... 173
7.2 Introduction ............................................................................................................... 174
7.3 Methods ..................................................................................................................... 176
7.3.1 Participants ........................................................................................................ 176
7.3.2 Experimental design ........................................................................................... 177
7.3.3 Graded exercise test .......................................................................................... 179
7.3.4 Time trial ............................................................................................................ 179
7.3.5 Training .............................................................................................................. 180
7.3.6 Statistical analyses ............................................................................................. 181
7.4 Results ........................................................................................................................ 181
7.4.1 Participants ........................................................................................................ 181
7.4.2 Heat acclimation adaptation .............................................................................. 182
7.4.3 Training .............................................................................................................. 184
7.4.4 Effect of heat stress ........................................................................................... 184
7.4.5 Determinants of endurance performance after training ................................... 186
7.4.6 Time trial performance ...................................................................................... 188
7.5 Discussion ................................................................................................................... 189
7.5.1 Heat acclimation ................................................................................................ 189
7.5.2 Effect of heat stress during GXT 1 ...................................................................... 191
7.5.3 Effect of training on GXT and time trial performance ....................................... 193
8 Effect of heat acclimation and precooling on 5 km running time trial performance in the
heat 197

VIII
8.1 Abstract ...................................................................................................................... 197
8.2 Introduction ............................................................................................................... 198
8.3 Methods ..................................................................................................................... 200
8.3.1 Participants ........................................................................................................ 200
8.3.2 Experimental design ........................................................................................... 200
8.3.3 Precooling .......................................................................................................... 201
8.3.4 Heat acclimation ................................................................................................ 201
8.3.5 Exercise trials ..................................................................................................... 202
8.3.6 Statistical analyses ............................................................................................. 202
8.4 Results ........................................................................................................................ 202
8.4.1 Graded exercise tests ......................................................................................... 202
8.4.2 Time trial performances ..................................................................................... 203
8.5 Discussion ................................................................................................................... 209
8.5.1 Combined heat acclimation and precooling ...................................................... 209
8.5.2 Comparison of heat acclimation and precooling ............................................... 210
9 Efficacy of the determinants of endurance performance for predicting time trial
performance in the heat ............................................................................................................ 214
9.1 Introduction ............................................................................................................... 214
9.2 Methods ..................................................................................................................... 214
9.3 Results ........................................................................................................................ 215
9.4 Discussion ................................................................................................................... 216
10 General Discussion ......................................................................................................... 222
10.1 Thesis aims ................................................................................................................. 222
10.2 Summary of findings .................................................................................................. 223
10.3 Efficacy of acute and chronic interventions for enhancing the determinants of
endurance performance ........................................................................................................ 225
10.3.1 VO2max ................................................................................................................. 226
10.3.2 Blood lactate response....................................................................................... 229
10.3.3 Running economy .............................................................................................. 232
10.3.4 vVO2max ............................................................................................................... 235
10.4 Unexplained variance during endurance performance in the heat ........................... 236
10.5 Practical applications ................................................................................................. 240
10.6 Limitations.................................................................................................................. 243
10.7 Future directions ........................................................................................................ 244
10.8 Conclusion .................................................................................................................. 247

IX
11 References ..................................................................................................................... 249
Appendix 1 – informed consent form ........................................................................................ 268
Appendix 2 – medical questionnaire ......................................................................................... 269

X
List of Figures
Figure 1: Simplification of interplay between determinants of endurance performance to
influence distance running performance. .......................................................................................6
Figure 2: VO2max may improve in the first months of training, but larger changes are observed in
%VO2max. ..........................................................................................................................................7
Figure 3: Hypothetical lactate threshold and lactate turnpoint identified in accordance with the
recommendations of Saunders and Green (2013). ..................................................................... 16
Figure 4: Hypothetical lactate threshold and lactate turnpoint identified in accordance with the
recommendations of Spurway and Jones (2007). ....................................................................... 17
Figure 5: Theoretical representation of determining the maximum lactate steady state. ......... 19
Figure 6: Factors that could determine RE (Saunders et al. 2004b). ........................................... 21
Figure 7 :The athlete denoted by grey triangles demonstrates a higher running speed when VO2
is extrapolated to maximal intensity (Jones 2006b). ................................................................... 23
Figure 8: Schematic of thermoregulatory control system. From Sawka & Young (2006). .......... 37
Figure 9: Different change in TCORE when exercising at %VO2max in groups with high (HI) and low
(LO) VO2max. ................................................................................................................................... 40
Figure 10: The prescriptive zone (Lind, 1963), whereby a steady-state body temperature can be
achieved under compensable heat stress (CHS), but not uncompensable heat stress (UCHS). . 41
Figure 11: Thermoregulatory control of skin blood flow as modified by moderately intense
exercise. (Gonzalez-Alonso et al. 2008). ...................................................................................... 46
Figure 12: Estimated external work and metabolic heat production during world record track
performances over distances from 100m through to the marathon (Taylor & Cotter 2006). .... 52
Figure 13: Relationship between reduction in exercise capacity (PTIME) and reduction in VO2max in
the heat (Arngrimsson et al. 2004). ............................................................................................. 57
Figure 14: Integrative model of potential cardiovascular, respiratory, central nervous system
and peripheral factors that influence fatigue during exercise in the heat (Nybo et al. 2014) .... 61
Figure 15: Effect of heat acclimation on maximal cardiac output, stroke volume and heart rate
during a VO2max test in cool (13°C) and hot (38°C) environments (Lorenzo et al. 2010). ............ 67
Figure 16: Effect of 10 days fixed intensity HA versus normothermic control training on
cutaneous vascular conductance (CVC) in response to 1 , 10 and 100 mMol.L-1 acetylcholine
infusion. (Lorenzo & Minson 2010).............................................................................................. 69
Figure 17: Predicted changes in mean body temperature for heat-acclimated and non-
acclimated athletes at world record pace over distances from 100 m to marathon, in ambient
and hot environments (Taylor & Cotter 2006). ........................................................................... 74

XI
Figure 18: Percentage change for cardiorespiratory variables (Qcmax = maximal cardiac output)
and time trial performance in hot and cool conditions, following HA. (Lorenzo et al. 2010). .... 75
Figure 19: Core temperature changes on days 1, 4, 8 and 12 of two, 12-day heat acclimation
regimens using either the fixed intensity or isothermic methods (Taylor & Cotter 2006).......... 77
Figure 20: Simplification of the induction of heat acclimation adaptation (Périard et al. 2015). 79
Figure 21: Modified from Bongers et al. (2015). Forest plot summarising the effects of different
cooling techniques on exercise performance for the precooling studies. .................................. 82
Figure 22: Cooling rates associated with different external modalities with healthy
hyperthermic athletes and heatstroke casualties (Casa et al. 2005). .......................................... 82
Figure 23: Effect sizes (Cohen’s d) for ice slurry ingestion versus control (Jones et al. 2012). ... 86
Figure 24: Protocol overview. Entire protocol completed in hot environment. ‘GXT 1’ denotes 3
min exercise stages with increments of 1km.h-1. ‘GXT 2’ denotes gradient based test to
exhaustion incorporating 1 min stages with increments of 1%. ............................................... 100
Figure 25 Environmental chamber within Welkin Laboratories, Eastbourne, UK. .................... 101
Figure 26: Location of thermistors on chest, upper arm and thigh. Thermal camera
measurements were taken beside the thermistors, ensuring patches did not interfere with
measurement. ............................................................................................................................ 121
Figure 27: Mean uncorrected data from hard-wired, telemetry system and thermal camera
during each waterbath plateau temperature across the range 25-40°C. .................................. 127
Figure 28: Mean (±SD) reliability of wired thermistors, telemetry thermistors and thermal
camera measuring skin temperature. ........................................................................................ 130
Figure 29: Protocol overview. Entire protocol completed in hot environment. ‘GXT 1’ involved 3
min exercise stages with increments of 1km.h-1. ‘GXT 2’ denotes gradient based test to
exhaustion incorporating 1 min stages with increments of 1%. ............................................... 143
Figure 30: Mixed methods external cooling involving cooling shorts, hand immersion, ice vest
and cold towel around the head and neck. ............................................................................... 144
Figure 31: Mean (±SD) lactate response over six incremental sub-maximal exercise stages. .. 146
Figure 32: Mean (±SD) blood lactate versus oxygen uptake during GXT 1. ............................... 147
Figure 33A: Mean (±SD) core temperature response B: Mean (±SD) skin temperature response
across protocol. .......................................................................................................................... 149
Figure 34: Mean (±SD) physiological strain index across 6 incremental exercise stages. ......... 150
Figure 35: Mean (±SD) thermal sensation across rest, precooling and exercise phases ........... 151
Figure 36: Protocol overview. The entire protocol was completed in a hot environment. ‘R’ and
‘L’ represent occlusion of right and left legs, respectively. ‘GXT 1’ denotes 3 min exercise stages

XII
with increments of 1km.h-1. ‘GXT 2’ denotes gradient based test to exhaustion, incorporating 1
min stages with increments of 1%. ............................................................................................ 160
Figure 37: Running speed at 2 & 4 mMol.L-1 respectively. ........................................................ 164
Figure 38: Mean (±SD) blood lactate concentration during GXT 1 for IP and CON. .................. 164
Figure 39: VO2max during familiarisation, Control and IP............................................................ 165
Figure 40: Total running time during GXT 2. .............................................................................. 165
Figure 41: vVO2max during GXT 2 between conditions. ............................................................... 166
Figure 42: Mean (±SD) Core temperature throughout the protcocol. ...................................... 167
Figure 43: Overview of experimental design. ............................................................................ 177
Figure 44: Clockwise from top left: Pre and post STHA HR response (A), exercising TCORE (B),
thermal sensation (C) and RER (D) during GXT 1. ...................................................................... 183
Figure 45: Mean TCORE response to STHA and CON training across 5 days. ............................... 184
Figure 46: Mean (±SD) change in the determinants of endurance performance from graded
exercise tests under heat stress, relative to cool conditions. ................................................... 186
Figure 47: Mean (±SD) blood lactate response during graded exercise under heat stress,
compared to cool conditions. Error bars represent one standard deviation. ........................... 186
Figure 48: Mean (±SD) percentage change in the determinants of endurance performance
following STHA and CON. Error bars represent one standard deviation. .................................. 187
Figure 49: Mean (±SD) kilometre split times during the 5 km time trial. .................................. 188
Figure 50: Mean and individual data of percentage change in VO2max and 5 km time trial
performance following heat acclimation (STHA) and normothermic training (CON). .............. 189
Figure 51: Overview of experimental design. ............................................................................ 201
Figure 52: Individual comparisons between conditions. ........................................................... 204
Figure 53: Mean (±SD) kilometre split times during the 5 km time trial. .................................. 204
Figure 54: Clockwise from top left: Mean (±SD) core temperature (A), skin temperature (B),
thermal sensation (C) and core:skin gradient (D) during rest, cooling and exercise phases of the
time trial protocol. ..................................................................................................................... 207
Figure 55: Mean percentage of maximum heart rate maintained throughout each trial. ........ 208
Figure 56: Relationships between the determinants of endurance performance when measured
in a hot environment and 5 km time trial performance in the heat.. ....................................... 218
Figure 57: Relationships between the determinants of endurance performance when measured
in a cool environment and 5 km time trial performance in the heat. ....................................... 220
Figure 58 Top: Blood lactate response to 5 days short term heat acclimation training. Bottom:
Blood lactate response to 5 days of normothermic training. .................................................... 232
Figure 59: Model of behavioural thermoregulation (Flouris & Schlader 2015). ....................... 238

XIII
Figure 60: Proposed theoretical model of the determining factors for self-selected running
speed in the heat. ...................................................................................................................... 239

XIV
List of Tables
Table 1: Pearson product–moment correlations between the determinants of endurance
performance and 16 km time trial performance (McLaughlin et al. 2010). ...................................9
Table 2: Reliability and sensitivity of the determinants of endurance performance. ................. 26
Table 3: Marathon runner’s skin blood flow requirements for several core (Tc) and skin (Tsk)
temperatures during heat stress (Kenefick et al. 2010). ............................................................. 47
Table 4: Comparison of normothermic (control) and hot (heat) environments on submaximal
aerobic performance during time trial and time to exhaustion tests (Nybo et al. 2014). ........... 54
Table 5: Effect of environmental heat stress (Heat) on VO2max and Physical Work Capacity (PWC)
during incremental intensity protocols, compared with temperate (Control) conditions.
Modified from Nybo et al. (2014). ............................................................................................... 56
Table 6: Physiological adaptations and functional consequences associated with the heat
acclimation phenotype that lead to improved thermal comfort and submaximal aerobic
performance, and increased maximal aerobic capacity (Périard et al. 2015). ............................ 65
Table 7: Reliability of resting blood lactate concentration. ....................................................... 104
Table 8: Reliability of 2 mMol.L-1. .............................................................................................. 105
Table 9: Reliability of 4 mMol.L-1. .............................................................................................. 106
Table 10: Reliability of mean running economy. ....................................................................... 107
Table 11: Reliability of VO2max. ................................................................................................... 108
Table 12: Reliability of vVO2max. ................................................................................................. 108
Table 13: Reliability of resting blood glucose concentration. .................................................... 109
Table 14: Reliability of exercising blood glucose concentration. ............................................... 109
Table 15: Inter-day reliability of TCORE.. ...................................................................................... 110
Table 16: Reliability of skin (TSKIN; wired thermistors) and core (TCORE; rectal thermistor)
temperature measurement at rest and during exercise. .......................................................... 111
Table 17: Reliability of resting TSKIN. ........................................................................................... 113
Table 18: Reliability of resting HR. ............................................................................................. 113
Table 19: Analytical limits adopted for both part 1 (waterbath) and part 2 (TSKIN measurement)
of this study................................................................................................................................ 123
Table 20: Reliability of wired thermistors, telemetry thermistors and thermal camera after
correction to account for difference in bath temperature between trials 1 and 2. .................. 125
Table 21: Validity of wired thermistors, telemetry thermistors and thermal camera relative to
the criterion thermocouple. ...................................................................................................... 128
Table 22: Reliability of wired thermistors, telemetry thermistors and thermal camera measuring
skin temperature at rest and during exercise. ........................................................................... 129

XV
Table 23: Tabular report of validity comparisons between hard wired thermistors, telemetry
thermistors and thermal camera at rest and during exercise. .................................................. 132
Table 24: Mean (±SD) change in core temperature and mean skin temperature across six
incremental exercise stages (left) and change per 5 min (right). .............................................. 148
Table 25: Physiological variables at rest during CON and IP, prior to cuff inflation. ................. 163
Table 26: Comparison of experimental groups. ......................................................................... 181
Table 27: Effect of 5 days STHA on recognised HA criteria.. ...................................................... 182
Table 28: Effect of heat stress on physiological variables. Exercising measures are taken after
~24 min of running during the final stage of (incremental) GXT 1 test. .................................... 185
Table 29: Relative difference in 5 km time trial performance between trials. .......................... 203
Table 30: Correlations (r) between the determinants of endurance performance and time trial
performance in existing literature and from this thesis (shown in bold). ................................. 216
Table 31: Improvements in dependent variables derived from graded exercise tests from
interventions investigated in this thesis. ................................................................................... 226

XVI
List of equations
Equation 1: Calculation of marathon running speed .............................................................................. 8
Equation 2: Calculation of mean running economy. ............................................................................ 20
Equation 3: Heat balance equation ...................................................................................................... 31
Equation 4: Calculation of metabolic heat production ......................................................................... 32
Equation 5: Calculation of outdoor wet bulb globe temperature ........................................................ 42
Equation 6: Calculation of indoor wet bulb globe temperature ........................................................... 43
Equation 7: Sweat rate prediction equation ......................................................................................... 50
Equation 8: Calculation of body density ............................................................................................. 103
Equation 9: Calculation of percentage body fat ................................................................................. 103
Equation 10: Change in plasma volume .............................................................................................. 114
Equation 11: Physiological strain index .............................................................................................. 114
Equation 12: Mean skin temperature ................................................................................................. 114

XVII
List of abbreviations
ANOVA Analysis of variance
b.min-1 Beats per minute
BHC Body heat content
BHS Body heat storage
BM Body mass
CI Confidence interval
CNS Central nervous system
CO Cardiac output
CO2 Carbon dioxide
CV Coefficient of variation
CON Control
CV Cardiovascular
d Cohen’s d effect size
η2 Eta squared effect size
EXT Mixed methods external cooling
GXT Graded exercise test
HW Hard wired thermistor system
HA Heat acclimation
HA+PC Heat acclimation and precooling
HR Heart rate
HRmax Maximum heart rate
Hb Haemoglobin
Hct Haematocrit
ICC Intraclass correlation coefficient
ICE Ice slurry drink
IP Ischemic preconditioning
IR Infrared
Kg Kilogram
Km.h-1 Kilometres per hour
LOA Limits of agreement
L.min-1 Litres per minute
LT Lactate threshold
LTP Lactate turnpoint

XVIII
LTHA Long term heat acclimation
MHP Metabolic heat production
Min Minutes
mL.kg.-1min.-1 Millilitres of oxygen per kilogram of body mass per minute
mmHg Millimetre of mercury
O2 Oxygen
OBLA Onset of blood lactate accumulation (4 mMol.L-1)
PC Precooling
PSI Physiological strain index
PTV Peak treadmill velocity
RE Running economy
RER Respiratory exchange ratio
RH Relative humidity
RPE Rating of perceived exertion
S Seconds
SD Standard deviation
STHA Short term heat acclimation
SV Stroke volume
TC Thermal camera
TCORE Core temperature
TEE Typical error of the estimate
TEL Telemetry thermistor system
TEM Typical error of the measure
TS Thermal sensation
TSKIN Skin temperature
TT Time trial exercise protocol
TTE Time to exhaustion exercise protocol
VO2 Oxygen consumption
VO2max Maximal oxygen consumption
VO2peak Peak oxygen uptake
vVO2max Estimated velocity at maximal oxygen consumption
WBGT Wet bulb globe index
XIX
Acknowledgements
I would like to thank the Brighton Doctoral College, as a University of Brighton Studentship
Award supported the work described in this thesis. I also extend my sincere thanks and
gratitude to all of my supervisory team. From the outset I realised how fortunate I was to have
such a range of experience and expertise, and these final months have only reinforced this.
Neil, firstly I thank you for taking a chance on someone interviewing through a dodgy skype
connection 3 ½ years ago. Your supervisory style has been enlightening, notably how your first
consideration is unfailingly your student’s welfare. I shall endeavour to heed your advice on
priorities and maintaining perspective throughout one’s career. Furthermore, your prompt
responses and relentless work ethic to ensure the best for me has not gone unnoticed and your
support has been integral in allowing me to get to this point.
Peter, in particular, I would like to thank you for always having the time to stop and explain
things to me whenever I came to your office unannounced. I have learned so much about the
correct scientific approach to a problem and all often explained in good humour.
Alan, similarly, your support and understanding of what a research student may be going
through has been invaluable throughout the last 3 years. I thank you for always being there to
help and advise on everything from the most subtle of scientific points, to the big picture and
career plans.
To all the other academic staff members who have been so helpful and always there to talk or
offer advice, notably Mark Hayes, Jeanne Dekerle and Gary Brickley, thank you. You have each
had large and meaningful influences on my development for which I am very grateful.
To my fellow and Environmental Extremes Laboratory members and post-grad students; Ben,
James, Ash, Oli, Jess, Gareth, Rosie, Cat, Drew, Fletch, Debbo, Lisa, Charlotte, Marina, Emily,
Kirsty, Jake, Rebecca and Aaron. The supportive environment in which we work, has been
integral throughout the development and completion of this thesis. I’ve made numerous great
friendships and I know we will continue to support each other throughout our future
endeavours.
To the technical staff at the Welkin Human Performance Labs; Tom Howes, no matter what
time of day or night you were there for advice when equipment didn’t work and you went over
and above to make my life easier. I would also like to thank Ron Shephard, Ann Attfield and
Patrick Smith for promptly resolving any issues that arose, and always with a smile. Thanks
guys. Of course, no data collection would be possible without individuals willing to undertake
repeated, strenuous physical exercise. Therefore, I thank all of the individuals who participated,
and reserve special thanks to Ben Duncan and Phil McCorry who participated in every study.
Finally, I would like to thank my family for all of your support and understanding over the last 3
and half years. Mum, Dad, Grandma, Christian, Sophie, Hugo, Tom, Barry and Robert, you have
helped me every step of the way and I couldn’t have done it without you behind me. This is the
reason I didn’t visit as often as I should! Finally, to Grandad. I am so sorry you are not here to
see the completion of my PhD. From an early age, you were emphatic about the importance of

XX
education and were a driving force behind me continuing in education and I dedicate this thesis
to you.
XXI
Declaration
I declare that the research contained in this thesis, unless otherwise formally indicated
within the text, is the original work of the author. The thesis has not been previously submitted
to this or any other university for a degree, and does not incorporate any material already
submitted for a degree.
Signed:
Dated: 31/03/2016
Academic publications from work within this thesis:
James, C., Richardson, A., Watt, P., & Maxwell, N. (2014). Reliability and validity of skin temperature
measurement by telemetry thermistors and a thermal camera during exercise in the heat. Journal of Thermal
Biology, 45, 141–149.
James, C, Richardson, A., Watt, P., Gibson, O., & Maxwell, N. (2015). Physiological responses to incremental
exercise following internal and external precooling. Scand J Med Sci Sports, 25 (Suppl. 1): 190-199.
Conference proceedings from work within this thesis:
James, C., Richardson, A., Watt, P., & Maxwell, N. Comparison of internal and external precooling on the
determinants of endurance running performance in hot and humid conditions. In Training and Competing in
the Heat 2014, Doha, Qatar. 23rd - 24th March 2014.

1 Introduction
For millennia humans have been required to complete strenuous physical work under
extreme environmental conditions, not least due to a necessity to hunt prey and survive
(Lieberman 2015). In more recent years, this challenge remains in occupational environments,
and is experienced by individuals across a range of industries that includes, but is not limited
to; construction, firefighting, military, mining and sport (Health and Safety Executive, 2015).
Within these fields, in particular, a deleterious effect of hot and humid conditions on prolonged
exercise duration and sporting performance is well-established (Galloway & Maughan 1997),
which is pertinent given that premier sporting competitions such as the Olympic Games and
IAAF World Championships routinely occur in the summer months and often in hot
environments. Moreover, competing under high ambient temperatures and humid conditions
presents potential impairments to an athlete’s health, as well as their exercise performance
(Bergeron 2014). Therefore, across many endurance sports, prolonged metabolic heat
production that arises from energy metabolism for locomotion, may exceed the cooling
capacity of the human body in a given environment (Mountjoy et al. 2012). This results in
considerable body heat storage and heightens the risk of hyperthermia, heat exhaustion or
heat stroke (Bergeron et al. 2012). To mitigate against these risks, many sporting governing
bodies, notably those of athletics, triathlon, soccer and tennis (Mountjoy et al. 2012), as well as
volleyball (Bahr & Reeser 2012), implement sport-specific heat stress policies which aim to
protect athletes when environmental conditions exceed predefined thresholds. However,
whilst these policies may reduce instances of extreme heat illness and medical emergencies
(Casa et al. 2015), they do not account for individual differences in body shape and size
(Racinais et al. 2015a). Moreover, the detrimental effects of heat stress on athletic
performance are widely observed in competitions that occur below these extreme threshold
temperatures (Guy et al. 2015; Ely et al. 2007; El Helou et al. 2012; Nassis et al. 2015; Mohr et
al. 2012). Consequently, across a range of sports, the potential remains for those who are
better prepared and adapted, to experience a smaller decrement in exercise performance, and
yield a competitive advantage when competing in the heat.
To prepare to perform in hot environments, humans have traditionally undergone repeated
heat exposures across a number of days, to promote physiological adaptations that will
enhance heat dissipation and work capacity (Wyndham et al. 1954; Fox et al. 1963; Greenleaf &
Greenleaf 1970). The origins of such strategies may in part, be traced back to the work of Aldo
Dreosti, a Physician working for Rand Mines Limited in Witwartersrand, South Africa. Dreosti
encouraged miners to undertake novel heat training sessions, progressively increasing their

2
exposure to hot conditions across 2 weeks, as well as developing a heat tolerance protocol to
screen prospective miners, as he sought to reduce the number of fatalities in the 1930s
(Schneider & Moseley 2014). Subsequently, throughout the mid-19th century, similar strategies
have been researched and refined, notably for military personnel (Fox et al. 1963; Greenleaf &
Greenleaf 1970; Taylor et al. 1995) and astronauts (Sciaraffa et al. 1980).
More recently, athletes who compete in a hot environment will undertake long term, heat
acclimatization on location, or a priori artificial heat acclimation programmes as part of their
preparation (Armstrong 1998). Undertaking specialised preparation such as these is necessary
given the fine margins that determine success at elite level (Hopkins 2005), as well as the
regularity with which major sporting events and competitions are scheduled for summer
months and/or hot locations. For example, at the 2008 Beijing Olympics ambient temperature
ranged between 21-31°C with relative humidity exceeding 60% (Ross et al. 2011).
Environmental conditions across the sites of the Rio de Janiero Olympics at the time of the
London Olympics indicate further thermal challenges during the 2016 Olympics, with peak
temperatures of 38°C and humidity exceeding 80%, displaying large variation from mean daily
ambient temperature of 26°C (National Institute of Meteorology Brazil 2015). This trend looks
set to continue with the 2019 IAAF World Championships and 2022 FIFA World Cup taking place
in Doha, Qatar.
Both acclimation and acclimatisation training1 are effective strategies to induct the heat
acclimation phenotype (Garrett et al. 2011), which is characterised by systemic
thermoregulatory, cardiovascular and sudomotor adaptations (Sawka et al. 2011). Evidence
advocating the use of heat acclimation strategies for improving sporting performance in the
heat is ubiquitous, within both endurance performance (Lorenzo et al. 2010; Schmidt et al.
2015) and higher-intensity team sports (Buchheit et al. 2011; Sunderland et al. 2008). Recent
evidence suggests the traditional approach of acclimating through repeated, prolonged low
intensity training may be optimised through manipulation of the primary stressors;
environmental conditions (temperature, radiant heat and humidity) and physical work
(intensity, duration and frequency). Accordingly, this manipulation may proffer a more
individual-specific adaptation, pertaining to sporting type (Sunderland et al. 2008) or sex (Mee
et al. 2015a), as well as reducing the overall training volume (Gibson et al. 2015b). However,
despite the emergence of more efficient strategies such as these, repeated acclimation or
acclimatisation training in a hot environment, across 5- 14 days, remains time-consuming and
costly. Furthermore, the transient nature of the heat acclimation phenotype necessitates this
1 Heat acclimation develops following exposure to controlled experimental conditions, whereas heat
acclimatization is produced in the naturally occurring environment (Sawka et al. 2011).

3
training occurs in the weeks prior to competition, which opposes a typical competition taper
phase (Spilsbury et al. 2015). Consequently, for endurance athletes competing in the heat, the
potential of acute interventions that do not have these restrictions, is being realised.
Acute internal (Siegel et al. 2012) or external (Minett, Duffield, et al. 2012) cooling of the
body in the hour prior to exercise, has been shown to mitigate against heat strain2 through
lowering core body temperature, permitting a greater heat storage capacity, and improving
thermal comfort during exercise. Accordingly, precooling techniques have been shown to
improve both self-paced endurance time trial performance (Cotter et al. 2001, Duffield et al.
2010) and time to exhaustion (Siegel et al. 2010). Despite the widespread support for adopting
both chronic (Chalmers et al. 2014; Garrett et al. 2011) and acute strategies (Tyler et al. 2015;
Jones et al. 2012) prior to exercise in the heat, there has yet to be a direct comparison between
techniques. Furthermore, a uni-disciplinary approach is apparent, with only a modest amount
of literature pertaining to the additive effect of combining interventions. This limited research
has been focussed upon intermittent sprint cycling (Castle et al. 2011; Brade et al. 2012) and
endurance cycling (Schmit et al. 2015), but does not provide conclusive evidence supporting
combining interventions. However, endurance running is characterised by a greater absolute
metabolic heat production (Millet et al. 2009) and reduced convective cooling, versus cycling,
which will result in an expedited elevation of body temperature (Cramer & Jay 2015).
Furthermore, given that endurance performance in the heat remains impaired in the
acclimated individual (Sawka et al. 1985, Lorenzo et al. 2010), the investigation of a multi-
disciplinary approach involving the combination of precooling and acclimation appears
warranted for runners.
However, such a multi-disciplinary approach may extend beyond specific thermal
interventions. For example, alternative, non-thermal acute interventions such as the
supplementation of caffeine (Hulston & Jeukendrup 2008) and sodium (Sims et al. 2007) have
both been highlighted as potential ergogens, and could complement an acclimation strategy.
However, the effectiveness of both caffeine (Roelands et al. 2011) and sodium
supplementation (Earhart et al. 2015) during exercise in the heat have been questioned. An
alternative acute intervention, the application of which in an exercise performance context is
relatively novel, is ischaemic preconditioning. Ischaemic preconditioning involves repeated
bouts of occlusion to major limbs and is established within clinical practice to prepare cardiac
muscle for subsequent stresses arising from surgical hypoxia, infarction and reperfusion
2 Heat stress refers to environmental (including clothing) and metabolic conditions that tend to
increase body temperatures; heat strain refers to physiological (e.g., body temperature) consequences of heat stress (Sawka et al. 2011).

4
(Hausenloy & Yellon 2008). Notable improvements have been observed in endurance exercise
performance under normothermic conditions following preconditioning (Bailey et al. 2012a; de
Groot et al. 2010), whilst emerging evidence indicates alleviation of physiological strain in other
extreme environments, such as hypoxia (Foster et al. 2011; Foster et al. 2014). Specifically,
maximal oxygen uptake (VO2max) may be enhanced following preconditioning (de Groot et al.
2010), whilst blood lactate concentration has been shown to be reduced during endurance
running (-1.07 mMol.L-1), prior to improved 5 km running time (2.5%, Bailey et al. 2012a).
Prominent purported mechanisms underpinning the effects of preconditioning are improved
peripheral haemodynamics improving blood flow to active skeletal muscles, thereby increasing
oxygen delivery and the removal of waste products (Bailey et al. 2012b), improved metabolism
through increased mitochondrial efficiency that proffers greater oxygenation of the muscle
(Cooper & Brown 2008), as well as the potential for desensitising of afferent feedback that may
facilitate the maintenance of a greater self-selected exercise intensity (Tocco et al. 2014).
Whilst the precise mechanisms underpinning exercise performance following preconditioning
have recently become a topic of fierce debate (Salvador et al. 2015), improved muscle blood
flow, greater aerobic capacity arising from improved muscle oxygenation and a reduced
perceived strain respectively, all have the potential to ameliorate endurance performance
impairments afforded by cardiovascular, metabolic and perceptual alterations that characterise
endurance performance in the heat (Nybo et al. 2014). However, this technique has yet to be
examined under heat stress. Ultimately, it would appear that the potential exists to optimise
existing endurance performance strategies, prior to competing in the heat, and a multi-
disciplinary approach should be investigated as a method of achieving this.
Endurance running performance is typically assessed through time trial and time to
exhaustion trials (Casa 1999; Maughan & Shirreffs 2004), with these occurring in a laboratory,
or artificially hot environment, such as an environmental chamber. Such protocols offer an
ecologically valid assessment of endurance performance by allowing free pacing (time trial), or
help to discern the physiological mechanisms that determine any changes in performance from
an intervention (time to exhaustion), but do not permit both (Stevens & Dascombe 2015).
Alternatively, both performance and physiological changes may be encapsulated within a single
test, by examining the physiological markers of the lactate turnpoint, running economy and
VO2max, with running economy and VO2max combining to provide a valid estimate of endurance
performance in velocity at VO2max (Bassett & Howley 2000; Denadai et al. 2004; Jones et al.
2006; Joyner & Coyle 2008). Collectively, these markers, known as the determinants of
endurance performance, account for a large proportion of the variability in endurance cycling
(Coyle 1999) and running performance (McLaughlin et al. 2010). Given that the lactate

5
turnpoint (Lorenzo et al. 2011) and VO2max (Nybo et al. 2014) are distinctly impaired in the heat,
and the lactate turnpoint remains a strong predictor of endurance performance in both hot and
cold environments (Lorenzo et al. 2011), this would appear a sensitive and valid model for
holistically evaluating endurance performance under heat stress.
Therefore, this thesis will investigate how acute and chronic strategies, both individually
and collectively, can mediate the decline in endurance performance in the heat, in order to
optimise competition preparation for an endurance runner who will compete in the heat.
Furthermore, the determinants of endurance performance exercise model will facilitate a
better understanding of how these interventions impact on physiology, and in turn
performance.
The following literature review will provide an overview of relevant literature pertaining to
endurance running under heat stress and the potential strategies that may be used to enhance
heat tolerance and ameliorate the deleterious effects to running performance. The review will
begin by examining the mechanisms underpinning endurance performance and the
physiological markers that combine effectively to determine performance. The review will then
consider the range of exercise models that can be adopted to validly and reliably assess
endurance running, before introducing the physiological manifestations of environmental heat
stress. Methods of quantifying heat stress and subsequent heat strain will be discussed, as well
as typical endurance performance decrements observed from running in the heat. Finally,
chronic and acute strategies that may benefit endurance running in the heat will be introduced
and evaluated.

6
2 Literature review
2.1 Endurance performance
2.1.1 Determinants of endurance performance
Energy for human locomotion is provided by catabolic reactions that harvest energy
from cellular respiration. In turn, this energy facilitates the movement of skeletal muscle
filaments that proffers muscular action of the appropriate limbs. Although a myriad of factors
including gait, limb anatomy and environmental conditions help to determine the individual’s
velocity (Saunders et al. 2004a), a collection of physiological markers may be used to quantify
the underlying biochemical process. These markers accurately define the characteristics
required for successful endurance performance (McLaughlin et al. 2010; Bassett & Howley
2000; Joyner & Coyle 2008; Jones 1998, Coyle 1999), such that they have been termed the
determinants of endurance performance and include; the lactate threshold (LT), lactate
turnpoint (LTP), running economy (RE) and maximum oxygen uptake (VO2max).
Traditionally, VO2max has been considered to be the most important physiological
characteristic for an endurance athlete (Saltin 1967) and a high VO2max is still considered a pre-
requisite to success at elite level (Joyner and Coyle 2008). Given that VO2max cannot be
sustained beyond 5-10 min (Joyner 1991) and to better explain differences in performance
between those of similar VO2max, emphasis has shifted towards sub-maximal markers such as
blood lactate indices and running economy (Burnley and Jones 2007). A simplification of these
relationships is shown in Figure 1, providing an interpretation on how the LT and VO2max
collectively determine running velocity.
Figure 1: Simplification of interplay between determinants of endurance performance to
influence distance running performance. Modified from Jones (2006), which extends the
previous model of Coyle (1995) by incorporating VO2 kinetics and acknowledging the
contribution of anaerobic energy provision in determining running performance.

7
The determinants of endurance performance model demonstrates how an individual’s
VO2max determines the upper limit of aerobic metabolism, beneath which the LT determines the
VO2 that can be sustained at a given velocity, termed fractional utilisation of VO2max (%VO2max),
or performance VO2. In one interpretation of this relationship, Londeree (1986) suggests ‘a
runner’s potential is limited by VO2max, but other factors will determine how close to his
potential a runner is at a particular point in time’. The running speed that can be maintained,
and consequently performance velocity, is then determined by how efficiently the
corresponding oxidative adenosine triphosphate (ATP) turnover at the performance VO2, is
converted to locomotion (running economy). An individual’s ability to meet changes in exercise
intensity, through aerobic energy provision is determined by VO2 kinetics. Therefore, this
component is most pertinent to events that experience regular changes in intensity. It is
important to note however, this model utilises the LTP as a representative marker of the
metabolic stress experienced by the muscle, and does not implicate lactate in the process of
fatigue above LTP. Trained runners demonstrate the ability to sustain a higher %VO2max across
an event, relative to untrained individuals (Bassett and Howley 2000).
It has been suggested that VO2max is primarily limited by cardiovascular factors, whilst the
performance VO2 may be more closely linked to peripheral adaptation in the muscles (Holloszy
& Coyle 1984). Consequently, larger changes in %VO2max than VO2max itself are observed across
months of endurance training, as demonstrated by Figure 2 from Astrand and Rodhal (1970).
Figure 2: VO2max (termed maximal aerobic power) as denoted by top black line, may improve in
the first months of training, but larger changes are observed in %VO2max, denoted by lower
black line.

8
The determinants of endurance performance combine to predict running speed, and
have been used by Joyner (1991) to predict a faster world marathon record, based on best-
known values for each component, using the following formula.
Equation 1: Calculation of marathon running speed (Joyner 1991).
Running speed = VO2max (mL.kg-1
.min-1
) x %VO2max at LT x RE (km.h-1
VO2-1
[mL.kg-1
.min-1
])
This formula demonstrates how the determinants integrate to determine the running
speed, when confounding individual factors such as motivation, dehydration, hyperthermia and
carbohydrate depletion are excluded. More recently, further determinants of endurance
performance have been proposed, including the predicted velocity at VO2max (vVO2max) (Billat &
Koralsztein 1996), peak treadmill velocity (PTV) (Noakes et al. 1990) and oxygen kinetics
(Burnley & Jones 2007), with vVO2max the most widely adopted (Jones & Carter 2000; Bassett &
Howley 2000). This may reflect the potential for anaerobic energy sources to contribute to PTV
(Jones & Carter 2000), as well as oxygen kinetics appearing most relevant to middle distance
events such as 800-1500 m, where there is a significant anaerobic contribution (Jones & Carter
2000, Jones 2009).
The use of VO2max LT and RE within a model is well supported for explaining endurance
performance (Coyle et al. 1988; Coyle et al. 1991; Stratton et al. 2008; Denadai et al. 2004;
Jacobs et al. 2011; Joyner & Coyle 2008). In one notable study, McLaughlin et al. (2010)
demonstrated that the determinants were able to collectively account for 95.4% of the
variation in 16 km running time trial performance. The composite measure of RE and VO2max,
vVO2max, was the strongest individual predictor explaining 94.4% of the variance, whilst VO2max
and LT both accounted for ~90% of the variation. A breakdown of these results is shown below
in Table 1. Within these data, %VO2max was the weakest predictor of performance, to which the
authors attributed the homogeneity of intensity within which all participants completed the
run (76 – 88 %VO2max).

9
Table 1: Pearson product–moment correlations between the determinants of endurance
performance and 16 km time trial performance (McLaughlin et al. 2010).
An appropriate model of endurance performance can facilitate assessment of endurance
performance in a laboratory, but also allows practitioners and researchers to quantify how
training and/or interventions that promote specific and divergent physiological adaptations,
influence performance. Moreover, since LT, LTP and VO2max can be used as physiological
markers to demarcate exercise intensity domains, they represent relevant variables upon which
to determine training zones, to facilitate appropriate overload, with regard to training intensity
and volume (Davison et al. 2009; Denadai et al. 2004). Finally, the determinants of endurance
performance model allows practitioners to predict endurance performance, which may be
accurate to as much as 0.2–0.4% of the actual race finishing time (Jones 2009), when
appropriate correction factors are adopted (Londeree 1986). In the following section, the
determinants of endurance performance from the traditional model will be individually
introduced and the respective contribution to endurance running discussed.
2.1.2 VO2max
Through a series of experiments in the 1920s, the eminent physiologist AV Hill first
reported an increase in oxygen consumption, accompanying in a linear fashion, increases in
exercise intensity. This relationship was maintained until a plateau was achieved, whereby
oxygen consumption (VO2) appeared to reach a ‘ceiling’, despite an increase in exercise
intensity (Hill et al. 1924). This was termed ‘maximal oxygen intake’ and this concept has
become embedded within the exercise physiology literature across the last century, with it
considered the best measure of the functional limit of the cardiovascular system (Rowell 1974),
and a widely used measure of cardiorespiratory fitness (Howley et al. 1995). The standardised
nomenclature for this phenomenon has become maximum oxygen uptake (VO2max); defined as
the highest rate at which oxygen can be taken up and utilised by the body during severe
exercise (Bassett & Howley 2000). The concept is succinctly encapsulated by the Fick principle
(VO2max = CO x a - VO2 difference) which states VO2max to be the product of cardiac output (CO),

10
minus the arterio-venous difference. Therein, VO2max represents the integrative ability of the
cardiovascular system to oxygenate the blood, expedite the delivery of this blood through a
high cardiac output and skeletal muscle blood flow, as well as extract oxygen at the muscle.
VO2max would appear to be predominantly limited by CO, through an inability to deliver
sufficient oxygenated blood to the active muscles for aerobic respiration to continue to match
exercise intensity, which may account for as much as 70–85% of the limitation in VO2max
(Cerretelli & Di Prampero 1987). An insufficient CO prevents sarcoplasmic reticulum calcium
release (Allen et al. 2007), impairs sodium/potassium pump activity (McKenna et al. 2008), and
slows cross-bridge cycling (Fitts 2007). In turn, such localised stress activates muscle afferents
leading to cessation of central motor drive and voluntary effort (Amann & Calbet 2008).
Therefore, training and interventions that enhance CO or blood oxygen carrying capacity have a
direct impact on VO2max. A classic study by Ekblom et al. (1968) demonstrated an 8% increase in
CO (pre 22.4 L.min-1: post 24.2 L.min-1) following 16 weeks of physical training, contributing to a
16% increase in VO2max (pre 3.15 L.min-1: post 3.68 L.min-1). Moreover, improvements in VO2max
within the first months of endurance training primarily arise through an increased stroke
volume mediated by an increase in systemic blood flow, with peripheral changes of increased
capillary density leading to enhanced oxygen extraction taking longer to present (Ekblom 1968).
Thus, it is unsurprising to observe that the larger VO2max values in endurance athletes compared
with lesser-trained individuals, predominantly arises from a larger end-diastolic volume, due to
a greater cardiac compliance and a distensible pericardium (Levine et al. 1991). Trained
athletes benefit from rapid diastolic relaxation with vigorous suction (Ferguson et al. 2001),
because of a remodelling of the heart which increases the equilibrium volume of the left
ventricle; the volume of blood in the heart when transmural filling pressure is 0 mmHg (Yellin et
al. 1990). This affords athletes the potential to utilise the Frank-Starling mechanism to produce
a large stroke volume and thus CO consistently.
Enhancing the factors that determine oxygen transport within the body has also been
shown to increase VO2max. Consequently, the more pronounced cardiovascular stress arising
from high intensity interval training, appears to produce faster and larger adaptations that
enhance VO2max compared with continuous endurance training (Milanović et al. 2015). This also
includes, increasing red blood cell volume through altitude training (Rusko et al. 2004) or blood
doping (Gledhill 1985). Similarly, interventions such as heat acclimation that induce
hypervolaemia through an increase increased plasma volume (PV) have been shown to increase
VO2max by helping maintain CO at maximal intensities, as PV expansion is not of a magnitude to
elicit haemodilution (Lorenzo et al. 2010). For example, Coyle et al. (1990) demonstrated that

11
PV expansion by 200-300 ml of 6% dextran caused increases in stroke volume of 10-15%,
accompanied by haemodilution of only a 4%, but there was still a significant increase in VO2max
(4%). Such an observation is also supported by arterial oxygen saturation not being a major
limiting factor to VO2max, therefore modest haemodilution does not elicit a detrimental effect
on oxygen delivery (Saltin and Wagner 2006). Whilst cellular oxygen delivery is also dependent
upon initial pulmonary diffusion, this rarely becomes a limiting factor as arterial oxygen
saturation is maintained around 95% during maximal exertion (Powers et al. 1989). In elite
athletes however, a limitation from pulmonary diffusion has been proposed, because of an
extremely high CO reducing blood transit time through the lungs (Dempsey & Wagner 1999).
Although central cardiac factors appear to form the predominant limitation to VO2max, other
functional limitations may also contribute. This assertion is supported by Wagner (1992) who
suggests no single limitation to VO2max, rather that every step in the oxygen pathway
contributes in an integrated way, and a reduction in the transport capacity of any of the steps
will reduce VO2max. Supplementary limiting factors may include oxygen uptake at the muscle,
with Honig et al. (1992) identifying the importance of maintaining an elevated partial pressure
of oxygen in the blood, relative to that in the sarcolemma. Furthermore, small adaptations in
mitochondrial enzymes (Holloszy & Coyle 1984) as well as the structure and volume of capillary
beds (Saltin 1985), which increase muscular blood transit time rather than blood flow, are
associated with improved submaximal exercise performance and may contribute to an
enhanced VO2max. Traditionally, the importance of peripheral limitations to VO2max may have
been overestimated, considering almost all oxygen is extracted from blood perfusing the active
skeletal muscles during maximal exercise (Bassett & Howley 2000). Such findings may reflect
methodological artefacts of experimental trials, which involved small muscle mass or individual
limb exercise, which do not appropriately replicate severe whole body maximal exercise with
respect to CO and cardiovascular strain (Richardson & Saltin 1998; Bassett & Howley 2000).
Ferretti (2014) has subsequently suggested that the role of peripheral factors may be magnified
when the active muscle mass is predominantly formed of smaller muscles, which may help
explain such findings. To summarise, evidence indicates that central factors, and specifically
maximal CO, predominantly limit VO2max, rather than peripheral factors such as the ability of
muscle mitochondria to consume oxygen (Wagner 1992; Bassett & Howley 2000; Lorenzo et al.
2010).
Endurance runners are characterised by high VO2max values, typically between 70-85 mL.kg-1
min-1 for male athletes (Saltin & Astrand 1967), which may be double that of recreationally
active individuals. VO2max appears to set the upper limit for energy production for an individual,

12
but does not necessarily determine the final performance (Bassett & Howley 1997). A high
VO2max would appear necessary to sustain the rate of ATP production necessary to complete
endurance events in a competitive time. Bassett & Howley (2000) suggest that a 2:15 hour
marathon time would require a VO2 of approximately 60 mL.kg-1.min-1 to be sustained, which
given that the marathon is typically completed at 80-85% of VO2max would necessitate a VO2max
in the region of 70-75 mL.kg-1.min-1. As previously detailed in the model of Bassett & Howley
(2000) in Figure 1, the rate of energy production is dependent on the fractional utilisation of
VO2max that an individual can sustain. Therefore, sub-maximal factors such as lactate turnpoint
and running economy may better predict running performance in a group containing
individuals with similar VO2max values (Coyle 1999).
Due to the reliance of VO2max tests on the participant to voluntarily work to maximal effort,
objective criteria to validate VO2max measurements would seem appropriate, especially where
investigations attempt to establish the effects of an intervention, such as a training regime. This
situation is exacerbated by the apparent regularity with which a proportion of a population or
relevant participant cohort, do not display a plateau in VO2 (Edvardsen et al. 2014). Therefore,
a range of secondary criteria have been developed and utilised throughout the exercise science
literature, pertaining to; the respiratory exchange ratio, post exercise blood lactate
concentration, maximum observed heart rate and perceived exertion of the test (Howley et al.
1995; Edvardsen et al. 2014). The use of VO2max criteria is not without contention (Poole et al.
2008; Smirmaul et al. 2013), due to the potential for incorrectly accepting or refuting a test as
maximal depending upon the criteria adopted (Midgley, McNaughton, Polman, et al. 2007). A
more appropriate method of establishing whether a test can be deemed maximal has been
suggested to be through the completion of a subsequent verification (Midgley & Carroll 2009),
or constant-load test (Poole et al. 2008), above the highest attained intensity during the
incremental trial. However, such procedures may not be appropriate for certain experimental
designs, such as those under heat stress, where a manipulated variable such as body
temperature could influence the results of a verification. Therefore, recent evidence advocates
caution when interpreting results using secondary criteria. Following a large analysis of
secondary criteria applied across 861 treadmill tests, to mitigate against erroneous
classification of maximal tests, Edvardsen et al. (2014) recommend that when secondary
criteria should be specific to the population and fitness level, in accordance with the
appropriate normative data.
2.1.3 Blood lactate response

13
The presence and role of lactic acid in human muscle metabolism has been reported and
debated since early in the 20th century (Ryffel 1910; Hill et al. 1924). The formation of lactic acid
may occur momentarily as a by-product of metabolism following glycolysis, before it dissociates
in a reversible reaction into lactate and hydrogen ions (Robergs et al. 2004). This follows an
increased energetic contribution from glycolysis, arising from an inability of the rate of fat
oxidation to meet the ATP demands of contracting muscles, as exercise intensity increases.
Concomitantly carbohydrate, rather than fat, becomes the primary fuel source, typically at
relatively modest exercise intensities, around 40% of VO2max (Holloszy & Kohrt 1996). Glycolysis
occurs in the cell cytoplasm, and produces the intermediate metabolite, pyruvic acid, with the
rate of energy requirement determining whether this is converted into acetyl coenzyme A by
the enzyme pyruvate dehydrogenase, for complete oxidative breakdown of the glucose
molecule in the mitochondria. Alternatively, when the energy demand cannot be met by the
energy yield from the Krebs cycle and electron transport chain, pyruvic acid converts into lactic
acid, facilitated by lactate dehydrogenase. Being a relatively weak acid, lactic acid promptly
dissociates due to the aqueous solution, releasing hydrogen ions, and subsequently combines
with sodium or potassium ions to produce the base lactate. In turn lactate can be used as a fuel
source within the liver, heart, brain and slow twitch muscle fibres via shuttling of oxidisable
substrate from areas of glycogenolysis to areas of high cellular respiration, as well as sustain
blood glucose levels through the Cori cycle (Brooks 1986; Brooks 2009).
Glycolysis is an ongoing process, with the relative contribution increasing with the
metabolic rate in accordance with exercise intensity, but not necessarily to oxygen availability
(Gladden 2000; Robergs et al. 2004). Therefore, when exercise intensity is relatively low, energy
provision may be met predominantly through aerobic metabolism, resulting in a smaller
production of lactate, matched by removal. As intensity increases, energy production derived
from pyruvate delivered to the mitochondria does not meet the energy requirement, resulting
in an increased contribution of glycolysis and associated lactate and hydrogen ion accumulation
(Hermansen & Stensvold 1972; Holloszy & Coyle 1984; Robergs et al. 2004). The release of
hydrogen ions contributes to a lowered pH in the muscle, which coincides with metabolic
acidosis and the onset of fatigue (Robergs et al. 2004). Acidosis is thought to impair muscle
filament movement by interfering with contraction coupling between actin and myosin
filaments (Robergs et al. 2004). An increase in muscle lactate concentration is reflected in the
circulating blood lactate concentration, with which it is highly correlated, although a consistent
difference remains (Ivy et al. 1980). This reflects that a negative gradient is necessary for
lactate to transfer to the blood, aided by lactate being directly removed from the blood at the

14
liver, and that the blood lactate level is dependent on body water status (Jacobs 1986).
Consequently, blood lactate concentration represents the balance between lactate production
in the muscle and utilisation, or conversion, to pyruvate in the liver.
Blood lactate, as sampled from whole blood in the capillary, appears to be a valid surrogate
measure of the ability of an individual to yield energy from carbohydrate, once the metabolic
rate has exceeded what can be supplied through lipolysis (Bentley et al. 2007). The blood
lactate response to incremental exercise permits identification of the corresponding intensities
that elicit changes in an individual’s metabolic function (Bentley et al. 2007). The point at which
blood lactate level rises above steady-state and demonstrates a curvilinear response,
demarcates an intensity where an increased contribution from glycolysis is required
(Wasserman et al. 1985) and therefore the onset of metabolic acidosis, as the energy demand
exceeds that provided by aerobic metabolism (Beaver et al. 1985). Although a multitude of
names have been ascribed to this event, the common nomenclature is to term this the lactate
threshold (Jones 1998, Saunders & Green 2013). Exercise above this threshold is associated
with an increased respiratory, perceptual and metabolic strain (Jones & Carter 2000). As
intensity continues to increase, similarly the contribution of glycolysis increases, resulting in an
exponential increase in the muscle and circulating lactate concentration (Beaver et al. 1985).
The exercise intensity at which an exponential increase begins, as identified on a blood lactate
versus exercise intensity plot, has been termed the lactate turnpoint (Jones 1998, Saunders &
Green 2013). This event has also been termed the onset of blood lactate accumulation (OBLA)
due to the association of this with a blood lactate concentration of 4 mMol-1, although this
index is now more widely used as a training marker (Heck et al. 1985). Figures demonstrating
these methods are shown below (Sections 2.1.3.1 - 2.1.3.3). Exercise above these thresholds is
associated with expedited fatigue, through metabolic acidosis (Sahlin 1992), or an accelerated
depletion of muscle glycogen (Boyd et al. 1974), which is why the lactate turnpoint represents a
fractional utilisation of the maximum oxidative capacity that can be maintained during exercise
(Bassett & Howley, 2000).
Considerable debate surrounds the validity of lactate threshold concepts, with Faude et al.
(2009) suggesting these thresholds represent a continuous transition, and therefore the term
‘threshold’ may be misleading. Consequently, Faude et al. (2009) describes an aerobic-
anaerobic transition, using the terms lactate threshold aerobic and lactate threshold anaerobic
to represent the lactate threshold and lactate-turn point respectively, within this transition
framework. Despite discrepancies concerning the nomenclature, it is apparent that such
markers are useful for tracking exercise performance as the oxidative capacity of skeletal
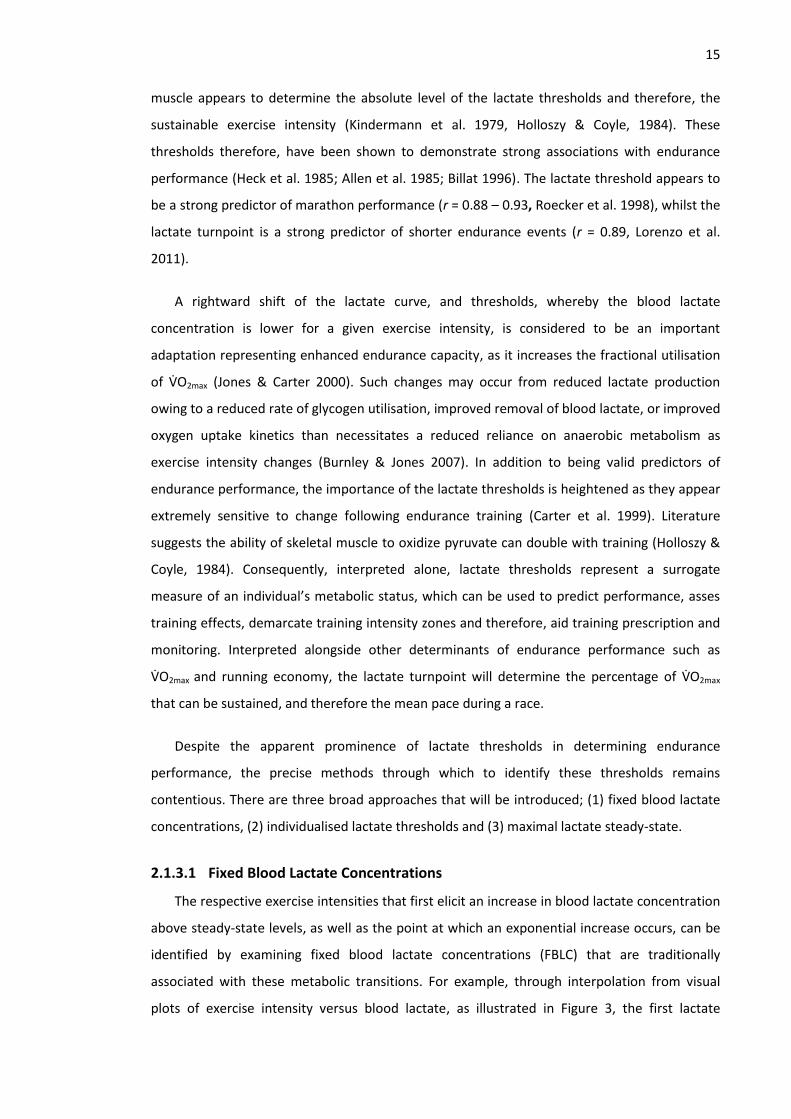
15
muscle appears to determine the absolute level of the lactate thresholds and therefore, the
sustainable exercise intensity (Kindermann et al. 1979, Holloszy & Coyle, 1984). These
thresholds therefore, have been shown to demonstrate strong associations with endurance
performance (Heck et al. 1985; Allen et al. 1985; Billat 1996). The lactate threshold appears to
be a strong predictor of marathon performance (r = 0.88 – 0.93, Roecker et al. 1998), whilst the
lactate turnpoint is a strong predictor of shorter endurance events (r = 0.89, Lorenzo et al.
2011).
A rightward shift of the lactate curve, and thresholds, whereby the blood lactate
concentration is lower for a given exercise intensity, is considered to be an important
adaptation representing enhanced endurance capacity, as it increases the fractional utilisation
of VO2max (Jones & Carter 2000). Such changes may occur from reduced lactate production
owing to a reduced rate of glycogen utilisation, improved removal of blood lactate, or improved
oxygen uptake kinetics than necessitates a reduced reliance on anaerobic metabolism as
exercise intensity changes (Burnley & Jones 2007). In addition to being valid predictors of
endurance performance, the importance of the lactate thresholds is heightened as they appear
extremely sensitive to change following endurance training (Carter et al. 1999). Literature
suggests the ability of skeletal muscle to oxidize pyruvate can double with training (Holloszy &
Coyle, 1984). Consequently, interpreted alone, lactate thresholds represent a surrogate
measure of an individual’s metabolic status, which can be used to predict performance, asses
training effects, demarcate training intensity zones and therefore, aid training prescription and
monitoring. Interpreted alongside other determinants of endurance performance such as
VO2max and running economy, the lactate turnpoint will determine the percentage of VO2max
that can be sustained, and therefore the mean pace during a race.
Despite the apparent prominence of lactate thresholds in determining endurance
performance, the precise methods through which to identify these thresholds remains
contentious. There are three broad approaches that will be introduced; (1) fixed blood lactate
concentrations, (2) individualised lactate thresholds and (3) maximal lactate steady-state.
2.1.3.1 Fixed Blood Lactate Concentrations
The respective exercise intensities that first elicit an increase in blood lactate concentration
above steady-state levels, as well as the point at which an exponential increase occurs, can be
identified by examining fixed blood lactate concentrations (FBLC) that are traditionally
associated with these metabolic transitions. For example, through interpolation from visual
plots of exercise intensity versus blood lactate, as illustrated in Figure 3, the first lactate

16
threshold may be calculated based on the intensity corresponding to 2 mMol.L–1 (Kindermann
et al. 1979; Saunders & Green 2013), 2.2 mMol.L–1 (LaFontaine et al. 1981), 2.5 mMol.L–1 (Allen
et al. 1985) or 3 mMol.L–1 (Borch et al. 1993). Most notably, a 4 mMol.L-1 concentration, termed
the Onset of Blood Lactate Accumulation (OBLA), has been used to represent the maximal
lactate steady-state and therefore also, the lactate turnpoint. Theoretically therefore, a blood
lactate concentration of 4 mMol.L-1 represents the point at which an exponential increase in
blood lactate accumulation follows (Sjödin et al. 1982; Heck et al. 1985; Weltman et al. 1990).
Figure 3: Hypothetical lactate threshold and lactate turnpoint identified in accordance with the
recommendations of Saunders and Green (2013). Fixed blood lactate concentrations afford
greater precision (<1 km.h-1) than alternative methods.
Examining FBLC affords a simple and objective assessment (Davis et al. 2007), which also
benefits from greater precision than alternative methods, which may be bound by the stage
increments of the test, such as the 1 km.h-1 differences in running speeds as shown in Figure 3.
At both amateur and elite levels, differences of less than 1 km.h-1 may be considered
meaningful across a prolonged race (Hopkins & Hewson 2001; Tyler et al. 2015). Furthermore,
this method does not discriminate between different protocols or the number of stages to
develop a lactate curve, which typically varies between 6-8 stages (Spurway & Jones 2007).
However, FBLC are strongly influenced by an athlete’s nutritional and recovery status (Carter et
al. 1999; Yoshida 1984), which may invalidate results if not appropriately controlled for, or if
markedly different exercise protocols are used (Faude et al. 2009). Moreover, for aerobically
trained athletes the 4 mMol.L-1 threshold may overestimate endurance capacity, or
underestimate in anaerobically trained individuals (Stegmann et al. 1981; Stegmann &
Kindermann 1982).

17
2.1.3.2 Individualised Lactate Thresholds
In order to mitigate against the influence of biological variation on FBLCs, Stegmann et al.
(1981) proposed a complex model of individualised lactate thresholds. Based on the
incremental exercise and recovery blood lactate response, a diffusion-elimination model was
developed, from which the maximal rate of lactate elimination, individual anaerobic threshold,
gradient between muscle and blood, muscle volume working above the threshold and whole
body lactate could be obtained. However, underpinning assumptions of this model have since
been questioned (Gladden 2000) and researchers have continued to seek simpler and more
accurate methods, often based upon visual inspection of the lactate curve, alongside
interpretation boundaries (Holloszy & Coyle 1984; Spurway & Jones 2007). For example,
Spurway and Jones advocate the exercise intensity that elicits a 1 mMol.L-1 increase above
steady-state levels to denote the lactate threshold, and the intensity that elicits a ‘sudden and
sustained increase’ as the lactate turnpoint, as shown in Figure 4.
Figure 4: Hypothetical lactate threshold and lactate turnpoint identified in accordance with the
recommendations of Spurway and Jones (2007).
Such an approach is simple to adopt, but may be susceptible to fluctuation during the initial
stages of an exercise test, as well as discrepancies between testers, particularly when some
individuals demonstrate a curvilinear lactate curve, without discernible breakpoints (Yeh et al.
1983). Furthermore, unlike FBLC, individualised thresholds are typically only precise to the
increment of the stage i.e. 1 km.h-1, as shown in Figure 4.
To try to maintain an individualised approach, but yield an objective measure, Cheng et al.
(1992) introduced the Dmax method, where the lactate threshold was denoted by the maximal
perpendicular distance of the lactate curve from a line connecting the first and last stages of
the curve. Despite early promise, Dmax may be liable to bias from the test starting speed, as

18
well as number of steady-state and higher intensity stages completed. To eliminate this bias,
Bishop et al. (1998) introduced a modified Dmax, focussed primarily on the lactate turnpoint,
whereby a line was drawn from first lactate threshold to the endpoint of lactate curve, with
lactate turnpoint identified by the largest perpendicular distance. This approach has been
shown to be highly correlated (r=0.84) with 1 hour TT performance in trained cyclists (Bishop et
al. 1998), and the best predictor 10 km running performance in recreational runners (Nicholson
& Sleivert 2001).
2.1.3.3 Maximal Lactate Steady State (MLSS)
The MLSS is the highest exercise intensity that can be maintained without a continual
increase in blood lactate concentration (Beneke 2003), and therefore represents the highest
exercise intensity that results in an equilibrium between lactate production and lactate
elimination (Baron et al. 2008). Practically therefore, MLSS demarcates the upper limit for
sustainable exercise intensity, above which leads to an accumulation of fatiguing metabolic by-
products (Beneke 2003). This marker occurs at a similar exercise intensity to the LTP, but
appears more ecologically valid for endurance exercise due to the need for repeated,
prolonged periods of exercise at near to steady-state intensities, which closely replicates
endurance events (Spurway & Jones 2007; Faude et al. 2009). Indeed, Jones and Carter (2000)
suggest MLSS to be the best measure of endurance capacity, further evidenced by the high
correlations with 5 and 8 km running reported by Haverty et al. (1988, r = 0.87) and Jones and
Doust (1998, r = 0.92), respectively. However, the protocol to determine MLSS is inefficient,
requiring multiple visits on different days, of at least 30 min. The protocol requires each test to
be completed at a different steady-state intensity, typically within the range of 50-90% VO2max,
until an increase in blood lactate of no more than 1 mMol.L-1 between 10-30 min is observed as
shown below in Figure 5. The MLSS is identified as the highest exercise intensity that elicits a
steady-state blood lactate response (<1 mMol.L-1) between 10-30 min.

19
Figure 5: Theoretical representation of determining the maximum lactate steady state. Adapted
from Faude et al. (2009). Athlete completes five treadmill runs at different running speeds on
different days. MLSS is the speed that elicits a delayed but elevated steady-state blood lactate
concentration.
Despite the apparent efficacy of MLSS for assessing endurance performance and affording
the opportunity for simultaneous measurement of running economy, the number of repeated
trials required precludes the widespread use of MLSS. Furthermore, the LTP derived from a
traditional GXT has also been shown to be highly correlated with MLSS (Jones and Doust, 1998)
and may be completed as part of a battery of tests in order to yield additional measures.
This section has summarised a variety of methods for estimating the same physiological
markers. Whilst all methods appear to have advantages and disadvantages, when confounding
influences of diet and prior exercise are controlled for (Yoshida et al. 1984), the exercise
intensities at FBLC appear to afford the most objective and precise assessments of the lactate
thresholds. Such calculations remove potential experimenter bias and the need for duplicate
reviews of tests, whilst quantifying potentially meaningful differences that may be smaller than
the stage increment. Finally, FBLC can be determined independently of the number of stages
completed, which may be an important consideration in research when a participant cohort of
heterogeneous performance level is used.
2.1.4 Running Economy
Running economy represents the metabolic energy required to cover a given distance and
is traditionally expressed as the oxygen uptake (VO2) required to run at a given velocity (mL.kg-

20
1.min-1), or as a mean across a number of velocities (mL.kg-1.km-1) (Bassett & Howley 2000). The
VO2 at 16 km.h-1 (6 min per mile, 3 min 44 s per km) is the most common reference velocity,
particularly amongst highly trained individuals, although velocities from 12 to 21 km.h-1 are
observed across the literature (Daniels & Daniels 1992; Joyner 1991; Morgan et al. 1991;
Pollock 1977; Conley & Krahenbuhl 1980; Saunders et al. 2004b). Mean running economy (RE)
may be estimated from a range of running velocities by measuring the steady state VO2 during
submaximal running, as shown below in Equation 2.
Equation 2: Calculation of mean running economy.
RE= VO2 mL O2 kg.-1 km.-1
(S/60)
Where, VO2 is oxygen consumption in mL O2 kg.-1 min.-1, and ‘S’ is velocity in km.h-1, multiplied
by 60 to convert km.h-1 to km.min-1 (Jones 2006a; Saunders & Green 2013).
At an elite level, a running economy value around 200 mL.kg.-1 km.-1 may be considered
typical, with values above and below this value representing poor and good economy,
respectively (Jones 2006b). An economical runner demonstrates a low VO2 for a given velocity,
utilising a lower percentage of the VO2max at that velocity, consequently preserving muscle
glycogen and likely necessitating a lower anaerobic metabolism contribution, therein reducing
metabolic acidosis (Saunders et al. 2004a; Jones 2006b). Due to the presence of the VO2 slow
component, whereby VO2 may not reach a steady-state at higher exercise intensities, RE should
be measured across velocities below an individual’s LTP (Jones et al. 2003). The necessity for
steady-state VO2 measurements also determines that stage increments must be of at least 3
min to account for VO2 kinetics (Burnley & Jones 2007), whilst a 1% gradient on a treadmill may
be appropriate to compensate for the lack of air resistance and gait alterations when using a
treadmill, compared with running outdoors (Jones & Doust 1996). Despite widespread use, VO2
measurement may be insensitive to subtle training improvements in fuel utilisation, compared
with total energy turnover (Shaw et al. 2014). Notwithstanding this limitation, the traditional
approach has shown great efficacy in quantifying improved running performance (Coyle 1999)
and forms a critical component of an established model for predicting endurance running
performance (Ingham et al. 2008; Di Prampero et al. 1993; Bassett & Howley 2000).
As RE represents the transfer of chemical energy into locomotion, it is influenced by both
biomechanical and physiological variables, as shown in Figure 6. From a biomechanical
perspective, body mass, anthropometry (i.e. muscle mass), flexibility (i.e. muscular elasticity),

21
and gait (i.e. stride length) are major contributing factors. From a physiological perspective,
both muscle fibre type and temperature may influence VO2, as well as cardiovascular fitness,
specifically pertaining to mitochondrial density, haemoglobin mass, aerobic enzyme activity,
capillarisation and blood volume (Saunders et al. 2004b). With so many contributing factors,
there is considerable individual variability in RE, with literature suggesting RE varies amongst
runners of similar VO2max by 30% (Daniels 1985). Broadly however, higher standard runners
demonstrate a better RE than untrained runners (Pollock 1977), whilst long distance runners
appear more economical than middle-distance runners at sub-maximal running speeds (Daniels
& Daniels 1992), which may be a consequence of the larger training volumes typically
completed by these athletes.
Figure 6: Factors that could determine RE (Saunders et al. 2004b).
Running economy appears to distinguish between runners of similar VO2max. Conley and
Krahenbuhl (1980) identified a relatively strong correlation (r = 0.82) between running
economy and performance in a 10 km run, with runners of similar VO2max, results which have
been supported elsewhere (Costill et al. 1973; Morgan et al. 1989). This relationship is likely
underpinned by subtle individual differences in the linear relationship between submaximal
running velocity and VO2max. Individuals with a low RE will also benefit from a reduced
metabolic heat production contributing towards body heat storage, an effect that will be
especially important in hot and humid conditions (Jones 2006b). Expressing RE relative to
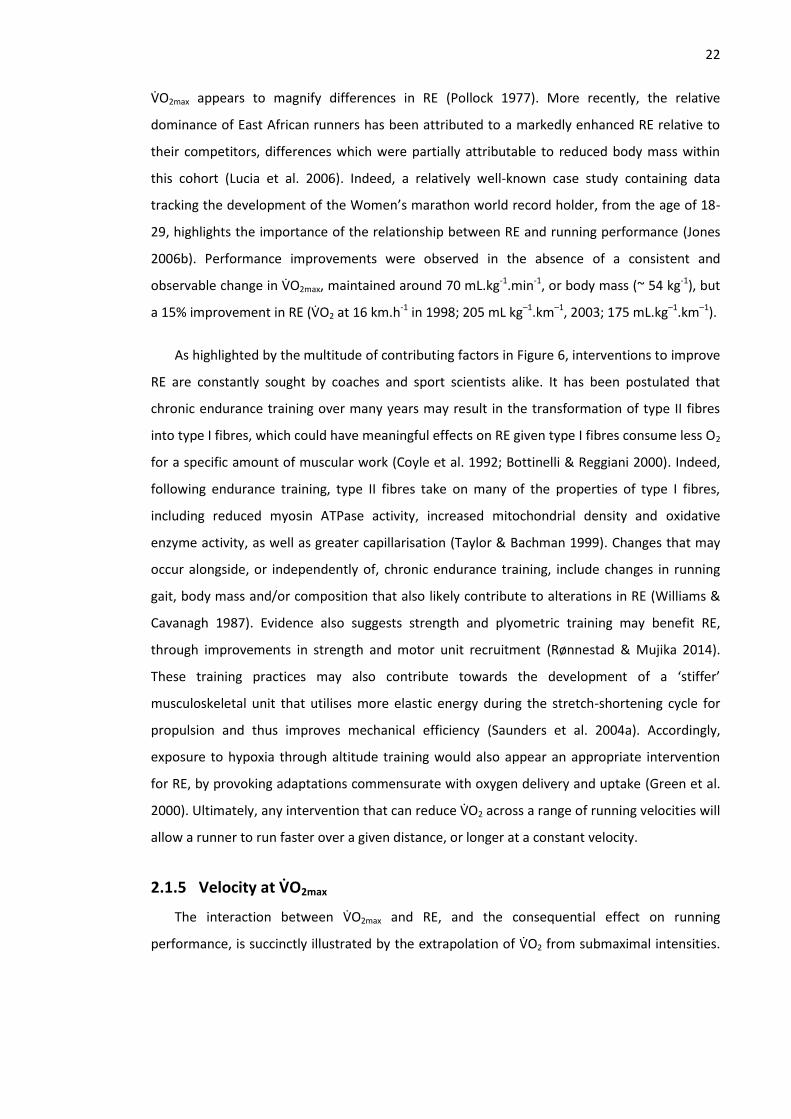
22
VO2max appears to magnify differences in RE (Pollock 1977). More recently, the relative
dominance of East African runners has been attributed to a markedly enhanced RE relative to
their competitors, differences which were partially attributable to reduced body mass within
this cohort (Lucia et al. 2006). Indeed, a relatively well-known case study containing data
tracking the development of the Women’s marathon world record holder, from the age of 18-
29, highlights the importance of the relationship between RE and running performance (Jones
2006b). Performance improvements were observed in the absence of a consistent and
observable change in VO2max, maintained around 70 mL.kg-1.min-1, or body mass (~ 54 kg-1), but
a 15% improvement in RE (VO2 at 16 km.h-1 in 1998; 205 mL kg–1.km–1, 2003; 175 mL.kg–1.km–1).
As highlighted by the multitude of contributing factors in Figure 6, interventions to improve
RE are constantly sought by coaches and sport scientists alike. It has been postulated that
chronic endurance training over many years may result in the transformation of type II fibres
into type I fibres, which could have meaningful effects on RE given type I fibres consume less O2
for a specific amount of muscular work (Coyle et al. 1992; Bottinelli & Reggiani 2000). Indeed,
following endurance training, type II fibres take on many of the properties of type I fibres,
including reduced myosin ATPase activity, increased mitochondrial density and oxidative
enzyme activity, as well as greater capillarisation (Taylor & Bachman 1999). Changes that may
occur alongside, or independently of, chronic endurance training, include changes in running
gait, body mass and/or composition that also likely contribute to alterations in RE (Williams &
Cavanagh 1987). Evidence also suggests strength and plyometric training may benefit RE,
through improvements in strength and motor unit recruitment (Rønnestad & Mujika 2014).
These training practices may also contribute towards the development of a ‘stiffer’
musculoskeletal unit that utilises more elastic energy during the stretch-shortening cycle for
propulsion and thus improves mechanical efficiency (Saunders et al. 2004a). Accordingly,
exposure to hypoxia through altitude training would also appear an appropriate intervention
for RE, by provoking adaptations commensurate with oxygen delivery and uptake (Green et al.
2000). Ultimately, any intervention that can reduce VO2 across a range of running velocities will
allow a runner to run faster over a given distance, or longer at a constant velocity.
2.1.5 Velocity at VO2max
The interaction between VO2max and RE, and the consequential effect on running
performance, is succinctly illustrated by the extrapolation of VO2 from submaximal intensities.
23
As shown in Figure 7, for two athletes of similar VO2max, the athlete with better economy
(triangles) will be running at a greater velocity3, as they approach maximal intensities.
Figure 7 :The athlete denoted by grey triangles demonstrates a higher running speed when VO2
is extrapolated to maximal intensity (Jones 2006b).
Consequently, the estimation of the running velocity associated with VO2max, termed
vVO2max, provides a simple performance metric, which mitigates against the interpretation
difficulties coaches and athletes may experience when VO2max is expressed in units of mL.kg-1
min-1. An improvement in vVO2max enables exercise at a given absolute, or relative intensity, to
be performed at higher running speeds, which is important considering athletes operate at
similar percentages of VO2max within certain events (Leger et al. 1986). Daniels (1985) first
advocated extrapolating the regression line of an individual’s running velocity and VO2
relationship to the measured VO2max. Morgan et al. (1989) modified the approach of Daniels
(1985), utilising an individual’s mean RE and reported a strong relationship between vVO2max
and 10 km performance (r = -0.87), which provided similar predictive power as the running
velocity at 4 mMol.L-1 (r = -0.82). However, Morgan et al. (1989) highlighted a limitation of this
estimate, as the accurate determination of RE may depend upon repeated trials to account for
the reliability of measuring oxygen consumption. Notwithstanding, the strength of this
relationship has subsequently been widely supported, with Jones and Doust (1998)
demonstrating that vVO2max correlated more strongly with 8 km running performance (r = 0.93)
3 Velocity is a vector quantity. This requires that direction, as well as magnitude, is stated or strongly
implied. Conversely, ‘speed’ is a scalar quantity that indicates magnitude, but not direction (Winter & Fowler 2009). In accordance with recent recommendations (Winter & Fowler 2009), velocity will be predominantly used within this thesis when describing running performance, unless it is explicit that the performance refers to a treadmill protocol.

24
than other physiological measures, including VO2max (r = 0.69) and RE (r = –0.16). Theoretically,
the calculation of vVO2max is most pertinent for events completed at, or around VO2max, such as
the 3000 m. However, vVO2max is also well supported for longer events, with McLaughlin et al.
(2010) suggesting it to be the largest individual predictor of endurance performance,
accounting for 94.4% of the variance in 16 km time trial performance.
Given RE is derived from steady-state VO2 measurements, hypothetically vVO2max provides
an estimate of the maximal velocity that can be maintained by oxidative phosphorylation. This
value may be lower than the maximum running speed observed during a speed-incremented
test, such as the peak treadmill velocity attained for 1 min (PTV), as the calculation of vVO2max is
independent of an anaerobic energy contribution (Noakes et al. 1990). Therefore, despite the
intuitive similarity of vVO2max and the PTV, a distinct difference between these measures should
be acknowledged, given the potential for anaerobic capacity, muscle power and neuromuscular
skill to contribute to the final performance, variables which will have a progressively smaller
influence as event distance and duration increase (Jones & Carter 2000). Therefore, although
PTV is highly correlated with endurance performance (r = - 0.88 - -0.94, Noakes et al. 1990), it
may not be as good a marker as vVO2max during prolonged endurance exercise, as shown by
McLaughlin et al. (2010) during a 16 km time trial (PTV r = -0.892, vVO2max r = -0.972).
Furthermore, vVO2max is widely applicable, given the ability to derive this measure from both
speed and gradient incremented tests, whereby mean RE is utilised to represent the
relationship between submaximal VO2 and running velocity for gradient protocols (Jones 1998;
Jones 2006b). Therefore, for an athlete with a running economy of 210 mL.kg–1.km–1 and a
VO2max of 70 mL.kg–1.min–1, vVO2max would be 20 km.h–1 (70 x 60 / 210). In turn, this velocity
may also represent an optimal individualised training pace to improve VO2max, as it theoretically
describes the slowest speed which elicits VO2max (Billat et al. 1999) and therefore, is the
intensity that can be sustained for the longest possible duration while eliciting VO2max. In
conclusion, vVO2max is a widely supported performance estimation derived from two of the
primary physiological determinants of performance that appears appropriate for use across a
range of distances within endurance events.
2.1.6 Assessment of endurance exercise
Endurance athletes are routinely assessed in the laboratory to establish training status or
highlight weaknesses for future training, with testing procedures also an effective tool for
talent identification in endurance sports (Joyner & Coyle 2008; Jones 2006a). In accordance
with the previously described model, a graded exercise test (GXT) can provide a measure of

25
each determinant of endurance performance. Many variations of GXT exist, across a range of
endurance sports including running (Jones 1998), cycling (Hopkins & McKenzie 1994) and
rowing (Ingham et al. 2013), whereby practitioners can manipulate stage duration and
increment size to reflect the relevant event better. Thus, for an endurance runner, a
generalised aim of the GXT is to assess blood lactate concentration, running economy and
VO2max while increasing exercise intensity until volitional exhaustion (Bentley et al. 2007).
Treadmill-based GXTs are considered highly reliable (Grant et al. 2002), with strong
Pearson’s correlation coefficients for LT (r = 0.89) and the velocity at the onset blood lactate
accumulation (OBLA), demarked by 4 mMol.L-1 (r = 0.95), originally reported by Weltman et al.
(1990). These results, and the use of three minute stages, have since been supported by
Pfitzinger & Freedson (1998), who report very strong intraclass correlation coefficients (ICC) for
LT (ICC = 0.98) and OBLA (ICC = 0.99) and Grant et al. (2002) (LT; r = 0.94, OBLA; r = 0.93). In a
meta-analysis, Hopkins et al. (2001) stated the coefficient of variation (CV) for speed at LT to be
1.5%. VO2max assessment during GXT also appears highly reliable, where a CV of 0.9% and
standard error of the estimate of 0.24 l min-1 have been reported (Weltman et al. 1990).
However, a more conservative estimate would indicate the typical error of VO2max to be closer
to 2% (Tanner & Gore 2013). Similarly, the sub-maximal assessment of running economy during
a GXT appears to be highly reliable, with a typical error of 1.3 mL.kg.-1min-1 reported in trained
runners (Saunders et al. 2004b). Table 2 displays published accepted levels of error for each of
the determinants of endurance performance derived from a GXT through a range of absolute
and relative reliability statistics.

Table 2: Reliability and sensitivity of the determinants of endurance performance. Data are from experiments conducted in predominantly temperate
environments. Columns from left to right; respective determinant of endurance performance, a battery of relative and absolute reliability statistics that have
previously been considered acceptable levels of error, previously observed change in the measure and whether this exceeds the typical variation (sufficient
signal:noise ratio), typical change in the mean to elucidate a statistically significant difference (p<0.05) and the magnitude of change accepted as meaningful.
Outcome RELIABILITY MEASURES SENSITIVITY Δ for sig diff Meaningful Δ

27
Legend to Table 2;1 Spurway & Jones 2007,
2 Tanner & Gore 2013,
3 Weltman et al. 1990,
4 Pfitzinger & Freedson 1998,
5 Grant et al. 2002,
6 Billat & Koralsztein 1996,
7 Saunders et al. 2004a,
8 Doma et
al. 2012, 9 Katayama et al. 2004,
10 Rivera-Brown et al. 1995,
11 Billat et al. 1999,
12 Saunders et al. 2004b,
13 Jones & Doust 1998,
14 Morgan et al. 1991,
15 Cunningham et al. 1977.
measure (SI unit)
Δ mean
(±)
Pearson
(r)
ICC TEM
(±SI unit)
TEM
(±CV%)
LOA
(±)
Typical Δ
from intervention
S >N?
LT <0.29 km.h-1 (5) >0.89 (3) >0.98 (4) <0.2 mMol.L-1 (1, 2) <10% (1) 0.47- 1.05 km.h-1 (5) Aerobic training
+1 km.h-1 (13) Yes 0.96 km.h-1 (3) >0.2 mMol.L-1 (2)
LTP <0.33 km.h-1 (5) >0.95 (3) >0.99 (4) <0.5 mMol.L-1 (2) <3-6% (2) 0.85 -1.50 km.h-1 (5) Aerobic training
+1 km.h-1 (13) Yes 1.18 km.h-1 (3) >0.5 mMol.L-1 (2)
RE <0.09 L.min-1 (8) >0.95 (14) >0.90 (8) <0.09 L.min-1 (12)
<1.3 mL.kg-1min-1 (12)
<2.4% (12)
1.5-5% (7) 1.02-1.03 L.min-1 (3) Altitude training
+2.9% (9) Moderate 2.8 mL.kg-1min-1 (12) >2.4% (12)
(elite)
VO2max <0.04 L.min-1 (3) >0.94 (10) >0.97 (10) <0.15 L.min-1 (2) <2% (2) - Interval training
+5% (11) Yes 2 mL.kg-1min-1 (15) >0.15 L.min-1 (2)
vVO2max <0.5 km.h- 1 (6) >0.90 (6) - <14% (6) <2.4% (2) - Interval training
+0.6 km.h-1 (11) Moderate - ±0.5 km.h-1 (6)

28
While the predominant measures taken during a GXT consist of physiological responses,
there remains the potential for some measures of performance to be measured directly, or
estimated. Depending upon the protocol chosen, the peak treadmill velocity may be recorded
when an incremental speed protocol is used (Noakes et al. 1990), or estimate vVO2max from the
mean RE (Morgan et al. 1989). As such, VO2max can be measured during an incremental gradient
test, which may be more appropriate when testing runners not accustomed to running at
maximal speeds, such as cross country runners, as well as minimising health and safety risks in
the laboratory, when a treadmill safety harness is not available. VO2max appears comparable
(Kasch et al. 1976; McConnell & Clark 1988; Balducci et al. 2016), or slightly elevated (Morgan
et al. 1989a), when adopting an incremental gradient rather than incremental speed protocol.
Thus, during a GXT, at least one, if not both PTV and vVO2max can be yielded, both of which may
have a CV as low as 0.9% (Hopkins et al. 2001).
Laboratory investigations of endurance performance per se, typically adopt either self-
paced time trials (TT), fixed-intensity time to exhaustion trial (TTE) or pre-loaded time trials
(Currell & Jeukendrup 2008). Free-paced time trial protocols (TT) have been suggested as the
most ecologically valid approach and display greater reliability than TTE, with the coefficient of
variation (CV) below 5%, compared with 10-26% for TTE (Laursen et al. 2007; Currell &
Jeukendrup 2008; Jeukendrup & Saris 1996). Furthermore, Currell and Jeukendrup (2008) argue
‘pacing strategy is an inherent component of real performance rather than something that
should be omitted from a performance test’. This advocates avoiding fixed intensity protocols if
the efficacy of an intervention is to be truly tested. However, the variation of exercise intensity
that occurs during a TT as a consequence of free-pacing can impede interpretation of the
physiological effects, and therefore the understanding of an intervention which can be
achieved during a steady state TTE. This has led to calls for multiple TTE trials to be used as TT
performance predictors (Hinckson & Hopkins 2005).
Consequently, the type of exercise test adopted remains a contentious issue. Schlader,
Stannard, et al. (2011a) have suggested as a consequence of these differing experimental
approaches the seemingly opposed theories of fatigue concerning endurance performance may
have given undue prominence to measuring a different combination of physiological processes.
For example, a TTE trial completed at a fixed intensity examines the participant’s ability to
exercise to exhaustion may emphasize physiological failures at the level of either the muscle
(peripheral) or brain (central). This characterises fatigue as an ‘all or nothing’ phenomenon
(Tucker 2008), despite most sporting events evidencing a level of fatigue and necessitating
individuals pace themselves, slowing down to complete the event and avoid task failure. Thus,

29
a TT may better examine the regulation of exercise intensity and on-going fatigue, in
accordance with the anticipatory regulation model of fatigue (Marino 2004). Such a contrast
remains when considering laboratory endurance performance in hot environments, where
exhaustion during TTE trials was associated with a TCORE exceeding 40°C, providing the basis for
the critical core temperature model (González-Alonso et al. 1999). However, this phenomenon
is not supported by observations in the field during free-paced time trials, where TCORE has been
widely reported to exceed 40°C (Racinais et al. 2015b; Ely et al. 2009).
In light of these limitations, Jeukendrup & Saris (1996) attempted to combine these
perspectives by developing a pre-loaded time trial, where a period of fixed-intensity work
precedes a self-paced TT. They reported comparatively high reliability with a CV of 3.4% with
respect to TT (3.4%) and TTE (26%) within their cohort. A pre-loaded time trial permits the
assessment of the physiological response during the fixed intensity work before completing a
more ecologically valid TT. This approach has been suggested to reflect long distance events in
track athletics, which involve running as a group for the majority of a race before increasing
pace in the final laps (Jeukendrup & Saris 1996). However, this typically only permits
assessment at one prior speed during the pre-loaded part of the test and participants may
complete a TT of an unusual length, once a pre-loaded period has been added to, or removed,
from the total distance.
Despite the apparent greater inter-trial variation, a TTE may hold the same sensitivity for
discerning differences between trials (Laursen et al. 2007, Amann et al. 2008). Currell &
Jeukendrup (2008) have proposed a signal-to-noise ratio to assess sensitivity, where the effect
size of any change in exercise performance following an intervention (signal) should be
compared against the variation associated with the protocol used (noise). Thus the change in
performance can be divided by the error of measurement. To illustrate, an ice slurry drink
eliciting a 19% improvement in TTE (Siegel et al. 2010), where the CV may be 26% (Jeukendrup
and Saris, 1996), may elicit a similar magnitude of change as a 1.3% improvement following ice
slurry ingestion in a TT (Ross et al. 2011) where CV is 5% (Currell & Jeukendrup, 2008). Thus,
whilst the CV for TT is generally low, so too appear changes in performance. Equally, whilst the
CV for TTE is generally larger, so are observed changes (Laursen et al. 2007). This may be
because small changes in exercise intensity result in larger changes in time-to-exhaustion tests
(Hopkins et al. 2001).
Investigations pertaining to endurance performance under heat stress have primarily
adopted TT and TTE trials to try to maximise external validity of investigations (Casa 1999;

30
Maughan & Shirreffs 2004). However, despite not allowing free-pacing, a GXT would still
appear to provide meaningful information on exercise capability due to the determinants of
endurance performance remaining valid markers of performance in hot and cold environments
(Lorenzo et al. 2011). Moreover, the yield of measures from a GXT appear to permit a more
holistic assessment of the physiological response during exercise than TT, pre-loaded time trial
and TTE trials, as well as providing a valid and reliable estimated performance measurement in
vVO2max.
2.2 Human thermoregulation, heat stress and heat strain
2.2.1 Heat exchange
Before considering how heat stress pertains to a decrement within the physiology of
endurance performance, the principles of heat exchange and thermoregulation will be
introduced. A measured temperature represents the mean kinetic energy of the movement of
atoms within a substance (Parsons 2014). Within humans the mean measured temperature in
the core of the body is 37±1°C, as humans are homeothermic mammals that maintain an
internal body temperature (Cheung 2010). In the morning upon awakening, this is typically
around 36.7°C, with temperature increasing during the day, potentially by 0.8°C in the evening,
and declining again until the morning due to the circadian rhythm (Wenzel & Piekarsky 1984).
The resting body temperature principally arises as a net result of heat production from
anaerobic and/or aerobic metabolism and ATP hydrolysis, when the total heat dissipated to the
ambient environment has been accounted for (Parsons 2014). Thus, thermoregulation serves to
balance internal and external heat sources, creating a normothermic homeostatic environment
and thereby avoiding hypo- and hyperthermia (Cheung 2010). The processes of heat dissipation
and heat gain are quantified most accurately through whole body calorimetry, but for most
exercise science research, may also be estimated to an acceptable level of accuracy through
indirect calorimetry, as measured from exhaled breath (Jay & Kenny 2007). The use of indirect
calorimetry is pertinent given the limited accessibility and significant expense of whole body
calorimeters (Kenny & Jay 2013).
Six fundamental parameters; air and radiant temperatures, humidity, air velocity, metabolic
heat production and clothing insulation, determine human thermal interaction with an
environment (Parsons 2014). Air temperature concerns the temperature of the air surrounding
the human body, which in turn largely determines dry heat transfer. Radiant temperature is the
temperature that is emitted from radiant sources such as the sun, or types of lighting.
Environmental humidity can be expressed both relatively and in absolute terms; relative

31
humidity (%) is the percentage of saturated water vapour pressure, whilst absolute humidity is
the total water content in the air, in mass per volume (g/m3). Both of these will affect
evaporative heat transfer from the skin to the environment. Air velocity is the movement of air
across the human body (m.s-1). Metabolic heat production (Watts) is the consequence of heat
from energy production that is not stored within the body and lastly, clothing insulation (m2
K/W), that is determined by clothing material and the consequential effect on dry and
evaporative heat transfer from the skin to the environment. Based upon these fundamental
parameters, human thermal interaction with an environment can be determined using the heat
balance equation.
Equation 3: Heat balance equation.
S = M - W ± R ± C ± K – E.
This equation dictates that at times of thermal balance, the heat storage in the body (S), is
equal to metabolic heat production (M) minus external work performed (W) and dependent
upon the four predominant pathways of heat exchange; radiation (R), conduction (C),
convection (K) and evaporation (E). Elements of heat exchange are measured in Watts, unless
made relative to the body mass (W.kg-1) or body surface area (W.m2). However, it is notable
that variations in body mass or surface area do not systematically lead to differences in
metabolic rate, therefore conventionally expressing M in absolute terms is appropriate (Sawka
et al. 2011).
It should be noted that R, C and K may all be positive or negative, as they have the potential
to contribute to heat gain, whilst E can only be negative. A positive value for S represents a gain
in heat storage, whilst a negative value represents a net heat loss. Thus, both at rest and during
exercise, such as running during experimental chapters of this thesis, an individual’s steady-
state body temperature is contingent upon an individual’s ability to balance heat gain from
metabolic heat production (MHP) and the environment, with the ability to dissipate heat.
Furthermore, with reference to this thesis, as a positive S is typically observed during
endurance running with a progressive and consistent increase in body temperature, thermal
interventions must therefore aim to enhance heat dissipation through R, C, K and E, or indeed
reduce M for a given running velocity. However, it is pertinent to note that a positive S may be
a desirable outcome during heat acclimation training whereby the elevation of core
temperature is a primary consideration, therefore under these circumstances, an objective may
be to limit R, C, K and E, and/or increase W.

32
2.2.1.1 Heat production
As endotherms, humans produce heat during cellular metabolism, with metabolic energy
generated during the liberation of energy from macronutrients such as carbohydrates, lipids
and proteins. These ingested substrates may be converted into glucose, fatty and amino acids
respectively, with glucose and fatty acids metabolised predominantly through an aerobic
pathway for adenosine triphosphate (ATP) production. This energy production is relatively
inefficient in terms of external work, with only ~20% of the produced metabolic energy used
during physical exercise such as cycling. The remaining ~80% is released as heat to nearby
tissues and travels through the body via the bloodstream (Brooks et al. 1996). Accordingly,
anatomical locations where a large amount of energy is liberated, such as the musculature of
the upper legs, are a large source of heat production. Based on the calorific value of the
ingested substrates together with oxygen consumption to metabolise these for external work, a
measure of metabolic energy expenditure (gross energy), and subsequently metabolic heat
production (less external work), is possible. The energy yields per litre of oxygen consumed for
carbohydrates, fats and protein are 21.13 kJ, 19.62 kJ and 19.48 kJ, respectively (Brooks et al.
1996). Based on the ratio of the volume of carbon dioxide produced to the volume of oxygen
consumed, the predominant substrate being oxidised can be identified. Thus the respiratory
quotient, or respiratory exchange ratio (RER) when measured via exhaled breath, indicates the
proportion of carbohydrates (RER = 1.0), fat (RER = 0.71), protein (RER =0 .835) or mixed diet
(RER = 0.85) being oxidised during a given task (Brooks et al. 1996). Therefore, the magnitude
of MHP (M) can then be estimated through indirect calorimetry, incorporating oxygen uptake
and the respiratory exchange ratio (RER) using the following formula where VO2 is the volume
of oxygen (L.min-1) and RER is the respiratory exchange ratio (Jay & Kenny 2007).
Equation 4: Calculation of metabolic heat production (Jay & Kenny 2007).
Resting levels of metabolic heat production may be 70 – 100 Watts (Parsons 2014), with
this rising to 300-1200 Watts during most physical exercise (Sawka et al. 2011). As a
consequence of the positive linear relationship between external work and oxygen
consumption, as exercise intensity increases, a concomitant increase in the MHP associated
with that activity is also observed. Therefore, as shown by the equation, despite the
contribution of RER and irrespective of other descriptive characteristics, oxygen consumption is

33
the greatest determining factor for MHP and the prominent threat to homeothermy (Jay et al.
2011; Cramer and Jay 2014; Smoljanic et al. 2014).

34
2.2.1.2 Heat dissipation
In order to preserve a stable body temperature, increases in thermogenesis must be
balanced by thermolysis, the rate at which heat is dissipated to the environment. The heat
balance equation highlights the four pathways for heat exchange which will determine heat
dissipation.
Radiation (R) is the electromagnetic energy transfer between a relatively cool and warm
body. This occurs through a combination of solar radiation, reflection from the ground and
diffuse radiation from atmospheric molecules colliding, with the magnitude of heat exchange
dependent upon the gradient between the body and the environment (Cheung 2010, Parsons
2014). However, this relationship can be modified upon the composition of the ground and
surrounding physical surfaces, cloud cover, time of year, altitude, exposed body surface area
and clothing (Cheung 2010). When environmental temperature exceeds skin temperature, the
thermal gradient between the body and the environment is reversed, with radiation presenting
a source of net heat gain. At rest, radiation accounts for approximately 60% of total heat loss,
reducing to 5% during exercise. However, when an individual is indoors radiative heat exchange
is minimal and therefore, for experimental trials such as those in this thesis, assumed equal.
Conductive heat exchange (C) occurs through direct physical contact between objects.
Specifically, as molecules of greater heat collide with cooler molecules, molecular agitation
occurs, with a net transfer of heat to the cooler media (Cheung 2010). It is through this
mechanism that heat production from a major muscle group increases temperature of the
surrounding tissues. Under most circumstances, in terms of whole body heat exchange, the
magnitude of conductive heat transfer is negligible. However, significant conductive cooling can
be achieved through thermal interventions such as placing ice packs directly on the skin.
Convective heat exchange (K) occurs by mass motion of air or water, as the molecules of
the warm body expand, become less dense and therefore move away in a convective current,
thereby removing heat. Thus convection can occur in both the air and water and as with
radiation, in humans, convection is dependent upon a temperature gradient between the skin
and the air or water. This gradient can be modified by the rise in skin temperature that occurs
during the enhanced cutaneous blood flow as an individual performs exercise, therefore
enhancing convective cooling. Convective heat exchange is also dependent upon the net flow
of the respective medium (air or water) over the surface of the skin, such as wind speed, as well
as the exposed surface area, which may be determined by anthropometry, clothing and
posture. Conduction and convection may be considered interconnected, due to their related

35
roles in heat exchange between media, such as solids, fluids and gases. Consequently,
conduction and convection contribute approximately 20% to heat loss at rest, with this is
reducing to 15% during exercise (Wendt et al. 2007).
Evaporative heat loss (E) occurs when there is a transfer of heat between a body and a
medium, such as sweat, that requires an initial change in state from liquid to vapour at the skin
surface (Parsons 2014). Human thermoregulation involves the secretion of sweat on to the skin
surface via eccrine sweat glands, with an energy transfer occurring from the body to the
environment as sweat evaporates from the skin surface. Evaporation can account for up to 80%
of heat loss during exercise and is therefore considered the most effective method for losing
heat and reducing core temperature in humans and thus offsetting a positive S, the rate of heat
storage (Gagnon et al. 2013). Each litre of sweat evaporated from the skin liberates 2.4 MJ of
latent heat, or 680 W.hr-1 (Wenger 1972). Therefore, as MHP can reach 800 - 1500 W during
high intensity exercise, a sweat rate exceeding 2.0 L.hr-1 may be required to maintain heat
balance (Gleeson 1998; Brotherhood 2008). Humans have a finite capacity for evaporative heat
loss therefore, when combined with high heat stress, the evaporative requirement of a runner
to maintain body temperature can exceed the evaporative potential of the environment. The
rate of evaporative heat loss from the skin is primarily determined by the difference in the
partial pressure of water vapour between the skin surface (sweat) and ambient air (humidity)
(Kenney 1998). However, even under conditions where ambient air is fully saturated, such as
100% relative humidity, evaporation may still be possible if an absolute humidity gradient exists
between the skin and air (Jay & Kenny 2013). In addition to the atmospheric conditions,
evaporative heat loss will also be determined by maximum sweat rate, air velocity, clothing,
body surface area and the fraction of this area saturated with sweat, known as skin wettedness
(Jay & Kenny 2013). Evaporation also has a significant convective component since it is
dependent upon the velocity at which ambient air passes across the skin.
By examining the relationship of heat exchange between the body and environment it is
apparent that thermoregulation is a complex interrelated process that necessitates both dry
heat exchange (R, C and K) and wet heat exchange (Cheung 2010). For example, the relative
contribution of each may be determined by the magnitude of blood flow from the muscle and
core delivering heat to the cutaneous anatomy, and then the ability to vaporise sudomotor
output. Therefore, effective thermoregulation requires an integrated response to maximise the
efficiency of these processes.

36
2.2.2 Human thermoregulation
Human thermoregulation is ultimately achieved through two collaborative processes;
behavioural and physiological temperature regulation (Sawka et al. 2011). The effect of
behavioural thermoregulation that serves to reduce MHP and body heat storage is significant,
and manifests as an altered pacing strategy during endurance running performance (Flouris &
Schlader 2015). Behavioural temperature regulation operates through conscious behavioural
alterations to alter heat storage, and extends to clothing changes and seeking of shade.
Physiological temperature regulation operates independently of conscious behaviour and can
determine the rate of MHP, cutaneous vasodilatation and constriction and sweating.
The maintained internal body temperature has been termed a ‘set-point’ (Hammel et al.
1963; Hensel 1973), which is actively maintained by central and peripheral effectors when a
‘load error’ occurs between body and set-point temperature (Sawka & Young 2006). The ‘set
point’ is a mathematical concept describing the thermal control of effector responses. The pre-
optic anterior hypothalamus (POAH) acts as a central integrator of thermal stimuli, as shown in
Figure 8, eliciting proportional responses for thermogenesis or thermolysis to maintain heat
balance. In addition to the POAH, central thermoreceptors are located in the cortex and spinal
cord, whilst peripheral thermoreceptors are found within the epidermis, blood vessels, and
deep abdominal and thoracic tissue (Insler & Sessler 2006). Body temperature can be
demarcated into central core and peripheral shell temperatures (Jay, Gariépy, et al. 2007).
While TCORE represents deep-tissue organs that possess high levels of basal metabolism, such as
the brain, heart, and liver, the shell temperature is influenced by blood flow to the skin and
environmental temperature. Shell temperature is usually around 4°C lower than core
temperature, facilitating the transfer of heat away from the core to the periphery, which in
turn is usually above environmental temperature (Tansey & Johnson 2015).
Lesion studies indicate neither central or peripheral areas independently and precisely
control and coordinate both afferent and efferent signals as in the POAH (Boulant 2000).
Afferent signals from both central and peripheral thermoreceptors are integrated at the POAH
and initiate and elicit principal autonomic and behavioural thermoregulatory effector
responses. The POAH appears sensitive to hypothalamic temperature to an accuracy of 0.01°C,
due to predominance of localised warm sensitive neurons, that are characterised by thermally
stimulated ion channels in the cell body (Nakamura 2011). Warm sensitive neurons effect a
response by signalling to open ion channels which in turn create an electrical potential to evoke
a proportional thermoregulatory response (Nakamura 2011).

37
Figure 8: Schematic of thermoregulatory control system. Tsk represents skin temperature and Tc
represents core temperature. From Sawka & Young (2006).
Although the notion of a set-point, achieved through a central thermal command, is not
wholly accepted (Hensel 1973; Romanovsky 2007), Sawka et al. (2011) suggest the unanimity of
thermoregulatory responses from thermal variation in both the core and periphery is indicative
of central, rather than peripheral control. For example, the primary autonomic effector
responses of vasodilation and sweating appear to initiate simultaneously (Sessler 2008).
Further, there appears to be cohesion in shifts of the set-point alongside variables such as
biological rhythms, pyrogens, and heat acclimation. Such observations are suggestive of a form
of holistic thermoregulatory control, rather than independent neural networks without a
unified central integrator (Romanovsky 2007). Notwithstanding these considerations, a recent
theory concerning each thermoregulatory effector response as part of an independent neural
network, without a set point and with coordination achieved through body temperature,
cannot be dismissed (Romanovsky 2007). Although afferent signals originate from both core
and peripheral cutaneous receptors, the POAH appears more sensitive to changes in core
temperature, in terms of effecting autonomic responses such as vasoconstriction. Nadel et al.
(1971) suggested that a 1°C change in TCORE equates to a thermoregulatory response nine times
larger than would follow a 1°C change in TSKIN. Indeed, Kurz (2008) has proposed the variation
of TCORE about the set-point before an autonomic response is evoked to be 0.2°C, while skin
temperature generally varies over a far wider range of several degrees before a response is
initiated. However, skin temperature is more sensitive to environmental changes than TCORE,

38
therefore the role of TSKIN on thermoregulation should not be underestimated (Sawka et al.
2011). Moreover, it would seem peripheral thermoreceptors contribute to prompt behavioural
changes, due to a strong relationship between peripheral temperature and thermal comfort
(Frank et al. 1999).
As an individual begins to exercise, there is an immediate increase in MHP, however heat
loss kinetics result in a temporary dissociation between heat gain and heat dissipation, thus
resulting in an increase in body heat content and an increase in body temperature. The body
initially responds to exercise through sympathetic vasoconstriction, directing blood flow to
active muscles. Central and peripheral thermoreceptor afferent feedback will determine heat
loss responses from the POAH as appropriate. Efferent output from the POAH subsequently
promotes vasodilatation, resulting in a small transfer of heat to the periphery, proportional to
the magnitude of blood redistribution. This increases convective and radiative heat loss as a
consequence of an elevated TSKIN, which has promoted an enhanced temperature gradient
between the skin and environment. This vasodilation is achieved through a 1-2 L.min-1 increase
in cardiac output, mediated by an increased heart rate and decreased perfusion of splanchnic
and renal tissue (Rowell 1973). Whilst the magnitude of skin blood flow is proportional to
alterations in TCORE, there appears an upper limit at a core temperature of ~38°C (Brengelmann
et al. 1977; Smolander et al. 1987; Patterson et al. 1994). The skin blood flow response is
covered in greater detail subsequently (Section 2.3.1). Alongside vasodilation, sympathetic
cholinergic fibres stimulate sudomotor output across the body, enhancing evaporative heat loss
to that from respiration. Again, the reader is referred to a subsequent section where the sweat
response is discussed in greater detail (Section 2.3.3). However briefly, efferent output from
the hypothalamus is relayed by sympathetic cholinergic fibres that innervate individual eccrine
sweat glands (Shibasaki et al. 2006). Acetylcholine initiates a series of chemical reactions that
ultimately releases isotonic fluid from the secretory cells of the sweat gland (Kellogg et al.
1995; Shibasaki & Crandall 2010). During exercise, the reliance on evaporative heat loss
increases and becomes the predominant heat loss mechanism (Parsons 2014; Sawka et al.
2011; Kenney 1998). A litre of evaporated sweat has the potential to liberate 2.4 MJ or 680
W.hr-1 of heat energy (Kenney 1998). Consequently, endurance runners are characterised by
high sweat rates, such as 1.77 L.hr-1 and higher (Godek et al. 2005), as sudomotor output
attempts to balance MHP, which may exceed 1000 Watts during endurance running (Nielsen
1966).
Traditionally, it has been reported that fitter individuals have a greater thermoregulatory
ability, as a consequence of a greater local and whole body sweat rates for a set relative

39
exercise intensity (Gisolfi & Cohen 1978; Greenhaff 1989; Saltin & Hermansen 1966). This
follows the notion that individuals with a greater maximal aerobic capacity possessed a greater
potential to dissipate heat, to balance the greater MHP for a given exercise intensity (Saltin &
Hermansen 1966). Consequently, aerobic fitness has long been considered a prominent
variable for determining changes in TCORE (Saltin & Hermansen 1966; Havenith et al. 1998),
which may be important to prescribing exercise during heat acclimation training, or identifying
an individual’s predisposition to heat illness. This theory has pervaded due to the implications
concerning the prescription of exercise intensity relative to VO2max in experimental trials.
Accordingly, greater sweat rates have been observed in fitter individuals, compared with
untrained, when exercising at the same percentage of VO2max (Ichinose-Kuwahara et al. 2010).
In recent years, this theory has been challenged (Jay et al. 2011; Cramer & Jay 2015; Smoljanic
et al. 2014; Dervis et al. 2014), with the suggestion the lower sweat rates may be a
consequence of a lower required sweat rate to maintain heat balance (Ereq), due to exercising at
a lower absolute MHP. Moreover, VO2max does not have an independent effect on
thermoregulation and rather the absolute rate of MHP appears to be the primary determinant
for changes in TCORE. Jay et al. (2011) compared two groups matched for body mass and body
surface area, who displayed high (>60 mL.kg-1.min-1) or low (<40 mL.kg-1.min-1) VO2max values.
No difference in TCORE change or whole body sweat loss were observed when individuals
exercised at the same absolute rate of metabolic heat production (540 W) in a physiologically
compensable environment. Conversely, when exercising based on %VO2max, large differences in
TCORE response (~0.6°C) were observed between groups during the 60 min exercise, as shown in
Figure 9. Similarly, large differences were observed in whole body sweat rate (807 ± 155 ml
trained vs 486 ± 59 ml untrained) when exercise was prescribed through %VO2max.

40
Figure 9: Modified from Jay et al. (2011). Left: Different change in TCORE when exercising at
%VO2max in groups with high (HI) and low (LO) VO2max. Right: Similar TCORE response when
exercising at a fixed metabolic heat production irrespective of high (HI) or low (LO) VO2max.
Cramer et al. (2012) provided further evidence to emphasise the importance of controlling
for MHP, with change in TCORE and whole body sweat rate the same across high and low VO2max
groups during 60 min cycling at a MHP per unit of body surface area (275 W.m-2), which
produced the same Ereq in all participants. Although interestingly, Cramer et al. (2012) did
report differences in local sweat rate between trained and untrained individuals, with forehead
sweating almost double that in trained participants. Thus Jay (2014) suggests previous studies
may be confounded by methodological limitations and changes in TCORE and sweating are
primarily determined by heat production, body mass and BSA, not VO2max.
2.2.3 Interaction of heat stress and body temperature
Environmental heat stress may be defined as the environmental and metabolic conditions
that may lead to elevations in body temperature (Sawka et al. 2011). The heat balance
equation demonstrates how hot and humid conditions may exacerbate the challenge of
homeothermy, during prolonged periods of elevated MHP, as occurs during endurance running.
Increased ambient temperature reduces the potential for heat loss via convection and
radiation, resulting in a greater reliance on the evaporation of sweat. Moreover, an increase in
atmospheric humidity lowers the water pressure gradient from the skin to the air, potentially
reducing the volume of sweat that evaporates and cools the skin. Therefore, whilst running in
hot and humid conditions, a consistent rise in body temperature is observed, with the
prominent thermoregulatory defence being a reduction in MHP, manifested through a
behavioural alteration of reducing running speed (Tucker 2008; Schlader 2014).
Heat stress may be classified as compensable or uncompensable, determined by biophysics
and notably, the ambient environmental conditions and the exercise intensity (Cheung et al.
2000). When heat stress is compensable, the heat balance equation is maintained and heat
dissipation matches MHP such that body temperature remains at a steady state. Conversely, in
an uncompensable thermal environment, core temperature continues to rise as long as
work/exercise continues, at a given intensity, and steady-state core temperature is never
attained. Whether a given set of conditions is uncompensable or not therefore depends on a
combination of ambient temperature, water vapour pressure, exercise intensity and clothing
insulation. This concept was proposed by Lind (1963), who identified a prescriptive zone for
safe physical activity within compensable heat stress situations. This zone demarcates a range

41
of environmental temperatures where exercise at a given intensity results in thermal
equilibrium and thus a steady-state body temperature. This is shown below in Figure 10.
Figure 10: The prescriptive zone (Lind, 1963), whereby a steady-state body temperature can be
achieved under compensable heat stress (CHS), but not uncompensable heat stress (UCHS).
The model of Lind (1963) demonstrates how metabolic heat productions of 200, 350, 500
and 1000 W may elicit respectively elevated steady-state core temperatures within the
prescriptive zone, when heat stress is compensable. Therefore, thermal equilibrium may be
achieved throughout the prescriptive zone, producing a zero rate of heat storage, however
absolute core temperature remains different at different rates of MHP. This is explained by a
greater temporal dissociation between MHP and heat dissipation at these two workloads,
caused by a greater delay to reach a steady state temperature at a higher MHP, due to heat
loss kinetics. This delay reflects the time for sudomotor and circulatory responses to elicit an
increase in heat loss that equates to heat production. As the upper limit of the prescriptive
zones demarcates the transition to an uncompensable heat stress situation, alterations to
exercise intensity, clothing and/or environmental conditions may all represent work completed
beyond the prescriptive zone and therefore result in increased core temperature at the same
heat production.
These data of Lind (1963) indicated that absolute metabolic rate determines core
temperature within the prescriptive zone and beyond. However, these data originated from
just three individuals and Lind (1970) subsequently showed large inter-individual variability in
core temperature at fixed levels of heat productions. Cramer and Jay (201) have subsequently
identified body mass as an important determinant of core temperature response and suggest

42
the rate of MHP in Watts per kilogram of body mass predicts the core temperature response
better. This observation has practical consequences for prescribing exercise within heat
acclimation training that necessitates rapid and repeated elevation of core temperature across
individuals, over many days (Cramer & Jay 2015). Moreover, it facilitates a more controlled
exercise prescription for those exercising in the heat who have different fitness levels, and
therefore may exercise at different absolute exercise intensities (Jay et al. 2011), or may be
obese (Leites et al. 2013) or experience limited thermoregulatory function (Goosey-Tolfrey et
al. 2008; Price 2015).
2.2.4 Quantifying heat stress and heat strain
Accurately quantifying environmental heat stress is an important consideration for
competitors, coaches and organisers of competitions in hot environments, in order to
determine whether a competition will result in a compensable or uncompensable heat stress,
and allow appropriate preparation. Furthermore, the heat balance equation alludes to the
importance of incorporating a range of variables that will determine the efficiency of heat
dissipation within any measure of heat stress. For example, dry ambient temperature and
relative humidity will not account for heat from the sun, or indeed cooling from the wind. To
address this, Yaglou & Minard (1957) developed the Wet Bulb Globe Temperature (WBGT) to
help combat heat illness in American military personal in the late 1950s. This measurement has
become established as both an International (ISO 7243) and British (BS EN 27243) standard for
the assessment of heat stress (Budd 2008). The WBGT metric incorporates environmental
temperature, humidity, wind, solar radiation and surface radiation through a dry bulb
thermometer (DB), natural wet bulb thermometer (NWB) and a globe thermometer (GT). A DB
indicates dry ambient temperature through a mercury-filled thermometer, which is also
sensitive to cooling from the wind. The NWB represents the temperature when a wet wick
surrounds the mercury bulb. The wick may provide an indication of evaporative cooling through
difference between NWB and DB, with a minimal difference representing minimal evaporative
cooling, due to a high relative humidity. Finally, GT provides a measure of radiant heat, through
a black metal sphere surrounding the bulb. Therefore, the outdoor WBGT may be calculated
from the following equation.
Equation 5: Calculation of outdoor wet bulb globe temperature (°C).
WBGT = 0.7NWB + 0.2GT + 0.1DB

43
This calculation has subsequently been modified to provide a holistic indoor heat stress
assessment based on the assumption that GT matched DB in a sheltered environment, as
shown below.
Equation 6: Calculation of indoor wet bulb globe temperature (°C).
Indoor WBGT = 0.7NWB + 0.3DB
The use of WBGT, within predefined heat stress guidelines, has been shown to be effective
in reducing the incidences of heat illness in both military (Yaglou & Minard 1957) and sporting
environments (Bergeron et al. 2012). For example, current guidelines recommend the
suspension of play in soccer and tennis when WBGT is 32.2°C as the metabolic heat production
associated with typical performances in these sports will elicit an uncompensable heat stress,
that heightens the risk of heat illness (Mountjoy et al. 2012). A benefit of WBGT is that it
incorporates heat stress of vastly different characteristics, such as hot-dry or hot-wet
conditions, into one metric. Such integration appears valid for sporting performance, where no
thermoregulatory differences have been observed between repeated cycle sprinting between
hot-wet and hot-dry conditions, under matched WBGT (Hayes et al. 2014). However, the use of
WBGT is not without criticism, based upon unreliable calibration procedures and how natural
wet-bulb temperature should be assessed (Budd 2008). Furthermore, the relevance of WBGT
for sporting performance has been questioned based on the inability to account for clothing
accurately, and the measurement of air velocity not representative of that experienced by the
individual during exercise (d’Ambrosio Alfano et al. 2014).
Whilst useful, the inability of such a measure of environmental heat stress to predict or
monitor individual responses validly, is a consequence of the independent effect of factors such
as metabolic heat production according to exercise intensity and efficiency/economy (Cramer
& Jay 2015; Smoljanic et al. 2014), athlete morphology (Dervis et al. 2014), acclimation state
(Willmott et al. 2015), and clothing (Havenith 1999). Therefore, a need to consider heat stress
in combination with measures of individual heat strain is apparent (Racinais et al. 2015a).
Moran et al. (1998) developed a Physiological Strain Index (PSI) based around exercising heart
rate (HR) and core temperature (TCORE), relative to resting levels, that reliably reflects heat
strain across different types of heat stress (see Equation 11, General Methods Section 3.7.2).
Such an index has the benefit of being individualised, accounts for diurnal variation by
incorporating resting measurements, and should be sensitive to thermal changes arising from
clothing that is worn. However, PSI adopts arbitrary end-points for both HR (185 b.min-1) and
TCORE (38.5°C) that are routinely exceeded during endurance running in the heat, and therefore
PSI may not be appropriate for comparing between individuals or between exercise modes.
44
Through a series of experiments by Moran and colleagues, the PSI has been shown to be valid
across a range of environmental conditions including; hot-dry, hot-wet, and normal conditions,
with data primarily based upon steady-state measurements (Moran et al. 1998; Moran,
Horowitz, et al. 1999; Moran, Shapiro, et al. 1999). Subsequently, PSI has been approved for
use during intermittent exercise, based on a study involving three repetitions of 15 min : 5 min
work : rest cycles (Gotshall et al. 2001).
Alternative approaches to quantifying thermal strain at rest and during exercise include
combining core and skin temperature to provide an estimates of mean body temperature
(Burton 1935; Colin et al. 1971; Jay & Kenny 2007) from which can be calculated body heat
content (BHC) and body heat storage (BHS) (Jay & Kenny 2007). The inclusion of TSKIN in a
measure of thermal status appears appropriate given it’s responsiveness to changes in
environmental or body temperature (Roberts et al. 1977), as it is through the skin that heat is
gained or lost. Additionally, Sawka et al. (2011) has highlighted how the extremely high TCORE
associated with fatigue and exercise cessation is routinely observed in association with a high
TSKIN and there is emerging evidence that TSKIN has a large and direct influence on behavioural
thermoregulation and therefore exercise intensity during free paced trials (Schlader, Simmons,
et al. 2011a; Flouris & Schlader 2015). Although the accuracy of mean body temperature
measurements has been called into question when whole body calorimetry is not used (Jay,
Reardon, et al. 2007), such an estimation may remain useful for interpreting alongside other
measures such as PSI and alone may remain appropriate for determining treatment effects in
repeated measures designs (Sawka et al. 2011). However, many methods of skin temperature
measurement are cumbersome, and require long, trailing wires and the investigation of less
intrusive, portable, wireless and non-contact methods of TSKIN measurement would therefore
appear warranted for both practitioners and within research. This would enhance the ability to
better quantify and predict thermal status during exercise in the field, individually, or in
combination with other measures such as WBGT and PSI.
2.3 Physiological effects of heat strain
2.3.1 Skin blood flow
The anatomy of human skin affords the potential for a large temperature gradient between
circulating blood and the external environment. The skin is dual layered, with an exterior
epidermis containing epithelial cells located above a dermis layer that contains blood vessels,
nerves, eccrine sweat glands and hair follicles. Modulation of dermis microcirculation facilitates
heat loss through radiation and convection by enhancing this temperature gradient to the
45
environment with an increase in warm blood from the core. Thus, the body can control dry
heat loss by varying skin blood flow and skin temperature. Furthermore, when sweating occurs,
skin blood flow serves to deliver heat that can subsequently be removed by sweat evaporation,
therein sweating and skin blood flow complement each other in dissipating heat.
Large regional differences in skin blood flow exist, in part due to anatomical differences in
the microstructure of the skin (Roddie 1983). Glabrous skin, which contains no hair, can be
found on the palms, ventral region of fingers, soles, forehead and lips. Conversely, nonglabrous
skin contains hair, and is more widely found across the body (Johnson et al. 2014). It has been
suggested that between 25% and 27% of total skin blood flow is directed to the head and
hands, despite these areas only comprising about 13% of the total skin surface (Tikuisis et al.
2001). Consequently, extrapolation of localised blood flow data into whole body estimations
may be inaccurate. Regional differences in skin blood flow and heat transport can be partially
attributed to the presence of arterio-venous anastomoses (AVAs). AVAs are only present in
glabrous skin and once opened, allow blood to bypass high resistance capillaries at the skin
surface, connecting arterioles to venules. Therefore, the opening of AVAs greatly increases the
volume of blood, and thus heat, transported to the skin (Roddie 1983, Johnson et al. 2014).
Although the area of glabrous skin is small relative to the entire body surface, the contribution
to thermoregulation is significant, as a consequence of not only AVAs, but because glabrous
skin is routinely and directly exposed to the environment, and not covered by clothing.
Skin blood flow is controlled by sympathetic nervous system activity, in response to
changes in TSKIN and TCORE, with vascular smooth muscle acting as effectors to central commands
(Johnson & Kellogg 2010). Human skin is under dual vasomotor control (Johnson et al. 2011),
with nonglabrous skin is innervated by both noradrenergic vasoconstrictor and cholinergic
vasodilator nerves, whereas glabrous skin, is innervated solely by vasoconstrictor nerve fibres,
with vasodilatation achieved in these regions by withdrawing vasoconstrictor activity. The
precise mechanisms that determine skin blood flood remain a topic of debate (Johnson et al.
2014), however acetylcholine appears to mediate initial vasodilation (Kellogg et al. 1995), with
an, as yet unidentified cholinergic vasodilator determining the overall response (Charkoudian
2010). This could be nitric oxide (Kellogg et al. 1998; Lorenzo & Minson 2010), or indeed a
collective response to adenosine, prostaglandins and nitric oxide (Mortensen et al. 2009).
Moreover, a number of other substances have been implicated as contributors, including
vasoactive intestinal peptide, histamine and transient receptor channels, however their precise
roles remain to be fully elucidated (Tansey & Johnson 2015; Sawka et al. 2011). Finally, in
contrast to a model of independent control of skin blood flow, it has been suggested that there

46
is a shared response with that of sudomotor output, given the concurrence of these responses
(Charkoudian 2010).
Initially, during exercise in the heat, skin blood flow is characterised by vasoconstriction, as
active muscle is supplied with blood at the expense of cutaneous circulation (González-Alonso
et al. 2008). However, as TCORE rises, afferent feedback from central thermoreceptors increases
and peripheral vasodilation is facilitated, manifested by an increase in heart rate to maintain
cardiac output (González-Alonso et al. 2008). Although, maximal whole-body skin blood flow
measurements are not possible, it has been estimated that skin blood flow can be as high as 7.8
L.min-1 in a hot environment (Taylor et al. 1984; Rowell 1986). Despite the potential conflict for
cardiac output from haematic requirements for skeletal muscle metabolism and
thermoregulation in the periphery, muscle blood flow is maintained at sub-maximal intensities
at the expense of skin blood flow (Gonzalez-Alonso et al. 1998). Thus as exercise continues, the
magnitude of skin blood flow is proportional to the elevation in TCORE (Rowell 1974), until an
upper limit at a core temperature of ~ 38°C, despite this equating to approximately 50% of the
potential maximal blood flow (Brengelmann et al. 1977; Smolander et al. 1987; Patterson et al.
1994), as shown in Figure 11. Compromised skin blood flow during exercise is also a
consequence of increased vasoconstrictor tone, elevating the TCORE threshold for the increase of
skin blood flow to aid thermoregulation during exercise, compared to rest (Bevegard &
Shepherd 1966; Kenney & Johnson 1992).
Figure 11: Schematic description of the thermoregulatory control of skin blood flow as modified
by moderately intense exercise. The relation of skin blood flow to internal temperature is

47
affected, relative to resting conditions, in at least three ways by exercise: a vasoconstrictor
response at the onset of dynamic exercise (A), an increase in the internal temperature
threshold at which skin blood flow begins to increase (B), and a levelling off, or plateau, in skin
blood flow above an internal temperature of 38°C at a level well below maximal (C) (Gonzalez-
Alonso et al. 2008).
As ambient temperature increases, so too does the importance skin blood flow to maintain
the core-to-skin gradient and in turn, heat balance (Kenefick et al. 2010). The skin blood flow
requirement to maintain heat balance can be estimated, based on an individual exercising at a
known exercise intensity, TCORE and TSKIN, as shown in Table 3.
Table 3: Marathon runner’s skin blood flow requirements for several core (Tc) and skin (Tsk)
temperatures during heat stress (Kenefick et al. 2010). Estimated using 60 kg body mass and
325 m.min-1 running velocity, after subtracting for work (20% efficiency) and 50% dry and
evaporative heat losses.
For example, based on the assumption that blood entering and leaving the cutaneous
vasculature is equal to TCORE and TSKIN respectively, a net MHP of 540 Watts with TCORE of 38°C
and TSKIN of 30°C necessitates a skin blood flow of 1.1 L.min−1 (Sawka et al. 2011). Table 3
demonstrates how the minimal skin blood flow requirement to preserve the same heat transfer
rate increases in accordance with increased skin temperature and a reduced core-to-skin
gradient. The interaction of TCORE and TSKIN also alludes to the potential role of an elevated TCORE
in maintaining heat dissipation, without enhancing the skin blood flow requirement, which is
not in keeping with typical interventions that habitually seek to minimise increases in TCORE
(Sawka et al. 2011).
2.3.2 Cardiovascular system
To meet the concomitant demands of muscular and skin blood flow, cardiac output is
increased through an increase in heart rate, with prolonged endurance exercise characterised

48
by a cardiovascular drift as blood flow demands become more pronounced with increasing
body temperature (Wingo et al. 2005). A classic study by Rowell et al. (1966) demonstrates how
uphill walking, in a euhydrated state, elicits significantly greater cardiovascular strain in hot
(43°C) vs control (26°C) conditions, with a 150 – 200 ml reduction in central blood volume, 19 –
23 ml reduction in stroke volume, 21 – 29 b.min-1 elevation in heart rate and 1.1 – 1.2 L.min-1
reduction in cardiac output.
Importantly, muscular blood flow is maintained at submaximal intensities (Gonzalez-Alonso
et al. 1998), achieved in part, through a redistribution of blood, with visceral circulation
markedly reduced during heat strain (Rowell et al. 1966). As exercise approaches maximal
intensities, González-Alonso & Calbet (2003) have demonstrated that cardiac output and mean
arterial pressure reduce, leading to an impairment to skeletal muscle blood flow. Consequently,
a reduction in oxygen delivery, oxygen uptake at the muscle, and expedited fatigue compared
with normothermic conditions is observed (González-Alonso & Calbet 2003). The reduced
stroke volume occurs as per the Frank-Starling mechanisms, with increased cutaneous
resistance impairing venous return, thereby decreasing central venous pressure and central
blood volume (Gonzalez-Alonso et al. 1999; Crandall et al. 2008). This is in contrast to lower
exercise intensities whereby despite reductions in cardiac filling pressure, stoke volume is
maintained as a consequence of increased cardiac contractility (Brothers et al. 2009). Indeed,
cardiac output may reach up to ∼13 L.min−1 under heat stress as the heart attempts to meet
convergent demands of muscular (2.5 – 4 L.kg-1.min-1) and cutaneous flow (~8 L.min-1) (Rowell
1974). González-Alonso et al. (2008) highlights how haematic insufficiency may be the same
mechanism limiting maximal aerobic exercise performance under normothermic conditions, as
these demands combined would require a cardiac output of almost 40 L.min-1 to sustain
maximal exercise involving the recruitment of a large proportion of muscle mass.
This negative relationship between blood availability and exercise tolerance may be
exacerbated by dehydration, with trained runners demonstrating sweat rates of 3 L.hr-1, which
exceeds the maximal gastric emptying rate of 600 – 800 mL.hr-1 (Montain & Coyle, 1992;
Gonzalez-Alonso et al. 2000). The reduction in plasma volume that facilitates sudomotor output
reduces the central blood volume, consequently impairing stroke volume, cardiac output and
blood pressure (Gonzalez-Alonso et al. 1998). Gonzalez-Alonso et al. (2000) demonstrated a 6.4
± 1.3 % decrease in stroke volume per percent of dehydration, necessitating a 11 - 14 b.min-1
higher heart rate and decreased mean arterial blood pressure during 30 minutes of cycling at
72% VO2max at 35°C. Furthermore, the attenuation of exercise intensity is likely inevitable during
49
exercise that continues for many hours, such as marathon running, given the associated sweat
rates and maximal gastric emptying rate.
2.3.3 Sudomotor function
Alongside alterations in peripheral circulation and radiative and convective heat loss,
afferent feedback concerning elevations in TCORE and TSKIN are integrated within the POAH and
stimulate concomitant sudomotor activity to facilitate evaporative cooling. The primary
effectors of this response are the eccrine sweat glands, of which there are thought to be 1.6 –
4.0 million in the human body (Shibasaki et al. 2006). Efferent signals innervated the ducts and
coils of glands by releasing acetylcholine from cholinergic fibres. In turn, acetylcholine binds to
muscarine receptors, increasing calcium concentration and enhancing the permeability of K+
and Cl- channels, which initiates the release of an isotonic precursor fluid from the secretory
cells (Sato et al. 1989). It is thought that as the fluid travels up the duct toward the surface of
the skin, sodium and chloride are reabsorbed, resulting in sweat on the skin’s surface being
hypotonic relative to plasma. However, during periods of high sweat rates, such as running in
the heat, ion reabsorption mechanisms may be overwhelmed by the volume of sweat secreted
into the duct, resulting in higher ion losses and making sweat sodium content dependent on
sweat rate (Bulmer & Forwell 1956; Cage & Dobson 1965). The torso appears to demonstrate a
sweat response in advance of peripheral limbs, with the localised sweat volume dependent on
the density and secretion rate of sweat glands (Nadel et al. 1971). Fitter individuals do not
independently possess a greater whole body sweat rate, but may demonstrate localised
differences, such as on the forehead (Cramer et al. 2012).
The evaporative heat loss to the environment will be determined by the moisture content
of the air, quantified through the ratio of ambient vapour pressure to the saturated water
vapour pressure, the relative humidity (Kenney 1998). Thus, the rate of sweat evaporation is a
product of the gradient between skin and air water vapour pressures, and the coefficient of
evaporative heat transfer (Gagge & Gonzalez 2011). Based on a known exercise intensity, the
evaporate requirement (Ereq) of an individual can be estimated a priori. For example, an
individual performing exercise at a 600 W metabolic rate, liberates approximately 80% of the
energy consumed as heat. Consequently, 480 W (28.8 kJ·min−1) must be dissipated to maintain
heat balance. As the specific heat of body tissue is 3.5 kJ.°C−1, a 70 kg individual has a heat
capacity of 245 kJ·°C−1. Therefore, based on the latent heat of sweat evaporation of 2.43 kJ.g−1,
approximately 12 g.min-1 or 0.72 L.h−1 of sweat must be secreted and evaporate to prevent an
elevation of body temperature (Sawka et al. 2011). Consequently, activities such as running

50
that require a high MHP likely result in net dehydration when sweat loss exceeds 2 L.hr-1,
irrespective of hydration strategies when gastric emptying may be only 600 – 800 ml.hr-1
(Montain & Coyle 1992; Gonzalez-Alonso et al. 2000). As previously detailed, the consequences
of sweat-induced dehydration on the cardiovascular system are profound, and may contribute
to an impaired VO2max in the heat. It may however, be possible to predict such situations and
implement strategies to mitigate against dehydration. For example, as shown below, Shapiro et
al. (1995) developed a sweat rate prediction equation, which may permit informed decisions to
be taken concerning an athlete’s readiness to compete at a given location.
Equation 7: Sweat rate prediction equation (Shapiro et al. 1981).
Sweat rate (g·m−2·h−1) = 147 + 1.527·Ereq – 0.87·Emax
Consequently, it may be possible to individualise thermal interventions to ensure that
adaptation is sufficient for the intended environment so long as the required evaporative
cooling (Ereq) and evaporative cooling capacity of the environment (Emax) are known.
2.3.4 Skeletal muscle metabolism
Exercising in hot environments elicits a range of effects on metabolism, although the
precise mechanisms underpinning such alterations remain to be fully elucidated (Febbraio
2001). Skeletal muscles temperature can often vary by 2 to 4°C during exercise-heat stress
(Gonzalez-Alonso et al. 1999; Jay, Gariépy, et al. 2007) and elevated muscle temperature is
associated with an increased rate of glycogenolysis (Fink et al. 1975; Parkin et al. 1999), and
earlier increases in plasma blood lactate concentration (Hargreaves 2008). Hepatic glucose
production is also increased during exercise and heat stress, although this change is not
accompanied by an increase peripheral glucose uptake (Angus et al. 2001). Although these
metabolic changes are not considered to limit prolonged endurance exercise in the heat
directly (Nybo et al. 2014), they may contribute towards the reduced LT and LTP in the heat
(Lorenzo et al. 2010), as well as increasing the likelihood of chronic glycogen depletion for
those consistently training in the heat (Hargreaves 2008). Furthermore, changes in metabolism
may elicit a more direct effect on fatigue during endurance performance in the heat as they
occur in association with cardiovascular and neuromuscular impairments (Nybo et al. 2014).
The enhanced contribution of glycogenolysis and glycolysis would appear to lead to an
imbalance in the production of lactate and ensuing conversion to pyruvate (Robergs et al.
2004). This imbalance may be partly attributable to compromised blood flow arising from the
visceral vasoconstriction (Rowell et al. 1971). Limiting splanchnic circulation in order to
facilitate peripheral vasodilation for heat dissipation, likely leads to a reduction in lactate

51
buffering in the liver. Concurrently, an increased lactate concentration may occur as a
consequence of the Q10 effect, whereby the increase in body temperature leads to an overall
increase of substrate metabolism (Nadel 1985). Finally, Febbraio et al. (1994) has previously
highlighted a strong relationship between reduced plasma adrenaline levels in explaining
metabolic changes following heat acclimation, notably a reduced RER, indicating greater fatty
acid or ketone oxidation and less glycogenolysis. These findings were in the apparent absence
of changes in fibre type recruitment and with changes far exceeding that from a Q10 effect.
This investigation built on the apparent relationship between an elevated TCORE and exertional
heat stress, that have been shown to increase plasma adrenaline levels (Febbraio et al. 1994;
Gonzalez-Alonso et al. 1999; Hargreaves, Angus, et al. 1996; Hargreaves, Dillo, et al. 1996), and
for which there is evidence of an associated increase in glycogenolysis during exercise
(Greenhaff et al. 1991; Spriet et al. 1988). Since glycogen phosphorylase activity is enhanced by
β-adrenergic receptor stimulation (Richter et al. 1982) it seems plausible that an increase in
circulating adrenaline drives a concomitant increase in intramuscular glycogen utilisation.
Notwithstanding this apparent relationship, such a finding has not been universally observed,
and the relationship between adrenaline and glycogenolysis, as well as more broadly
conferencing metabolic alterations in the heat, remains a somewhat mixed picture (Febbraio
2001).
2.4 Endurance performance in the heat
The aforementioned physiological changes arising from heat stress are associated with an
increased percentage of non-finishers during prolonged running races (Vihma 2010; Wegelin
and Hoffman 2011), reflecting an inverse relationship between ambient temperature and
endurance performance (Ely et al. 2007; Ely et al. 2008; Vihma 2010; Wegelin & Hoffman 2011).
Therefore, it is apparent that endogenous and exogenous thermal strain combine to produce a
relative exercise intolerance. Such intolerance is underpinned by the absolute level of MHP
required in different endurance distance events. To identify events that are most susceptible to
heat stress, Taylor and Cotter (2006) modelled the theoretical BHS for world record
performances in events from 100m through to the marathon, using normative morphometric
characteristics and the predicted MHP, assuming a net heat loss of zero (Figure 12). After
accounting for the specific heat capacity of human tissue, whereby 3.47 kJ of heat energy is
required to elevate 1 kg of tissue by 1°C, the resultant heat production curve demonstrates that
world record pace in the 1500 m and 3000 m races would increase body temperature by 2 and
4°C respectively.

52
Commensurate with the model of Taylor and Cotter (2006), larger impairments to
performance have been reported in longer duration events than 3000 m. Consequently, in a
meta-analysis of marathon running performance, El Helou et al. (2012) calculated that an
increase in ambient temperature 20°C above the optimal temperature increased running time
by 17.7% for males and 12.4% for females, equating to 0.03% per 1°C increase. El Helou et al
(2012) went on to identify median optimum environmental temperatures of 6.2°C for men and
6.8°C for women from 1,791,792 marathon finishers.
Figure 12: Estimated external work and metabolic heat production during world record track
performances over distances from 100m through to the marathon, using the morphometric
characteristics of each record holder, with no heat loss (Taylor & Cotter 2006).
This model of Taylor and Cotter (2006) provides a theoretical underpinning of the recent
results of Guy et al. (2014) who demonstrated a statistically significant, mean reduction of 3%
in performance across endurance events in hot (>25°C), compared with cool (<25°C) conditions.
Guy et al. (2014) also observed a ‘medium’ negative effect on World Championship Athletics
performance from 1500 m through to 10,000 m. As shown in Table 4, typical impairments from
heat stress within experimental studies are equally pronounced, with a mean reduction of -
13.4% in TT and -29.6% in TTE (Nybo et al. 2014). Whilst athlete fitness levels, event
duration/distance and the specific environmental conditions prevent clear synthesis both
between and within the studies selected by Guy et al. (2014) and Nybo et al. (2014)

53
respectively, it is apparent that the magnitude of impairment from heat strain is both
significant and meaningful for a competitive athlete.

54
Table 4: Comparison of normothermic (control) and hot (heat) environments on submaximal aerobic performance during time trial and time to exhaustion tests (modified from
Nybo
et al.
2014).
‘-‘
denot
es
data
not
provid
ed by
respec
tive
study.
‘Bike’
= cycle
ergom
eter.
Study n Protocol Exercise mode
Distance/ Duration
Control condition
Hot condition Impairment (%)
Temp (°C)
TCORE (°C)
TSKIN
(°C) HR
(b.min-1
) Temp (°C)
TCORE (°C)
TSKIN
(°C) HR
(b.min-1
)
Bannister & Cotes 1959 3 TTE - - 17 39.6 - 161 25 39.2 - - >-12
Dill et al. 1931 5 TTE Bike 37-60 min 12 38.2 - 139 34 39.0 - 175 -25
Galloway & Maughan 1997 8 TTE Bike ~50-105 min 21 ~39.3 ~31 ~164 31 ~40.1 ~35.0 ~174 -36
Gonzalez-Alonso et al. 1999 7 TTE Bike ~26-66 min 36 40.1 37.2 198 40 40.1 37.0 196 -39
MacDougall et al. 1974 6 TTE Treadmill - 23 ~39.4 ~31.5 178 39 ~39.4 ~35.7 181 -36
Mean = -29.6%
Altareki et al. 2009 9 TT Bike 4 km 13 37.9 36.4 - 35 38.3 38.0 169 -2
Ely et al. 2010 8 TT Bike 15 min (30 min pre-load)
21 38.1 31.1 95% 40 38.2 36.2 96% -17
Lorenzo et al. 2010 12 TT Bike 1 hour 13 38.7 25.1 130 38 38.9 34.6 165 -17
Lorenzo et al. 2010 8 TT Bike 1 hour 13 38.8 23 127 38 34.4 33.9 150 -16
Périard et al. 2011 8 TT Bike 40 km 20 38.9 ~27 ~179 35 39.8 ~35.8 ~184 -7
Roelands et al. 2008 8 TT Bike ~40 min (1 hour pre-load)
18 39.5 - ~185 30 40.0 - ~190 -25
Tatterson et al. 2000 11 TT Bike 30 min 23 39.0 ~26 195 32 39.2 ~32.0 195 -7
Tucker et al. 2004 10 TT Bike 20 km 15 38.8 ~28 181 35 39.2 ~35.0 184 -6
Tyler & Sunderland 2008 9 TT Treadmill 15 min (75 min pre-load)
14 ~38.5 - ~178 30 ~39.0 - ~180 -7
Watson et al. 2005
9 TT Bike ~40 min (1 hour pre-load)
18 39.2 - - 30 39.7 - 178 -30
Mean = -13.4 %

55
The precise manner in which the physiological effects of heat stress combine and manifest
as impaired performance and/or capacity remain a topic of fierce debate (see reviews by;
Périard [2013], Nybo et al. [2014], Hargreaves et al. [2008], Febbraio [2001], Cheung [2007],
Tucker [2008], Ely et al. [2007]). Nevertheless, it is commonly accepted that athletes
demonstrate a reduction, or regulation, of exercise intensity, in order to optimise performance,
with such adjustments termed ‘pacing’ (Tucker 2008). The following sections will outline the
current state of knowledge concerning exercise performance and hyperthermia. Initially this
will address the effect of heat stress on the determinants of endurance performance, before
considering alternative, currently advocated models that specifically concern self-paced
endurance performance in the heat.
2.4.1 Effect of heat stress on the determinants of endurance performance
The determinants of endurance performance model dictates that an individual’s VO2max
defines the upper limit of aerobic metabolism, beneath which the interaction of the LT and RE
will determine running velocity (Coyle 1995). In turn, the formula of Joyner (1991) (Equation 1,
Section 2.1.1) demonstrates how the determinants integrate, when confounding individual
factors such as motivation, dehydration, hyperthermia and carbohydrate depletion are
excluded. Potentially, heat stress may influence each of these factors, and furthermore, heat
appears to impair both VO2max and LT, whilst the effects on RE are equivocal, so it is unclear
whether the decrement in performance is proportional to the impairments within the model.
The most notable reduction appears to be in VO2max, although the uniformity of heat stress
induced impairments to VO2max is not without contention (Williams et al. 1962; Rowell et al.
1965; Pirnay et al. 1970). However, when methodological factors such as heat stress duration,
training status and a concomitant elevated TCORE are controlled for, there is greater unanimity
with VO2max reductions apparently proportionate to the TSKIN elevation (Arngrimsson et al.
2004). The VO2max reduction is likely mediated by an inability to achieve equivalent maximal
cardiac output as in normothermic conditions (Rowell 1966), as demand for both cutaneous
and muscular circulations compounds venous return (Gonzalez-Alonso & Calbet 2003). This is
supported by recent data, whereby despite apparent alterations to the Frank–Starling
relationship and cardiac contractility arising during passive heat stress (Wilson et al. 2009), no
differences in myocardial systolic or diastolic function were observed during maximal exercise
in the heat, compared with normothermic (Smith et al. 2015). The magnitude of VO2max decline
is typically between 5-20% as shown in Table 5, which is closely associated with reduced
exercise capacity (r = 0.82 – 0.84, Arngrimsson et al. 2004) as shown in Figure 13.

56
Table 5: Effect of environmental heat stress (Heat) on VO2max and Physical Work Capacity (PWC) during incremental intensity protocols, compared with temperate
(Control) conditions. Modified from Nybo et al. (2014).
Study n Control Heat VO2max change PWC change
Arngrímsson et al. 2003 22 25°C 35°C -4% -8%
Arngrímsson et al. 2003 40°C -9% -14%
Arngrímsson et al. 2003 45°C -17% -32%
González-Alonso & Calbet 2003 8 14-16°C 44°C (perfused suit) -8% -28%
Klausen et al. 1967 6 25°C 40°C -4%
Lafrenz et al. 2008 10 22°C 35°C -9% -52%
Lorenzo et al. 2010 12 13°C 38°C -16%
Lorenzo et al. 2010 8 13°C 38°C -18%
Pirnay et al. 1970 18 23°C 46°C -7%
Pirnay et al. 1970 8 23°C 46°C -27%
Rowell et al. 1969 27 26°C 49°C -3%
Sawka et al. 1985 13 21°C 49°C -8%
Wingo et al. 2005 7 22°C 35°C -7% -9%

57
Figure 13: Relationship between reduction in exercise capacity (PTIME) and reduction in VO2max
from 25 men (filled symbols; r = 0.84) and women (open symbols; r = 0.82). Data derived from
seven repeat trials. Solid line indicates the mean for men and dashed line for women
(Arngrimsson et al. 2004).
As previously discussed, there is an observable increase in blood lactate concentration
under heat stress (see Section 2.3.4). Consequently, a reduction in the exercise intensity and
fractional utilisation at the LT and LTP, compared with normothermic environments, is well-
established (Powers et aI. 1985; Young et al. 1985; Smolander et al. 1986; Tyka et al. 2000;
Papadopoulos et aI. 2008; Tyka et al. 2009; Lorenzo et al. 2010; De Barros et al. 2011).
Consistent with the determinants model, an increased reliance on glycogen consumption and
higher blood lactate concentration is likely associated with a decrease in endurance
performance (Bassett & Howley 2000). Although decrements to the LT and LTP under heat
stress are widely reported, different methodologies for defining and reporting LT precludes
synthesis of reported effects across the literature, although notably, Lorenzo et al. (2010) has
reported a ~5% reduction in LT in the heat from a range of methodologies during an
incremental cycling test in the heat. Similarly, Tyka et al. (2009) reported an 8% reduction in
LTP during incremental cycling at 31°C versus 23°C. De Barros et al. (2011) report a 17%
reduction in maximum lactate steady state at 40°C compared with 22°C, however the larger
decrement may reflect the prolonged nature of an MLSS protocol that likely results in greater
heat strain. Furthermore, the majority of literature pertains to cycling, so the decrement may
differ between exercise modes, due to a greater MHP when running, as well as participant
fitness. Consequently, the precise anticipated reduction in LT and LTP for trained runners,
exercising under heat stress, has yet to be established.

58
The effect of heat stress on RE is less well defined. Historically, elevated TCORE has been
associated with small increases in metabolic rate and therefore VO2 during prolonged
submaximal exercise (Sawka et al. 1983; Shvartz et al. 1977; MacDougall et al. 1974). This likely
reflects an increased metabolic demand from augmented circulation, sweating, ventilation and
impaired efficiency of oxidative phosphorylation within the mitochondria during heat strain
(Brooks et al. 1971, MacDougall et al. 1974). Consequently, Grimby (1962) has detailed a 5.5%
increase in VO2 when TCORE was elevated by 1.3°C, whilst Thomas (1999) observed a 6.2%
increase, when TCORE was elevated by 1.0°C. However, results appear equivocal, with both
Maron et al. (1976) and Rowell et al. (1969) reporting no changes in VO2 during exercise in the
heat. It has been suggested the increased metabolic demand arising from thermoregulatory
responses and reduced mitochondrial efficiency may be compensated for by increased
biomechanical efficiency from a warmer muscle (Saunders et al. 2004a).
In summary, evidence indicates the determinants of performance are impaired in the heat.
However, it is currently unclear to what extent these impairments explain the reduction in
endurance performance in the heat and whether these remain the primary determinants of
endurance performance under heat stress. Such information will be relevant to those
predicting and monitoring performance of those routinely training and competing in the heat in
the heat.
2.4.2 Effect of heat stress during free-paced exercise
This section will introduce common models pertaining to endurance performance and
pacing in the heat. Specifically, the influence of the additional thermal and perceptual strain
under heat stress will be discussed, with regard to whether this acts independently to, or in
combination with impairments to the determinants of endurance performance, in influencing
performance in the heat.
Traditionally, literature suggested exercise ceases in the heat at a ‘critical’ core (brain)
temperature of 40°C irrespective of starting TCORE (González-Alonso et al. 1999, Walters et al.
2000). When TCORE exceeds 40°C, symptoms of exertional heat illness typically present, resulting
in exercise cessation and potentially severe exertional heat illness (Armstrong et al. 1996). The
apparent independence of the critical TCORE from both acclimation and hydration status (Nielsen
et al. 1993), implicated a high TCORE as a direct contributing factor to fatigue. Whilst the precise
mechanisms behind this apparent internal threshold temperature remained unclear (Siegel &
Laursen 2012), a high TCORE may independently reflect a central nervous system protective
mechanism, which in turn limits motor-output (Cheung 2007). More recently, attention has

59
been drawn to the associated high TSKIN and significant cardiovascular strain at the point of
exercise cessation in many studies demonstrating an apparent critical TCORE, suggesting fatigue
was not a consequence of solely the absolute body temperature, but rather coinciding with a
combination of cardiovascular and sensory impairments (Ely et al. 2009; Sawka et al. 2011).
Furthermore, a critical TCORE has been proposed to be a laboratory phenomenon, particularly
during fixed intensity exercise (Tucker & Noakes 2009; Marino 2011), as athletes may exceed
this internal temperature during free-paced trials in the field (Ely et al. 2009; Lee et al. 2010;
Racinais et al. 2015b). In contrast to a critical TCORE hypothesis, an anticipatory regulation of
exercise intensity model has been advocated, suggesting most self-paced exercise is voluntarily
controlled in advance of an excessive rise in TCORE (Tucker & Noakes 2009). Accordingly,
anticipatory regulation states that an individual’s brain regulates exercise intensity to control,
and typically lower MHP, thereby ensuring exercise is completed without a catastrophic failure
of homeostasis as with a critical TCORE. The ability of runners to pace themselves to throughout
hot, long distance events such as marathons, before demonstrating an end-spurt, supports the
premise of central anticipation, rather than localised fatigue in the muscle (Noakes et al. 2009;
Tucker & Noakes 2009).
However, whilst more widely accepted than a critical TCORE hypothesis to explain fatigue in
the heat, anticipatory regulation is not without criticism (Jay & Kenny 2009; Ravanelli et al.
2014). Notably, Jay and Kenny (2009) have questioned the supposition that regulation can be
based upon BHS (Tucker et al. 2006), as there can be no feed-forward mechanism for heat
storage, given it represents the instantaneous difference between the MHP and net heat loss.
Indeed, recent evidence demonstrates reductions in self-paced exercise intensity in the heat
were not mediated by early differences in BHS (Ravanelli et al. 2014). However, the premise
that exercise intensity is the consequence of some form of internal regulation remains.
To mediate between the apparently contrasting models of anticipatory regulation and
critical TCORE, Schlader, Stannard, et al. (2011a) have suggested these models may in fact
complement each other, existing on a continuum. At one end of the continuum, fatigue
manifests through a progression of processes that develop into voluntary exhaustion, before
the loss of behavioural thermoregulation and ‘catastrophic’ failure at the other end of the
continuum. Schlader, Stannard, et al. (2011a) provided evidence from a retrospective analysis
of the literature to demonstrate alterations in work rate, at submaximal intensities in
accordance with sensations of fatigue, to ensure the safe completion of the exercise bout in
hand. Such an observation is underpinned by the principle of anticipatory regulation. However,
under certain circumstances, such as in a competition or when a highly motivated athlete is
60
exercising, Schlader, Stannard, et al. (2011a) suggest these fatigue signals can be over-ridden
and exercise performance is limited by volitional exhaustion i.e. a critical core temperature.
In addition to these prominent models, it has been suggested that the role of
cardiovascular stress in determining exercise performance in the heat may have been
overlooked (Périard 2013). Endurance performance in the heat has been shown to be
associated with a relative exercise intensity, as a percentage of VO2max, which appears to be
consistent despite the reduction in VO2max in the heat (Cheuvront et al. 2010; Périard et al.
2011; Périard 2013; Racinais et al. 2015b). This assertion is supported by the data of Lorenzo et
al. (2010) who reported an 8% increase in time trial performance alongside an 8% increase in
VO2max. Similarly, the recent study by Racinais et al. (2015b) reported a progressive reduction in
exercise intensity during a time trial in the heat, compared to cool conditions, which the
authors suggest reflects a progressive reduction in VO2max as hyperthermia develops, and
therefore the maintenance of a physiological threshold or relative exercise intensity. In this
study, athletes began a 43 km cycling time trial at the same intensity in both cool and hot
conditions, with a progressive reduction in power output occurring after 10 km, however heart
rate remained elevated and stable throughout the time trial. In accordance with the
progressive reduction in VO2max, power output reduced. Unlike the anticipatory regulation
model, a cardiovascular model does not immediately explain how an end-spurt may be
achieved in the heat, given individuals appear to be operating at a physiological threshold.
However, these authors have suggested this may be achieved through anaerobic energy
provision (Racinais et al. 2015b).
The evidence of Racinais et al. (2015b) demonstrates VO2max to be an important
determinant of endurance performance in the heat, however VO2max represents the integrative
ability of a selection of physiological processes, therefore in itself, it may not be the single best
determinant. Consequently, other research has highlighted the influence of high TSKIN, alongside
a high TCORE, in determining exercise performance under heat stress (Sawka et al. 2013; Lee et
al. 2015; Flouris & Schlader 2015). A high TSKIN has direct cardiovascular consequences, due to
the associated skin blood flow requirements, but also heavily influences thermal perception
and therefore self-selected exercise intensity (Taylor et al. 2009). From a cardiovascular
perspective, a high TSKIN that occurs independently of an elevated TCORE, does not result in the
typical reduction in left ventricular end diastolic volume and in turn stroke volume (Lee et al.
2015) and therefore VO2max (Arngrimsson et al. 2004). Therefore, Flouris and Schlader (2015)
recently proposed that when only TSKIN is elevated, reductions in self-selected exercise intensity
may be mediated by alterations to thermal perception and perceived exertion. However, when

61
both elevated TCORE and TSKIN present, cardiovascular factors likely determine voluntary
reductions in exercise work rate.
In order to model these apparently interrelated and progressive perturbations during
exercise in the heat, Nybo et al. (2014) recently proposed a model of endurance performance
under hyperthermia (Figure 14). This model suggests fatigue to be multifactorial, highlighting
specific roles for cardiovascular, metabolic, neurological, respiratory, psychological and sensory
alterations.
Figure 14: Integrative model proposed by Nybo et al. (2014) with the potential cardiovascular,
respiratory, central nervous system and peripheral factors that may influence fatigue during
prolonged exercise in the heat. Central nervous system alterations arise from changes in
perceptual and psychological factors. Elevated tissue temperature or impaired oxygen delivery
may directly result in peripheral muscular fatigue, depending on exercise intensity. The
associated afferent feedback from elevated TSKIN and cardiovascular strain also influences the
central nervous system response. Event characteristics including absolute metabolic heat
production, duration, environmental conditions and training status will determine the relative
influence of each factor in a given situation.

62
The model states hyperthermia-induced changes may influence muscle function and
therefore exercise performance if CO becomes inadequate to support muscle blood flow and
oxygen delivery declines, such as at VO2max. However, at submaximal intensities, muscle blood
flow and VO2 are maintained, regardless of cardiovascular strain and/or high skin temperature.
As hyperthermia progresses, a combination of central and peripheral fatigue presents, with
central fatigue apparently related to the dopaminergic system. Conversely, afferent feedback
from core, muscle and skin temperatures, increased ventilation rate, cardiovascular strain and
metabolic alterations within the muscle appear to determine peripheral feedback and in turn
exercise intensity. However, the authors stress the model is situation specific, representing a
theoretical integration of factors, with the precise role of each factor depending on the degree
of hyperthermia and the exercise intensity (Nybo et al. 2014).
2.4.3 Determinants of fatigue in endurance running
The model of Nybo et al. (2014) demonstrates the interrelation of different physiological
impairments under heat stress, but does not make these relationships directional as the
specifics of an exercise bout may alter the importance of specific factors. For example,
cardiovascular strain and the subsequent impairment in VO2max, may be greater in endurance
running, compared with cycling, due to the greater MHP and reduced convective cooling arising
from a lower maintained velocity during running (Chan et al. 2008, Millet et al. 2009). Recent
evidence indicates VO2max to be a primary regulator of exercise intensity in the heat (Periard &
Racinais 2015), therefore mediating the decline in VO2max in the heat would appear to be a
priority for an endurance runner. However concomitantly, an elevated TSKIN influences both
cardiovascular and perceived thermal and exertional strain (Schlader, Simmons et al. 2011a).
Therefore, the importance of TSKIN as a regulator of exercise intensity in the heat is being
realised (Schlader, Simmons et al. 2011a). However, independently elevating TSKIN does not
impair VO2max (Arngrimsson et al. 2004), therefore TSKIN alone would not appear to be a primary
determinant of fatigue during endurance running in the heat. Rather, when an elevated TSKIN
presents alongside an elevated TCORE, then the TSKIN appears to determine the magnitude of
VO2max reduction (Arngrimsson et al. 2004) due to the increasing skin blood flow demands for
heat dissipation (Cuddy et al. 2015; Cheuvront et al. 2010). Therefore, it would appear
important to maintain the core:skin gradient, which otherwise narrows as TCORE and TSKIN
increase (Cheuvront et al. 2010). This trend may be exacerbated by skin blood flow reaching
maximal levels at an approximate TCORE of 38°C (Gonzalez-Alonso et al. 2008), impairing heat
dissipation at the skin. As the core:skin gradient narrows, increased skin blood flow reduces
stroke volume and in turn impairs VO2max (Périard et al. 2011; Lee et al. 2015). Therefore, an

63
individual with a lower RE would appear to benefit from a reduced MHP and therefore better
maintaining the core:skin gradient.
From a perceptual perspective, elevated TSKIN influences thermal sensation, thermal
comfort and ultimately RPE, all of which are associated with the voluntary reduction of exercise
intensity in the heat (Flouris & Schlader 2015). Indeed, the interrelation of TSKIN, VO2max and RPE
has previously been highlighted by Schlader, Simmons et al. (2011b), reinforcing the potential
for fatigue during endurance running to be determined by a combination of these variables,
and ultimately multifactorial in nature (Nybo et al. 2014). Consequently, the role of the LTP,
another determinant of endurance performance in cool conditions, may also be significant, as
this marker represents changes in metabolism and fuel utilisation under heat stress, that result
in both increased glycogenolysis (Febbraio et al. 1994) and metabolic acidosis (Jones & Carter
2000). However, the combined model of VO2max, LTP and RE has yet to be assessed during
endurance running in the heat.
Having considered underpinning mechanisms of endurance running performance, both in
and out of the heat, this literature review will now focus on interventions that can be used to
enhanced performance in the heat. For the applied physiologist, models such as that of Nybo et
al. (2014) highlight not only the multitude of mechanisms through which performance in the
heat is impaired, but equally, potential avenues that interventions may target to ameliorate
decrement to endurance performance. The available evidence indicates interventions should
prioritise alleviation of VO2max and perceptual strain, whilst maintaining the core:skin gradient.
Accordingly, exercise tests for endurance performance in the heat should encapsulate as many
of the physiological responses as possible, in order to understand and subsequently improve
how interventions can be used. This will begin with the traditional, chronic approach that
facilitates heat adaptation.
2.5 Chronic strategies for exercise in the heat
In preparation for sporting competitions that occur under heat stress, such as the summer
Olympic Games, and to mitigate against the thermal challenges previously detailed, coaches
and sport scientists may have to balance opposing conditioning goals. Specifically, a training
taper phase would appear in direct conflict with the need to undertake repeated bouts of
exercise in a hot environment to provide habituation to the competitive environment. Such
habituation may occur through heat acclimatisation, within a naturally hot environment during
the weeks prior to competition. Alternatively, athletes may complete repeated bouts of
exercise under artificial heat stress, termed heat acclimation (HA). Heat acclimation is

64
habitually classified as either short term (STHA, <7 days), medium term (MTHA, 8-14 days) or
long term (LTHA, >15 days) (Garrett et al. 2011). Acclimation typically involves a total daily heat
exposure of about 2 hours, accompanied by exercise (Chalmers et al. 2014; Racinais et al.
2015a; Périard et al. 2015). Such long term, chronic interventions, have traditionally been the
preparation undertaken by those who will compete in the heat.
Heat acclimation affords a potentially more convenient alternative for those who do not
reside in a hot and humid environment to remotely, and artificially, promote thermoregulatory
adaptations (Armstrong & Maresh 1991). Therefore, the opportunity to undertake HA, rather
than acclimatization, may reduce the logistical and financial burden of arriving in a hot
environment in the weeks prior to competing. Notwithstanding, HA remains a chronic
intervention that necessitates a lot of an athlete’s time, which alludes to why STHA appears the
most widely adopted approach within sport (Périard et al. 2015).
Thus, the need for a time-efficient HA protocol that complements a taper phase is
apparent, which may be reflected by the recent prominence of alternative acute thermal
interventions such as precooling. This need has also focussed attention towards remodelling
the traditional chronic HA approach, with HA through relatively higher intensity exercise of
shorter duration gaining prominence, rather than long duration, low intensity exercise
(Houmard et al. 1990; Sunderland et al. 2008), whereby HA may in fact complement, rather
than compromise a taper. This section will first introduce the physiological adaptations
conferred by heat acclimation strategies and the associated effects on endurance performance,
before examining the different models of heat acclimation training.
2.5.1 Physiological adaptations to heat acclimation
The heat acclimated phenotype arises from adaptation across multiple systems. Before
exploring the individual adaptations and exploring the underpinning mechanism(s), an
overview of the physiological adaptations and functional consequences arising from heat
acclimation is provided below in Table 6.

65
Table 6: Physiological adaptations and functional consequences associated with the heat
acclimation phenotype that lead to improved thermal comfort and submaximal aerobic
performance, and increased maximal aerobic capacity (Périard et al. 2015).
2.5.1.1 Thermoregulation
Heat acclimation is characterised by a myriad of physiological adaptations, many of which
independently contribute towards improved thermoregulation, with a predominant central
thermoregulatory adaptation concerning a decreased resting and exercise TCORE (Armstrong &
Maresh 1991). The reduction is typically between 0.3-0.5°C, depending upon the method and
duration of acclimation (Buono et al. 1998), as well as time of day that acclimation occurs
(Shido et al. 1999). This alteration would appear to follow a reduction of the POAH set point,
and possibly improved heat dissipation efficiency (Armstrong 1998). The work of Kampmann et
al. (2008) alludes to the importance of the exercise stimulus during HA training to elicit this
adaptation, having demonstrated a small reduction in TCORE (~0.2°C) following matched
intensity normothermic training. A reduced TCORE affords individuals an enlarged heat storage
capacity before heat strain becomes significant and heat illness may present (Casa et al. 2015).
Therefore, the potential for a cooler body following HA may help to maintain VO2max, as
demonstrated by the maintenance of skeletal muscle blood flow and VO2max in normothermic
conditions, compared with hot conditions (Périard et al. 2011).
2.5.1.2 Cardiovascular
A primary adaptation of HA is increased cardiovascular stability, characterised by a
reduction in resting and exercising heart rate (Rowell et al. 1967), and hypervolaemia (Sawka et
al. 2000). Collectively, these adaptations may partially, or completely at lower exercise
intensities, attenuate the elevated heart rate observed during submaximal endurance exercise
in the heat. Hypervolaemia is manifested through an increased plasma volume (PV), without an

66
increase in cell mass, which is usually (Shapiro et al. 1981; Sawka et al. 2000; Corbett et al.
2014) but not always (Dill et al. 1966; Young et al. 1993; Neal et al. 2015), present following
heat acclimation. An enhanced central blood volume serves to increase venous return, thus
maintaining stroke volume and cardiac output through an increased cardiovascular reserve
(Fortney et al. 1981). A large reduction in resting and exercising heart rate is observed within 5
days, with no further reduction evident beyond 7 days (Pandolf 1998), which is in keeping with
the time-course of plasma volume expansion during heat acclimation (Armstrong & Maresh
1991). As such, it has been suggested that a 1% increase in plasma volume elicits a 1%
reduction in exercising heart rate (Convertino 1983) and that exercising heart rate is
‘moderately-to-largely’ related to plasma volume expansion following heat acclimation
(Buchheit et al. 2011). Accordingly, following a 10 day MTHA programme which resulted in a
6.5% increase in PV, Lorenzo et al. (2010) details a 15 b.min-1 reduction in exercising heart rate
on day 10 of training in the heat, alongside increased maximal cardiac output and stroke
volume in the cool, but not in the heat as shown in Figure 15. The reported increase in PV
appears typical following HA, and is in agreement with other literature (Nielsen et al. 1993;
Patterson et al. 2004a). However, it should be noted that some of the reduction in exercising
heart rate on day 10 may be attributable to a reduced relative exercise intensity arising from
the prescription of exercise based on a percentage of VO2max, given that VO2max was increased
by 8% following HA.

67
Figure 15: Effect of heat acclimation on maximal cardiac output (A), stroke volume (B), and
heart rate (C) during a VO2max test in cool (13°C) and hot (38°C) environments. Data are means ±
standard error for both heat acclimation (n = 12) and temperate training control (n = 8).*
denotes significant (p<0.05) difference versus pre-acclimation within the same environmental
condition (Lorenzo et al. 2010).
Plasma volume expansion is thought to be primarily mediated through the release of
plasma aldosterone (Garrett et al. 2014). Aldosterone is produced by the adrenal cortex to
facilitate reabsorption of sodium ions in the kidneys and sweat glands, thereby controlling
extracellular fluid volume and blood volume. The release of aldosterone is mediated by plasma

68
potassium (K+) concentration, activity of the renin-angiotensin system, as well as plasma Na+
concentration (Garrett et al. 2011). In addition to aldosterone, Patterson et al. (2004b)
suggested a contributing role for the movement of total plasma protein to the interstitial fluid
in the vascular space, either independently or through interacting with aldosterone. Increased
plasma protein serves to exert colloidal pressure within the plasma, thereby drawing water into
the circulatory system (Patterson et al. 2004b). Garrett et al. (2014) highlighted a significant
role for aldosterone, in response to HA training using a controlled hyperthermia model and
permissive dehydration, to the magnitude of 1.8% of body mass. The authors suggest
permissive dehydration presents an additional, independent stressor, supported by the
heightened response of the fluid and stress-regulatory hormones such as aldosterone, arginine
vasopressin and cortisol (Sawka et al. 1987). Therefore, the type of HA training and dehydration
level may determine a heightened plasma volume and cardiovascular adaption (Garrett et al.
2014; Racinais et al. 2015b; Mee et al. 2015b) and ab-libitum drinking during HA may help
explain the failure of some HA protocols to elicit PV expansion. Although it should be
acknowledged that support for plasma volume expansion following permissive dehydration
controlled hyperthermia is not unanimous (Neal et al. 2015).
From a thermoregulatory perspective, an increased PV would also permit a greater volume
of blood for cutaneous circulation, facilitating enhanced heat dissipation via radiation and
convection. However, studies that have artificially and acutely enhanced PV have not observed
conclusive differences in thermoregulatory variables such as TCORE, TSKIN and sweat response
(Sawka et al. 1983; Fortney et al. 1981). Thus, whether increased PV directly improves
thermoregulatory function remains equivocal (Sawka et al. 2000).
Acute plasma volume expansion has been highlighted as a likely mechanism leading to
improved endurance exercise performance in temperate (Corbett et al. 2014) and hot (Sims et
al. 2007) conditions. Hypervolaemia may proffer the greatest benefit at maximal exercise
intensities in the heat, where failure to sustain cardiac output and mean arterial pressure is
most pronounced (González-Alonso & Calbet 2003). As such, Lorenzo et al. (2010) reported
improved VO2max in hot and cool conditions, as well as time trial performance in hot and cool
conditions, following PV expansion of 6.5%. Similarly, Coyle et al. (1990) has demonstrated an
enhanced VO2max in normothermic conditions following acute PV expansion via infusion of a
dextran solution 24 hours prior to exercise. However, the improvements in the study of
Lorenzo and colleagues (2010) followed a HA programme, so improvements cannot be solely
attributed to PV expansion, as other centrally mediated aerobic adaptations, such as improved
contractile efficiency of the heart (Sawka et al. 2000; Horowitz 2002) and reduced sympathetic

69
nervous activity (Berlyne et al. 1974; Hodge et al. 2013) will likely have contributed. Indeed,
Horowitz (2002) highlights the importance of an improved excitation contraction coupling
cascade following HA which facilitates an improved ejection fraction and, in turn, stroke
volume. Such changes may occur through myocardial adaptation, whereby increased
compliance and distribution of myosin isoenzymes reduce the myocardial energy cost
(Horowitz et al. 1986). In summary, cardiovascular adaptions from HA are significant and wide-
ranging, with these changes likely underpinning improved exercise performance.
2.5.1.3 Skin blood flow
Skin blood flow appears to be increased whilst exercising at a given TCORE following HA,
likely mediated through an enhanced blood plasma volume (Nadel et al. 1974; Roberts et al.
1977; Lorenzo & Minson 2010), as shown below in Figure 16. Roberts & Wenger (1979)
suggested HA may also lower the TCORE threshold for cutaneous vasodilation, which is typically
elevated during exercise compared with rest (Kenney & Johnson 1992). This has the effect of
presenting a lowered TSKIN whilst exercising in both hot and normothermic conditions (Nielsen
et al. 1993; Buono et al. 2009; Lorenzo & Minson, 2010).
Figure 16: Effect of 10 days fixed intensity HA versus normothermic control training on
cutaneous vascular conductance (CVC) in response to 1 , 10 and 100 mMol.L-1 acetylcholine
infusion. * denotes a significant difference between acclimation and control group (p<0.05)
(Lorenzo & Minson 2010).
70
Whilst these adaptations could be suggestive of central alterations in the POAH, equally
peripheral vascular adaptations may be responsible for improved vasodilatory efficiency,
possibly through an increase in the number of muscarinic receptors, or the responsiveness and
sensitivity to localised acetylcholine (Lorenzo & Minson, 2010). Interestingly, maximal forearm
skin blood flow does not appear to change following a period of heat acclimation, indicating the
observed changes are attributable to improvement in cutaneous vascular function and not to
structural changes that limit maximal vasodilator capacity (Lorenzo & Minson, 2010). Peripheral
vasodilatory adaptations likely contribute towards the reduced cardiovascular strain during
exercise following HA by enhancing the potential for radiative and convective heat loss, and
alongside sudomotor alterations, more effectively maintaining the core-to-skin gradient. In
turn, such adaptations aid heat dissipation and contribute towards an alleviation of heat strain,
minimising the competition for cardiac output whilst exercising in the heat.
2.5.1.4 Skeletal muscle metabolism
Heat acclimation would appear to ameliorate many of the alterations in muscle metabolism
observed under heat stress. Notably, HA reduces the enhanced submaximal circulating lactate
concentration and reliance on carbohydrate metabolism, relative to cooler conditions
(Febbraio et al. 1994; Young et al. 1985). These alterations likely occur as a consequence of a
reducing resting and exercising body temperature, but there may be other contributing
mechanisms (Febbraio 2001). For example, a reduced body temperature would promote a
reduction in plasma adrenaline, thereby reducing glycogenolysis following HA (Febbraio et al.
1994). Indeed, there may even be a reduction in the overall aerobic metabolic rate following
HA (Sawka et al. 1983; Young et al. 1985), as has been reported in hot climates during warmer
months (Hori 1995). A greater contribution to energy supply from lipolysis is supported by
reductions in lactate accumulation, the respiratory exchange ratio, blood glucose concentration
and glycogen depletion at given exercise intensities following STHA (Sunderland et al. 2008;
Febbraio et al. 2004). The changes in lactate from HA appear to be most pronounced during
submaximal exercise, with lactate removal kinetics unchanged across the 60 min following
maximal exercise (DiLeo et al. 2014). Finally, a contributing factor may also be an increased
blood plasma volume, by mediating against the compromised visceral vasoconstriction in the
heat, thus maintaining lactate conversion in the liver (Rowell et al. 1968).
2.5.1.5 Sudomotor function
Adaptations to sudomotor function appear to require a greater thermal stimulus than
cardiovascular adaptations, typically requiring between seven and ten days of HA (Patterson et

71
al. 2004b). Sudomotor adaptations are characterised by an enhanced sweat rate and sensitivity
at a given TCORE (Sato et al. 1990; Roberts et al. 1977a; Yamazaki & Hamasaki 2003; Mee et al.
2015b; Gibson et al. 2015a), but likely not an increased maximum sweat rate (Lorenzo and
Minson, 2010). Furthermore, there is likely not a redistribution of sweat secretion towards the
limbs (Patterson et al. 2004b), despite early evidence arguing for such an alteration (Hofler
1968). Complete adaptation is thought to occur after 7-10 days of heat exposure (Patterson
2004), but 75% of adaptations are evidenced from 4-6 days (Pandolf 1998). The findings of
Patterson et al. (2004b) suggest sudomotor adaptation may be accelerated during controlled
hyperthermia acclimation training, with respect to the traditional timescale of 10-14 days
(Pandolf 1998). A principle objective of HA protocols must apparently include maintaining an
elevated TSKIN, as sudomotor function adaptation appears insensitive to heat strain without
elevated TSKIN (Chen & Elizondo 1974). Augmented sudomotor function lowers TSKIN through
evaporative heat loss, potentially reducing cardiovascular strain arising from peripheral
vasodilation and appears to make an important contribution towards an improved thermal
sensation (Schlader, Simmons, et al. 2011b). Despite the unanimity of evidence supporting an
enhanced sweat loss following HA, recently Poirer et al. (2014) reported an improvement in
evaporative heat loss of 11% can be achieved following 14 days of heat acclimation (90 min
cycling at 50% VO2peak in 40°C and 20% RH.
The enhanced sweat rate is likely attributable to sweat gland hypertrophy (Sato & Sato
1983; Chen & Elizondo 1974), whilst an earlier internal temperature threshold or set point,
represents increased cholinergic sensitivity of the eccrine sweat gland (Nadel et al. 1974;
Lorenzo & Minson 2010). The exogenous administration of acetylcholine after HA supports this
assertion (Collins et al. 1965; Lorenzo & Minson 2010). The combination of a lowered sweat
onset and reduced resting TCORE represents an improved centrally mediated response to heat
stress (Nadel et al. 1974; Roberts & Wenger 1979). As well as improvements concerning the
volume and onset of sweating, it is suggested that the composition of sweat may be altered
following HA to protect against the loss of electrolytes (Garrett et al. 2014). Specifically, when
fluid homeostasis is stressed during HA sessions, increased fluid-electrolyte retention may be
facilitated by PV expansion, which is in turn attributable to increased aldosterone and arginine
vasopressin and a cardiovascular response to heat stress (Garrett et al. 2014). Such changes are
seen through reduced sweat sodium (Kirby & Convertino 1986) and mineral (Chinevre et al.
2008) concentrations following HA. Despite the apparent benefits of an enhanced sweat rate, it
should be noted that sudomotor adaptations may also lead to an earlier onset of dehydration
and associated cardiovascular consequences (Gonzalez-Alonso et al. 1998). Thus, the event
72
length and hydration strategies should be considered when planning a HA protocol and thermal
adaptations for a specific event.
2.5.1.6 Cytoprotection
Adaptation to HA is also apparent at a cellular level, with cytoprotection necessary to
mitigate against the cellular abnormalities associated with severe heat stress. These
abnormalities include protein denaturation, translational inhibition, ribosomal biogenesis
attenuation, and cytoskeletal damage (Mizzen & Welch 1988), which collectively can be
mediated through acquired thermal tolerance (Horowitz 2014). An increased extracellular
concentration of stress response proteins, most notably heat shock proteins (HSP), is observed
during a heat exposure (Gibson et al. 2014) and may be maintained through repeated
subsequent exposures (Sandström et al. 2008). This response is not unique to heat stress, with
elevations in HSP also observed following stresses that include hypoxia, substrate depletion
and dehydration (Gething & Sambrook 1992). Thus any protection afforded through repeated
heat exposures may also have efficacy across a variety of environmental situations (Kim et al.
2004; Gibson et al. 2015b). Specifically, HSPs function as molecular chaperones assisting with
protein folding and refolding after denaturation and therefore assist in maintaining protein
homeostasis (Kresfelder et al. 2006; Schmitt et al. 2007).
The most inducible HSP is the 70 kDa family (HSPA1A), categorised based on the molecular
weight of the proteins (Moseley 1997). HSP70 is a stress protein family whose inducible form
(HSP72), rather than the extracellular expression, promotes thermal tolerance by performing a
chaperone function (Horowitz 2002). Consequently, basal HSP concentration has been
proposed as a marker of HA status (Kim et al. 2004), with Kresfelder et al. (2006) having
reported a positive relationship between HA criteria and levels of serum HSP70. Despite
increased in vitro HSP70 expression being associated with elevated internal temperatures, the
HSP70 response may in fact be independent of TCORE (Skidmore et al. 1995) and may better
reflect metabolic stress such as glycogen depletion (Febbraio et al. 2002) or hypohydration
(Kim et al. 2004). However, whilst both heat exposure and high intensity exercise elicit a HSP
response, the combined metabolic and thermal stress elicits a greater HSP response than either
stressor independently (Skidmore et al. 1995). It would appear that a stimulus whereby TCORE is
>38.5°C is required (Morton et al. 2009; Gibson et al. 2014) and that adaptation is not sensitive
to the type of HA protocol (Gibson et al. 2015a), so long as sufficient endogenous strain is
achieved. Sandström et al. (2008) has reported an initial increase in HSP70 levels during
exercise under heat stress, reflecting enhanced thermotolerance, as well as upregulation of

73
HSP70 above basal levels following 15 days of HA. The greatest elevation in HSP levels occurred
after 5 days, with the greatest response during exercise after 15 days. This is supported by the
findings of McClung et al. (2008) who analysed baseline and ex vivo heat-induced expression of
HSP72 and HSP90 in peripheral blood mononuclear cells (PBMCs) on day 1 and 10 of a HA
protocol. Alongside classical physiological responses to HA, baseline levels of HSP72 and HSP90
increased by 17.7 ± 6.1% and 21.1 ± 6.5%, respectively. Furthermore, the ex vivo heat
inducibility of HSP72 was blunted after HA, and individuals demonstrating the adaptations to
HA exhibited the greatest blunting of ex vivo HSP induction during heat stress. These data
demonstrated that physiological adaptations in humans undergoing HA may be accompanied
by both increases in baseline levels and changes in the regulation of cytoprotection. In addition
to having a role for cellular thermotolerance, there is evidence to suggest a shared mechanism
between the adaptation of cellular thermotolerance and traditional markers of heat
acclimation in humans. Through the inhibition of HSP72 via quercetin supplementation,
Kuennen and colleagues (2011) highlighted impaired cellular and traditional systemic heat
adaptations. Thus, it is apparent the ability of humans to adapt and develop thermotolerance is
multifactorial, of which the heat shock response is an important, acute and transient
component.
2.5.2 Endurance performance following heat acclimation
The combined effect of the previously detailed physiological adaptations that enhance heat
dissipation is succinctly illustrated by the theoretical model from Taylor and Cotter (2006) of
body temperature across a range of endurance distance events, pre and post HA, as shown in
Figure 17.
The predictive model of Taylor and Cotter (2006) demonstrates how an acclimated athlete
may display a smaller increase in body temperature than when non-acclimated, which will
delay, or possibly prevent reaching a TCORE that has been associated with fatigue and exercise
cessation (Cheung 2007), in events of 5 km and above. Notably, the reduced BHS likely reflects
acclimation-induced changes in sweating, skin blood flow and skin temperatures (Taylor &
Cotter, 2006). Consensus across experimental studies supports this model, with a recent review
by Guy et al. (2014) identifying beneficial effects of heat acclimation on endurance
performance using both STHA (2.4 ± 3.5 %) and MTHA protocols (10.2 ± 14.0 %).

74
Figure 17: Predicted changes in mean body temperature for heat-acclimated and non-
acclimated athletes at world record pace over distances from 100 m to marathon, in ambient
and hot environments (Taylor & Cotter 2006).
Racinais et al. (2015b) recently demonstrated considerable changes in 43 km field-based
cycling time trials (∼37 °C) following heat acclimatisation. Although starting exercise intensity
was similar in the heat, to a cold, control condition (∼8 °C), from ~9 km a progressive and
marked decrease in power output was observed in the heat, which was partly recovered after 1
week of heat acclimatisation and almost fully restored after 2 weeks. The authors attributed
the initial reduction in performance in the heat, and subsequent improvement, to the
maintenance of a relative exercise intensity, reflecting the impairment to VO2max in the heat
(Nybo et al. 2014), which may be partially mediated by an enhanced VO2max following HA
(Lorenzo et al. 2010). It has been reported however, that HA may not entirely abate the decline
in VO2max in the heat, with Sawka et al. (1985) reporting a 3.5% increase in VO2max in the heat,
compared with the initial ∼8% reduction. Similarly, Lorenzo et al. (2010) reported an 8%
improvement in VO2max following LTHA, compared with an initial ~20% reduction. Interestingly,
an 8% improvement in 1 hour cycling time trial performance was also observed, in accordance
with relative exercise intensity determining endurance performance (Périard et al. 2011;
Périard, 2013). It should also be noted however, that the improvements reported by Lorenzo et
al. (2010) occurred alongside increases in LT, PV expansion, lower skin temperatures, and a
larger core-to-skin gradient, each of which have the potential to contribute to performance in
the heat (Nybo et al. 2014). The authors attributed changes in VO2max to the enhanced PV,
maintaining cardiac output for longer in the heat. Similarly, the increased LT was attributed to

75
reduced splanchnic vasoconstriction arising from a reduced heat strain, and muscle metabolism
adaptation. The observed changes from Lorenzo et al. (2010) for VO2max, LTP, maximal cardiac
output and time trial performance are shown below in Figure 18.
Figure 18: Percentage change for cardiorespiratory variables (Qcmax = maximal cardiac output)
and time trial performance in hot and cool conditions, following HA. *p < 0.05 vs. pre
acclimation within the same environmental condition (Lorenzo et al. 2010).
While changes in LT arising from heat acclimation appear supported elsewhere in the
literature (Chalmers et al. 2014; Neal et al. 2015), any changes in RE are less clear. Saunders et
al. (2004a) highlighted the potential for acclimation to improve RE, as a consequence of PV
expansion and reduced cardiovascular strain, however this question does not appear to have
been directly addressed within the literature. In conclusion, chronic heat
acclimation/acclimatization strategies appear to have great efficacy for improving endurance
performance in hot environments. However, specific questions remain, with a relative dearth
of research pertaining to running time trials, and a wide variety of HA protocols adopted. Given
the variation in length of HA training programme, as well as the ability to adopt different
models, as discussed in the following section, it is unclear to what extent the determinants of
endurance performance and time trial performance can be enhanced in trained runners.

76
2.5.3 Models of heat acclimation
The overall training stimulus during HA is determined by the environmental heat stress,
length and regularity of exposure and exercise intensity (Garrett et al. 2011). Accordingly, HA
models may manipulate different components of this stimulus to meet specific physical
conditioning goals for different sports. As well as distinctions between short, medium and long-
term acclimation, further distinctions between programmes can be made based on exercise
prescription. Garrett et al. (2011) classifies HA protocols as self-regulated exercise, constant
work or controlled hyperthermia, also known as isothermic. Self-regulated protocols involve
participants self-selecting exercise intensity based on thermal comfort and aerobic conditioning
(Garrett et al. 2011). However, lack of experimenter control over exercise intensity leads to
large variations in MHP, which may preclude the use of such protocols for answering research
questions where training intensity must be closely controlled and matched between individuals
(Taylor 2014).
2.5.3.1 Constant work
Constant work protocols, involving a consistent exercise intensity that is often fixed at a
percentage of VO2max, are considered the ‘traditional’ HA approach and as a result, considerable
evidence documents the response to such protocols (Garrett et al. 2011; Taylor 2014). From
this evidence, it would appear the optimal protocol involves 60-100 minutes of exercise per
day, at intensities greater than 40% VO2max for 10 - 14 days, completed under heat stress that
exceeds the environment being prepared for (Sawka et al. 2011; Taylor 2014). Constant work
protocols benefit from being simple to administer as they typically adopt a fixed intensity for
the duration of the training session. However, they do not provide a homogenous thermal
strain across participants because of differences in MHP at individual’s relative proportion of
VO2max, and thus do not always elicit the same adaptive response across individuals (Jay et al.
2011). Further, when exercise intensity is determined from pre acclimation testing, and heat
stress is consistent throughout the protocol, the relative heat strain diminishes as adaptation
occurs, such that it may become sub-optimal for adaptation (Taylor & Cotter 2006; Taylor
2014). During LTHA the reduction in relative strain has the potential to lead to the decay of
cardiovascular adaptations before the end of the protocol (Patterson et al. 2004a). Thus,
constant work protocols appear inefficient and require progression in exercise intensity or heat
stress to maintain the thermal strain throughout the duration of the programme and maximise
the potential for adaptation (Taylor 2014). Consequently, progressive protocols have been
developed to incrementally increase heat stress across the training period (Daanen et al. 2011;
Costa et al. 2014). This approach was successfully used by Costa et al. (2014) in preparation for

77
a 6-day ultra-marathon. Following three, 2-hour treadmill running sessions (60% VO2max) in
30°C, participants completed three sessions in 35°C and observed meaningful improvements in
exercising TCORE (~-0.2°C), heart rate (~-7 b.min-1) and thermal comfort during subsequent heat
stress tests. However, comparing these improvements to existing literature is difficult as this
study did not include a control group who completed traditional fixed HA.
2.5.3.2 Controlled hyperthermia
An alternative approach targets the maintenance of a consistently high TCORE throughout
the HA programme, such that the relative strain becomes progressively harder with
adaptations eliciting a reduced resting TCORE and improved heat dissipation capability (Patterson
et al. 2004a; Garrett et al. 2014). The controlled hyperthermia, or isothermic, model (ISO) is
underpinned by the principle that a sustained high TCORE for approximately 60 min is a primary
effector to adaption. This follows the seminal work of Fox et al. (1963) who investigated the
response to controlled increases in body temperature in 18 men across 12 days, and reported
reductions in oral temperature and increased sweat rate during subsequent heat stress tests.
Maintaining an elevated TCORE may offer a more complete adaptation, as well as being more
time efficient than the traditional approach (Gisolfi & Cohen 1978; Taylor 2000). A comparison
of the TCORE response to ISO and fixed-intensity HA models are shown below in Figure 19.
Figure 19: Core temperature changes on days 1, 4, 8 and 12 of two, 12-day heat acclimation
regimens using either the fixed intensity (A– Steady-state work rate and thermal load) or
isothermic (B - controlled hyperthermia methods). Insets show integrated core temperature for
each day. A diminished thermal strain is evident across day 1-12 in the fixed intensity group
(Taylor & Cotter 2006).

78
During ISO, exercise can be used discontinuously, to generate MHP to quickly and raise
TCORE, and then to maintain TCORE at the desired level. Therefore, ISO often permits higher
intensity work than in fixed intensity HA, which may not only result in a more representative
and sport-specific exercise profile, but may also complement a traditional competition taper
phase characterised by higher intensity and reduced exercise volume (Spilsbury et al. 2015).
Sunderland et al. (2008) has advocated higher intensity exercise during acclimation, suggesting
adaptive mechanisms may be enhanced when a greater level of stress is experienced, resulting
in faster acclimation. This followed the work of Houmard et al. (2000), who applied short
duration, high intensity exercise (75% VO2peak daily, 30–35 min per day), and observed identical
adaptation to a longer duration, lower intensity method (50% VO2peak daily, 60 min per day).
Subsequently, Garrett et al. (2009) has demonstrated the effectiveness of ISO in a short-term
heat acclimation programme, requiring participants to exercise and ensure TCORE was
consistently above 38.5°C during each 90 min session for five consecutive days. After five days,
reductions in TCORE and heart rate were observed at the end of exercise, although not at rest.
The lack of a reduction in resting TCORE was not thought to be a limitation of the protocol, but
rather an artefact of the time of day acclimation took place, as time of day of habitual heat
exposures appears to determine resting TCORE response (Shido et al. 1999). Garrett et al. (2009)
also reported improved exercise capacity, a reduction in thermal and cardiovascular strain, and
cellular thermo-protection through elevated resting plasma HSP72 concentration.
An internal temperature of 38.5°C would appear to represent a minimum endogenous
threshold in order to induce cellular adaptation to thermal stress (Gibson et al. 2014).
Furthermore, Patterson et al. (2004a) adopted an ISO model across 7 days of training, involving
90 min daily bouts, with much of the physiological and performance benefits conferred during
this period, as after 21 days of traditional acclimation. In a direct comparison of ISO and fixed
intensity methods across 10 days of HA, Gibson et al. (2015a) did not observe differences in
physiological adaptation between methods, with all inducing HA, however this was achieved
with a reduced total work (-9%) during ISO and higher mean exercise intensity (1.6 W.kg-1 fixed
vs 2.0 W.kg-1 ISO). Therefore, despite the theoretical benefits of maintaining the potentiating
stimuli of elevated TCORE throughout a HA programme, recent evidence suggests the benefits of
ISO may be most apparent in terms of maintaining sport-specific training intensity and
efficiency of time, through a reduced training volume, rather than providing a greater
physiological adaptation per se (Patterson et al. 2004a; Gibson et al. 2015a).

79
2.5.4 Induction and decay of heat acclimation
Awareness of the time-course for HA adaptation induction and decay is paramount not
only for those looking to apply HA strategies with athletes, but also to ensure the valid
assessment of exercise performance and capacity following a HA intervention. Complete
physiological adaptation typically occurs after ~7–10 days (Pandolf 1998; Shapiro et al. 1998;
Garrett et al. 2009). However, there is a rapid initial induction (75%) after ~4–6 days,
characterised by heart rate and plasma volume changes (Armstrong & Maresh 1991). The
reduction of TCORE likely follows after ~7 days (Weller et al. 2007), with the adjustments in sweat
response and composition adapting last (Cotter et al. 1997). An overview of this process is
provided below in Figure 20. Commensurate with this timescale, larger effects of endurance
performance have been reported following MTHA, compared with STHA, notably including
larger reductions in endpoint exercising heart rate (STHA: -3.5 ± 1.8 % vs MTHA: -7.0 ± 1.9 %)
and endpoint TCORE (STHA: -0.7 ± 0.7 % vs -0.8 ± 0.3 %) (Guy et al. 2015).
Figure 20: Simplification of the induction of heat acclimation adaptation. NB. The magnitude
and maintenance of these adaptations is dependent on the initial acclimation status,
environmental conditions (i.e., dry or humid), exercise intensity, and acclimation model
(Périard et al. 2015).
Cardiovascular stability appears to be compromised within days of ceasing HA (Horowitz
2014) and the HA phenotype is no longer observed after 3 weeks (Pandolf 1998). Therefore,
whilst the induction of cardiovascular adaptations occurs within days, they also appear to be
lost relatively quickly. This was demonstrated by Saat et al. (2005) who reported a greater
relative loss of heart rate adaptation compared with changes in TCORE, when assessed 4 days
80
after HA. These results are supported by Flouris et al. (2014) who observed changes in TCORE
persisting for at least 2 weeks, while changes in heart rate and heart rate variability were only
partially evident after 2 weeks. A prominent adaptation, plasma volume (PV) expansion,
appears to be lost very quickly and it has been proposed some LTHA strategies may
demonstrate reductions in PV within the HA programme in the absence of a stepwise increase,
or maintenance of intensity (Patterson et al. 2004a). Both Convertino et al. (1980) and Garrett
et al. (2009) reported a return to baseline levels of PV within 1 week of the cessation of
exertional heat exposures. Ultimately, this suggests changes that take longer to present, last
longer (Pandolf 1998; Garrett et al. 2011). Of particular relevance for competition preparation
is the notion for every two days spent not working in the heat, one day of adaptation is lost
(Givoni & Goldman 1972).
As the HA phenotype decays, Taylor (2000) suggests one heat exposure for every 5 days
away, may be sufficient to maintain adaptations. Consequently, Weller et al. (2007) has
reported the re-induction of HA adaptation after 2-4 days of training, 12 days following a LTHA
programme of controlled hyperthermia at 38.5°C. Therefore, in the month after LTHA,
relatively few heat exposures may be required for the re-induction of HA. An expedited re-
induction potential may be underpinned by a physiological acclimation memory at a cellular
level (Horowitz 2014), with specific gene clusters remaining in an active transcriptional state
throughout the entire decay and re-induction period (Tetievsky et al. 2008). In conclusion,
whilst HA affords improved thermo-tolerance through a myriad of adaptations, the state is
transient whereby induction and decay may occur within 3 weeks, necessitating re-exposure to
maintain benefits. Therefore, it would seem appropriate that experimental trials following a
STHA protocol should occur within 10 days and within 20 days following LTHA.
2.6 Acute strategies for exercise in the heat
2.6.1 Precooling
The time and expense associated with chronic heat acclimation strategies, as well as the
relatively fast rate of decay, has led to the development of simple and acute manoeuvres as
alternative preparation strategies for competitions in the heat (Booth et al. 1997). Meta
analyses and systematic reviews provide substantial evidence that both chronic strategies such
as heat acclimation (Garrett et al. 2011; Chalmers et al. 2014) and acute strategies such as
precooling (Jones et al. 2012; Tyler et al. 2013; Ross et al. 2013; Bongers et al 2015), provide
meaningful benefits to endurance exercise, although there currently does not appear to be a
direct comparison between techniques. Pre-cooling occurs in the hour prior to exercise

81
performance and may provide benefit to competitors for the following hours (Siegel & Laursen
2012) by increasing heat storage capacity (Wendt et al. 2007) and delaying, or preventing
individuals reaching core temperatures associated with fatigue and task cessation (González-
Alonso et al. 1999). Consequently, such techniques may increase heat storage reserve and
improve the perceived thermal strain, permitting greater power output in self-paced exercise
(Cotter et al. 2001; Duffield et al. 2010), or extending the time to exhaustion (TTE) at a set
intensity by as much as 25 minutes (González-Alonso et al. 1999), with a reported overall mean
improvement of 5.7 % (d = 0.44, Bongers et al. 2015).
The precooling literature is divergent, with reviews considering both precooling and cooling
during exercise, whilst differences in methodologies concerning time of cooling, inclusion of
appropriate warm-up and type of exercise test (i.e. open/closed loop, intensity, duration) can
confound systematic interpretation. Precooling studies can be further differentiated into
internal or external precooling, depending upon where the cooling impulse is delivered. Both
internal techniques (+6.3%, Cohen’s d=0.40, Bongers et al. 2015) and external techniques
(+7.3%, d =0.72 Bongers et al. 2015, d=1.91, Tyler et al. 2013) are supported for use prior to
endurance performance, with an overview of relevant experimental studies provided in Figure
21 below.

82
Figure 21: Modified from Bongers et al. (2015). Forest plot summarising the effects of different
cooling techniques on exercise performance for the precooling studies. The black rectangles
represent the respective weighted effect size, with grey lines representing the 95% CIs. Studies
that used multiple cooling intervention trials were included more than once, as denoted by *.
NB Quod et al. (2008) ‘mixed methods’ involved ice vest and cold water immersion, whereas all
other mixed methods studies involved multiple garments.
2.6.1.1 External precooling
The majority of precooling investigations have traditionally utilised external modalities
including ice packs applied to major muscle groups (Castle et al. 2006), ice jackets (Hunter et al.
2006; Price et al. 2009), or whole-body cold water immersion (Vaile et al. 2008). Cold water
immersion is considered the gold standard cooling method for the treatment of exertional
heatstroke (Casa et al. 2005), as shown in Figure 22. This reflects the rate at which it cools TCORE,
as a consequence of the high volume-specific heat capacity of water and skin surface area in
contact with the water, thereby affording a significantly enhanced the core-to-skin ratio.
Figure 22: Cooling rates associated with different external modalities with healthy
hyperthermic athletes and heatstroke casualties (Casa et al. 2005).
83
In contrast to the successful application as a treatment for heat illness, Stanley et al. (2010)
suggested the aggressive lowering of TSKIN, as proffered by cold water immersion, may provoke
concomitant vasoconstriction when individuals are not experiencing heatstroke. This has the
potential to reduce skeletal muscle blood flow, and in turn impair force generation capacity and
locomotion (Stanley et al. 2010) and likely reflects the apparent impairment to sprint
performance afforded by precooling (Tyler et al. 2013). Furthermore, the practical application
of this technique may be limited, as it would likely necessitate athletes to get wet and change
prior to competing. Finally, it should be noted opportunities for cold water immersion in the
field will vary, or may not exist. Reflecting these concerns, a meta-analysis concerning
precooling techniques for sports performance did not include the manoeuvre in their analysis,
citing impracticality (Wegmann et al. 2012).
Consequently, athletes and coaches have continued to seek out alternative, simple and
practical approaches to cooling the body before competition, often adopting individual cooling
garments. Despite initial perceived benefits and support from athletes (Martin et al. 1998), ice
jackets have fallen in popularity in favour of more aggressive cooling, with Jones et al. (2012)
stating there was moderate evidence to suggest ice jackets were an ineffective precooling
method. Tyler et al. (2010) pioneered the use of a neck cooling collar before and during
exercise in order to deliver a cooling impulse in close proximity to the hypothalamus. A 5.9%
improvement during a 15 min running time trial was observed, despite the absence of a
reduced TCORE or effect across a range of biomarkers including cortisol, prolactin, adrenaline,
noradrenaline or dopamine. Tyler et al. (2010) suggested neck cooling may improve thermal
sensation which in turn alters an anticipatory regulation response, permitting greater pace.
Although the cooling collar was worn during exercise, subsequent repeat applications provided
no further benefit, so there would appear efficacy in including neck cooling as a component of
a precooling intervention (Tyler & Sunderland 2011).
Duffield et al. (2009) suggested a lack of cooling volume may explain the limited
effectiveness of individual cooling garments on endurance performance and subsequently
combined garments to develop a mixed methods approach in order to deliver a greater cooling
impulse. The approach of Duffield et al. (2009) was intended to be practical, such that it could
be applied across a range of situations and whilst ensuring regions of large MHP, such as the
quadriceps, were targeted directly. Minett et al. (2012) and Duffield et al. (2009) combined four
cooling techniques; wet, iced towels (3°C) covering the head, neck and trapezius muscles,
forearm and hand immersion in cold water (9°C), an ice vest on the torso and plastic bags of ice
on the quadriceps. Interestingly, Duffield (2009) did not observe a reduction in TCORE before

84
beginning exercise, but demonstrated a blunted rise in TCORE during exercise compared with no
precooling, and greater total distance covered during 30 minutes of intermittent sprinting (3.35
± 0.20 vs. 3.11 ± 0.13 km). Therefore, it has been speculated that external cooling may not
always elicit a reduction in TCORE prior to exercise, but appears to permit a reduced rate of heat
storage during exercise, by enhancing heat dissipation through an increased core-to-skin
gradient (Kay et al. 2010). Furthermore, an ‘after-drop’ may occur following external cooling,
whereby TCORE falls following the onset of exercise as vasoconstriction dissipates and warm
blood is subsequently cooled in the periphery (Webb 1986). Direct cooling of the skin also likely
reduces the cutaneous blood flow demand, mediating cardiovascular strain (Price & Maley
2015). Minett et al. (2012) subsequently identified a dose-dependent response, citing cooling
surface area coverage as the critical factor for exercise capacity. This was evidenced by a step-
wise interaction between exercise performance and cooling volume between no cooling
control, individual neck cooling, combined neck and hand cooling and whole body mixed
methods cooling respectively. Thus, a mixed methods approach was shown to improve work
completed during intermittent sprinting by 12% compared with no cooling (Minett et al. 2011).
The recent meta-analysis of Bongers et al. (2015) supports the concept of applying a greater
cooling volume interaction with mixed method cooling (7.3%, d = 0.72), displaying the largest
effect size compared with individual cooling packs (4.3%, d=0.40) and cooling vests (3.4%, d =
0.19) for improving exercise performance. However, this effect of mixed methods may be
slightly inflated due to the inclusion of a mixed methods technique involving cold water
immersion.
Despite these promising results, the more aggressive, practical, whole-body, mixed
methods technique of Duffield et al. (2009) has yet to be evaluated prior to endurance exercise,
where precooling techniques appear to provide the greatest benefit (Wegmann et al. 2012;
Tyler et al. 2013). In conclusion, external cooling techniques are well supported for use prior to
endurance performance, with Tyler et al. (2013) reporting an overall effect size of d = 1.91 from
13 investigations, which included a total of 16 cooling interventions/performance/capacity
measure combinations. The reported effects appear unanimous across both TTE (n = 6, d =
2.88) and TT protocols (n = 7, d = 1.06).
2.6.1.2 Internal precooling
Considerable growing evidence supports the use of internal cooling through ice slurry
ingestion (ICE) as an ergogen for endurance exercise in the heat (Wegmann et al. 2012; Siegel &
Laursen 2012; Jones et al. 2012), by a likely magnitude of 6.3% (d = 0.40, Bongers et al. 2015).

85
Indeed, as an alternative to cold water immersion, cold drinks and ICE have also been proposed
as the most effective form of pre-cooling in a meta-analysis by Wegmann et al. (2012) and
systematic review by Jones et al. (2013). Internal cooling through cold drinks or ICE lowers TCORE
by delivering the cooling impulse closer to the core organs, whilst maintaining muscle
temperature for high intensity efforts (Stanley et al. 2010). The mechanisms underpinning
internal precooling remain equivocal, but may include limiting gastrointestinal epithelia
permeability to limit the degree of endotoxemia occurring under heat stress (Moseley et al.
1994), and thus preventing an apparently increased perception of effort (Cheung & Sleivert
2004). Furthermore, aggressive cooling via the mouth and gut may positively influence the
anticipatory regulation of exercise due to improved thermal comfort (Marino 2004), as a
consequence of the relative prominence of thermoreceptors in these regions (Flouris 2011;
Villanova et al. 1997). This mechanism is supported by the observation of greater power output
following ICE during exercise, versus a combined internal and external technique, which elicited
a greater reduction in TCORE (0.4 vs. 0.6°C, Ross et al. 2011).
Despite the demonstrable efficacy of cold drink ingestion, questions remain concerning the
optimal quantity and ingestion time before performance in order to avoid gastro-intestinal
complaints (Ross et al. 2011). Addressing this, Siegel et al. (2010), proposed the ingestion of a
smaller dosage of ice slurry (7.5 g kg-1). A smaller dosage is appropriate because a larger
transfer of heat energy is required to complete the phase change of ice into water (H2O), than
to heat cold water. Through precooling with 7.5 g kg-1 of ICE for 30 minutes prior to exercise,
Siegel et al. (2010) demonstrated a greater reduction in TCORE and thermal sensation than
following 7.5 g.kg-1 of cold drinks (-0.66 ± 0.14°C ICE vs. -0.25 ± 0.09°C cold drinks, p=0.001),
which resulted in an increased running TTE of 19 ± 6% at an intensity corresponding to the
ventilatory threshold. A summary of the reported improvements following ICE in open and
closed loop trials is displayed below in Figure 23.

86
Figure 23: Effect sizes (Cohen’s d) for ice slurry ingestion versus control (Jones et al. 2012).
Graph represents effect of intervention on exercise performance. Ihsan et al. (2010) = 40 km
cycling TT. Ross et al. (2011) = 23 km cycling TT. Siegel et al. (2010, 2012) running TTE at
ventilatory threshold.
Furthermore, when directly compared with cold water immersion, the same volume of ICE
cooled TCORE by a greater magnitude (0.43 ± 0.14°C ICE vs. no change from rest) and resulted in
similar TTE (52.7 ± 8.4 min ICE vs. 56.8 ± 5.6 min, p = 0.335, Siegel et al. 2012). However, as
previously discussed with external cooling modalities, an after-drop in the water immersion
condition was observed and TCORE continued to reduce until 5 minutes into exercise such that
the mean total reduction was -0.25 ± 0.20°C. Whilst these data are not representative of the
total cooling potential of water immersion due to the onset of exercise, it is apparent that ice
slurry cools TCORE faster than water immersion.
Free-paced trials also demonstrate improved endurance performance following ICE, with
Ihsan et al. (2010) reporting a 6.5% improvement following ICE versus a warm water control
(26.8 ± 1.3°C) during a 40 km cycling time trial. However, the failure to include a cold water trial
control group may over-estimate the magnitude of the effect, as may the lack of representative
air-flow whilst using a cycling ergometer in the heat (Morrison et al. 2014). Furthermore,
caution should be taken interpreting the TCORE response from this trial as the validity of
telemetric gastro-intestinal capsules as measures of TCORE, when subsequently providing a
cooling impulse to the gut has been criticised due to the significant inter-individual variation in
gut transit time (Lee 2011; Byrne & Lim 2007). A subsequent time trial experiment by Ross et al.
(2011) helped reaffirm the results of Ihsan et al. (2010), using three conditions of cold water
immersion, cold water drink and a mixed-methods slurry and iced towels technique prior to a
46 km cycle. The mixed methods slurry and iced towels technique resulted in a 1.3 %
improvement in finishing time and 3% (~8 W) increase in mean power output. These effects
were observed despite Ross et al. (2011) delivering the intervention in hot conditions (32-35°C
50-60% relative humidity), rather than thermo-neutral locations reported by Siegel et al. (2010;
Siegel et al. 2012) and Ihsan et al. (2010). Moreover, Ross et al. (2011) included representative
air-flow within the laboratory (Morrison et al. 2014).
Currently no study has investigated the effect of precooling on the determinants of
endurance performance in the heat. Furthermore, there remains a lack of research concerning
internal precooling and endurance running performance. Given the differing absolute energy
requirements and potential for greater MHP during running versus cycling (Millet et al. 2009),

87
caution should be taken before extrapolating the magnitude of performance improvements
following ICE from cycling to running. Ultimately, athletes and coaches require a simple, time-
efficient intervention for use across a number of competition venues. Internal cooling
modalities are practical for field delivery and demonstrate a greater reduction in TCORE than
whole body water immersion across 20-30 min. Endurance performance in the heat following
ICE would appear to be similar to whole body immersion, and improved relative to cold drinks
or no cooling. Further benefits to this approach may arise from the ability to combine ICE with
an existing pre-race hydration or carbohydrate supplementation strategy (Rollo & Williams
2011).
2.6.2 Ischemic Preconditioning
As with precooling, ischaemic preconditioning may be an acute intervention that can
benefit endurance performance in the heat independently, or in combination with existing
strategies such as heat acclimation. Ischaemic preconditioning (IP), that may be achieved from
repeated bouts of occlusion and reperfusion of a peripheral limb, has been shown to aid
exercise performance across a range of different sports and environmental conditions (Sharma
et al. 2015), and proffers transient protection that has the potential to alleviate physiological
consequences of heat strain including the increased contribution of anaerobic energy provision
(Febbraio 2001) and heightened perceived exertional strain (Flouris & Schlader 2015).
A recent meta-analysis by Marocolo et al. (2015) details anecdotal information concerning
the origins of the IP technique, suggesting the practice originated from South American
indigenous populations who ligated the thighs before long journeys. In Europe It would seem
that the technique emerged in the mid-20th century, with a prominent study by E.A. Muller
reporting increased exercising time being associated with prolonged prior application of
tourniquets, to achieve occlusion of the lower extremities (Muller 1958). The difference in
exercise performance was attributed to an increased blood flow to the working muscles during
the reactive hyperaemia during reperfusion that follows occlusion. IP may be considered an
example of hormesis, an adaptive response of cellular mechanisms to intermittent stress
(Mattson 2008). Since these early experiments, IP has become established clinical practice as
an intervention to treat those at risk of coronary infarction, or to prepare cardiac muscle to
withstand infarction that may occur during surgery. From a clinical perspective, this practice
follows the discovery of a markedly reduced infarct size during occlusion of the left anterior
descending coronary artery, when cardiac muscle had been preconditioned through
intermittently clamping the circumflex coronary artery (Przyklenk et al. 1993). Crucially, this

88
study highlighted a systemic component to protection, as the heart was preconditioned
through a different vessel to which the subsequent occlusion was made. This introduced the
concept of ‘remote ischaemic preconditioning’, and stimulated other, successful investigations
concerning the effect on other organs. Among the wide ranging responses to IP, the IPC
phenomenon has provided protection against reperfusion injury during clinical studies
concerning smooth muscle of the lungs (Chen et al. 1999) and liver (Clavien et al. 2003), as well
as a range of effects on skeletal muscle which may include ATP sparing (Pang et al. 1995),
greater muscle oxygenation (Andreas et al. 2011) and as well as vasodilation, potentially
elevating muscle blood flow (Bailey, et al. 2012b). As with cardiac protection, because the
effects are not localised to the occluded muscles, such a technique may be of benefit across a
wide range of sports when skeletal muscle is preconditioned. Skeletal muscle IP typically
involves three or four, 5 min bouts of occlusion, separated by 5 min of reperfusion. Some
protection is conferred within minutes, lasting 1-2 hours, followed by a second window of
protection which may last for up to 48 hours (Hausenloy & Yellon 2008).
Early investigations into the mechanisms underpinning the protective effects of IP before
surgery suggested that the artificially induced metabolic stress may result in cellular protection
through a heat shock protein response (Marber 1994). However, this is no longer thought to be
the case, with Bushell et al. (2002) observing no change in heat-shock protein content following
IP, as well as highlighting the need for a relatively acute and transient stress to elicit protection,
which is not in keeping with stimulating the expression of a transcribed protection factor.
Subsequent research suggests adenosine, bradykinin, opioids and oxygen radicals have roles in
the protective response induced by IP, combining to signal the metabolic cascade which
provides the ischemia/reperfusion protection (Cohen et al. 2000; Hausenloy & Yellon 2008).
The role of adenosine in particular appears significant, with Bushell et al. (2002) replicating the
protective benefits of IP and as well as demonstrating the maintenance of ATP levels, following
adenosine infusion into skeletal muscle of rats. Adenosine is produced rapidly by the
endothelium during ischemia (Minamino et al. 1995) and mediates reactive hyperaemia during
reperfusion (Tóth et al. 2007), following occlusion. This serves to protect organs from future
ischaemic events and likely contributes to enhanced exercise performance, through
vasodilation of the peripheral vasculature during the windows of protection. Adenosine is likely
released from the vasculature, rather than the skeletal muscle, due to the relatively small
amounts of adenosine stored in muscle (Bushell et al. 2002). Such a mechanism helps explain
the rapid benefits from IP, as well as why IP is effective across a range of locations including
cardiac, smooth and skeletal muscle.

89
As well as acting as a vasodilator (Gustafsson et al. 1993), the presence of adenosine also
opens mitochondrial potassium (KATP) channels, which may reduce mitochondrial oxygen
consumption (Cooper & Brown 2008). The results of Hopper et al. (2000) allude to the
importance of the roles played by adenosine and KATP channels, with reduced preconditioning
effects when adenosine or KATP channel blockers were administered, and increased effects
when the respective agonists were administered. KATP channels are closed at rest, but open
during hyperthermia, as well as during hypoxic events, which could include normothermic
exercise, leading to increased plasma potassium levels and in turn, nitric oxide release
(Marshall 2000). In turn, the release of endothelial nitric oxide effects haemodynamic changes
by attenuating sympathetic vasoconstriction (Thomas & Victor 1998) and appears to maintain
vascular function that may be impaired following high intensity exercise (Bailey et al. 2012b).
Specifically, nitric oxide maintains the flow-mediated dilation of blood vessels, and the results
of Bailey et al. (2012b) suggest IP can mediate against the impairment to endothelial function
that occurs following high intensity exercise. The authors suggested nitric oxide release may
effect this change, with the likely additional benefit of helping maintain the supply of oxygen
and energy substrates to the skeletal muscles during intense exercise, when muscles may be
subject to hypoxia, therefore sustaining contractile activity. Indeed, under heat stress, nitric
oxide has an established role for inducing smooth muscle relaxation as part of the secondary
plateau phase of the bimodal cutaneous response to local hyperthermia (Kellogg et al. 1998).
Kimura et al. (2007) has also demonstrated a direct effect of IP in promoting endothelial nitric
oxide biosynthesis, suggesting this will increase shunting of blood flow to the local muscle beds
at the IP site and away from less active muscle tissue. Under heat stress, such a redistribution
of blood towards active skeletal muscle may help to maintain the delivery of oxygenated blood
that ultimately impairs VO2max (Gonzalez Alonso et al. 2008), whilst reducing the %VO2max at
submaximal intensities as a consequence of reducing anaerobic metabolism. The study by
Andreas et al. (2011) utilised functional magnetic resonance imaging to characterize
metabolism changes to IP in vivo, providing novel evidence of the metabolic cascade likely
mediated through adenosine and nitric oxide, highlighting greater energy replenishment and a
higher oxygen consumption at rest during reperfusion, mechanisms that may transfer to
exercise in the heat. However, given the vasodilation that already occurs during heat strain,
were IP to promote a greater redistribution of blood to the active muscles, this could be to the
detriment of skin blood flow and thermoregulation. Therefore, when investigating the
performance effects of IP in a hot environment, the on TSKIN and TCORE during exercise in the
heat should also be quantified to better understand the consequences of the intervention.

90
de Groot et al (2010) reported a 3% increase in VO2max alongside a 1.3% increase in
maximal power output during incremental cycling following IP, relative to a control condition.
This increase in VO2max is comparable to a month of altitude (Stray-Gundersen et al. 2001) or
high intensity interval training (Milanović et al. 2015). To explain their findings, de Groot et al.
(2010) recognised the potential for enhanced maximal exercise-induced blood flow following
IP, but also suggested an alternative mechanism, because increased maximal blood flow does
not always unanimously increase VO2max, as oxygen extraction can be impaired from a less
efficient flow distribution (Calbet et al. 2006). Alternatively, De Groot et al. (2010) suggested an
increase in muscle oxygenation may have occurred, as has been reported in rats that have
undergone IP (Saito et al. 2004) and in humans at rest (Andreas et al. 2011). De Groot et al.
(2010) also proposed that any changes in muscle oxygenation may be complemented by a
small, unobserved, energy sparing effect (Pang et al. 1995) alongside augmented mitochondrial
function reducing oxygen consumption, as a consequence of increased nitric oxide availability
following IP (Kimura et al. 2007). Such a mechanism would appear to be independent of body
temperature, therefore would be maintained during exercise in the heat, and may help explain
how IP can benefit both short and longer duration exercise, as well as performance in hypoxia.
However, the failure to observe any differences in oxygen consumption at sub-maximal
exercise intensities is not in support of these mechanisms, and it remains difficult to validate
given the lack of muscle oxygenation or muscle biopsies to establish muscle ATP levels
following maximal exercise.
In a subsequent study, the improved incremental cycling performance of de Groot et al.
has been supported by Crisafulli et al. (2011) who reported a 4% increase in maximal power
output and a ~40 s increase in total exercise time to exhaustion, following IP. However, IP did
not improve VO2max, nor maximal stroke volume or cardiac output. Therefore, Crisafulli et al.
(2011) suggested IP may benefit performance through a perpetual mechanism, such as an
altered fatigue perception, potentially utilising a greater proportion of muscular functional
reserve, as per an end-spurt (Noakes 2011) or indeed a ‘placebo’ effect (Tocco et al. 2014).
Such a mechanism has been suggested to be mediated by desensitised group III and group IV
afferents (Sharma et al. 2015). Such a mechanism may proffer particular benefit when
exercising in the heat, due to the heightened perceived exertional strain that exists as a result
of thermal discomfort (Flouris and Schlader 2015). A sub-question of the Crusifulli et al. (2011)
study compared the effect of IP following an exercise bout, versus IP following a period of rest.
This built on the suggestion that in order for IP to provide benefit, the metabolic stress must
exceed a minimum threshold (Przyklenk & Kloner, 1995), therefore a greater metabolite build-

91
up may yield a greater benefit. However, no difference was observed between conditions,
suggesting an IP protocol alone is already sufficient to achieve a metabolite threshold, and
exceeding this does not provide a further benefit.
Jean-St-Michel et al. (2011) suggested IP may provide particular benefit for events such
as swimming whereby an enhanced physiological strain occurs as a result of specified breathing
patterns, leading to a decreased arterial partial pressure of oxygen and decreased blood pH.
Accordingly, Jean-St-Michel et al. (2011) reported a meaningful and statistically significant 0.7 s
improvement in 100m swim time (-1.1%, p=0.02) following IP, improving personal best times
within a highly trained cohort. Likewise, IP appears to be effective when additional
environmental stressors are present, improving exercise performance in hypoxia (Foster et al.
2011) and preventing illness (Sikri & Chawla 2015; Berger et al. 2015) at altitude, but it is
unclear if these benefits extend to heat stress. Like swimming, endurance running is a whole-
body exercise modality, which elicits different VO2max and oxygen kinetics responses to cycling
(Hill et al. 2002; Millet et al. 2009). This may in part explain why Bailey et al. (2012a) went on to
report lower blood lactate concentration (mean difference -1.07 mMol.L-1) throughout an
incremental submaximal running test, followed by improved 5 km running time with a mean
improvement of-34 s, although again, no effect on VO2max was observed. The authors suggested
the improved time trial performance could be explained by the decreased lactate accumulation
at sub-maximal speeds, based on the association of reduced blood lactate concentration and
cycling time trial performance (Jacobs et al. 2011) and accurate predictive ability of the lactate
turnpoint (Lorenzo et al. 2011). Bailey et al. (2012a) suggested IP mediated improvements in
vascular function facilitated enhanced blood flow to transport and remove lactate for uptake
and use away from the working muscles. In a more recent study, and only the second
concerning endurance running, Tocco et al. (2015) recruited national standard athletes and
investigated the effect of IP on 5 km time trial performance on an outdoor running track. Self-
paced running was not enhanced by IP, and no differences were observed within metabolic
data collected by a portable metabolic system worn by participants during all trials. The authors
suggested that despite habituation with the testing conditions, the established pacing
strategies of the participants may have been stronger than the influence of IP. This suggests
there may be a need for individuals to familiarise with IP pacing strategies prior to self-paced
trials, whilst the authors also highlighted a difference in training status of participants in the
respective studies, speculating that the better trained participants may be less sensitive to IP
because they may already be more resistant to ischaemia than sedentary subjects (Crisafulli
2006).

92
In conclusion, considerable, recent debate concerns the precise mechanisms
underpinning IP (Salvador et al. 2015, Sharma et al. 2014, Marocolo et al. 2015). Research has
demonstrated beneficial effects of IP under normothermic conditions, in longer, aerobic based
events (de Groot et al. 2010; Crisafulli et al. 2011; Bailey et al. 2012a; Kjeld et al. 2014) as well
as shorter, anaerobic events (Patterson et al. 2015; Kido et al. 2015; Beaven et al. 2012).
However, findings are not unanimous and recent meta-analyses conducted on a relatively
heterogeneous field of IP and exercise performance studies both support (Salvador et al. 2015)
and dispute (Marocolo et al. 2015) the benefits of IP under normothermic conditions. Thus it is
apparent the effect of IP on exercise performance remains a new and evolving area, with such
ambiguity reflecting the large variation in methodologies when conducting IP research (Sharma
et al. 2015), as well as the small number of studies. Notwithstanding this recent apparent
disagreement, where IP has shown benefit, results are highly meaningful for both amateur and
elite populations, including trained endurance runners, warranting further investigation.
Moreover, there is emerging evidence that IP may be highly effective when additional
environmental stresses are present, which is highly relevant, given the physiological alterations
that occur when exercising under heat stress. Based on the limited, existing literature in this
area it is plausible that IP could enhance endurance performance in the heat through
haemodynamic, metabolic and/or perceptual mechanisms, with the large previously reported
effects indicating highly meaningful performance improvements if benefits transfer to a hot
environment.
2.7 Conclusion
The purpose of this literature review was to identify limiting factors to endurance
performance in the heat in order to identify approaches that may be adopted to enhance
performance. Therefore, it began by introducing the mechanisms that underpin endurance
performance, principally through the determinants of endurance performance model. This
included defining the lactate threshold, lactate turnpoint, running economy and VO2max, and
introducing controversy surrounding the measurement and limiting factors of each variable.
For example, there are a number of different approaches to defining indices of the blood
lactate response (Faude et al. 2009) and it is common for exercising individuals not to
demonstrate a VO2 plateau during maximal aerobic exercise (Edvardsen et al. 2014). The
efficacy of these determinants for predicting endurance performance, both individually and
collectively, was then discussed, as well as how this approach corresponds to traditional
endurance time trials or time to exhaustion protocols. The determinants of endurance
performance appear to provide a multi-faceted model through which to assess and interpret

93
endurance performance, combining to produce a valid performance calculation of velocity at
VO2max. Having detailed the fundamentals of endurance performance, the review then
introduced how hot and humid conditions influence human thermoregulation, and exacerbate
physiological strain that is commensurate with exercise. This included identifying the
predominant physiological stresses that arise from exertional heat stress, and discussing the
individual, and collective effects of these changes. It is apparent that there are numerous
hypotheses of fatigue, (Gonzalez-Alonso et al. 1999, Cheung 2007, Tucker et al. 2008, Nybo et
al. 2014), however there is consensus that cardiovascular, perceptual and metabolic alterations
appear prominent in determining the voluntary control of intensity during self-paced
endurance exercise in the heat. Therefore, it is apparent that interventions must mediate many
of these effects to maintain performance in the heat better. Accordingly, recent integrated
models of endurance performance in the heat such as that of Nybo et al. (2014) were
explained, in order to provide a basis for how interventions such as heat acclimation,
precooling and ischaemic preconditioning may provide a benefit to performance in the heat.
The mechanisms underpinning these widely evidenced interventions were then explained, in
terms of their time course i.e. chronic (heat acclimation) and acute (precooling and ischaemic
preconditioning). Despite evidence advocating the use of each intervention individually, specific
questions were identified that should be answered in order to develop an optimised strategy
for endurance performance in the heat. Regarding precooling, the recent development of
modified cooling techniques such as mixed-methods external cooling appear beneficial, but
have yet to be examined on endurance performance, and it is unclear whether this is a
preferential approach to internal precooling strategies. Ischaemic preconditioning has yet to be
investigated under heat stress, and has the potential for benefits from normothermic
conditions to transfer through effecting a change in the peripheral vasculature and blood
availability, thereby mediating heat stress-induced metabolic changes. From a chronic
perspective, LTHA strategies appear beneficial for endurance performance and have been
shown to enhance the determinants of endurance performance (Lorenzo et al. 2010). However,
these notable results warrant replication in a more widely utilised STHA model and during
running experiments, due to the greater MHP that may result in an enhanced thermal strain in
running versus cycling (Millet et al. 2009). Furthermore, despite the inability for HA strategies
alone to restore VO2max (Sawka et al.1985) and endurance performance (Lorenzo et al. 2010) to
levels observed under normothermic conditions, remarkably little research has investigated the
combined effect of acute and chronic strategies. Finally, the extent to which the determinants
of endurance performance model explains performance in the heat has yet to be investigated.

94
Therefore, the following series of experiments were designed in order to address these gaps in
the research and optimise preparation for endurance runners competing in a hot environment.
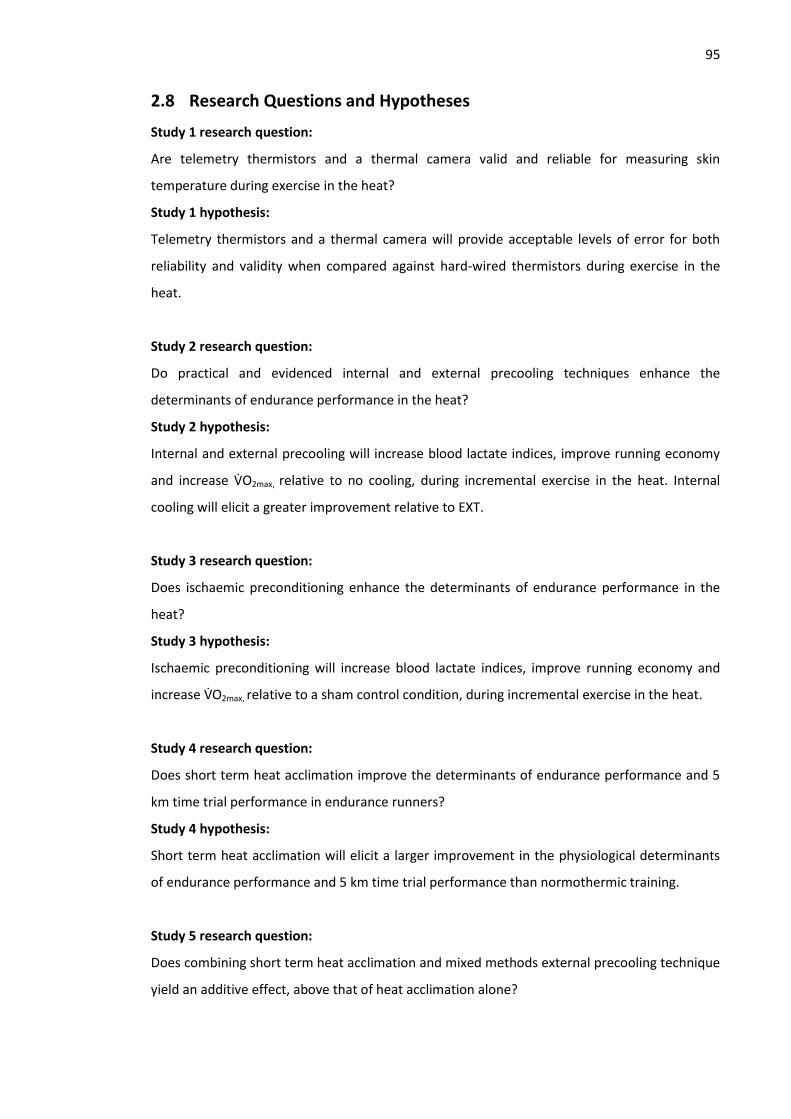
95
2.8 Research Questions and Hypotheses
Study 1 research question:
Are telemetry thermistors and a thermal camera valid and reliable for measuring skin
temperature during exercise in the heat?
Study 1 hypothesis:
Telemetry thermistors and a thermal camera will provide acceptable levels of error for both
reliability and validity when compared against hard-wired thermistors during exercise in the
heat.
Study 2 research question:
Do practical and evidenced internal and external precooling techniques enhance the
determinants of endurance performance in the heat?
Study 2 hypothesis:
Internal and external precooling will increase blood lactate indices, improve running economy
and increase VO2max, relative to no cooling, during incremental exercise in the heat. Internal
cooling will elicit a greater improvement relative to EXT.
Study 3 research question:
Does ischaemic preconditioning enhance the determinants of endurance performance in the
heat?
Study 3 hypothesis:
Ischaemic preconditioning will increase blood lactate indices, improve running economy and
increase VO2max, relative to a sham control condition, during incremental exercise in the heat.
Study 4 research question:
Does short term heat acclimation improve the determinants of endurance performance and 5
km time trial performance in endurance runners?
Study 4 hypothesis:
Short term heat acclimation will elicit a larger improvement in the physiological determinants
of endurance performance and 5 km time trial performance than normothermic training.
Study 5 research question:
Does combining short term heat acclimation and mixed methods external precooling technique
yield an additive effect, above that of heat acclimation alone?
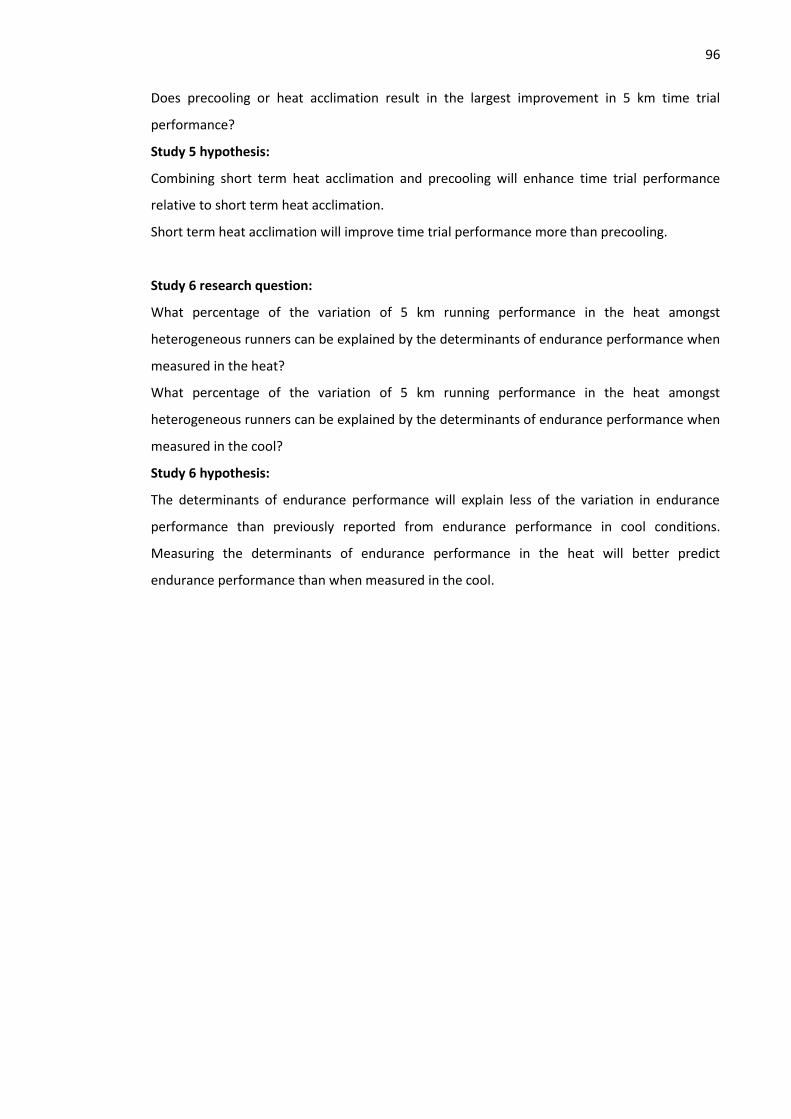
96
Does precooling or heat acclimation result in the largest improvement in 5 km time trial
performance?
Study 5 hypothesis:
Combining short term heat acclimation and precooling will enhance time trial performance
relative to short term heat acclimation.
Short term heat acclimation will improve time trial performance more than precooling.
Study 6 research question:
What percentage of the variation of 5 km running performance in the heat amongst
heterogeneous runners can be explained by the determinants of endurance performance when
measured in the heat?
What percentage of the variation of 5 km running performance in the heat amongst
heterogeneous runners can be explained by the determinants of endurance performance when
measured in the cool?
Study 6 hypothesis:
The determinants of endurance performance will explain less of the variation in endurance
performance than previously reported from endurance performance in cool conditions.
Measuring the determinants of endurance performance in the heat will better predict
endurance performance than when measured in the cool.

97
3 General Methods
This chapter describes the common methods used in the experimental chapters within this
thesis. Each of these methods were conducted in British Association of Sport and Exercise
Sciences (BASES) accredited laboratories (Welkin Human Performance Laboratories,
Eastbourne). Where experimental chapters used alternative methods, appropriate descriptions
are detailed within the methods section of that specific chapter. Data collection was combined
for Studies 1 and 2 (Chapters 4 and 5), as well as Studies 4 and 5 (Chapters 7 and 8). Therefore,
participants, methods and equipment used in these chapters were the same.
3.1 Health and safety
The studies that form this thesis were each individually approved by the University of
Brighton Research Ethics and Governance Committee and conducted in accordance with the
Declaration of Helsinki 1964, as revised in 2013. Written informed consent and recent medical
history was obtained from all participants prior to the start of each study. Biological waste and
hazardous materials were handled and disposed of in accordance with University of Brighton
standard operating procedures.
During each data collection session at least two experimenters were present throughout,
with one located within the environmental chamber monitoring the participant, and one
outside of the chamber remotely controlling the treadmill where necessary.
Termination of testing occurred at the request of the participant, the attainment of the
University of Brighton Ethics and Governance Committee approved maximum permissible core
temperature of 39.7°C or evidence of signs of heat illness that included syncope, exhaustion,
disorientation, nausea and vomiting. Following the cessation of exercise participants were
routinely chaperoned until TCORE had returned to within 0.5°C of the baseline measure obtained
prior to testing. Drinks were also provided and active cooling through ice packs and fans were
utilised where appropriate.
3.2 Participants
As the investigations in this thesis were focussed towards improving endurance running,
trained endurance runners were the cohort recruited. Participants who volunteered to
participate in the studies were all healthy, predominantly male and between the ages of 22-60.
Prior to attending the laboratory, participants were provided with an information sheet
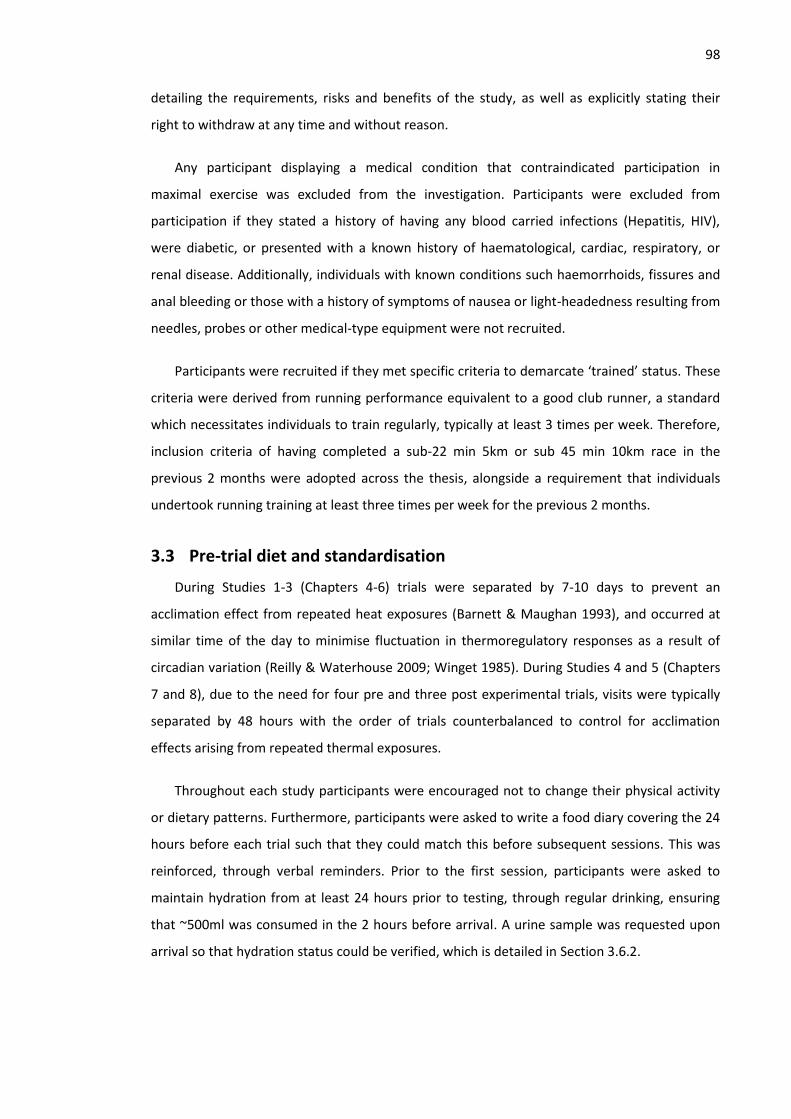
98
detailing the requirements, risks and benefits of the study, as well as explicitly stating their
right to withdraw at any time and without reason.
Any participant displaying a medical condition that contraindicated participation in
maximal exercise was excluded from the investigation. Participants were excluded from
participation if they stated a history of having any blood carried infections (Hepatitis, HIV),
were diabetic, or presented with a known history of haematological, cardiac, respiratory, or
renal disease. Additionally, individuals with known conditions such haemorrhoids, fissures and
anal bleeding or those with a history of symptoms of nausea or light-headedness resulting from
needles, probes or other medical-type equipment were not recruited.
Participants were recruited if they met specific criteria to demarcate ‘trained’ status. These
criteria were derived from running performance equivalent to a good club runner, a standard
which necessitates individuals to train regularly, typically at least 3 times per week. Therefore,
inclusion criteria of having completed a sub-22 min 5km or sub 45 min 10km race in the
previous 2 months were adopted across the thesis, alongside a requirement that individuals
undertook running training at least three times per week for the previous 2 months.
3.3 Pre-trial diet and standardisation
During Studies 1-3 (Chapters 4-6) trials were separated by 7-10 days to prevent an
acclimation effect from repeated heat exposures (Barnett & Maughan 1993), and occurred at
similar time of the day to minimise fluctuation in thermoregulatory responses as a result of
circadian variation (Reilly & Waterhouse 2009; Winget 1985). During Studies 4 and 5 (Chapters
7 and 8), due to the need for four pre and three post experimental trials, visits were typically
separated by 48 hours with the order of trials counterbalanced to control for acclimation
effects arising from repeated thermal exposures.
Throughout each study participants were encouraged not to change their physical activity
or dietary patterns. Furthermore, participants were asked to write a food diary covering the 24
hours before each trial such that they could match this before subsequent sessions. This was
reinforced, through verbal reminders. Prior to the first session, participants were asked to
maintain hydration from at least 24 hours prior to testing, through regular drinking, ensuring
that ~500ml was consumed in the 2 hours before arrival. A urine sample was requested upon
arrival so that hydration status could be verified, which is detailed in Section 3.6.2.

99
The following guidelines were also given prior to each testing session:
No eating in 2 hours prior
No strenuous exercise in 48 hours prior (weightlifting, sprint training & exercise
>30min)
No caffeine in 12 hours prior & no alcohol in 24 hours prior.
Participants were also instructed to abstain from prolonged thermal exposures (baths,
saunas, steam rooms) and refrain from participating in vigorous physical activity or exhaustive
exercise and alcohol consumption 2 days prior too, and throughout the duration of each
experiment. Finally, participants were asked to prepare for each trial as they would a
competition. Adherence to these guidelines was verified verbally upon arrival for each trial.
Studies 4 and 5 (Chapters 7 and 8) necessitated a total of 7 experimental trials to be
completed, which were predominantly separated by 48 hours, rather than 7 days. To assess
readiness to exercise, upon arrival participants were required to note hours of sleep for the
previous night, as well as complete 5-point Likert scales based on:
Muscle soreness
Motivation
Stress
3.4 Exercise protocol
All studies involved serial graded exercise tests, to which participants were familiarised, and
instrumented during familiarisation. An overview of each trial is provided in Figure 24. Trials
were comprised of four phases; 10 min rest, 20-40 min for the relevant acute intervention
(precooling or ischemic preconditioning), 5 min warm-up and then the graded exercise tests
(GXT 1 and GXT 2), with the entire trial within the hot and humid environment. All resting
measurements occurred at the end of 10 min rest period within the hot environment. In order
to better replicate a competition schedule, the exercise test began 15 min after the acute
intervention.

100
Figure 24: Protocol overview. Entire protocol completed in hot environment. ‘GXT 1’ denotes 3
min exercise stages with increments of 1km.h-1. ‘GXT 2’ denotes gradient based test to
exhaustion incorporating 1 min stages with increments of 1%.
Following rest and intervention phases, a five min warm-up was completed on a motorised
treadmill (Woodway ELG2, Weil am Rhein, Germany). The treadmill gradient was calibrated by
the manufacturer annually, using a certified spirit level. The treadmill speed and distance
functions were verified every 6 months through marking the treadmill belt and counting the
revolutions across of a range of speeds from 6-15 km.h-1 in accordance with the manufacturer
guidelines. Warm-up speed was determined from discussion with the participant about their
recent running performances.
GXT 1 was similar to that described by Jones (2006), initially a submaximal incremental
speed protocol totalling 6-8 stages, using speed increments of 1 km.h-1. This was followed by
GXT 2, an incremental gradient protocol to volitional exhaustion. Starting speeds were between
8–11 km.h-1 (1% gradient), again dependent upon recent running performance, such that each
participant would complete 6-8 stages without reaching volitional exhaustion. Each stage was 4
min, consisting of 3 min running and 1 min for capillary blood sampling. These times were fixed
across all trials, with the treadmill following a predefined protocol. Exercise continued until an
exponential increase in blood lactate was observed, blood lactate concentration exceeded 4
mMol.L-1 or the participant felt unable to complete the subsequent stage. The same number of
exercise stages and running speeds completed were replicated during all subsequent trials
within each Chapter.
Following a short rest, GXT 2 began at a speed 2 km.h-1 below the previous final speed. This
rest period was fixed at 2 min for Studies 1 and 2 (Chapters 4 and 5), and 10 min for Studies 3-5
(Chapters 6-8). The shorter rest period was adopted to maintain the effects of precooling prior
0 5 10 15 20 25 30 35 40 45 50 55 60 65 70 75 80
Exe
rcis
e in
ten
sity
Time (mins)
GXT 1 - Speed Warm-up GXT 2 - Gradient
Rest Acute intervention Exercise

101
to GXT 2, as per the investigation in Study 2. During GXT 2, the gradient increased by 1% each
min and the test continued until volitional exhaustion (Jones, 2006). Participants were verbally
exhorted to continue running for as long as they possibly could, whilst ensuring that they could
still safely terminate the test by pressing the stop button or jumping off and straddling the
treadmill belt. An experimenter was in close proximity to the treadmill and participant at all
times during GXT 2 for safety. Standardised instructions were given to participants immediately
prior to GXT 2 during each trial to emphasize the importance of running to maximum. No
feedback on running time or number of stages completed was provided at any time.
3.5 Ambient Environment
All trials were completed in a large purpose built environmental chamber (Figure 25) with an
available range of -20 to +50C and 20-95% relative humidity chamber (TISS, Hampshire, UK).
The targeted conditions for this thesis was 32°C and 60% relative humidity. These conditions
represent the expected environment across many of the sites at the 2016 Rio de Janeiro
Olympics, as detailed earlier (see Chapter 1, Introduction).
Within the environmental chamber, conditions were thermostatically controlled (WatFlow
control system, TISS, Hampshire, UK), as well as being continuously monitored throughout the
trial using a heat stress meter (HT30, Extech Instruments, USA). Environmental conditions were
logged at the beginning, middle and end of the trial to accurately describe the environment
experienced by participants.
Figure 25 Environmental chamber within Welkin Laboratories, Eastbourne, UK.

102
3.6 Physiological measures
Details of the techniques and equipment adopted for measuring physiological variables are
detailed in this section. In the following section, reliability data for outcome variables that are
prominent in experimental chapters are presented. Data is presented on physiological
measures and procedures having been collected from participants of experimental studies
within this thesis, all of whom have followed the same standardisation procedures as for
experimental trials. The observed variation between trials is the sum of technical, biological
and random error (Weir 2005). Therefore, when appropriate standardisation procedures have
been followed and potential confounding factors are accounted for, a quantitative assessment
of the total variation within a dependent variable can facilitate accurate interpretation of
interventional change, by distinguishing meaningful change from inherent variation of the
measure. Where possible, and appropriate given the different experimental designs, data from
different chapters are combined to enhance the robustness of reliability calculations.
Atkinson and Nevill (1998) recommend a battery of both relative and absolute reliability
statistics to provide a more robust analysis than significance testing and a singular test such as
the 95% limits of agreement (LOA), previously advocated by British Standards Institution
(1987). Therefore, a range of statistics are presented, with absolute reliability assessed through
the typical error of the measure (TE), calculated from the standard deviation of the mean
difference for each pair of trials using the formula TE = SD(diff)/√2 and expressed as a mean
coefficient of variation (CV%) (Hopkins 2000, Hopkins et al 2009). The 95% limits of agreement
are also presented, in accordance with Bland and Altman (1986), reflecting the range within
which the scores of 95% of the given population would be expected to fall within if this
measure or technique was replicated. Relative reliability is presented as Pearson’s correlation
coefficient (r), as data concerns no more than 2 trials, in accordance with Hopkins (2000).
Finally, paired samples T-tests are used to identify mean bias between samples. From these
statistics, a more informed assessment of a variable is possible, whereby low typical error,
narrow 95% LOA, high correlation and no statistically significant differences between tests,
demonstrates good reliability of the measure.
3.6.1 Anthropometry
Anthropometric data were collected for stature, body mass and a four site skin fold calliper
assessment (Harpenden, Burgess Hill, UK) across iliac crest, subscapular, triceps and biceps.
Body mass was measured using AE Adam GFK150 scales, precise to 0.01 kg (AE Adam, Milton

103
Keynes, UK). From these measures of skinfold thickness, body density was calculated in
accordance with the formula of Durnin and Womersley (1974).
Equation 8: Calculation of body density (Durnin & Womersley 1974).
Body density = 1.1610 – 0.0632 Log ∑ Iliac crest, Subscapular, Triceps, Biceps
Following determination of body density, percentage body fat could be calculated.
Equation 9: Calculation of percentage body fat (Siri 1956):
% Body fat = ([4.95 / body density] - 4.5) x 100
3.6.2 Hydration
During all trials a urine sample was requested upon arrival. Euhydration was achieved when
urine osmolality and urine specific gravity were below 700 mOsmol.kg-1 H2O and 1.020,
respectively (Sawka et al. 2007).
Urine specific gravity (USG) was measured using a refractometer (Specific Gravity
Refractometer Model 32, Atago; USA). The refractometer was calibrated prior to each test
using water (USG = 1.000). A small volume (~2 ml) of urine was placed into the surface reader
and the plastic cover closed. The refractometer was then held towards the light, with the value
obtained from the scale within the eye piece.
Urine osmolality was measured using a hand held osmometer (Osmocheck™ Pocket, Vitech
Scientific Ltd, UK.). The osmometer was calibrated prior to each measurement using water
(Osmolality = 0). A small volume of urine (~2 ml) was placed on the aperture. The result was
displayed to within ±10 mOsmols kg H2O. The measurement surface was then cleaned
immediately.
In the event that a participant arrived dehydrated, they would initially be provided with 500
ml of water to drink across 30 min, before another urine sample was requested. If this was not
possible or the individual did not yet meet the hydration criteria, then rehydration would
continue for another 30 min or the trial would be rearranged.

104
3.6.3 Determinants of endurance performance
3.6.3.1 Lactate thresholds
Blood lactate was determined from arterialised fingertip capillary samples. The fingertip
was cleaned with an alcohol wipe and punctured using a Softclix Pro lancet (Roche Diagnostics,
Lewes, UK). To prevent contamination or erythrolysis, the first drop of blood was discarded.
Approximately 25 µL of blood was collected into lithium heparin coated microvette tubes
(CB300 µL, Sarstedt, Germany) before being presented to the analyser sipper. Blood samples
were analysed for lactate concentration using an automated lactate and glucose analyser (YSI
2300, YSI, Ohio USA). The analyser contains an enzyme specific for the substrate of interest
within the three layered membrane. The substrate is oxidized as it enters the enzyme layer,
producing hydrogen peroxide, which passes through the bottom of the membrane containing
cellulose acetate, where it meets a platinum electrode and the hydrogen peroxide is oxidized.
The resulting current is proportional to the concentration of the substrate (YSI, Ohio USA).
Specifically, lactate is oxidised in the presence of lactate oxidase, producing hydrogen peroxide
as per the following reaction.
Reliability data for resting blood lactate concentration from all experimental chapters is
presented below in Table 7. Samples taken upon arrival at the laboratory, following a 10 min
seated rest.
Table 7: Reliability of resting blood lactate concentration.
Trial 1 Trial 2
n 40 40
Mean 0.81 0.76 mMol.L-1
SD 0.21 0.29 mMol.L-1
TE 0.22 mMol.L-1
TE (CV%) 27.9 %
95% LOA 0.61 mMol.L-1
Lower/Upper -0.56 0.66 mMol.L-1
r 0.25
p 0.347
During graded exercise tests, blood samples were taken immediately after each 3 min stage
was completed, with participants momentarily jumping astride the treadmill belt. In Study 2

105
(Chapter 5), fixed blood lactate concentrations of 2 and 3.5 mMol.L-1 were adopted to denote
the lactate threshold and lactate turnpoint respectively by solving the polynomial regression
equation for blood lactate versus speed at 2 and 3.5 mMol.L-1 as per Saunders and Green
(2013). This was modified from Saunders and Green (2013) in response to not all participants
displaying a blood lactate value exceeding 4 mMol.L-1 across all trials. Through Studies 3-5
(Chapters 6-8), fixed blood lactate concentrations of 2 and 4 mMol.L-1 were adopted.
Fixed blood lactate concentrations afforded precision below 1 km.h-1 in identifying the
running speeds associated with the respective thresholds. Such precision is appropriate for the
participant cohort within this thesis where changes of less than 1 km.h-1 are meaningful, and
this level of precision cannot be objectively achieved through visual inspection when stage
increments of 1 km.h-1 are used. This approach also eliminated the possibility of experimenter
bias in identifying thresholds, and individualised the analysis, allowing comparison across
participants irrespective of the number of stages the individual completed. To control for the
influence of nutritional status and resting blood lactate on the absolute blood lactate response
(Jacobs 1981; Yoshida 1984), pre-exercise standardisation guidelines and diet replication were
routinely reinforced to participants the evening prior to every trial.
The reliability of running speeds at fixed blood lactate concentrations are presented below,
calculated from the control group in Studies 4 and 5 (Chapter 7 and 8). The heat acclimation
group of Studies 4 and 5 were excluded based on the effect of acclimation on the lactate
threshold (Lorenzo et al. 2011).
Table 8: Reliability of 2 mMol.L-1.
2 mMol.L-1
Trial 1 Trial 2
n 7 7
Mean 12.20 12.40 Km.h-1
SD 1.92 1.85 Km.h-1
TE 0.25 Km.h-1
TE (CV%) 2.0 %
95% LOA 0.69 Km.h-1
Lower/Upper -0.89 0.49 Km.h-1
r 0.98
p 0.858
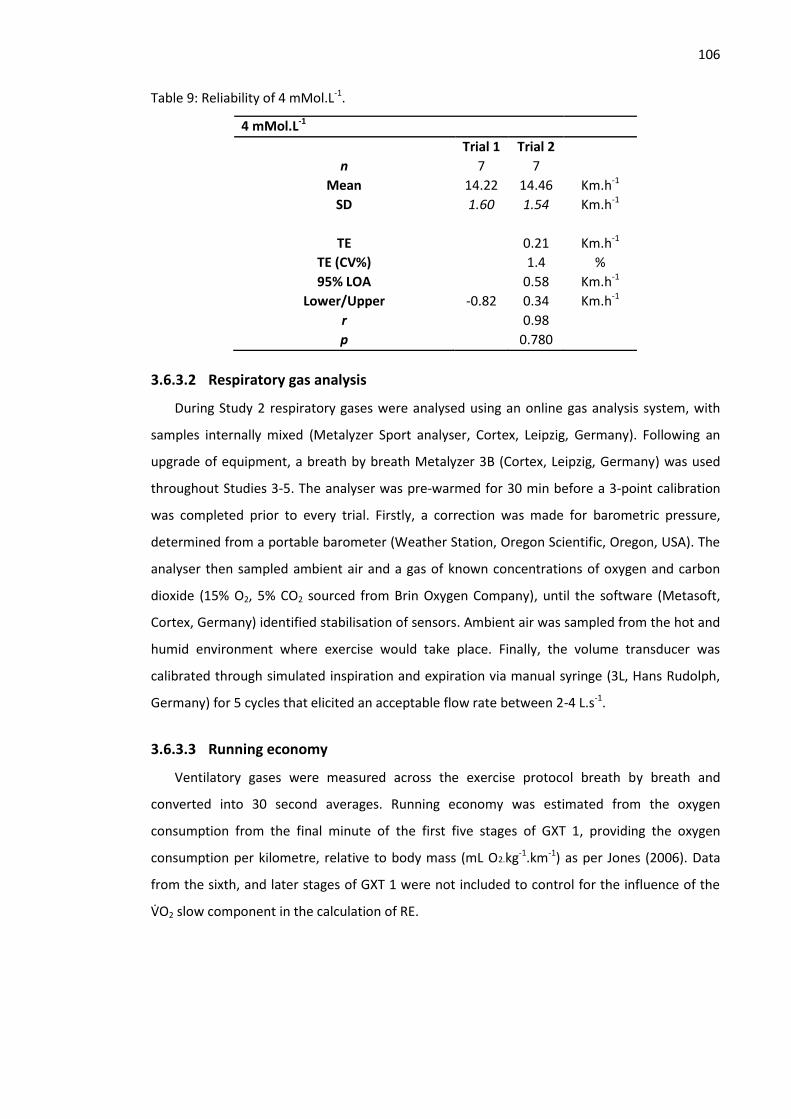
106
Table 9: Reliability of 4 mMol.L-1.
4 mMol.L-1
Trial 1 Trial 2
n 7 7
Mean 14.22 14.46 Km.h-1
SD 1.60 1.54 Km.h-1
TE 0.21 Km.h-1
TE (CV%) 1.4 %
95% LOA 0.58 Km.h-1
Lower/Upper -0.82 0.34 Km.h-1
r 0.98
p 0.780
3.6.3.2 Respiratory gas analysis
During Study 2 respiratory gases were analysed using an online gas analysis system, with
samples internally mixed (Metalyzer Sport analyser, Cortex, Leipzig, Germany). Following an
upgrade of equipment, a breath by breath Metalyzer 3B (Cortex, Leipzig, Germany) was used
throughout Studies 3-5. The analyser was pre-warmed for 30 min before a 3-point calibration
was completed prior to every trial. Firstly, a correction was made for barometric pressure,
determined from a portable barometer (Weather Station, Oregon Scientific, Oregon, USA). The
analyser then sampled ambient air and a gas of known concentrations of oxygen and carbon
dioxide (15% O2, 5% CO2 sourced from Brin Oxygen Company), until the software (Metasoft,
Cortex, Germany) identified stabilisation of sensors. Ambient air was sampled from the hot and
humid environment where exercise would take place. Finally, the volume transducer was
calibrated through simulated inspiration and expiration via manual syringe (3L, Hans Rudolph,
Germany) for 5 cycles that elicited an acceptable flow rate between 2-4 L.s-1.
3.6.3.3 Running economy
Ventilatory gases were measured across the exercise protocol breath by breath and
converted into 30 second averages. Running economy was estimated from the oxygen
consumption from the final minute of the first five stages of GXT 1, providing the oxygen
consumption per kilometre, relative to body mass (mL O2.kg-1.km-1) as per Jones (2006). Data
from the sixth, and later stages of GXT 1 were not included to control for the influence of the
VO2 slow component in the calculation of RE.

107
Table 10: Reliability of mean running economy across five stages of GXT 1 in hot and humid
conditions.
Trial 1 Trial 2
n 15 15 Mean 226.9 225.5 mL O2.kg-1.km-1
SD 18.4 17.3 mL O2.kg-1.km-1
TE 6.8 mL O2.kg-1.km-1 TE (CV%) 3.0 95% LOA 18.8 mL O2.kg-1.km-1
Lower/Upper -17.4 20.2 mL O2.kg-1.km-1 r 0.86 p 0.831
3.6.3.4 VO2max
During Study 2 VO2max was calculated as the highest 15 s moving average of oxygen
consumption recorded during GXT 2. A shorter averaging period was adopted due to the short
recovery period between GXT 1 and GXT 2 of 2 min. Recovery was minimal in order to help
ensure both physiological and perceptual effects of cooling would still be present whilst testing
VO2max. Therefore, a shorter averaging period was adopted in order to attenuate a potential
effect on blunted VO2max values. As interventions within Studies 3-5 did not follow the same
time course as cooling, a longer rest period was afforded between GXT 1 and GXT 2.
Consequently, a more conventional 30 s averaging was used during these chapters as per the
recommendations of Saunders and Green (2013) and Jones (1996a).
In accordance with the recommendations of Edvardsen et al. (2014) secondary criteria for
VO2max were adopted, in keeping with recommended criteria for trained athletes (Jones 2006a,
Saunders & Green, 2013). A VO2max, not VO2peak, was accepted when a VO2 plateau (<2 mL.kg-
1.min-1 across two successive 30 s fixed-time averages) was observed. In the absence of a
plateau, a test was deemed maximal if three out of the following four criteria were met; blood
lactate concentration >8 mMol.L-1, HR within 10 beats of age predicted maximum, respiratory
exchange ratio >1.1, and RPE at or above 19 RPE.

108
Table 11: Reliability of VO2max.
Trial 1 Trial 2
n 14 14
Mean 56.6 57.6 mL.kg-1min-1
SD 5.9 5.2 mL.kg-1min-1
TE 2.2 mL.kg-1min-1
TE (CV%) 3.9
95% LOA 6.1 mL.kg-1min-1
Lower/Upper -7.1 5.2 mL.kg-1min-1
r 0.85
p 0.670
3.6.3.5 vVO2max
Velocity at VO2max (vVO2max) was calculated by multiplying VO2max (mL.kg-1.min-1) by 60,
divided by the average running economy as per Jones (2006a).
Table 12: Reliability of vVO2max.
Trial 1 Trial 2
n 14 14
Mean 15.45 15.68 Km.h-1
SD 2.31 2.10 Km.h-1
TE 0.45 Km.h-1
TE (CV%) 2.9
95% LOA 1.25 Km.h-1
Lower/Upper -1.48 1.01 Km.h-1
r 0.96
p 0.780
3.6.4 Blood glucose concentration
Blood glucose concentration was assessed from the same fingertip sample as blood lactate
concentration, as per the procedure previously detailed and using the same YSI 2300 analyser.
The specific reaction that takes place to provide a measure of glucose concentration involves
the oxidation of glucose in the presence of glucose oxidase, producing hydrogen peroxide and
glucono-lactone.
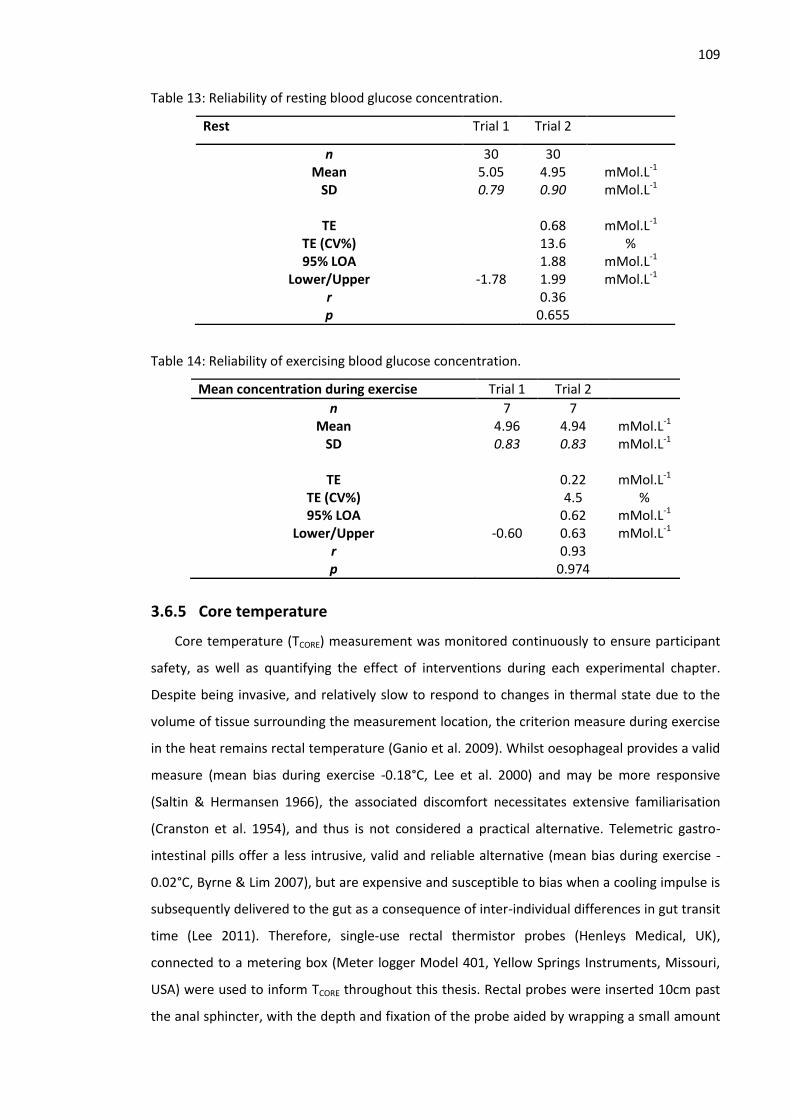
109
Table 13: Reliability of resting blood glucose concentration.
Rest Trial 1 Trial 2
n 30 30 Mean 5.05 4.95 mMol.L-1
SD 0.79 0.90 mMol.L-1
TE 0.68 mMol.L-1 TE (CV%) 13.6 % 95% LOA 1.88 mMol.L-1
Lower/Upper -1.78 1.99 mMol.L-1 r 0.36 p 0.655
Table 14: Reliability of exercising blood glucose concentration.
Mean concentration during exercise Trial 1 Trial 2
n 7 7 Mean 4.96 4.94 mMol.L-1
SD 0.83 0.83 mMol.L-1
TE 0.22 mMol.L-1 TE (CV%) 4.5 % 95% LOA 0.62 mMol.L-1
Lower/Upper -0.60 0.63 mMol.L-1 r 0.93 p 0.974
3.6.5 Core temperature
Core temperature (TCORE) measurement was monitored continuously to ensure participant
safety, as well as quantifying the effect of interventions during each experimental chapter.
Despite being invasive, and relatively slow to respond to changes in thermal state due to the
volume of tissue surrounding the measurement location, the criterion measure during exercise
in the heat remains rectal temperature (Ganio et al. 2009). Whilst oesophageal provides a valid
measure (mean bias during exercise -0.18°C, Lee et al. 2000) and may be more responsive
(Saltin & Hermansen 1966), the associated discomfort necessitates extensive familiarisation
(Cranston et al. 1954), and thus is not considered a practical alternative. Telemetric gastro-
intestinal pills offer a less intrusive, valid and reliable alternative (mean bias during exercise -
0.02°C, Byrne & Lim 2007), but are expensive and susceptible to bias when a cooling impulse is
subsequently delivered to the gut as a consequence of inter-individual differences in gut transit
time (Lee 2011). Therefore, single-use rectal thermistor probes (Henleys Medical, UK),
connected to a metering box (Meter logger Model 401, Yellow Springs Instruments, Missouri,
USA) were used to inform TCORE throughout this thesis. Rectal probes were inserted 10cm past
the anal sphincter, with the depth and fixation of the probe aided by wrapping a small amount

110
of zinc oxide tape at the appropriate depth. The manufacturer stated accuracy and reliability
are ±0.05°C and ±0.01°C respectively between 0-70°C. Table 15 shows the calculated inter-day
reliability of TCORE, based on the data from Studies 1-3 and the control group of Studies 4 and 5.
These data are comparable with those in Table 16, which presents acceptable levels of
reliability and sensitivity for TCORE and TSKIN as reported in the literature, which serve to inform
levels of variation that are currently considered acceptable for measures used in this thesis.
Table 15: Inter-day reliability of TCORE.
Trial 1 Trial 2
n 30 30
Mean 37.07 37.08 °C
SD 0.29 0.27 °C
TE 0.13 °C
TE (CV%) 0.4
95% LOA 0.37 °C
Lower/Upper -0.38 0.37 °C
r 0.77
p 0.930

111
Table 16: Reliability of skin (TSKIN; wired thermistors) and core (TCORE; rectal thermistor) temperature measurement at rest and during exercise.
Legend to Table 16; 1 Harper Smith et al. 2010, 2 Byrne & Lim 2007,
3 Muir et al. 2001,
4 Ganio et al. 2009.
NB. Values are from both temperate and hot environments. Columns from L-R; respective temperature measurement, a battery of relative and absolute reliability statistics with
acceptable levels of error, typical change in the mean to elucidate a statistically significant difference (p<0.05) and finally what magnitude of change may be considered meaningful.
OUTCOME MEASURE RELIABILITY MEASURES Meaningful Δ
Δ mean
(±SI unit)
Pearson
(r)
ICC TEM
(±SI unit)
TEM
(±CV%)
LOA
(±)
TSKIN REST 0.5°C (1)
>0.9 (1)
>0.90 (1)
<0.3 (1)
<1% (1)
. <0.9°C (1)
>0.5°C (1)
EXERCISE 0.5°C (1)
>0.9 (1)
>0.90 (1)
<0.30 (1)
<1% (1)
<0.9°C (1)
>0.5°C (1)
TCORE REST 0.10°C (3)
0.12°C
(4)
>0.94 (4)
>0.97 (4)
<0.1°C (2)
<1.8% (4)
<0.22°C (2)
>0.1°C (3)
EXERCISE 0.10°C (3)
>0.94 (4)
>0.97 (4)
<0.1°C (3)
<1.8% (4)
<0.43°C (4)
>0.1°C (3)

112
3.6.6 Skin temperature
Alongside TCORE measurement, skin temperature (TSKIN) was continuously monitored
through all trials. It is through the skin that the body loses or gains heat and as such, TSKIN plays
an important role in human thermoregulation. The criterion measure for TSKIN are wired
thermistors or thermocouples attached to specified anatomical sites. Following early estimate
that advocated up to 12 sites across the body (Hardy & Du Bois 1938) to develop an estimate of
mean TSKIN, this has been simplified this to 4 sites; the mid-belly of the pectoralis major, biceps
brachii, rectus femoris and gastrocnemius (Ramanathan 1964, see General Methods, Section
3.7.3, Equation 12). Thermistors and thermocouples are non-invasive, but the associated wiring
requires familiarisation and a hard-wired connection to a datalogger, making field testing
problematic. This in turn, limits the external validity of thermal interventions, which are
untested in the field. The recent development of wireless skin thermistors and infrared imaging
techniques may provide alternatives to traditional thermistors, particularly as wireless devices
appear more accurate than wired thermistors (Harper-Smith et al. 2010) and require no
familiarisation. This problem informed the direction of Study 1 (Chapter 4).
Following this initial investigation, the most accurate, reliable and least inhibitive skin
temperature measurement system was chosen for use through all subsequent trials.
Thereafter, skin temperature (TSKIN) was measured via telemetry thermistors (U-Type
connected to Gen II GD38 transmitter, Eltek, UK), attached to the mid-belly of the pectoralis
major, biceps brachii, rectus femoris and gastrocnemius. After shaving surface hair and cleaning
with a sterilizing wipe, thermistors were attached to each site using a film patch. Breathable
film patches (Tegaderm 1632W, 3M, UK) fastened all sensors and ensured thermistors
remained in contact and perpendicular to the skin. The same product was used during all trials
to maintain consistency of any micro-climate effect. Data were transmitted wirelessly from the
transmitter worn on the person, to a datalogger (RX250AL 1000 series Wireless Squirrel Logger,
Eltek). The system was set to sample every 10 seconds and log the mean across 30 seconds.
Accuracy and reliability data for this system is discussed in detail in Study 1 (Chapter 4). Table
16 presented acceptable levels of reliability and sensitivity for TSKIN as reported in the literature,
which serve to inform levels of variation that are currently considered acceptable for the
measures that will be used in this thesis. Table 17 presents data from within this thesis that is
commensurate with the variability in the literature.

113
Table 17: Reliability of resting TSKIN.
Trial 1 Trial 2
n 30 30
Mean 34.36 34.29 °C
SD 0.68 0.587 °C
TE 0.33 °C
TE (CV%) 1.0
95% LOA 0.93 °C
Lower/Upper -0.86 0.99 °C
r 0.73
p 0.687
3.6.7 Heart rate
During Studies 1, 2, 4 and 5 heart rate (HR) was measured through a moistened chest strap
(Polar T30 coded), displayed by short range telemetry on a wrist watch (Polar RS800, Kempele,
Finland). For Study 3, a Cortex Metalyzer SMART Bluetooth HR receiver logged HR continuously
throughout the trial from the same chest strap.
Table 18: Reliability of resting HR.
Trial 1 Trial 2
n 30 30
Mean 56 54 b.min-1
SD 10 9 b.min-1
TE 3 b.min-1
TE (CV%) 5
95% LOA 7 b.min-1
Lower/Upper -5 8 b.min-1
r 0.93
p 0.569
3.6.8 Perceived exertion
Rating of perceived exertion (RPE) encompassing effort, exertion, breathlessness and
fatigue was quantified during exercise using a Borg RPE scale where 6 equals very very light
continuing up to 20 representing maximal work; where 19 is very very hard (Borg 1998). RPE
was recorded at the end of each exercise stage, as a blood sample was being taken, as well as
immediately following cessation of exercise during GXT 2.

114
3.6.9 Thermal sensation
Thermal sensation during rest and exercise was quantified through a thermal sensation
scale whereby 0 represents ‘unbearably cold’, continuing up to 8 representing ‘unbearably hot’
in increments of 0.5 (Gagge et al. 1969). Thermal sensation was recorded at the end of each
exercise stage, as a blood sample was being taken, as well as immediately following cessation
of exercise during GXT 2.
3.6.10 Sweat rate
Sweat rate (L.hr-1) was calculated from the difference in pre and post nude body mass
divided by the individual exercise duration. Body mass was calculated using the same scales as
detailed earlier in Section 3.6.1, General Methods.
3.7 Calculations
3.7.1 Change in Plasma Volume
In Studies 4 and 5 (Chapters 7 and 8), plasma volume change was estimated from measured
haematocrit and haemoglobin concentration.
Equation 10: Change in plasma volume (Dill and Costil 1974). Where ‘A’ represents the first
blood sample and ‘B’ the second.
ΔPV% = 100[HbA (1 - HctB x 10-2)] / [HbB (1 - HctA x 10-2)] – 100
3.7.2 Physiological strain index
Scale of 1-10, whereby TCORE0 and HR0 denote baseline and TCORE1 and HR1 denotes
measurement taken at any time during exercise.
Equation 11: Physiological strain index (Moran et al. 1998)
PSI = [5 * (TCORE1 - Tr
0)* ((39.5 – TCORE0)] + [5 * (HR1 - HRo) * (180-HR0)]
3.7.3 Mean skin temperature
Equation 12: Mean skin temperature (TSKIN) (Ramanathan 1964):
Mean TSKIN = 0.3(TCHEST + TARM) + 0.2(TTHIGH + TCALF)
3.8 Statistical analyses
Prior to data collection the number of participants required for each experimental chapter
was determined using G*Power v3.1 in accordance with established guidelines (Prajapati et al.

115
2010; Suresh & Chandrashekara 2012). Where possible effect sizes were utilised from
published literature that demonstrated similar experimental design and participant
characteristics. Effect sizes were calculated from means and standard deviations where this
was not possible. Estimations of sample size were made based upon conventional α (0.05) and
β (0.20) levels.
All outcome variables were assessed for normality and sphericity prior to further analysis.
Data were analysed in three phases: rest, intervention and exercise. Two way, repeated
measures ANOVA (condition*time) were used to test for differences in primary outcome
variables such as blood lactate indices, respiratory responses, TCORE, TSKIN, PSI, RPE and TS. One
way, repeated measures ANOVA were used to detect differences between singular values such
as VO2max, running time until VO2max during GXT 2, vVO2max and thermoregulatory variables at
rest, where there were more than 2 experimental conditions, with paired samples t-test used
when only two conditions. Where appropriate, Bonferroni adjusted pairwise comparisons
revealed where differences occurred. Data were analysed using SPSS (Version 20, SPSS Inc,
Illinois, USA) with significance set at p<0.05 and the data are presented as means (±SD). Effect
sizes for main effects and interactions are presented as partial eta squared (η2), whilst
differences between two related samples were evaluated through Cohen’s dav in accordance
with (Lakens 2013). Lakens (2013) and other recent articles (Cummings 2013) advise against the
use of parameters around Cohen’s d as they are considered arbitrary, instead recommending
the magnitude of change is compared against other published effects. Additional statistical
techniques are reported in the appropriate chapters.

116
4 Reliability and validity of skin temperature measurement by
telemetry thermistors and a thermal camera during exercise
in the heat
4.1 Abstract
New technologies have afforded convenient modalities for skin temperature (TSKIN)
measurement, notably involving wireless telemetry and non-contact infrared thermometry.
The purpose of this study was to investigate the validity and reliability of skin temperature
measurements using a telemetry thermistor system (TEL) and thermal camera (TC) during
exercise in a hot environment. Each system was compared against a certified thermocouple,
measuring the surface temperature of a metal block in a thermostatically controlled waterbath.
Fourteen recreational athletes completed two incremental running tests, separated by one
week. Skin temperatures were measured simultaneously with TEL and TC compared against a
hard-wired thermistor system (HW) throughout rest and exercise. Post hoc calibration based on
waterbath results displayed good validity for TEL (mean bias [MB] = -0.18°C, typical error [TE] =
0.18°C) and reliability (MB = -0.05°C, TE = 0.31°C) throughout rest and exercise. Poor validity
(MB = -1.4°C, TE = 0.35°C) and reliability (MB = -0.65°C, TE = 0.52°C) was observed for TC,
suggesting it may be best suited to controlled, static situations. These findings indicate TEL
systems provide a convenient, valid and reliable alternative to HW, useful for measurements in
the field where traditional methods may be impractical.
4.2 Introduction
Skin temperature (TSKIN) measurement has application for research (Harper-Smith et al.
2010), occupational health (Kim et al. 2013) and clinical monitoring (Sherman 1996). It is
through the skin that the body loses or gains heat and as such, TSKIN plays an important role in
human thermoregulation. TSKIN is a consequence of dermis microcirculation, which is mediated
through activity of the sympathetic nervous system and regulated by the hypothalamus.
Typically TSKIN may initially reduce during exercise as a consequence of sweat on the skin
surface and blood shifting towards working skeletal muscles (Torii et al. 1992). However, a
steady rise is observed during endurance exercise as core temperature (TCORE) increases, with
elevated ambient temperatures increasing the rate of TSKIN increase (Roberts & Wenger 1979).
Whilst TSKIN may be interpreted in isolation, it also forms a component of derivative calculations
of heat strain, such as body heat content (Jay & Kenny 2007) and mean body temperature (Jay,

117
Reardon, et al. 2007). Such calculations assist in understanding the mechanisms underpinning
practical thermal interventions such as precooling and heat acclimation, by providing an
objective measure of whole-body thermal dynamics.
Typically, TSKIN has been measured using thermocouples or wired thermistors with recent
literature adopting wired thermistors as the criterion measure when validating new tools
(Kelechi et al. 2011, Buono et al. 2007, Burnham et al. 2006). A thermocouple is a temperature-
measuring device consisting of two dissimilar conductors that contact each other at one or
more joint locations. It produces a measureable electrical potential difference proportional to
the temperature difference against another joint, which is set at a reference temperature in
another part of the circuit. Thermistors are resistors in which resistance varies with
temperature, allowing stored calibration data within the circuit to convert this to a
temperature. Such devices have been shown to be robust and accurate to 0.045°C across a
range (10-40°C) of waterbath temperatures (Harper-Smith et al. 2010). Thermistors and
thermocouples are non-invasive, but the associated wiring requires familiarisation and a hard-
wired connection to a datalogger, making field testing problematic. This in turn, limits the
external validity of thermal interventions which are untested in the field.
Recent developments in wireless thermometry provides an alternative to hard-wired
systems, particularly as some telemetry devices appear more accurate than wired thermistors
(Harper-Smith et al. 2010), require little familiarisation and provide freedom of movement for
the person being measured. Harper-Smith et al. (2010) examined wireless iButtons (Maxim
Integrated Products Inc. California, USA) in a waterbath as well as on human skin during
exercise in hot conditions. Typical error was <0.3°C, Pearson and Intra-class correlation (ICC)
coefficients >0.9 and coefficient of variation (CV) <1% when compared against wired
thermistors which were the criterion measure during exercise. The size and convenience of
iButtons undoubtedly affords opportunities for measurements in novel environments, however
the lack of real-time data may preclude their use in safety monitoring and research
environments. Dermal temperature patches for physiological monitoring systems are wireless
and offer live data, but being single-use only, carry significant purchase and consumable costs,
which may prohibit use for large sample sizes. Consequently, a newly-developed telemetry
system, whereby thermistors are connected to a transmitter worn on the person, may offer the
benefits of live data without long, trailing connecting wires or being restricted to the
laboratory.

118
Infrared thermometry is another technique that is used for monitoring TSKIN in research
(Costello et al. 2012) and clinical environments (Ring & Ammer 2012). Thermal cameras receive
and process infrared radiation emitted from a surface, using this information to display the
production and dissipation of heat. The ability of a surface to emit energy by radiation is
termed ‘emissivity’ and allows the temperature of the emitting surface to be calculated.
Thermopiles or microbolometers within the cameras absorb this infrared radiation, eliciting a
change in electrical resistance that a colour palette can use to display temperatures of an
object. Handheld infrared thermometers provide temperature at specific points based on the
same principle, and are widely used for measuring core temperature via the tympanic
membrane as well as increasingly for TSKIN (Ring & Ammer 2012). Measurements from such
devices demonstrate strong association with wired thermistors, providing valid measures of
mean TSKIN at rest (r=0.95) and whilst walking in the heat (r=0.98, Buono et al. 2007). This
technology appears reliable, with mean inter-examiner intraclass correlation of r = 0.88 (range
0.73–0.99) between TSKIN measurements on consecutive days (Zaproudina et al. 2008). The
majority of literature utilising thermal cameras as a measure of TSKIN has involved thermogram
images taken at rest being retrospectively analysed using software to identify area average
temperatures for specified regions of anatomical interest. Measuring temperature across a
region of interest enhances construct validity by helping to avoid inter-individual variation of
veins and vascularisation and the consequential non-uniform heat production, a potential
confounding error when taking readings from a single spot on an image or from attached
thermistors (Chudecka & Lubkowska 2012). Broadly, this technique has been shown to be valid
(correlation range r =0.71-0.77, Roy et al. 2006) and reliable (correlation range r =0.82-0.97,
Selfe et al. 2006), such that it has been recommended for clinical use (Ng et al. 2004; Ring &
Ammer 2012). However, large errors when compared to a thermocouple during rest and
exercise have also been reported (-0.75°C, Fernandes et al. 2014), making it unclear within
which situations it may have application. Recent developments in thermal camera technology
permit high speed imaging, offering a real-time thermal image, such that cameras can produce
whole images for post hoc analysis as well as instantaneous spot analysis. These improvements
allow simultaneous comparison against other TSKIN measures, facilitating an objective
assessment of the potential of thermal cameras as a multi-purpose tool for environmental
exercise physiology research.
Wired thermistors, telemetry thermistors and a thermal camera do not appear to have
been compared simultaneously for live TSKIN measurement during exercise in hot environments.
Therefore, the aim of this study was to compare the reliability and validity of these

119
measurement tools for live TSKIN measurement in athletes exercising in a hot and humid
environment, including subsequent studies within this thesis. It was hypothesised that
telemetry thermistors and a thermal camera would provide acceptable levels of error for both
reliability and validity when compared against hard-wired thermistors during exercise in the
heat.
4.3 Methods
4.3.1 Participants
Fourteen (male) recreational club runners volunteered as participants (mean [±SD]): age 38
(11) years, stature 179 (8) cm, mass 77.3 (7.1) kg, sum of four skinfolds 33.6 (7.7) mm, VO2max
57.3 (4) mL.kg-1.min-1. No contraindications for testing were violated prior to commencing any
experimental session in accordance with previously detailed procedures (General Methods
Section 3.3).
4.3.2 Experimental design
The study was organised into two parts; a waterbath comparison and human skin
temperature measurement during exercise. Both parts of the study assessed validity and
reliability of tools. During the waterbath analysis, data were collected for 20 minutes across
seven stable temperatures within the range 25-40°C. Stability was defined as a deviation of no
more than 0.1°C measured by the criterion thermocouple over 5 min consecutively. Retest
reliability was examined on the following day. In order to assess the measurement tools in a
relevant context for endurance exercise in the heat, an incremental exercise test was
completed on each athlete volunteer. Re-tests of TSKIN measurements were separated by one
week to prevent an acclimation effect (Barnett & Maughan 1993) and taken at the same time
of day (Winget 1985), with the second trial data used for validity analysis.
4.3.3 Measurement tools
During the waterbath tests, measurements from all thermistors and the thermal camera
(TC) were referenced against a multi-point calibrated and certified thermocouple (Type K probe
attached to Fluke 51 ll instrument, range -200°C - +1000°C, divisions 0.1°C, Washington, US).
This thermocouple had been calibrated in a certified laboratory in the last 6 months.
During exercise, the criterion measure comprised of four hard-wired (HW) skin thermistors
(Eltek U-Type EUS-U-VS5-0, Eltek Ltd, Cambridge, UK) connected to a datalogger (Grant Squirrel
1000 series, Grant Instruments, Cambridge, UK). The manufacturer stated accuracy was ±0.2°C.

120
This type of device has been adopted as a criterion during similar validity comparisons (Kelechi
et al. 2011; Buono et al. 2007, Burnham et al. 2006). The telemetry system (TEL) comprised four
skin thermistors (ELEU-U-VS-02-, Eltek U-Type, Eltek Ltd, Cambridge, UK) connected to a
transmitter (Gen II GD38, Eltek, Cambridge, UK, dimensions 6x8x5cm). Data is transmitted
wirelessly to a datalogger (Eltek RX250AL 1000 series Wireless Squirrel Logger, Eltek,
Cambridge, UK), up to a distance of 2 km. The datalogger was placed outside of the
environmental chamber approximately 3 m away. The manufacturer stated accuracy was
±0.1°C. Both dataloggers were synchronised and sampled every 30 s with minute mean logged.
Data were downloaded using Squirrelwire and Darca Plus software for the HW and TEL systems,
respectively. The TC was a FLIR e40BX (Flir tools, Oregon, US) with 160x120 focal plane array,
uncooled microbolometer with thermal sensitivity of <0.045°C at 30°C, 7.5 to 13μm spectral
range, 60 Hz frame rate and a ‘live-view’ colour palette offering multiple spot analysis and area
average functions. The manufacturer stated accuracy was ±2°C or ±2%. Emissivity was set at
e=0.98 in accordance with the data of Steketee (1973).
4.3.4 Procedures
4.3.4.1 Waterbath
All thermistors and the criterion thermocouple (CT) were affixed within a 3cm2 area, each
was separated by 1cm, in the centre of the top surface of a cast iron block (dimensions: 15 x 12
x 12 cm) placed in a waterbath (Fischer Scientific DMU19). Whilst a waterbath allows
comparison of tools throughout a range of temperatures, water is not an appropriate body to
measure using infrared thermometry. Thus, the waterbath provided controlled plateau
temperatures, with the metal block providing the thermal surface for measurements. The
thermal conductivity of iron results in a uniform temperature which helps avoid erroneous
readings from convection currents within a large waterbath. The metal block was submerged to
within 1mm of the surface, which remained dry at all times. Breathable film patches (Tegaderm
1632W, 3M, UK) fastened all sensors and ensured thermistors remained in contact and
perpendicular to the surface. The same patches were used during exercise trials to maintain
consistency of any micro-climate effect (Tyler 2011). Black electrical tape with a known
emissivity of 0.95 marked the TC measurement site.
The camera was mounted one metre above the block, at an angle of 90° to the plane of the
block, with reflected environmental temperature and environmental conditions adjusted
accordingly. The incorporated laser pointer ensured readings were consistently taken from the

121
centre of the designated area. Both dataloggers were set to sample and log temperature values
every minute, with TC and CT temperatures recorded each minute.
4.3.4.2 Exercise test
Upon arrival, participants self-inserted a single-use rectal probe and attached skin
thermistors from both HW and TEL to the mid-belly of the pectoralis major, biceps brachii,
rectus femoris and gastrocnemius on the right of the body, as shown in Figure 26. Thermistors
were attached using a film patch as per the waterbath procedures. Participants completed all
trials in running trainers, sports shorts and without a t-shirt.
Figure 26: showing location of thermistors on chest, upper arm and thigh. Thermal camera
measurements were taken beside the thermistors, ensuring the patches did not interfere with
measurement.
Participants then entered the environmental chamber (TISS, Hampshire, UK) with
conditions (mean [±SD]) 31.9 (1)°C, 61 (8.9)% relative humidity. The trial began with
participants sitting for 40 minutes with measurements taken every five minutes. All thermal
camera measurements were taken handheld, at a distance of 1 m, with the camera at 90° to
the relevant site as per the manufacturer’s instructions. Temperatures were taken from the
spot analysis function, which displays the live temperature of an area within the viewfinder.

122
The measurement site for the thermal camera was 1cm adjacent to the edge of the film patch
fixing the thermistors. This equated to a distance of 3cm between the furthest thermistor and
TC measurement site at each anatomical location. After 40 minutes, a 5 minute warm-up at 8
km.h-1 was completed on a motorized treadmill (Woodway ELG2, Weil am Rhein, Germany)
before participants began an incremental exercise test with starting speed between 8 – 10
km.h-1. Each participant completed five stages of three minutes, with speed increasing by 1
km.h-1. At the end of each stage the participant would straddle the treadmill belt and the
thermal camera would be used to measure TSKIN at each site; the procedure took approximately
30 s. At the end of the test nude body mass was recorded before participants were actively
cooled using a large fan and cold drinks.
4.3.5 Statistical Analyses
4.3.5.1 Waterbath
Linear regression analysis was used to derive correction formulae for each measurement
tool, relative to the criterion thermocouple. In order to develop robust formulae, all data from
both day one and day two of the waterbath were included, which equated to fourteen
temperature measures (seven each day) within the range 25-40°C and two hundred and eighty
data points for each equation. However, statistical analyses were conducted on the measures
of temperatures taken over a typical range of values that would be expected during exercise.
These temperatures were 33°C, 35°C and 38°C. Validity and reliability comparisons were made
on the grouped data for each tool, rather than at each temperature (33, 35, 38°C). Data were
corrected to one decimal place before analysis as CT and TC are precise to 0.1°C whereas HW
and TEL read to 0.01°C. Mean values of the four thermistors in each system are reported,
although data from individual thermistors was adjusted based on CT and the corrected values
used in subsequent analysis. Differences between tools (validity) for raw and corrected data
were investigated using a two way repeated measures ANOVA (correction*tool) with
Bonferroni adjustments.
Additionally, the following battery of relative and absolute reliability statistics was
calculated for each tool; mean bias, typical error of the measure (TEM), calculated from the
standard deviation of the mean difference for each pair of trials using the formula TE =
SD(diff)/√2 and expressed as a mean coefficient of variation (CV), intra-class correlation (ICC) and
limits of agreement (LOA). Reliability comparisons compared waterbath day 1 data against day
2 data. To eliminate variation from the waterbath itself, all of day 2 data were corrected based
on a linear regression equation formed from the two criterion datasets. This prevented a

123
systematic difference between trials, such as the failure to achieve precisely the same plateau
temperature on day 2 which would invalidate reliability analyses of individual tools.
Validity comparisons were completed on waterbath day 1 data. Similar statistics were
calculated for HW, TEL and TC relative to the criterion to assess validity; mean bias, ICC, typical
error of the estimate (TEE), providing standard or typical error of the predicted y-value for each
x, and LOA. Differences between trials for each tool were investigated using two way repeated
measures ANOVA (tool*trial) with Bonferroni post hoc adjustments. Statistical tests were
completed using SPSS 20 (SPSS Inc, Chicago, USA) with significance set at p <0.05 throughout.
Data are presented as mean (±SD).
4.3.5.2 Exercise test
Analysis of TSKIN measurements was conducted on the derivative calculation of mean TSKIN,
using the formula of Ramanathan (1964) (Equation 12, General Methods, Section 3.6.6). Two
way ANOVA (trial*time) with Bonferroni correction were used to identify differences between
exercise trials for each tool (reliability). This included a comparison of the entire dataset from
trial 1 against trial 2 data (main effect trial) to assess whether a systematic change had
occurred between trials which may affect the interpretation of other statistics. A two way
ANOVA (tool*time) was used to identify differences between tools (validity). Sweat rate (L.hr-1)
was calculated from the difference in pre and post nude body mass divided by the individual
exercise duration.
4.3.5.3 Analytical limits
Analytical limits may assist in completing an objective and robust assessment of a measure
(Atkinson & Nevill 1998). Such limits can be predefined on what constitutes a meaningful
physiological change, limits adopted by similar research and the precision of the criterion
thermometer. The a priori analytical limits are shown in Table 19.
Table 19: Analytical limits adopted for both part 1 (waterbath) and part 2 (TSKIN measurement)
of this study. Sig = relative to criterion, with thermocouple the criterion during the waterbath
and hard wired thermistors criterion during exercise.
Δ mean (°C) Sig. TEE/TEM
(°C)
TE
(CV%)
ICC LOA (°C)
Waterbath <0.2 p>0.05 <0.1 <1% >0.9 <0.3
Exercise <0.5 p>0.05 <0.3 <1% >0.9 <0.9

124
Columns left to right; change in mean (Δ mean), statistical difference (Sig), typical error of the
estimate (TEE)/measure (TEM), typical error as a coefficient of variation (TE [CV%]), intraclass
correlation coefficient (ICC) and limits of agreement (LOA).

125
4.4 Results
4.4.1 Waterbath reliability comparison
A difference was observed between all day 1 and all day 2 data (p=0.01), however this did
not remain after day 2 data were corrected based on the differences measured by the criterion
thermocouple (p=0.658) using the correction formula 𝛾 = (1.009 ) - 0.365. The raw data also
displayed differences between days for every tool. After correction, this difference was
eliminated for CT (p=0.124), but remained for all other tools (Table 20).
A summary of reliability comparisons is shown in Table 20. Prior to correction, all tools
displayed a mean bias below 0.2°C. Correction reduced the mean bias for both HW and TEL, but
a small bias remained for TC. Absolute typical error (TEM), relative typical error (CV) and ICC
calculated from the raw data were acceptable against the a priori analytical limits for all tools.
As a linear correction factor was applied to the data, the variation in differences between trials
did not change, so TEM and the associated coefficients of variation remained the same after
correction. Acceptable LOA were observed for TEL, with HW marginally exceeding the limits of
0.3°C and TC displaying the largest range.
Table 20: Reliability of wired thermistors, telemetry thermistors and thermal camera after
correction to account for difference in bath temperature between trials 1 and 2.
Columns left to right; change in mean between trials (Δ mean), statistical difference (Sig), typical
error of the measure (TEM), typical error as a coefficient of variation (TE [CV%]), intraclass
correlation coefficient (ICC) and limits of agreement (LOA). * denotes p<0.001, ‘95% CI’ = 95%
confidence interval.
x
Δ mean (°C)
(95% CI) Sig
TEM (°C)
TE
(CV%) ICC
LOA (°C)
(95% CI)
Analytical limit: <0.2°C p>0.05 <0.1°C <1% >0.9 <0.3°C
Wired -0.10
(-0.15- -0.05)
p=0.005 0.14 0.3 0.996 0.38
(-0.28-0.48)
Telemetry -0.04
(-0.06- -0.02)
* 0.05 0.2 1.000 0.14
(-0.10-0.18)
Thermal
camera
0.14
(0.08-0.20)
* 0.16 0.5 0.996 0.44
(-0.06-0.30)

126
4.4.2 Waterbath validity comparison
Variation in block temperature was low throughout each temperature plateau period with
mean standard deviation across all temperatures below 0.07°C. Indicated water temperature
was greater than displayed by CT for each temperature (block: water, 32.8:34°C, 34.9:37°C,
38.1:40°C). Individual corrections were made to the data of each thermistor. Mean values from
the four thermistors of both HW and TEL systems produced the following equations; HW;
𝛾 =(0.978 ) + 0.484 and TEL; 𝛾 =(1.019 ) - 0.518. The formula used to correct all TC data was
𝛾=(1.146 ) - 3.121. Formulae were derived from the fourteen plateau temperatures and
provided TEE across this range of 0.13°C, 0.13°C and 0.10°C for HW, TEL and TC, respectively.
The largest error for an individual thermistor was 0.18°C, with mean TEE of 0.16°C for HW and
0.14°C for TEL.
Prior to correction, the accuracy of each tool was very close to the manufacturer stated
accuracy and all improved following correction (Table 21). Only TEL displayed a mean bias
below 0.2°C, although HW nearly achieved this, only 0.02°C greater, with uncorrected data
plotted in Figure 27. The largest error was observed for TC, with raw mean bias ten times
greater than the limit. Correction brought all tools within an acceptable level of bias. Significant
differences from CT were observed for all tools in the raw data, but only for HW after
correction (p<0.001), with the corrected data significantly different to the raw data (p<0.001).
After correction, all devices displayed acceptable levels of absolute and relative TEE, whilst
correlations were just below the a priori acceptable limit. Limits of agreement were acceptable
for HW and TEL pre and post correction, with a difference of just 0.01°C preventing TC meeting
this limit.
x x
x
23
25
27
29
31
33
35
37
39
41
43
45
23 25 27 29 31 33 35 37 39 41 43 45
Mea
sure
d t
emp
erat
ure
(°C
)
Reference temperature (°C)
Hard wired thermistors
Telemetry thermistors
Thermal camera

127
Figure 27: Mean uncorrected data from hard-wired, telemetry system and thermal camera
during each waterbath plateau temperature across the range 25-40°C. The dark line represents
the criterion thermocouple (CT) against which thermistors and camera data were corrected.

128
Table 21: Validity of wired thermistors, telemetry thermistors and thermal camera relative to
the criterion thermocouple. Mean values from 33, 35 and 38°C are presented.
Columns left to right; manufacturer stated accuracy, change in mean (Δ mean), statistical
difference (Sig), typical error of the estimate (TEE), typical error as a coefficient of variation (TE
[CV%]), intraclass correlation coefficient (ICC) and limits of agreement (LOA). * denotes
p<0.001, ‘95% CI’ = 95% confidence interval.
4.4.3 Skin temperature reliability at rest and during exercise
Sweat rate did not differ between trials (Trial 1; 1.52 L.hr-1, Trial 2; 1.48 L.hr-1, p=0.726). No
differences in TSKIN were observed between trials (p=0.137) for HW (Figure 28). The HW system
displayed a consistently small mean bias with a mean value of 0.01°C across rest and 0.18°C
during exercise (Table 22). Across the statistics adopted, the largest differences occurred during
the first 20 minutes of rest, with the greatest reliability after 30 minutes of rest. Initially TE was
high (0.53°C), but improved throughout the rest period (mean=0.34°C), reaching 0.2°C after 30
minutes and remaining just above the analytical limit throughout exercise (mean=0.31°C).
Similarly, LOA was initially high (1.47°C after 10 minutes), but acceptable at the end of rest (35
Raw data
Manufacturer
accuracy
(±°C)
Δ mean (°C)
(95% CI)
Sig
TEE
(°C)
TE
(CV%)
ICC
LOA (°C)
(95% CI)
Analytical
limit: <0.2°C p>0.05 <0.1°C <1% >0.9 <0.3°C
Wired 0.2 -0.22
(-0.24 - -0.20)
* 0.07 0.2 0.85 0.13
(-0.35- -0.09)
Telemetry 0.1 0.15
(0.13-0.17)
* 0.07 0.2 0.86 0.16
(0.00-0.31)
Thermal
camera 2
2.01
(1.91-2.10)
* 0.17 0.5 0.99 0.74
(1.26-2.75)
Corrected
Wired 0.2 0.08
(0.05-0.11)
* 0.07 0.2 0.85 0.21
(-0.13-0.29)
Telemetry 0.1 0.02
(0.00-0.04)
p=0.267 0.08 0.2 0.86 0.15
(-0.13-0.17)
Thermal
camera 2
-0.02
(-0.07-0.02)
p>0.99 0.16 0.5 0.86 0.31
(-0.34-0.29)

129
minutes; 0.56°C, mean=0.95°C). This further improved during exercise, with the mean value
0.86°C. Correlation between the trials across rest (r=0.67) and exercise (r=0.62) was low,
although after 30 minutes of the rest period the correlation increased (r=0.84) to a level just
below the predefined limit.
Table 22: Reliability of wired thermistors, telemetry thermistors and thermal camera measuring
skin temperature at rest and during exercise.
Δ mean (°C)
(95% CI) TEM (°C)
TE (CV%)
ICC LOA (°C) (95% CI)
Analytical limit:
<0.5°C <0.3°C <1% >0.9 <0.9°C
HW Rest 0.01 (-0.27-0.29) 0.34 1 0.67 0.95 (-0.95-0.94)
Exercise 0.18 (-0.46-0.09) 0.31 0.88 0.62 0.86 (-0.62-1.09)
TEL Rest 0.10 (-0.22-0.42) 0.38 1.11 0.64 1.04 (-1.14-0.94)
Exercise -0.19 (-0.42-0.04) 0.24 0.7 0.84 0.67 (-0.48-0.87)
TC Rest -0.38 (-0.83-0.07) 0.53 1.58 0.52 1.46 (-1.08-1.85)
Exercise -0.92 (-1.35-0.49) 0.5 1.5 0.56 1.40 (-0.60-2.20)
Columns left to right; change in mean (Δ mean), typical error of the measure (TEM), typical error
as a coefficient of variation (TE [CV%]), intraclass correlation coefficient (ICC) and limits of
agreement (LOA). ‘CI’ = 95% confidence interval.
No main effect between trials was observed (p=0.343) for TEL, however a time*trial
interaction was present (p=0.040) with differences during the final two exercise stages (Figure
28). A small mean bias was observed throughout the TEL trial 2 (-0.05°C) which was within
acceptable limits, as was bias during rest (-0.1°C) and exercise (-0.19°C). Typical error within TEL
was greatest at the start of rest (0.48°C), reducing to 0.29°C after 30 minutes, and remained
low for the remainder of the trial (mean during exercise 0.24°C, overall mean 0.31°C), either
below or very close to the acceptable limit. As with HW, despite overall correlation for the
entire protocol being below 0.9 (r=0.74), points of strong agreement were observed for TEL, in
particular during exercise with correlation coefficients of r=0.89, 0.95 and 0.96 for the final
three stages.
A main effect was observed between trials (p=0.023) for TC reflecting a systematic
difference from trial 1 to trial 2. Similarly, a trial*time interaction was observed (p=0.001) with
differences in TC identified from the second exercise stage and continuing to the end of the
130
trial (Figure 28). Agreement was poor for all statistics with none consistently meeting the
acceptable limits (Table 22). A large negative bias was observed throughout trial 2 (-0.65°C).
Figure 28: Mean (±SD) reliability of wired thermistors, telemetry thermistors and thermal
camera measuring skin temperature. “R” = rest, “Ex” = exercise. “*” denotes a difference
between trials (p<0.05).
31
32
33
34
35
36
37
31
32
33
34
35
36
37
Skin
tem
per
atu
re (
°C)
Trial 1 Trial 2
31
32
33
34
35
36
37
R 10 R 20 R 25 R 30 R 35 Ex 3 Ex 7 Ex 11 Ex 15 Ex 18
Protocol phase and time (mins)
C – Thermal Camera
B – Telemetry
A – Hard-wired

131
4.4.4 Skin temperature validity comparison
A main effect for tool (p=0.002) was observed with differences between HW and TEL
(p=0.03) and HW and TC (p=0.007). A tool*time interaction effect (p<0.001) was also observed.
A tabular report detailing individual differences is shown in Table 23. The TEL system showed
good agreement with HW throughout the protocol. Mean bias was consistently low (mean: -
0.18°C), achieving the predefined limit. This is supported by low mean typical error (0.18°C) and
strong correlation (r=0.92). Similarly, mean LOA are narrow and within the acceptable limits
(0.39°C). Unlike TEL, TC did not show good agreement with HW. A large bias was recorded
throughout rest (-0.87°C) and exercise (-1.92°C) phases. Typical error consistently exceeded the
limits and correlations were low throughout the trial (mean r=0.45). These errors translated
into large limits of agreement, consistently above the predefined limit (1.30°C).

132
Table 23: Tabular report of validity comparisons between hard wired thermistors, telemetry thermistors and thermal camera at rest and during exercise.
Rest 1 Rest 2 Rest 3 Rest 4 Rest 5 Exercise 1 Exercise 2 Exercise 3 Exercise 4 Exercise 5
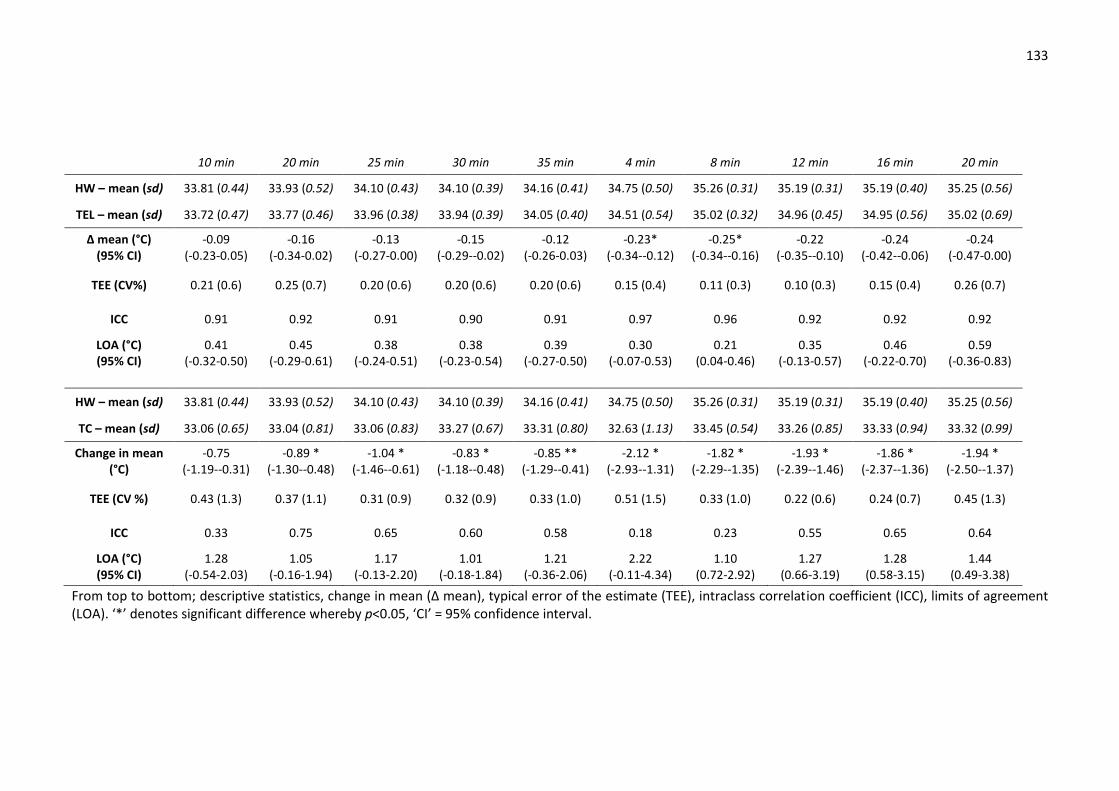
133
From top to bottom; descriptive statistics, change in mean (Δ mean), typical error of the estimate (TEE), intraclass correlation coefficient (ICC), limits of agreement (LOA). ‘*’ denotes significant difference whereby p<0.05, ‘CI’ = 95% confidence interval.
10 min 20 min 25 min 30 min 35 min 4 min 8 min 12 min 16 min 20 min
HW – mean (sd) 33.81 (0.44) 33.93 (0.52) 34.10 (0.43) 34.10 (0.39) 34.16 (0.41) 34.75 (0.50) 35.26 (0.31) 35.19 (0.31) 35.19 (0.40) 35.25 (0.56)
TEL – mean (sd) 33.72 (0.47) 33.77 (0.46) 33.96 (0.38) 33.94 (0.39) 34.05 (0.40) 34.51 (0.54) 35.02 (0.32) 34.96 (0.45) 34.95 (0.56) 35.02 (0.69)
Δ mean (°C) (95% CI)
-0.09 (-0.23-0.05)
-0.16 (-0.34-0.02)
-0.13 (-0.27-0.00)
-0.15 (-0.29--0.02)
-0.12 (-0.26-0.03)
-0.23* (-0.34--0.12)
-0.25* (-0.34--0.16)
-0.22 (-0.35--0.10)
-0.24 (-0.42--0.06)
-0.24 (-0.47-0.00)
TEE (CV%) 0.21 (0.6) 0.25 (0.7) 0.20 (0.6) 0.20 (0.6) 0.20 (0.6) 0.15 (0.4) 0.11 (0.3) 0.10 (0.3) 0.15 (0.4) 0.26 (0.7)
ICC 0.91 0.92 0.91 0.90 0.91 0.97 0.96 0.92 0.92 0.92
LOA (°C) (95% CI)
0.41 (-0.32-0.50)
0.45 (-0.29-0.61)
0.38 (-0.24-0.51)
0.38 (-0.23-0.54)
0.39 (-0.27-0.50)
0.30 (-0.07-0.53)
0.21 (0.04-0.46)
0.35 (-0.13-0.57)
0.46 (-0.22-0.70)
0.59 (-0.36-0.83)
HW – mean (sd) 33.81 (0.44) 33.93 (0.52) 34.10 (0.43) 34.10 (0.39) 34.16 (0.41) 34.75 (0.50) 35.26 (0.31) 35.19 (0.31) 35.19 (0.40) 35.25 (0.56)
TC – mean (sd) 33.06 (0.65) 33.04 (0.81) 33.06 (0.83) 33.27 (0.67) 33.31 (0.80) 32.63 (1.13) 33.45 (0.54) 33.26 (0.85) 33.33 (0.94) 33.32 (0.99)
Change in mean (°C)
-0.75 (-1.19--0.31)
-0.89 * (-1.30--0.48)
-1.04 * (-1.46--0.61)
-0.83 * (-1.18--0.48)
-0.85 ** (-1.29--0.41)
-2.12 * (-2.93--1.31)
-1.82 * (-2.29--1.35)
-1.93 * (-2.39--1.46)
-1.86 * (-2.37--1.36)
-1.94 * (-2.50--1.37)
TEE (CV %) 0.43 (1.3) 0.37 (1.1) 0.31 (0.9) 0.32 (0.9) 0.33 (1.0) 0.51 (1.5) 0.33 (1.0) 0.22 (0.6) 0.24 (0.7) 0.45 (1.3)
ICC 0.33 0.75 0.65 0.60 0.58 0.18 0.23 0.55 0.65 0.64
LOA (°C) (95% CI)
1.28 (-0.54-2.03)
1.05 (-0.16-1.94)
1.17 (-0.13-2.20)
1.01 (-0.18-1.84)
1.21 (-0.36-2.06)
2.22 (-0.11-4.34)
1.10 (0.72-2.92)
1.27 (0.66-3.19)
1.28 (0.58-3.15)
1.44 (0.49-3.38)

134
4.5 Discussion
Assessing novel tools in a controlled, static environment as well as ecologically valid
situations allows objective assessments of measurement accuracy and interpretation of
meaningful change. A telemetry thermistor system (TEL) offers a technologically similar, but
more convenient option to traditional hard-wired systems. Thermal cameras (TC) measure the
emitted infrared radiation from a body, permitting live non-contact infrared measurements,
but have not previously been assessed across a range of running speeds in a hot, humid
environment. The aim of this study was to compare the validity and reliability of these
measurement tools when measuring TSKIN whilst resting and running in a hot and humid
environment. As expected, hard-wired thermistors (HW) demonstrated good agreement with
the criterion thermocouple (CT) during the initial waterbath comparison and were reliable
between trials. The TEL system demonstrated the smallest error and greatest agreement with
CT during static waterbath measurement. This system also performed well when measuring
TSKIN at rest and during exercise, displaying the least error and largest correlations between
trials, as well as the strongest agreement with the criterion suggesting it is appropriate for use
within environmental physiology research. The thermal camera also demonstrated a small
error during the waterbath measures, although a large systematic bias was detected. Using the
current protocol, the camera did not perform as well as the other devices when providing live,
handheld measurements of TSKIN during exercise and is not recommended for use in this
manner, as it has a tendency to under-read during exercise which presents safety implications.
4.5.1 Waterbath validity comparison
The correction of collected data based on a criterion measure has been advocated by previous
research (Harper-Smith et al. 2010). This in-house calibration procedure is time consuming and
requires specialist equipment, but is relatively inexpensive and the differences between raw
and corrected data in this study suggest it is worthwhile when accurate results are required.
Furthermore, completing this process prior to subsequent human testing will assist in
partitioning error into biological, environmental and random error, incorporating the
equipment error itself. Prior to correction, overall reliability from both HW and TEL was
acceptable based on the predefined analytical limits (Table 19). Such limits were adopted based
on what constitutes a meaningful physiological change, the limits adopted by similar research
and the precision of the criterion thermometer. Of particular note was the mean bias (2°C) and
LOA (0.74°C) observed in TC, which despite meeting the manufacturer stated accuracy, far
exceeds the acceptable error (0.2°C) for safe and meaningful measurements of TSKIN. Although

135
TC over-estimated across all waterbath temperatures, a heteroscedastic trend is observed with
the greatest errors occurring at the highest temperatures (Figure 27). Within the range
assessed, the indicated water temperature was above that measured by CT. Despite being
setup in accordance with manufacturer’s guidelines, it is possible TC partially detected water
temperature rather than solely the metal block. Thermal cameras are usually calibrated by
taking readings on an electronically heated black body and corrected as necessary. The purpose
of the waterbath was not to calibrate the tools, but to allow a simultaneous comparison of all
tools to facilitate a communal correction to help detect differences. This method was adopted
given the traditional method for thermistor comparison was inappropriate for including TC and
following correspondence with the TC manufacturer. These data may indicate a limitation for
TC when measuring against a background which is hotter than the object in question. These
errors were minimised after correction, such that TC accuracy was acceptable in terms of mean
bias, no significant difference and low CV. Other statistics were extremely close to acceptable
limits.
4.5.2 Waterbath reliability comparison
Data collected during trial 2 of the waterbath analysis were corrected based on the
differences observed by the criterion between trials. This was necessary due to a difference
between plateau temperatures (0.1°C, p<0.001) on day two. Correction allowed the remaining
differences to be attributed to the tools themselves rather than the waterbath conditions. The
correction reduced the mean bias for all tools and eliminated the significant difference
between trials for HW, but not for TEL and TC. However, significance testing alone does not
preclude a device from being considered reliable or valid, which is why a battery of statistics
was completed. When a significant difference is identified, it is typically the magnitude of this
difference that is relevant to the end user (Hopkins et al. 2009). Cohen’s d effect sizes state
these differences to be trivial. Therefore, where a significant difference was observed, in the
context of the accepted limits the difference was not critical. TEL was the most reliable tool,
achieving all other a priori limits, both with the raw and corrected data. Wired thermistors and
TC failed to meet the acceptance levels for TE and LOA, however both displayed low mean bias,
strong correlations and low CV, so were deemed to have performed reliably.
4.5.3 Skin temperature validity comparison
During rest and exercise HW recorded a consistently higher temperature than TEL and TC.
However, there was strong agreement between HW and TEL, with all a priori limits achieved,
meaning TEL can be considered a valid measurement tool. Conversely, TC showed poor

136
agreement and could not be considered valid for measurement of TSKIN using this method or
similar conditions with an error of 2°C potentially affecting mean body temperature by 0.4°C
(Jay & Kenny 2007).
During exercise, both TEL and TC recorded lower temperatures than HW, despite reading
higher during the waterbath. The mean difference from HW for TEL was small (-0.18°C) with
the largest difference during exercise (-0.25°C) still within predefined acceptable limits (<0.3°C).
In the context of previous research on TSKIN measurements, such differences appear very small,
with Harper-Smith et al. (2010) reporting differences of 0.26-1.36°C between thermistors and
iButtons. Furthermore, when retest variation of both HW and TEL are considered, this
difference becomes negligible and may not even exist. Such results may afford opportunities to
measure TSKIN in extreme environments using TEL with the receiver unit not needing to be
connected to the exercising individual. Until now, the potential for this type of research has
been limited by the need for trailing wires when using HW systems.
However, the differences observed in TSKIN from TC were sizeable. Utilising TC in a dynamic,
ecologically valid situation is in contrast to the techniques adopted in the majority of previous
research with thermal cameras that has shown broadly encouraging results (Merla et al. 2010;
Ferreira et al. 2008; Chudecka & Lubkowska 2012), albeit not unanimously (Fernandes et al.
2014). Specifically, tripod mounted cameras have been used to generate thermograms of
participants who have spent up to 40 minutes in thermo-neutral conditions. Thermograms are
then analysed post hoc using area averages to identify temperatures within specific anatomical
regions. For an exercise physiologist, the problem with such an approach is the lack of real-time
data upon which decisions can be made. Consequently, the rationale for including TC in this
study was to examine whether TC could provide accurate and reliable data through the live-
view function during an exercise test. Johnstone et al. (2012) also reported poor validity of an
IR sensor within a physiological monitoring system that provided live data during exercise in the
heat. Despite an acceptable mean bias (0.49°C), they reported a large random error with the
LOA range -1.36-4.14°C. There are a range of difficulties associated with exercise that may
explain the erroneous readings in both studies and why these findings differ from previous
research that has successfully used this technology. A fundamental difference between
thermistor and IR measurement techniques is covering of the measurement site. Thermistors
were attached using breathable film patches, which may lessen a micro-climate effect relative
to other fixation methods, but may still over-estimate relative to uncovered skin (Tyler 2011).
Whilst secure fixation for thermistors is necessary to minimise small angular changes during
exercise, the precise angle and distance of IR measurements in both studies was not fixed,
137
which could lead to increased measurement error (Hershler et al. 1992). An aim of this study
was to assess tools taking live measurements in an ecologically valid setting. As such, a widely
used incremental, discontinuous protocol was completed which permitted short, but regular
measurement opportunities at the end of each stage. Temperatures at four body sites were
required in approximately 30 s and although precautions were taken, some variation in angle
between measurements is to be expected. The short measurement period prevented ensuring
that the skin was completely dry for measurements. Protocol sweat rates were approaching 2
L.hr-1, which compromised drying the skin and completing measurements within the permitted
time. Water may alter the emissivity of the skin, so causing the camera to under-read; a trend
observed not only here, but by Johnstone et al. (2012). Further, the effect of the waterbath
correction procedure on subsequent exercising values should be considered. As previously
mentioned, TC may have partially detected the surrounding water temperature, rather than
simply the metal block, resulting in over-estimation of values. In this instance the correction
formula may be inaccurate, falsely suggesting TC under-estimated during exercise. However, as
a linear correction was applied to the data, the high levels of random error TC displayed
throughout TSKIN measurements remain an obstacle for dynamic use.
Modifications to the TC protocol are required if accurate results are going to be yielded
from such a test. Subsequent pilot testing (unpublished data) suggests improved accuracy is
possible with this model of camera when camera positions are fixed and longer periods of time
are available for measurements to be taken. When transferring tools to applied situations, a
compromise must be made between maximising measurement accuracy and maintaining
ecological validity of the protocol. Consequently, whilst TC may still have a role to play in static,
controlled situations within environmental physiology, using the current protocol it cannot be
considered a valid alternative to either of the thermistor systems for live monitoring of TSKIN
during exercise.
4.5.4 Skin temperature reliability comparison
The reliability of both thermistor systems was acceptable throughout the exercise tests,
whilst TC again displayed large errors. The lack of difference in sweat rate between trials would
indicate that TC did not under-read as a consequence of an adaptation eliciting a greater sweat
response from the heat exposure during trial 1. Moreover, allowing 7 days between trials is
likely to have prevented this effect (Barnett & Maughan 1993). The graphs for both HW and TEL
(Figure 28) display converging means throughout the rest period, with dissociation during the
latter part of exercise, which is when skin wettedness is likely to be greater as body

138
temperature increases. This supports the need for a long stabilisation period and suggests that
temperature differences occurred as exercise intensity rises. Reduced reliability is associated
with challenges to homeostasis and this occurs throughout incremental tests where thermal
equilibrium is never achieved. Other literature has made comparisons during steady-state
exercise (Buono et al. 2007; Harper Smith et al. 2010), so the small differences observed may
be a characteristic of this test and the reliability of all tools may improve when examined under
similar circumstances.
In conclusion, a telemetry thermistor system offers a valid and reliable alternative measure
of skin temperature to traditional hard-wired thermistors. Such a system may provide for
convenient and wireless data collection, allowing ecologically valid measurements to be taken
in the field. Thermal cameras may still be useful tools for measuring skin temperature in static
and controlled environments, however their use is not recommended for live monitoring
during exercise.

139
5 Physiological responses to incremental exercise in the heat
following internal and external precooling
The initial investigation compared different skin temperature measures and identified
telemetry thermistors as the most suitable device for use through the subsequent
investigations. With there being limited understanding of the effect heat has on the
determinants of endurance performance, this study will investigate the efficacy of two
prominent acute, precooling strategies, previously untested during endurance running, for
enhancing the determinants of endurance performance in the heat. For this experiment the
same participants were used as in Chapter 4, with data collection occurring simultaneously.
5.1 Abstract
Twelve males completed three incremental, discontinuous treadmill tests in the heat (31.9
[1.0]°C, 61.9 [8.9]%) to determine speed at two fixed blood lactate concentrations (2 & 3.5
mMol.L-1), running economy (RE) and maximum oxygen uptake (VO2max). Trials involved 20 min
of either internal cooling (7.5 g.kg-1 ice slurry ingestion, ICE) or mixed-methods external cooling
(EXT, cold towels, forearm immersion, ice vest and cooling shorts), alongside a no intervention
control (CON). Following precooling, participants ran 0.3 km.h-1 faster at 2 mMol.L-1 and 0.2
km.h-1 faster at 3.5 mMol.L-1 (p=0.04, partialη2=0.27). Statistical differences were observed
versus CON for ICE (p=0.03, d=0.15), but not EXT (p=0.12, d=0.15). There was no effect of
precooling on RE (p=0.81, partialη2=0.02), nor on VO2max (p=0.69, partialη2=0.04). A main effect
for cooling on physiological strain index was observed (p<0.01, partialη2=0.41), with differences
versus CON for EXT (p=0.02, d=0.36), but not ICE (p=0.06, d=0.36). Precooling reduced thermal
sensation (p<0.01, partialη2=0.66) in both cooling groups (p<0.01). Results indicate ICE and EXT
provide similar physiological responses for exercise up to 30 min duration in the heat. Differing
thermoregulatory responses are suggestive of specific event characteristics determining the
choice of cooling. Precooling appears to reduce blood lactate accumulation and reduce
thermoregulatory and perceptual strain during incremental exercise.
5.2 Introduction
Endurance exercise is underpinned by the ability to transfer chemical energy into a given
exercise velocity (Coyle 1999). The status of this biological process can be assessed using
physiological markers such as the lactate thresholds, running economy (RE) and maximum
oxygen uptake (VO2max). Under normothermic conditions, when combined with the velocity at
VO2max (vVO2max), these markers have been shown to account for 97.8% of the variation in 16

140
km run time (McLaughlin et al. 2010). McLaughlin et al. (2010) highlighted that VO2max
accounted for 90.2% of variation in running time in a group with hetergenous VO2max values.
Furthermore, Lorenzo et al. (2011) has shown the lactate turnpoint (LTP) to be a strong
predictor of time trial performance in both cold (r =0.89) and hot (r =0.87) environments.
The addition of heat stress during endurance running is characterised by an enhanced
metabolic (Parkin et al. 1999), cardiovascular (González-Alonso et al. 2008) and sensory strain
(Villanova et al. 1997) as core temperature (TCORE) increases. Furthermore, the consequential
heat strain is associated with reductions in the LTP (Lorenzo et al. 2011) and VO2max (Nybo et al.
2014). The reduction in LTP in the heat is of particular importance given it remains a valid
predictor of endurance performance in hot environments (Lorenzo et al. 2011). This decline
may be associated with the shift towards carbohydrate oxidation (Fink et al. 1975; Parkin et al.
1999) and the increased blood lactate concentration observed during heat strain (Hargreaves
2008). At maximal exercise intensities, VO2max is attenuated due to increased skin blood flow
required for heat dissipation, which leads to a reduction in stroke volume as a consequence of
cutaneous pooling, and ultimately limits muscular blood flow and oxygen delivery (Gonzalez-
Alonso et al. 2008). Enhanced oxygen consumption has also been reported during heat strain
(Consolazio et al. 1973), although not all studies observed this effect (Gonzalez-Alonso et al.
1999). Furthermore, during prolonged or intense endurance exercise, a protective reduction in
central nervous system (CNS) motor output may be observed as core temperature approaches
40°C (Cheung 2007). Thus, thermal interventions such as precooling that reduce body
temperature thereby increasing heat storage capacity or reducing the rate of heat storage,
have been shown to benefit endurance exercise in the heat.
A dichotomous approach towards precooling is apparent, with interventions either cooling
externally or internally, eliciting different skin, core and muscle temperatures and therefore
potentially different physiological responses. The attenuated LTP in the heat may be in part a
consequence of increased muscular glycolysis (Fink et al. 1975; Parkin et al. 1999), an alteration
in muscle metabolism that external body cooling has previously been shown to mediate
(Kozłowski et al. 1985; Hsu et al. 2005). Therefore, an external precooling technique may help
reduce plasma lactate accumulation and could have an effect on LTP. Similarly, by reducing
TCORE, internal cooling may reduce the cutaneous circulation that can inhibit cardiac filling,
thereby ameliorating cardiovascular strain that ultimately causes a reduction in VO2max.
Therefore, accurately quantifying any differences in the responses to different types of cooling
is important to optimise cooling strategies.

141
The vast number of cooling techniques reflects the challenge of providing a large cooling
impulse through a technique that remains practical for use across a number of venues.
Considerable growing evidence supports the use of internal cooling through ice slurry ingestion
(ICE) as an ergogen for endurance exercise in the heat (Jones et al. 2012; Siegel & Laursen
2012; Wegmann et al. 2012). In addition to increasing heat storage capacity, direct cooling of
sensitive thermoreceptors within the splanchnic region may contribute to a reduced perceived
thermal strain (Villanova et al. 1997). Further, visceral cooling may preserve splanchnic flow
that reduces during heat strain (Rowell et al. 1968) as well as prevent against endotoxin
leakage that has been associated with impaired muscle force generation (Supinski et al. 2000)
and exertional heat illness (Sawka et al. 2011). ICE typically elicits a substantial reduction in
TCORE of 0.3-0.6°C (Siegel et al. 2010; Siegel et al. 2012) and has been shown to aid time trial
performance in the heat, improving a 40 km laboratory cycle by 6.5% compared with no cooling
(Ihsan et al. 2010). ICE appears to permit similar running time to exhaustion as the gold
standard technique of cold water immersion (Siegel et al. 2012), with recent systematic reviews
advocating ICE to avoid impracticalities with water immersion (Jones et al. 2012; Siegel &
Laursen 2012; Ross et al. 2013) Moreover, ICE is a simple strategy that may complement
hydration and nutritional strategies during competition in the heat (Ross et al. 2011).
From an exogenous perspective, mixed method whole body external cooling (EXT) is
gaining prominence following the apparent limited effectiveness of individual cooling garments
on endurance performance (Ranalli et al. 2010; Jones et al. 2012). Duffield et al. (2009)
combined cooling garments to enhance the cooling volume and reported a blunted rise in TCORE
during exercise, resulting in increased work during 30 min of intermittent sprinting. External
cooling may not always elicit a reduction in TCORE prior to exercise (Minett et al. 2011; Minett, et
al. 2012), but appears to permit a reduced rate of heat storage during exercise by enhancing
heat dissipation through an increased core-to-skin gradient (Kay et al. 2010). The reduced TSKIN
will also lead to reduced vasodilation of peripheral capillary beds, potentially lowering
cardiovascular (CV) strain. Cooling of the skin may be an important mediator of thermal
sensation (Schlader, Simmons et al. 2011b) and has been associated with a 6% increase in self-
selected exercise intensity during a 30 min cycling trial when an initial reduction in TCORE was
not observed (Kay et al. 1999). Minett et al. (2011) has subsequently identified a dose-
dependent response with skin cooling surface area coverage as the critical factor for exercise
capacity, adopting a mixed methods approach to increase total work during intermittent
sprinting in the heat, compared with no cooling (Minett et al. 2011, Minett et al. 2012). As with
ICE, EXT is a simple and practical technique, however it has yet to be assessed prior to

142
endurance running or on the physiological markers that are strongly associated with endurance
exercise, such as the determinants of endurance performance derived from a graded exercise
test.
The aim of this study was to compare the physiological responses to practical and
evidenced internal and external precooling techniques through the markers of lactate
thresholds, RE and VO2max. The first hypothesis stated both precooling techniques would
increase lactate threshold, improve running economy and increase VO2max, relative to no
cooling. The second hypothesis stated internal cooling would elicit the greatest improvement
within these markers when compared to EXT due to the magnitude of TCORE reduction, and the
size of effects previously reported for this technique.
5.3 Method
5.3.1 Participants
Twelve male recreational club runners volunteered as participants (mean [±SD]): age 38
(11) years, stature 177.8 (7) cm, mass 76.1 (5.7) kg, sum of four skinfolds 32.6 (7.1) mm, VO2max
57.5 (4) mL.kg-1.min-1. All participants trained at least three times per week and met the
training status criteria defined in the General Methods (Section 3.2). No contraindications for
testing were violated prior to commencing any experimental session in accordance with
previously detailed procedures. (General Methods, Section 3.3).
5.3.2 Experimental design
A randomised controlled design was used with each participant performing experimental trials
under three conditions; control (no cooling, CON), internal cooling (ice slurry ingestion, ICE) and
external cooling (mixed methods, EXT). Four trials, each comprising of two graded exercise
tests during each visit were completed, with the first trial serving as a familiarisation. The
subsequent three trials were completed in a randomised order, separated by 7-10 days. An
overview of each trial is provided in Figure 29. Briefly, trials comprised four phases; 10 min rest,
20 min precooling, 5 min warm-up and then the graded exercise tests (GXT 1 and GXT 2), with
the entire trial within a hot and humid environment (31.9 (1.0)°C, 61 (8.9)% relative humidity).
In order to replicate a competition schedule, the exercise test began 15 min after cooling.

143
Figure 29: Protocol overview. Entire protocol completed in hot environment. ‘GXT 1’ involved 3
min exercise stages with increments of 1km.h-1. ‘GXT 2’ denotes gradient based test to
exhaustion incorporating 1 min stages with increments of 1%.
5.3.3 Cooling interventions
During ICE, participants ingested 7.5 g.kg-1 body mass of ice slurry (-1°C) during the cooling
phase. Such a volume has previously been shown to elicit large reductions in TCORE without
inducing gastrointestinal distress (Siegel et al. 2012). Of this volume, the drink consisted of two
thirds shaved ice using a snow cone maker (JM Posner, Watford, UK) and one third diluted
drinking cordial (High Juice, 7.3 g carbohydrate per 100 ml of diluted drink, Tesco Stores Ltd,
Cheshunt, UK ). This cordial is a non-carbonated syrup made from fruit juice, water and
carbohydrate, that was diluted one part cordial to four parts water. Slurry was dispensed in
equal amounts every five min over the 20 min precooling period to prevent gastrointestinal
discomfort, with total drink volumes typically between 500-600 ml.
During EXT, participants were cooled using the manoeuvre adopted by Minett et al. (2011).
This involved wet, iced towels covering the head and neck, forearm and hand immersion in cold
water (9°C), an ice vest on the torso (Artic Heat, Queensland, Australia) and ice packs affixed to
the quadriceps using cooling shorts as shown in Figure 30. Towels were swapped after 10 min
and hand immersion water temperature was actively maintained throughout. During EXT and
CON, the same volume of squash was provided to match the sugar intake between all
conditions, with the drink delivered to the hot environment from an normothermic laboratory
(21°C), following a 15 min stabilisation to room temperature.

144
Figure 30: Mixed methods external cooling involving cooling shorts, hand immersion, ice vest
and cold towel around the head and neck.
5.3.4 Graded exercise tests
Following rest and precooling phases in the environmental chamber, a five min warm-up
was completed. The exercise test is described in the General Methods (Section 3.4). Briefly, the
test comprised two parts; GXT 1 was a submaximal incremental speed protocol, followed by
GXT 2; an incremental gradient protocol to volitional exhaustion. Starting speeds were between
8–10 km.h-1 (1% gradient), with each participant completing 6-8 stages, using speed increments
of 1 km.h-1. The first capillary sample was taken 18 min after hand immersion ceased, of which
8 min was exercise. Following a 2 min rest, GXT 2 began at a speed 2 km.h-1 below the previous
final speed with gradient increasing by 1% each min and continuing until volitional exhaustion.
5.3.5 Physiological measures
During the familiarisation trial, anthropometric data were collected for stature, body mass
and a four site skin fold calliper assessment, as described in the General Methods. During all
trials, following confirmation of euhydration, participants self-inserted a rectal probe and had
skin thermistors attached as previously described. Heart rate (HR), TCORE, TSKIN, rating of
perceived exertion (RPE,) and thermal sensation were noted every five min during rest and
precooling and at the end of each stage during exercise.
The following physiological responses were calculated; lactate thresholds, running
economy (RE), maximum oxygen consumption (VO2max) and velocity at VO2max (vVO2max) as
previously described (General Methods, Section 3.6.3). Ventilatory gases were measured using
30 s averaging from the final min of each stage to provide RE, ventilation (VE) and respiratory

145
exchange ratio (RER). Mean running economy across the first 5 exercise stages is presented,
although the data from each individual stage was used for analysis. During the VO2max test, the
highest 15 s moving average recorded represented VO2max. A shortened data averaging
approach was adopted due to the short recovery period between the two parts of the test to
attenuate a potential effect on blunted VO2max values. Recovery between GXTs was minimal in
order to help ensure both physiological and perceptual effects of cooling would still be present
whilst testing VO2max.
5.3.6 Statistical Analyses and Derivative Calculations
Derivative calculations of mean TSKIN and PSI, as well as estimations of sweat rate, were
calculated as previously described in General Methods, Section 3.7. All outcome variables were
assessed for normality and sphericity prior to further analysis. Data were analysed in three
phases: rest, cooling and exercise. Two way, repeated measures ANOVA (cooling type*time)
were used to test for differences in blood lactate indices, respiratory responses, TCORE, TSKIN, PSI,
RPE and TS. One way, repeated measures ANOVA were used to detect differences in VO2max,
running time until VO2max during GXT 2, vVO2max, thermoregulatory variables at rest, sweat rate,
absolute change during cooling and change during exercise.
5.4 Results
5.4.1 Physiological responses
A main effect of cooling condition on running speed was observed across both fixed lactate
concentrations (F=3.78, p=0.04, partial η2=0.27). Mean values at 2 mMol.L-1 were ICE 12.3(1.1)
km.h-1, EXT 12.3(1.1) km.h-1, CON 12.0(1.1) km.h-1 and at 3.5 mMol.L-1, ICE 13.8(1.0) km.h-1, EXT
13.8(1.0) km.h-1, CON 13.6(1.0)km.h-1. Bonferroni comparisons identified a difference between
ICE and CON (p=0.03, d=0.15), but not between EXT and CON (p=0.12, d=0.15), or between ICE
and EXT (p>0.99, d<0.001). The mean blood lactate response is displayed in Figure 31, whilst
lactate and oxygen uptake during GXT 1 are plotted in Figure 32. There was no effect of cooling
on RE (ICE 231[18] mL.kg-1.km-1, EXT 230[17] mL.kg-1.km-1, CON 228[13] mL.kg-1.km-1, p=0.79,
partial η2=0.02), nor for VO2max (ICE 57.5[5.6] mL.kg-1.min-1, EXT 58.4[4.7] mL.kg-1.min-1, CON
57.3[4.9] mL.kg-1.min-1, p=0.69, partial η2=0.04). No statistical difference in running time until
exhaustion during GXT 2 was observed (p=0.707, partial η2=0.03). The mean running time of
both precooling groups was greater than CON (368(79) s, ICE 375(57) s, EXT 381(73) s) which
equated to a 5.0% (d=0.11) following ICE and 6.4% (d=0.17) difference following EXT. Times for
EXT were 1.6% (d=0.08) greater than ICE. No statistical difference was found in vVO2max (p=0.49,
partial η2=0.08), although speed after EXT (15.4[1.3] km.h-1, ICE 15.0[1.4] km.h-1, CON 15.0[1.7]

146
km.h-1) equated to a 3.2% difference versus CON (d=0.26) and a 3.0 % (d=0.31) difference
versus ICE. Speed following ICE was not different to that of CON (-0.2%, d=0.02). No differences
in heart rate (p=0.81, partial η2=0.20) were observed between groups; CON 146(16) b.min-1, ICE
145(15) b.min-1, EXT 143(15) b.min-1.
Figure 31: Mean (±SD) lactate response over six incremental sub-maximal exercise stages, with
error bars displaying standard deviation. Each stage constituted 3 min exercise and 1 min blood
sampling, with increments of 1 km.h-1. Horizontal dotted line indicates blood lactate
concentration of 2 mMol.L-1 from which individual running speeds were calculated to represent
lactate threshold. All participants completed a minimum of 6 stages, with some participants
completing additional stages before displaying blood lactate concentrations exceeding 3.5
mMol.L-1. A main effect for cooling type was observed (p=0.04, partial η2=0.27), with
differences identified between CON and ICE.
0.0
0.5
1.0
1.5
2.0
2.5
3.0
3.5
4.0
4.5
Rest 3 7 11 15 19 23
Blo
od
lact
ate
(mM
o.L
-1)
GXT 1 total time (min)
CON ICE EXT

147
Figure 32: Mean (±SD) blood lactate versus oxygen uptake during GXT 1. Horizontal dotted line
indicates blood lactate concentration of 2 mMol.L-1 from which individual running speeds were
calculated to represent lactate threshold. Error bars represent one standard deviation.
No differences were observed throughout the submaximal exercise test in either VE (mean
across exercise; CON 85.6[12.5] L.min-1, ICE 85.0[12.5] L.min-1, EXT 85.0[11.6] L.min-1, p=0.90,
partial η2=0.01) or RER (mean across exercise; CON 0.97[0.03], ICE 0.97[0.03], EXT 0.98[0.06],
p=0.44, partial η2=0.08) were observed across six exercise stages. Similarly, no interaction
effects were observed for VE (p=0.149, partial η2=0.131) or RER (p=0.11, partial η2=0.16).
5.4.2 Thermoregulatory responses
Figure 33A illustrates mean TCORE data for each condition. After the 10 min rest period there
were no differences between conditions (CON 37.13[0.23]°C, ICE 37.18[0.25]°C, EXT
37.13[0.31]°C, p=0.43, partial η2=0.08). During the cooling phase, an interaction between
cooling type and time was observed (F=25.86, p<0.001, partial η2=0.70). Ice slurry ingestion
resulted in a greater reduction in TCORE (-0.32[0.11]°C) than EXT (-0.05[0.08]°C, p<0.001, d=2.97)
and CON (-0.05[0.07]°C, p<0.001, d=3.03). No main effect for cooling type during exercise was
found (p=0.13, partial η2=0.17), although a trend towards a higher TCORE for CON is apparent.
The failure to detect an effect for cooling type may be explained by the presence of a cooling
type*time interaction (F=4.38, p=0.01, partial η2=0.29). As shown in Table 24 the overall change
in TCORE across the exercise phase was greatest during ICE (1.34[0.27]°C) compared with EXT
0.5
1.0
1.5
2.0
2.5
3.0
3.5
4.0
4.5
32 34 36 38 40 42 44 46 48 50 52
Blo
od
lact
ate
(m
Mo
.L-1
)
VO2 (mL.kg-1.min-1)
CON ICE EXT
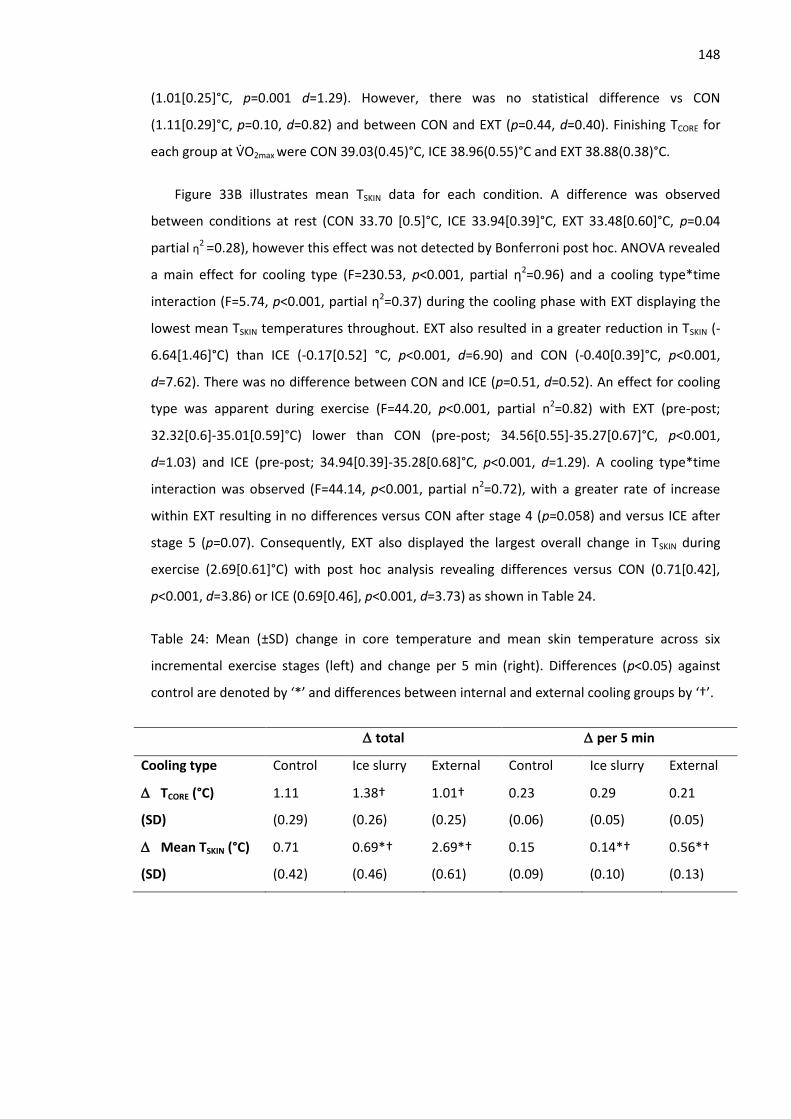
148
(1.01[0.25]°C, p=0.001 d=1.29). However, there was no statistical difference vs CON
(1.11[0.29]°C, p=0.10, d=0.82) and between CON and EXT (p=0.44, d=0.40). Finishing TCORE for
each group at VO2max were CON 39.03(0.45)°C, ICE 38.96(0.55)°C and EXT 38.88(0.38)°C.
Figure 33B illustrates mean TSKIN data for each condition. A difference was observed
between conditions at rest (CON 33.70 [0.5]°C, ICE 33.94[0.39]°C, EXT 33.48[0.60]°C, p=0.04
partial η2 =0.28), however this effect was not detected by Bonferroni post hoc. ANOVA revealed
a main effect for cooling type (F=230.53, p<0.001, partial η2=0.96) and a cooling type*time
interaction (F=5.74, p<0.001, partial η2=0.37) during the cooling phase with EXT displaying the
lowest mean TSKIN temperatures throughout. EXT also resulted in a greater reduction in TSKIN (-
6.64[1.46]°C) than ICE (-0.17[0.52] °C, p<0.001, d=6.90) and CON (-0.40[0.39]°C, p<0.001,
d=7.62). There was no difference between CON and ICE (p=0.51, d=0.52). An effect for cooling
type was apparent during exercise (F=44.20, p<0.001, partial n2=0.82) with EXT (pre-post;
32.32[0.6]-35.01[0.59]°C) lower than CON (pre-post; 34.56[0.55]-35.27[0.67]°C, p<0.001,
d=1.03) and ICE (pre-post; 34.94[0.39]-35.28[0.68]°C, p<0.001, d=1.29). A cooling type*time
interaction was observed (F=44.14, p<0.001, partial n2=0.72), with a greater rate of increase
within EXT resulting in no differences versus CON after stage 4 (p=0.058) and versus ICE after
stage 5 (p=0.07). Consequently, EXT also displayed the largest overall change in TSKIN during
exercise (2.69[0.61]°C) with post hoc analysis revealing differences versus CON (0.71[0.42],
p<0.001, d=3.86) or ICE (0.69[0.46], p<0.001, d=3.73) as shown in Table 24.
Table 24: Mean (±SD) change in core temperature and mean skin temperature across six
incremental exercise stages (left) and change per 5 min (right). Differences (p<0.05) against
control are denoted by ‘*’ and differences between internal and external cooling groups by ‘†’.
total per 5 min
Cooling type Control Ice slurry External Control Ice slurry External
TCORE (°C)
(SD)
1.11
(0.29)
1.38†
(0.26)
1.01†
(0.25)
0.23
(0.06)
0.29
(0.05)
0.21
(0.05)
Mean TSKIN (°C)
(SD)
0.71
(0.42)
0.69*†
(0.46)
2.69*†
(0.61)
0.15
(0.09)
0.14*†
(0.10)
0.56*†
(0.13)

149
Figure 33A: Mean (±SD) core temperature response B: Mean (±SD) skin temperature response
across protocol. ’*’ denotes difference between Ice slurry and Control, ‘#’ denotes difference
between External and Control, ‘†’ denotes difference between Ice slurry and External (p<0.05).
Error bars represent one standard deviation.
An effect for cooling on PSI during exercise was observed (F=6.91, p=0.005, partial η2=0.41),
with differences between CON (CON 5.2[1.6]) and EXT (4.6[1.6], p=0.02, d=0.36), and a non-
significant trend for ICE (4.58[1.8], p=0.058, d=0.36). A cooling type*time interaction was also
observed (F=3.98, p=0.01, partial η2=0.26) due to different rates of increase between groups,
with trends displayed in Figure 34. Sweat rates did not differ between groups (F=2.00, p=0.16,
36.6
36.9
37.2
37.5
37.8
38.1
38.4
38.7
T CO
RE
(°C
) *# * *
25
26
27
28
29
30
31
32
33
34
35
36
REST COOL COOL COOL COOL W/UP 0 3 7 11 15 19 23
Mea
n T
SKIN
(°C
)
GXT 1 total time (min)
*# †# †# †# # †# †# †# †#
A
B

150
partial η2=1.66) with groups means as follows; (mean [±SD], percentage of body mass); CON
1.4(0.7) L.hr-1 (1.2%), ICE 1.6(0.6) L.hr-1 (1.4%) and EXT 1.6(0.5) L.hr-1 (1.4%).
Figure 34: Mean (±SD) physiological strain index across 6 incremental exercise stages. ‘*’
denotes difference (p<0.05) between internal vs control and ‘†’ denotes difference between
external vs control. Error bars represent one standard deviation.
5.4.3 Perceptual measures
Thermal sensation did not differ after 10 min rest, between trials (F=0.897, p=0.422, partial
η2=0.075). A main effect for cooling type was observed in thermal sensation (F=59.422, p<0.01,
partial η2=0.844), as well as an interaction effect (F=3.549, p=0.004, partial η
2=0.0244). Both
EXT and ICE lowered thermal sensation relative to CON, whilst EXT was also lower than ICE, as
shown in Figure 35. Precooling reduced thermal sensation during exercise (F=20.98, p<0.01,
partial η2 = 0.66) with CON (6.2 [0.8]) higher than ICE (5.7 [0.9], p=0.005, d=0.50) and EXT (5.4
[0.8], p<0.001, d=0.98). However, this reduction did not remain throughout exercise, evidenced
by a cooling type*time interaction effect (F=4.98, p<0.001, partial η2 =0.31). No differences in
RPE (F=1.96, p=0.54, partial η2=0.06) were observed between groups.
1
2
3
4
5
6
7
8
9
3 7 11 15 19 23
Ph
ysio
logi
cal s
trai
n in
dex
GXT 1 total time (min)
Control Ice slurry External
*†
*†
*†
†

151
Figure 35: Mean (±SD) thermal sensation across rest, precooling and exercise phases of each
condition. There were no differences at rest. Statistical differences were observed across all
subsequent time points for internal vs control, external vs control and internal vs external,
aside of the first cooling measure where internal did not differ from control. Statistical symbols
removed for clarity. Error bars represent one standard deviation.
5.5 Discussion
The aims of this study were to compare the physiological responses from internal and
external precooling methods during graded exercise tests in the heat. In accordance with the
first hypothesis, both precooling interventions resulted in modest improvements in running
speeds at fixed blood lactate of 2 and 3.5 mMol.L-1 compared with no cooling. However, in
contrast to the second hypothesis, no differences in running economy or VO2max were observed.
Furthermore, no difference in the physiological responses between ICE and EXT were found
despite a larger pre-exercise reduction in TCORE following ICE. Finally, there were different
thermoregulatory responses from the cooling techniques, suggesting specific event
characteristics will determine the choice of cooling.
5.5.1 Effects of cooling
In this study, fixed blood lactate concentrations of 2 and 3.5 mMol.L-1 were used to represent
the lactate threshold and lactate turnpoint, respectively (Saunders & Green 2013). This
approach accounted for differences in the number of stages completed, removed subjectivity
of experimenter identification and provided precision to less than 1 km.h-1. ICE displayed a
statistically significant greater running speed across both markers relative to CON, whilst a
trend was observed for EXT. Such differences may be important given LTP remains a valid
predictor of endurance performance in the heat (Lorenzo et al. 2011). Both precooling
0.0
1.0
2.0
3.0
4.0
5.0
6.0
7.0
8.0
REST Cool Cool Cool Cool Ex S1 Ex S2 Ex S3 Ex S4 Ex S5 Ex S6
Ther
mal
sen
sati
on
CON INT EXTUnbearably hot
Very hot
Hot
Warm
Neutral
Cool
Cold
Very cold
Unbearably cold

152
techniques displayed the same mean difference to CON at 2 (+0.3 km.h-1) and 3.5 mMol.L-1
(+0.2 km.h-1), as well as the same overall effect size. As a result, a magnitude based inference
statistical approach may conclude that both interventions had the same effect on lactate
indices (Hopkins et al. 2009). Such changes in blood lactate response following precooling are
small and likely fall at the upper end of what may be considered day to day variation of 0.2
mMol.L-1 for this type of test (Saunders & Green 2013), possibly as a consequence of
differences in muscle glycogen status (Yoshida 1984). However, the modest differences
observed were consistent throughout the 23 min trial and appear proportional to previously
reported reductions in blood lactate, relative to the TCORE reduction from hand cooling during
exercise. During 1 hour cycling at 60% VO2max, Hsu et al. (2005) reported a ~-0.5 mMol.L-1
reduction in blood lactate concentration, when TCORE was ~-0.6°C lower. Furthermore, this
constitutes a 2% improvement in running speed at the lactate threshold, which may be
meaningful as it exceeds the 1.5% coefficient of variation for speed at lactate threshold
(Hopkins et al. 2001). For this participant cohort, when running at lactate turnpoint pace, such
a difference would equate to 31 s over 5 km. Figure 32 illustrates the lactate VO2 relationship
during GXT 1 and provides some further evidence of a trend towards precooling eliciting a
modest effect on the lactate thresholds during this test. The lack of difference in ventilation or
RER suggests that under this level of heat strain cooling directly elicits an effect on lactate
production or clearance rather than an altered VO2 in the muscle. This is supported by the
apparent mediated metabolic strain not observed through improved running economy in the
heat. Despite competing demands for cardiac output for both exercising skeletal muscle and
cutaneous vasodilation, it is apparent that muscular blood flow is maintained at submaximal
intensities (Nybo et al. 2014; Gonzalez-Alonso et al. 2008). Therefore, any changes in lactate
are unlikely to be explained by cooling eliciting alterations in muscular blood flow. Rather, as
thermoregulatory strain leads to a reduction in visceral circulation during exercise (Rowell et al.
1968), it is more likely that by directly cooling TCORE, ICE may elicit a heat sink away from the
skin and maintain the rate of lactate-pyruvate conversion in the liver. Similarly, by substantially
lowering TSKIN, EXT may also reduce cutaneous blood flow, thereby preserving splanchnic
circulation and enhancing lactate clearance. An increase in splanchnic blood flow during
exercise has previously been proposed as a mechanism to explain the enhancement in LTP
following heat acclimation (Lorenzo et al. 2010). It should be noted that the alterations in the
lactate response occurred at moderately elevated levels of TCORE, with mean TCORE 38.3°C in CON
after 23 minutes of graded exercise. Thus these results warrant an investigation into whether a
greater effect of cooling on lactate occurs when individuals are hotter, and where metabolic
alterations would be expected to be more pronounced.

153
Running economy incorporates both biomechanical as well as physiological parameters and
is thought to account for differences between elite athletes who display similar VO2max values
(Bassett & Howley 2000). Despite indications that precooling may benefit some determinants
of RE such as oxygen uptake (Lee & Haymes 1995), stride length (Folland et al. 2006) and
neuromuscular function (Siegel et al. 2011), no differences were found, supporting the results
of Winke and Yates (2008) who examined RE following ice slurry precooling. Thus, beneficial
effects of precooling do not appear to present through improved RE whilst exercising for
relatively short durations in the heat.
Despite evidence that maximum oxygen consumption is attenuated in the heat (Lorenzo et
al. 2011), cooling had no effect on subsequent VO2max. González-Alonso and Calbet (2003) have
demonstrated that under heat stress, cardiac output and mean arterial pressure reduce at
maximal exercise intensities, leading to a reduction in skeletal muscle blood flow. Thus, a cooler
body would be expected to mediate the decline in VO2max under heat stress through reducing
competition for blood flow and maintaining cardiac output and mean arterial pressure for
longer. Such a mechanism is supported by the maintenance of skeletal muscle blood flow and
VO2max in thermoneutral, relative to hot, conditions (Périard et al. 2011). However, it would
appear that thermometric effects of both cooling techniques were no longer present at the
point of VO2max, as evidenced by the similar finishing TCORE between cooling techniques. The
time-course of the current protocol shares similarities with many athletic events whereby a
precooling intervention must occur prior to a warmup, with individuals completing 24-32 min
of exercise, which may culminate in an all-out end-spurt. It remains plausible however, that
cooling may still elicit an effect on VO2max if a greater cooling impulse is provided or VO2max is
measured during a shorter duration protocol.
Interestingly, despite reductions in body temperature and thermal sensation following both
cooling methods, relative to control, RPE remained unchanged. This may indicate that
enhanced performance in the heat and associated pacing adjustments following precooling are
closer linked to thermal sensation rather than overall perceived exertion. Such a relationship
could have implications for future cooling techniques more aggressively targeting locations that
determine thermal sensation.
5.5.2 Responses to internal and external precooling
The physiological responses from each cooling technique were similar, with neither ICE nor
EXT having an effect on VO2max or RE, and the magnitude of the effect on lactate similar
between techniques. Although a small mean difference suggests an enhanced vVO2max
154
following EXT, no statistical difference between treatments was observed. Further, whilst a
change of 3.2% (0.4 km.h-1) in EXT compared with ICE and CON could be interpreted as
meaningful, this change is below what has been suggested to constitute a meaningful
difference of 0.5 km.h-1 (Billat & Koralsztein 1996). Therefore, it would appear that the estimate
of the maximum speed that can be maintained by oxidative phosphorylation is similar,
irrespective of cooling method.
Although both precooling manoeuvres produced a similar, lowered PSI throughout the trial,
there were markedly different thermoregulatory responses which may determine application.
Whilst ICE resulted in a 0.3°C reduction in TCORE, in keeping with other literature (Ihsan et al.
2010; Ross et al. 2011; Siegel et al. 2012), EXT did not elicit a reduction in TCORE. This is not
uncommon following external cooling techniques, as an ‘after-drop’ may be observed whereby
TCORE remains unchanged during cooling, before falling at the start of exercise as
vasoconstriction dissipates and warm blood from the core is subsequently cooled in the
periphery. Whilst an after-drop was not observed through a reduction in TCORE, the rate of
increase in TCORE during exercise following EXT was smaller than both ICE and CON. The lack of
an after-drop may be attributable to differences in the time-course and intensity of exercise
following cooling compared with other research (Kay et al. 1999). Similarly, Duffield (2009) did
not report a reduction in TCORE following EXT and subsequently observed a reduced TCORE
throughout exercise. Both Uckert & Joch (2007) and Duffield et al. (2010) have reported
performance benefits following external cooling techniques that did not elicit an initial
reduction in TCORE, as greater pace may be achieved through a reduced rate of heat storage or
TSKIN. Such a lower TSKIN may be associated with reduced thermal discomfort (Gagge & Gonzalez
1974) and appears to be a key mediator of behavioural thermoregulation, contributing towards
a greater selected intensity during self-paced prolonged exercise (Schlader, Simmons, et al.
2011a). Indeed, the size of reduction in thermal sensation relative to CON was greatest
following EXT as shown in Figure 35, in accordance with a reduced TSKIN. Previous research
suggests ICE affects performance through an enhanced absolute heat storage capacity that
prevents or delays CNS motor drive reduction, again permitting greater exercise intensity,
relative to not being cooled (Siegel et al. 2011). In addition to an enhanced capacity for storing
heat, functional magnetic resonance imaging has indicated that thermoreceptors within the
splanchnic region may activate pleasure centres of the brain, possibly leading to a deceptive
effect concerning overall thermal strain (Guest et al. 2007). The current results may suggest
splanchnic thermoreceptors are less sensitive than those on the skin in order to alter thermal
sensation. However, the lack of a self-paced performance test within the current study limits

155
the extrapolation of findings to endurance performance, therefore future research should
investigate how a reduced thermal sensation following EXT transfers into running speed during
self-paced protocols relative to ICE.
Similar trends in the TCORE response were observed by Siegel et al. (2012) during fixed
intensity exercise, whereby ICE produced a faster rise in TCORE relative to cold water immersion,
the rise from which was in turn slower than a no cooling control condition. Sawka et al. (2012)
suggested that cooling the core without a concurrent reduction in TSKIN decreases the core-to-
skin gradient, impairing the ability to dissipate heat to environment. Such an interaction
between the rates of rise in TCORE indicates ICE would be better suited to shorter duration
endurance events, with the rate of heat storage during EXT making it also appropriate for
longer duration exercise. Future research should consider combining ICE and EXT to increase
heat storage capacity and promote a reduced rate of heat storage during exercise. Techniques
may be utilised sequentially in order not to impair heat dissipation through a reduced core-to-
skin gradient, however time constraints within competition may necessitate concurrent use if
such an additive effect exists.
In conclusion, internal and external precooling induced similar improvements in the lactate
thresholds, whilst neither altered RE or VO2max during incremental treadmill exercise up to 30
minutes. However, different thermoregulatory responses from the cooling techniques are
suggestive of specific event characteristics determining the choice of cooling. Internal cooling
may be limited to shorter duration events whilst external cooling may remain appropriate for
exercise over 30 min due to the reduced rate of heat storage. Finally, precooling appears to
reduce blood lactate accumulation in the heat and reduce thermoregulatory and perceptual
strain during incremental exercise.

156
6 Ischaemic preconditioning does not alter the determinants
of endurance running performance in the heat.
Study 2 compared two prominent acute, precooling interventions and did not observe large
effects across the determinants of endurance performance. This study will investigate the
effect of another acute, but non-thermal, intervention on the determinants. Ischaemic
preconditioning has been shown to enhance endurance performance, but has not yet been
adopted in the heat.
6.1 Abstract
Ischaemic preconditioning (IP) has been shown to be ergogenic for endurance performance
in normothermic conditions, potentially through haemodynamic and/or metabolic
mechanisms. Exertional hyperthermia is characterised by competition for blood flow between
the muscles and skin, an enhanced metabolic strain and impaired endurance performance. This
study investigated the effect of IP on the determinants of endurance performance, through an
incremental exercise test in the heat. Eleven males completed two experimental trials in the
heat (32°C, 62% RH), preceded by 4x5 min bouts of occlusion, at either 220 (IP) or 50 mmHg
(CON). IP did not improve running speeds at fixed blood lactate concentrations of 2 and 4
mMol.L-1 (p=0.828), or affect blood glucose concentration throughout the trial (mean [±SD];
CON–5.03 [0.94] mMol.L-1, IP–5.47[1.38] mMol.L-1, p=0.260). There was no difference in VO2max
(CON-55.5[3.7] mL.kg-1min-1, IP 56.0[2.6] mL.kg-1min-1, p=0.436), running economy (CON–222.3
[18.0] mL.kg-1.km-1, IP–218.9 [16.5] mL.kg-1.km-1, p=0.125), or total running time during graded
exercise (CON–347[42] s, IP–379[68] s, p=0.166). The IP procedure did not change muscle
temperature (CON ∆= 0.55[0.57]°C, IP ∆=0.78[0.85]°C, p=0.568), but did reduce TCORE during
exercise (~-0.1°C, p=0.001). IP does not appear to offer any benefit across the determinants of
endurance performance in the heat.
6.2 Introduction
Repeated bouts of occlusion and reperfusion, termed ischaemic preconditioning (IP),
are established within clinical practice to prepare cardiac muscle for subsequent stresses
arising from surgically induced hypoxia, infarction and reperfusion (Hausenloy & Yellon 2008).
Skeletal muscle may also be exposed to modest exercise-induced arterial hypoxemia and
ischaemic threat (Noakes 2000). Therefore, this simple, acute intervention has been utilised
prior to a range of exercise protocols and shown to offer meaningful improvements in both

157
high intensity and endurance events (Salvador et al. 2015), as well as different environmental
conditions (Foster et al. 2014).
Of note, Crisafulli et al. (2011) reported a 4% increase in maximal power output and a
~40 s increase in total exercise time during an incremental cycling test to exhaustion
immediately following IP, whilst de Groot et al (2010) observed a 3% increase in VO2max
alongside a 1.6% increase in maximal power output during incremental cycling. In swimming, it
has been suggested IP may provide a particular benefit as a consequence of the relative
exercise-induced hypoxia that occurs as a result of specified breathing patterns (Noakes 2000),
leading to a decreased arterial partial pressure of oxygen and decreased blood pH (Craig 1986;
Sharp et al. 1991). Accordingly, Jean-St-Michel et al. (2011) reported a meaningful and
statistically significant 0.7 s improvement in 100m swim time (-1.1%, p=0.02) following IP,
improving personal best times within a highly trained cohort. Few studies have considered
endurance running, however Bailey et al. (2012a) reported lower blood lactate concentration
(mean difference -1.07 mMol.L-1) throughout an incremental submaximal running test,
although no subsequent effect on VO2max was observed. This was followed by improved 5 km
running time with a mean improvement of-34 s (2.5%, p=0.03), highlighting the potential for
use prior to endurance running. Exercising in extreme environments may also elicit a
heightened physiological strain and as such, IP has been shown to be beneficial under hypoxia
(Foster et al. 2011; Foster et al. 2014), but has yet to be adopted under heat stress.
Early investigations concerning the protective effects of IP before surgery suggested
the artificially induced metabolic stress provided cellular protection through a heat shock
protein response (Marber 1994). However, Bushell and Klenerman (2002) observed no change
in heat-shock protein content following IP and highlighted the need for a relatively acute and
transient stress to elicit protection, which is not in keeping with stimulating the expression of a
transcribed protection factor. Bushell and Klenerman (2002) have mimicked the protective
effects of IP through adenosine infusion. Adenosine may proffer beneficial clinical and
exertional effects by acting as a vasodilator (Gustafsson et al. 1993), and/or opening potassium
(KATP) channels, which in turn preserves energy (Pang et al. 1997; Cohen et al. 2000), possibly
through reduced mitochondrial oxygen consumption (Cooper & Brown 2008). There is also
likely an effect of IP in promoting endothelial nitric oxide biosynthesis (Kimura et al. 2007),
which appears to maintain vascular function that may be impaired following high intensity
exercise (Bailey et al. 2012b). In turn, this maintains the supply of oxygen and energy
substrates, whilst removing metabolites during exercise, affording the ability to exercise at a
greater %VO2max. The opening of KATP channels may present a more efficient muscular action,

158
facilitating greater work to be completed for the same energy expenditure (Crisafulli et al.
2011; Pang et al. 1995), although De Groot et al. (2010) did not observe differences in power
output and oxygen consumption at submaximal intensities. Clevidence et al. (2012) speculated
that IP appears to be effective when an ischaemic event is most likely and may require a
minimum metabolic stress to be achieved during the exercise bout to be effective during
exercise. Thus, extreme environmental conditions such as heat stress and hypoxia (Foster et al.
2014), higher intensity exercise (Crisafulli et al. 2011) and/or activities such as running (Bailey
et al. 2012a) and swimming (Jean-St-Michel et al. 2011), that elicit significant physiological
strain, warrant investigation. In addition to haemodynamic and metabolic mechanisms, IP may
influence afferent feedback, facilitating a greater self-selected exercise intensity due to a
desensitising of group III and group IV afferents (Sharma et al. 2015).
Accordingly, environmental heat stress provides an additional stressor to exercise
performance (Galloway & Maughan 1997). Indeed, endurance running in the heat is
characterised by a myriad of physiological perturbations (Nybo et al. 2014), including
competition for blood flow between the muscles and skin as individuals become hyperthermic
(Gonzalez-Alonso et al. 2008), as well as metabolic alterations including increased blood lactate
production, carbohydrate oxidation and glycogen depletion (Hargreaves 2008). Collectively,
such alterations contribute towards the widely reduced exercise duration and intensity during
exercise under heat stress (Nybo et al. 2014), whilst an increase in glycogenolysis may have
implications for prolonged exercise or regular training in the heat (Hargreaves 2008).
Mechanisms underpinning the shift towards carbohydrate metabolism may relate to
compromised blood flow due to enhanced skin blood flow for thermoregulation, a Q10 effect
upon glycolysis enzymes and/or elevated plasma adrenaline levels (Febbraio 2001). Therefore,
preserving muscle blood flow during exercise in the heat may ameliorate some of these
metabolic changes. Alongside these changes, the lactate turnpoint (Lorenzo et al. 2011) and
VO2max (Nybo et al. 2014) are impaired in the heat, markers which help determine endurance
performance, when combined with running economy. These changes are significant given that
the lactate turnpoint (LTP) remains a strong predictor of time trial performance in hot
environments (Lorenzo et al. 2011) and VO2max may be the best individual predictor of
performance, explaining 90.2% of the total variance in a 16-km run (McLaughlin et al. 2010).
Through effecting a change in muscle blood flow and/or mitochondrial function, it is possible
that IP could help to mediate some of these metabolic changes in the heat, and maintain
markers such as LTP and VO2max, thereby reducing the fractional utilisation of VO2max during
endurance performance in the heat. Theoretically therefore, IP may be an appropriate acute

159
intervention for athletes to consider, in addition to traditional techniques such as precooling
(James et al. 2015; Randall et al. 2015) and heat acclimation (Gibson et al. 2015; Mee et al.
2015; Willmott et al. 2016), that seek to alleviate the significant impairment to endurance
performance afforded by heat stress (Guy et al. 2015).
This study investigated the effect of IP across a range of submaximal and maximal
physiological markers through the determinants of endurance performance model (Bassett &
Howley 2000) during incremental exercise in the heat. It was hypothesised that IP would
ameliorate the decline in the lactate turn-point and VO2max during endurance running in the
heat, providing potential as a simple, acute ergogenic technique for use prior to competition.
6.3 Methods
6.3.1 Participants
Eleven male, recreational club runners volunteered as participants (mean [±SD]): age
37 (12) years, stature 178.3 (5.9) cm, mass 74.4 (6.1) kg, sum of four skinfolds 25.1 (3.3) mm,
VO2max 57.6 (3.2) mL.kg-1.min-1. All participants trained at least three times per week and had
run a sub 22 min 5 km in the previous month (mean [±SD] 20:06 [1.0] min), as defined in the
General Methods (Section 3.2). No contraindications for testing were violated prior to
commencing any experimental session in accordance with previously detailed procedures
(General methods, Section 3.3). Hydration status was assessed upon arrival via urine osmolality
and urine specific gravity, in accordance with the General Methods (Section 3.6.2)
6.3.2 Experimental Design
A repeated measures, crossover design was used to investigate the effect of a brief
period of remote IP on the determinants of endurance performance in the heat, with two
conditions; IP and control (CON). All participants undertook a prior, cooler familiarisation trial
(24°C, 50% relative humidity [RH]), containing no treatment, before two experimental trials in
the heat (32°C, 60% RH).
6.3.3 Ischaemic Preconditioning
In both IP and CON trials, whilst in the supine position, participants were fitted with automated
tourniquet thigh cuffs (10 x 30 cm), positioned around the upper thigh of both legs. Each leg
was exposed to 5 min of occlusion, 220 mmHg (IP) or 50 mmHg (CON), followed by 5 min of
reperfusion and rest for 4 consecutive cycles, as has previously been shown to be effective
(Jean-St-Michel et al. 2011; Bailey et al. 2012a). An overview of the preconditioning protocol

160
and subsequent graded exercise test (GXT) is shown in Figure 36. The occlusion pressure of 220
mmHg was chosen following pilot testing to identify the limb occlusion pressure when blood
flow ceased within the popliteal artery, utilising Doppler ultrasound (Shenzhen Delicate
Electronics Co. Ltd., Shenzhen, China) and is supported by similar IP literature (Bailey et al.
2012a; de Groot et al. 2010). Occlusion pressure for the group was between 160-170 mmHg,
therefore 220 mmHg ensured the pressure was at least 50 mmHg above systolic blood
pressure.
Figure 36: Protocol overview. The entire protocol was completed in a hot environment. ‘R’ and
‘L’ represent occlusion of right and left legs, respectively. ‘GXT 1’ denotes 3 min exercise stages
with increments of 1km.h-1. ‘GXT 2’ denotes gradient based test to exhaustion, incorporating 1
min stages with increments of 1%.
In order to preserve participant naivety and control for a Hawthorne effect during the
second part of the exercise test (GXT 2), participants were informed the study was investigating
the optimal pressure of an intervention that had the potential to be ergogenic in both
conditions. At the end of each trial standardised questions were used to ascertain how
convincing the placebo had been. Blood flow data of the popliteal artery collected during pilot
testing, and published literature (Gibson et al. 2013), identified 50 mmHg as an appropriate
control pressure, as it provides a sensation of pressure, without impairing arterial flow.
Participants completed an extended rest period during the familiarisation trial, prior to
exercise.
6.3.4 Graded exercise tests

161
A graded exercise test, split into two parts; GXT 1 and GXT 2, was adopted as previously
described (General Methods, Section 3.4). Briefly, following rest and preconditioning phases, a
low intensity five min warm-up was completed. GXT 1 was a submaximal incremental speed
protocol followed by GXT 2, an incremental gradient protocol to volitional exhaustion. Starting
speeds were between 8–11 km.h-1 (1% gradient, Jones & Doust [1996]) depending upon recent
running performance, with each participant completing a minimum of six stages, using speed
increments of 1 km.h-1. Following a 10 min rest, GXT 2 began at a speed 2 km.h-1 below the
previous GXT 1 final speed, with gradient increasing by 1% each min and continuing until
volitional exhaustion (Jones, 2006a).
6.3.5 Physiological measures
During the familiarisation trial, anthropometric data were collected for stature, body
mass and a four site skin fold calliper assessment (Harpenden, Burgess Hill, UK) across iliac
crest, subscapular, triceps and biceps (Durnin & Womersley 1974). Measures of TCORE, TSKIN and
HR were taken throughout the trial as detailed in the General Methods (Section 3.6). Heart
rate, TCORE, TSKIN, RPE and TS were noted every 5 min during rest and the IP protocol, and at the
end of each stage during exercise. The following physiological responses were calculated;
lactate thresholds, running economy (RE), VO2max and velocity at VO2max (vVO2max), as described
in the General Methods (Section 3.6.3).
Pre and post the IP protocol, muscle temperature was measured through a needle
thermistor probe (Type MLA connected to DM 852 Medical Precision Thermometer, Ellab A/S,
Hilleroad, Denmark) inserted to a depth of two centimetres into the right thigh at the mid-point
between the greater trochanter and tibial tuberosity, in the vastus lateralis.
6.3.6 Statistical Analyses and Derivative Calculations
All outcome variables were assessed for normality and sphericity prior to further
analysis. Where assumptions of normality were not met, data was log transformed as
appropriate. Two way, repeated measures ANOVA (treatment*time) were used to test for
differences in blood lactate indices, expired metabolic gases, TCORE, TSKIN, PSI, RPE and TS. Where
appropriate, Bonferroni adjusted pairwise comparisons revealed where differences occurred.
Paired samples t-tests were used to detect differences between total running time during GXT
2, vVO2max sweat rate, environmental conditions and muscle temperature. Effect sizes for main
effects and interaction effects are presented as partial eta squared (η2), whilst differences

162
between two related samples were evaluated through Cohen’s dav (d) in accordance with
Lakens (2013).

163
6.4 Results
Environmental conditions did not differ between trials; CON 32.6 (0.3)°C, 61.8 (3.1)% RH, IP
32.4 (0.3)°C, 60.8 (3.6)% RH (Wet bulb globe temperature CON 28.2 [0.5]°C, IP 27.8 [0.6]°C,
t=1.531, p=0.157). Similarly, comparisons of physiological variables between CON and IP, at
rest, prior to cuff inflation did not reveal differences between conditions (Table 25).
Table 25: Comparisons of physiological variables at rest during CON and IP, prior to cuff
inflation (mean ±SD).
CON IP t p d
Hydration (mOsmol.kg-1
H2O) 247 (191) 322 (208) 0.842 0.419 0.37
Blood lactate (mMol.L-1
) 0.85 (0.38) 0.80 (0.29) 0.533 0.605 0.11
Blood glucose (mMol.L-1
) 5.17 (0.94) 5.08 (1.26) 0.432 0.675 0.11
Heart rate (b.min-1
) 55 (6) 52 (8) 2.138 0.058 0.52
TCORE(°C) 37.00 (0.28) 37.04 (0.36) 0.463 0.654 0.11
TSKIN (°C) 34.15 (0.74) 34.13 (0.36) 0.107 0.918 0.03
TTHIGH (°C) 33.90 (0.69) 33.84 (0.57) 0.274 0.792 0.10
TCALF (°C) 33.69 (0.74) 33.54 (0.58) 0.605 0.564 0.23
TMUSC (°C) 34.82 (0.69) 34.50 (0.96) 0.732 0.483 0.39
TCORE = core temperature, TSKIN = skin temperature, TTHIGH = thigh temperature, TCALF = calf temperature,
TMUSC = muscle temperature, t = t-test value, p = significance value, d = Cohen’s d effect size.
During GXT 1 IP did not improve running speeds at fixed blood lactate concentrations
of 2 and 4 mMol.L-1 as shown in Figure 37 and Figure 38. At 2 mMol.L-1 the running speed in
CON was 11.57 (1.17) km.h-1 and 11.65 (1.36) km.h-1 in IP. At 4 mMol.L-1 running speed in CON
was 13.55 (1.03) km.h-1, and 13.53 (1.24) km.h-1 in IP. There were no main effects between
conditions (F=0.050, p=0.828, partial η2= 0.005), or interaction effects across the levels of blood
lactate concentration (F=1.319, p=0.277, partial η2= 0.117). Similarly, during exercise, no main
effect of treatment on blood glucose concentration was observed (CON – 5.03 [0.94] mMol.L-1,
IP – 5.47 [1.38] mMol.L-1, F=1.423, p=0.260, partial η2= 0.125), nor an interaction effect
(F=2.056, p=0.087, partial η2= 0.171).

164
Figure 37: Running speed at 2 & 4 mMol.L-1 respectively. Grey columns represent group means
(±SD), with individual data shown by grey lines.
Figure 38: Mean (±SD) blood lactate concentration during GXT 1 for IP and CON. ‘Famil’
represents cooler familiarisation, and is presented in grey, without error bars for clarity.
There was no main effect for treatment in RE (CON – 222.3 [18.0] mL.kg-1.km-1, IP –
218.9 [16.5] mL.kg-1.km-1, F=2.806, p=0.125, partial η2= 0.219), nor an interaction effect
(F=0.446, p=0.774, partial η2= 0.043). No main effect was observed on VE for treatment
(F=0.013, p=0.910, partial η2= 0.001), nor an interaction effect (F=0.843, p=0.477, partial η2=
0.078). Similarly, there was no main effect for RER (F=1.593, p=0.236, partial η2= 0.137), or an
interaction effect (F=1.318, p=0.272, partial η2= 0.116).
8
9
10
11
12
13
14
15
16
Control IP Control IP
Ru
nn
ing
spee
d (
km.h
-1)
4 mMol.L-1
2 mMol.L-1
0.0
0.5
1.0
1.5
2.0
2.5
3.0
3.5
4.0
4.5
5.0
5.5
6.0
6.5
7.0
7.5
Stage 1 Stage 2 Stage 3 Stage 4 Stage 5 Stage 6
Blo
od
lact
ate
(mM
o.L
-1)
Control IP Famil

165
VO2max, as defined by specified criteria, was achieved in 16 trials, with the remaining 6
trials demonstrating VO2peak. There were 7 VO2max and 4 VO2peak in CON, and 9 VO2max and 2
VO2peak following IP. There was no difference in VO2max (CON - 55.5 (3.7) mL.kg-1.min-1, IP 56.0
(2.6) mL.kg-1.min-1, t=-0.812, p=0.436, d=0.17), as shown in Figure 39, nor in total running time
during GXT 2 (CON – 347 [42] s, IP – 379 [68] s, t=1.496, p=0.166, d=0.58) (Figure 40). However,
differences in vVO2max were observed (Figure 41), with IP demonstrating a greater predicted
running speed (CON 15.0 [1.2] km.h-1, 15.4 [1.2] km.h-1, t=2.727, p=0.021, d=0.33).
Figure 39: VO2max during familiarisation, Control and IP. Grey columns represent group means
(±SD), with individual data shown by grey lines. ‘Famil’ represents normothermic
familiarisation.
Figure 40: Total running time during GXT 2. Grey columns represent group means (±SD), with
individual data shown by grey lines.
46
48
50
52
54
56
58
60
62
64
Famil Control IP
VO
2max
(m
l.kg-1
.min
-1)
200
250
300
350
400
450
500
550
Control IP
Ru
nn
ing
tim
e (s
eco
nd
s)

166
Figure 41: vVO2max during GXT 2 between conditions. Grey columns represent group means
(±SD), with individual data shown by grey lines. * represents a statistical difference (p<0.05).
Resting heart rate was not different between groups (Table 25), however heart rate, as
noted at the end of each 5 min occlusion period, was consistently lower whilst undergoing IP,
compared with CON (CON 60 [10] b.min-1, IP - 56 [10] b.min-1, F=9.977, p=0.010, partial η2=
0.499). The lower pre-exercise heart rate did not continue during exercise, with HR similar
throughout GXT 1 (F=0.132, p=0.724 partial η2= 0.13), and at maximum during GXT 2 (CON 186
[10] b.min-1, 186 [11] b.min-1, t=0.341, p=0.740, d=0.03). A main effect for PSI was observed,
with PSI lower following IP (F=5.548, p=0.043, partial η2= 0.381), with no interaction effect
(F=1.380, p=0.250, partial η2= 0.133). No differences were observed between IP and CON for
RPE (F=0.028, p=0.870, partial η2= 0.003), or thermal sensation (F=0.054, p=0.821, partial η2=
0.005).
There were no differences in thermoregulatory variables at rest as shown in Table 25. There
was also no main effect for treatment on TCORE whilst IP occured (F=0.666, p=0.433, partial η2=
0.062). However, there was a progressive decrease in TCORE during IP, which was not matched
by the control group, providing an interaction effect (F=6.098, p=0.009, partial η2= 0.379) as
shown in Figure 42. However, Bonferroni post hoc did not detect differences at any time
points. The reduced TCORE following IP continued during GXT 1, with IP lower throughout
(F=27.886, p=0.001, partial η2= 0.756), however the rate of increase was similar between the
groups, so no interaction effect was seen (F=3.308, p=0.05, partial η2= 0.269). IP did not elicit a
change in muscle temperature (CON ∆ = 0.55[0.57]°C, IP ∆= 0.78[0.85]°C, t=-0.593, p=0.568,
11
12
13
14
15
16
17
18
19
20
Control IP
vVO
2max
(km
.h-1
)
*
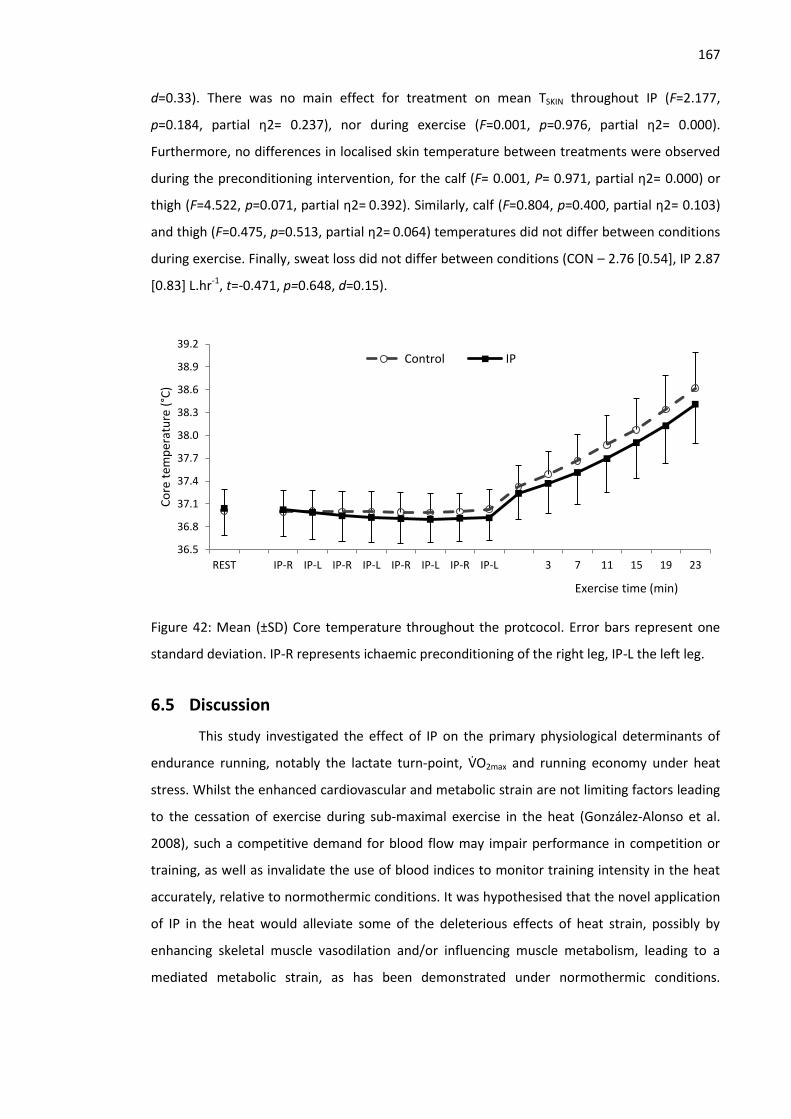
167
d=0.33). There was no main effect for treatment on mean TSKIN throughout IP (F=2.177,
p=0.184, partial η2= 0.237), nor during exercise (F=0.001, p=0.976, partial η2= 0.000).
Furthermore, no differences in localised skin temperature between treatments were observed
during the preconditioning intervention, for the calf (F= 0.001, P= 0.971, partial η2= 0.000) or
thigh (F=4.522, p=0.071, partial η2= 0.392). Similarly, calf (F=0.804, p=0.400, partial η2= 0.103)
and thigh (F=0.475, p=0.513, partial η2= 0.064) temperatures did not differ between conditions
during exercise. Finally, sweat loss did not differ between conditions (CON – 2.76 [0.54], IP 2.87
[0.83] L.hr-1, t=-0.471, p=0.648, d=0.15).
Figure 42: Mean (±SD) Core temperature throughout the protcocol. Error bars represent one
standard deviation. IP-R represents ichaemic preconditioning of the right leg, IP-L the left leg.
6.5 Discussion
This study investigated the effect of IP on the primary physiological determinants of
endurance running, notably the lactate turn-point, VO2max and running economy under heat
stress. Whilst the enhanced cardiovascular and metabolic strain are not limiting factors leading
to the cessation of exercise during sub-maximal exercise in the heat (González-Alonso et al.
2008), such a competitive demand for blood flow may impair performance in competition or
training, as well as invalidate the use of blood indices to monitor training intensity in the heat
accurately, relative to normothermic conditions. It was hypothesised that the novel application
of IP in the heat would alleviate some of the deleterious effects of heat strain, possibly by
enhancing skeletal muscle vasodilation and/or influencing muscle metabolism, leading to a
mediated metabolic strain, as has been demonstrated under normothermic conditions.
36.5
36.8
37.1
37.4
37.7
38.0
38.3
38.6
38.9
39.2
REST IP-R IP-L IP-R IP-L IP-R IP-L IP-R IP-L 3 7 11 15 19 23
Co
re t
emp
erat
ure
(°C
)
Exercise time (min)
Control IP

168
However, these data indicate IP does not proffer any benefit across the determinants of
endurance performance in the heat.
The lack of difference in blood lactate accumulation during GXT 1 is distinctly different
from the results of Bailey et al. (2012a) who reported a significantly lower blood lactate
concentration throughout an incremental, submaximal run (mean difference -1.07 mMol.L-1).
They attributed the subsequently improved 5 km performance to improvements in vascular
function, facilitating enhanced removal and transport of lactate for uptake and use. Bailey et al.
(2012a) speculated that such changes may increase lactate oxidation in the mitochondria of
working muscles, and/or reflect energy sparing, through augmented mitochondrial flux or
increased excitation-contraction coupling efficiency, as has previously been observed in
preconditioned pig muscle (Pang et al. 1995). Recently observed improvements in isometric
endurance exercise of the forearm suggests such alterations in muscle metabolism may occur
without concomitant haemodynamic changes (Barbosa et al. 2015). Previously, the
improvements to vascular function following IP have been attributed to biochemical changes
that follow ATP degradation during periods of occlusion. For example, the accumulation of
intracellular adenosine interacts with adenosine receptors A1 and A2 (Marongiu & Crisafulli
2014), and ultimately mediates vasodilation (Riksen et al. 2008). Adenosine accumulation has
also been suggested to maintain endothelium function, when it is normally impaired following
strenuous exercise (Bailey et al. 2012b). Alongside adenosine, ischaemia stimulates increased
endothelial nitric oxide (NO) release that attenuates sympathetic vasoconstriction, inducing
smooth muscle relaxation as part of the secondary plateau phase of the bimodal cutaneous
response to local hyperthermia (Kellogg et al. 1998). It is possible that under heat stress, any
reduction in skeletal muscle energy consumption were too small for these measures to detect
or, from a haemodynamic perspective, skeletal muscle may not be sensitive to further
increases in NO following IP, due to the apparently greater role of prostaglandins, relative to
NO (Kellogg et al. 2005). Moreover, it is possible that blood vessels are already maximally
dilated from heat stress (Lorenzo & Minson 2010).
Among other studies to have found no significant effect from IP during submaximal
exercise, Clevidence et al (2012) suggested their incremental cycling exercise protocol may not
have provided sufficient ischaemic challenge to realise the benefits of IP, although the authors
also acknowledge they may not have achieved full occlusion during the IP procedure.
Notwithstanding, the elevated physiological and metabolic strain observed during submaximal
running in the heat, compared with familiarisation data collected under cooler conditions
(Figure 38), is supportive of an ischaemic challenge, especially given the distinct improvements

169
following IP observed by Bailey et al. (2012a) during a similar normothermic incremental
running protocol. However, Febbraio (2001) has highlighted that oxygen availability is not the
main factor mediating the augmented glycogenolysis and elevated blood lactate concentration
during moderate exercise under heat stress, although they did not rule out a role for decreased
muscular blood flow influencing metabolic processes in an oxygen independent manner.
Indeed, Febbraio et al. (1994) has previously highlighted a strong relationship between reduced
body temperature and reduced plasma adrenaline levels in explaining metabolic changes
following heat acclimation, notably a reduced RER, indicating greater fatty acid or ketone
oxidation and less glycogenolysis. These findings were in the apparent absence of changes in
fibre type recruitment and with changes far exceeding that expected from a Q10 effect on
glycogenolytic and glycolytic processes. It is through the lowering of body temperature that
other interventions such as heat acclimation and precooling may prevent such metabolic
alterations, with a cooler body preserving splanchnic circulation and thus maintaining the
conversion of lactate to pyruvate in the liver (Lorenzo et al. 2010). However, given the
sensitivity of splanchnic blood flow to changes in body temperature, where splanchnic blood
flow may reduce by 40% during hyperthermia (Rowell 1973), this same mechanism following IP
would appear unlikely. Therefore, despite potentially greater blood flow to the muscle
following IP, metabolic alterations and metabolite production by the muscle were maintained.
Consequently, the unchanged circulating blood lactate and glucose concentrations are in
keeping with elevated muscle temperature and adrenaline being the prominent drivers of
increased intramuscular carbohydrate utilisation in the heat, rather than localised ischemia
(Febbraio 2001), although it is acknowledged these were not directly measured in the current
study.
VO2max is attenuated in the heat (Nybo et al. 2014), which is likely a direct consequence
of cardiovascular strain and insufficient muscular blood flow at maximal intensities (Gonzalez-
Alonso et al. 2008). Given that mean finishing TCORE in both conditions was elevated (39.0°C
CON, 38.9°C IP), and VO2max was lower than the normothermic familiarisation (~-2 mL.kg.-1min-1,
Figure 39), it is probable VO2max was indeed impaired in this cohort. Notwithstanding that IP
was applied under different environmental conditions, effects of IP on VO2max appear equivocal
(Marocolo et al. 2015). A potential explanation for such variability in VO2max following IP are
methodological differences between exercise protocols, time of exercise following IP, training
status of participants, as well as data analysis techniques, such as VO2 averaging time.
Furthermore, it is unclear if other studies adopted strict VO2max criteria as in the present study,
or may in fact be reporting VO2peak. Although the adoption of VO2max criteria is not without
170
criticism (Poole et al. 2008), the use of a verification phase is supported to reaffirm VO2max
attainment (Midgley & Carroll 2009), but no studies pertaining to IP have adopted this
procedure. In the current study, a verification phase would be confounded by the
environmental conditions, given VO2max impairments are determined by the progressive
influence of heat strain (Gonzalez-Alonso et al. 2008). Interestingly, there was a statistical
difference in vVO2max, a composite measure of running economy and VO2max, which could
indicate small improvements in both of these variables, which were not substantial enough to
be seen individually, but is apparent from the combined calculation. However, the mean
difference of 0.38 km.h-1, does not exceed the calculated typical error of 0.51 km-1 established
during pilot testing, indicating that changes may not be meaningful.
Crisafulli et al. (2011) has highlighted a role for altered fatigue perception to explain
enhanced performance following IP, after observing no differences in physiological parameters
including VO2max, maximal stroke volume and maximal cardiac output. These data cannot
support, or refute this, as testing occurred under different environmental conditions. However,
no differences were found in RPE, and whilst a mean improvement in total running time of 32 s
during GXT 2 could be considered meaningful, this was not statistically significant, nor did it far
exceed the laboratory typical measurement error of 27 s. Figure 40 displays the individual
responses of total running time to IP, with two individuals demonstrating large (>150 s)
improvements. The physiological data of these individuals does not reveal clear evidence for
the large increases in performance. Similar cardiovascular, respiratory and thermoregulatory
responses were observed between tests. However, lower RPE values were reported during GXT
1, indicating these participants may have experienced a reduced perceived exertional strain
following IP, enabling them to continue running for longer during GXT 2. Recently, Tocco et al.
(2014) did not observe an effect from IP with highly trained athletes during free paced 5 km
time trials on a track. They also suggested altered fatigue sensations could account for some of
the benefits observed by IP, and that training status modifies the sensitivity to this alteration,
or indeed changes in blood flow. Such a suggestion would help explain the difference between
effects in sub-elite (Bailey et al. 2012a) and elite runners (Tocco et al. 2014), but does not
appear to be universal, with Jean-St-Michel et al. (2011) having reported improvements in elite
swimmers. Indeed, the two individuals who may have experienced a reduced perceived strain
in this trial, facilitating longer running times during GXT 2, were close to the group mean for
recent 5 km performance and VO2max. Alongside changes in fatigue perception, the possibility of
a ‘placebo effect’ should be considered, as IP is difficult to blind. In the current study,
procedures were implemented to try and maintain participant naivety to the true purpose of

171
the study, and this was reinforced by questioning after the study about their beliefs and
perceptions of the trials. No participant reported a prior belief that the IP condition may have
provided a benefit to their performance. However, blinding measures and such actions to
mitigate against a Hawthorne effect are not widely reported elsewhere within the IP literature,
so it is difficult to ascertain whether IP performance may have been influenced by a placebo
effect.
Furthermore, such variability in submaximal and maximal exercise responses to IP
could relate to the technique itself. Clevidence et al (2012) speculated that individual variation
in limb occlusion pressure may have resulted in a different level of ischaemia to Jean-St-Michel
et al. (2011). Arterial flow is unlikely to be completely blocked in the legs at 250 mmHg (Iida et
al. 2007), and a greater stimulus may be achieved when occlusion occurs, rather than
ischaemia. Therefore, it is possible that preconditioning of the arms, as in the study of Jean-St-
Michel et al. (2011), resulted in a greater response, due to the same pressure being used on a
smaller muscle mass. Gibson et al. (2013) have also suggested a pressure of 220 mmHg to be
too low for leg occlusion, as arterial pulses may still be detected at 250 mmHg (Suga et al.
2010). However, the current study adopted a pressure previously shown to produce beneficial
effects (de Groot et al. 2010; Bailey et al. 2012a). Prior to experimental trials, Doppler
ultrasound was used to establish individual limb occlusion pressure to ensure a safety margin of
at least 50 mmHg across all participants. Collectively, this suggests this cohort experienced an
appropriate level of occlusion.
Muscle temperature was taken pre and post IP to quantify the thermal effects of such
large, cyclical alterations in major limb blood flow. This measurement would appear to be novel
within IP studies and the lack of change in muscle temperature suggests passive heating
maintenance or rewarming to be unnecessary when IP is adopted, in order that muscle
temperature is maintained for the start of an anaerobic exercise bout. While muscle
temperature did not change following IP, interestingly IP appeared to elicit a small change in
resting TCORE (~0.1°C). This likely reflects a consistent redistribution of blood away from the core
to the periphery as part of recovery for the previously occluded limb. During exercise this
difference was maintained, presenting a small, but consistent change in TCORE, which in turn
influenced PSI. However, the small magnitude of difference in TCORE between conditions
(~0.1°C) explains the lack of an independent effect of body temperature on performance
measures such as VO2max and blood lactate indices. Whilst this change is small in comparison to
the change in TCORE following precooling techniques, future research may consider how this
could complement a cooling strategy.

172
In conclusion, this study investigated the novel application of IP during exercise in the heat.
These data indicate IP does not proffer any benefit across the determinants of endurance
performance in the heat and metabolic alterations under heat stress appear insensitive to IP
signalling. Furthermore, four cycles of IP did not influence deep muscle temperature, but
elicited a modest influence on TCORE during subsequent exercise. Consequently, in comparison
to alternative acute interventions such as precooling, IP is not recommended for use when
completing endurance exercise in the heat.

173
7 Short term heat acclimation improves the determinants of
endurance performance and running time trial performance
in the heat.
Previous investigations have demonstrated modest effects from acute interventions on the
determinants of endurance performance. This investigation will now consider the chronic
approach of heat acclimation, and investigate a practical 5-day strategy. The effect of heat
acclimation on the determinants of endurance performance model has yet to be investigated.
Furthermore, the decrement to the model afforded by heat stress is unclear. A 5 km time trial
protocol will be completed to complement findings from the incremental exercise protocol.
7.1 Abstract
Despite widespread use of heat acclimation training, no studies have quantified the effect
on the determinants of endurance performance and time trial performance in runners.
Therefore, the aim of this study was to investigate the effect of 5 days controlled hyperthermia
heat acclimation (STHA), with permissive dehydration, on VO2max, LT, LTP, RE, vVO2max and 5 km
running time trial performance in the heat, as well as quantify the impairment to the
determinants in hot versus cool conditions. A control group (CON) matched for training volume
and intensity was adopted to differentiate the effect of heat stress and exercise components of
the acclimation programme on the subsequent exercise performance. Seventeen participants
(10 STHA, 7 CON) completed graded exercise tests (GXT) in cool (13°C, 50% RH, pre training)
and hot (32°C, 60% RH) conditions (pre and post training), as well as 5 km treadmill time trials
in the heat (32°C) pre and post training. Interaction effects were observed for total running
time during the GXT (STHA;78 (43) s, CON; 18 [44] s, p=0.006, partial η2=0.457) and TT
performance (STHA 6.2 [5.5]%, CON; 0.6 [1.7]%, p=0.029, partial η2= 0.296), with greater
improvements in STHA. VO2max was improved across both groups (p=0.004, partial η2=0.517),
with no interaction (p=0.228). However, large differences in the mean improvements were
observed; STHA +4.0 (2.2) mL.kg-1.min-1 (7.3 [4.0]%, dav=0.47), CON; +1.9 (3.7) mL.kg-1.min-1 (3.8
[7.2] %, dav=0.30). Alongside improved TT performance, following training, the finishing TSKIN
was lower (p=0.041, partial η2= 0.283) in STHA (Pre; 35.7 [0.35]°C, Post; 34.6 [0.31] °C), but not
in CON (Pre; 35.7 [0.43]°C, Post; 35.5 [0.38] °C). There were improvements in both groups for
the lactate threshold (p=0.021, partial η2=0.306), lactate turnpoint (p=0.005, partial η2=0.413)
and vVO2max (p=0.031, partial η2=0.332), but no interactions. Running economy was impaired
following both training programmes (p=0.008, partial η2=0.459), with no interaction (p=0.341).

174
The independent effect of training in the heat appears to account for improvements in running
time to exhaustion, TT performance and VO2max, however similar improvements in LT and LTP
were seen following both training programmes. Training in the heat provides specific thermal
adaptations that improve endurance performance further than high intensity normothermic
training, despite normothermic training affording similar systematic improvement to the
traditional model of endurance physiology.
7.2 Introduction
A deleterious effect of heat stress on endurance performance is well established (Galloway
& Maughan 1997). Moreover, this impairment extends to the primary determinants of
endurance performance; VO2max, (Sawka et al. 1985), blood lactate indices (Lorenzo et al. 2011)
whilst the influence on running economy (RE) is unclear (Saunders et al. 2004a). Consequently,
considerable evidence documents the effectiveness of transient thermal adaptations, proffered
through heat acclimation training (HA), in alleviating physiological and thermoregulatory strain
during exercise in both temperate and hot conditions (Corbett et al. 2014; Neal et al., 2015), as
well as the ergogenic potential for endurance performance in the heat (Lorenzo et al. 2010;
Garrett et al. 2012; Racinais et al. 2015b; Keiser et al. 2015). The HA phenotype arises from
physiological adaptation across multiple systems notably pertaining to; sudomotor function
(Lorenzo & Minson 2010), cardiovascular stability (Rowell 1967), skeletal muscle metabolism
(Febbraio et al. 1994), cutaneous blood flow (Lorenzo and Minson, 2010), central
thermoregulatory control (Buono et al. 1998) and cellular function (McClung et al. 2008). In
turn, observable and prominent HA adaptations include decreased resting and exercising, core
(TCORE) and skin (TSKIN) temperatures, alongside a reduction in exercising heart rate (HR) in the
heat, which likely arises through a combination of increases in plasma volume (PV), cardiac
contractility and sudomotor function (Sawka et al. 2011). Such adaptations collectively
ameliorate the deleterious effect of peripheral vasodilation in the hyperthermic individual,
which is a predominant limitation during maximal aerobic exercise in the heat (González-Alonso
et al. 2003; Périard et al. 2011). Concomitantly, improved perception of both thermal strain and
perceived exertion during heat stress may be observed following HA, alluding to a role for
behavioural alterations to improve free-paced, sub-maximal exercise in the heat (Flouris &
Schlader 2015). Although greater physiological adaptations are typically observed following
MTHA and LTHA (Pandolf 1998; Shapiro et al. 1998; Garrett et al. 2009), the rapid induction of
cardiovascular, thermoregulatory and perceptual adaptations after ~4–6 days (Armstrong &
Maresh 1991, Tyler et al. 2016) helps explain the relative prominence of short-term acclimation

175
(STHA; ≤7 days) as a time-efficient alternative for competitive preparation (Garrett et al. 2011;
Chalmers et al. 2014).
In addition to improving TT performance in the heat, HA appears to enhance the
determinants of endurance performance directly, although the holistic effect on the traditional
model (Bassett & Howley 2000) during running is not well documented. Recently, Racinais et al.
(2015b) demonstrated a partially and then almost fully ameliorated 43 km cycling TT
performance in the field (∼37°C) following 1 and 2 weeks of heat adaptation respectively,
compared with cool conditions (∼8°C). Racinais et al. (2015b) attributed the initial pre-
acclimation reduction and subsequent improvement in TT performance under heat stress, to
increased power output, albeit with relative intensity (%VO2max) maintained. This pattern is
commensurate with a reduced, and then enhanced, VO2max as individuals arrive and then adapt
to a hot environment respectively (Nybo et al. 2014). It is likely HA does not entirely abate the
decline in VO2max in the heat, with Sawka et al. (1985) reporting a 3.5% increase in VO2max in the
heat, compared with the initial ∼8% reduction. Similarly, Lorenzo et al. (2010) reported an 8%
improvement in VO2max, relative to an initial ~20% reduction under heat stress. An enhanced
lactate threshold (LT), or lactate turnpoint (LTP) following HA is also widely reported (Lorenzo
et al. 2010; Chalmers et al. 2014; Neal et al. 2015), likely facilitated by the maintenance of
splanchnic blood flow and conversion to glucose in the liver (Rowell 1973), as well as metabolic
adaptations in the muscle, ameliorating the shift to glycogenolysis under heat stress (Febbraio
et al. 1994). Theoretically, HA may enhance running economy (RE), through hypervolaemia and
a reduced cardiovascular strain (Morgan et al. 1989; Saunders et al. 2004a), however whether
RE is impaired by heat stress remains a topic of contention (Bailey & Pate 1991), with both
enhanced (MacDougal et al. 1974) and reduced (Rowell et al. 1967) submaximal VO2 reported
in the heat. Notwithstanding this ambiguity, the traditional model of endurance performance
(Coyle 1995; Basset & Howley 2000; Jones & Carter 2000; McLaughlin et al. 2010) appears to
remain sensitive for characterising decrements in performance under heat stress, as well as
subsequent improvements following HA.
Despite the efficacy of HA in improving exercise performance under heat stress, there is a
dearth of research concerning running time trials. A greater metabolic heat production,
reduced convective cooling and potentially enhanced individual variability of economy of
movement within runners (Millet et al. 2009), may all elicit a non-uniform response when
compared with cycling research. Indeed, given the propensity for a heightened thermal strain
in running (Chan et al. 2008), larger effects following HA may be apparent. Therefore, an
investigation into the effect of HA on the determinants of endurance performance and TT

176
performance in runners, would appear to be warranted. Moreover, a lack of synergy within HA
regimes exists, with different durations (short, medium, long term), environmental conditions
and models (fixed intensity, self-regulated, controlled hyperthermia) adopted, making it
difficult to extrapolate results between studies. Given the maximal adaptation that may be
observed, medium and long term HA strategies are more widely researched than STHA, despite
the apparent preference for STHA by athletes (Garrett et al. 2011; Chalmers et al. 2014).
Furthermore, fixed intensity models that prescribe exercise at %VO2max may provide a sub-
optimal adaptation stimulus as adaptation occurs (Taylor 2014). This reduces the relative strain,
as well as presenting systematically altered changes in TCORE and sweat rate due to differences
in MHP and the evaporative requirement (Ereq) across individuals of varying VO2max or body
mass (Jay et al. 2011, Taylor 2014). Conversely, controlled hyperthermia HA maintains the
relative strain by achieving the same internal temperature each day (Gibson et al. 2015c; Mee
et al. 2015b). Furthermore, higher intensity exercise complements controlled hyperthermia to
rapidly, initially increase TCORE, which is pertinent as this may result in training at sport-specific
intensities (Houmard et al. 1990; Sunderland et al. 2008), allowing HA to complement rather
than compromise, a competition taper (Spilsbury et al. 2015). However, high intensity training
may elicit a training effect independently of thermal strain, but no study has yet to closely
match a high intensity HA programme in a control group, making it hard to differentiate the
precise roles of thermal versus exertional strain in promoting physiological adaptation in this
type of training, which could further optimise HA practices.
Therefore, the aim of this study was to investigate the effect of controlled hyperthermia
STHA on the determinants of endurance performance and TT performance in endurance
runners, as well as quantify the decrement in the determinants in hot versus cool conditions. A
matched-intensity control group was included to differentiate the effect of heat stress and
exercise components of the acclimation programme on the subsequent exercise performance.
It was hypothesised that STHA would elicit larger improvements in both the physiological
determinants and TT performance than normothermic training.
7.3 Methods
7.3.1 Participants
Seventeen local runners volunteered as participants for this experiment. Participant details
and between groups comparisons are provided in Table 26 below. Ten participants (9 male, 1
female) completed short term heat acclimation training (STHA), whilst seven (male)
participants completed control training (CON). All participants were recreational club runners
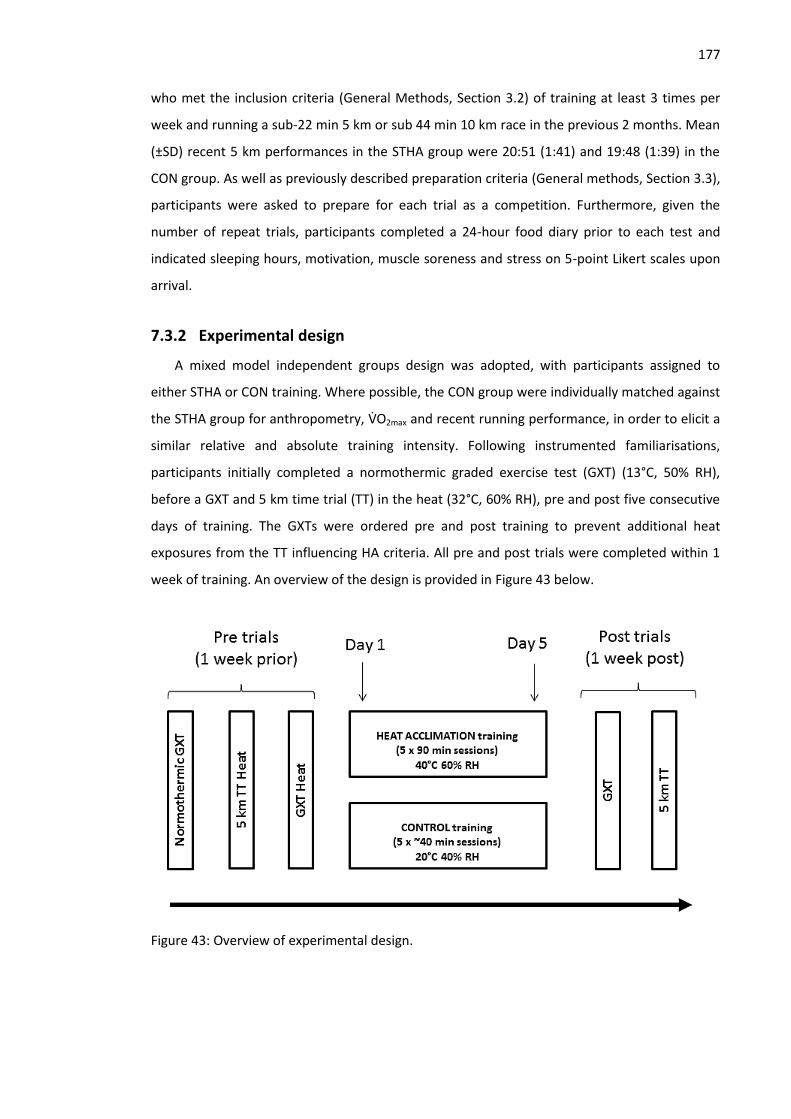
177
who met the inclusion criteria (General Methods, Section 3.2) of training at least 3 times per
week and running a sub-22 min 5 km or sub 44 min 10 km race in the previous 2 months. Mean
(±SD) recent 5 km performances in the STHA group were 20:51 (1:41) and 19:48 (1:39) in the
CON group. As well as previously described preparation criteria (General methods, Section 3.3),
participants were asked to prepare for each trial as a competition. Furthermore, given the
number of repeat trials, participants completed a 24-hour food diary prior to each test and
indicated sleeping hours, motivation, muscle soreness and stress on 5-point Likert scales upon
arrival.
7.3.2 Experimental design
A mixed model independent groups design was adopted, with participants assigned to
either STHA or CON training. Where possible, the CON group were individually matched against
the STHA group for anthropometry, VO2max and recent running performance, in order to elicit a
similar relative and absolute training intensity. Following instrumented familiarisations,
participants initially completed a normothermic graded exercise test (GXT) (13°C, 50% RH),
before a GXT and 5 km time trial (TT) in the heat (32°C, 60% RH), pre and post five consecutive
days of training. The GXTs were ordered pre and post training to prevent additional heat
exposures from the TT influencing HA criteria. All pre and post trials were completed within 1
week of training. An overview of the design is provided in Figure 43 below.
Figure 43: Overview of experimental design.

178
179
7.3.3 Graded exercise test
Markers of heat acclimation were assessed for the STHA group from resting and exercise
responses during GXTs in the heat, pre and post training. These markers are in accordance with
recent literature (Sawka et al. 2011; Périard et al. 2015) and are displayed in Table 27. During
the pre and post GXTs in the heat, STHA participants entered the environmental chamber and
lay in the supine position for 30 min to assess resting responses.
For all trials, following rest, a five min warm-up was completed, before beginning the
exercise test as described in the General Methods (Section 3.4). Briefly, the test comprised two
parts; GXT 1 was a submaximal incremental speed protocol, followed by GXT 2; an incremental
gradient protocol to volitional exhaustion. During GXT 1 each participant completed a minimum
of six stages, using speed increments of 1 km.h-1. Following a 10 min rest, GXT 2 began at a
speed 2 km.h-1 below the previous final speed with gradient increasing by 1% each min and
continuing until volitional exhaustion (Jones 2006a).
For all experimental trials and training sessions, pre exercise hydration was assessed and
pre and post (towel-dried) nude body mass were recorded to estimate sweat loss (General
methods, Section 3.6.2). Measures of HR, TCORE, TSKIN, respiratory gases, sweat loss, RPE and TS
were also reported Plasma volume expansion was estimated using the equation of Dill and
Costill (1974) (Equation 10, General methods, Section 3.7.1). Measures of both haemoglobin
(Hb) and haematocrit (Hct) were taken in triplicate from resting fingertip capillary samples
using a portable haemoglobin photometer (EFK Diagnostics Hemo Control Analyser,
Magdeburg, Germany), providing an estimate of Hb to 1 g.L-1. To measure Hct, blood was
collected into 75μl heparinised capillary tubes and spun in a centrifuge at 14,000 rpm for 3
minutes (Haematospin 1300, Hawksley and Sons Ltd, Lancing, England). Following
centrifugation, Hct was read using capillary tube slide measure (Hawksley and Sons Ltd,
Lancing, England). A mean of the three samples was taken for each measure. In addition to
markers of heat acclimation, the determinants of endurance performance were calculated;
lactate thresholds, running economy (RE), maximum oxygen consumption (VO2max) and velocity
at VO2max (vVO2max), as previously described (General Methods, Section 3.6.3).
7.3.4 Time trial
Participants completed a minimum of one treadmill TT familiarisation in the heat, in
accordance with the recommendations of Laursen et al (2007) for trained runners. Following a
5 min, self-selected warm-up (replicated across all trials), participants completed a 5 km TT on a
motorised treadmill. During the TT participants adjusted treadmill speed ab libitum (increment

180
0.2 km.h-1), with the distance completed continuously displayed. Participants were blinded to
all other feedback including speed, time, HR and TCORE. Standardised instructions were given at
the start of the trial to; ’give your all’, ‘pace yourself throughout the trial’ and ‘adjust speed as
you see fit’ as per similar studies (Stannard et al. 2011). Initially participants straddled the
treadmill belt, which was increased to that individual’s mean pace from the familiarisation, in
order to prevent a small difference in the blinded starting speed influencing the overall
performance. The trial began as the participant began running, and they were free to adjust
speed immediately. During the run, elapsed time was recorded every km alongside HR, TCORE,
TSKIN, RPE and TS.
7.3.5 Training
The STHA group completed five, 90 min daily training sessions in the heat (40°C, 60%) using
controlled hyperthermia. This involved participants exercising until TCORE exceeded 38.5°C, with
exercise then prescribed intermittently to maintain TCORE above 38.5°C for 60 min, in
accordance with the work of Fox et al. (1963). Training was completed on cycle ergometers
(Monark, e724, Vansbro, Sweden), which afforded a high level of precision for controlling
mechanical work, and therefore metabolic heat production, whilst allowing multiple individuals
to train at once. Exercise intensity was initially prescribed relative to body mass, at 2.7 W.kg-1,
based on the strength of the relationship between MHP and power output (Gibson et al.
2015d), and subsequently adjusted to maintain the participant’s maximum tolerable power in
order to minimise exercise volume and ensure participants reached the target TCORE within 30
min. The novel prescription of exercise based on power output, relative to body mass, as
opposed to %VO2max (Nielsen et al. 1993; Lorenzo et al. 2010; Castle et al. 2011), removes the
necessity for an initial cycling VO2max test and maintains the relative exercise intensity across
training days, independent of adaptation. Measures of TCORE, HR, RPE and TS were taken every 5
min, alongside any adjustments to exercise intensity as appropriate. For each individual,
training occurred at the same time of day, with the majority in the morning (07:00-10:00 h) and
one participant in the evening (18:00-20:00 h). In accordance with recent evidence supporting
the efficacy of permissive dehydration as an additional stressor for PV expansion (Garrett et al.
2011, 2014), no fluid intake was permitted throughout the training sessions.
The purpose of the CON group was to understand the contributing roles of exertional and
thermal strain as independent stimuli for subsequent aerobic performance in the heat, rather
than assess HA state pre and post, given the volume of evidence supporting the efficacy of this
type of protocol for establishing HA. The CON group reflects the typically higher intensity in a

181
controlled hyperthermia programme, compared to that of fixed intensity (%VO2max) protocols
(Gibson et al. 2015a), which may elicit a training effect that is independent of thermal strain.
Therefore, with matched total exercise time and cycling intensity, the CON group completed
five consecutive days of training in temperate laboratory conditions (20°C, 40%). Sessions
typically lasted 40-45 min, using the same equipment and procedures as in STHA, although
participants were permitted cooling fans.
7.3.6 Statistical analyses
All outcome variables were assessed for normality and sphericity prior to further analysis.
Heat acclimation criteria for STHA were analysed using one-way repeated-measures ANOVA
with Bonferroni post hoc test. Physiological and performance data for CON and STHA from both
the GXTs and TTs were analysed using mixed model, 2-way ANOVA (Group*Time) with post hoc
Bonferroni adjusted pairwise comparisons used where significant main or interaction effects
occurred. Data from STHA and CON were pooled for comparisons between GXTs in cool and hot
environments, to quantify the effect of heat stress. Data were analysed using SPSS (Version 21,
SPSS Inc, Illinois, USA) with statistical significance set at p<0.05 and data presented as means
and standard deviation (±SD). Effect sizes for main effects and interaction effects are presented
as partial eta squared (partial η2), differences between related and independent samples were
evaluated through Cohen’s dav (dav) and Cohen’s d (d) respectively, in accordance with Lakens
(2013).
7.4 Results
7.4.1 Participants
Participants in experimental groups were closely matched for body mass, VO2max, body
composition and recent running performance as shown in Table 26. Self-reported motivation,
muscle soreness and stress responses did not differ between groups or trials (p>0.05). One
participant from STHA was unable to complete the final TT due to injury, so for TT comparisons
n=9. Furthermore, equipment failures during two trials reduced the STHA group to n=9 for RE
and n=8 for VO2max and vVO2max.
Table 26: Comparison of experimental groups. Data are mean (±SD).
Heat acclimation Control p
n = 10 n = 7
Age 34 (16) 27 (3) 0.279 Body mass (kg) 73.2 (9.2) 70.2 (8.9) 0.512 VO2max (ml.kg
-1.min
-1) 58.9 (6.7) 62.4 (5.9) 0.280
Sum of skinfolds (mm) 25.8 (3.9) 23.5 (5.3) 0.326

182
Body surface area (m2) 1.89 (0.14) 1.88 (0.13) 0.878
Recent 5 km (s) 1253 (103) 1188 (100) 0.214
7.4.2 Heat acclimation adaptation
The attainment of the majority of heat acclimation markers was observed following the 5
day, controlled hyperthermia programme, as shown below in Table 27. Notably, an enhanced
heat dissipation capacity was observed, with resting (-0.15°C, p=0.01), exercising (-0.21°C,
p=0.04) and change in TCORE during GXT 1 (-0.25°C, p=0.01) all lower following STHA.
Furthermore, a reduced mean exercising HR (-3 b.min-1, p=0.02) and RER (-0.08, p=0.03) were
observed alongside expansion of the blood plasma volume (5.7%, p=0.03). Finally, although
neither the mean TS (p=0.26) or RPE (p=0.34) reduced following HA, the change in TS was lower
following STHA (p=0.04), indicating a mediated perceived stress during the submaximal run. A
selection of HA adaptations are shown in Figure 44.
Table 27: Effect of 5 days STHA on recognised HA criteria. Data are mean (±SD).
Criteria Pre Post ∆ Pre - post p dav
Resting HR (b.min-1
) 52 (5) 49 (8) -2 (4) 0.115 0.36
Mean exercising HR (b.min-1
) 163 (14) 159 (13) -3 (4) 0.023* 0.26
Resting TCORE (°C) 36.97 (0.33) 36.83 (0.32) -0.15 (0.12) 0.014* 0.45
Mean exercising TCORE (°C) 38.12 (0.36) 37.91 (0.43) -0.21 (0.25) 0.039* 0.54
Exercising TCORE ∆ (°C) 1.26 (0.27) 1.00 (0.28) -0.25 (0.20) 0.006* 0.91
Resting TSKIN (°C) 34.6 (0.3) 33.8 (1.1) -0.77 (0.95) 0.046* 1.13
Mean exercising TSKIN (°C) 35.2 (0.8) 34.9 (0.7) -0.32 (0.52) 0.205 0.44
Exercising TSKIN ∆ (°C) 0.1 (1.0) 0.0 (1.1) -0.14 (0.99) 0.670 0.13
Mean exercising blood glucose (mMol.L
-1)
4.63 (0.62) 4.80 (0.48) 0.17 (0.40) 0.240 0.31
Exercising blood glucose ∆ (mMol.L
-1)
1.47 (0.77) 1.02 (0.80) -0.44 (0.54) 0.040* 0.56
Mean exercising RER 1.02 (0.15) 0.94 (0.07) -0.08 (0.12) 0.032* 0.70
Exercising RER ∆ 0.22 (0.06) 0.18 (0.05) -0.03 (0.05) 0.025* 0.59
Sweat loss (L) 1.35 (0.3) 1.39 (0.39) 0.05 (0.20) 0.503 0.13
Plasma volume - - 5.7 (7.1) % 0.031* 1.06
Mean exercising TS 6.0 (0.8) 5.8 (0.6) -0.2 (0.6) 0.262 0.29
Exercising TS ∆ 2.0 (0.5) 1.6 (0.4) -0.4 (0.6) 0.042* 0.86
Mean exercising RPE 14.1 (0.9) 13.8 (1.1) 0.0 (2.0) 0.342 0.31
NB. ∆= change in variable from stage 1 to stage 6. * denotes p<0.05.

183
Figure 44: Clockwise from top left: Pre and post STHA HR response (A), exercising TCORE (B), thermal sensation (C) and RER (D) during GXT 1. Data are mean (±SD).

184
7.4.3 Training
Mean daily session duration was greater for STHA, compared with CON (STHA; 90 [0] min,
CON; 41 [2] min). However, training load was closely matched between groups in terms of total
work completed (STHA; 2443 [657] kJ, CON; 2530 [336] kJ, p=0.502, dav=0.36), total exercising
time (STHA; 39 [6] min, CON; 41 [2] min, p=0.289, dav=0.57), relative exercise intensity (STHA;
2.72 [0.28] W.kg-1, CON; 2.9 [0.22] W.kg-1, p=0.181, dav=0.73) and absolute exercise intensity
(STHA; 201 [33] W, CON; 203 [20] W, p=0.895, dav =0.07). The difference in training
environmental conditions (STHA 36.6 [0.8]°C, 59 [9]% RH, CON 20.0 [0.9]°C, 43.3 [6.8]% RH),
elicited a markedly greater physiological strain in STHA in terms of; peak session HR (STHA; 176
[9] b.min-1, CON; 157 [19] b.min-1, p=0.016, dav=1.42), mean session TCORE (see Figure 45 below,
STHA; 38.5 [0.2]°C, CON; 37.8 [0.2]°C, p<0.001, dav=4.08), time above 38.5°C (STHA; 63 [5] min,
CON; 2 [2] min, p<0.001, dav=15.8), mean peak session TCORE (STHA; 39.1 [0.2]°C, CON; 38.2
[0.2]°C, p<0.001, dav=4.91), sweat loss volume (STHA; -2.3 [0.7] L, CON; -0.5 [0.2] L, p<0.001,
dav=3.43) and sweat loss relative to body mass (STHA; -3.2 [1.1]%, CON; -0.6 [0.2]%, p<0.001,
dav=3.24).
Figure 45: Mean TCORE response to STHA and CON training across 5 days. A TCORE of 38.5°C was
consistently achieved within 30 min, and maintained for 60 min during STHA training. Error bars
represent ±SD.
7.4.4 Effect of heat stress
The combined data of both training groups demonstrates a holistically elevated physiological
strain at the end of GXT 1 during exercising under heat stress (32.1 [1.2]°C, 56.8 [5.8]% RH),
compared with cool conditions (12.8 [0.9]°C, 51.7 [6.3]% RH), as shown in Table 28 below.
36.5
37.0
37.5
38.0
38.5
39.0
39.5
0 5 10 15 20 25 30 35 40 45 50 55 60 65 70 75 80 85 90
T CO
RE
tem
per
atu
re (
°C)
Time (min)
HEAT CON

185
Table 28: Effect of heat stress on physiological variables. Exercising measures are taken after
~24 min of running during the final stage of (incremental) GXT 1 test.
Marked reductions were also observed in the determinants of endurance performance, as
shown in Figure 46. Blood lactate concentration was elevated during submaximal running in the
heat compared with the cool, as shown in Figure 47. Other notable impairments included; -7.7
(5.9)% in VO2max (-4.6 [3.3] mL.kg-1.min-1, p<0.001, dav=0.70), -4.4 (6.2)% in LT (-0.6 [0.8] km.h-1,
p=0.036, dav=0.31), -4.8 (4.5)% in LTP (-0.7 [0.7] km.h-1, p=0.002, dav=0.34) and -4.0 (4.4)% in
vVO2max (-0.6 [0.7] km.h-1, p=0.030, dav=0.23), whilst a -19 (10)% reduction in running time to
exhaustion during GXT 2 was also observed (-98 [54] s, p<0.001, dav=1.96). Based on the
predefined criteria, no difference was observed in the prevalence of VO2max and VO2peak tests
between cool (VO2max = 15, VO2peak = 2) and hot (VO2max = 12, VO2peak = 5) conditions (p=0.08).
Despite running for a shorter time, there was a modest increase in maximum HR in the heat
(189 [9] b.min-1), compared with cool conditions (186 [12] b.min-1, p=0.04, dav=0.27).
Interestingly, RE was improved in the heat, with a reduction of -5.3 (4.3)% in oxygen
consumption per kilometre (-12.3 [10.1] mL.kg-1.km-1, p=0.004, dav=0.75). No difference was
observed in ventilation (p=0.243, partial η2=0.090) between hot and cold conditions.
Cool (13°C) Hot (32°C)
Exercising HR (b.min-1
) 177 (12) 184 (12)
Exercising TCORE (°C) 38.46 (0.41) 38.70 (0.38)
Exercising TSKIN (°C) 28.34 (1.37) 35.34 (1.08)
Exercising blood glucose (mMol.L-1
) 5.39 (0.80) 5.95 (1.20)
Exercising RER 1.04 (0.07) 1.12 (0.13)
Mean ventilation (L.min-1
) 93.1 (14.6) 94.2 (13.4)
Sweat loss (L) 0.64 (0.24) 1.31 (0.27)
Exercising TS 5.4 (1.0) 6.9 (0.8)
Exercising RPE 15.9 (1.3) 17.7 (1.4)

186
Figure 46: Mean (±SD) change in the determinants of endurance performance from graded
exercise tests under heat stress, relative to cool conditions.
Figure 47: Mean (±SD) blood lactate response during graded exercise under heat stress,
compared to cool conditions. Error bars represent one standard deviation.
7.4.5 Determinants of endurance performance after training
Environmental conditions were not different for submaximal tests both between groups
(Pre; p=0.372, Post; p=0.894) and within participants (STHA; p=0.505, CON; p>0.99). The
training responses for both groups in terms of the determinants are shown in Figure 48. A main
effect for time in VO2max was observed (p=0.004, partial η2=0.517), indicating both STHA and
-35
-30
-25
-20
-15
-10
-5
0
5
10
15
Ch
ange
of
per
form
ance
(%
)
VO2max vVO2max Running time LT LTP RE
GXT 2
0.0
1.0
2.0
3.0
4.0
5.0
6.0
7.0
8.0
REST EX 1 EX 2 EX 3 EX 4 EX 5 EX 6
Blo
od
lact
ate
(mM
o.L
-1)
GXT 1 stage number
Cool Heat

187
CON may have enhanced VO2max, however no Group*Time interaction effect was observed
(p=0.228). The mean increase in VO2max pre to post HA in STHA was 4.0 (2.2) mL.kg-1.min-1 (7.3
[4.0]%, dav=0.47) and for CON 1.9 (3.7) mL.kg-1.min-1 (3.8 [7.2] %, dav=0.30). Maximum HR did
not differ following training (p=0.147) and there was no interaction between groups (p=0.671).
Similarly, a main effect for time (pre:post training) was observed for LT (p=0.021, partial
η2=0.306), whereby change in STHA was 0.4 (0.6) k.hr-1 (4.0 [6.0]%, dav=0.24) and in CON 0.4
(0.6) k.hr-1 (3.4 [5.3]%, dav=0.24), with no interaction (p=0.923). For LTP there was a main effect
for time (p=0.005, partial η2=0.413), whereby change in STHA was 0.3 (0.4) k.hr-1 (2.5 [2.9]%,
dav=0.20) and in CON 0.2 (0.3) k.hr-1 (1.8 [2.2]%, dav=0.16), but no interaction effect (p=0.699). A
main effect was also observed for vVO2max (p=0.031, partial η2=0.332), where change in STHA
was 0.5 (0.8) k.hr-1 (3.5 [5.3]%, dav=0.24) and in CON 0.3 (0.8) k.hr-1 (2.6 [5.4]%, dav=0.13), but no
interaction (p=0.553). However, for running time during GXT 2 both a main effect for time
(p=0.002, partial η2=0.532) and interaction effect were observed (p=0.006, partial η2=0.457).
Following STHA, the mean running time during GXT 2 increased by 78 (43) s (p<0.001, dav=2.09)
which equated to 20.8 (12.7)%, compared with 18 [44] s (9.8 [1.2] %, p>0.99) in CON. Finally, a
main effect for RE pre and post training was observed (p=0.008, partial η2=0.459), with a
greater amount of oxygen consumed per kilometre following training, but no interaction
(p=0.341). For STHA, the mean difference pre to post was 7.3 (7.3) mL.kg-1.km-1 (3.5 [3.5]%,
dav=0.59), whilst for CON it was -2.4 (5.0) mL.kg-1.km-1 (1.1 [2.3]%, dav= 0.12).
Figure 48: Mean (±SD) percentage change in the determinants of endurance performance
following STHA and CON. Error bars represent one standard deviation.
-35
-30
-25
-20
-15
-10
-5
0
5
10
15
Ch
ange
of
per
form
ance
fro
m c
oo
l (%
)
Pre HEAT Post HEAT Pre CON Post CON
VO2max vVO2max Running time LT LTP RE GXT 2
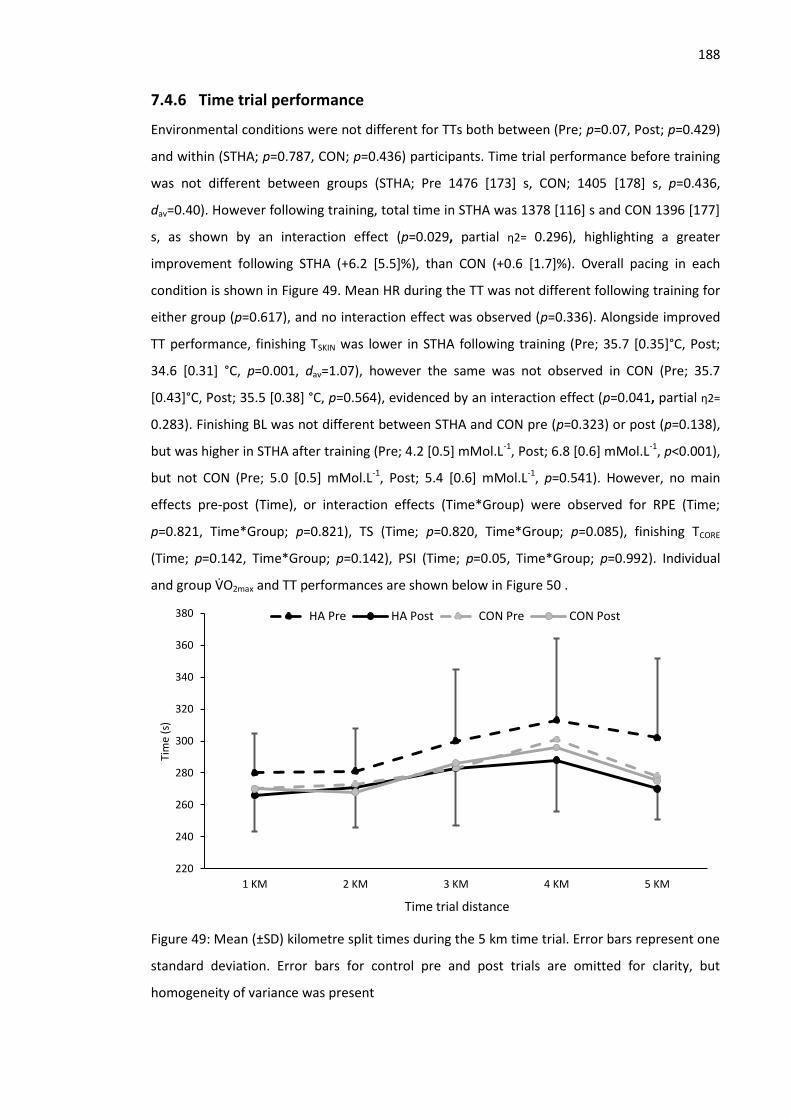
188
7.4.6 Time trial performance
Environmental conditions were not different for TTs both between (Pre; p=0.07, Post; p=0.429)
and within (STHA; p=0.787, CON; p=0.436) participants. Time trial performance before training
was not different between groups (STHA; Pre 1476 [173] s, CON; 1405 [178] s, p=0.436,
dav=0.40). However following training, total time in STHA was 1378 [116] s and CON 1396 [177]
s, as shown by an interaction effect (p=0.029, partial η2= 0.296), highlighting a greater
improvement following STHA (+6.2 [5.5]%), than CON (+0.6 [1.7]%). Overall pacing in each
condition is shown in Figure 49. Mean HR during the TT was not different following training for
either group (p=0.617), and no interaction effect was observed (p=0.336). Alongside improved
TT performance, finishing TSKIN was lower in STHA following training (Pre; 35.7 [0.35]°C, Post;
34.6 [0.31] °C, p=0.001, dav=1.07), however the same was not observed in CON (Pre; 35.7
[0.43]°C, Post; 35.5 [0.38] °C, p=0.564), evidenced by an interaction effect (p=0.041, partial η2=
0.283). Finishing BL was not different between STHA and CON pre (p=0.323) or post (p=0.138),
but was higher in STHA after training (Pre; 4.2 [0.5] mMol.L-1, Post; 6.8 [0.6] mMol.L-1, p<0.001),
but not CON (Pre; 5.0 [0.5] mMol.L-1, Post; 5.4 [0.6] mMol.L-1, p=0.541). However, no main
effects pre-post (Time), or interaction effects (Time*Group) were observed for RPE (Time;
p=0.821, Time*Group; p=0.821), TS (Time; p=0.820, Time*Group; p=0.085), finishing TCORE
(Time; p=0.142, Time*Group; p=0.142), PSI (Time; p=0.05, Time*Group; p=0.992). Individual
and group VO2max and TT performances are shown below in Figure 50 .
Figure 49: Mean (±SD) kilometre split times during the 5 km time trial. Error bars represent one
standard deviation. Error bars for control pre and post trials are omitted for clarity, but
homogeneity of variance was present
220
240
260
280
300
320
340
360
380
1 KM 2 KM 3 KM 4 KM 5 KM
Tim
e (s
)
Time trial distance
HA Pre HA Post CON Pre CON Post

189
Figure 50: Mean (grey columns) and individual data of percentage change in VO2max and 5 km
time trial performance following heat acclimation (STHA) and normothermic training (CON).
7.5 Discussion
Compared with cool conditions, heat stress impaired VO2max, LT, LTP, vVO2max and running
time during GXT 2, but improved RE. Both high intensity normothermic and heat acclimation
training lessened the decline in all of these variables. The improvements in VO2max and running
time during GXT 2 following STHA were greater than in CON. Moreover, heat acclimation
demonstrated meaningful improvements in thermoregulatory function, ultimately improving
TT performance by a far greater magnitude than CON. These data support the effectiveness of
a controlled hyperthermia, STHA programme with permissive dehydration, for improving
aerobic running performance in hot and humid conditions.
7.5.1 Heat acclimation
Despite the greater prevalence of LTHA strategies within research, STHA is more widely
adopted by athletes and these data demonstrate multi-system adaptations commensurate with
the HA phenotype. Notable STHA induced improvements in exercising HR, RER and TCORE were
observed, alongside an enhanced PV and mediated elevation of thermal sensation. Research
detailing the progressive induction of adaptations would suggest 70-75% of the maximum
potential adaptation to be conferred in this cohort (Garrett et al. 2011; Mee et al. 2015b;
-10
-5
0
5
10
15
20
Ch
ange
of
per
form
ance
(%
)
VO2max Time trial STHA CON STHA CON

190
Gibson et al. 2015a). The mediated increase in exercising TCORE, relative to pre-acclimation
(Figure 44B), represents reduced heat storage during the submaximal run, theoretically
affording the acclimated individual a greater heat storage capacity. The unchanged maximal
sweat rate following STHA is consistent with previous research (Mee et al. 2015b; Garrett et al.
2009; Garrett et al. 2014), however that this occurred alongside a smaller change in TCORE
alludes to increased sweat onset sensitivity. Accordingly, a reduction in exercising TSKIN was
observed during GXT 1, which is likely related to the altered thermal sensation (Figure 44C),
suggesting both an ameliorated absolute and perceived thermal strain (Schlader, Simmons et
al. 2011b; Flouris & Schlader 2015). The modest, but consistent, reduction in exercising HR is
indicative of enhanced cardiac output through increased stroke volume, to which thermal
adaptations such as reduced TCORE and TSKIN may contribute, by reducing the demand for
cutaneous vasodilation, as well as localised factors such as increased cardiac contractility
and/or venous tone (Périard et al. 2015). However, the largest contributing factor is likely
hypervolaemia, with the PV expansion of 5.3% commensurate with other literature following 5
days (Patterson et al. 2004a) and 8 days (Garrett et al. 2009; Garrett et al. 2012) of training
respectively. Hypervolaemia may be in part be attributable to the high intensity training, given
that haemodynamic adaptations are inducted first following this type of training (Montero et
al. 2015), whilst the level of dehydration achieved during HA training is also thought to
stimulate adaptation (Garrett et al. 2011). In light of this, fluid intake was restricted throughout
training, resulting in a mean dehydration of ~3.2% of body mass per session, which is greater
than Garrett et al. (2012; 2014) of ~-1.8-2.1%. The reduction in RER during exercise (Figure 44D)
may represent a lower relative intensity during the GXT following STHA (Jones & Carter 2000),
but may also be explained by a mediation of the shift towards glycogenolysis under heat stress,
resulting in a relative maintenance of fat oxidation. Similar effects have previously been
reported following heat acclimation and appear to arise from a reduced exercising body
temperature, that therefore reduced plasma adrenaline levels (Febbraio et al. 1994).
These data also demonstrate the efficacy of a novel exercise prescription method, based on
power output relative to body mass (2.7 W.kg-1) (Gibson et al. 2015d). This eliminated the need
for a prior cycling maximal test and better controls MHP than %VO2max, therefore maintaining
relative thermal strain independently of any progressive increase in aerobic fitness across a HA
programme. This approach also effectively controls thermal strain between individuals, which
may not occur when using %VO2max, given the disparate absolute exercise intensities between
those of high and low VO2max (Jay et al. 2011; Cramer et al. 2014). Accordingly, the target TCORE
of 38.5°C was consistently reached within 30 min by the majority of participants (27 ± 4 min),

191
across all days, reinforcing the strength of the relationship between exercise intensity and the
associated MHP for predicting changes in TCORE during uncompensable heat stress. Allied with a
primary aim of this HA programme, to minimise exercise volume and maximise intensity to
complement a competition taper, power output was increased when participants felt they
could maintain a higher intensity in order to reach the target TCORE in a shorter duration.
Similarly, where participants could not maintain 2.7 W.kg-1 across consecutive days, such as
those who did not habitually cycle, power was dropped and thus may be better characterised
as ‘maximum tolerable’, although the mean intensity remained at 2.7 (0.3) W.kg-1. Therefore,
the current methods achieved HA in an efficient manner, whilst the prescription of exercise
intensity initially based upon body mass and absolute power may be of interest to practitioners
given the simple practical application.
7.5.2 Effect of heat stress during GXT 1
As shown in Table 28, exercising under heat stress broadly enhanced physiological strain,
characterised by increased HR (+7 b.min-1), RER (+0.08), TCORE (+0.24°C), TSKIN (+7.0°C), TS (+1.5)
and RPE (+1.8). Whilst the determinants of endurance performance effectively predict
performance in normothermic conditions, (Joyner 1991; McLaughlin et al. 2010), the reduction
that can be expected within trained runners exercising under moderate heat stress, as can be
expected at the 2016 Rio de Janeiro Olympics, is not well defined. Such information could
benefit coaches and sport scientists preparing athletes for hot competitions, as well as those
who complete field testing in warm environments.
Pooled data highlighted the largest decrement in the heat to be in VO2max (~8%), with
smaller reductions across LT, LTP and vVO2max (all <5%), whilst RE was improved (~5%).
Furthermore, the total running time during the VO2max test (GXT 2) reduced by 19%. Although
TCORE at VO2max was elevated in the hot condition (38.9°C), compared with cool (38.5°C), the
largest difference between conditions was in TSKIN, with mean TSKIN 35.3 °C in the heat,
compared with 28.3°C (+7%) in the cool when measured at the end of GXT 1. This supports
previous assertions that when TCORE is elevated, a reduction in VO2max is more aligned to the
TSKIN elevation (Arngrimsson et al. 2004; Sawka et al. 2011). The primary limitation to VO2max is
thought to be an inability to achieve maximal cardiac output (Rowell 1966), as demand for both
cutaneous and muscular circulations compounds venous return (Gonzalez-Alonso & Calbet
2003). This is supported by the apparent lack of change in myocardial systolic or diastolic
function during maximal exercise in the heat, compared with normothermic (Smith et al. 2015),
despite alterations to the Frank–Starling relationship and cardiac contractility having been

192
reported during passive heat stress (Wilson et al. 2009). Although the observed ~8% reduction
in VO2max may be of interest to those completing similar exercise, it should be noted, that the
decrement to VO2max is progressive, therefore the impairment to VO2max may vary under
different environmental conditions, or individuals exercise harder or longer than ~24 min of
incremental running.
Heat stress induced reductions in the exercise intensity and fractional utilisation at LT and
LTP are well established (Tyka et al., 2009; De Barros et al. 2011; Lorenzo et al. 2010), however
different methodologies precludes synthesis of typical delta change. The observed decrements
in LT and LTP during GXT 1 are similar to that of Lorenzo et al. (2011) (-5%) in hot (40°C) versus
cool (13°C) conditions, but smaller than the 17% reduction in maximum lactate steady state
observed by De Barros et al. (2011) at 40°C compared with 22°C, which may reflect the
prolonged nature of an MLSS protocol that likely resulted in greater relative heat strain.
Despite the relative unanimity surrounding the effects of heat stress on VO2max and blood
lactate thresholds, the effect on RE is less well defined. Enhanced (MacDougal et al. 1974),
reduced (Rowell et al. 1967) and unchanged (Rowell et al. 1969; Maron et al. 1976) submaximal
VO2 have all been reported during submaximal exercise in the heat. Traditionally, the elevation
of TCORE has been associated with small increases in metabolic rate and therefore VO2 for a
given running velocity during prolonged submaximal exercise (Sawka, Pandolf, et al. 1983;
Shvartz et al. 1977; MacDougall et al. 1974), however oxygen kinetics remain unchanged under
heat stress (Koga et al. 1997; Nybo et al. 2001; Burnley et al. 2002), which is pertinent given the
incremental protocol in the current study. An increased energy demand may reflect increased
peripheral circulation, sweat gland activity, hyperthermic hyperventilation and an increased
mitochondrial metabolic rate, as well as a reduction in efficiency within the mitochondria
(Brooks et al. 1971, MacDougall et al., 1974). Of note, hyperventilation under heat stress has
been shown to increase VO2 by 31–50 ml (0.4-0.6 mL.kg-1. min−1) in the range of 117-147 L.min-1
(Aaron, Johnson, et al. 1992; Aaron, Seow, et al. 1992). In spite of these alterations, a warmer
muscle is considered more efficient due to a range of mechanisms (Racinais & Oksa 2010), but
notably including enhanced neural drive (Racinais et al. 2004) and reduced viscosity of the
muscles and joints (Hill 1927). Consequently, in hot conditions, there is a leftward shift of the
force-velocity relationship, affording an increased maximum velocity of shortening, with
improvements greatest in Type 1 compared with Type 2 muscle fibres, which could accentuate
differences in aerobic metabolism (de Ruiter & De Haan 2000). Therefore, an increased
biomechanical efficiency under environmental heat stress (Rowell et al. 1969; Saunders et al.
2004a) may explain the reduced VO2 during GXT 1 in the heat, with this benefit potentially

193
dissipating and/or outweighed by energy demanding thermoregulatory processes at higher
body temperatures. Accordingly, an increased ventilation rate in the heat was not observed.
However it is acknowledged such interpretation is made in the absence of direct measurements
of muscle temperature in both hot and cool conditions. Indeed, Bailey and Pate (1991) suggest
the diverse VO2 responses under heat stress across previous literature may reflect different
stages in the progression of heat strain with submaximal VO2 reduced at moderate
temperatures, but likely to rise as thermoregulatory responses are activated to a greater
extent. The practical implications of this observation are unclear, given that the relative
contribution of RE for performance increases with event distance (Saunders et al. 2004a) but so
too does the prevalence and influence of heat strain on endurance performance (Taylor &
Cotter 2006). Notwithstanding, these data evidence a lower oxygen consumption during
submaximal running in the heat, that should be controlled for in experimental work.
7.5.3 Effect of training on GXT and time trial performance
Both training methods demonstrated improvements across the determinants of
performance, aside of RE. However, an additional benefit of heat training was only observed in
the running time until exhaustion during GXT 2, the TT and VO2max. The observed improvements
in the control group for VO2max, LT, LTP and vVO2max would appear novel, but unsurprising, given
the high intensity exercise completed (~81% maximum heart rate), whereas previous HA
research has compared against resting or low intensity control training. These physiological
benefits arise independently of thermal strain from the exercise component of controlled
hyperthermia HA and following cycling training, so are not attributable to increased familiarity
with the running protocol. However, ultimately they do not improve endurance performance in
the heat. This alludes to a greater prominence of specific thermal adaptations to enhance
performance in the heat, rather than traditional physiological determinants. Previous research
highlights the importance of maintaining the core:skin gradient, which otherwise narrows as
TCORE and TSKIN increase, increasing skin blood flow demands for heat dissipation (Cuddy et al.
2015; Cheuvront et al. 2010). As the core:skin gradient narrows, increased blood flow to the
skin results in a reduction in stroke volume, which in turn impairs VO2max (Périard et al. 2011;
Lee et al. 2015). Furthermore, an elevated TSKIN will also influence perceptual responses such as
thermal sensation and RPE, which are associated with the voluntary reduction of exercise
intensity in the heat (Schlader, Simmons et al. 2011b, Schlader, Stannard, et al. 2011b). Indeed,
the interrelation of TSKIN, cardiovascular strain and RPE has previously been highlighted by
Schlader, Simmons et al. (2011b), reinforcing the potential for HA to influence performance
through a variety of mechanisms (Nybo et al. 2014). This is supported in the current data by the

194
maintenance of mean HR, RPE and TS across trials, despite running 6.2% faster following STHA.
Notwithstanding, VO2max likely explains some performance improvement, as there appears to
be a greater increase in VO2max from STHA than CON. Despite the absence of an interaction
effect for VO2max, the delta change and magnitude of effect for STHA (7.3%, d=0.47), compared
with CON (3.8%, d=0.30), are suggestive of meaningful changes between groups. Furthermore,
the absolute difference in STHA was 2.1 mL.kg-1.min-1 greater than in CON, which exceeds the
proposed magnitude of a meaningful change (2 mL.kg-1.min-1, Tanner & Gore 2013). It is also
interesting to observe the variability in VO2max response in CON as shown in Figure 50,
demonstrated by the high standard deviation, suggesting this type of training will benefit some
individuals, but not all, in keeping with previous research indicating genetics may help
determine the trainability of VO2max (Bouchard et al. 1999; Bacon et al. 2013). The individual in
CON who experienced the largest increase in VO2max, had one of the lowest VO2max of all
participants (58 mL.kg-1.min-1), suggesting the high intensity training provided a larger stimulus
than for other individuals with greater aerobic capacity (CON group mean 63 mL.kg-1.min-1). It is
apparent STHA remains a potent training intervention for acutely enhancing VO2max, with an
enlarged PV is the most likely mediator given that augmented cardiac compliance and
decreased myocardial VO2, have been observed in LTHA, rather than STHA (Horowitz et al.
1986).
The degree to which the improved running performance in the heat can be attributed to an
improved VO2max is unclear. Both Périard et al. (2011; 2013; 2015) and Schlader, Stannard et al.
(2011b) have identified VO2max as a primary determinant of self-paced endurance performance
in the heat, based on individual’s propensity to maintain exercise intensity relative to VO2max.
This supports traditional models of endurance performance, where VO2max is considered the
strongest single predictor of performance (McLaughlin et al. 2010; Bassett & Howley 2000),
also indicated by results from Lorenzo et al. (2010) where an observed an 8% improvement in 1
hour cycling TT performance (38°C) paralleled an 8% increase in VO2max in the heat following
HA. Furthermore, the respective improvements in performance in hot and cool environments
were proportional to the increase in VO2max in each condition. However, Lorenzo et al (2010)
also reported increases in LTP, PV expansion, lower skin temperatures and a larger core-to-skin
gradient, each of which have the potential to contribute to performance in the heat (Nybo et
al. 2014). Similarly, in the current study VO2max alone cannot wholly explain improved TT
performance given the VO2max improvement observed in CON (+1.9%), that did not transfer to
TT performance (+0.6%). Moreover, as shown in Figure 50, the variability in the STHA group for
TT performance is far greater than VO2max improvement. Accordingly, this indicates other

195
specific thermal adaptations contribute in addition to improving VO2max, but may also represent
a naivety for pacing following STHA. Indeed, the kilometre splits of the two individuals who
demonstrated only a ~1% improvement in TT performance following STHA indicate these
individuals may have begun the too fast following STHA, possibly because of reduced thermal
discomfort or a pre-determined strategy, as these individuals then slowed considerably during
the second half of the TT. Therefore, it may be necessary to re-familiarise individuals when they
are heat acclimated, as the afferent feedback they have become accustomed to, has
significantly changed. That STHA did not demonstrate greater improvements in blood lactate
thresholds is surprising, given the changes reported elsewhere in the literature (Lorenzo et al.
2010; Chalmers et al. 2014; Neal et al. 2015), potentially arising through reduced splanchnic
vasoconstriction due to a reduced body heat storage, and reduced glycogenolysis (Febbraio
2001). It is possible the ~2-3% improvement in both LT and LTP from CON has arisen due to the
intensity of exercise, with a mean intensity during normothermic cycling training of ~81% of HR
maximum, maintained for ~40 min daily across 5 days, which is likely to be at or above LTP for
most participants, an intensity that has been shown to elicit a training effect when replicated
across a four weeks 2-4 times weekly (Keith et al. 1992). The impaired RE demonstrates a
greater oxygen consumption during GXT 1 following both training programmes. Such an
observation is not unusual when an enhanced VO2max and/or lactate thresholds, due to the
interrelation of the determinants of endurance performance (Midgley, McNaughton & Jones
2007), demonstrating a greater absolute energy provision from aerobic metabolism at the
same submaximal intensities. Indeed, a trend for an exaggerated effect for greater oxygen
consumption in the STHA group (3.5%, dav=0.59) compared with CON (1.1%, dav= 0.12), reflects
the changes observed in VO2max. Following training, oxygen consumption and therefore RE
remained lower than in cool conditions, which likely reflects the differences in ambient, and
therefore muscle temperature.
It is acknowledged that the trial order may have contributed to some performance
improvement, as heat acclimated trials were consistently ordered as the final trial. However,
confidence that a real change has occurred in the STHA group may be taken from the minimal
change in CON performance, who would also be expected to improve with further
familiarisation, but also that greater familiarisation does not appear necessary for time trials in
the heat, compared with a cool environment (Schmit et al. 2016). Whilst familiarisation with
the competition conditions is considered important to an athlete, due to the influence of prior
familiarisation of a given task on RPE (Lamb et al. 1999), one familiarisation is considered

196
appropriate when trained runners are used, who typically display less variability than a lesser-
trained population (Laursen et al. 2007).
In conclusion, the current study supports the use of 5 days of controlled hyperthermia, with
permissive dehydration, for improving endurance running performance in the heat. The
independent effect of thermal strain above that of high intensity exercise training accounted
for improvements in TT performance and VO2max, whilst improvements in LT and LTP were seen
in both conditions. Finally, specific thermal adaptations appear to characterise improvements
in endurance performance in the heat better than the traditional model of endurance
physiology.

197
8 Effect of heat acclimation and precooling on 5 km running
time trial performance in the heat
Previous investigations have demonstrated little effect of acute interventions for enhancing
the determinants of performance. However, external cooling elicited large influences on skin
temperature and perceptual measures, which may promote a greater self-selected running
speed during free paced running. A 5-day heat acclimation protocol has been shown to
promote physiological adaptations and improve time trial performance in the heat, but it is
unclear whether this can be further enhanced with the addition of precooling. Furthermore, a
direct comparison between precooling and heat acclimation on running time trial performance
has yet to be completed, which could inform training prioritisation for those preparing for hot
competitions. For this experiment the same participants were used as in Chapter 7, with data
collection occurring simultaneously.
8.1 Abstract
Endurance running performance remains impaired in hot conditions following heat
acclimation. Previous investigations that have combined acclimation with precooling
demonstrate no additive benefit, albeit utilising intermittent, or cycling protocols, whereby
heat strain may be less severe than endurance running. The aim of this study was to investigate
the effect of STHA, alongside mixed-methods precooling on endurance running performance,
as well as providing a direct comparison between precooling and heat acclimation. Nine
participants completed four 5 km treadmill time trials in the heat (32°C, 60% RH); no
intervention (CON), precooling (PC), heat acclimation (HA) and heat acclimation with precooling
(HA+PC). Group mean (±SD) performance times were; CON 1476 (173) s, PC 1421 (146) s, HA
1378 (116) s and HA+PC 1373 (121) s. Friedman’s ANOVA revealed a statistical difference only
between HA and CON (p=0.004, d=0.68). However large effect sizes were observed for; HA+PC
vs CON (d=0.70), PC vs CON (d=0.34), HA vs PC (d=0.33) and HA+PC vs PC (d=0.36). Reaffirming
previous observations, precooling offered no further benefit to performance in the acclimated
individual, despite modest alleviation of perceptual and physiological strain. The maintenance
of running speed, despite a reduced physiological strain, may indicate an inappropriate pacing
strategy. Finally, these data indicate heat acclimation yields a larger ergogenic effect than
precooling on endurance running performance in the heat, although precooling would still
appear beneficial when acclimation is not possible.

198
8.2 Introduction
Considerable, recent, evidence documents the ergogenic benefits of both chronic strategies
such as heat acclimation (Garrett et al. 2011; Chalmers et al. 2014) and acute strategies, such as
precooling (Tyler et al. 2015; Jones et al. 2012; Ross et al. 2013; Bongers et al. 2015), for
endurance performance in the heat. Competition strategies that seek to alleviate the
deleterious effects of hyperthermia on endurance performance, habitually adopt a uni-
dimensional approach with athletes advised to either precool, or undertake (Racinais et al.
2015a). This dichotomous practice pervades despite a relative dearth of direct comparisons
between acute and chronic strategies to assess the more effective approach. As detailed in
Study 2 (Chapter 5), precooling techniques may be classified as internal or external depending
upon how the cooling impulse is delivered. External techniques demonstrate a dose-dependent
response, with a greater cooling surface area apparently providing greater benefits (Minett et
al. 2011). Consequently, mixed-method, whole body cooling techniques are well supported in
comparison with singular cooling garments, with recent meta-analyses reporting large effects
on subsequent endurance performance (+7.3%, d =0.72 Bongers et al. 2015, d = 1.91, Tyler et
al. 2015). Indeed, Study 2 (Chapter 5) evidences how a recent, practical, technique from
Duffield et al. (2009) ameliorated physiological and thermoregulatory strain during fixed
intensity endurance exercise in the heat, but this has yet to be evaluated during a free-paced
trial where the influence of alterations in TSKIN and thermal perception may be more
pronounced (Flouris & Schlader 2015).
From a chronic perspective, as demonstrated in Study 4 (Chapter 7), traditional heat
acclimation methods may be optimised through utilising a controlled hyperthermia model,
alongside permissive dehydration, in order to maintain the thermal strain throughout
acclimation training. Concomitantly, higher intensity exercise reduces training volume,
increasing synergy with pre-competition taper strategies. The typical ergogenic effect of short-
term HA (<7 days) on endurance performance appears to be 2.4 (3.5)% (Guy et al. 2015).
However, in spite of notable thermal adaptations such as an increased plasma volume in the
acclimated individual, a notable accentuated cardiovascular challenge persists when exercising
at maximal aerobic intensities under heat stress (Gonzalez-Alonso et al. 2008), as a
consequence of cutaneous vasodilation for thermoregulation impeding venous return and
cardiac filling. Consequently, evidence demonstrates both endurance performance (Lorenzo et
al. 2010) and VO2max (Sawka et al. 1985) remain impaired following acclimation, relative to
temperate conditions, highlighting not only the persistence of heat strain, but the potential to
further improve endurance performance in the acclimated individual.

199
Individual strategies used to prepare for performance in the heat fail to maintain
endurance performance relative to normothermic conditions, however combining
interventions has yet to demonstrate any clear benefits. An initial study by Castle et al. (2011)
reported no additional benefit from ice pack cooling of the quadriceps, during 40 min of
intermittent sprinting, following 10 days of heat acclimation (HA). A reduced resting TCORE and
increased basal plasma HSP70 concentration evidenced multi-system thermal adaptations
commensurate with the HA phenotype, but precooling yielded no additive benefit above the
2% improvement following HA. However prior to acclimation, precooling maintained, rather
than improved, performance possibly due to the lower group body mass, compared with
previous populations (Castle et al. 2006). Given that body mass, rather than body composition,
has an independent effect on thermoregulation when metabolic heat production is matched
(Dervis et al. 2014), a lighter population may have experienced an insufficient level of heat
strain to impair intermittent sprint cycling performance, due to a smaller metabolically active
muscle mass. Notwithstanding anthropometric considerations, it is conceivable the
improvement following HA arose independently of an alleviated thermal strain, reinforced by
the maintenance of performance in hot versus cool conditions, and facilitated by enhanced
cardiovascular stability and reduced glycogenolysis aiding recovery between sprints. Therefore,
additive effects may be more apparent under conditions where heat strain remains high.
Compared with long term HA (LTHA) that affords the maximum adaptive potential, short
term HA (<7 days, STHA) is more widely adopted by athletes and confers partial, albeit
meaningful adaptations (Garrett et al. 2011). Consequently, Brade et al. (2012) investigated
precooling following STHA, where heat strain would be expected to be greater than following
LTHA, but observed no additive effect during intermittent sprinting, with acclimation again
apparently mediating heat strain sufficiently, such that precooling was unwarranted and thus
ineffective. A consistent and significant thermal strain is apparent during continuous endurance
exercise in the heat (Galloway & Maughan 1997), reinforced by the larger effects of precooling
observed in endurance performance, compared with intermittent sprinting (Tyler et al. 2015).
Therefore, Schmit et al. (2015) recently tested the effect of an ice vest worn at rest and during
the warm-up prior to a 20 km cycling trial, following a 10-day, hot weather acclimatisation
training camp. Although, the combination of HA and precooling did not improve performance
above HA alone, transient, beneficial pacing alterations following precooling were observed
during the first half of the trial, alongside improved perceptual thermal strain. Therefore, more
aggressive precooling would appear to be more effective, given the small effects on endurance
performance reported from cooling vests alone (Jones et al. 2012).

200
Thus, it seems plausible that an additive effect may be observed when the event duration is
shorter than the ~32 min trial of Schmit et al (2015), and where heat strain remains high, such
that HA and precooling alone do not maintain performance relative to cool conditions. This
may be achieved by adopting STHA, rather than LTHA, as well as an exercise mode that yields a
significant metabolic heat production (MHP). For example, no studies pertain to endurance
running, despite running eliciting a greater MHP than cycling and providing reduced convective
cooling (Nielsen 1966, Millet et al. 2009), which collectively expedite heat strain (Chan et al.
2008). The aim of this study was therefore, to investigate the potential for an additive effect of
STHA, alongside an evidenced whole-body mixed methods precooling technique on endurance
running performance, as well as providing a direct comparison between precooling and heat
acclimation. It was hypothesised that a combined STHA and precooling strategy would further
enhance time trial performance relative to STHA alone, whilst STHA would be more beneficial
than precooling.
8.3 Methods
8.3.1 Participants
Nine participants (8 male, 1 female) volunteered as participants (mean [±SD]: age 32 [16]
years, stature 175.2 [7] cm, mass 71.9 [8.8] kg, sum of four skinfolds 25.4 [3.8] mm, VO2max 59.1
[6.9] mL.kg-1.min-1, recent 5 km time: 20:44 [1:44] min). Given the number of repeat trials,
participants completed a 24-hour food diary prior to each test and indicated sleeping hours,
motivation, muscle soreness and stress on 5-point Likert scales upon arrival. No
contraindications for testing were violated prior to commencing any experimental session in
accordance with previously detailed procedures (General methods, Section 3.3).
8.3.2 Experimental design
A within groups, repeated measures design was adopted, with individuals completing two 5
km treadmill time trials and a graded exercise test (GXT) before and after 5 days of HA training.
Each GXT was ordered immediately pre and post HA training, whilst time trials (TT) with
precooling (PC) and a no intervention control trial (CON) were completed in a counterbalanced
order prior to HA. Following acclimation, a TT was completed without any intervention (HA)
and another with the addition of precooling (HA+PC), again with the order counterbalanced
across the group. An overview is provided in Figure 51. All experimental trials followed
instrumented familiarisations of both the graded exercise test and time trial in the heat.
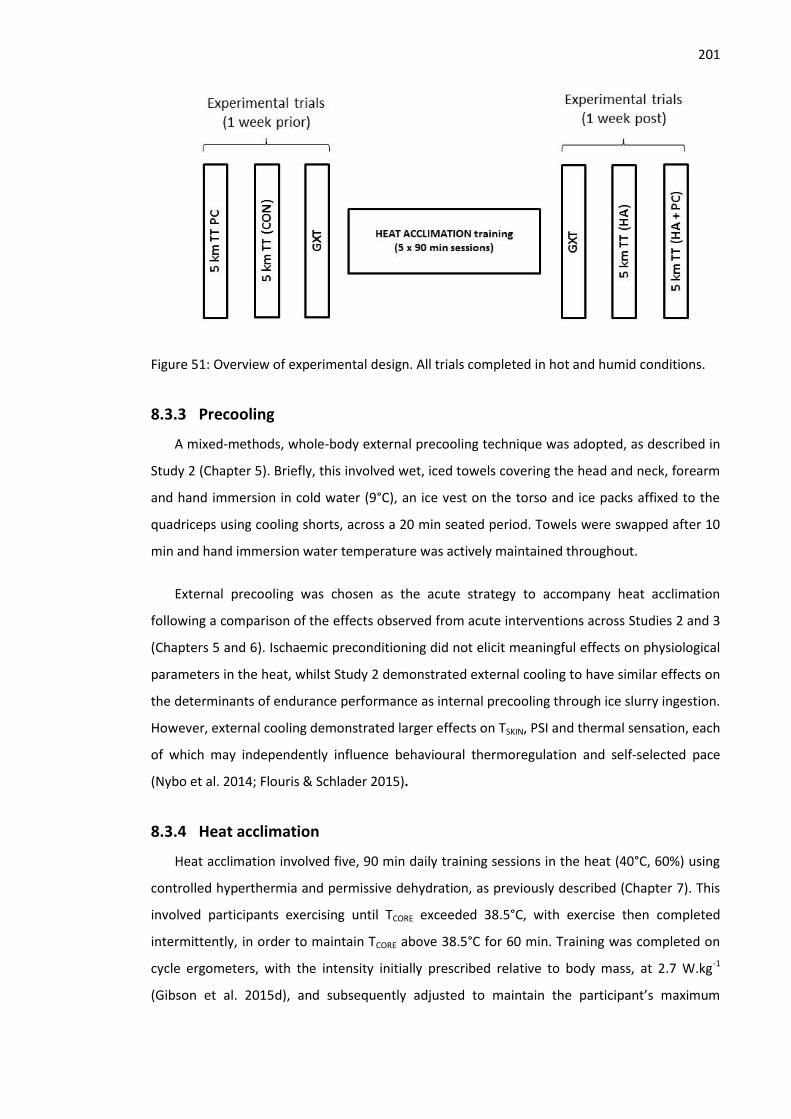
201
Figure 51: Overview of experimental design. All trials completed in hot and humid conditions.
8.3.3 Precooling
A mixed-methods, whole-body external precooling technique was adopted, as described in
Study 2 (Chapter 5). Briefly, this involved wet, iced towels covering the head and neck, forearm
and hand immersion in cold water (9°C), an ice vest on the torso and ice packs affixed to the
quadriceps using cooling shorts, across a 20 min seated period. Towels were swapped after 10
min and hand immersion water temperature was actively maintained throughout.
External precooling was chosen as the acute strategy to accompany heat acclimation
following a comparison of the effects observed from acute interventions across Studies 2 and 3
(Chapters 5 and 6). Ischaemic preconditioning did not elicit meaningful effects on physiological
parameters in the heat, whilst Study 2 demonstrated external cooling to have similar effects on
the determinants of endurance performance as internal precooling through ice slurry ingestion.
However, external cooling demonstrated larger effects on TSKIN, PSI and thermal sensation, each
of which may independently influence behavioural thermoregulation and self-selected pace
(Nybo et al. 2014; Flouris & Schlader 2015).
8.3.4 Heat acclimation
Heat acclimation involved five, 90 min daily training sessions in the heat (40°C, 60%) using
controlled hyperthermia and permissive dehydration, as previously described (Chapter 7). This
involved participants exercising until TCORE exceeded 38.5°C, with exercise then completed
intermittently, in order to maintain TCORE above 38.5°C for 60 min. Training was completed on
cycle ergometers, with the intensity initially prescribed relative to body mass, at 2.7 W.kg-1
(Gibson et al. 2015d), and subsequently adjusted to maintain the participant’s maximum

202
tolerable power in order to achieve the target TCORE within 30 min. Training occurred at the
same time of day, with the majority in the morning (07:00-10:00 h) and one participant in the
evening (18:00-20:00 h).
8.3.5 Exercise trials
Before and after the heat acclimation training, participants completed graded exercise tests
and treadmill time trials, as previously described in the General Methods (Section 3.4) and
Chapter 7, respectively. For all experimental trials and training sessions, pre exercise hydration
was assessed and pre and post nude body mass were recorded to estimate sweat loss (General
methods, Section 3.6.2). Prior to every trial, participants rested in the hot environment (32°C,
60% RH) for 10 mins, before a 20 min period when cooling, or additional rest, occurred as
appropriate. Following cooling and/or rest participants completed a self-selected 5 min warm-
up that was replicated across all trials, before a 5 km TT on a motorised treadmill. Participants
adjusted treadmill speed ab libitum (increment 0.2 km.h-1), with the distance completed
continuously displayed. Participants were blinded to all other feedback, with standardised
instructions given at the beginning of the trial and nothing thereafter. During the run, elapsed
time was recorded every km alongside HR, TCORE, TSKIN, RPE and TS.
8.3.6 Statistical analyses
Exercise data were analysed using repeated measures Two-way ANOVA (Trial*Time) with
post hoc Bonferroni adjusted pairwise comparisons used where significant main or interaction
effects occurred as detailed in the General Methods (Section 3.8). Singular data pertaining to
mean, delta change or finishing values between trials were analysed with One-way ANOVA.
Where assumptions of ANOVA were not met, data were either log transformed or non-
parametric statistics adopted. Effect sizes for main effects and interaction effects are presented
as partial eta squared (partial η2), differences between related samples were evaluated through
Cohen’s dav (dav), in accordance with Lakens (2013). Data presented as mean (±SD).
8.4 Results
8.4.1 Graded exercise tests
The heat acclimation strategy resulted in the attainment of the majority of heat acclimation
markers following the 5 day, controlled hyperthermia programme, as previously detailed in
Chapter 7. Briefly, these adaptations included reductions in resting TCORE (-0.15°C, p=0.01,
dav=0.45), exercising TCORE (-0.21°C, p=0.04, dav=0.54), exercising HR (-3 b.min-1, p=0.02,
dav=0.26) and RER (-0.08, p=0.03, dav=0.59). Furthermore, blood plasma volume expanded by

203
5.7% (p=0.03, dav=1.06) and there was a reduction in the change in thermal sensation (p=0.04,
dav=0.86). Sweat loss was unchanged following STHA (p= 0.503, dav=0.13).
8.4.2 Time trial performances
Environmental conditions (WBGT) did not differ between trials; CON = 27.4 (0.7)°C, PC =
26.9 (0.5)°C, HA = 27.5 (0.9)°C, HA+PC= 27.0 (0.8)°C (p=0.246, partial η2=0.156). Time trial
performance following heat acclimation with precooling (HA+PC) was not normally distributed.
Consequently, Friedman’s ANOVA revealed a statistical difference in TT performance between
conditions (p=0.001). Each intervention appeared to enhance TT performance in the heat,
relative to no intervention, as shown in Table 29, however a Wilcoxon tests with Bonferroni
correction (whereby significance = p<0.008), only indicated a significant difference between the
control trial and HA+PC. Group mean (±SD) performance times were; CON 1476 (173) s, PC
1421 (146) s, HA 1378 (116) s and HA+PC 1373 (121) s. Relative to control, large differences
were observed versus HA and HA+PC, with a modest difference with PC. There was no
observable difference in running performance between HA and HA+PC trial, whilst the
observed effect sizes and mean difference indicate modest improvements in HA and HA+PC
compared with PC (Table 29). Individual data is shown below in Figure 52.
Table 29: Relative difference in 5 km time trial performance between trials. *Corrected
statistical significance level for Wilcoxon signed-rank test post hoc p<0.008. Previously
established typical error following 5 days high intensity normothermic training = 16 s, 1.2%.
Data are; mean change (s), percentage change (%), statistical significance (p) and effect size (d).
Time trial
time
Control Precooling Heat acclimation Heat acclimation
+ precooling
Control 1476 (173) s
- 55 s (3.7%)
(p=0.039, d=0.34)
98 s (6.6%)
(p=0.004*, d=0.68)
103 s (7.0%)
(p=0.012, d=0.70)
Precooling 1421 (146) s 55 s (3.7%)
(p=0.039, d=0.34)
- 43 s (3.0%)
(p=0.098, d=0.33)
48 s (3.4%)
(p=0.023, d=0.36)
Heat acclimation 1378 (116) s 98 s (6.6%)
(p=0.004*,
d=0.68)
43 s (3.0%)
(p=0.098, d=0.33)
- 5 s (0.4%)
(p=0.590, d=0.04)
Heat acclimation + precooling
1373 (121) s 103 s (7.0%)
(p=0.012, d=0.70)
48 s (3.4%)
(p=0.023, d=0.36)
5 s (0.4%)
(p=0.590, d=0.04)
-

204
Figure 52: Individual comparisons between conditions. Group means are shown by bold lines.
Differences in pacing strategy between conditions were not apparent, with no Trial*Kilometre
interaction effect observed (p=0.319, partial η2=0.133). Figure 53 displays the kilometre splits
for each trial.
Figure 53: Mean (±SD) kilometre split times during the 5 km time trial. Error bars represent one
standard deviation. Error bars for control (CON) and heat acclimation + precooling (HA+PC)
trials are omitted for clarity, but homogeneity of variance was present.
1000
1100
1200
1300
1400
1500
1600
1700
1800
CON PC CON HA PC HA HA HA+PC
Tim
e (s
)
Time trial condition
232
250
267
284
302
319
336
353
1 KM 2 KM 3 KM 4 KM 5 KM
Tim
e (s
)
Time trial distance
CON PC HA HA+PC

205
Plots of TCORE, TSKIN, core:skin gradient and thermal sensation throughout all trials are shown
in Figure 54. Precooling did not elicit a change in TCORE during the 20 min cooling period
(p=0.219, partial η2=0.165). Change in TCORE during PC was 0.03 (0.04)°C and 0.04 (0.5) °C during
HA+PC, compared with 0.01 (0.03)°C and 0.01 (0.03)°C during CON and HA, respectively.
Therefore, starting TCORE did not differ between trials (p=0.697, partial η2=0.075); CON 37.12
(0.22)°C, PC 37.07 (0.30)°C, HA 37.07 (0.23)°C and 37.2 (0.22)°C during HA+PC. However, a large
reduction in TSKIN (p<0.001, partial η2=0.906) was observed across the cooling period in the
trials containing precooling (-6.9 [2.7]°C PC; -6.8 [1.5]°C HA+PC), whilst non precooling trials
were unchanged (CON +0.87 [0.50]°C; HA +0.58 [0.58]°C). This resulted in a reduction in
starting TSKIN (p<0.001, partial η2=0.900) in the trials following precooling (26.9 [2.8]°C PC, 26.4
[1.9]°C HA+PC), compared with non-precooled (34.3 [0.7]°C CON, 34.0 [0.4]°C HA). This
coincided with a reduced starting thermal sensation (p=0.002, partial η2=0.907) in PC (2.2 [0.8])
and HA+PC (2.4 [0.8]), compared with CON (4.4 [0.6] and HA (3.7 [1.5]). Finally, as a
consequence of the reduction in TSKIN following precooling, a greater core:skin gradient
(p<0.001, partial η2=0.896) was observed in PC (9.6 [2.6]°C) and HA+PC (10.5 [1.7]°C),
compared with CON (2.7 [0.6]°C) and HA (3.2 [0.5]°C).
During the time trials, no differences (p=0.117, partial η2=0.273) in mean TCORE were
apparent between trials; CON 38.53 (0.23)°C, PC 38.40 (0.42)°C, HA 38.37 (0.29)°C, HA+PC
38.25 (0.40)°C. However, the change in TCORE was different between trials (p=0.044, partial
η2=0.776). The increase during CON (2.22 [0.30]°C) was greatest, followed by HA (2.05 [0.40]°C,
PC (1.89 [0.92]°C), with the smallest change during HA+PC (1.71 [0.31]°C). The change during
HA+PC was statistically smaller than in both CON (p=0.013, d=1.67) and HA (p=0.033, d=0.96).
This resulted in different finishing TCORE across trials (p=0.025, partial η2=0.396), with the
highest in CON (39.34 [0.30]°C), followed by PC (39.24 [0.51]°C), HA (39.16 [0.44]°C) and the
lowest finishing TCORE in HA+PC (38.96 [0.43]°C).
The differences in starting TSKIN were also observed during the trials (p=0.010, partial
η2=0.369). Mean TSKIN was highest during CON (35.3 [1.2]°C), followed by HA (34.6 [0.7]°C), PC
(34.6 [1.2]°C) and the lowest was in HA+PC (34.1 [0.9]°C). However, a statistical difference was
only observed between CON and PC (p=0.029, d=0.58). Marked differences were observed in
change of TSKIN across trials (p<0.001, partial η2=0.877). The largest changes were observed
following precooling (PC = 8.5 [2.7]°C, HA+PC 8.5 [2.3]°C), compared with non-precooled trials
(CON = 1.4 [1.4]°C, HA 0.6 [0.9]°C). Statistical differences were observed across all trials, except
between the two precooled trials (PC & HA+PC, p>0.99) and non-precooled trials (CON & HA,
p=0.300) respectively. Differences in finishing TSKIN were also apparent (p=0.037, partial

206
η2=0.293), although only between CON and HA (p=0.026, d=0.48). Finishing TSKIN for each trial
was; CON 35.1 (1.2)°C, PC 35.7 (1.2)°C, HA 35.6 (1.0)°C and HA+PC 34.9 (1.0)°C.
The observed changes in TSKIN resulted in differences in the mean core:skin gradient
between trials (p=0.005, partial η2=0.504). The largest gradient was observed in HA+PC (4.2
[1.2]°C), followed by HA (3.7 [0.8]°C), PC (3.6 [1.0]°C) and CON (2.9 [0.9]°C, with statistical
differences between CON and HA+PC (p=0.034, d=1.24). Similarly, there were marked
differences in the change in the core:skin gradient between trials (p<0.001, partial η2=0.967).
The largest change occurred in precooled trials (PC -5.3 [3.0]°C, HA+PC-6.3 [1.8]°C), with
modest changes following HA (1.5 [1.0]°C) and CON (0.9 [1.4]°C). Statistical differences were
observed across all trials, except between HA and CON (p>0.99). This resulted in different
finishing core:skin gradients (p=0.028, partial η2=0.388). The largest was observed in HA (4.3
[1.1]°C) and HA+PC (4.2 [1.2]°C), followed by PC (3.7 [1.0]°C), with the smallest gradient
observed in CON (3.4 [1.0]°C).

207
Figure 54: Clockwise from top left: Mean (±SD) core temperature (A), skin temperature (B), thermal sensation (C) and core:skin gradient (D) during rest, cooling and
exercise phases of the time trial protocol. Error bars represent one standard deviation Core temperature error bars omitted for clarity.

208
Despite differences in TSKIN, no differences were observed in mean TS between trials
(p=0.066, partial η2=0.255). However, marked differences were observed in change in TS
(p=0.001, partial η2=0.470), with the greatest changes following both precooling trials. Mean
RPE did not differ between trials (p=0.213, partial η2=0.168), although there was a difference in
the change in RPE (p=0.03, partial η2=0.306). However, pairwise comparisons did not reveal
differences between individual trials. Neither mean heart rate (p=0.252, partial η2=0.154),
change in heart rate versus rest (p=0.458, partial η2=0.101) or finishing HR (p=0.734, partial
η2=0.051), differed between trials. Similarly, the mean heart rate as a percentage of maximum
heart rate (%HRmax) was not different between trials (p=0.089, partial η2=0.234), as shown in
Figure 55. The mean %HRmax for each trial was; CON 93.4 (3.8)%, PC 94.6 (4.9)%, HA 93.3
(3.8)% and HA+PC 91.6 (3.1)%. A difference in the mean Physiological Strain Index (PSI) was also
observed between CON and HA+PC (p=0.005, d=0.95), but all other trials did not differ. Sweat
loss was different between trials (p=0.008, partial η2=0.386), with the largest loss in HA (2.5
(0.5) L.hr-1), compared with CON (2.2 (0.8) L.hr-1), PC (1.7 (0.5) L.hr-1) and HA+PC (2.3 (0.6) L.hr-1)
respectively. Pairwise comparisons revealed a statistical difference between PC and HA
(p=0.006, d=1.50), but not other conditions. The change in blood lactate concentration was not
the same across all conditions (p<0.001, partial η2=0.648), with both HA (p=0.025, d=1.72) and
HA+PC (p=0.007, d=1.72) statistically greater than CON. Furthermore, the change in HA+PC was
also greater than that in PC (p=0.016, d=0.79). There was also a difference in the change in
blood glucose concentration (p=0.004, partial η2=0.459), with both PC (p=0.040, d=0.79) and
HA (p=0.037, d=0.75) greater than CON.
Figure 55: Mean (±SD) percentage of maximum heart rate maintained throughout each trial.
Error bars represent one standard deviation. Error bars for control and heat acclimation trials
are omitted for clarity, but homogeneity of variance was present.
80
85
90
95
100
105
1 KM 2 KM 3 KM 4 KM 5 KM
Per
cetn
age
of
max
imu
m h
eart
rat
e (%
)
Time trial distance
CON PC HA HA+PC
209
8.5 Discussion
The foremost aim of this investigation was to assess the efficacy of combining precooling
(acute) and heat acclimation (chronic) interventions for improving endurance running in the
heat. Previous investigations into an additive effect have not demonstrated significant
improvements, albeit utilising intermittent sprint cycling and/or endurance cycling protocols,
whereby heat strain may be less severe than endurance running. The current study is the first
to investigate a combined strategy prior to running, but also adopted a precooling technique
that afforded greater cooling volume than previous studies. Notwithstanding, these data
reaffirm previous observations, with precooling offering no further benefit to performance in
the acclimated individual following precooling, despite modest alleviation of physiological
strain. The second aim was to provide a direct comparison of the individual ergogenic potential
of precooling and heat acclimation interventions. Although a statistical difference was not
observed between conditions, these data indicate heat acclimation improves endurance
running performance in the heat, further than precooling.
8.5.1 Combined heat acclimation and precooling
In contrast with previous research studies that have combined individual cooling garments with
acclimation (Castle et al. 2011, Schmit et al. 2015), a whole body mixed methods precooling
technique was utilised, which is considered more potent for endurance performance (Bongers
et al. 2015, Tyler et al. 2015) and demonstrated large reductions in thermal sensation in Study
2 (Chapter 5). During intermittent sprinting exercise, heat acclimation appears to mediate heat
strain sufficiently, such that additional PC provides no further benefit (Castle et al. 2011; Brade
et al. 2012). However, as shown in Study 4 (Chapter 7), the magnitude of physiological
impairment during endurance running in the heat following HA, relative to cool conditions,
remains significant. Study 4 revealed notable impairments to VO2max and running time during
GXT 2 of 2.4% and 4.4%, respectively following HA. In spite of the theoretical potential to
improve running performance further, no performance improvement above the HA was
observed. In the only other study investigating HA+PC on endurance exercise, Schmit et al.
(2015) highlighted a potentially meaningful greater self-selected exercise intensity during the
first half of the trial, alongside a reduced thermal sensation. However, the greater pace was not
sustained, reducing alongside the dissipation of PC effects, with a comparable trend in the
precooled trials before HA. In the current study, despite a more aggressive cooling strategy in
HA+PC that resulted in small, but consistent differences in TCORE, TSKIN, core:skin gradient and
thermal sensation during the first half of the trial (Figure 54), a greater initial pace did not
occur. The reasons for this are unclear, but speculatively, may represent a different, and

210
ultimately sub-optimal, pacing strategy being adopted in HA+PC. Recent evidence indicates
athletes target a flatter pacing profile with familiarisation in the heat (Schmit, Duffield, et al.
2015) and as shown in Figure 53, HA+PC displays the smallest decrement in performance and
therefore the most even pacing profile. A more cautious pacing strategy is supported by a
slightly lower %HRmax during HA+PC until 4 km into the trial (Figure 55). Therefore, both the
mediated physiological and thermoregulatory strain afforded by HA+PC during the first half of
the trial, may not have been exploited, as individuals targeted an even pace. Previous studies
have suggested the induced cardiovascular and thermoregulatory adaptations from HA may
reduce the ergogenic effects of precooling by influencing the same mechanisms, such as a
larger core:skin gradient and reduced cardiovascular strain, creating an insensitivity or ‘ceiling
effect’ (Castle et al. 2011; Schmit et al. 2015). However, when an aggressive precooling
technique is adopted and heat strain remains severe, these data would contend otherwise,
evidencing small changes, notably in %HRmax and TSKIN, that indicate future investigations may
want to familiarise individuals with HA+PC to ensure pacing is optimised.
8.5.2 Comparison of heat acclimation and precooling
A secondary aim was to directly compare the effect of acute and chronic interventions on
endurance running performance, which has received little attention within the literature.
Participants ran 43 s (3%) faster following HA than in PC, which exceeds the typical error for
this trial 16 s (1.2%). In-turn PC afforded a 55 s (3.7%) improvement over control, whilst the
improvement was 98 s (6.6%) following HA, which was the only statistically significant
comparison in the analyses. That no other comparisons were statistically different likely reflects
a disparity in running performance within this cohort as shown in Figure 52, as well as the
adoption of a more conservative non-parametric statistical test, with both the large mean
differences and effect sizes indicative of meaningful changes between conditions. Elapsed time
was similar between HA and PC at 2 km (PC; 547 [46] s, HA; 538 [45] s), before PC
demonstrated a greater reduction between 2- 4 km (elapsed time at 4 km PC; 1135 [111] s, HA;
1108 [106] s). As shown in Figure 54, this reduction in running speed during PC coincides with
the dissipation of alleviated thermoregulatory strain, where both TSKIN and the core:skin
gradient are no longer improved relative to HA. The flatter pacing profile in HA may reflect the
trial order, as PC was not randomised with HA and repeated trials (Racinais et al. 2015b) and
familiarisation to the heat (Schmit, Duffield, et al. 2015) may result in a flatter pacing profile.
However, it is more likely that the greater reduction in running speed in PC reflects the
associated physiological strain, given the aforementioned dissipation of both a reduced TSKIN
and core:skin ratio. Concomitantly, this may result in a greater progressive reduction in VO2max,

211
necessitating a reduced running speed to maintain relative intensity during PC. The reduction in
maximum aerobic capacity has been suggested to be the most plausible explanation for the
decline in endurance performance under heat stress (Ely et al. 2009), whilst relative intensity
has been shown to be maintained across both hot, cold and hypoxic conditions (Racinais et al.
2015b; Périard & Racinais 2015). Given the transient nature, precooling does not provide
prolonged alleviation of cardiovascular and thermoregulatory stress, as shown by the
ineffectiveness of precooling on VO2max after approximately 30 min of exercise in Study 2
(Chapter 5). Conversely, Study 4 (Chapter 7) evidences meaningful improvements in VO2max
following acclimation, which would facilitate a greater maintained running speed, despite the
inevitable progressive decline in VO2max. The enhanced VO2max following acclimation arises
through enhanced plasma volume (Lorenzo et al. 2010) and possibly peripheral adaptation
from the high intensity training (Helgerud et al. 2007), whilst the rate of decline in VO2max
during exercise may be mediated by increased heat dissipation. Peripheral cutaneous and
sudomotor adaptations better maintain the core:skin gradient, which otherwise narrows as
TCORE and TSKIN increase, thereby reducing cutaneous blood flow demands (Cheuvront et al.
2010). In turn, a greater core:skin gradient will maintain stroke volume and VO2max (Périard et
al. 2011), delaying exercise termination under heat stress (Cuddy et al. 2014). Alongside a
mediated cardiovascular strain, heat acclimation will afford an improved perceived thermal
strain, both independently (Chapter 7), and concomitantly with reduced TSKIN (Schlader,
Simmons, et al. 2011a). Elevated TSKIN and perceived thermal strain are associated with the
voluntary reduction of exercise intensity in the heat (Schlader, Stannard et al. 2011a; Flouris &
Schlader 2015), although Ely et al. (2009), suggest this may to be to a lesser extent than the
decrement in VO2max, given the magnitude of VO2max impairment. However, relative intensity
and perceived thermal strain alone cannot fully explain the differences between HA and PC,
given the different starting speeds. This could reflect a lower training status of the current
cohort of runners, who began trials with a predetermined even-paced strategy, in comparison
to the highly experienced cyclists in the study of Racinais et al. (2015b) who maintained a fixed
relative intensity (%VO2max) from the start of the trial. Alternatively, a naivety of the optimum
pacing strategy following precooling would also seem plausible, given the marked reduction in
TSKIN that persists through the first half of the trial, which will differ from the afferent feedback
participants are accustomed to, and accordingly interpret, to determine self-selected running
speed in the heat (Flouris & Schlader 2015). Indeed, anecdotally, participants highlighted
ambiguity about how to maximise performance in PC, reinforcing the notion that pacing must
be practiced in advance of adopting PC in competition. Therefore, in conclusion, these data
212
would appear to be the first to demonstrate a marked advantage from STHA over acute
precooling prior to endurance running.
Despite the reduced performance compared with HA, these data reaffirm the potential for
mixed methods, pre cooling to benefit endurance performance in the heat when heat
acclimation is not possible. Although the use of mixed methods cooling is well supported
(Bongers et al. 2015; Tyler et al. 2015), this appears to be the first time this particular
aggressive and practical technique has been assessed during free-paced endurance exercise in
the heat. Despite suggestions that a lighter body mass may limit the effectiveness of
precooling, due to the amount of recruited muscle mass (Castle et al. 2011), these data
demonstrate benefits from precooling in individuals of similar body mass to those of Castle et
al. (2011) (~70 kg), potentially due to a greater thermal strain in running versus intermittent
cycling. As per previous research (Duffield et al. 2009) and in Study 2 (Chapter 5), PC did not
elicit a reduction in TCORE during the cooling phase. Similarly, an ‘after-drop’ was not observed,
whereby vasoconstriction dissipates and warm blood is subsequently cooled in the periphery
(Webb 1986), which is likely a result of the high metabolic heat production from the exercise
intensity during treadmill running. A reduced rate of TCORE increase may be inferred, given
similar response to CON, but at higher running speeds.
It should be acknowledged that the lack of suitable air-flow, as might be experienced
outdoors, may over-estimate the magnitude of the reported PC effect (Morrison et al. 2014),
although the influence will be less severe than in cycling due to the reduced air velocity during
running. Another potential limitation of this design is the failure to counterbalance the order of
the pre and post training time trials, therefore the magnitude of improvement may be
exaggerated. However, when compared against the typical error of 16 s (1.2%) following 5 days
high intensity normothermic training as in Study 4 (Chapter 7), the reported improvements all
appear to represent true differences.
In conclusion, these results suggest athletes and coaches should prioritise a HA strategy
where possible prior to endurance exercise in the heat. When this is not possible, a precooling
strategy that provides a large cooling impulse would appear to remain beneficial, although time
should be taken to familiarise with pacing strategies. Combined HA and PC appears to elicit a
better maintained core:skin gradient, which did not transfer into improved time trial
performance. Future investigations should consider familiarising individuals with HA+PC to
ensure pacing strategies maximise the alleviation of physiological strain.

213

214
9 Efficacy of the determinants of endurance performance for
predicting time trial performance in the heat
9.1 Introduction
In addition to investigating a range of interventions that seek to improve endurance
performance in the heat, a secondary aim of the thesis was to characterise the physiology
underpinning endurance running performance in the heat better. This not only facilitates a
more informed application of interventions, but also aids the prediction of performance and
informs training prioritisation. This Chapter will present a retrospective analysis investigating
the relationship between the determinants of endurance performance and 5 km treadmill time
trial performance, when the determinants are measured in both hot (32°C, 60%) and cool
(13°C, 50%) conditions. Therein, the findings of this analysis will help to characterise endurance
performance in the heat better with regard to the role of the physiological determinants in
producing a free-paced performance under heat stress, and may reinforce, or question, the
appropriateness of utilising the traditional determinants of endurance performance model for
research on endurance running in the heat.
The following questions were identified:
What percentage of the variation of 5 km running performance in the heat amongst
heterogeneous runners can be explained by the determinants of endurance performance
when measured in the heat?
What percentage of the variation of 5 km running performance in the heat amongst
heterogeneous runners can be explained by the determinants of endurance performance
when measured in the cool?
What is the strongest single predictor of endurance performance in the heat?
9.2 Methods
Data were taken from the hot and cool GXTs in Study 4 (Chapter 7), following
familiarisation, but prior to training. Data were pooled from both the heat acclimation and
control groups (n=17). Linear regression was adopted in order to determine the best predictor
of time trial performance from the LT, LTP, RE, VO2max and vVO2max. Tests for normality were
conducted and indicated the 5 km time trial and all respective predictor variables from both

215
hot and cool conditions to be normally distributed. All analysis was conducted using SPSS
(Version 20, SPSS Inc, Illinois, USA). As stated in Study 4 (Chapter 7), technical faults resulted in
no data for one measure of both VO2max and RE (different individuals). Consequently,
correlations are derived from n=17 for LT & LTP, n=16 for VO2max & RE and n=15 for vVO2max.
9.3 Results
Significant linear regression relationships were observed for LT, LTP, VO2max and vVO2max
versus time trial performance when measured in the heat, but not RE, as shown in Table 31
below. Therefore, all variables aside of RE, were entered into a full model (standard) multiple
regression, revealing a significant relationship with time trial performance (F=6.508, p=0.008,
R2=0.72, standard error of the estimate [SEE]=105.6 s). The model revealed the following
formula for predicting 5 km performance based on measures derived from a GXT in the heat.
5 km time (s) = 2352.608 + (-2.377*VO2max) + (-48.629*vVO2max) + (-69.266*LT) + (57.706*LTP).
Although the full model multiple regression approach does not quantify the precise
variance explained by each independent variable as a stepwise approach would, the full model
revealed the strongest relationship with time trial performance. Indeed, a stepwise approach,
which accepts or excludes additional variables into the model that improve the prediction
(probably of F to enter ≤0.050 and to remove ≥0.100), revealed a model whereby only vVO2max
was accepted into the model (F=29.27, p<0.001, R2=0.69, SEE=97.5 s).
When measured in the cool, significant relationships with time trial performance were
observed for all variables; LT, LTP, RE, VO2max and vVO2max, as shown in Table 30 below. Entering
the same variables as per the hot condition (excluding RE) into a full model multiple regression
revealed a significant relationship with time trial performance (F=11.396, p=0.001, R2=0.82,
SEE=85 s). However, adding RE to these variables further improved the model (F=11.465,
p=0.001, R2=0.86, SEE=77.8 s). The model revealed the following formula for predicting 5 km
performance based on measures derived from the cool GXT.
5 km time (s) = -220.569 + (-31.288*VO2max) + (40.994*vVO2max) + (-43.484*LT) + (61.911*LTP) +
(11.117*RE).
As with predictions from the hot conditions, this model explained time trial performance
better than a stepwise model, whereby again only vVO2max was accepted (F=58.10, p<0.001,
R2=0.82, SEE=75.1 s) into the prediction equation.

216
Table 30: Correlations (r) between the determinants of endurance performance and time trial
performance in existing literature and from this thesis (shown in bold). Where fixed blood
lactate concentrations other than 2 & 4 mMol.L-1 have been used, the respective value is stated
below. ‘INFL’ represents determination of the LT or LTP based on an inflection point, where
blood lactate concentration exceeds steady state (LT) or demonstrates an exponential increase
(LTP).
9.4 Discussion
When measured in the heat, vVO2max, VO2max, LT and LTP accounted for 72% of the total
variance in 5 km performance. Therefore, these relationships indicate endurance performance
in the heat is still underpinned by the traditional physiological determinants. However, the
strength of the overall model reveals greater unexplained variance than has previously been
reported between the relationship between laboratory variables and 16 km running
performance (R2=0.978, McLaughlin et al. 2010). However it should be acknowledged that
there is likely a greater anaerobic contribution during a 5 km time trial rather than 16 km
Study n Distance
(km)
VO2max RE vVO2max LT LTP
McLaughlin et al.
2010
17 16 -0.91 0.81 -0.97 -0.85 -0.89
3 mMol.L-1
Jones & Doust 1998 13 8 -0.69 - -0.93 -0.93
(INFL)
-0.81
Noakes et al. 1990 43 10 -0.55 0.41 -0.94
(PTV)
- -0.91
(INFL)
Stratton et al. 2008 39 5 -0.55 0.20 -0.89
(PTV)
-0.73
(INFL)
-
Morgan et al. 1989 13 10 -0.55 0.30 -0.78 - -0.85
-
Yoshida et al. 1993 57 3 -0.51 0.24 -0.75 -0.77
(INFL)
-0.60
This thesis (hot) 17 5 -0.70
r2=0.49
p=0.003
0.36
r2=0.11
p=0.205
-0.83
r2=0.69
p<0.001
-0.77
r2=0.59
p<0.001
-0.78
r2=0.62
p<0.001
This thesis (cool) 17 5 -0.67
r2=0.46
p=0.004
0.62
r2=0.38
p=0.011
-0.90
r2=0.82
p<0.001
-0.79
r2=0.63
p<0.001
-0.80
r2=0.64
p<0.001
217
(Londeree 1986), whilst the study of McLaughlin et al. (2010) also involved over-ground, rather
than treadmill running. Indeed, as shown in Table 30 (above), the strength of the relationship
between individual predictors and endurance performance is also lower than previously
reported, indicating other factors elicit a greater influence on endurance performance in the
heat. Finally, the SEE of the derived equations is of sufficient magnitude that predictions would
not be meaningful, given the typical variation observed in this population during time trial
performance in Study 4 (Chapter 7). Therefore, the traditional determinants of performance
may be considered prerequisites for success in the heat. However, there is far greater
unexplained variance than in normothermic conditions, indicating thermal specific factors also
influence performance. It should also be considered that these data are only specific to 5 km,
as for example, RE may exert a greater influence during longer events in the heat (Saunders et
al. 2004a), whilst the decrement to VO2max would progressively increase (Racinais et al. 2015b).
Furthermore, these relationships are derived from treadmill running, which has been modified
to replicate the increased energy expenditure of outdoor running (Jones & Doust 1996), but
may remain insensitive to small, intuitive changes in running speed (St Clair Gibson et al. 2006).
It is interesting to observe the apparently stronger model from the variables measured in
cool conditions (R2 hot = 0.72, R2 cool = 0.82), indicating time trial performance in the heat is
not as closely associated to the physiological responses during a GXT in the heat, as when the
determinants are assessed in the cool. One explanation for this may be that the fixed exercise
intensities during the GXT not eliciting analogous decrements on the determinants across
participants, possibly because of differences between individuals in terms of body composition
(Cramer & Jay 2015) and/or training status (Jay et al. 2011). The differences between hot and
cool GXTs cannot be explained by the addition of RE to the model, because whilst RE
strengthens the prediction of performance, the smaller model derived from VO2max, vVO2max, LT
and LTP already explained a greater proportion of variability and demonstrated a lower SEE
when measured in the cool.

218
Figure 56: Relationships between the determinants of endurance performance when measured
in a hot environment and 5 km time trial performance in the heat. A- VO2max, B - vVO2max, C –
Lactate Threshold, D – Lactate Turnpoint, E – Running economy.
There is generally considered to be a strong inverse relationship between VO2max and
performance (r=-0.81-0.91, Brandon 1995; Costill et al. 1973; Farrell et al. 1979; McLaughlin et
al. 2010, Noakes et al. 1990). As shown in Figure 56, the relationship between VO2max and
performance in the heat is weaker than these reported values, but very similar to other studies
utilising individuals who display both heterogeneous VO2max and running performance (Stratton
et al. 2008; Yoshida et al. 1993), as shown in Table 30. Appropriately, given the -7.7%

219
impairment in VO2max under heat stress observed in Study 4 (Chapter 7), VO2max in the heat
demonstrated a slightly stronger relationship than when measured in the cool. A high VO2max
has long been considered a pre-requisite for elite endurance performance, not least as a
consequence of the estimated energy requirements necessary to sustain running velocities
observed in high level competition (Bassett & Howley 1997). However, the strength of the
relationship between VO2max and performance may be weaker within elite athletes of similar
VO2max (Morgan et al. 1989). Notwithstanding, at sub-elite levels, such as the cohort within this
thesis, certain individuals may be genetically predisposed to demonstrate a high VO2max
(Bouchard et al. 1999), but yet produce slower running performance due to a reduced training
regularity or an inability to maintain an appropriate fractional utilisation of VO2max. Whilst
variation in training status, and the relatively small sample size may help to explain the
weakened predictive power of VO2max, it is also likely that specific thermal factors exert a
greater influence on performance, given the improvements in VO2max in the control group of
Study 4 (Chapter 7), but no improved time trial performance.
Running economy data, derived from a hot, incremental exercise test, revealed no
relationship with endurance performance (R2=0.11, p=0.205), unlike in cool conditions
(R2=0.38, p=0.011), which could indicate the assessment of RE during a hot incremental test to
be inappropriate. As discussed in Study 4 (Chapter 7), the influence of heat stress on RE is
equivocal, which may be a consequence of differences in exercise protocols and progressive
onset of heat strain and associated thermoregulatory responses. The GXT, starting at relatively
low intensities, may therefore initially afford a benefit to RE through a more efficient muscle
(De Ruiter & De Haan 2000), which is in contrast to the time trial that demonstrates a high,
sustained, intensity from the outset (~94% maximum heart rate). Consequently, despite being
matched for heat stress, the time trial results in a faster and heightened thermoregulatory
response, relative to the GXT. Accordingly, a stronger relationship was observed with the RE
measured in cool conditions, but the relationship remains relatively weak, reaffirming RE to be
a poor predictor of running performance of 5 km or similar (Yoshida et al. 1993, Stratton et al.
2008). This is unsurprising, given that RE is most related to longer distance events than 5 km
(Londeree 1986) and would appear to exert the greatest influence within a group of athletes
with relatively homogenous VO2max (Morgan et al. 1989), which was not the case in this sample
(VO2max range 51-75 mL.kg.-1min.-1).

220
Figure 57: Relationships between the determinants of endurance performance when measured
in a cool environment and 5 km time trial performance in the heat. A- VO2max, B - vVO2max, C –
Lactate Threshold, D – Lactate Turnpoint, E – running economy.
The relationships between endurance performance and both LT and LTP are stronger than
those for VO2max or RE, but remain weaker than previous research in normothermic conditions,
as shown in Table 30. Furthermore, it is notable that the relationships are also weaker than
those reported by Lorenzo et al. (2011), who conducted a comprehensive assessment of a
range of blood and ventilatory methods of assessing the aerobic-anaerobic transition, both in
hot and cool conditions. Lorenzo et al. (2011) demonstrated relationships of r= 0.87, 0.86 and

221
0.86 for the lactate inflection point (increase >0.2 mMol.L-1), 1 mMol.L-1 and 4 mMol.L-1
predicating performance in very hot (38°C, 30%) conditions respectively and r= 0.89, 0.91 and
0.91 for the lactate inflection point, 1 mMol.L-1 and 4 mMol.L-1 in cool conditions (13°C, 30%),
ultimately recommending thresholds to be assessed in the respective environmental conditions
the performance will take place in. The current data may therefore, indicate a lessened ability
of blood lactate indices to predict performance in shorter, endurance running events, that are
completed at a greater exercise intensity to the 1 hour cycling time trial adopted by Lorenzo et
al. (2011). This may reflect both the higher intensity of 5 km running, which is thought to
represent 94-98% of VO2max in elite athletes (Londeree 1986) as well as the shorter duration of
the protocol, which lasted 23 min on average in the heat. The training status of participants
should also be considered, as Lorenzo et al. (2011) used a highly trained cohort, who typically
display a less varied response than lesser trained athletes (Malcata & Hopkins 2014), whilst
Lorenzo et al. (2011) also pre-warmed individuals for 30 min to elevate TCORE in a controlled
manner prior to exercise. The weakness of the relationships between blood-based markers and
endurance performance again alludes to alternative factors influencing performance outside of
the traditional model in this time trial.
As a stepwise approach did not yield the best predicting model, the relative contribution of
each variable must be inferred from the respective coefficient of determination (R2) for each
variable. This indicates the strongest predictor to be vVO2max, reaffirmed by this being the only
variable accepted into stepwise models of regression, both in the heat and in the cool. This
observation is in broad agreement with previous literature that suggests vVO2max to be the best
predictor of endurance performance across a range of distances, as shown in Table 30. Despite
the limitations of the relationship between RE and endurance performance, vVO2max remains
the strongest predictor, both when derived from hot and cool GXTs. This observation reaffirms
the importance of training the parameters that determine vVO2max for improving 5 km
performance in the heat. Accordingly, Morgan et al. (1989) has highlighted the intuitive notion
that a direct link may exist between vVO2max and determinants of blood lactate indices such as
capillary density, fibre-type distribution, respiratory capacity and muscle enzyme activity,
suggesting that training of either VO2max, RE or lactate thresholds may provide mutual benefits.

222
10 General Discussion
10.1 Thesis aims
This thesis sought to optimise preparation strategies for endurance runners competing in a
hot environment. Both the multidisciplinary approach, as well as the adopted exercise
protocols, are novel in the context of evaluating endurance performance in the heat.
Experimental chapters incorporated both short and long-term strategies, and consideration
was not limited to thermal interventions, as shown by the inclusion of ischaemic
preconditioning. A multidisciplinary intervention approach to alleviating the detrimental
consequences of heat strain would seem appropriate given the multidimensional nature of the
cardiovascular, metabolic, neuromuscular and perceptual perturbations that collectively impair
endurance performance in the heat (Nybo et al. 2014). Moreover, endurance performance is
typically replicated through time trial or time to exhaustion trials, that evaluate either free-
paced exercise performance or the underpinning physiological mechanisms respectively, but
not both (Stevens & Dascombe 2015). Therefore, this thesis utilised a novel, holistic approach
involving a well-established incremental exercise protocol (Jones 2006a, Saunders & Green
2013) to encapsulate both the physiological responses and yield a valid estimate of
performance within a single test (Bassett & Howley 2000; Denadai et al. 2004; Joyner & Coyle
2008), in order to optimise interventions that athletes may wish to adopt.
This thesis also investigated the association between traditional markers of endurance
physiology; VO2max, running economy and blood lactate indices, and 5 km running performance
in a hot environment. Previous research indicates the lactate turnpoint remains a strong
predictor of endurance cycling performance in both hot and cold environments (Lorenzo et al.
2011) and that pacing is maintained as a relative percentage of VO2max during a 43 km cycling
time trial across different environmental conditions (Périard & Racinais 2015), indicating this to
be a sensitive and valid model for holistically evaluating endurance performance under heat
stress. However, these markers and their utility, have yet to be assessed individually, or as a
model, during running in the heat. The relative dearth of research on endurance running in the
heat, compared with cycling, may reflect the difficulties presented by the greater metabolic
heat production in running, given the prevalence of ethical institutional TCORE termination
boundaries that persist, despite routinely being exceeded when exercising in the field (Nybo &
Gonzalez-Alonso 2015). Therefore, there was significant novelty in the exercise modality used,
as it was unclear if previous effects from interventions such as precooling and heat acclimation
observed in cycling, transfer to running.

223
The first investigation (Chapter 4) was conducted to identify a reliable and valid measure of
TSKIN, that could be adopted for subsequent studies, highlighting the need for a robust measure
that did not suffer from long, trailing wires. Experiments then focussed on acute interventions,
providing novel insights into the effectiveness of cooling internally versus externally, as well as
whether previously observed benefits of ischaemic preconditioning transferred to a hot
environment. Acute interventions were selected based upon published evidence for influencing
endurance performance, either in hot or normothermic conditions, as well as the practicality
for use at a competition. Study 4 (Chapter 7) introduced a chronic approach, adopting a simple
and novel method of exercise prescription within a widely utilised short term heat acclimation
(STHA) model, in order to quantify the effect of STHA on the determinants and time trial
performance. Finally, Study 5 (Chapter 8) provided a direct comparison of the best supported
acute technique versus both heat acclimation and a combined strategy. This reflected the
relative dearth of direct comparisons between acute and chronic interventions, and will inform
athletes and coaches of the worthiness of completing time-consuming and expensive
acclimation or acclimatisation, compared with a cooling manoeuvre in the 30 min prior to
performance.
This General Discussion will firstly summarise the findings of individual experimental
chapters, before discussing the efficacy of the adopted interventions for enhancing the
determinants of endurance performance in the heat. A retrospective analysis will then be
presented, exploring the factors that best characterise and predict endurance running in the
heat. Based on these conclusions, practical recommendations arising from the thesis will be
provided, as well as acknowledging the limitations of the work within this thesis and areas upon
which future research can extend.
10.2 Summary of findings
Study 1 (Chapter 4) investigated the validity and reliability of TSKIN measurements using
hard-wired thermistors, a telemetry thermistor system and thermal camera. Relative to hard-
wired thermistors, telemetry thermistors demonstrated good validity (typical error [TE] =
0.18°C) and reliability (TE = 0.31°C) throughout rest and exercise. Poor validity (TE = 0.35°C) and
reliability (TE = 0.52°C) was observed for a thermal camera, indicating use may be limited to
controlled, static situations as it was inappropriate for safe monitoring of TSKIN at rest and
during exercise testing in the heat. Based on waterbath and exercising comparisons, telemetry
thermistors appear more valid and reliable than the traditional criterion measure of hard wired
thermistors, and are more convenient for treadmill running. Consequently, a telemetry
thermistor system was validated for measuring TSKIN in the heat throughout subsequent studies.

224
Study 2 (Chapter 5) compared internal (ice slurry ingestion) and external (multiple cooling
garments) precooling strategies on the determinants of endurance performance in the heat.
Neither technique influenced VO2max, however both techniques demonstrated modest effects
on blood lactate concentration, which may help prevent impairments of LT and LTP in the heat.
This may occur through a reduction in body temperature preserving splanchnic circulation,
thereby maintaining pyruvate conversion in the liver. An independent effect on lactate removal
was supported by the maintenance of oxygen consumption at the muscle, based on RE, as well
as the unchanged RER. Changes in blood lactate concentration were at the upper end of day-to-
day variation, but may be more pronounced under greater heat strain. Internal cooling did not
elicit greater effects than external cooling. However, external cooling demonstrated greater
effects on TSKIN, PSI and thermal sensation. Finally, the rate of change in TCORE was reduced in
external cooling, compared with internal, alluding to an increased core:skin gradient.
Study 3 (Chapter 6) involved the second investigation of acute methods. Ischaemic
preconditioning (IP) may afford an ergogenic effect independently of alleviating thermal strain,
through haemodynamic (Bailey et al. 2012b) and/or metabolic mechanisms (Andreas et al.
2011). Ischaemic preconditioning did not proffer any benefit across the determinants of
endurance performance in the heat, with metabolic alterations under heat stress apparently
insensitive to IP signalling. Furthermore, IP did not influence deep muscle temperature, but
elicited a modest influence on TCORE (-0.1°C) during subsequent exercise. Following Study 3
(Chapter 6), of the three acute interventions investigated, external precooling was considered
the most effective and most suitable to complement a chronic heat-alleviating strategy.
Study 4 (Chapter 7) investigated the effect of a STHA strategy on the determinants of
endurance performance and 5 km performance. Both hot and temperate GXTs indicated the
decrement across the determinants afforded by heat stress, to which intervention’s effects
were interpreted. Compared with cool conditions, heat stress impaired VO2max (-7.7%), LT (-
4.4%), LTP (-4.8%), vVO2max (-4%) and running time during GXT 2 (-19%), but improved RE
(5.3%). A control group (CON) was adopted to differentiate between the contributions of
thermal and exertional strain during STHA on the subsequent exercise performances. The
independent effect of thermal strain, above that of normothermic high intensity training,
accounted for improvements in running time to exhaustion (STHA 20.8%, CON 9.8%), TT
performance (STHA 6.2%, CON 0.6%) and VO2max (STHA 7.3%, CON 3.8%). Heat acclimation was
attained through high intensity cycling (87% maximum HR), prescribed relative to body mass
(2.7 W.kg-1), which maintains thermal strain both between and within individuals. The disparity

225
between the respective improvements determinants of endurance performance and time trial
performance indicates specific thermal are necessary in order to improve performance.
Study 5 (Chapter 8) provided a direct comparison of precooling (acute), heat acclimation
(chronic) and a combined (HA+PC) intervention during 5 km time trial performance in the heat.
The adopted interventions addressed previous concerns that previous cooling techniques may
have been insufficient (Schmit et al. 2015), that precooling may be unnecessary following long
term heat acclimation (Castle et al. 2011). However, external precooling provided no further
benefit to performance following acclimation, despite modest alleviation of physiological
strain. No statistical difference was observed in 5 km performance following precooling and
heat acclimation (STHA +6.6%, precooling +3.7%) however this likely represented a meaningful
improvement following STHA. individuals should prioritise a HA strategy, however when this is
not possible, precooling remains beneficial. Combined HA and PC appears to elicit a better
maintained core:skin gradient, which did not transfer into improved time trial performance.
Consideration should be given to familiarising with pacing following precooling alone and when
following acclimation.
Study 6 (Chapter 9) presented a retrospective analysis of how the determinants of
endurance performance predict 5 km time trial performance in the heat, both when measured
in the heat and in cool conditions. Multiple, linear regression indicated the physiological
determinants of endurance performance do not accurately predict time trial performance
when measured in the heat (R2=0.72, standard error of the estimate =105.6 s), or in the cool
(R2=0.86, standard error of the estimate =77.8 s).
10.3 Efficacy of acute and chronic interventions for enhancing the
determinants of endurance performance
Traditionally, the determinants of endurance performance may be enhanced through
chronic (>4 weeks) endurance training (Midgely et al. 2007), with training volume, intensity and
frequency prescribed specific to an individual’s needs and the event in question. This is
befitting with training programmes that routinely overload specific physiological mechanisms in
order to exceed a critical intensity to maintain chronic adaptation (Hellebrandt & Houtz 1956).
However, as an individual’s training status improves following a large volume of training,
diminishing returns may be observed, resulting in a plateau of adaptation (Midgley et al. 2007).
This complicates interpreting the true response of training when the training history of a cohort
is unknown or heterogeneous, but also supports the investigation of alternative interventions

226
to which individuals may not be desensitised to, or at a plateau phase, in order to influence the
underpinning physiology of a specific determinant. In the following section, the efficacy of the
adopted interventions within this thesis will be discussed relative to their influence on each
individual determinant of endurance performance in the heat, and how this compares to
improvements that are often observed from traditional endurance training. An overview of the
effect of all interventions on the determinants of endurance performance is provided below in
Table 31.
Table 31: Improvements in dependent variables derived from graded exercise tests from
interventions investigated in this thesis. All data are presented as means (±SD) and represent
within group changes, relative to the control condition of the respective chapter.
10.3.1 VO2max
The single most important physiological characteristic for an endurance athlete is
purported to be VO2max (Saltin 1967). VO2max represents the functional capacity of the
cardiovascular system to oxygenate the blood, as well as transport and consume oxygen at the
muscle, during maximal exercise that utilises a large muscle mass (Bassett & Howley 2000). A
plateau in oxygen consumption during a GXT is often, but not always, observed (Edvardsen et
al. 2014), as venous return becomes insufficient to maintain cardiac output and oxygen delivery
to sustain exercise (Cerretelli & Di Prampero 1987). The increase in cutaneous blood flow under
heat stress exacerbates exertional cardiovascular strain, typically impairing VO2max by 5-20%
(Nybo et al. 2014), whilst an impairment of -7.7% was observed in Study 4 (Chapter 7). Within
this thesis, all interventions displayed the potential to mediate the primary systemic limitation
to VO2max, albeit via different approaches. Precooling affords individuals a reduced core or
peripheral body temperature, thus reducing skin blood flow requirements (Price & Maley
LT LTP RE VO2max vVO2max Running time GXT 2
Internal
precooling
+2.1 (2.7) %
dav= 0.22
+1.2 (1.4) %
dav= 0.16
-1.5 (6.7) %
dav= 0.23
+0.7 (8.7) %
dav= 0.05
+0.2 (7.4) %
dav= 0.02
+5.0 (18.6) %
dav= 0.11
External
precooling
+2.2 (2.8) %
dav= 0.23
+1.1 (1.9) %
dav= 0.15
-1.3 (7.1) %
dav= 0.17
+2.3 (8.1) %
dav= 0.23
+3.2 (10.9) %
dav= 0.26
+6.4 (21.4) %
dav= 0.17
Ischaemic
preconditioning
-0.4 (4.4) %
dav= 0.04
+0.3 (3.0) %
dav= 0.02
+1.4 (3.0) %
dav= 0.20
+1.1 (3.9) %
dav= 0.17
+2.6 (3.4) %
dav= 0.33
+10.0 (21.4) %
dav= 0.58
Heat acclimation +4.0 (6.0) %
dav= 0.24
+2.5 (2.9) %
dav= 0.20
-3.5 (3.5) %
dav= 0.59
+7.3 (4.0) %
dav= 0.47
+3.5 (5.3) %
dav= 0.24
+20.8 (12.7) %
dav= 2.09
227
2015). Accordingly, this would be expected to maintain cardiac output and mean arterial
pressure for longer, in accordance with the maintenance of VO2max in thermo-neutral, versus
hot environments (Périard et al. 2011). The underpinning mechanisms of ischaemic
preconditioning remain a source of contention (Salvador et al. 2015; Marocolo et al. 2015;
Sharma et al. 2015; Barbosa et al. 2015) however, previous improvements in maximal aerobic
performance have lead authors to propose an improved muscular blood flow of peripheral
vasculature arising from nitric oxide release (Bailey et al. 2012b). From a chronic perspective,
heat acclimation is well supported for maintaining VO2max in the heat through plasma volume
expansion (Sawka et al. 1985, Lorenzo et al. 2010), whilst medium and long-term programmes
may also induce further localised cardiac adaptations such as a decreased myocardial VO2
(Horowitz et al., 1986).
However, despite these potential mechanisms, no acute interventions elicited an enhanced
VO2max. In Study 2 (Chapter 5) it should be noted that thermometric effects of both cooling had
likely dissipated during GXT 2 and thus at the point of VO2max, supported by the similarity in
TCORE and TSKIN across cooled and non-cooled trials, thereby reinforcing the transient nature of
cooling. Therefore, the independent effect, or indeed the lack of effect of precooling
techniques on VO2max cannot be discerned from these data. Despite differences in exercise
intensities, the time-course of the adopted protocol is not dissimilar to athletic events whereby
a precooling intervention would occur prior to a warmup, before a competition of 24-32 min of
exercise, which may culminate in an all-out end-spurt. Therefore, whilst a greater cooling
impulse and/or a shorter duration protocol may reveal an influence on VO2max, the ecological
validity of assessing VO2max and precooling in isolation is questionable, given the effects will
remain transient in competition. Whilst precooling techniques did not enhance VO2max, they did
prolong running during GXT 2 by ~5%, which is in keeping with previous evidence indicating
precooling may continue to influence exercise performance after thermometric effects have
dissipated, due to a reduced perceived strain (Duffield et al. 2010). Therefore, precooling may
increase the propensity to elicit a VO2max, rather than VO2peak, given the necessity to be highly
motivated to achieve VO2max, which is likely heightened under such extreme environmental
conditions (Levine 2008), although this cannot be discerned from the data of Study 2 (Chapter
5) due to the shorter data averaging procedure adopted.
In Study 3 (Chapter 6), the apparent insensitivity of VO2max under heat stress to IP was
consistent with the submaximal blood lactate and oxygen uptake responses in the heat, but
also reflects the wider literature and the variability within VO2max effects (Marocolo et al. 2015).
Methodological differences between studies prevent synthesis of results, as the relatively small

228
number of studies conducted on ischaemic preconditioning and exercise performance vary with
regard to; the time of exercise following preconditioning, the type of placebo/control
condition, information provided to participants, exercise mode, cohort training status and data
analysis techniques (Salvador et al. 2015). Notwithstanding the lack of consensus, the data of
Study 3 indicates the influence of heat stress to supersede the purported mechanisms that may
enhance VO2max. Consequently, the acute interventions within this thesis are not well-
supported for enhancing or maintaining VO2max under heat stress.
From a chronic perspective however, STHA afforded consistent and meaningful increases in
the heat for all but one participant for VO2max. (+7.3%, d=0.47), such that no difference was
observed relative to VO2max under cool conditions. Although VO2max in the control group
increased by 3.8% (d=0.30), this did not constitute a meaningful change (>2 mL.kg-1.min-1,
Tanner & Gore 2013) and remained lower than VO2max in the cool (d=0.56). However, it should
be acknowledged that these inferences are made in the absence of a Group*Time interaction
effect for VO2max, likely reflecting the small sample of the control group (n=7) and within the
STHA group for this measure (n=8). Hypervolaemia is advocated as the primary mechanism
facilitating an increased VO2max following heat acclimation within this timescale (Sawka et al.
2011). Plasma volume expansion of 5.7% was observed following STHA, indicating an enhanced
delivery of haemoglobin carrying O2 to the target tissue as a consequence of increased stroke
volume for matched heart rate. Alongside an increased ability to deliver oxygen to the muscle,
hypervolaemia may also facilitate a reduced blood temperature, in turn promoting a leftward
shift in the oxyhaemoglobin saturation curve, thereby improving the oxygen carrying capacity
of the blood (Barcroft & King 1909). The relatively high training intensity (~81% maximum heart
rate control, ~87% maximum heart rate STHA) is associated with faster and larger
improvements in VO2max than moderate intensity training under normothermic conditions
(<80% VO2max, Helgerud et al. 2007; Montero et al. 2015; Milanović et al. 2015). Therefore, high
intensity training may have also contributed to the plasma volume expansion, given that
haemodynamic adaptations are inducted first, following high intensity training (Montero et al.
2015). A stimulative role for high intensity exercise would also seem appropriate following
recent evidence suggesting permissive dehydration may not always elicit plasma volume
expansion following similar STHA protocols (Neal et al. 2015). Whilst high intensity training may
enhance VO2max through a multitude of adaptations aside of plasma volume expansion (Bacon
et al. 2013), many of these adaptations would not be expected to present within this timescale
or from the current exercise stimulus. For example, cardiac factors such as increased left
ventricular size, myocardial contractility and end-diastolic volume, that collectively increase

229
stroke volume and greater systemic blood flow, are generally associated with at least 4 weeks
of training (Jones & Carter 2000; Midgely et al. 2007) and appear to necessitate a mechanical
myocardial overload that normally involves training above VO2max for adaptation (Cooper 1997).
Similarly, peripheral adaptations such as increased capillary density (Ingjer 1979) and
mitochondrial enzyme content (Green et al. 1992) collectively improve oxygen extraction and
therefore enhance the arteriovenous oxygen difference (a-VO2diff) component of the Fick
equation, but require over eight weeks of training (Montero et al. 2015). Furthermore, the
recent meta-analysis of Montero et al. (2015) indicates the strongest relationship between
improvements in VO2max and maximal cardiac output, rather than the a-VO2diff following
endurance training.
In conclusion, acute strategies do not appear to influence VO2max, and in the case of
precooling, not within the timescale of the adopted protocol or likely competition event.
Conversely, chronic heat acclimation affords adaptations that increase VO2max, which will likely
benefit endurance performance in the heat in accordance with the traditional model (Bassett
and Howley 2000).
10.3.2 Blood lactate response
Blood lactate indices, the lactate threshold (LT) and the lactate turnpoint (LTP), denote the
respective initial, and exponential, increases in blood lactate concentration during incremental
exercise. These markers therefore demarcate an aerobic to anaerobic transition (Faude et al.
2009), as the proportion of ATP production via anaerobic processes progressively increases to
complement oxidative phosphorylation in order to meet the energetic demand of the exercise
intensity. Exercise above these thresholds is associated with an increased respiratory,
perceptual and metabolic strain (Jones & Carter 2000), leading to expedited fatigue and/or
exercise termination from metabolic acidosis (Sahlin 1992), as well as accelerated muscle
glycogen depletion, that may be accentuated during prolonged or repeated exercise in the heat
(Boyd et al. 1974). The exercise intensities corresponding to blood lactate thresholds are
reduced in the heat (Powers et al. 1985; Smolander et al. 1986; Lorenzo et al. 2011), in
accordance with elevated body and muscle temperatures mediating a shift to glycogenolysis
(Febbraio et al. 1994) and reduced splanchnic blood distribution to facilitate peripheral
vasodilation (Rowell et al. 1968), but appears independent of hypohydration (Papadopoulos et
al. 2008). Consequently, the decrement to the thresholds is progressive and proportional to
heat strain, with reductions of 4.4% and 4.8% for LT and LTP observed within this thesis. The
LTP appears to remain a valid predictor of one-hour endurance cycling performance in the heat

230
(r=0.86-0.89, Lorenzo et al. 2011), despite a 5% reduction at 38°C and 30% relative humidity.
Experimental chapters revealed a relative insensitivity of the blood lactate response to acute
interventions within this thesis. Small, albeit consistent, improvements in thresholds were
observed in Study 4 (Chapter 7), as shown in Table 30 (above), potentially arising from reduced
core or skin temperatures maintaining lactate-pyruvate conversion in the liver. Whether these
effects would be enlarged following a more aggressive combined internal and external
technique, or under more severe heat strain warrants consideration. Retrospective analysis of
these data alludes to a relationship between ice slurry ingestion enhancing the lactate
thresholds to a greater extent in individuals with greater body mass (LT; r=0.64, p=0.03, LTP;
r=0.76, p=0.01) and body surface area (LT; r=0.60, p=0.05, LTP; r=0.63, p=0.04), whereas the
improvements following external cooling appeared to be independent of anthropometric
characteristics (all comparisons r=0.22-0.41, p>0.05). As ice slurry ingestion was delivered
relative to body mass, future external cooling techniques may consider adjusting the cooling
volume of external garments to cover a greater surface area for larger athletes, or for a longer
duration, in order to elicit changes in lactate thresholds.
Following IP, Bailey et al. (2012a) reported a reduced increase in blood lactate
concentration during a GXT, that was not replicated within a similar protocol under heat stress,
in Study 3 (Chapter 6). Bailey et al. (2012a) attributed the mediated blood lactate response and
prolonged time to reach OBLA (4 mMol.L-1) to improvements in vascular function and muscle
blood flow, that may have enhanced the removal and transport of lactate. The same authors
subsequently reported the maintenance, rather than reduction, of flow-mediated dilation
within the brachial artery following preconditioning (Bailey et al. 2012a), reaffirming a role for
haemodynamic changes following IP. Alongside this mechanism, increased mitochondrial
lactate oxidation has also been proposed to contribute to a reduced blood lactate
concentration, either independently (Pang et al. 1995; Andreas et al. 2011), or concomitantly
with the haemodynamic changes arising from increased endothelial nitric oxide release that
attenuates sympathetic vasoconstriction (Kimura et al. 2007). Assuming an increased muscle
blood flow was achieved, the data from Study 3 (Chapter 6) would appear supportive of
previous observations that increased blood lactate accumulation under heat stress does not
occur due to ischaemia, but may be better explained by alternative explanations, such as
plasma-adrenaline levels (Febbraio 2001). It would appear that the purported underpinning
mechanisms of peripheral vasodilation and/or altered mitochondrial function for reducing
blood lactate concentration following IP do not supersede the influence of heat strain.
Therefore, as shown in Table 30, the largest improvements occurred following STHA, of 4% and
231
2.5% to the LT and LTP respectively, although this was not statistically greater than the
normothermic control training group, that improved LT and LTP by 3.4 and 1.8% respectively.
Furthermore, both LT and LTP remained impaired in the heat, relative to cool conditions
following STHA. Unlike the chronic approach of STHA, acute interventions such as precooling
and IP would only afford transient blood lactate dynamics, rather than a prolonged effect that
is sustained across subsequent days arising from physiological adaptation.
Notwithstanding the lack of statistical difference relative to the control group in Study 4
(Chapter 7), the improvement from STHA remains comparable to the 5% increase reported by
Lorenzo et al. (2010) following a two-week long term heat acclimation programme. The
physiological adaptations from STHA that enhance the thresholds may differ from those
following typical endurance training (Jones & Carter 2000). STHA resulted in a reduced body
temperature and hypervolaemia, both of which likely contribute to a mediated splanchnic
haematic redistribution (Rowell et al. 1968), whilst a reduced body temperature may proffer
reduced plasma adrenaline levels, affording a relative maintenance of fat oxidation, supported
by the lower RER observed (Febbraio et al. 1994). However, these apparently thermal-related
mechanisms cannot wholly account for the improvements, given the change in the control
group of Study 4 (Chapter 7) following normothermic training. This indicates a contribution
from alternative mechanisms, possibly due to the consistently high training intensity, an
observation that is supported by recent data demonstrating no effect on the lactate threshold
following 5 days of STHA and variable intensity exercise (Chalmers et al. 2016). The control
training was completed at a mean intensity of ~81% of maximum heart rate, that may have
recruited type 2 muscle fibres (Gollnick et al. 1974), as well as affording a consistently high
blood lactate level that appears to promote adaptation in clearance mechanisms (Weltman et
al. 1992). However, to what extent these non-thermal alternative mechanisms contribute is
unclear, as traditionally improvements to the lactate thresholds arise following long-term
training, with a 50-100% increase in the number, size and enzyme content of mitochondria,
enhancing mitochondrial respiration capacity and the ability of skeletal muscle to oxidize
pyruvate following weeks or months of training (Holloszy & Coyle 1984). Similarly, extracellular
adaptations such as increased capillary density that increase the transit time for red blood cells
to complete metabolite exchange with working muscles, are observed across similar timescales
(Ingjer 1979). Despite the lack of statistical difference, the mean response of the STHA group
may reflect a meaningful improvement following STHA above that of the control group, as
shown below in Figure 58.

232
Figure 58 Top: Blood lactate response to 5 days short term heat acclimation training. Bottom:
Blood lactate response to 5 days of normothermic training. X axis represents stage number
during incremental running test (GXT 1).
In accordance with the determinants of endurance performance model (Bassett & Howley
2000), improvements to the thresholds will afford not only a higher sustainable fractional
utilisation of VO2max under heat stress, but a reduced rate of glycogen utilisation and potentially
improved oxygen uptake kinetics that is less reliant on anaerobic metabolism as exercise
intensity changes (Carter et al. 1999; MacRae et al. 1985).
In conclusion, acute interventions of precooling and ischaemic preconditioning afforded
small or no effect on blood lactate thresholds respectively in the heat, whilst the chronic
approach of STHA provided the largest effects, with these benefits arising through a
combination of specific thermal and traditional endurance training adaptations.
10.3.3 Running economy
Running economy (RE), a representation of the energy demand for a given velocity of
submaximal running, combines with VO2max and the sustainable fractional utilisation of VO2max,
0.0
1.0
2.0
3.0
4.0
5.0
6.0
7.0
8.0
REST EX 1 EX 2 EX 3 EX 4 EX 5 EX 6
Blo
od
lact
ate
(mM
o.L
-1)
GXT 1 stage number
STHA Pre STHA Post
0.0
1.0
2.0
3.0
4.0
5.0
6.0
7.0
8.0
REST EX 1 EX 2 EX 3 EX 4 EX 5 EX 6
Blo
od
lact
ate
(mM
o.L
-1)
GXT 1 stage number
CON Pre CON Post

233
to determine running performance for a given distance (Foster & Lucia 2007). Appropriately, an
economical runner demonstrates a lower oxygen consumption for a given velocity, utilising a
lower percentage of their VO2max, thereby preserving fuels, minimising metabolic heat
production and necessitating a smaller contribution from anaerobic metabolism (Saunders et
al. 2004a; Jones 2006b). Running economy is multifactorial, combining biomechanical,
physiological and neuromuscular variables (Saunders et al. 2004a; Barnes & Kilding 2015).
Traditionally, improved RE has been associated with a high training volume and distance
(Morgan et al. 1995), attributed to neuromuscular and gait adaptations (Cavanagh & Williams
1982) that result in improved motor unit synchronisation (Barnes & Kilding 2015). However, a
dearth of longitudinal studies with appropriately controlled potential co-variates, such as
training status and training intensity, confounds an accurate quantification of the strength of
this relationship (Midgely et al. 2007). In keeping with the multifactorial nature of running
economy, multidisciplinary acute interventions have been shown to enhance running economy.
For example, resistance training increases muscle strength and the musculoskeletal unit
stiffness (Barnes et al. 2013), enhancing stored elastic energy in the lower limbs, improving a
runner’s biomechanics. Similarly, plyometric training provides neuromuscular improvements,
such as improved motor unit recruitment (Paavolainen et al. 1999). From a physiological
perspective, the most common, initial adaptations that improve RE following a high training
volume appear to be haematological changes, notably increased plasma volume and red blood
cell mass (Sjödin et al. 1982). Subsequently, central and peripheral cardiovascular adaptations
may present, such as increased stroke volume and increased capillarisation respectively, which
may enhance all of the determinants of endurance performance, not just running economy
(Bassett and Howley 2000).
In keeping with the multidisciplinary approach of this thesis, running economy would
appear to be sensitive to improvement from a range of different perspectives, however the
adopted interventions within this thesis were all orientated around the physiological
parameters that influence running economy. The influence of heat stress on running economy
is contentious, with both enhanced (MacDougal et al. 1974) and reduced (Rowell et al. 1967)
submaximal VO2 reported in the heat. Energy demanding thermoregulatory responses and a
reduction in the efficiency of oxidative phosphorylation in mitochondria may occur under heat
stress (Brooks et al. 1971), however oxygen kinetics remain unchanged (Koga et al. 1997; Nybo
et al. 2001; Burnley et al. 2002), avoiding complications arising from the VO2 slow component
within GXT 1. Notwithstanding these divergent responses, poor running economy elicits a
greater MHP and therefore risks an expedited onset of heat strain (Bergeron 2014). The mixed

234
results may reflect an energetic demand proportional to heat strain and the thermoregulatory
responses at the time of measurement, such as sweat gland activation and hyperthermic
hyperventilation (Sancheti & White 2006). Hyperventilation alone has been shown to increase
VO2 by 31–50 ml (0.4-0.6 mL.kg-1. min−1) when ventilation is in the range of 117-147 L.min-1
(Aaron, Johnson, et al. 1992; Aaron, Seow, et al. 1992). However, when heat strain is modest,
an additional energy demand may not be apparent and physiological perturbations may be
offset by biomechanical alterations, such as a warmer muscle possessing increased mechanical
efficiency (De Ruiter & De Haan 2000; Racinais & Oksa 2010). Therefore, it is interesting to note
Study 4 (Chapter 7) did not reveal an impairment to running economy under heat stress, but
rather a relative improvement of 5.3%, indicating any metabolic perturbations arising from ~24
min of incremental running within GXT 1 to be subordinate to the beneficial mechanical effects.
This is supported by the lack of observable increase in ventilation in the heat during GXT 1,
which may be a consequence of the modest differences in the rate of TCORE increase between
hot and cold conditions (GXT 1 finishing TCORE hot 38.7°C, cool 38.5°C), given the close
relationship between TCORE and hyperthermic hyperventilation (Cabanac & White 1995).
Accordingly, it is unsurprising that cooling afforded no improvement to running economy in
Study 2 (Chapter 5). However, given that a lowered ventilation rate has been shown to improve
running economy by 3% (Franch et al. 1998), it is possible precooling would have provided a
benefit under greater heat strain where a cooler body would mediate an elevation in
hyperthermic hyperventilation. Despite suggestions that ischaemic preconditioning may afford
reduced mitochondrial oxygen consumption as a consequence of nitric oxide release (Cooper &
Brown 2008), a reduction in oxygen uptake during submaximal exercise has yet to be widely
observed (De Groot et al. 2010; Crisafulli et al. 2011; Clevidence et al. 2012). The results of
Study 3 (Chapter 6) are in keeping with these observations, demonstrating IP does not reduce
oxygen consumption during submaximal running in the heat. From a chronic perspective, no
apparent benefit from STHA was observed, with differences not statistically different from the
control training group. However, the 7.3 mL.kg-1.km-1 (3.5%, dav=0.59) increase in VO2 following
STHA, compared with 2.4 mL.kg-1.km-1 (1.1%, dav=0.12) following control, indicates meaningful
differences in the change in running economy between training types. Indeed, an elevated
submaximal VO2 would appear detrimental to endurance performance, but an increased
oxygen uptake is not uncommon when VO2max and/or the fractional utilisation have increased
(Midgely et al. 2007), with some previous studies suggesting there may be an inverse
relationship between RE and VO2max. Accordingly, Study 4 (Chapter 7) demonstrated increases
in both VO2max and the LTP, which may explain this finding.

235
In conclusion, running economy was unchanged following precooling and ischaemic
preconditioning and apparently impaired by STHA, although this may be an artefact of
improvements to the LTP and/or VO2max. (Pate et al. 1992; Morgan & Daniels 1994).
10.3.4 vVO2max
vVO2max may be calculated from extrapolating the regression line of an individual’s running
velocity and VO2 relationship to the measured VO2max (Daniels 1985) or, as appears to be more
commonly adopted, by dividing an individual’s VO2max by the mean running economy (Jones
2006a). vVO2max is a simple performance metric, easily interpretable by both athletes and
coaches, and appears to be the strongest predictor of running performance at both 8 km (Jones
& Doust 1998) and 16 km (McLaughlin et al. 2010). Conceptually, vVO2max demonstrates how an
athlete with good running economy, but the same VO2max as a competitor, will run at a greater
velocity as they approach maximal intensities. The strong relationship between vVO2max and
endurance performance represents the integration of two primary determinants of endurance
performance into one variable, however running performance will also be largely influenced by
the lactate turnpoint determining the fractional utilisation of VO2max an individual can sustain.
By combining two physiological variables, vVO2max may also reveal differences that arise from
subtle changes in either VO2max or running economy, which individually do not appear
meaningful or reach statistical significance, but combine to represent meaningful performance
differences. Despite the prevalence of vVO2max, it does not appear to have previously been
investigated under heat stress. Study 4 (Chapter 7) revealed a 4% reduction in vVO2max under
heat stress, which will have been predominantly determined by the reduction in VO2max, given
the improvement to running economy afforded by the hot environment. In keeping with the
lack of effects on running economy and VO2max, neither internal nor external cooling elicited a
statistical effect on vVO2max. Whilst a ~3% improvement following external cooling appears
notable, the response was highly variable, as demonstrated by the high standard deviation of
the percentage change (10.9%). Moreover, the 0.4 km.h-1 change is below what appears
meaningful (0.5 km.h-1, Billat & Koralsztein 1996). Study 3 (Chapter 6) revealed a similar
magnitude of improvement in vVO2max (2.6%), which did elicit a statistically significant effect
(d=0.33), however it is again unclear how meaningful this is, given the 0.4 km.h-1 mean
difference. The effect following IP would appear to be the result of small changes in both
running economy and VO2max that individually are not apparent, but yield an effect when
combined. In accordance with the magnitude of effects on the other determinants of
endurance performance, STHA demonstrated the greatest effect on vVO2max, although the
change in speed (0.5 km.h-1) and percentage change (3.4%) remain modest. The large (-7.7%)

236
increase in VO2max would appear to have been attenuated by the greater oxygen uptake
observed following STHA.
In conclusion, despite the novel application of a range of thermal and non-thermal based
interventions, no intervention yielded a meaningful and/or consistent improvement in vVO2max.
10.4 Unexplained variance during endurance performance in the heat
In addition to investigating a range of interventions that seek to improve endurance
performance in the heat, a secondary aim of the thesis was to characterise the physiology
underpinning endurance running performance in the heat better. Free-paced exercise
represents the observable, behavioural consequence of collective physiological, psychological
and tactical feedback. As previously discussed, under normothermic conditions, this
behavioural response is highly associated with physiological markers of endurance
performance (Bassett and Howley 2000). However, the findings of this thesis indicate the
relationship between running performance and the overall model of the physiological
determinants to be weakened when in the heat, relative to normothermic conditions (Table 30,
Chapter 9), whilst improvements to these determinants following high intensity normothermic
training in the control group of Study 4 (Chapter 7), did not elicit improved time trial
performance in the heat. This alludes to a greater role for specific thermal factors influencing
endurance performance. Considerable evidence documents the marked influence that
perceived thermal strain and/or exertional strain can exert on self-selected exercise intensity,
in advance of changes in body temperature, through to moderate levels of hyperthermia (Ely et
al. 2010; Périard et al. 2011; Schlader, Simmons, et al. 2011b). Such adjustments to self-
selected exercise intensity represent a behavioural response, and in the heat such alterations
to exercise intensity are thought to reflect behavioural attempts to thermoregulate and/or
alleviate perceived thermal strain (Flouris & Schlader 2015). Therefore, behavioural
thermoregulation, i.e. a reduction in the self-selected running speed is a likely candidate to
contribute to the unexplained variance role in determining endurance performance in the heat,
and has previously been suggested to be a determinant of exercise performance under heat
stress (Flouris & Schlader 2015). Alterations to the exercising intensity, and therefore metabolic
rate, serve as primary defence mechanisms in clinical populations who are at risk of heat illness
due to a reduced thermoregulatory ability (Nielsen 1966), or when protective clothing impairs
typical heat loss mechanisms (Cheung et al. 2010). In high level athletes, the trend towards a
flatter pacing profile following familiarisation to endurance exercise in the heat (Schmit,
Duffield, et al. 2015), represents a form of behavioural thermoregulation as individuals seek to

237
avoid beginning exercise at an intensity that may yield a subsequent disadvantage due to
excessive heat storage. Therein, the consequential metabolic heat production would appear to
become a regulated variable and a determinant of endurance performance during exercise in a
hot environment (Flouris & Schlader 2015). Such thermoregulatory practices arise from the
perceived thermal strain, which can be differentiated into thermal sensation, the relative
intensity of the temperature being sensed (Attia 1984) and thermal comfort, which reflects the
subjective indifference with the thermal environment (Mercer 2001). Thermal comfort, and
specifically discomfort, appears more strongly linked with behavioural changes than thermal
sensation (Gagge et al. 1969; Schlader, Simmons, et al. 2011b). Accordingly, individuals within
this thesis may have altered running speed in accordance with their perceived discomfort,
rather than in accordance with the quantified physiological markers established during the
GXTs.
Thermal comfort appears to be primarily driven by changes in TSKIN (Flouris 2011), but as
hyperthermia progresses, the influence of TCORE increases (Cabanac 1971), as may the relative
contribution of skin wetness (Fukazawa & Havenith 2009). Mirroring the response of thermal
comfort, the holistic measure of perceived exertion, RPE, is also initially influenced by TSKIN,
however TCORE exerts a greater influence as hyperthermia progresses. Accordingly, as TCORE
elevation and hyperthermia becomes more pronounced, physiological strain will influence
performance to a greater extent both directly, through limiting the aerobic capacity, but also
indirectly by enhancing RPE (Marino 2004; Périard et al. 2011). Therein, RPE has been
suggested to be the ultimate moderator of behavioural thermoregulation, to which thermal
comfort may feed into, as thermal comfort alone may be misinterpreted during strenuous
exercise that is by nature, uncomfortable (Flouris & Schlader 2015). As shown below in Figure
59, a theoretical representation of this integrated response has been proposed by Flouris and
Schlader (2015), demonstrating that as TSKIN increases, there is a concomitant effect on both
perceived strain i.e. thermal discomfort and/or RPE, and cardiovascular strain, indicating
performance to be influenced by both behavioural consequences as well as systemic
physiological limitations.
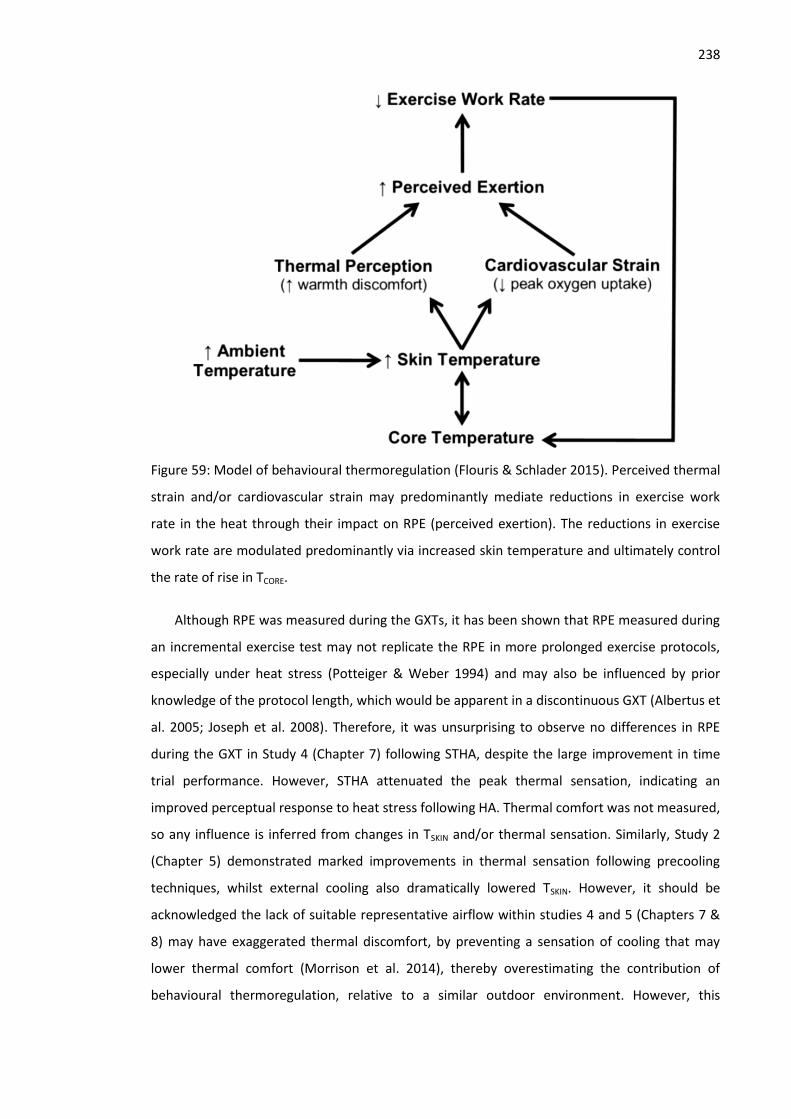
238
Figure 59: Model of behavioural thermoregulation (Flouris & Schlader 2015). Perceived thermal
strain and/or cardiovascular strain may predominantly mediate reductions in exercise work
rate in the heat through their impact on RPE (perceived exertion). The reductions in exercise
work rate are modulated predominantly via increased skin temperature and ultimately control
the rate of rise in TCORE.
Although RPE was measured during the GXTs, it has been shown that RPE measured during
an incremental exercise test may not replicate the RPE in more prolonged exercise protocols,
especially under heat stress (Potteiger & Weber 1994) and may also be influenced by prior
knowledge of the protocol length, which would be apparent in a discontinuous GXT (Albertus et
al. 2005; Joseph et al. 2008). Therefore, it was unsurprising to observe no differences in RPE
during the GXT in Study 4 (Chapter 7) following STHA, despite the large improvement in time
trial performance. However, STHA attenuated the peak thermal sensation, indicating an
improved perceptual response to heat stress following HA. Thermal comfort was not measured,
so any influence is inferred from changes in TSKIN and/or thermal sensation. Similarly, Study 2
(Chapter 5) demonstrated marked improvements in thermal sensation following precooling
techniques, whilst external cooling also dramatically lowered TSKIN. However, it should be
acknowledged the lack of suitable representative airflow within studies 4 and 5 (Chapters 7 &
8) may have exaggerated thermal discomfort, by preventing a sensation of cooling that may
lower thermal comfort (Morrison et al. 2014), thereby overestimating the contribution of
behavioural thermoregulation, relative to a similar outdoor environment. However, this

239
limitation is a systematic error across all experimental chapters of this thesis, and would also
have served to attenuate the influence of beneficial interventions such as precooling and heat
acclimation.
Whilst the model of Flouris and Schlader (2015) encapsulates the interactions between
variables that determine behavioural thermoregulation responses, this model remains broad,
and is not specific to the exercise type or informing of training priorities. A modified model,
integrated with the known physiological determinants of endurance performance is therefore
presented below, demonstrating the main factors that appear to combine to determine self-
selected running speed in the heat (Figure 60).
Figure 60: Proposed theoretical model of the determining factors for self-selected running
speed in the heat. The physiological determinants of endurance performance (encircled bottom
right), will directly influence both the magnitude of cardiovascular strain and TCORE elevation,
therefore influencing perceptual strain that appears to determine running speed. Behavioural
framework is modified from Flouris and Schlader (2015). Individual characteristics such as Heat
Acclimation State (HA state) and previous experience may modify the relationship between
self-selected running speed and physiological determinants. Novel variables added to the
model based on data within this thesis are shown in italics.
The model demonstrates the interrelation of both the physiological strain from the exercise
intensity, as well as the heightened perceptual strain, arising from the environmental
conditions in determining running speed. For example, the magnitude of cardiovascular strain
under heat stress may be influenced by both the fractional utilisation, as well as the elevation

240
of TSKIN and/or TCORE at a given point in time. The model demonstrates perceptual adaptation
should be prioritised equally with physiological adaptation before competing in the heat.
Theoretically, heat acclimation strategies adopting far greater heat stress than will be
experienced during competition may be appropriate in order to facilitate greater
improvements in perceived strain. The model also demonstrates how familiarisation with the
competition conditions will be important to an athlete, due to the influence of prior
familiarisation of a given task on RPE (Lamb et al. 1999), which may independently serve to
reduce the perceived exertion and therefore enable a greater running speed. Heat acclimation
state appears central to the model, given heat acclimation affords cardiovascular, metabolic,
perceptual and thermoregulatory adaptations (Périard et al. 2015). Therefore, the use of heat
acclimation state tests would appear important to quantify an individual’s thermosensitivity.
Such tests derive the linear relationship between sweat setpoint and sweat gain, in relation to
changes in core temperature during submaximal exercise under a fixed heat stress (Willmott et
al. 2015). The model therefore demonstrates how heat acclimation state directly influences
TSKIN, cardiovascular strain and perceived strain.
Although the model does not specifically define all physiological perturbations under heat
stress that may influence performance, such as metabolic, respiratory and neuromuscular
alterations (Nybo et al. 2014), it helps to define the priorities for variables that training should
aim to improve, prior to competing in the heat. For example, the data from this thesis would
indicate strategies that seek to enhance the lactate thresholds and vVO2max should be
prioritised. However, as when preparing for normothermic conditions, the relative importance
and prioritisation of each variable will be specific to an individual’s strengths and weaknesses
(Jones & Carter 2000), as well as acclimation state (Gonzalez & Gagge 1976). Therefore, the
model remains broad, and does not attribute relative importance to specific variables, because
the relative importance of each variable will not only change based on an individual’s strengths
and weaknesses, such as training status, but also on the event length. Future research may
consider developing specific models to inform training prioritisation for elite and non-elite
individuals, as well as shorter (~5 km) and much longer (~half marathon) endurance events
where the relative importance of individual variables may change.
Therefore, in conclusion, behavioural factors arising from thermal discomfort may play a
greater role in determining endurance exercise performance.
10.5 Practical applications

241
The studies conducted within this thesis were intended to inform athletic preparation for
competing in the heat and as such, many findings naturally transfer to the applied
environment. The hot and humid conditions adopted appear to be above the anticipated mean
heat stress expected at the 2016 Rio de Janeiro Olympics (ambient temperature; 26°C), but not
disproportionate to the peak temperatures that may reach 38°C and exceed 80% relative
humidity (National Institute of Meteorology Brazil 2015). Consequently, the physiological
impairments observed in the heat in Study 4 (Chapter 7), relative to cool conditions, within the
moderately trained cohort in this thesis, may serve as a useful index across endurance-based
sports to gauge the impact of heat stress for the 2016 Olympics or other major championships
with similar environmental challenges. While this thesis indicates that the determinants of
endurance performance do not explain performance to the same extent in the heat as has
been reported in cool conditions, it is unclear how this relationship would transfer to an elite
population. Moreover, the event characteristics such as distance and duration may determine
whether it is appropriate to conduct a laboratory test in representative environmental
conditions, due to the potential for heat stress to afford a transient improvement to running
economy that does not appear to replicate time trial exercise. Therefore, completing time trials
in the heat that also encompass self-selected exercise intensity under heat stress, may be
appropriate for assessing training status in competitive athletes prior to competing in the heat.
When laboratory testing does take place, the best single predictor from an incremental test
would appear to be vVO2max, measured in cool laboratory conditions. Notwithstanding the
problems with predicting performance in the heat when derived from laboratory testing, the
traditional determinants appear to remain prequisites, accounting for 82% of variance in time
trial performance, emphasizing the importance of continuing to train these areas. However,
data from this thesis also indicates individuals should prioritise a reduced perceived thermal
and/or exertional strain, in order to minimise impairments arising from behavioural attempts
to thermoregulate. Therefore, it would appear to be important to integrate indices of thermal
comfort and RPE into athlete’s training programmes in order to track improvements in these
areas.
The data within this thesis also supports the traditional approach of adopting chronic heat
acclimation prior to endurance running competitions. The STHA protocol used in Studies 4 and
5 (Chapters 7 & 8) would appear to be easily adopted by athletes and coaches. Totalling 5 days,
it encompassed high intensity exercise (~87% heart rate maximum) to expedite the elevation of
TCORE and onset of sudomotor output, with such higher intensity exercise more sport specific
than traditional fixed intensity training (Houmard et al. 1990; Sunderland et al. 2008). This

242
exercise intensity would be expected to complement, rather than compromise a training taper
phase (Spilsbury et al. 2015). The prescription of exercise relative to body mass (W.kg-1)
negates additional visits to establish relative intensities and reduces time demands on athletes
and practitioners alike. In turn, this simple prescriptive approach also facilitates the
simultaneous training of multiple individuals in the heat, although care must be taken to
maintain appropriate measures of TCORE, which can be expensive. Although the 5 days of STHA
within this thesis was effective, the length of the heat acclimation programme warrants further
consideration, given the tendency for thermal sensation to continue to improve during days 5-
10 of controlled hyperthermia acclimation, despite the absence of further large physiological
adaptations during this same timescale (Mee et al. 2015b; Gibson et al. 2015a). Emerging
evidence also suggests completing two heat exposures each day elicits greater adaptation than
a single exposure, indicating an alternative approach to yield greater adaptation within a 5 day
timescale (Willmott et al. 2016). However, consideration should also be given to ensure
individual’s recover sufficiently and do not experience a performance decrement, or suffer
infection from repeated heat exposures (Gleeson 2007). To this end, acclimating in
environmental conditions that far exceed the expected competition conditions, as occurred in
this thesis (STHA: 40°C, 60%, Experimental trials: 32°C, 60%), may promote greater perceptual
benefits, by increasing thermal discomfort, relative to acclimating under cooler conditions,
even when this is an uncompensable thermal environment. Furthermore, the use of conditions
involving high humidity may be appropriate, in order to enhance perceived strain, due to the
potential link between thermal comfort and skin wetness (Fukazawa & Havenith 2009).
In keeping with research conducted on cycling performance (Castle et al. 2011; Brade et al.
2012; Schmit, Le Meur, et al. 2015), this thesis also demonstrates that the addition of a
precooling technique to the acclimated individual does not immediately provide an additive
benefit, despite an apparent initial alleviation of physiological and perceptual strain. This
highlights the need for athletes to familiarise with interventions in advance of a competition, as
the optimum pacing strategy when an individual is both acclimated and precooled, or indeed
following acclimation or precooling alone, may be very different to pacing under normothermic
conditions. The transient nature of precooling presents a tactical challenge, as theoretically it
affords athlete’s the ability to undertake a faster start, but this is atypical of 5 km pacing
(Abbiss & Laursen 2008), and the benefits may have gone by the latter parts of a competitive
race, where tactical pacing adjustments may be most important. From a practitioner
perspective, it may be advisable to cool both prior to, and following the warmup, in order to
maintain a lower TSKIN and therefore promote improved thermal comfort, whilst concurrently
243
alleviating skin blood flow requirements. Finally, whilst the external precooling technique from
Study 2 (Chapter 5) remains practical for use in the field, preparation will be necessary in order
to ensure multiple garments remain cool.
Finally, whilst preparation and practising appear essential to implementing acclimation and
precooling strategies effectively, these interventions must coexist with other practices that
were not included within experimental studies of this thesis. Notably, athletes tend to adopt
longer and higher intensity warm-ups (Randall et al. 2015), that may result in greater heat
storage than the warm-ups induced for this thesis. Within this thesis, the warm-up was
attenuated relative to current competition practices to ensure participants did not exceed the
ethical TCORE limit. Therefore, athletes and coaches should practice interventions in accordance
with other race-day routines.
10.6 Limitations
Despite upmost caution being taken to ensure valid and robust measures were taken
throughout all experimental chapters, the findings of this thesis should be considered in light of
the following primary limitations:
Neither graded exercise tests, nor time trials, were conducted with representative air flow.
This will likely impair convective cooling (Morrison et al. 2014), and in turn may have
enhanced thermal discomfort, relative to outdoor running. Whilst all interventions were
always compared against a control condition under the same conditions, this may have
influenced the relationship between physiological markers and time trial performance,
relative to experiments adopting outdoor running, thus exaggerating the contribution of
perceptual strain and behavioural thermoregulation adjustments.
Throughout this thesis thermal sensation was taken as a measure of perceived thermal
strain, however this may be independent of both RPE and thermal comfort (Gagge et al.
1969), which appear more closely linked to changes in behaviour. Consequently, the true
relationship between thermal comfort and changes in free paced exercise cannot be
quantified. However, thermal comfort is modulated through changes in skin temperature,
therefore changes to thermal comfort can be inferred.
A 5 km time was not completed in cool conditions and therefore, the efficacy of
determinants of endurance performance for predicating time trial performance for this
cohort outside of heat stress is unknown. Similarly, this would have informed whether the
impairment to the determinants under heat stress, as observed in Study 4 (Chapter 7), was
associated with an impairment to time trial performance of a similar magnitude when heat

244
stress was present. Therefore, inference is taken from the wealth of research that states
strong relationships between these variables and endurance performance for participants
of similar fitness.
Time trial performance was assessed on a motorised treadmill which, although valid and
reliable for assessing endurance running performance (Stephens & Dascombe 2015), may
result in a relative insensitivity to small, intuitive pacing changes, relative to over-ground
running, as individuals must adjust stride pattern in order to select a higher or lower speed
(St Clair Gibson et al. 2006). To mitigate against this, participants were asked to practice
both small and large adjustments in treadmill speed during their familiarisation, as well as
being reminded they were free to adjust the speed as much or as little as they liked prior to
every trial. Furthermore, despite best efforts to create a simulated competitive
environment, motivational issues from exercising in a laboratory may attenuate the true
performance of an individual (Stephens & Dascombe 2015).
10.7 Future directions
A theoretical model has been proposed to demonstrate the interrelation of the
physiological underpinnings of endurance running and behavioural decisions that determine
the self-selected running speed in the heat (Figure 60). Within the model, the relative
contribution from each interacting factor is likely to demonstrate significant individual
variability, depending not least upon the individual’s underlying cardiovascular fitness, the
given environmental conditions, how much prior exercise has occurred and acclimation status.
Therefore, there appears limited value in attempting to differentiate the precise role of each
contributing factor, given how these relationships may be different between individuals.
Rather, this model may provide a broad framework from which intervention strategies and
training can be focussed upon, with a priority to further differentiate the relative contributions
of physiological strain, relative to perceived thermal strain in determining running speed.
Therefore, future research should firstly seek to replicate the findings of this thesis under
conditions incorporating suitable airflow.
Subsequently, to disentangle the physiological and perceptual influences, the use of
interventions such as menthol that provide a sensation of cooling, without influencing body
temperature (Schlader, Simmons, et al. 2011b; Barwood et al. 2015), would appear
appropriate. Existing research has demonstrated that menthol can influence behaviour to a
similar magnitude as skin cooling, affording improved thermal comfort (Schlader, Simmons, et
al. 2011b; Barwood et al. 2015). Under such circumstances, it would appear pertinent to

245
investigate whether a mediation of thermal discomfort following menthol application results in
the physiological variables explaining performance to a greater degree, reducing the
unexplained variance observed in this thesis. Such research may be particularly relevant for
populations who experience reduced thermoregulatory sensation (Price 2006). The
effectiveness of menthol application may be dependent upon event distance and the duration
of the protocol, given the influence thermal perception prior to the onset of severe
physiological strain (Tucker et al. 2004; Ely et al. 2010). Therefore, interventions that alleviate
thermal discomfort may be most effective during shorter duration events that still display
impairments to performance under heat stress, in the absence of severe hyperthermia (Guy et
al. 2015). One practical consequence of differentiating the roles of physiological strain and
thermal comfort would be improved prescription of precooling techniques. For example,
precooling techniques across different events may be optimised between absolute cooling
volume to alleviate physiological strain, and maximising thermal comfort, which is pertinent
given the potential for precooling to continue to aid performance once the thermometric
effects appear to have gone (Duffield et al. 2010).
Theoretically, menthol application could also complement an existing heat acclimation
strategy to provide further alleviation of thermal discomfort. Notwithstanding the potential for
yielding an additive effect through combining these interventions, the decay of alleviated
perceptual strain following heat acclimation alone is unknown, as previous research has
focussed on the induction and decay of physiological adaptations (Garrett et al. 2009; Ashley et
al. 2015; Poirier et al. 2015). Finally, attention should be given to understanding how training
status may modulate the relationship between perceived strain and exercise performance
given elite runners have an altered perception of their physiological thermal strain during
exercise (Tikuisis et al. 2002), and therefore may demonstrate a higher pain tolerance
(Astokorki & Mauger 2016). Therefore, the relative importance of behavioural
thermoregulation may be different within elite runners, in comparison to the conclusions
drawn from a heterogeneous group of moderately trained runners within this thesis.
The data within this thesis also alludes to the importance of practicing pacing strategies
when adopting interventions. As shown in Study 5 (Chapter 8), an additive effect apparently
mediated physiological strain at the start of the time trial, but this was not matched by an
increase in running speed. Therefore, individuals may have adopted a predetermined pacing
strategy, not utilising the potentially beneficial additive effect from the two interventions.
Similar effects have previously been reported following combined heat acclimation and
precooling (Schmit, Le Meur, et al. 2015) as well as following menthol application (Barwood et

246
al. 2015). Consequently, future research should seek to identify the optimal pacing strategy
following interventions that takes advantage of possibly transient alleviation of physiological or
perceptual strain, without a subsequent performance decrement from beginning a trial at too
great an intensity. However, despite the need to practice pacing following precooling, it may be
necessary to balance this against the propensity for humans to develop a habituation to
repeated cold exposures in accordance with acclimatization to cold environments (Young
2011), thereby attenuating the ergogenic benefits of precooling. This is another avenue that
research should consider for those athletes who regularly compete in the heat and repeatedly
adopt precooling techniques.
The findings of Study 4 (Chapter 7), alongside previous research, present a mixed picture on
the influence of heat stress on running economy. If indeed it is that running economy initially
benefits from elevated muscle temperature in advance of the onset of energy demanding
thermoregulatory processes, then trials that manipulate starting muscle temperature through
passive heating or cooling, may help to understand this relationship better. Furthermore,
running protocols that involve longer continuous exercise in the heat greater than the 3 min
stages of the GXT in this thesis, may help to establish the degree of heat strain where running
economy benefits are lost and oxygen consumption increases, i.e. identify the point of best
performance. However, whilst such questions are pertinent to understand from a research
perspective, the practical application of such findings may be limited, given the modest
relationship demonstrated between running economy and time trial performance.
The application of non-sport-specific, cycling training during STHA in Study 4 (Chapter 7)
would appear counter-intuitive within this running cohort. However, a cycling model afforded
many advantages that cannot currently be realised using running training, given a dearth of
research pertaining to running acclimation protocols (Costa et al. 2014). Logistically, cycling
allowed multiple individuals to train simultaneously in an environmental chamber, but also
permitted simple and precise quantification of the completed mechanical work, allowing the
training load to be matched between groups, independently of potentially confounding factors
such as body mass differences. Furthermore, prescribing cycling exercise relative to body mass
eliminates the need for participants or athletes to complete an additional laboratory test in
order to derive relative intensities (Gibson et al. 2015a). The importance of efficient exercise
prescription is not only to minimise exercise volume to complement a training taper (Spilsbury
et al. 2015), but also ensures the major potentiating stimuli for heat adaptation are achieved
and maintained across a training programme, namely the rapid elevation of TCORE and initiation
of profuse sweating (Sawka et al. 2011). Therefore, that significant adaptation can be achieved

247
through an alternative, and potentially more convenient, exercise mode is highly meaningful
for many individuals preparing to compete in the heat and supports previous suggestions that
heat acclimation is not modality specific (Taylor 2014). Notwithstanding these benefits, elite
athletes will require sport-specific conditioning in weeks prior to a competition, so acclimation
protocols facilitating practical and robust acclimation procedures for weight-bearing sports
such as running are warranted. In this instance, the application of mechanical work, relative to
body mass, would appear inappropriate, given the inverse relationship between running
performance and body mass (Lucia et al. 2006). Greater consideration should also be managing
the overall training load if weight-bearing training is adopted, as this type of exercise may be
associated with a heightened risk of injury and/or cumulative fatigue (Vleck & Garbutt 1998,
Millet et al. 2009). Emerging evidence indicates intensity may be effectively prescribed based
on a fixed RPE (Neal et al. 2015; Gibson et al. 2015a; Chalmers et al. 2016). However, research
should seek to establish the influence of training status on the change in TCORE at a given RPE, as
large differences in absolute MHP between fit and unfit individuals may present (Jay et al.
2011), not least due to differences in perceived exertion (Astokorki & Mauger 2016).
10.8 Conclusion
This thesis has investigated acute and chronic strategies that may enhance endurance
performance in the heat. The most effective strategy, short term heat acclimation, appears to
enhance endurance running performance through both the traditional model of endurance
physiology, as well as promoting specific thermal adaptations. Accordingly, traditional markers
of endurance performance, the lactate thresholds, VO2max, running economy and vVO2max,
explain less of the variance in time trial performance than is often reported in normothermic
conditions. The greater unexplained variance may be a consequence of an altered pacing, as
individuals behaviourally thermoregulate, due to heightened perceived thermal discomfort and
exertion. As a consequence, preparation for competition in the heat should prioritise improving
thermal comfort and perceived exertion under heat stress, alongside improvements to
traditional physiological markers. Theoretically, a combined heat acclimation and precooling
strategy would yield physiological adaptations alongside a mediated perceived strain,
predominantly through a reduced skin temperature. However, this technique failed to
demonstrate meaningful benefits above those arising from heat acclimation alone, despite
indications of a greater alleviation of physiological and perceptual strain. Consequently, this
thesis emphasises the importance of familiarising individuals with precooling and/or heat
acclimation in order to optimise the most effective pacing strategy. Future research should
consider other methods through which thermal discomfort can be improved, and whether

248
interventions, such as menthol application, can enhance performance in acclimated individuals
further.

249
11 References
Aaron, E.A. Seow, K.C. et al., 1992. Oxygen cost of exercise hyperpnea: implications for performance. Journal of Applied Physiology, 72(5), pp.1818–25.
Aaron, E.A. Johnson, B.D. et al., 1992. Oxygen cost of exercise hyperpnea: measurement. Journal of Applied Physiology, 72(5), pp.1810–7.
Abbiss, C.R. & Laursen, P.B., 2008. Describing and understanding pacing strategies during athletic competition. Sports Medicine, 38(3), pp.239–52.
Albertus, Y. et al., 2005. Effect of distance feedback on pacing strategy and perceived exertion during cycling. Medicine and Science in Sports and Exercise, 37(14), pp.461–468.
Allen, W., Seals, D. & Hurley, B., 1985. Lactate threshold and distance-running performance in young and older endurance athletes. Journal of Applied Physiology, 58(4), pp.1281–4.
Altareki, N. et al., 2009. Effects of environmental heat stress (35 degrees C) with simulated air movement on the thermoregulatory responses during a 4-km cycling time trial. International Journal of Sports Medicine, 30(1), pp.9–15.
Amann, M. & Calbet, J.A., 2008. Convective oxygen transport and fatigue. Journal of Applied Physiology, 104(3), pp.861–70.
Amann, M., Hopkins, W.G. & Marcora, S.M., 2008. Similar sensitivity of time to exhaustion and time-trial time to changes in endurance. Medicine and Science in Sports and Exercise, 40(3), pp.574–8.
Andreas, M. et al., 2011. Effect of ischemic preconditioning in skeletal muscle measured by functional magnetic resonance imaging and spectroscopy: a randomized crossover trial. Journal of Cardiovascular Magnetic Resonance, 13(1), p.32.
Angus, D.J. et al., 2001. Effect of carbohydrate ingestion on glucose kinetics during exercise in the heat. Journal of Applied Physiology, 90(2), pp.601–5.
Armstrong, L., 1998. Heat Acclimatization. Available at: http://www.sportsci.org/encyc/heataccl/heataccl.html [Accessed November 20, 2014].
Armstrong, L. & Maresh, C., 1991. The induction and decay of heat acclimatisation in trained athletes. Sports Medicine, 12(5), pp.302–312.
Arngrímsson, S.A. et al., 2003. Relation of heart rate to percent VO2 peak during submaximal exercise in the heat. Journal of Applied Physiology, 94(3), pp.1162–8.
Ashley, C.D., Ferron, J. & Bernard, T.E., 2015. Loss of Heat Acclimation and Time to Re-establish Acclimation. Journal of Occupational and Environmental Hygiene, (February 2015), pp.10–14.
Astokorki, A.H.Y. & Mauger, A.R., 2016. Tolerance of exercise-induced pain at a fixed rating of perceived exertion predicts time trial cycling performance. Scandinavian Journal of Medicine & Science in Sports.
Atkinson, G. & Nevill, A., 1998. Statistical methods for assessing measurement error (reliability) in variables relevant to sports Medicine. Sports Medicine, 26(4), pp.217–238.
Attia, M., 1984. Thermal pleasantness and temperature regulation in man. Neuroscience and Biobehavioral Reviews, 8(3), pp.335–42.
Bacon, A.P. et al., 2013. VO2max trainability and high intensity interval training in humans: a meta-analysis. PloS one, 8(9), p.e73182.
Bahr, R. & Reeser, J.C., 2012. New guidelines are needed to manage heat stress in elite sports - The Federation Internationale de Volleyball (FIVB) Heat Stress Monitoring Programme. British Journal of sports Medicine, 46(11), pp.805–9.
Bailey, T.G., et al., 2012a. Effect of ischemic preconditioning on lactate accumulation and running performance. Medicine and Science in Sports and Exercise, 44(11), pp.2084–9.
Bailey, T.G., et al., 2012b. Remote ischemic preconditioning prevents reduction in brachial artery flow-mediated dilation after strenuous exercise. American Journal of Physiology. Heart and Circulatory Physiology, 303(5), pp.533–8.
Balducci, P. et al., 2016. Comparison of Level and Graded Treadmill Tests to Evaluate Endurance Mountain Runners. Journal of Sports Science and Medicine, 15, pp.239–246.
Bannister, R.G. & Cotes, J., 1959. The effect of changes in environmental temperature upon body temperature and performance during strenuous exercise. Journal of Physiology, 142, pp.60–62.
Barbosa, T.C. et al., 2015. Remote ischemic preconditioning delays fatigue development during handgrip exercise. Scandinavian Journal of Medicine and Science in Sports, 25(3), pp.356–364.
Barcroft, J. & King, W.O., 1909. The effect of temperature on the dissociation curve of blood. The Journal of Physiology, 39(5), pp.374–84.
Barnes, K.R. et al., 2013. Effects of resistance training on running economy and cross-country performance. Medicine and Science in Sports and Exercise, 45(12), pp.2322–31.
Barnes, K.R. & Kilding, A.E., 2015. Running economy: measurement, norms, and determining factors. Sports Medicine, 1(1), p.8.-13
Barnett, A. & Maughan, R.J., 1993. Response of unacclimatized males to repeated weekly bouts of exercise in the heat. British Journal of Sports Medicine, 27(1), pp.39–44.
Baron, B. et al., 2008. Why does exercise terminate at the maximal lactate steady state intensity? British Journal of

250
Sports Medicine, 42(10), pp.828–33. Barwood, M.J. et al., 2015. Relieving thermal discomfort: Effects of sprayed L-menthol on perception, performance,
and time trial cycling in the heat. Scandinavian Journal of Medicine & Science in Sports, 25, pp.211–218. Bassett, D.R. & Howley, E.T., 2000. Limiting factors for maximum oxygen uptake and determinants of endurance
performance. Medicine and Science in Sports and Exercise, 32(1), pp.70–84. Bassett, D.R. & Howley, E.T., 1997. Maximal oxygen uptake: “classical” versus “contemporary” viewpoints. Medicine
and Science in Sports and Exercise, 29(5), pp.591–603. Beaven, C.M. et al., 2012. Intermittent lower-limb occlusion enhances recovery after strenuous exercise. Applied
physiology, nutrition, and metabolism = Physiologie appliquée, nutrition et métabolisme, 37(6), pp.1132–9. Beaver, W.L., Wasserman, K. & Whipp, B.J., 1985. Improved detection of lactate threshold during exercise using a
log-log transformation. Journal of Applied Physiology, 59(6), pp.1936–40. Beneke, R., 2003. Methodological aspects of maximal lactate steady state-implications for performance testing.
European Journal of Applied Physiology, 89(1), pp.95–9. Bentley, D., Newell, J. & Bishop, D.J., 2007. Incremental exercise test design and analysis. Sports Medicine, 37(7),
pp.575–586. Berger, M.M. et al., 2015. Remote ischemic preconditioning delays the onset of acute mountain sickness in
normobaric hypoxia. Physiological reports, 3(3), e12325-e12325. Bergeron, M.F., 2014. Heat Stress and Thermal Strain Challenges in Running. Journal of Orthopaedic & Sports
Physical Therapy, 44(10), pp.831–838. Bergeron, M.F. et al., 2012. International Olympic Committee consensus statement on thermoregulatory and
altitude challenges for high-level athletes. British Journal of sports Medicine, 46(11), pp.770–9. Berlyne, G.M., Finberg, J.P. & Yoran, C., 1974. The effect of β-adrenoceptor blockade on body temperature and
plasma renin activity in heat-exposed man. British Journal of clinical pharmacology, 1(4), pp.307–12. Billat, V. et al., 1999. Interval training at VO2max: effects on aerobic performance and overtraining markers. Med Sci
Sports Exerc, 31(1), pp.156–163. Billat, V., 1996. Use of blood lactate measurements for prediction of exercise performance and for control of
training. Sports Medicine, 22(3), pp.157–175. Billat, V. & Koralsztein, J., 1996. Significance of the velocity at VO2max and time to exhaustion at this velocity. Sports
Medicine, 22(2), pp.90–108. Bishop, D.J., Jenkins, D.G. & Mackinnon, L.T., 1998. The relationship between plasma lactate parameters, Wpeak and
1-h cycling performance in women. Medicine and Science in Sports and Exercise, 30(8), pp.1270–5. Bongers, C.C.W.G. et al., 2015. Precooling and percooling (cooling during exercise) both improve performance in the
heat: a meta-analytical review. British Journal of Sports Medicine, 49(6), pp.377–384. Borch, K.W. et al., 1993. Rate of accumulation of blood lactate during graded exercise as a predictor of “anaerobic
threshold”. Journal of Sports Sciences, 11(1), pp.49–55. Bottinelli, R. & Reggiani, C., 2000. Human skeletal muscle fibres: molecular and functional diversity. Progress in
biophysics and molecular biology, 73(2-4), pp.195–262. Bouchard, C. et al., 1999. Familial aggregation of VO2max response to exercise training: results from the HERITAGE
Family Study. Journal of Applied Physiology, 87(3), pp.1003–8. Boulant, J.A., 2000. Role of the Preoptic-Anterior Hypothalamus in Thermoregulation and Fever. Clinical Infectious
Diseases, 31(Supplement 5), pp.S157–S161. Boyd, A.E. et al., 1974. Lactate inhibition of lipolysis in exercising man. Metabolism, 23(6), pp.531–542. Brade, C., Dawson, B.T. & Wallman, K., 2012. Effect of precooling and acclimation on repeat-sprint performance in
heat. Journal of Sports Sciences, 31(7), pp.779–86. Brandon, L., 1995. Physiological factors associated with middle distance running performance. Sports Medicine,
19(4), pp.268–277. Brengelmann, G.L. et al., 1977. Altered control of skin blood flow during exercise at high internal temperatures.
Journal of Applied Physiology, 43(5), pp.790–794. Brooks, G.A., 2009. Cell-cell and intracellular lactate shuttles. The Journal of Physiology, 587(Pt 23), pp.5591–600. Brooks, G.A. et al., 1971. Temperature, skeletal muscle mitochondrial functions, and oxygen debt. The American
Journal of Physiology, 220(4), pp.1053–9. Brooks, G.A., 1986. The lactate shuttle during exercise and recovery. Medicine and Science in Sports and Exercise,
18(3), pp.360–368. Brooks, G.A., Fahey, T.D. & White, T.P., 1996. Exercise Physiology: human bioenergetics and its applications. 2nd
Edition., New York: McGraw-Hill. Brotherhood, J.R., 2008. Heat stress and strain in exercise and sport. Journal of Science and Medicine in Sport, 11(1),
pp.6–19. Brothers, R.M. et al., 2009. Cardiac systolic and diastolic function during whole body heat stress. American Journal of
Physiology. Heart and circulatory Physiology, 296(4), pp.H1150–6. Buchheit, M. et al., 2011. Physiological and performance adaptations to an in-season soccer camp in the heat:
associations with heart rate and heart rate variability. Scandinavian Journal of Medicine & Science in Sports, 21(6), pp.e477–85.
Budd, G.M., 2008. Wet-bulb globe temperature (WBGT)--its history and its limitations. Journal of Science and Medicine in Sport / Sports Medicine Australia, 11(1), pp.20–32.

251
Bulmer, M.G. & Forwell, G.D., 1956. The concentration of sodium in thermal sweat. The Journal of Physiology, 132(1), pp.115–22.
Buono, M., Heaney, J. & Canine, K., 1998. Acclimation to humid heat lowers resting core temperature. American Journal of Physiology, 274(5 Pt 2), pp.1295–1299.
Buono, M.J. et al., 2007. Comparison of infrared versus contact thermometry for measuring skin temperature during exercise in the heat. Physiological Measurement, 28(8), pp.855–9.
Burnham, R.S., McKinley, R.S. & Vincent, D.D., 2006. Three types of skin-surface thermometers: a comparison of reliability, validity, and responsiveness. American Journal of Physical Medicine & Rehabilitation, 85(7), pp.553–8.
Burnley, M., Doust, J.H. & Jones, A.M., 2002. Effects of prior heavy exercise, prior sprint exercise and passive warming on oxygen uptake kinetics during heavy exercise in humans. European Journal of Applied Physiology, 87(4-5), pp.424–432.
Burnley, M. & Jones, A.M., 2007. Oxygen uptake kinetics as a determinant of sports performance. European Journal of Sport Science, 7(2), pp.63–79.
Burton, A.C., 1935. Human calorimetry. 2. The average temperature of the tissues of the body. Journal of Nutrition, 9, pp.261–280.
Bushell, A., Klenerman, L. & Davies, H., 2002. Ischaemic preconditioning of skeletal muscle. Journal of Bone and Joint Surgery, 84(8), pp.1189–1193.
Byrne, C. & Lim, C.L., 2007. The ingestible telemetric body core temperature sensor: a review of validity and exercise applications. British Journal of sports Medicine, 41(3), pp.126–33.
Cabanac, M., 1971. Physiological role of pleasure. Science (New York, N.Y.), 173(4002), pp.1103–7. Cabanac, M. & White, M.D., 1995. Core temperature thresholds for hyperpnea during passive hyperthermia in
humans. European Journal of Applied Physiology and occupational Physiology, 71(1), pp.71–6. Cage, G.W. & Dobson, R.L., 1965. Sodium secretion and reabsoprtion in the human eccrine sweat gland. The Journal
of clinical investigation, 44, pp.1270–6. Calbet, J.A. et al., 2006. Effects of ATP-induced leg vasodilation on VO2 peak and leg O2 extraction during maximal
exercise in humans. American Journal of Physiology. Regulatory, Integrative and Comparative Physiology, 291(2), pp.R447–53.
Carter, H., Jones, A.M. & Doust, J.H., 1999. Effect of 6 weeks of endurance training on the lactate minimum speed. Journal of Sports Sciences, 17(12), pp.957–67.
Casa, D.J., 1999. Exercise in the heat. I. Fundamentals of thermal Physiology, performance implications, and dehydration. Journal of Athletic Training, 34(3), pp.246–52.
Casa, D.J. et al., 2005. Exertional heat stroke in competitive athletes. Current Sports Medicine reports, 4(6), pp.309–17.
Casa, D.J. et al., 2015. National Athletic Trainers’ Association Position Statement: Exertional Heat Illnesses. Journal of athletic training, 50(9).
Castle, P.C. et al., 2011. Heat acclimation improves intermittent sprinting in the heat but additional pre-cooling offers no further ergogenic effect. Journal of Sports Sciences, 29(11), pp.1125–34.
Castle, P.C. et al., 2006. Precooling leg muscle improves intermittent sprint exercise performance in hot, humid conditions. Journal of Applied Physiology, 100(4), pp.1377–84.
Cavanagh, P.R. & Williams, K.R., 1982. The effect of stride length variation on oxygen uptake during distance running. Medicine and Science in Sports and Exercise, 14, pp.30–35.
Cerretelli, P. & Di Prampero, P.E., 1987. Gas exchange in exercise. In A. Fishman et al., eds. Hanbook of Physiology. Bethesda, MD: American Physiological Society, pp. 297–339.
Chalmers, S. et al., 2016. Brief Heat Training Does Not Improve the Lactate Threshold in Mild Conditions. International Journal of Sports Physiology and Performance, [In press].
Chalmers, S. et al., 2014. Short-term heat acclimation training improves physical performance: a systematic review, and exploration of physiological adaptations and application for team sports. Sports Medicine, 44(7), pp.971–88.
Chan, K.O.W., Wong, S.H.S. & Chen, Y.J., 2008. Effects of a hot environment on simulated cycling and running performance in triathletes. Journal of Sports Medicine and Physical Fitness, 48(2), pp.149–157.
Charkoudian, N., 2010. Mechanisms and modifiers of reflex induced cutaneous vasodilation and vasoconstriction in humans. Journal of Applied Physiology, 109(4), pp.1221–8.
Chen, S., Li, G. & Long, L., 1999. Clinical research of ischemic preconditioning on lung protection. Bulletin of Hunan Medical University, 24(4), pp.357–9.
Cheng, B. et al., 1992. A new approach for the determination of ventilatory and lactate thresholds. International Journal of sports Medicine, 13(7), pp.518–22.
Cheung, S.S., 2010. Advanced Environmental Exercise Physiology, Champaign, Illinois: Human Kinetics. Cheung, S.S., 2007. Neuropsychological determinants of exercise tolerance in the heat. Progress in brain research,
162, pp.45–60. Cheung, S.S., Petersen, S.R. & McLellan, T.M., 2010. Physiological strain and countermeasures with firefighting.
Scandinavian Journal of Medicine & Science in Sports, 20 Suppl 3, pp.103–16. Cheung, S.S. & Sleivert, G.G., 2004. Multiple triggers for hyperthermic fatigue and exhaustion. Exercise and sport
sciences reviews, 32(3), pp.100–6.
252
Cheuvront, S.N. et al., 2010. Mechanisms of aerobic performance impairment with heat stress and dehydration. Journal of Applied Physiology, 109(6), pp.1989–95.
Chinevre, T.D. et al., 2008. Effect of Heat Acclimation on Sweat Minerals. Medicine & Science in Sports & Exercise, 40(5), pp.886–891.
Chudecka, M. & Lubkowska, A., 2012. The Use of Thermal Imaging to Evaluate Body Temperature Changes of Athletes During Training and a Study on the Impact of Physiological and Morphological Factors on Skin Temperature. Human Movement, 13(1), pp.33–39.
Clavien, P.A. et al., 2003. A prospective randomized study in 100 consecutive patients undergoing major liver resection with versus without ischemic preconditioning. Annals of surgery, 238(6), pp.843–50.
Cohen, M. V, Baines, C.P. & Downey, J.M., 2000. Ischemic preconditioning: from adenosine receptor to KATP channel. Annual Review of Physiology, 62, pp.79–109.
Colin, J. et al., 1971. Computation of mean body temperature from rectal and skin temperatures. Journal of Applied Physiology, 31(3), pp.484–9.
Collins, K.J., Crockford, G. & Weiner, J.S., 1965. Sweat-gland training by drugs and thermal stress. Archives of Environmental Health, 11(4), pp.407–22.
Conley, D.L. & Krahenbuhl, G.S., 1980. Running economy and distance running performance of highly trained athletes. Medicine and Science in Sports and Exercise, 12(5), pp.357–60.
Consolazio, C.F. et al., 1973. Energy requirement and metabolism during exposure to extreme environments. World Review of Nutrition and Dietetics, 18, pp.177–94.
Convertino, V.A., 1983. Heart rate and sweat rate responses associated with exercise-induced hypervolemia. Medicine and Science in Sports and Exercise, 15(1), pp.77–82.
Cooper, C.E. & Brown, G.C., 2008. The inhibition of mitochondrial cytochrome oxidase by the gases carbon monoxide, nitric oxide, hydrogen cyanide and hydrogen sulfide: chemical mechanism and physiological significance. Journal of Bioenergetics and Biomembranes, 40(5), pp.533–9.
Cooper, G., 1997. Basic determinants of myocardial hypertrophy: a review of molecular mechanisms. Annual review of Medicine, 48, pp.13–23.
Corbett, J. et al., 2014. Adaptation to Heat and Exercise Performance Under Cooler Conditions: A New Hot Topic. Sports Medicine, 44(10), pp.1323–31.
Costa, R.J.S. et al., 2014. Heat acclimation responses of an ultra-endurance running group preparing for hot desert-based competition. European Journal of Sport Science, 14 Suppl 1, pp.S131–41.
Costello, J.T. et al., 2012. The use of thermal imaging in assessing skin temperature following cryotherapy: a review. Journal of Thermal Biology, 37(2), pp.103–110.
Costill, D.L., Thomason, H. & Roberts, E., 1973. Fractional utilization of the aerobic capacity during distance running. Medicine and science in sports, 5(4), pp.248–52.
Coyle, E.F. et al., 1990. Maximal oxygen uptake relative to plasma volume expansion. International journal of sports medicine. 11 (2), pp. 116-9.
Coyle, E.F. et al., 1992. Cycling efficiency is related to the percentage of type I muscle fibers. Medicine and Science in Sports and Exercise, 24(7), pp.782–8.
Coyle, E.F. et al., 1988. Determinants of endurance in well-trained cyclists. Journal of Applied Physiology, 64(6), pp.2622–30.
Coyle, E.F. et al., 1991. Physiological and biomechanical factors associated with elite endurance cycling performance. Medicine and Science in Sports and Exercise, 23(1), pp.93–107.
Coyle, E.F. 1999. Physiological determinants of endurance exercise performance. Journal of science and Medicine in sport / Sports Medicine Australia, 2(3), pp.181–9.
Craig, A.B., 1986. Breath holding during the turn in competitive swimming. Medicine and Science in Sports and Exercise, 18(4), pp.402–7.
Cramer, M.N., Bain, A.R. & Jay, O., 2012. Local sweating on the forehead, but not forearm, is influenced by aerobic fitness independently of heat balance requirements during exercise. Experimental Physiology, 97(5), pp.572–82.
Cramer, M.N. & Jay, O., 2015. Explained variance in the thermoregulatory responses to exercise: the independent roles of biophysical and fitness/fatness-related factors. Journal of Applied Physiology, 119(9), pp.982–989.
Crandall, C.G. et al., 2008. Effects of passive heating on central blood volume and ventricular dimensions in humans. The Journal of Physiology, 586(1), pp.293–301.
Crandall, C.G. & Wilson, T.E., 2015. Human Cardiovascular Responses to Passive Heat Stress. Comprehensive Physiology, 5, pp.17–43.
Crisafulli, A., 2006. Exercise and Ischemic Preconditioning. Current Cardiology Reviews, 2(3), pp.153–162. Crisafulli, A. et al., 2011. Ischemic preconditioning of the muscle improves maximal exercise performance but not
maximal oxygen uptake in humans. Journal of Applied Physiology, 111(2), pp.530–6. Cuddy, J.S., Hailes, W.S. & Ruby, B.C., 2014. A reduced core to skin temperature gradient, not a critical core
temperature, affects aerobic capacity in the heat. Journal of Thermal Biology, 43, pp.7–12. Cunningham, D.A. et al., 1977. Reliability and reproducibility of maximal oxygen uptake measurement in children.
Medicine & Science in Sports & Exercise, 9(2), pp.104–8. Currell, K. & Jeukendrup, A.E., 2008. Validity, reliability and sensitivity of measures of sporting performance. Sports
Medicine, 38(4), pp.297–316.

253
d’Ambrosio Alfano, F.R. et al., 2014. WBGT index revisited after 60 years of use. The Annals of occupational hygiene, 58(8), pp.955–70.
Daanen, H.A.M. et al., 2011. Optimising the acquisition and retention of heat acclimation. International Journal of Sports Medicine, 32(11), pp.822–8.
Daniels, J.T. & Daniels, N., 1992. Running economy of elite male and elite female runners. Medicine and Science in Sports and Exercise, 24(4), pp.483–9.
Davis, J.A. et al., 2007. Comparison of three methods for detection of the lactate threshold. Clinical physiology and functional imaging, 27(6), pp.381–4.
Davison, R.R., Van Someren, K.A. & Jones, A.M., 2009. Physiological monitoring of the Olympic athlete. Journal of Sports Sciences, 27(13), pp.1433–42.
Dempsey, J. & Wagner, P., 1999. Exercise-induced arterial hypoxemia. Journal of Applied Physiology, 87, pp.1997–2006.
Denadai, B., Ortiz, M. & Mello, M., 2004. Physiological indexes associated with aerobic performance in endurance runners: effects of race duration. Revista Brasileira de Medicina do Esporte, pp.405–407.
Dervis, S., Smoljanic, J. & Jay, O., 2014. Large differences in body fat do not independently alter changes in core temperature during exercise. The Journal of the Federation of American Societies for Experimental Biology, 28(1), p.1104.2.
Dill, D.B. et al., 1966. Blood, plasma, and red cell volumes: age, exercise, and environment. Journal of Applied Physiology, 21(2), pp.597–602.
Dill, D.B. et al., 1931. Physical performance in relation to external temperature. Arbeitsphysiologie, 4(6), pp.508–518. Doma, K. et al., 2012. The reliability of running economy among trained distance runners and field-based players.
Journal of Exercise Science & Fitness, 10(2), pp.90–96. Duffield, R. et al., 2010. Precooling can prevent the reduction of self-paced exercise intensity in the heat. Medicine
and Science in Sports and Exercise, 42(3), pp.577–84. Duffield, R., Steinbacher, G. & Fairchild, T.J., 2009. The use of mixed-method, part-body pre-cooling procedures for
team-sport athletes training in the heat. Journal of Strength and Conditioning Research, 23(18), pp.2524–2532.
Durnin, J. & Womersley, J., 1974. Body fat assessed from total body density and its estimation from skinfold thickness: measurements on 481 men and women aged from 16 to 72 years. British Journal of Nutrition, 32, pp.77–97.
Earhart, E.L. et al., 2015. Effects of Oral Sodium Supplementation on Indices of Thermoregulation in Trained Endurance Athletes. Journal of Sports Science and Medicine, (14), pp.172–178.
Edvardsen, E., Hem, E. & Anderssen, S.A., 2014. End Criteria for Reaching Maximal Oxygen Uptake Must Be Strict and Adjusted to Sex and Age: A Cross-Sectional Study. PLoS ONE, 9(1), p.e85276.
Ekblom, B. et al., 1968. Effect of training on circulatory response to exercise. Journal of Applied Physiology, 24(4), pp.518–528.
Ely, B.R. et al., 2010. Aerobic performance is degraded, despite modest hyperthermia, in hot environments. Medicine and Science in Sports and Exercise, 42(1), pp.135–41.
Ely, B.R. et al., 2009. Evidence against a 40 degrees C core temperature threshold for fatigue in humans. Journal of Applied Physiology, 107(5), pp.1519–25.
Ely, M.R. et al., 2008. Effect of ambient temperature on marathon pacing is dependent on runner ability. Medicine and Science in Sports and Exercise, 40(9), pp.1675–80.
Ely, M.R. et al., 2007. Impact of weather on marathon-running performance. Medicine and Science in Sports and Exercise, 39(3), pp.487–93.
Farrell, P.A. et al., 1979. Plasma lactate accumulation and distance running performance. Medicine & Science in Sports & Exercise, 11(4), pp.338–344.
Faude, O., Kindermann, W. & Meyer, T., 2009. Lactate threshold concepts: how valid are they? Sports Medicine, 39(6), pp.469–490.
Febbraio, M.A., 2001. Alterations in energy metabolism during exercise and heat stress. Sports Medicine, 31(1), pp.47–59.
Febbraio, M.A. et al., 1994. Muscle metabolism during exercise and heat stress in trained men: effect of acclimation. Journal of Appiedl Physiology, 76(2), pp.589–597.
Febbraio, M.A. et al., 2002. Reduced glycogen availability is associated with an elevation in HSP72 in contracting human skeletal muscle. Journal of Physiology, 58(3), pp.911–917.
Ferguson, S. et al., 2001. Cardiac performance in endurance-trained and moderately active young women. Medicine and Science in Sports and Exercise, 33(7), pp.1114–9.
Fernandes, A.D. et al., 2014. Measuring skin temperature before, during and after exercise: a comparison of thermocouples and infrared thermography. Physiological Measurement, 35(2), pp.189–203.
Ferreira, J.J. et al., 2008. Exercise-associated thermographic changes in young and elderly subjects. Annals of Biomedical Engineering, 36(8), pp.1420–7.
Ferretti, G., 2014. Maximal oxygen consumption in healthy humans: theories and facts. European Journal of Applied Physiology, 114(10), pp.2007–36.
Fink, W.J., Costill, D.L. & Handel, P.J., 1975. Leg muscle metabolism during exercise in the heat and cold. European Journal of Applied Physiology and Occupational Physiology, 34(1), pp.183–190.
254
Fitts, R.H., 2007. The cross-bridge cycle and skeletal muscle fatigue. Journal of Applied Physiology, 104(2), pp.551–558.
Flouris, A.D., 2011. Functional architecture of behavioural thermoregulation. European Journal of Applied Physiology, 111(1), pp.1–8.
Flouris, A.D. & Schlader, Z.J., 2015. Human behavioral thermoregulation during exercise in the heat. Scandinavian Journal of Medicine & Science in Sports, 25 Suppl 1, pp.52–64.
Folland, J.P. et al., 2006. Leg heating and cooling influences running stride parameters but not running economy. International Journal of Sports Medicine, 27(10), pp.771–9.
Fortney, S.M. et al., 1981. Effect of blood volume on sweating rate and body fluids in exercising humans. Journal of Applied Physiology: respiratory, environmental and exercise Physiology, 51(6), pp.1594–600.
Foster, C. & Lucia, A., 2007. Running economy: the forgotten factor in elite performance. Sports Medicine, 37, pp.316–319.
Foster, G.P. et al., 2014. Ischemic preconditioning improves oxygen saturation and attenuates hypoxic pulmonary vasoconstriction at high altitude. High Altitude Medicine & biology, 15(2), pp.155–61.
Foster, G.P. et al., 2011. Ischemic preconditioning of the lower extremity attenuates the normal hypoxic increase in pulmonary artery systolic pressure. Respiratory Physiology & Neurobiology, 179(2-3), pp.248–53.
Fox, R.H. et al., 1963. Acclimatization to heat in man by controlled elevation of body temperature. The Journal of Physiology, 166, pp.530–547.
Frank, S.M. et al., 1999. Relative contribution of core and cutaneous temperatures to thermal comfort and autonomic responses in humans. Journal of Applied Physiology, 86(5), pp.1588–93.
Fukazawa, T. & Havenith, G., 2009. Differences in comfort perception in relation to local and whole body skin wettedness. European Journal of Applied Physiology, 106(1), pp.15–24.
Gagge, A. & Gonzalez, R.R., 1974. Physiological and physical factors associated with warm discomfort in sedentary man. Environmental Research, 242(7), pp.230–242.
Gagge, A., Stolwijk, J. & Saltin, B., 1969. Comfort and thermal sensations and associated physiological responses during exercise at various ambient temperatures. Environmental Research, 229, pp.209–229.
Gagge, A.P. & Gonzalez, R.R., 2011. Mechanisms of Heat Exchange: Biophysics and Physiology. In Comprehensive Physiology. pp. 45–84.
Gagnon, D., Jay, O. & Kenny, G.P., 2013. The evaporative requirement for heat balance determines whole-body sweat rate during exercise under conditions permitting full evaporation. The Journal of Physiology, 591(Pt 11), pp.2925–35.
Galloway, S.D. & Maughan, R.J., 1997. Effects of ambient temperature on the capacity to perform prolonged cycle exercise in man. Medicine and Science in Sports and Exercise, 29(9), pp.1240–1249.
Ganio, M.S. et al., 2009. Validity and reliability of devices that assess body temperature during indoor exercise in the heat. Journal of athletic training, 44(2), pp.124–35.
Garrett, A.T. et al., 2009. Induction and decay of short-term heat acclimation. European Journal of Applied Physiology, 107(6), pp.659–70.
Garrett, A.T. et al., 2014. Short-term heat acclimation is effective and may be enhanced rather than impaired by dehydration. American Journal of Human Biology, 26(3), pp.311–20.
Garrett, A.T., Rehrer, N.J. & Patterson, M.J., 2011. Induction and decay of short-term heat acclimation in moderately and highly trained athletes. Sports Medicine, 41(9), pp.757–71.
Gething, M. & Sambrook, J., 1992. Protein folding in the cell. Nature, 335, pp.35–45. Gibson, N. et al., 2013. Effect of ischemic preconditioning on land-based sprinting in team-sport athletes.
International Journal of sports Physiology and performance, 8(6), pp.671–6. Gibson, O.R. et al., 2014. Extracellular Hsp72 concentration relates to a minimum endogenous criteria during acute
exercise-heat exposure. Cell Stress & Chaperones, 19(3), pp.389–400. Gibson, O.R. et al., 2015a. Heat Acclimation attenuates physiological strain and the Hsp72, but not Hsp90α mRNA
response to acute normobaric hypoxia. Journal of Applied Physiology, 119(July), [In press]. Gibson, O.R. et al., 2015b. Isothermic and fixed intensity heat acclimation methods induce similar heat adaptation
following short and long-term timescales. Journal of Thermal Biology, 49-50, pp.55–65. Gibson, O.R. et al., 2015c. Isothermic and fixed-intensity heat acclimation methods elicit equal increases in Hsp72
mRNA. Scandinavian Journal of Medicine & Science in Sports, 25, pp.259–268. Gibson, O.R. et al. 2015d. Prescribing workload administration to optimise isothermic heat acclimation. Extreme
Physiology & Medicine, 4(Suppl 1), p.A83. Gisolfi, C. V & Cohen, J., 1978. Relationships among training, heat acclimation, and heat tolerance in men and
women: the controversy revisited. Medicine and Science in Sports, 11(1), pp.56–59. Gladden, L.B., 2000. Muscle as a consumer of lactate. Medicine and Science in Sports and Exercise, 32(4), pp.764–71. Gledhill, N., 1985. The influence of altered blood volume and oxygen transport capacity on aerobic performance.
Exercise and Sport Sciences Reviews, 13, pp.75–93. Gleeson, M., 2007. Immune function in sport and exercise. Journal of Applied Physiology, 103(2), pp.693–9. Gleeson, M., 1998. Temperature regulation during exercise. International Journal of Sports Medicine, 19 Suppl 2,
pp.S96–9. Godek, S.F., Bartolozzi, A.R. & Godek, J.J., 2005. Sweat rate and fluid turnover in American football players compared
with runners in a hot and humid environment. British Journal of Sports Medicine, 39(4), pp.205–11; discussion
255
205–11. Gollnick, P.D., Piehl, K. & Saltin, B., 1974. Selective glycogen depletion pattern in human muscle fibres after exercise
of varying intensity and at varying pedalling rates. The Journal of Physiology, 241(1), pp.45–57. Gonzalez, R.R. & Gagge, A.P., 1976. Warm discomfort and associated thermoregulatory changes during dry, and
humid-heat acclimatization. Israel Journal of Medical Sciences, 12(8), pp.804–7. Gonzalez-Alonso, J. & Calbet, J.A., 2003. Reductions in systemic and skeletal muscle blood flow and oxygen delivery
limit maximal aerobic capacity in humans. Circulation, 107(6), pp.824–830. González-Alonso, J., Calbet, J.A. & Gonzalez-Alonso, J., 2003. Reductions in systemic and skeletal muscle blood flow
and oxygen delivery limit maximal aerobic capacity in humans. Circulation, 107(6), pp.824–830. Gonzalez-Alonso, J., Calbet, J.A. & Nielsen, B., 1999. Metabolic and thermodynamic responses to dehydration-
induced reductions in muscle blood flow in exercising humans. The Journal of Physiology, 520 Pt 2, pp.577–89. Gonzalez-Alonso, J., Crandall, C.G. & Johnson, J.M., 2008. The cardiovascular challenge of exercising in the heat. The
Journal of Physiology, 586(1), pp.45–53. Gonzalez-Alonso, J., Mora-Rodriguez, R. & Coyle, E.F., 2000. Stroke volume during exercise: interaction of
environment and hydration. Am J Physiol Heart Circ Physiol, 278(2), pp.H321–330. Goosey-Tolfrey, V.L. et al., 2008. The effectiveness of hand cooling at reducing exercise-induced hyperthermia and
improving distance-race performance in wheelchair and able-bodied athletes. Journal of Applied Physiology, 105(1), pp.37–43.
Gotshall, R.W., Dahl, D.J. & Marcus, N.J., 2001. Evaluation of a physiological strain index for use during intermittent exercise in the heat. Journal of Exercise Physiology Online, 4(3), pp.22–29.
Grant, S. et al., 2002. Reproducibility of the blood lactate threshold, 4 mmol.l(-1) marker, heart rate and ratings of perceived exertion during incremental treadmill exercise in humans. European Journal of Applied Physiology, 87(2), pp.159–66.
Green, H.J. et al., 2000. Increases in submaximal cycling efficiency mediated by altitude acclimatization. Journal of Applied Physiology, 89(3), pp.1189–97.
Green, H.J. et al., 1992. Metabolic adaptations to training precede changes in muscle mitochondrial capacity. Journal of Applied Physiology, 72(2), pp.484–491.
Greenhaff, P.L., 1989. Cardiovascular fitness and thermoregulation during prolonged exercise in man. British Journal of Sports Medicine, 23(2), pp.109–14.
Greenhaff, P.L. et al., 1991. Energy metabolism in single human muscle fibers during contraction without and with epinephrine infusion. The American Journal of Physiology, 260(5 Pt 1), pp.E713–8.
Greenleaf, J.E. & Greenleaf, C.J., 1970. Human acclimation and acclimatization to heat: A compendium of Research., Moffett Field, CA: Ames Research Center, Technical Memorandum no. TM X-62008.
de Groot, P.C.E. et al., 2010. Ischemic preconditioning improves maximal performance in humans. European Journal of Applied Physiology, 108(1), pp.141–6.
Guest, S. et al., 2007. Human cortical representation of oral temperature. Physiology & behavior, 92(5), pp.975–84. Gustafsson, U. et al., 1993. Effect of systemic adenosine infusion on capillary flow and oxygen pressure distributions
in skeletal muscle of the rabbit. International Journal of microcirculation, clinical and experimental, 13(1), 1–12.
Guy, J.H. et al., 2015. Adaptation to hot environmental conditions: an exploration of the performance basis, procedures and future directions to optimise opportunities for elite athletes. Sports Medicine, 45(3), 303–11.
Hammel, H.T. et al., 1963. Temperature regulation by hypothalamic proportional control with an adjustable set point. Journal of Applied Physiology, 18, pp.1146–54.
Hargreaves, M., Dillo, P., et al., 1996. Effect of fluid ingestion on muscle metabolism during prolonged exercise. Journal of Applied Physiology, 80(1), pp.363–366.
Hargreaves, M., Angus, D., et al., 1996. Effect of heat stress on glucose kinetics during exercise. Journal of Applied Physiology, 81(4), pp.1594–7.
Hargreaves, M., 2008. Physiological limits to exercise performance in the heat. Journal of science and Medicine in sport / Sports Medicine Australia, 11(1), pp.66–71.
Harper Smith, A.D. et al., 2010. The validity of wireless iButtons and thermistors for human skin temperature measurement. Physiological Measurement, 31(1), pp.95–114.
Hausenloy, D.J. & Yellon, D.M., 2008. Remote ischaemic preconditioning: underlying mechanisms and clinical application. Cardiovascular research, 79(3), pp.377–86.
Havenith, G., 1999. Heat balance when wearing protective clothing. Annals of Occupational Hygiene, 43(5), pp.289–296.
Havenith, G. et al., 1998. Relevance of individual characteristics for human heat stress response is dependent on exercise intensity and climate type. European Journal of Applied Physiology and Occupational Physiology, 77(3), pp.231–41.
Haverty, M., Kenney, W.L. & Hodgson, J.L., 1988. Lactate and gas exchange responses to incremental and steady state running. British Journal of Sports Medicine, 22(2), pp.51–4.
Hayes, M. et al., 2014. The influence of hot humid and hot dry environments on intermittent-sprint exercise performance. International Journal of sports Physiology and performance, 9(3), pp.387–96.
Health and Safety Executive, 2015. Heat Stress. UK.Gov.uk. Available at: http://www.hse.gov.uk/temperature/heatstress/ [Accessed December 8, 2015].

256
Heck, H. et al., 1985. Justification of the 4-mmol/l lactate threshold. International Journal of Sports Medicine, 6(3), pp.117–30.
Helgerud, J. et al., 2007. Aerobic high-intensity intervals improve VO2max more than moderate training. Medicine and Science in Sports and Exercise, 39(4), pp.665–71.
Hellebrandt, F.A. & Houtz, S.J., 1956. Mechanisms of muscle training in man: experimental demonstration of the overload principle. The Physical Therapy Review, 36(6), pp.371–83.
El Helou, N. et al., 2012. Impact of environmental parameters on marathon running performance. PloS one, 7(5), e37407.
Hensel, H., 1973. Neural Processes in Thermoregulation. Physiological Reviews, 53(4), pp.948–1017. Hermansen, L. & Stensvold, I., 1972. Production and removal of lactate during exercise in man. Acta physiologica
Scandinavica, 86(2), pp.191–201. Hershler, C. et al., 1992. Assessment of an infra-red non-contact sensor for routine skin temperature monitoring: a
preliminary study. J. Med Eng. Technol, 16(3), pp.117–122. Hill, A., 1927. Living Machinery, New York: Brace and Company. Hill, A., Long, C. & Lupton, H., 1924. Muscular exercise, lactic acid, and the supply and utilisation of oxygen - Parts I-
III. Proceedings of the Royal Society of London., pp.155–176. Hill, D.W., Davey, K.M. & Stevens, E.C., 2002. Maximal accumulated O2 deficit in running and cycling. Canadian
Journal of Applied Physiology = Revue canadienne de physiologie appliquee, 27(5), pp.463–78. Hinckson, E.A. & Hopkins, W.G., 2005. Reliability of Time to Exhaustion Analyzed with Critical-Power and Log-Log
Modeling. Medicine & Science in Sports & Exercise, 37(4), pp.696–701. Hodge, D. et al., 2013. Time course of the attenuation of sympathetic nervous activity during active heat acclimation.
Autonomic neuroscience : basic & clinical, 177(2), pp.101–3. Hofler, W., 1968. Changes in regional distribution of sweating during acclimatization to heat. Journal of Applied
Physiology, 25(5), pp.503–506. Holloszy, J. & Coyle, E.F., 1984. Adaptations of skeletal muscle to endurance exercise and their metabolic
consequences. Journal of Applied Physiology, 56(4), pp.831–838. Holloszy, J.O. & Kohrt, W.M., 1996. Regulation of carbohydrate and fat metabolism during and after exercise. Annual
review of nutrition, 16, pp.121–38. Honig, C.R., Connett, R.J. & Gayeski, T.E., 1992. O2 transport and its interaction with metabolism; a systems view of
aerobic capacity. Medicine and Science in Sports and Exercise, 24(1), pp.47–53. Hopkins, S.R. & McKenzie, D.C., 1994. The laboratory assessment of endurance performance in cyclists. Canadian
Journal of Applied Physiology = Revue canadienne de physiologie appliquée, 19(3), pp.266–74. Hopkins, W.G. et al., 2009. Progressive statistics for studies in sports Medicine and exercise science. Medicine and
Science in Sports and Exercise, 41(1), pp.3–13. Hopkins, W.G., 2005. Variability and Smallest Worthwhile Enhancements. Sportscience. 9, 17-20.
(sportsci.org/jour/05/wghtrack.htm). Accessed Jan 2016. Hopkins, W.G. & Hewson, D.J., 2001. Variability of competitive performance of distance runners. Medicine and
Science in Sports and Exercise, 33(9), pp.1588–92. Hopkins, W.G., Schabort, E.J. & Hawley, J.A., 2001. Reliability of power in physical performance tests. Sports
Medicine, 31(3), pp.211–34. Hopper, R.A. et al., 2000. Role and mechanism of PKC in ischemic preconditioning of pig skeletal muscle against
infarction. American Journal of Physiology. Regulatory, Integrative and Comparative Physiology, 279(2), pp.R666–76.
Horowitz, M., 2014. Heat acclimation, epigenetics, and cytoprotection memory. Comprehensive Physiology, 4(1), pp.199–230.
Horowitz, M., Peyser, Y.M. & Muhlrad, A., 1986. Alterations in cardiac myosin isoenzymes distribution as an adaptation to chronic environmental heat stress in the rat. Journal of molecular and cellular cardiology, 18(5), pp.511–5.
Houmard, J.A. et al., 1990. The influence of exercise intensity on heat acclimation in trained subjects. Medicine and Science in Sports and Exercise, 22(5), pp.615–20.
Howley, E., Bassett, D. & Welch, H., 1995. Criteria for maximal oxygen uptake: review and commentary. Medicine and Science in Sports and Exercise, 27(9), pp.1292–1301.
Hsu, A.R. et al., 2005. Effects of heat removal through the hand on metabolism and performance during cycling exercise in the heat. Canadian Journal of Applied Physiology = Revue canadienne de physiologie appliquee, 30(1), pp.87–104.
Hulston, C.J. & Jeukendrup, A.E., 2008. Substrate metabolism and exercise performance with caffeine and carbohydrate intake. Medicine and Science in Sports and Exercise, 40(12), pp.2096–104.
Ichinose-Kuwahara, T. et al., 2010. Sex differences in the effects of physical training on sweat gland responses during a graded exercise. Experimental Physiology, 95(10), pp.1026–32.
Iida, H. et al., 2007. Hemodynamic and neurohumoral responses to the restriction of femoral blood flow by KAATSU in healthy subjects. European Journal of Applied Physiology, 100(3), pp.275–285.
Ingham, S. A et al., 2013. Comparison of step-wise and ramp-wise incremental rowing exercise tests and 2000-m rowing ergometer performance. International Journal of Sports Physiology and performance, 8(2), pp.123–9.
Ingham, S. A et al., 2008. Determinants of 800-m and 1500-m running performance using allometric models.

257
Medicine and Science in Sports and Exercise, 40(2), pp.345–50. Ingjer, F., 1979. Effects of endurance training on muscle fibre ATP-ase activity, capillary supply and mitochondrial
content in man. The Journal of Physiology, 294, pp.419–32. Insler, S.R. & Sessler, D.I., 2006. Perioperative thermoregulation and temperature monitoring. Anesthesiology Clinics,
24(4), pp.823–37. Jacobs, I., 1986. Blood lactate. Implications for training and sports performance. Sports Medicine, 3(1), pp.10–25. Jacobs, R.A. et al., 2011. Determinants of time trial performance and maximal incremental exercise in highly trained
endurance athletes. Journal of Applied Physiology, 111(5), pp.1422–1430. Jay, O., Gariépy, L.M., et al., 2007. A three-compartment thermometry model for the improved estimation of
changes in body heat content. American Journal of Physiology. Regulatory, Integrative and Comparative Physiology, 292(1), pp.R167–75.
Jay, O., Reardon, F.D., et al., 2007. Estimating changes in mean body temperature for humans during exercise using core and skin temperatures is inaccurate even with a correction factor. Journal of Applied Physiology, 103(2), pp.443–51.
Jay, O. et al., 2011. Large differences in peak oxygen uptake do not independently alter changes in core temperature and sweating during exercise. American Journal of Physiology. Regulatory, Integrative and Comparative Physiology, 301(3), pp.R832–41.
Jay, O., 2014. Unravelling the true influences of fitness and sex on sweating during exercise. Experimental Physiology, 99(10), pp.1265–6.
Jay, O. & Kenny, G., 2007. The determination of changes in body heat content during exercise using calorimetry and thermometry. Journal of the human-environmental system, 10(1), pp.19–29.
Jay, O. & Kenny, G.P., 2009. Last Word on Viewpoint: Current evidence does not support an anticipatory regulation of exercise intensity mediated by rate of body heat storage. Journal of Applied Physiology, 107(2), p.635.
Jean-St-Michel, E. et al., 2011. Remote preconditioning improves maximal performance in highly trained athletes. Medicine and Science in Sports and Exercise, 43(7), pp.1280–6.
Jeukendrup, A.E. & Saris, W., 1996. A new validated endurance performance test. Medicine and Science in Sports and Exercise, 28(2), pp.266–270.
Johnson, J.M. & Kellogg, D.L., 2010. Local thermal control of the human cutaneous circulation. Journal of Applied Physiology, 109(4), pp.1229–38.
Johnson, J.M., Minson, C.T. & Kellogg, D.L., 2014. Cutaneous vasodilator and vasoconstrictor mechanisms in temperature regulation. Comprehensive Physiology, 4(1), pp.33–89.
Johnstone, J.A. et al., 2012. Bioharness(TM
) multivariable monitoring device: part. I: validity. Journal of Sports science & Medicine, 11(3), pp.400–8.
Jones, A.M., 1998. A five year physiological case study of an Olympic runner. British Journal of Sports Medicine, pp.39–43.
Jones, A.M., 2006a. Middle and Long distance running. In Sport and Exercise Physiology Testing Guidelines: Volume I – Sport Testing: The British Association of Sport and Exercise Sciences Guide. Routledge, p. 384.
Jones, A.M., 2006b. The Physiology of the World Record Holder for the Women’s Marathon. International Journal of Sports Science and Coaching, 1(2), pp.101–116.
Jones, A.M. & Carter, H., 2000. The effect of endurance training on parameters of aerobic fitness. Sports Medicine, 29(6), pp.373–386.
Jones, A.M. & Doust, J.H., 1996. A 1% treadmill grade most accurately reflects the energetic cost of outdoor running. Journal of Sports Sciences, 14(4), pp.321–327.
Jones, A.M. & Doust, J.H., 1998. The validity of the lactate minimum test for determination of the maximal lactate steady state. Medicine and Science in Sports and Exercise, 30(8), pp.1304–13.
Jones, A.M., Koppo, K. & Burnley, M., 2003. Effects of prior exercise on metabolic and gas exchange responses to exercise. Sports Medicine, 33(13), pp.949–71.
Jones, P.R. et al., 2012. Pre-cooling for endurance exercise performance in the heat: a systematic review. BMC Medicine, 10(1), p.166.
Joseph, T. et al., 2008. Perception of fatigue during simulated competition. Medicine and Science in Sports and Exercise, 40(2), pp.381–6.
Joyner, M.J., 1991. Modeling: optimal marathon performance on the basis of physiological factors. Journal of Applied Physiology, 70(2), pp.683–7.
Joyner, M.J. & Coyle, E.F., 2008. Endurance exercise performance: the Physiology of champions. The Journal of Physiology, 586(1), pp.35–44.
Kampmann, B. et al., 2008. Lowering of resting core temperature during acclimation is influenced by exercise stimulus. European Journal of Applied Physiology, 104(2), pp.321–327.
Kasch, F.W. et al., 1976. VO2max during horizontal and inclined treadmill running. Journal of Applied Physiology, 40(6), pp.982–983.
Katayama, K. et al., 2004. Effect of intermittent hypoxia on oxygen uptake during submaximal exercise in endurance athletes. European Journal of Applied Physiology, 92(1-2), pp.75–83.
Kay, D., Taaffe, D.R. & Marino, F.E., 1999. Whole-body pre-cooling and heat storage during self-paced cycling performance in warm humid conditions. Journal of Sports Sciences, 17(12), pp.937–944.
Keith, S.P., Jacobs, I. & McLellan, T.M., 1992. Adaptations to training at the individual anaerobic threshold. European

258
Journal of Applied Physiology and Occupational Physiology, 65(4), pp.316–323. Kelechi, T.J., Good, A. & Mueller, M., 2011. Agreement and Repeatability of an Infrared Thermometer. Journal of
Nursing Measurement, 19(1), pp.55–64. Kellogg, D.L. et al., 2005. Acetylcholine-induced vasodilation is mediated by nitric oxide and prostaglandins in human
skin. Journal of Applied Physiology, 98(2), pp.629–32. Kellogg, D.L. et al., 1995. Cutaneous Active Vasodilation in Humans Is Mediated by Cholinergic Nerve Cotransmission.
Circulation Research, 77(6), pp.1222–1228. Kellogg, D.L. et al., 1998. Nitric oxide and cutaneous active vasodilation during heat stress in humans. Journal of
Applied Physiology, 85(3), pp.824–9. Kenefick, R.W. et al., 2010. Skin temperature modifies the impact of hypohydration on aerobic performance. Journal
of Applied Physiology, 109(1), pp.79–86. Kenney, W.L., 1998. Heat flux and storage in hot environments. International Journal of sports Medicine, 19 Suppl 2,
pp.S92–5. Kenny, G.P. & Jay, O., 2013. Thermometry, calorimetry, and mean body temperature during heat stress.
Comprehensive Physiology, 3(4), pp.1689–1719. Kido, K. et al., 2015. Ischemic preconditioning accelerates muscle deoxygenation dynamics and enhances exercise
endurance during the work-to-work test. Physiological Reports, 3, pp.e12395–e12395. Kim, J.H. et al., 2013. Application of thermoregulatory modeling to predict core and skin temperatures in firefighters.
International Journal of Industrial Ergonomics, 43(1), pp.115–120. Kim, K., Kim, M. & Lee, D., 2004. The effect of exercise in cool, control and hot environments on cardioprotective
HSP70 induction. Journal of physiological anthropology and …, 23, pp.225–230. Kimura, M. et al., 2007. Repetition of Ischemic Preconditioning Augments Endothelium-Dependent Vasodilation in
Humans: Role of Endothelium-Derived Nitric Oxide and Endothelial Progenitor Cells. Arteriosclerosis, Thrombosis, and Vascular Biology, 27(6), pp.1403–1410.
Kindermann, W., Simon, G. & Keul, J., 1979. The significance of the aerobic-anaerobic transition for the determination of work load intensities during endurance training. European Journal of Applied Physiology and Occupational Physiology, 42(1), pp.25–34.
Kirby, C.R. & Convertino, V.A., 1986. Plasma aldosterone and sweat sodium concentrations after exercise and heat acclimation. Journal of Applied Physiology, 61(3), pp.967–970.
Kjeld, T. et al., 2014. Ischemic preconditioning of one forearm enhances static and dynamic apnea. Medicine and Science in Sports and Exercise, 46(1), pp.151–5.
Klausen, K. et al., 1967. Metabolic reactions to work in the desert. Journal of Applied Physiology, 22(2), pp.292–6. Koga, S. et al., 1997. Effect of increased muscle temperature on oxygen uptake kinetics during exercise. Journal of
Applied Physiology, 83(4), pp.1333–1338. Kozłowski, S. et al., 1985. Exercise hyperthermia as a factor limiting physical performance: temperature effect on
muscle metabolism. Journal of Applied Physiology, 59(3), pp.766–73. Kresfelder, T.L., Claassen, N. & Cronjé, M.J., 2006. Hsp70 Induction and hsp70 Gene polymorphisms as Indicators of
acclimatization under hyperthermic conditions. Journal of Thermal Biology, 31(5), pp.406–415. Kuennen, M. et al., 2011. Thermotolerance and heat acclimation may share a common mechanism in humans.
American Journal of Physiology. Regulatory, Integrative and Comparative Physiology, 301(2), pp.R524–33. Kurz, A., 2008. Physiology of thermoregulation. Best practice & research. Clinical anaesthesiology, 22(4), pp.627–44. LaFontaine, T.P., Londeree, B.R. & Spath, W.K., 1981. The maximal steady state versus selected running events.
Medicine and Science in Sports and Exercise, 13(3), pp.190–3. Lafrenz, A.J. et al., 2008. Effect of ambient temperature on cardiovascular drift and maximal oxygen uptake.
Medicine and Science in Sports and Exercise, 40(6), pp.1065–71. Lakens, D., 2013. Calculating and reporting effect sizes to facilitate cumulative science: a practical primer for t-tests
and ANOVAs. Frontiers in psychology, 4(November), p.863. Lamb, K.L., Eston, R.G. & Corns, D., 1999. Reliability of ratings of perceived exertion during progressive treadmill
exercise. British Journal of Sports Medicine, 33, pp.336–339. Laursen, P.B. et al., 2007. Reliability of time-to-exhaustion versus time-trial running tests in runners. Medicine and
Science in Sports and Exercise, 39(8), pp.1374–9. Lee, D.T. & Haymes, E.M., 1995. Exercise duration and thermoregulatory responses after whole body precooling.
Journal of Applied Physiology, 79(6), pp.1971–6. Lee, J.F. et al., 2015. Warm Skin Alters Cardiovascular Responses to Cycling after Preheating and Precooling.
Medicine & Science in Sports & Exercise, 47(6), pp.1168–1176. Leger, L., Mercier, D. & Gauvin, L., 1986. The relationship between %VO2max and running performance time. In D.
M. Landers, ed. Sport and Elite Performers. Champaign, Illinois: Human Kinetics Publishers, pp. 113–120. Leites, G.T. et al., 2013. Responses of obese and lean girls exercising under heat and thermoneutral conditions. The
Journal of Pediatrics, 162(5), pp.1054–60. Levine, B.D. et al., 1991. Left ventricular pressure-volume and Frank-Starling relations in endurance athletes.
Implications for orthostatic tolerance and exercise performance. Circulation, 84(3), pp.1016–23. Lieberman, D.E., 2015. Human locomotion and heat loss: an evolutionary perspective. Comprehensive Physiology,
5(1), pp.99–117. Londeree, B., 1986. The use of laboratory test results with long distance runners. Sports Medicine, 3, pp.201–213.

259
Lorenzo, S. et al., 2010. Heat acclimation improves exercise performance. Journal of Applied Physiology, 109(4), pp.1140–7.
Lorenzo, S. et al., 2011. Lactate threshold predicting time-trial performance: impact of heat and acclimation. Journal of Applied Physiology, 111(1), pp.221–7.
Lorenzo, S. & Minson, C.T., 2010. Heat acclimation improves cutaneous vascular function and sweating in trained cyclists. Journal of Applied Physiology, 109(6), pp.1736–43.
Lucia, A. et al., 2006. Physiological characteristics of the best Eritrean runners—exceptional running economy. Applied Physiology, Nutrition, and Metabolism, 31(5), pp.530–540.
MacDougall, J.D. et al., 1974. Effects of metabolic hyperthermia on performance during heavy prolonged exercise. Journal of Applied Physiology, 36(5), pp.538–44.
Malcata, R.M. & Hopkins, W.G., 2014. Variability of competitive performance of elite athletes: a systematic review. Sports Medicine, 44(12), pp.1763–74.
Marber, M.S., 1994. Ischaemic preconditioning. British Medical Journal, 308(January), pp.7–8. Marino, F.E., 2004. Anticipatory regulation and avoidance of catastrophe during exercise-induced hyperthermia.
Comparative biochemistry and Physiology. Part B, Biochemistry & Molecular Biology, 139(4), pp.561–9. Marocolo, M., Ribeiro da Mota, G. & Simim, M.A.M., 2015. Myths and Facts About the Effects of Ischemic
Preconditioning on Performance. International Journal of Sports Medicine. [In press]. Maron, M.B. et al., 1976. Oxygen uptake measurements during competitive marathon running. Journal of Applied
Physiology, 40(5), pp.836–8. Marongiu, E. & Crisafulli, A., 2014. Cardioprotection acquired through exercise: the role of ischemic preconditioning.
Current cardiology reviews, 10(4), pp.336–48. Marshall, J.M., 2000. Adenosine and muscle vasodilatation in acute systemic hypoxia. Acta physiologica
Scandinavica, 168(4), pp.561–73. Mattson, M.P., 2008. Hormesis defined. Ageing research reviews, 7(1), pp.1–7. Maughan, R. & Shirreffs, S.M., 2004. Exercise in the heat: challenges and opportunities. Journal of Sports Sciences,
22(10), pp.917–27. McClung, J.P. et al., 2008. Exercise-heat acclimation in humans alters baseline levels and ex vivo heat inducibility of
HSP72 and HSP90 in peripheral blood mononuclear cells. American Journal of Physiology. Regulatory, Integrative and Comparative Physiology, 294(1), pp.R185–91.
McConnell, T.R. & Clark, B.A., 1988. Treadmill protocols for determination of maximum oxygen uptake in runners. British Journal of Sports Medicine, 22(1), pp.3–5.
McKenna, M.J., Bangsbo, J. & Renaud, J.-M., 2008. Muscle K+, Na+, and Cl disturbances and Na+-K+ pump inactivation: implications for fatigue. Journal of Applied Physiology, 104(1), pp.288–95.
McLaughlin, J.E. et al., 2010. Test of the classic model for predicting endurance running performance. Medicine and Science in Sports and Exercise, 42(5), pp.991–7.
Mee, J.A., Peters, S., et al., 2015a. Restricted sweat evaporation preceding short term heat acclimation accelerates adaption in females. Extreme Physiology & Medicine, 4(Suppl 1), p.A112.
Mee, J.A., Gibson, O.R., et al., 2015b. A comparison of males and females’ temporal patterning to short- and long-term heat acclimation. Scandinavian Journal of Medicine & Science in Sports, 25(June), pp.250–258.
Mercer, J., 2001. Glossary of terms for Thermal Physiology. Third edition. Revised by The Commission for Thermal Physiology of the International Union of Physiological Sciences (IUPS Thermal Commission). Japanese Journal of Physiology, 51, pp.245–280.
Merla, A. et al., 2010. Thermal imaging of cutaneous temperature modifications in runners during graded exercise. Annals of Biomedical Engineering, 38(1), pp.158–63.
Midgley, A.W., McNaughton, L.R., Polman, R., et al., 2007. Criteria for Determination of Maximal Oxygen Uptake. Sports Medicine, 37(12), pp.1019–1028.
Midgley, A.W. & Carroll, S., 2009. Emergence of the verification phase procedure for confirming “true” VO2max. Scandinavian Journal of Medicine and Science in Sports, 19(3), pp.313–322.
Midgley, A.W., McNaughton, L.R. & Jones, A.M., 2007. Training to enhance the physiological determinants of long-distance running performance: can valid recommendations be given to runners and coaches based on current scientific knowledge? Sports Medicine, 37(10), pp.857–80.
Milanović, Z., Sporiš, G. & Weston, M., 2015. Effectiveness of High-Intensity Interval Training (HIT) and Continuous Endurance Training for VO2max Improvements: A Systematic Review and Meta-Analysis of Controlled Trials. Sports Medicine, pp.1469–1481.
Millet, G.P., Vleck, V. & Bentley, D., 2009. Physiological differences between cycling and running. Sports Medicine, 39(3), pp.179–206.
Millet, G.P., Vleck, V.E. & Bentley, D.J., 2009. Physiological differences between cycling and running: lessons from triathletes. Sports Medicine, 39(3), pp.179–206.
Minamino, T. et al., 1995. Activation of protein kinase C increases adenosine production in the hypoxic canine coronary artery through the extracellular pathway. Arteriosclerosis, thrombosis, and vascular biology, 15(12), pp.2298–304.
Minett, G.M., Duffield, R., Marino, F.E., et al., 2012. Duration-dependant response of mixed-method pre-cooling for intermittent-sprint exercise in the heat. European Journal of Applied Physiology, 112(10), pp.3655–66.
Minett, G.M., Duffield, R., Kellett, A., et al., 2012. Mixed-method pre-cooling reduces physiological demand without
260
improving performance of medium-fast bowling in the heat. Journal of Sports Sciences, 30(9), pp.907–15. Minett, G.M. et al., 2011. Volume-dependent response of precooling for intermittent-sprint exercise in the heat.
Medicine and Science in Sports and Exercise, 43(9), pp.1760–9. Mizzen, L. & Welch, W., 1988. Characterization of the thermotolerant cell. I. Effects on protein synthesis activity and
the regulation of heat-shock protein 70 expression. The Journal of cell biology, 106, pp.1105–1116. Mohr, M. et al., 2012. Physiological responses and physical performance during football in the heat. PloS one, 7(6),
p.e39202. Montain, S.J. & Coyle, E.F., 1992. Influence of graded dehydration on hyperthermia and cardiovascular drift during
exercise. Journal of Applied Physiology, 73(4), pp.1340–1350. Montero, D., Diaz-Cañestro, C. & Lundby, C., 2015. Endurance Training and VO2max: Role of Maximal Cardiac Output
and Oxygen Extraction. Medicine and Science in Sports and Exercise, [In Press]. Moran, D., Shitzer, A. & Pandolf, K., 1998. A physiological strain index to evaluate heat stress. American Journal of
Physiology. Regulatory, Integrative and Comparative Physiology, 277, pp.129–134. Moran, D.S., Shapiro, Y., et al., 1999. Can gender differences during exercise-heat stress be assessed by the
physiological strain index? The American Journal of Physiology, 276(6 Pt 2), pp.R1798–804. Moran, D.S., Horowitz, M., et al., 1999. The physiological strain index applied to heat-stressed rats. Journal of
Applied Physiology, 86(3), pp.895–901. Morgan, D. et al., 1991. Variability in running economy and mechanics among trained male runners. Medicine and
Science in Sports and Exercise, 23(3), pp.378–383. Morgan, D.W. et al., 1989. Ten kilometer performance and predicted velocity at VO2max among well-trained male
runners. Medicine and Science in Sports and Exercise, 21(1), pp.78–83. Morgan, D.W. et al., 1995. Variation in the aerobic demand of running among trained and untrained subjects.
Medicine and Science in Sports and Exercise, 27(3), pp.404–9. Morgan, D.W. & Daniels, J.T., 1994. Relationship between VO2max and the aerobic demand of running in elite
distance runners. International Journal of Sports Medicine, 15(7), pp.426–9. Morrison, S.A., Cheung, S.S. & Cotter, J.D., 2014. Importance of airflow for physiologic and ergogenic effects of
precooling. Journal of athletic training, 49(5), pp.632–9. Mortensen, S.P. et al., 2009. Adenosine contributes to blood flow regulation in the exercising human leg by
increasing prostaglandin and nitric oxide formation. Hypertension, 53, pp.993–999. Morton, J.P. et al., 2009. The exercise-induced stress response of skeletal muscle, with specific emphasis on humans.
Sports Medicine, 39(8), pp.643–62. Mountjoy, M. et al., 2012. Hyperthermic-related challenges in aquatics, athletics, football, tennis and triathlon.
British Journal of Sports Medicine, 46(11), pp.800–4. Muir, I. et al., 2001. Prediction of rectal temperature from ear canal temperature. Ergonomics, (April 2013), pp.37–
41. Muller, E.A., 1958. Muscular work and muscular blood circulation in reactive hyperemia. Pflugers Archiv : European
Journal of Physiology, 265(5), pp.29–39. Nadel, E.R. et al., 1971. Peripheral modifications to the central drive for sweating. Journal of Applied Physiology,
31(6), pp.828–833. Nadel, E.R., 1985. Recent advances in temperature regulation during exercise in humans. Federation proceedings,
44(7), pp.2286–2292. Nakamura, K., 2011. Central circuitries for body temperature regulation and fever. American Journal of Physiology.
Regulatory, Integrative and Comparative Physiology, 301(5), pp.R1207–28. Nassis, G.P. et al., 2015. The association of environmental heat stress with performance: analysis of the 2014 FIFA
World Cup Brazil. British Journal of Sports Medicine, 94-98. Neal, R.A. et al., 2015. Effect of short-term heat acclimation with permissive dehydration on thermoregulation and
temperate exercise performance. Scandinavian Journal of Medicine & Science in Sports, [In Press]. Ng, E.Y.K., Kaw, G.J.L. & Chang, W.M., 2004. Analysis of IR thermal imager for mass blind fever screening.
Microvascular Research, 68(2), pp.104–9. Nicholson, R.M. & Sleivert, G.G., 2001. Indices of lactate threshold and their relationship with 10-km running
velocity. Medicine and Science in Sports and Exercise, 33(2), pp.339–42. Nielsen, B. et al., 1993. Human circulatory and thermoregulatory adaptations with heat acclimation and exercise in a
hot, dry environment. The Journal of Physiology, 460, pp.467–485. Nielsen, B., 1966. Regulation of Body Temperature and Heat Dissipation at Different Levels of Energy-and Heat
Production in Man. Acta Physiologica Scandinavica, 68(2), pp.215–227. Noakes, T., Myburgh, K. & Schall, R., 1990. Peak treadmill running velocity during the VO2 max test predicts running
performance. Journal of Sports Sciences, 8(1), pp.35–45. Noakes, T.D., 2000. Physiological models to understand exercise fatigue and the adaptations that predict or enhance
athletic performance. Scandinavian Journal of Medicine & Science in Sports, 10(3), pp.123–145. Noakes, T.D., 2011. Time to move beyond a brainless exercise physiology: the evidence for complex regulation
of human exercise performance. Applied Physiology, Nutrition, and Metabolism = Physiologie appliquée, nutrition et métabolisme, 36(1), pp.23–35.
Noakes, T.D., Lambert, M.I. & Hauman, R., 2009. Which lap is the slowest? An analysis of 32 world mile record performances. British Journal of Sports Medicine, 43(10), pp.760–4.

261
Nybo, L. et al., 2001. Effects of marked hyperthermia with and without dehydration on VO2 kinetics during intense exercise. Journal of Applied Physiology, 90(3), pp.1057–1064.
Nybo, L. & Gonzalez-Alonso, J., 2015. Critical core temperature: a hypothesis too simplistic to explain hyperthermia-induced fatigue. Scandinavian Journal of Medicine & Science in Sports, 25, pp.4–5.
Nybo, L., Rasmussen, P. & Sawka, M.N., 2014. Performance in the heat-physiological factors of importance for hyperthermia-induced fatigue. Comprehensive Physiology, 4(2), pp.657–89.
Paavolainen, L. et al., 1999. Explosive-strength training improves 5-km running time by improving running economy and muscle power. Journal of Applied Physiology, 86(5), pp.1527–33.
Pandolf, K.B., 1998. Time course of heat acclimation and its decay. International Journal of Sports Medicine, 19 Suppl 2, pp.157–60.
Pang, C.Y. et al., 1995. Acute ischaemic preconditioning protects against skeletal muscle infarction in the pig. Cardiovascular research, 29(6), pp.782–788.
Pang, C.Y. et al., 1997. Role of ATP-sensitive K+ channels in ischemic preconditioning of skeletal muscle against infarction. The American Journal of Physiology, 273(1 Pt 2), pp.H44–51.
Papadopoulos, C. et al., 2008. The effect of the hypohydration on the lactate threshold in a hot and humid environment. The Journal of Sports Medicine and Physical fitness, 48(3), pp.293–9.
Parkin, J.M. et al., 1999. Effect of ambient temperature on human skeletal muscle metabolism during fatiguing submaximal exercise. Journal of Applied Physiology, 86(3), pp.902–8.
Parsons, K., 2014. Human Thermal Environments: The Effects of Hot, Moderate, and Cold Environments on Human Health, Comfort, and Performance Third Edition., Florida, US: CRC Press.
Pate, R.R. et al., 1992. Physiological, anthropometric, and training correlates of running economy. Medicine and Science in Sports and Exercise, 24(10), pp.1128–33.
Patterson, M., Warlters, D. & Taylor, N., 1994. Changes in cutaneous blood flow during incremental exercise with and without external thermal stress. Sixth Int. Conf. on Envir Eron, (l), pp.236–237.
Patterson, M.J., Stocks, J.M. & Taylor, N.A.S., 2004. Humid heat acclimation does not elicit a preferential sweat redistribution toward the limbs. American Journal of Physiology. Regulatory, Integrative and Comparative Physiology, 286(3), pp.R512–8.
Patterson, M.J., Stocks, J.M. & Taylor, N.A.S., 2004. Sustained and generalized extracellular fluid expansion following heat acclimation. The Journal of Physiology, 559 (1), pp.327–334.
Patterson, S.D. et al., 2015. The Effect of Ischemic Preconditioning on Repeated Sprint Cycling Performance. Medicine and Science in Sports and Exercise, 47(8), pp.1652–8.
Périard, J.D., 2013. Cardiovascular determinants involved in pacing under heat stress. Sports Medicine, 43(7), 643–5. Périard, J.D. et al., 2011. Cardiovascular strain impairs prolonged self-paced exercise in the heat. Experimental
Physiology, 96(2), pp.134–44. Périard, J.D. & Racinais, S., 2015. Performance and Pacing during Cycle Exercise in Hyperthermic and Hypoxic
Conditions. Medicine & Science in Sports & Exercise, (December), p.1. Périard, J.D., Racinais, S. & Sawka, M.N., 2015. Adaptations and mechanisms of human heat acclimation:
Applications for competitive athletes and sports. Scandinavian Journal of Medicine & Science in Sports, 25, pp.20–38.
Pfitzinger, P. & Freedson, P.S., 1998. The reliability of lactate measurements during exercise. International Journal of Sports Medicine, 19(5), pp.349–57.
Pirnay, F., Deroanne, R. & Petit, J.M., 1970. Maximal oxygen consumption in a hot environment. Journal of Applied Physiology, 28(5), pp.642–645.
Poirier, M.P. et al., 2015. Whole-body heat exchange during heat acclimation and its decay. Medicine and Science in Sports and Exercise, 47(2), pp.390–400.
Pollock, M.L., 1977. Submaximal and maximal working capacity of elite distance runners. Part I: Cardiorespiratory aspects. Annals of the New York Academy of Sciences, 301, pp.310–22.
Poole, D.C., Wilkerson, D.P. & Jones, A.M., 2008. Validity of criteria for establishing maximal O2 uptake during ramp exercise tests. European Journal of Applied Physiology, 102(4), pp.403–410.
Potteiger, J.A. & Weber, S.F., 1994. Rating of perceived exertion and heart rate as indicators of exercise intensity in different environmental temperatures. Medicine and Science in Sports and Exercise, 26(6), pp.791–796.
Powers, S.K. et al., 1989. Effects of incomplete pulmonary gas exchange on VO2 max. Journal of Applied Physiology, 66(6), pp.2491–5.
Powers, S.K., Howley, E.T. & Cox, R., 1985. Blood lactate concentrations during submaximal work under differing environmental conditions. The Journal of Sports Medicine and Physical fitness, 25(3), pp.84–9.
Prajapati, B., Dunne, M. & Armstrong, R., 2010. Sample size estimation and statistical power analyses. OT Peer reviewed (Clinical).
Di Prampero, P.E. et al., 1993. Energetics of best performances in middle-distance running. Journal of Applied Physiology, 74(5), pp.2318–24.
Price, M.J., 2015. Preparation of Paralympic athletes; Environmental concerns and heat acclimation. Frontiers in Physiology.
Price, M.J., 2006. Thermoregulation during exercise in individuals with spinal cord injuries. Sports Medicine, 36(10), pp.863–879.
Price, M.J., Boyd, C. & Goosey-Tolfrey, V.L., 2009. The physiological effects of pre-event and midevent cooling during

262
intermittent running in the heat in elite female soccer players. Applied physiology, nutrition, and metabolism = Physiologie appliquee, nutrition et metabolisme, 34(5), pp.942–949.
Price, M.J. & Maley, M.J., 2015. The effects of pre-cooling on skin blood flow during exercise in the heat and subsequent performance. Extreme Physiology & Medicine, 4(Suppl 1), p.A127.
Przyklenk, K. et al., 1993. Regional ischemic “preconditioning” protects remote virgin myocardium from subsequent sustained coronary occlusion. Circulation, 87(3), pp.893–9.
Racinais, S. et al., 2015. Consensus recommendations on training and competing in the heat. British Journal of Sports Medicine, pp.1–10.
Racinais, S. et al., 2015a. Consensus recommendations on training and competing in the heat. Scandinavian Journal of Medicine & Science in Sports, 25, pp.6–19.
Racinais, S.et al., 2015b. Effect of heat and heat acclimatization on cycling time trial performance and pacing. Medicine and Science in Sports and Exercise, 47(3), pp.601–6.
Racinais, S., Hue, O. & Blonc, S., 2004. Time-of-day effects on anaerobic muscular power in a moderately warm environment. Chronobiology international, 21(3), pp.485–95.
Racinais, S. & Oksa, J., 2010. Temperature and neuromuscular function. Scandinavian Journal of Medicine & Science in Sports, 20 Suppl 3, pp.1–18.
Ramanathan, N.L., 1964. A New Weighting System for Mean Surface Temperature of the Human Body. Journal of Applied Physiology, 19(3), pp.531–3.
Ranalli, G. et al., 2010. Effect of body cooling on subsequent aerobic and anaerobic exercise performance: a systematic review. The Journal of Strength & Conditioning Research, 24(12), pp.3488–3496.
Randall, C.A., Ross, E.Z. & Maxwell, N.S., 2015. Effect of Practical Precooling on Neuromuscular Function and 5-km Time-Trial Performance in Hot, Humid Conditions Among Well-Trained Male Runners. Journal of strength and conditioning research / National Strength & Conditioning Association, 29(7), pp.1925–36.
Ravanelli, N.M. et al., 2014. Do greater rates of body heat storage precede the accelerated reduction of self-paced exercise intensity in the heat? European Journal of Applied Physiology, pp.2399–2410.
Reilly, T. & Waterhouse, J., 2009. Circadian aspects of body temperature regulation in exercise. Journal of Thermal Biology, 34(4), pp.161–170.
Richter, E.A. et al., 1982. Muscle glycogenolysis during exercise: dual control by epinephrine and contractions. The American Journal of Physiology, 242(1), pp.E25–32.
Riksen, N.P. et al., 2008. Human in vivo research on the vascular effects of adenosine. European Journal of pharmacology, 585(2-3), pp.220–7.
Ring, E.F.J. & Ammer, K., 2012. Infrared thermal imaging in Medicine. Physiological Measurement, 33(3), pp.R33–46. Rivera-Brown, A., Rivera, M. & Frontera, W., 1995. Original Research Reliability of VO2max in Adolescent Runners: A
Comparison Between Plateau Achievers and Nonachievers. Pediatric exercise science, 7(2), pp.203–210. Robergs, R., Ghiasvand, F. & Parker, D., 2004. Biochemistry of exercise-induced metabolic acidosis. American Journal
of Physiology. Regulatory, Integrative and Comparative Physiology, 287(3), pp.502–16. Roberts, M.F. et al., 1977. Skin blood flow and sweating changes following exercise training and heat acclimation.
Journal of Applied Physiology, 43(1), pp.133–137. Roberts, M.F. & Wenger, C., 1979. Control of skin circulation during exercise and heat stress. Medicine and Science in
Sports, 11(1), pp.36–41. Roddie, I., 1983. Circulation to skin and adipose Tissue. In J. T. Shepherd, F. M. Abboud, & S. R. Geiger, eds.
Handbook of Physiology, a critical, comprehensive presentation of physiological knowledge and concepts. Bethesda, Maryland: American Physiological Society.
Roecker, K. et al., 1998. Predicting competition performance in long-distance running by means of a treadmill test. Medicine and Science in Sports and Exercise, 30(10), pp.1552–1557.
Roelands, B. et al., 2011. No effect of caffeine on exercise performance in high ambient temperature. European Journal of Applied Physiology, 111(12), pp.3089–3095.
Roelands, B. et al., 2008. The effects of acute dopamine reuptake inhibition on performance. Medicine and Science in Sports and Exercise, 40(5), pp.879–85.
Rollo, I. & Williams, C., 2011. Effect of mouth-rinsing carbohydrate solutions on endurance performance. Sports Medicine, 41(6), pp.449–61.
Romanovsky, A.A., 2007. Thermoregulation: some concepts have changed. Functional architecture of the thermoregulatory system. American Journal of Physiology. Regulatory, Integrative and Comparative Physiology, 292(1), pp.37–46.
Rønnestad, B.R. & Mujika, I., 2014. Optimizing strength training for running and cycling endurance performance: A review. Scandinavian Journal of Medicine & Science in Sports, 24(4), pp.603–612.
Ross, M.L. et al., 2011. Novel precooling strategy enhances time trial cycling in the heat. Medicine and Science in Sports and Exercise, 43(1), pp.123–33.
Ross, M.L. et al., 2013. Precooling methods and their effects on athletic performance : a systematic review and practical applications. Sports Medicine, 43(3), pp.207–25.
Rowell, L.B. et al., 1965. Hepatic clearance of indocyanine green in man under thermal and exercise stresses. Journal of Applied Physiology, 20(3), pp.384–94.
Rowell, L.B., 1974. Human cardiovascular adjustments to exercise and thermal stress. Physiological Reviews rev, 54(1), pp.75–159.

263
Rowell, L.B., 1986. Human Circulation: Regulation During Physical Stress, Oxford University Press. Rowell, L.B., Brengelmann, G.L., Murray, J.A., et al., 1969. Human metabolic responses to hyperthermia during mild
to maximal exercise. Journal of Applied Physiology, 26(4), pp.395–402. Rowell, L.B., Brengelmann, G.L., Murray, J.A., et al., 1969. Human metabolic responses to hyperthermia during mild
to maximal exercise. Journal of Applied Physiology, 26(4), pp.395–402. Rowell, L.B., 1973. Regulation of splanchnic blood flow in man. Physiologist. Rowell, L.B. et al., 1968. Splanchnic blood flow and metabolism in heat-stressed man. Journal of Applied Physiology,
24(4), pp.475–84. Rowell, L.B. et al., 1971. Splanchnic vasoconstriction in hyperthermic man--role of falling blood pressure. Journal of
Applied Physiology, 31(6), pp.864–869. Roy, R., Boucher, J.P. & Comtois, A.S., 2006. Validity of infrared thermal measurements of segmental paraspinal skin
surface temperature. Journal of manipulative and physiological therapeutics, 29(2), pp.150–5. De Ruiter, C.J. & De Haan, a., 2000. Temperature effect on the force/velocity relationship of the fresh and fatigued
human adductor pollicis muscle. Pflugers Archiv European Journal of Physiology, 440(1), pp.163–170. Rusko, H.K., Tikkanen, H.O. & Peltonen, J.E., 2004. Altitude and endurance training. Journal of Sports Sciences,
22(10), pp.928–44. Ryffel, G., 1910. Lactic acid metabolism: a critical review. The Quarterly Journal of Medicine, 3, pp.221–231. Sahlin, K., 1992. Metabolic factors in fatigue. Sports Medicine, 13(2), pp.99–107. Saltin, B., 1985. Hemodynamic adaptations to exercise. The American Journal of Cardiology, 55(10), pp.42–D47. Saltin, B. & Astrand, P.O., 1967. Maximal oxygen uptake in athletes. Journal of Applied Physiology, 23(3), pp.353–
358. Saltin, B. & Wagner, P. (2006). Point:Counterpoint: In health and in a normoxic environment, VO2 max is limited
primarily by cardiac output and locomotor muscle blood flow. Journal of Applied Physiology. 100 (2), 744-748. Saltin, B. & Hermansen, L., 1966. Esophageal, rectal, and muscle temperature during exercise. Journal of Applied
Physiology, 21(6), pp.1757–1762. Salvador, A.F. et al., 2015. Ischemic Preconditioning and Exercise Performance: A Systematic Review and Meta-
Analysis. International Journal of Sports Physiology and Performance, (In Press). Sancheti, A. & White, M.D., 2006. Reproducibility of relationships between human ventilation, its components and
oesophageal temperature during incremental exercise. European Journal of Applied Physiology, 96(5), pp.495–504.
Sandström, M.E. et al., 2008. The effect of 15 consecutive days of heat-exercise acclimation on heat shock protein 70. Cell stress & Chaperones, 13(2), pp.169–75.
Sato, F. et al., 1990. Functional and morphological changes in the eccrine sweat gland with heat acclimation. Journal of Applied Physiology, 69(1), pp.232–6.
Sato, K., Kang, W.H. & Saga, K., 1989. Biology of sweat glands and their disorders. I. Normal sweat gland function. Journal of the American Academy of Dermatology, 20(4), pp.537–563.
Saunders, P.U. et al., 2004a. Factors affecting running economy in trained distance runners. Sports Med, 34(7), pp.465–485.
Saunders, P.U. et al., 2004b. Reliability and variability of running economy in elite distance runners. Medicine and Science in Sports and Exercise, 36(11), pp.1972–6.
Saunders, P.U. & Green, D.J., 2013. Runners and Walkers. In R. K. Tanner & C. J. Gore, eds. Physiological tests for elite athletes. Champaign, Illinois: Human Kinetics, pp. 397–409.
Sawka, M.N. et al., 2000. Blood volume: importance and adaptations to exercise training, environmental stresses, and trauma/sickness. Medicine and Science in Sports and Exercise, 32(2), pp.332–348.
Sawka, M.N., Pandolf, K.B., et al., 1983. Does heat acclimation lower the rate of metabolism elicited by muscular exercise? Aviation, space, and environmental Medicine, 54(1), pp.27–31.
Sawka, M.N., Hubbard, R.W., et al., 1983. Effects of acute plasma volume expansion on altering exercise-heat performance. European Journal of Applied Physiology and occupational Physiology, 51(3), pp.303–12.
Sawka, M.N. et al., 1985. Influence of heat stress and acclimation on maximal aerobic power. European Journal of Applied Physiology and Occupational Physiology, 53(4), pp.294–8.
Sawka, M.N. et al., 2011. Integrated physiological mechanisms of exercise performance, adaptation, and maladaptation to heat stress. Comprehensive Physiology, 1(4), pp.1883–928.
Sawka, M.N., Cheuvront, S.N. & Kenefick, R.W., 2012. High skin temperature and hypohydration impair aerobic performance. Experimental Physiology, 97(3), pp.327–32.
Sawka, M.N. & Young, A.J., 2006. Physiological Systems and Their Responses to Conditions of Heat and Cold. In C. M. Tipton, ed. ACSM’s Advanced Exercise Physiology. Baltimore: Lippincott Williams & Wilkin, pp. 535–563.
Schlader, Z.J., Simmons, S.E., et al., 2011a. Skin temperature as a thermal controller of exercise intensity. European Journal of Applied Physiology, 111(8), pp.1631–9.
Schlader, Z.J. Simmons, S.E., et al., 2011b. The independent roles of temperature and thermal perception in the control of human thermoregulatory behavior. Physiology and Behavior, 103(2), pp.217–224.
Schlader, Z.J., 2014. The relative overlooking of human behavioral temperature regulation: An issue worth resolving. Temperature, 1, pp.20–21.
Schlader, Z.J., Stannard, S.R. et al., 2011a. Exercise and heat stress: performance, fatigue and exhaustion--a hot topic. British Journal of Sports Medicine, 45(1), pp.3–5.

264
Schlader, Z.J., Stannard, S.R. et al., 2011b. Is peak oxygen uptake a determinant of moderate-duration self-paced exercise performance in the heat? Applied Physiology, Nutrition, and Metabolism = Physiologie appliquee, nutrition et metabolisme, 36(6), pp.863–72.
Schmit, C., Le Meur, Y., et al., 2015. Heat-acclimatization and pre-cooling: a further boost for endurance performance? Scandinavian Journal of Medicine & Science in Sports, (In Press).
Schmit, C., Duffield, R., et al., 2016. Pacing Adjustments Associated With Familiarisation: Heat vs. Temperate Environments. International Journal of Sports Physiology and performance, [In Press].
Schmitt, E. et al., 2007. Intracellular and extracellular functions of heat shock proteins: repercussions in cancer therapy. Journal of Leukocyte Biology, 81(1), pp.15–27.
Schneider, E.L. & Moseley, M.F., 2014. The Temperature Regulatory System. In Tipton & C. M., eds. History of Exercise Physiology. Champaign, Illinois: Human Kinetics, pp. 490–492.
Sciaraffa, D. et al., 1980. Human acclimation and acclimatization to heat: A compendium of research - 1968 - 1978. In NASA Technical Memorandum. California, U.S.A.: Ames Research Center, Moffett Field.
Selfe, J. et al., 2006. An accurate and reliable method of thermal data analysis in thermal imaging of the anterior knee for use in cryotherapy research. Archives of Physical Medicine and Rehabilitation, 87(12), pp.1630–5.
Sessler, D.I., 2008. Temperature monitoring and perioperative thermoregulation. Anesthesiology, 109(2), pp.318–38. Shapiro, Y. et al., 1981. Physiological and hematologic responses to summer and winter dry-heat acclimation. Journal
of Applied Physiology, 50(4), pp.792–798. Shapiro, Y. et al., 1995. Validation and adjustment of the mathematical prediction model for human sweat rate
responses to outdoor environmental conditions. Ergonomics, 38(5), pp.981–6. Shapiro, Y., Moran, D. & Epstein, Y., 1998. Acclimatization strategies--preparing for exercise in the heat. International
Journal of Sports Medicine, 19 Suppl 2, pp.S161–3. Sharma, V. et al., 2015. From Protecting the Heart to Improving Athletic Performance – the Benefits of Local and
Remote Ischaemic Preconditioning. Cardiovascular Drugs and Therapy, [In Press]. Sharp, R.L., Williams, D.J. & Bevan, L., 1991. Effects of controlled frequency breathing during exercise on blood gases
and acid-base balance. International Journal of Sports Medicine, 12(1), pp.62–5. Shaw, A.J., Ingham, S.A. & Folland, J.P., 2014. The valid measurement of running economy in runners. Medicine and
Science in Sports and Exercise, 46(10), pp.1968–73. Sherman, R., 1996. Comparative effectiveness of videothermography, contact thermography, and infrared beam
thermography for scanning relative skin temperature. Journal of Rehabilitation Research and Development, 33(4), pp.377–386.
Shibasaki, M. & Crandall, C.G., 2010. Mechanisms and controllers of eccrine sweating in humans. Frontiers in Bioscience, 2, pp.685–696.
Shibasaki, M., Wilson, T.E. & Crandall, C.G., 2006. Neural control and mechanisms of eccrine sweating during heat stress and exercise. Journal of Applied Physiology, 100(5), pp.1692–701.
Shido, O. et al., 1999. Core temperature and sweating onset in humans acclimated to heat given at a fixed daily time. The American Journal of Physiology, 276(4 Pt 2), pp.1095–101.
Shvartz, E. et al., 1977. Heat acclimation, physical fitness, and responses to exercise in temperate and hot environments. Journal of Applied Physiology: Respiratory, Environmental and Exercise Physiology, 43(4), pp.678–83.
Siegel, R. et al., 2010. Ice slurry ingestion increases core temperature capacity and running time in the heat. Medicine and Science in Sports and Exercise, 42(4), pp.717–25.
Siegel, R. et al., 2012. Pre-cooling with ice slurry ingestion leads to similar run times to exhaustion in the heat as cold water immersion. Journal of Sports Sciences, 30(2), pp.155–65.
Siegel, R. et al., 2011. The influence of ice slurry ingestion on maximal voluntary contraction following exercise-induced hyperthermia. European Journal of Applied Physiology, 111(10), pp.2517–24.
Siegel, R. & Laursen, P.B., 2012. Keeping Your Cool Heat with Internal Cooling Methods. Sports Medicine, 42(2), pp.89–98.
Sikri, G. & Chawla, A., 2015. Role of remote ischemic preconditioning against acute mountain sickness during early phase. Physiological Reports, 3(8), p.e12499.
Sims, S.T. et al., 2007. Preexercise sodium loading aids fluid balance and endurance for women exercising in the heat. Journal of Applied Physiology, 103(2), pp.534–41.
Siri, W.E., 1956. The gross composition of the body. Advances in Biological and Medical Physics, 4, pp.239–80. Sjödin, B., Jacobs, I. & Svedenhag, J., 1982. Changes in onset of blood lactate accumulation (OBLA) and muscle
enzymes after training at OBLA. European Journal of Applied Physiology and occupational Physiology, 49(1), pp.45–57.
Skidmore, R. et al., 1995. HSP70 induction during exercise and heat stress in rats: role of internal temperature. The American Journal of Physiology, 268(1 Pt 2), pp.R92–7.
Smirmaul, B.P.C., Bertucci, D.R. & Teixeira, I.P., 2013. Is the VO2max that we measure really maximal? Frontiers in Physiology, 4(August), pp.10–13.
Smith, D.L. et al., 2015. Myocardial functional responses do not contribute to maximal exercise performance in the heat. Extreme Physiology & Medicine, 4(1), p.11.
Smolander, J. et al., 1986. Aerobic and anaerobic responses to incremental exercise in a thermoneutral and a hot dry environment. Acta physiologica Scandinavica, 128(1), pp.15–21.

265
Smolander, J. et al., 1987. Skin blood flow during incremental exercise in a thermoneutral and a hot dry environment. European Journal of Applied Physiology and occupational Physiology, 56(3), pp.273–280.
Smoljanic, J. et al., 2014. Running economy , not aerobic fitness , independently alters thermoregulatory responses during treadmill running Running economy , not aerobic fitness , independently alters thermoregulatory responses during treadmill running. Journal of Applied Physiology, 117, pp.1451–1459.
Spilsbury, K.L. et al., 2015. Tapering strategies in elite British endurance runners. European Journal of sport science, 15(5), pp.367–73.
Spriet, L.L., Ren, J.M. & Hultman, E., 1988. Epinephrine infusion enhances muscle glycogenolysis during prolonged electrical stimulation. Journal of Applied Physiology, 64(4), pp.1439–44.
Spurway, J. & Jones, A.M., 2007. Lactate Testing. In E. M. Winter et al., eds. Sport and Exerice Physiology Testing Guidelines: The British Association of Sport and Exercise Sciences Guide. Volume One, Sport Testing. Oxon, UK, pp. 112–119.
St Clair Gibson, A. et al., 2006. The role of information processing between the brain and peripheral physiological systems in pacing and perception of effort. Sports Medicine, 36(8), pp.705–22.
Stannard, A.B. et al., 2011. Effects of wearing a cooling vest during the warm-up on 10-km run performance. Journal of Strength and Conditioning Research, 25(2), pp.2018–2024.
Stegmann, H. & Kindermann, W., 1982. Comparison of prolonged exercise tests at the individual anaerobic threshold and the fixed anaerobic threshold of 4 mmol.l(-1) lactate. International Journal of Sports Medicine, 3(2), pp.105–10.
Stegmann, H., Kindermann, W. & Schnabel, A., 1981. Lactate kinetics and individual anaerobic threshold. International Journal of Sports Medicine, 2(3), pp.160–5.
Steketee, J., 1973. Spectral emissivity of skin and pericardium. Physics in Medicine and Biology, 18(5), pp.686–94. Stevens, C.J. & Dascombe, B.J., 2015. The Reliability and Validity of Protocols for the Assessment of Endurance Sports
Performance: An Updated Review. Measurement in Physical Education and Exercise Science, 19(4), pp.177–185.
Stratton, E. et al., 2008. Treadmill Velocity Best Predicts 5000-m Run Performance. International Journal of Sports Medicine, 30(01), pp.40–45.
Stray-Gundersen, J., Chapman, R.F. & Levine, B.D., 2001. “Living high-training low” altitude training improves sea level performance in male and female elite runners. Journal of Applied Physiology, 91(3), pp.1113–1120.
Suga, T. et al., 2010. Dose effect on intramuscular metabolic stress during low-intensity resistance exercise with blood flow restriction. Journal of Applied Physiology, 108(6), pp.1563–7.
Sunderland, C., Morris, J. & Nevill, M., 2008. A heat acclimation protocol for team sports. British Journal of Sports Medicine, 42(5), pp.327–33.
Suresh, K. & Chandrashekara, S., 2012. Sample size estimation and power analysis for clinical research studies. Journal of human reproductive sciences, 5(1), pp.7–13.
Tanner, R.K. & Gore, C.J., 2013. Physiological Tests for Elite Athletes Second edi., Champaign, Illinois: Human Kinetics. Tansey, E. a. & Johnson, C.D., 2015. Recent advances in thermoregulation. Advances in Physiology Education, 39(3),
pp.139–148. Tatterson, A. et al., 2000. Effects of heat stress on physiological responses and exercise performance in elite cyclists.
Journal of science and Medicine in Sport / Sports Medicine Australia, 3(2), pp.186–93. Taylor, A.W. & Bachman, L., 1999. The effects of endurance training on muscle fibre types and enzyme activities.
Canadian Journal of Applied Physiology = Revue canadienne de physiologie appliquee, 24(1), pp.41–53. Taylor, N.A.S. 2014. Human heat adaptation. Comprehensive Physiology. 4 (1), 325-65. Taylor, N.A.S. et al., 1995. Heat acclimation procedures: preparation for humid heat exposure, Department of
Defence Science and Technology Organisation. Taylor, N.A.S. et al., 2009. The roles of hands and feet in temperature regulation in hot and cold environments.
Proceedings of the 13th International Conference on Environmental Ergonomics, pp.405–409. Taylor, N.A.S. & Cotter, J.D., 2006. Heat Adaptation: Guidlines for the optimisation of human performance.
International Journal of Sports Medicine, 7(1), pp.33–57. Taylor, W.F. et al., 1984. Modification of the cutaneous vascular response to exercise by local skin temperature.
Journal of Applied Physiology, 57(6), pp.1878–1884. Tetievsky, A. et al., 2008. Physiological and molecular evidence of heat acclimation memory: a lesson from thermal
responses and ischemic cross-tolerance in the heart. Physiological genomics, 34(1), pp.78–87. Thomas, G.D. & Victor, R.G., 1998. Nitric oxide mediates contraction-induced attenuation of sympathetic
vasoconstriction in rat skeletal muscle. The Journal of Physiology, 506 (3), pp.817–26. Tikuisis, P., McLellan, T.M. & Selkirk, G., 2002. Perceptual versus physiological heat strain during exercise-heat stress.
Medicine and Science in Sports and Exercise, 34(9), pp.1454–61. Tikuisis, P., Meunier, P. & Jubenville, C.E., 2001. Human body surface area: measurement and prediction using three
dimensional body scans. European Journal of Applied Physiology, 85(3-4), pp.264–71. Tocco, F. et al., 2015. Muscle Ischemic Preconditioning does not Improve Performance during Self-Paced Exercise.
International Journal of Sports Medicine, 36(1), pp.9–15. Torii, M. et al., 1992. Fall in skin temperature of exercising man. British Journal of Sports Medicine, 26(1), pp.29–32. Tóth, A. et al., 2007. Contribution of anaerobic metabolism to reactive hyperemia in skeletal muscle. American
Journal of Physiology. Heart and circulatory Physiology, 292(6), pp.H2643–53.

266
Tucker, R. et al., 2004. Impaired exercise performance in the heat is associated with an anticipatory reduction in skeletal muscle recruitment. Pflugers Archiv : European Journal of Physiology, 448(4), pp.422–30.
Tucker, R. et al., 2006. The rate of heat storage mediates an anticipatory reduction in exercise intensity during cycling at a fixed rating of perceived exertion. The Journal of Physiology, 574(Pt 3), pp.905–15.
Tucker, R., 2008. Thermoregulation, fatigue and exercise modality. Medicine and sport science, 53, pp.26–38. Tucker, R. & Noakes, T.D., 2009. The physiological regulation of pacing strategy during exercise: a critical review.
British Journal of Sports Medicine, 43(6), p.e1. Tyler, C.J., 2011. The effect of skin thermistor fixation method on weighted mean skin temperature. Physiological
Measurement, 32(10), pp.1541–7. Tyler, CJ., 2016. The Effects of Heat Adaptation on Physiology, Perception and Exercise Performance in the Heat: A
Meta-Analysis. Sports Medicine. [In Press]. Tyler, C.J. & Sunderland, C., 2008. The effect of ambient temperature on the reliability of a preloaded treadmill time-
trial. International Journal of Sports Medicine, 29(10), pp.812–6. Tyler, C.J., Sunderland, C. & Cheung, S.S., 2015. The effect of cooling prior to and during exercise on exercise
performance and capacity in the heat: a meta-analysis. British Journal of Sports Medicine, 49(1), pp.7–13. Uckert, S. & Joch, W., 2007. Effects of warm-up and precooling on endurance performance in the heat. British
Journal of Sports Medicine, 41(6), pp.380–4. Vihma, T., 2010. Effects of weather on the performance of marathon runners. International Journal of
biometeorology, 54(3), pp.297–306. Villanova, N., Azpiroz, F. & Malagelada, J.R., 1997. Perception and gut reflexes induced by stimulation of
gastrointestinal thermoreceptors in humans. The Journal of Physiology, 502 ( Pt 1(1997), pp.215–22. Vleck, V.E. & Garbutt, G. 1998. Injury and training characteristics of male elite, development squad and club
triathletes. International Journal of Sports Medicine. 19(1), pp.38-42. Wagner, P., 1992. Gas exchange and peripheral diffusion limitation. Medicine and Science in Sports and Exercise,
24(1), pp.54–58. Watson, P. et al., 2005. Acute dopamine/noradrenaline reuptake inhibition enhances human exercise performance
in warm, but not temperate conditions. The Journal of Physiology, 565(Pt 3), pp.873–83. Webb, P., 1986. Afterdrop of body temperature during rewarming: an alternative explanation. Journal of Applied
Physiology, 60(2), pp.385–390. Wegelin, J.A. & Hoffman, M.D., 2011. Variables associated with odds of finishing and finish time in a 161-km
ultramarathon. European Journal of Applied Physiology, 111(1), pp.145–53. Wegmann, M. et al., 2012. Pre-Cooling and Sports Performance. Sports Medicine, 42(7), pp.545–564. Weir, J., 2005. Quantifying test-retest reliability using the intraclass correlation coefficient and the SEM. The Journal
of Strength & Conditioning Research, 19(1), pp.231–240. Weltman, A. et al., 1992. Exercise training at and above the lactate threshold in previously untrained women.
International Journal of Sports Medicine, 13(3), pp.257–63. Weltman, A. et al., 1990. Reliability and validity of a continuous incremental treadmill protocol for the determination
of lactate threshold, fixed blood lactate concentrations, and VO2max. International Journal of Sports Medicine, 11(1), pp.26–32.
Wendt, D., van Loon, L.J. & Lichtenbelt, W., 2007. Thermoregulation during exercise in the heat: strategies for maintaining health and performance. Sports Medicine, 37(8), pp.669–82.
Wenger, C.B., 1972. Heat of evaporation of sweat: thermodynamic considerations. Journal of Applied Physiology, 32(4), pp.456–459.
Wenzel, C. & Piekarsky, H.G., 1984. Klima und Arbeit, Munich. Williams, C.G. et al., 1962. Circulatory and metabolic reactions to work in heat. Journal of Applied Physiology, 17(4),
pp.625–638. Williams, K.R. & Cavanagh, P.R., 1987. Relationship between distance running mechanics, running economy, and
performance. Journal of Applied Physiology, 63(3), pp.1236–45. Willmott, A.G.B. et al., 2016. The effects of single versus twice daily short term heat acclimation on heat strain and
3000m running performance in hot, humid conditions. Journal of Thermal Biology, 56, pp.59–67. Willmott, A.G.B. et al., 2015. The reliability of a heat acclimation state test prescribed from metabolic heat
production intensities. Journal of Thermal Biology, 53, pp.38–45. Wilson, T.E. et al., 2009. Effect of thermal stress on Frank-Starling relations in humans. The Journal of Physiology,
587(Pt 13), pp.3383–92. Winget, C., 1985. Circadian rhythms and athletic performance. Medicine & Science in Sports & Exercise in Sports &
Exercise, 17(5), pp.498–516. Wingo, J.E. et al., 2005. Cardiovascular Drift Is Related to Reduced Maximal Oxygen Uptake during Heat Stress.
Medicine & Science in Sports & Exercise, 37(2), pp.248–255. Winter, E.M. & Fowler, N.E., 2009. Exercise defined and quantified according to the Systeme International d’Unites.
Journal of Sports Sciences, 27(5), pp.447–460. Wyndham, C.H. et al., 1954. A new method of acclimatization to heat. Arbeitsphysiologie, 15(5), pp.373–382. Yaglou, C.P. & Minard, D., 1957. Control of heat casualties at military training centers. AMA Archives of Industrial
Health, 16(4), pp.302–305. Yamazaki, F. & Hamasaki, K., 2003. Heat acclimation increases skin vasodilation and sweating but not cardiac

267
baroreflex responses in heat-stressed humans. Journal of Applied Physiology, 95(4), pp.1567–1574. Yeh, M.P. et al., 1983. “Anaerobic threshold”: problems of determination and validation. Journal of Applied
Physiology: Respiratory, Environmental and Exercise Physiology, 55(4), pp.1178–86. Yellin, E.L., Nikolic, S. & Frater, R.W., 1990. Left ventricular filling dynamics and diastolic function. Progress in
cardiovascular diseases, 32(4), pp.247–71. Yoshida, T. et al., 1993. Physiological characteristics related to endurance running performance in female distance
runners. Journal of Sports Sciences, 11(1), pp.57–62. Young, A.J., 2011. Homeostatic Responses to Prolonged Cold Exposure: Human Cold Acclimatization. Comprehensive
Physiology, Supplement. Young, A.J. et al., 1993. Role of thermal factors on aerobic capacity improvements with endurance training. Journal
of Applied Physiology, 75(1), pp.49–54. Zaproudina, N. et al., 2008. Reproducibility of infrared thermography measurements in healthy individuals.
Physiological Measurement, 29(4), pp.515–24.

268
Appendix 1 – informed consent form
SCHOOL OF SPORT AND SERVICE MANAGEMENT
INFORMED CONSENT FORM Project Title (example)
The effect of acute, chronic and combined strategies on endurance
running performance in hot and humid conditions.
DECLARATION
I ……………………………………………………… hereby volunteer to take part in this research,
which is to investigate ischemic preconditioning during a running protocol.
The principal investigator has explained to my satisfaction the purpose of the experiment and the
possible risks involved.
I have had the principles and the procedure explained to me and I have also read the participant
information sheet. I understand the principles and procedures fully.
I am aware that I will be required to:
Exercise to volitional exhaustion during each visit. Exercise in a hot and humid environment Have my core temperature measured using a rectal thermometer Provide fingertip blood samples on each occasion.
I understand how the data collected will be used, and that any confidential information will be seen
only by the researchers and will not be revealed to anyone else.
I understand that I am free to withdraw from the investigation at any time and that I am under no
obligation to give reasons for withdrawal or to attend again for experimentation.
I agree that should I withdraw from the study, the data collected up to that point might be used by
the researcher for the purposes described in the information sheet.
I understand that the results of the study can be made known to me.
Furthermore, if I am a student, I am aware that taking part, or not taking part in this experiment,
will neither be detrimental to, nor further my position as a student.
I undertake to obey the laboratory/study regulations and the instructions of the investigators
regarding safety, participant only to my right to withdraw declared above.
Signature of participant: ......................................................... Date:
...............................
Signature of Investigator: .................................................... Date:
...............................

Appendix 2 – medical questionnaire
SCHOOL OF SPORT AND SERVICE MANAGEMENT MEDICAL QUESTIONNAIRE
Name: ........................................................................................... Age: .............................. Are you in good health ? Yes/No If no, please explain: How would you describe your present level of activity? Vigorous: < once per month once per month 2-3 times per week 4-5 times per week > 5 times per week Have you suffered from a serious illness or accident ? Yes/No If yes, please give particulars: Do you suffer, or have you ever suffered from: Asthma Yes No Diabetes Yes No Bronchitis Yes No Epilepsy /Convulsion/Seizure Yes No High blood pressure Yes No
Fainting/Syncope Yes No Are you currently taking medication ? Yes/No If yes, please give particulars: Have you taken a long-haul flight in previous 2 weeks? Yes/No Are you currently attending your GP for any condition or have you consulted your doctor in the last three months? Yes/No If yes, please give particulars: Have you, or are you presently taking part in any other Yes/No laboratory experiment ? PLEASE READ THE FOLLOWING CAREFULLY Persons will be considered unfit to participate in the study if they: are unsure of the test protocol and the possible risks and discomforts designated on the subj
ect information sheet; the answers given on the medical questionnaire or informed consent form do not meet the re
quired criteria; do not complete running training at least 3 times per week or are unable to attain 5 km within
22 minutes; are pregnant; have any medically inserted plates or pins, including pace makers, aneurysm clip, heart/vasc
ular clip, prosthetic valve, or intracranial metal prosthesis; have suspended training due to joint or muscle injury; have been verified, or documented as having any blood carried infections (Hepatitis, HIV), ar
e diabetic or obese (Body Mass Index>30), have a known history of haematological, cardiac, respiratory, or renal disease; or had a head injury, brain infection (meningitis) or brain tumour;
have a known history of severe headaches, fainting, dizziness, heat stroke or other heat induced illness;
have symptoms of nausea or light-headedness to needles, probes or other medical-type equipment;
have known anal problems such haemorrhoids, fissures and anal bleeding DECLARATION I …………………………………………………… hereby volunteer to be a participant in experiments/investigations during the period commencing February 2015. My replies to the above questions are correct to the best of my belief and I understand that they will be treated with the strictest confidence. The experimenter has fully informed me of, and I have understood, the purpose of the experiment and possible risks involved. I understand that I may withdraw from the experiment at any time and that I am under no obliga

tion to give reasons for withdrawal or to attend again for experimentation. I undertake to obey the laboratory/study regulations and the instructions of the experimenter regarding safety, subject only to my right to withdraw declared above. Signature of Subject …………………………………………………….. Date……………
Signature of Experimenter …………………………………………….. Date ………….