James L. Anderson Advisor for Oceans, Fisheries and Aquaculture Lead of the Global Program for...
26
Fish to 2030 and Some Other Perspectives James L. Anderson Advisor for Oceans, Fisheries and Aquaculture Lead of the Global Program for Fisheries The World Bank Seafood Investor Forum May 20, 2014 Roosevelt Hotel, New York, NY
-
Upload
arlene-stokes -
Category
Documents
-
view
215 -
download
2
Transcript of James L. Anderson Advisor for Oceans, Fisheries and Aquaculture Lead of the Global Program for...

Fish to 2030 and Some Other Perspectives
James L. Anderson Advisor for Oceans, Fisheries and AquacultureLead of the Global Program for FisheriesThe World Bank
Seafood Investor ForumMay 20, 2014Roosevelt Hotel, New York, NY

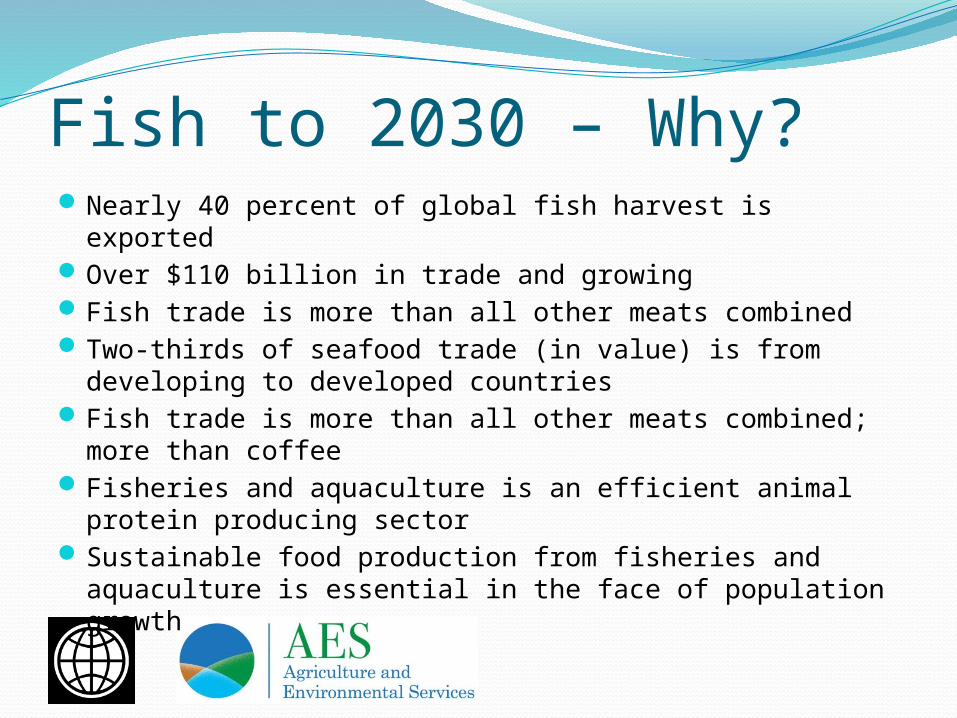
Fish to 2030 – Why?Nearly 40 percent of global fish harvest is exportedOver $110 billion in trade and growingFish trade is more than all other meats combinedTwo-thirds of seafood trade (in value) is from developing to
developed countriesFish trade is more than all other meats combined; more
than coffeeFisheries and aquaculture is an efficient animal protein
producing sectorSustainable food production from fisheries and aquaculture
is essential in the face of population growth


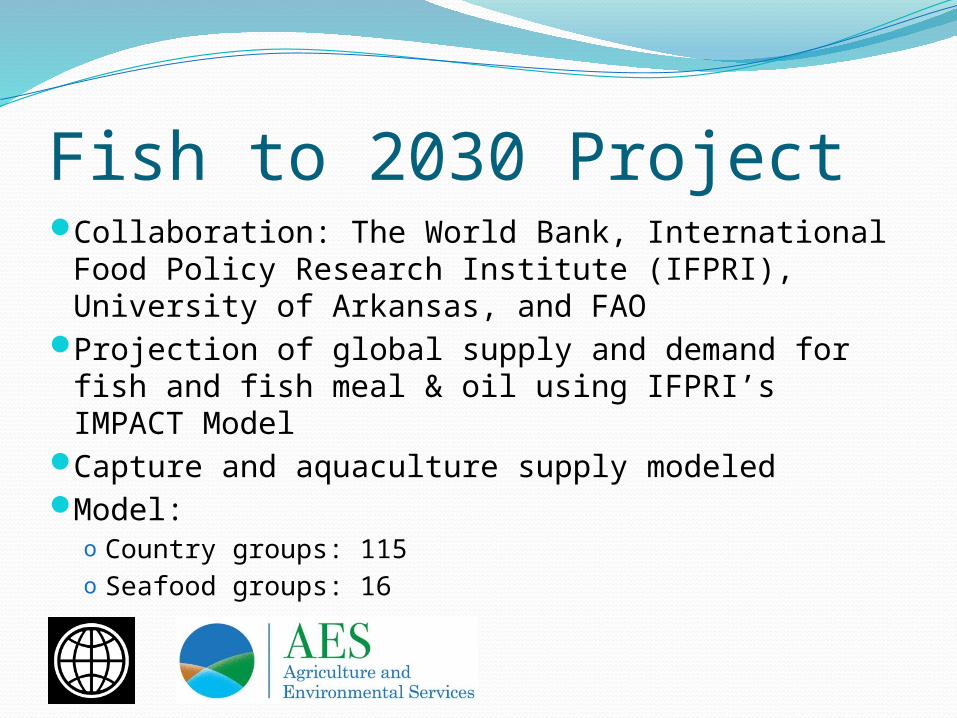
Fish to 2030 ProjectCollaboration: The World Bank, International Food
Policy Research Institute (IFPRI), University of Arkansas, and FAO
Projection of global supply and demand for fish and fish meal & oil using IFPRI’s IMPACT Model
Capture and aquaculture supply modeledModel:
o Country groups: 115o Seafood groups: 16

Hundreds of species traded – more than 30 shrimp species alone
It is Dynamic: Aquaculture –new technologies, new species,
new playersDemand is shiftingLarge emerging consumers – ChinaGovernance of capture fisheries is weak and
uncertainData are poor!!!
Fish sector is dynamic and complex(Modeling is challenging)

0
20
40
60
80
100
120
140
160
180
200
1984
1987
1990
1993
1996
1999
2002
2005
2008
2011
2014
2017
2020
2023
2026
2029
Mill
ion
MT Total (Data)
Total (Model)
Capture (Data)
Capture (Model)
Aquaculture (Data)
Aquaculture (Model)
Global fish production:Data and projections (1984-2030)

Projected Total Fish Supply
90.463.6
2011 (Data)
Capture Aquaculture
Total Harvest154.0 Million Tons
93.4 95.7
2030 (Model)
Capture Aquaculture
Total Harvest189.1 Million
Tons


Aquaculture Growth2030 (Model)
• Approx. 50% of total harvest• Approx. 62% of fish of human seafood
consumption• Aquaculture 2010-2030 – 62% in 20 yrs• Total supply (capture + aquaculture) 2010-
2030 – 24% in 20 yrs
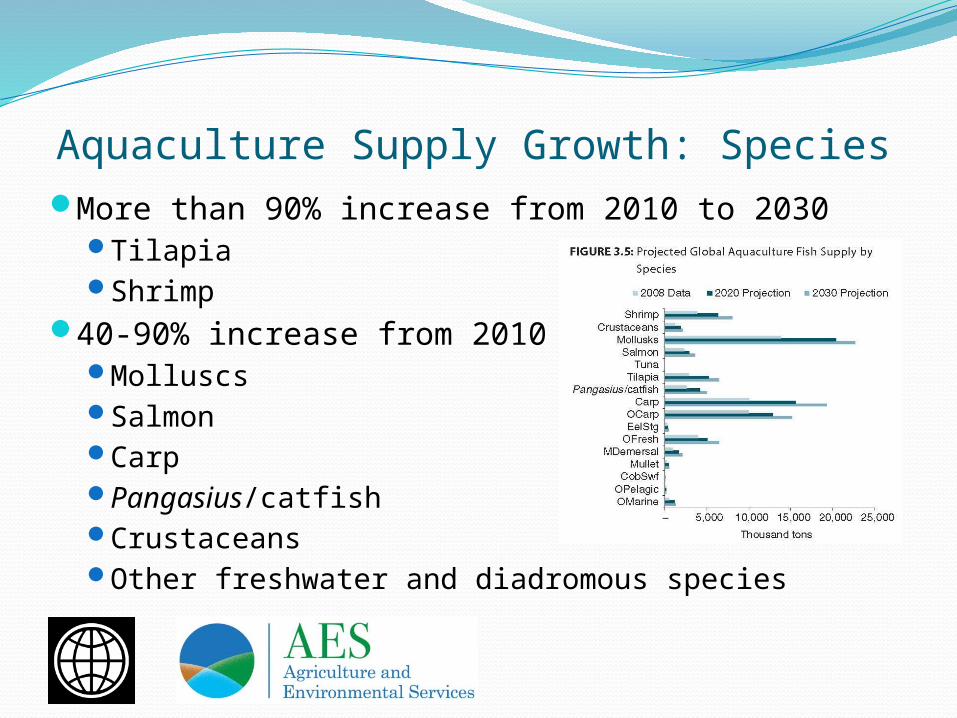
Aquaculture Supply Growth: SpeciesMore than 90% increase from 2010 to 2030
TilapiaShrimp
40-90% increase from 2010 to 2030MolluscsSalmonCarpPangasius/catfish CrustaceansOther freshwater and diadromous species
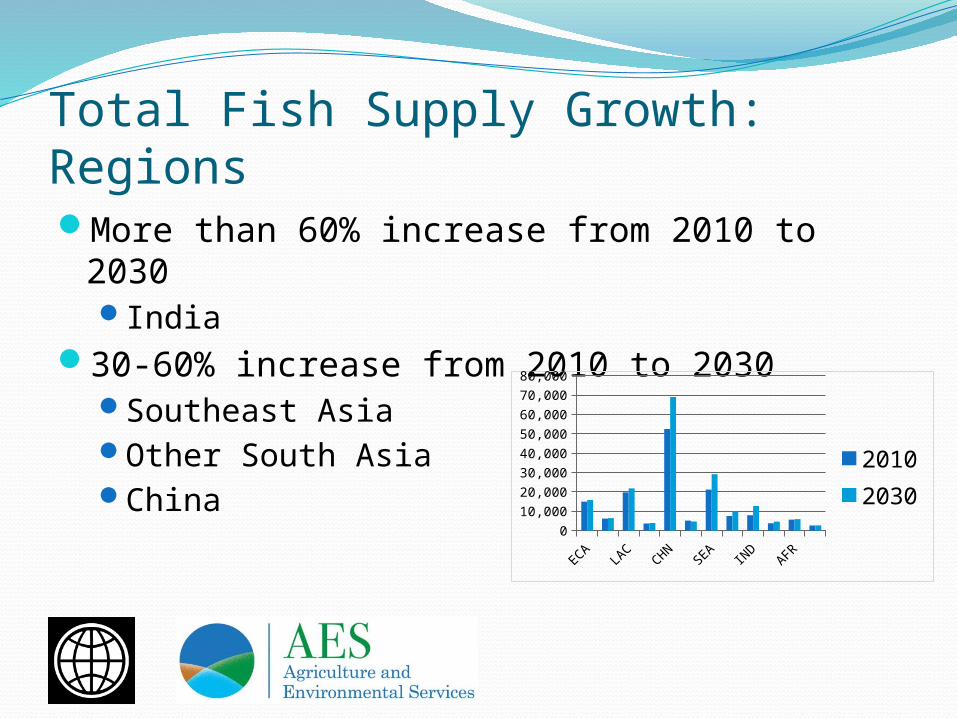
Total Fish Supply Growth: RegionsMore than 60% increase from 2010 to 2030
India30-60% increase from 2010 to 2030
Southeast AsiaOther South AsiaChina
ECALAC
CHNSEA
IND
AFR
0
10,000
20,000
30,000
40,000
50,000
60,000
70,000
80,000
20102030
Aquaculture Supply Growth: RegionsMore than 100% increase from 2010 to 2030
IndiaLatin America and CaribbeanSoutheast Asia
50-100% increase from 2010 to 2030South Asia (excl. India)Middle East and North AfricaSub-Saharan Africa
Less than 50% increase from 2010 to 2030Everywhere else

Consumption Growth: RegionsMore than 50% increase from 2010 to 2030
South Asia (excl. India)30-50% increase from 2010 to 2030
IndiaSoutheast AsiaNorth AmericaMiddle East and North AfricaChinaSub-Saharan Africa
Decline from 2010 to 2030Japan
0102030405060
20102030
Key Conclusions from 2030 studyExpectations for 2030:1. Aquaculture will produce 2/3 of food fish2. China will consume nearly 40% of seafood3. Production of tilapia, shrimp, will nearly
double from 2010 to 20304. Largest tonnage gains will be in mollusks,
carps 5. Aquaculture will grow fastest in India, Latin
America, and Southeast Asia
Some Additional Perspectives

China: International Seafood Trade (1984-2011)
0
500
1,000
1,500
2,000
2,500
3,000
3,500
4,000
4,500
Export QuantityImport Quantity
(Th
ou
san
d m
etr
ic t
on
s)
China: #1 Seafood Exporter #1 Seafood ImporterSource: FishStat, FAO 2014
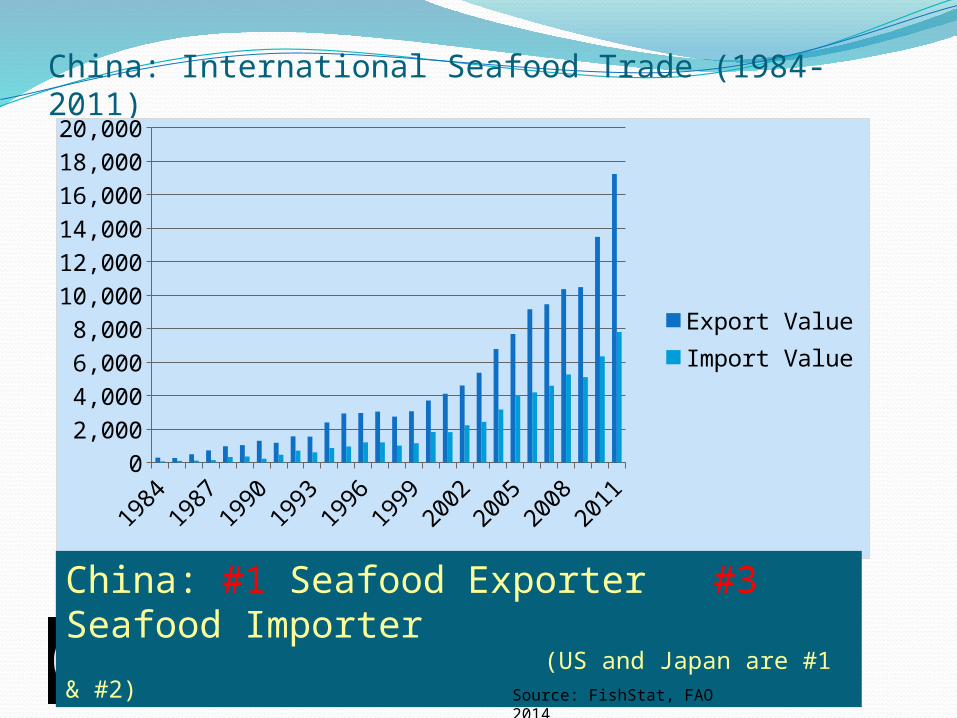
China: International Seafood Trade (1984-2011)
1984
1987
1990
1993
1996
1999
2002
2005
2008
2011
02,0004,0006,0008,000
10,00012,00014,00016,00018,00020,000
Export ValueImport Value
China: #1 Seafood Exporter #3 Seafood Importer(US and Japan are #1 & #2)
Source: FishStat, FAO 2014

China – Things to considerIs their economic growth sustainable?
The corruption crack down and high value seafood demand
Food Safety
Aquaculture
Big Risk…..DISEASE …ISA salmon… EMS shrimp
Systems? Species? Where?... Low cost producers generally win ... Unless create market niches are created, like varietal wines

US Seafood Consumption Continues to Concentrate
in Fewer Species and Per Capita Consumption is Declining
Edible kg per Capita 1987 2010 % change
1 Tuna 1.59 Shrimp 1.72 66 2 Shrimp 1.04 Tuna 1.09 -32 3 Cod 0.76 Salmon 0.92 358 4 AK Pollock 0.40 Tilapia 0.67 NA 5 Flatfish 0.33 Catfish/Pangasius 0.56 106 6 Clams 0.30 AK Pollock 0.53 32 7 Catfish 0.27 Crab 0.24 58 8 Salmon 0.20 Cod 0.24 -69 9 Crab 0.15 Clams 0.16 -48
10 Scallops 0.15 Other 2.16 Other 0.51 -61 Total 7.35 Total 6.62 -10
Source: NFI (2013).
71% 92%
56% 75%
Fisheries Reform
Great investment opportunity to stop losses, cut waste and innovate in marketing
BUT .... There to be the creation of new ways to make monetize natural fisheries assets ... Blue bonds?, public private partnership?, creating new markets – futures? options?... We need create thinking.

Thank [email protected]
http://documents.worldbank.org/curated/en/2013/12/18882045/fish-2030-prospects-fisheries-aquaculture