JAMES HARDIE’S USA INVESTOR/ANALYST TOUR For personal … · 0.2 0.1 0.7 0.3 FY10 Nameplate FY13...
49
JAMES HARDIE’S USA INVESTOR/ANALYST TOUR 14 th & 15 th SEPTEMBER 2017 DAY 1 PRESENTATIONS For personal use only
Transcript of JAMES HARDIE’S USA INVESTOR/ANALYST TOUR For personal … · 0.2 0.1 0.7 0.3 FY10 Nameplate FY13...

JAMES HARDIE’S USA INVESTOR/ANALYST TOUR14th & 15th SEPTEMBER 2017DAY 1 PRESENTATIONS
For
per
sona
l use
onl
y

PAGE
CAUTIONARY NOTE ON FORWARD-LOOKING STATEMENTS
This Management Presentation contains forward-looking statements. James Hardie Industries plc (the “Company”) may from time to time make forward-looking statements in itsperiodic reports filed with or furnished to the Securities and Exchange Commission, on Forms 20-F and 6-K, in its annual reports to shareholders, in offering circulars, invitationmemoranda and prospectuses, in media releases and other written materials and in oral statements made by the Company’s officers, directors or employees to analysts, institutionalinvestors, existing and potential lenders, representatives of the media and others. Statements that are not historical facts are forward-looking statements and such forward-lookingstatements are statements made pursuant to the Safe Harbor Provisions of the Private Securities Litigation Reform Act of 1995.
Examples of forward-looking statements include:
• statements about the Company’s future performance;• projections of the Company’s results of operations or financial condition;• statements regarding the Company’s plans, objectives or goals, including those relating to strategies, initiatives, competition, acquisitions, dispositions and/or its products;• expectations concerning the costs associated with the suspension or closure of operations at any of the Company’s plants and future plans with respect to any such plants;• expectations concerning the costs associated with the significant capital expenditure projects at any of the Company’s plants and future plans with respect to any such projects;• expectations regarding the extension or renewal of the Company’s credit facilities including changes to terms, covenants or ratios;• expectations concerning dividend payments and share buy-backs;• statements concerning the Company’s corporate and tax domiciles and structures and potential changes to them, including potential tax charges;• statements regarding tax liabilities and related audits, reviews and proceedings;• statements regarding the possible consequences and/or potential outcome of legal proceedings brought against us and the potential liabilities, if any, associated with such
proceedings;• expectations about the timing and amount of contributions to Asbestos Injuries Compensation Fund (AICF), a special purpose fund for the compensation of proven Australian
asbestos-related personal injury and death claims;• expectations concerning the adequacy of the Company’s warranty provisions and estimates for future warranty-related costs;• statements regarding the Company’s ability to manage legal and regulatory matters (including but not limited to product liability, environmental, intellectual property and
competition law matters) and to resolve any such pending legal and regulatory matters within current estimates and in anticipation of certain third-party recoveries; and• statements about economic conditions, such as changes in the US economic or housing recovery or changes in the market conditions in the Asia Pacific region, the levels of
new home construction and home renovations, unemployment levels, changes in consumer income, changes or stability in housing values, the availability of mortgages andother financing, mortgage and other interest rates, housing affordability and supply, the levels of foreclosures and home resales, currency exchange rates, and builder andconsumer confidence.
2
For
per
sona
l use
onl
y

PAGE
CAUTIONARY NOTE ON FORWARD-LOOKING STATEMENTS (continued)
Words such as “believe,” “anticipate,” “plan,” “expect,” “intend,” “target,” “estimate,” “project,” “predict,” “forecast,” “guideline,” “aim,” “will,” “should,” “likely,” “continue,” “may,”“objective,” “outlook” and similar expressions are intended to identify forward-looking statements but are not the exclusive means of identifying such statements. Readers arecautioned not to place undue reliance on these forward-looking statements and all such forward-looking statements are qualified in their entirety by reference to the followingcautionary statements.
Forward-looking statements are based on the Company’s current expectations, estimates and assumptions and because forward-looking statements address future results, eventsand conditions, they, by their very nature, involve inherent risks and uncertainties, many of which are unforeseeable and beyond the Company’s control. Such known and unknownrisks, uncertainties and other factors may cause actual results, performance or other achievements to differ materially from the anticipated results, performance or achievementsexpressed, projected or implied by these forward-looking statements. These factors, some of which are discussed under “Risk Factors” in Section 3 of the Form 20-F filed with theSecurities and Exchange Commission on 18 May 2017, include, but are not limited to: all matters relating to or arising out of the prior manufacture of products that containedasbestos by current and former Company subsidiaries; required contributions to AICF, any shortfall in AICF and the effect of currency exchange rate movements on the amountrecorded in the Company’s financial statements as an asbestos liability; the continuation or termination of the governmental loan facility to AICF; compliance with and changes in taxlaws and treatments; competition and product pricing in the markets in which the Company operates; the consequences of product failures or defects; exposure to environmental,asbestos, putative consumer class action or other legal proceedings; general economic and market conditions; the supply and cost of raw materials; possible increases in competitionand the potential that competitors could copy the Company’s products; reliance on a small number of customers; a customer’s inability to pay; compliance with and changes inenvironmental and health and safety laws; risks of conducting business internationally; compliance with and changes in laws and regulations; currency exchange risks; dependenceon customer preference and the concentration of the Company’s customer base on large format retail customers, distributors and dealers; dependence on residential and commercialconstruction markets; the effect of adverse changes in climate or weather patterns; possible inability to renew credit facilities on terms favorable to the Company, or at all; acquisitionor sale of businesses and business segments; changes in the Company’s key management personnel; inherent limitations on internal controls; use of accounting estimates; and allother risks identified in the Company’s reports filed with Australian, Irish and US securities regulatory agencies and exchanges (as appropriate). The Company cautions you that theforegoing list of factors is not exhaustive and that other risks and uncertainties may cause actual results to differ materially from those referenced in the Company’s forward-lookingstatements. Forward-looking statements speak only as of the date they are made and are statements of the Company’s current expectations concerning future results, events andconditions. The Company assumes no obligation to update any forward-looking statements or information except as required by law.
3
For
per
sona
l use
onl
y

PAGE
USE OF NON-GAAP FINANCIAL INFORMATION; AUSTRALIAN EQUIVALENT TERMINOLOGY
This Management Presentation includes financial measures that are not considered a measure of financial performance under generally accepted accounting principles in the UnitedStates (US GAAP). These financial measures are designed to provide investors with an alternative method for assessing our performance from on-going operations, capital efficiencyand profit generation. Management uses these financial measures for the same purposes. These financial measures include:
• Adjusted EBIT;• Adjusted EBIT margin;• Adjusted net operating profit;• Adjusted diluted earnings per share;• Adjusted operating profit before income taxes;• Adjusted income tax expense;• Adjusted effective tax rate;• Adjusted EBITDA;• Adjusted EBITDA excluding Asbestos; and• Adjusted selling, general and administrative expenses (“Adjusted SG&A”)
These financial measures are or may be non-US GAAP financial measures as defined in the rules of the U.S. Securities and Exchange Commission and may exclude or includeamounts that are included or excluded, as applicable, in the calculation of the most directly comparable financial measures calculated in accordance with US GAAP. These non-GAAP financial measures should not be considered to be more meaningful than the equivalent US GAAP measure. Management has included such measures to provide investorswith an alternative method for assessing its operating results in a manner that is focused on the performance of its ongoing operations and excludes the impact of certain legacyitems, such as asbestos adjustments. Additionally, management uses such non-GAAP financial measures for the same purposes. However, these non-GAAP financial measures arenot prepared in accordance with US GAAP, may not be reported by all of the Company’s competitors and may not be directly comparable to similarly titled measures of theCompany’s competitors due to potential differences in the exact method of calculation. This Management Presentation also includes financial measures and descriptions that areconsidered to not be in accordance with US GAAP, but which are consistent with financial measures reported by Australian companies, such as operating profit, EBIT and EBITmargin. Since the Company prepares its Consolidated Financial Statements in accordance with US GAAP, the Company provides investors with a table and definitions presentingcross-references between each US GAAP financial measure used in the Company’s Condensed Consolidated Financial Statements to the equivalent non-US GAAP financialmeasure used in this Management Presentation.
For additional information regarding the non-GAAP financial measures presented in this Management Presentation , including a reconciliation of each non-GAAP financial measure tothe equivalent US GAAP measure, see the see the sections titled “Definition and Other Terms” and “Non-US GAAP Financial Measures” included in James Hardie’s Management’sAnalysis of Results for the fourth quarter and twelve months ended 31 March 2017.
4
For
per
sona
l use
onl
y

JAMES HARDIE INVESTOR UPDATELouis Gries
For
per
sona
l use
onl
y

PAGE 2
AGENDA
• NA FC Organic Growth Strategy & Returns
• Beyond FC in North America
• Organization Capability to Deliver
For
per
sona
l use
onl
y

PAGE 3
SHARE GROWTH IN NORTH AMERICA
Growth Above Market Index
Primary Demand Growth
(PDG)
Growth against Vinyl, Stucco
and Brick
Hard Siding Alternatives
Growth against Natural Wood
Defend against lower value substitutes:
OSB, Hardboard, CFCF
or p
erso
nal u
se o
nly

PAGE 4
HOMEOWNER VALUE PROPOSITION
• Curb, porch & deck appeal
• Fire & abuse
• Low maintenance
• Affordable
For
per
sona
l use
onl
y

PAGE 5
MARKET DEVELOPMENT TO CONVERT VINYL
New Construction- Geography- Category of home- Builder profile- Better home ↔ Better builder ↔ Better development
Segment / Target / Position Basics
Repair & Remodel- Geography- Neighborhoods- Value proposition direct to home owner
For
per
sona
l use
onl
y

PAGE 6
DEFEND AGAINST LOWER VALUE SUBSTITUTES
Homeowner Value Proposition- Engineered for climate durability- Lower maintenance
- Substrate- Surface finish- Full exterior wrap
Keys to defend against discounting- Channel partners- Homeowner awareness- Contractor alignmentF
or p
erso
nal u
se o
nly

PAGE 7
SAFETY AT THE FOREFRONT
Safety culture evolving from 2&10 to Zero Harm
• Standard and sustainable systems
• Establish playbook and train employees
• Zero tolerance for unsafe behaviors
For
per
sona
l use
onl
y

PAGE 8
DRIVE DELIVERED UNIT COST TRENDS
Improving delivered unit cost trend … in a sustainable way
1Q FY18FY17
Delivered Unit Cost
For
per
sona
l use
onl
y

PAGE 9
EXPAND PRODUCT CAPABILITY
Future Capability
Durability
Density
Surface
FinishShapes
Sourcing Alternatives
Engineered for Climate
For
per
sona
l use
onl
y

PAGE 10
2.4
3.7
0.2 0.1
0.70.3
FY10Nameplate
FY13Wax Restart
FY14Fontana Restart
FY17Start Ups
FY18Start Ups
FY18Nameplate
NORTH AMERICA MANUFACTURING CAPACITY
Capacity Expansion Since Housing Downturn
• Fontana 1• Plant City 4• Cleburne 3
Future capacity additions:• FY19 & FY20 greenfield additions: Tacoma (300 mmsf) + Alabama (600 mmsf)
• Fontana 2• Waxahachie 1
• Plant City 3• Summerville 1
For
per
sona
l use
onl
y

PAGE 11
FY19 CAPACITY OUTLOOK
3.7
2.8
Billio
ns o
f Squ
are
Feet
FY19 Capacity
For
per
sona
l use
onl
y

BEYOND CURRENT NORTH AMERICAORGANIC GROWTH STRATEGY
For
per
sona
l use
onl
y

PAGE 13
INTERNATIONAL
• Steady share gains in APAC
• Reset game plan in Europe
• Further expansion with GDP per capita bias
For
per
sona
l use
onl
y

PAGE 14
NON-FIBER CEMENT IN NORTH AMERICA
Capabilities
Assets
Differentiated Product or Business Model
Target Building Materials
Organic Growth Potential with Defendable Moats
Leverage James Hardie
Growth Segments
Searching Across
Close Adjacencies
Large Market Size
Continue to explore options in North America where we have a strong presence to leverage in a large market
For
per
sona
l use
onl
y

ORGANIZATIONAL CAPABILITY TO ENABLE
For
per
sona
l use
onl
y

PAGE 16
MANAGEMENT TEAM
Sean GaddEVP, Markets &
Segments22 Years; 13 JH Years
Sean GaddEVP, Markets &
Segments22 Years; 13 JH Years
Jack TruongPresident, International27 Years; <1 JH Years
Jack TruongPresident, International27 Years; <1 JH Years
Matthew MarshCFO and EVP
20 Years; 4 JH Years
Matthew MarshCFO and EVP
20 Years; 4 JH Years
Ryan KilcullenEVP, Operations
14 Years; 10 JH Years
Ryan KilcullenEVP, Operations
14 Years; 10 JH Years
Louis GriesCEO
39 Years; 26 JH Years
Louis GriesCEO
39 Years; 26 JH Years
Zean NielsenEVP, NA Sales &
Marketing20 Years; <1 JH Years
Zean NielsenEVP, NA Sales &
Marketing20 Years; <1 JH Years
Kirk WilliamsCHRO
18 Years; <1 JH Years
Kirk WilliamsCHRO
18 Years; <1 JH Years
EVP, ManufacturingOpen
EVP, ManufacturingOpen
Chief Technology OfficerOpen
Chief Technology OfficerOpen
For
per
sona
l use
onl
y

FY17/18 SUPPLY ISSUES & RAMIFICATIONS
For
per
sona
l use
onl
y

PAGE 18
SUPPLY ISSUES & RAMIFICATIONS
• Focus has shifted to building on traction in manufacturing now that demand / supply equation has returned to balance
• Recapturing lost ground in the market … significant effort is required
• Improving delivered unit cost trend with network stabilization
For
per
sona
l use
onl
y

PAGE 19
KEY MESSAGES
• Zero Harm safety commitment
• Manufacturing reset
• Regain market traction lost during supply shortage period
• International growth
• Non-FC opportunity scans
• Management team build
• Broad-based organizational capability build
For
per
sona
l use
onl
y

EXTERNAL ENVIRONMENT & BUSINESS FUNDAMENTALSMatthew Marsh, EVP & CFO
For
per
sona
l use
onl
y

PAGE 2
AGENDA
• U.S. Economic Conditions
• Housing Environment
• North America Capacity
For
per
sona
l use
onl
y

PAGE 3
KEY ECONOMIC INDICATORS STABLE
GDP Growth
Source: Bureau of Economic Analysis
S&P Index
Source: Yahoo! Finance
GDP remains 2-3%. Market strong.For
per
sona
l use
onl
y

PAGE 4
KEY ECONOMIC INDICATORS STABLE
Crude OilUSD$/Barrel
Consumer Confidence Index
Source: World Bank
Oil prices stable. Continued strength in consumer confidence.
Source: OECD
For
per
sona
l use
onl
y

PAGE 5
KEY ECONOMIC INDICATORS STABLE
U.S. Unemployment Rate Average Hourly Wage
Source: Bureau of Labor Statistics Source: Bureau of Labor Statistics
U.S. returned to near full employment. Wage growth in line with inflation. For
per
sona
l use
onl
y

PAGE 6
POLITICAL ENVIRONMENT
( + ) Corporate Tax Reform
↔ Infrastructure Bill
↔ NAFTA
↔ Mortgage Interest Deduction
↔ Healthcare
( ‐ ) Immigration Policy / DACA
For
per
sona
l use
onl
y

PAGE 7
U.S. NATURAL DISASTERS
• Hurricanes Harvey and Irma marked the first time two Atlantic Category 4 hurricanes have made U.S. landfall in the same year.
• Comparatively, Sandy (‘12) and Katrina (‘05) made landfall as Category 3s.
• Hurricane impacted area represents ~15% of JH NA volume.
• Plant City manufacturing operations were halted in anticipation of Hurricane Irma.
For
per
sona
l use
onl
y

PAGE 8
SOLID CONFIDENCE & INVESTMENT IN HOUSING
Residential Fixed Investment as % of GDP
Source: Federal Reserve Economic Data,Federal Reserve Bank of St. Louis
Real Estate Confidence Index
Source: National Association of Realtors, Realtors Confidence Survey, June 2017
2008 2017
For
per
sona
l use
onl
y

PAGE 9
GROWTH OF NEW HOUSING CONTINUES
Housing Permits
Source: U.S. Census Bureau
For
per
sona
l use
onl
y

PAGE 10
GROWTH ACROSS NEW CONSTRUCTION SEGMENTS
Housing Starts by SegmentThousands of Starts
Positive growth in all segments. Single-family continues to outpace multi-family.
Source: U.S. Census Bureau
For
per
sona
l use
onl
y

PAGE 11
DEMAND EXCEEDING SUPPLY
Source: Core Logic Case-Schiller Home Price Index
U.S. Housing Supply# Months Supply
Case-Shiller Home Price Index
Supply remains tight. Prices continue to escalate.
Source: Federal Reserve Economic Data,Federal Reserve Bank of St. Louis
For
per
sona
l use
onl
y

PAGE 12
NEW OCCUPANT POPULATION EXISTS
U.S. Population by Age
Young Adults, 18-34, Living at Home
Source: U.S. Census, American Community Survey Source: U.S. Census
New residence eligible population living at home For
per
sona
l use
onl
y

PAGE 13
AFFORDABILITY REMAINS SIGNIFICANT HEADWIND
Source: Urban Institute, CoreLogic, eMBS, HMDA, SIFMA
Outstanding Credit &Student Loan Debt
Borrower FICO Score at Origination
Student debt continues to rise. Financing eligibility remains elevated.
Source: Federal Reserve Economic Data
For
per
sona
l use
onl
y
PAGE 14
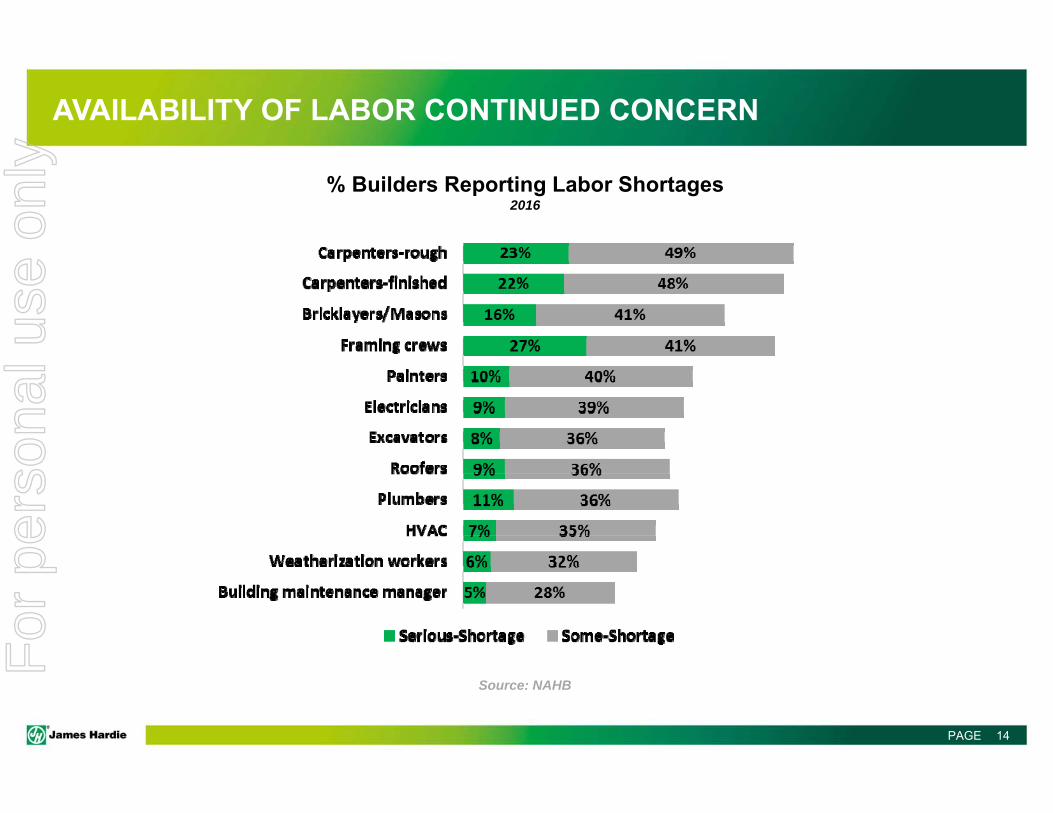
AVAILABILITY OF LABOR CONTINUED CONCERN
Source: NAHB
% Builders Reporting Labor Shortages2016
For
per
sona
l use
onl
y

PAGE 15
REPAIR & REMODEL REMAINS STABLE GROWTH SEGMENT
Source: U.S. Census Bureau, American Housing Survey Source: Hanley Wood
Repair & remodel projects continue to grow at ~5% annually
Average Age = 41 Years
Repair & Remodel Project Growth
Age of Housing Stock
For
per
sona
l use
onl
y

PAGE 16
HISTORIC MARKET SHARE
Present Future100%
JH wins against wood‐look alternativesFor
per
sona
l use
onl
y

PAGE 17
DEMAND TO DETERMINE FUTURE CAPACITY
Future capacity decisions based on:
‐ Geographic demand‐ Location‐ Product mix
‐ Optimal delivered unit cost‐ Materials sourcing‐ Efficient freight
‐ Skilled labor availability
Peru, IL Pulaski, VA
Summerville, SC
Plant City, FL
Prattville, ALWaxahachie, TX
Cleburne, TX
Fontana, CA
Reno, NV
Tacoma, WA
For
per
sona
l use
onl
y

PAGE 18
HISTORIC & FUTURE CAPACITY UTILIZATION
Current gross hours utilization ~94%
FY09 FY11 FY13 FY15 FY17 FY19 FY21
• Protect 20% growth
• 85% utilization trigger
• Capacity adds to keep supply ahead of demand
100%
For
per
sona
l use
onl
y

PAGE 19
TACOMA, WASHINGTON
• Currently under construction
• Expected commissioning Q1 FY19
• Nameplate capacity ‐ 300 mmsqft/year
• Plank, Backer, Heritage, ColorPlus® Technology
• ~130 employees at full production
• Site benefits• Low input cost• Proximity to growing markets
For
per
sona
l use
onl
y

PAGE 20
PRATTVILLE, ALABAMA GREENFIELD
• Anticipate ground breaking Q3 FY18
• Expected commissioning Q1 FY20
• Minimum nameplate capacity – 600 mmsqft/year
• Plan for diverse product capability• Plank, Trim, Backer, Heritage, ColorPlus®
Technology
• ~200 – 275 employees at full production
• Site benefits• Low input cost• Skilled manufacturing workforce• Proximity to growing markets• Rail accessibilityF
or p
erso
nal u
se o
nly

PAGE 21
KEY MESSAGES
• U.S. economy strong
• Housing recovery slow but steady
• Capacity in place to support growth
For
per
sona
l use
onl
y

GROWTH THROUGH INTERNATIONALJack Truong
For
per
sona
l use
onl
y

PAGE 2
INTERNATIONAL BUSINESS IN CONTEXT- FY 2017
2Unless otherwise stated for fiscal years 2011 through to 2017, Adjusted EBIT graphs and editorial comments refer to EBIT that may exclude asbestos, asset impairments, ASIC expenses, non-recurring stamp duty and/or New Zealand weathertightness claims.3Excludes Australian Pipes business sold in the first quarter of fiscal year 2016.
For
per
sona
l use
onl
y

PAGE 3
GROWTH ABOVE MARKET IN APAC & EUROPE
• Continue to focus on gaining share in new home construction and repair & renovation segments
• Expand product portfolio from cladding, linings and ceilings to facades, floors and decking
• Invest in consumer insights, local R&D and manufacturing to better serve our end-use customers
For
per
sona
l use
onl
y

PAGE
EXPANDING OUR FOOTPRINT IN EUROPE AND ASIA
Note: Bubble size: Total GDP (PPP)
Source: Company information, CIA world factbook
Our business has a strong platform in:• USA• Canada• Australia• New Zealand• the Philippines• the UK
Our international growth expansion will be in • Western Europe• China (region specific),• Southeast Asia
4
For
per
sona
l use
onl
y

For
per
sona
l use
onl
y