James C. Enochs High School Accountability Report … School Accountability Report Card for James C....
14
2013-14 School Accountability Report Card for James C. Enochs High Page 1 of 14 James C. Enochs High School Accountability Report Card Reported Using Data from the 2013-14 School Year Published During 2014-15 Every school in California is required by state law to publish a School Accountability Report Card (SARC), by February 1 of each year. The SARC contains information about the condition and performance of each California public school. Under the Local Control Funding Formula (LCFF) all local educational agencies (LEAs) are required to prepare a Local Control Accountability Plan (LCAP), which describes how they intend to meet annual school-specific goals for all pupils, with specific activities to address state and local priorities. Additionally, data reported in an LCAP is to be consistent with data reported in the SARC. • For more information about SARC requirements, see the California Department of Education (CDE) SARC Web page at http://www.cde.ca.gov/ta/ac/sa/. • View this SARC online at the school and/or LEA Web sites. • For more information about the LCFF or LCAP, see the CDE LCFF Web page at http://www.cde.ca.gov/fg/aa/lc/. • For additional information about the school, parents and community members should contact the school principal or the district office. About This School Contact Information (Most Recent Year) School Contact Information School Name------- James C. Enochs High Street------- 3201 Sylvan Ave. City, State, Zip------- Modesto, CA 95355-7893 Phone Number------- (209) 550-3400 Principal------- Mrs. Deborah Rowe E-mail Address------- [email protected] Web Site------- http://mcsold1.monet.k12.ca.us/schools/enochs/default.aspx CDS Code 50711750110593 District Contact Information District Name------- Modesto City Elementary School District Phone Number------- (209) 576-4011 Superintendent------- Pam Able E-mail Address------- [email protected] Web Site------- www.mcs4kids.com
Transcript of James C. Enochs High School Accountability Report … School Accountability Report Card for James C....

2013-14 School Accountability Report Card for James C. Enochs High Page 1 of 14
James C. Enochs High
School Accountability Report Card
Reported Using Data from the 2013-14 School Year
Published During 2014-15
Every school in California is required by state law to publish a School Accountability Report Card (SARC), by February 1 of each year. The SARC contains information about the condition and performance of each California public school. Under the Local Control Funding Formula (LCFF) all local educational agencies (LEAs) are required to prepare a Local Control Accountability Plan (LCAP), which describes how they intend to meet annual school-specific goals for all pupils, with specific activities to address state and local priorities. Additionally, data reported in an LCAP is to be consistent with data reported in the SARC. • For more information about SARC requirements, see the California Department of Education (CDE) SARC Web page at
http://www.cde.ca.gov/ta/ac/sa/. • View this SARC online at the school and/or LEA Web sites. • For more information about the LCFF or LCAP, see the CDE LCFF Web page at http://www.cde.ca.gov/fg/aa/lc/. • For additional information about the school, parents and community members should contact the school principal or the district
office.
About This School Contact Information (Most Recent Year)
School Contact Information
School Name------- James C. Enochs High
Street------- 3201 Sylvan Ave.
City, State, Zip------- Modesto, CA 95355-7893
Phone Number------- (209) 550-3400
Principal------- Mrs. Deborah Rowe
E-mail Address------- [email protected]
Web Site------- http://mcsold1.monet.k12.ca.us/schools/enochs/default.aspx
CDS Code 50711750110593
District Contact Information
District Name------- Modesto City Elementary School District
Phone Number------- (209) 576-4011
Superintendent------- Pam Able
E-mail Address------- [email protected]
Web Site------- www.mcs4kids.com

2013-14 School Accountability Report Card for James C. Enochs High Page 2 of 14
School Description and Mission Statement (Most Recent Year)
James C. Enochs High school is one of seven comprehensive high schools in Modesto City Schools. The remarkable campus was built on an expanse of 70-acres and opened in the fall of 2006. The majority of our 2,500 students in grades 9-12 reside in the northeast section of Modesto, the heart of California’s Central Valley. The diverse city of Modesto has a warm, friendly atmosphere and a large agricultural industry due to the fertile farmland surrounding it. In order to build the capacity of all students to think independently and solve complex problem our educational goal is to provide real world, unpredictable experiences for students within the academic process. Enochs High School students who embrace this goal will graduate from high school, pursue higher education, and become productive citizens. Vision Statement At James C. Enochs High School, we envision a learning community that challenges and nurtures students by fostering a sense of shared mission and engaging them in a rigorous, relevant, standards-based curriculum. Our vision demands that we provide innovative instruction by accomplished practitioners whose commitment to learning and student achievement encourages students to become technologically adept, lifelong learners able to think independently and solve complex problems. Our vision presupposes a community in which academics, athletics, student activities, and the arts contribute to student success. Our vision is rooted in the belief that staff and students alike must embrace the diversity of an increasingly complex world, foster mutual respect, and create a secure environment that supports student success. Expected Schoolwide Learning Results Our students will be:
Educated in a rigorous, relevant, standards-based curriculum
Actively involved in their school and community
Goal-oriented and independent thinkers
Life-long learners and problem solvers
Engaged through technology
Socially responsible. The mascot for James C. Enochs High School is the Eagle, and the motto is Altius Volans, which in Latin means Soaring Higher. Eagles can fly to altitudes of 10,000 feet, and can soar aloft for hours, Eagles have strong vision and remain focused, avoiding all distraction. The Eagle has become the living symbol of freedom, spirit and the pursuit of excellence. Student Enrollment by Grade Level (School Year 2013-14)
Grade Level Number of Students
Grade 9------- 612
Grade 10------- 641
Grade 11------- 605
Grade 12------- 555
Total Enrollment------- 2,413
2013-14 School Accountability Report Card for James C. Enochs High Page 3 of 14
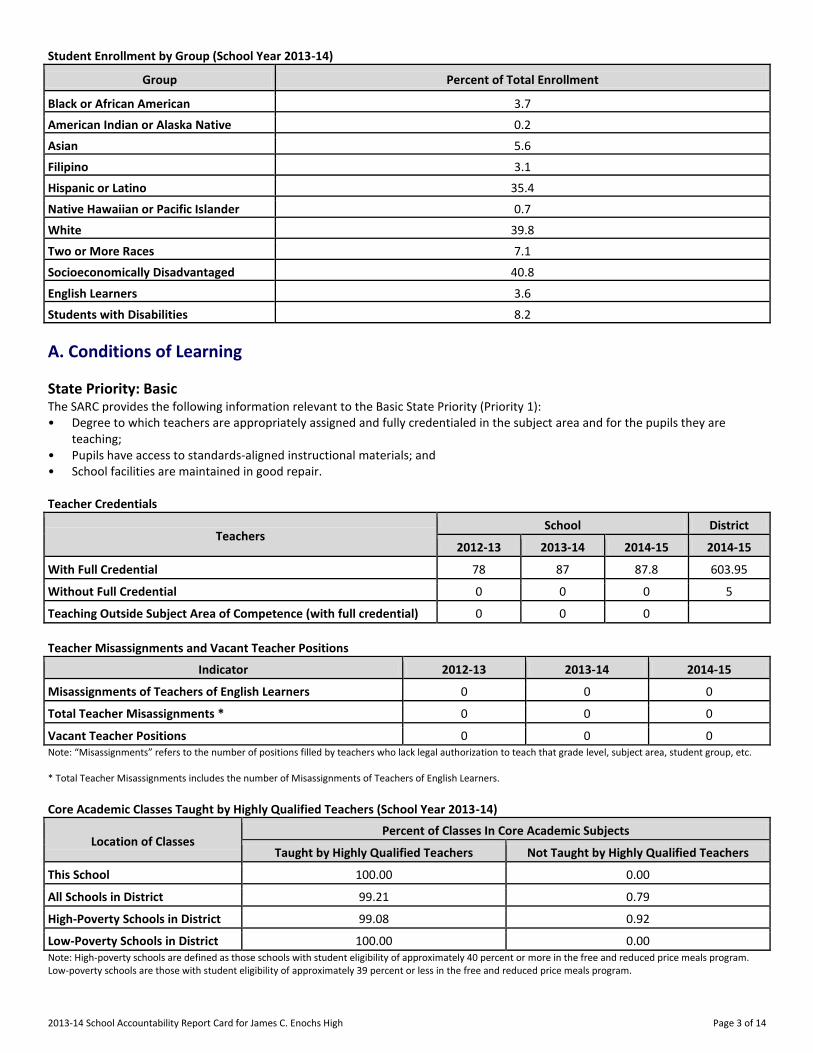
Student Enrollment by Group (School Year 2013-14)
Group Percent of Total Enrollment
Black or African American------- 3.7
American Indian or Alaska Native------- 0.2
Asian------- 5.6
Filipino------- 3.1
Hispanic or Latino------- 35.4
Native Hawaiian or Pacific Islander 0.7
White 39.8
Two or More Races 7.1
Socioeconomically Disadvantaged 40.8
English Learners 3.6
Students with Disabilities 8.2
A. Conditions of Learning
State Priority: Basic The SARC provides the following information relevant to the Basic State Priority (Priority 1): • Degree to which teachers are appropriately assigned and fully credentialed in the subject area and for the pupils they are
teaching; • Pupils have access to standards-aligned instructional materials; and • School facilities are maintained in good repair. Teacher Credentials
Teachers School District
2012-13 2013-14 2014-15 2014-15
With Full Credential 78 87 87.8 603.95
Without Full Credential 0 0 0 5
Teaching Outside Subject Area of Competence (with full credential) 0 0 0
Teacher Misassignments and Vacant Teacher Positions
Indicator 2012-13 2013-14 2014-15
Misassignments of Teachers of English Learners 0 0 0
Total Teacher Misassignments * 0 0 0
Vacant Teacher Positions 0 0 0 Note: “Misassignments” refers to the number of positions filled by teachers who lack legal authorization to teach that grade level, subject area, student group, etc. * Total Teacher Misassignments includes the number of Misassignments of Teachers of English Learners.
Core Academic Classes Taught by Highly Qualified Teachers (School Year 2013-14)
Location of Classes Percent of Classes In Core Academic Subjects
Taught by Highly Qualified Teachers Not Taught by Highly Qualified Teachers
This School 100.00 0.00
All Schools in District 99.21 0.79
High-Poverty Schools in District 99.08 0.92
Low-Poverty Schools in District 100.00 0.00 Note: High-poverty schools are defined as those schools with student eligibility of approximately 40 percent or more in the free and reduced price meals program. Low-poverty schools are those with student eligibility of approximately 39 percent or less in the free and reduced price meals program.
2013-14 School Accountability Report Card for James C. Enochs High Page 4 of 14
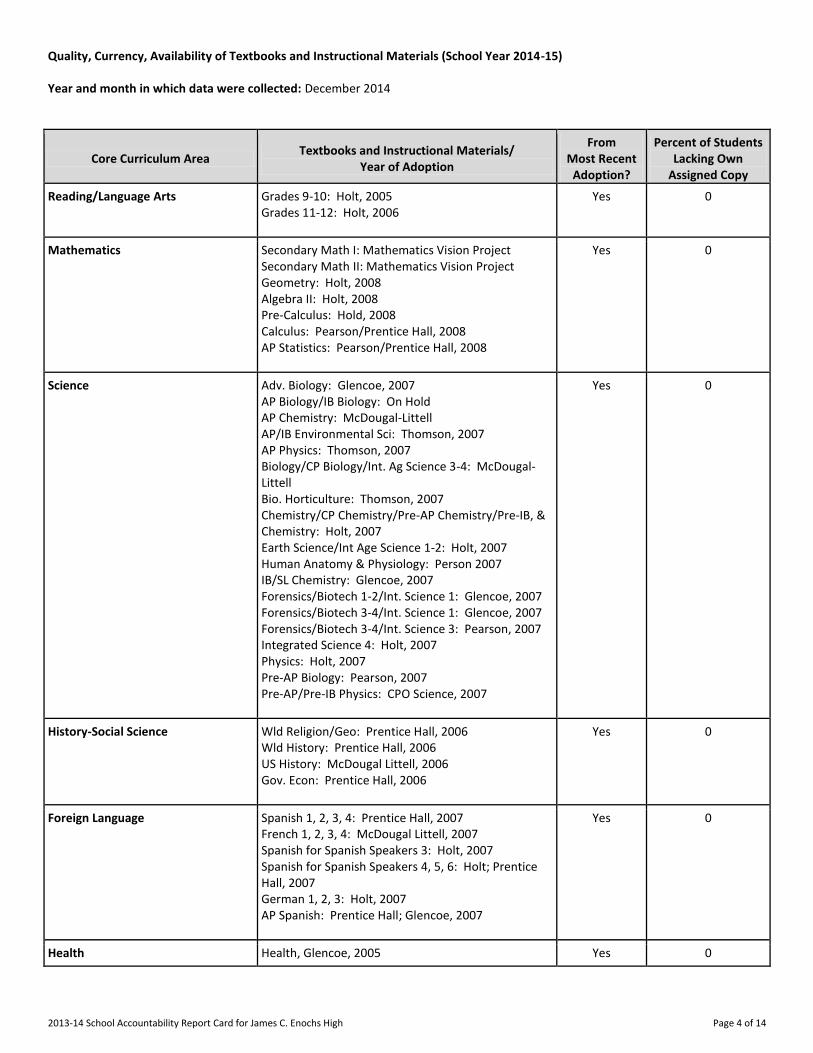
Quality, Currency, Availability of Textbooks and Instructional Materials (School Year 2014-15) Year and month in which data were collected: December 2014
Core Curriculum Area Textbooks and Instructional Materials/
Year of Adoption
From Most Recent
Adoption?
Percent of Students Lacking Own
Assigned Copy
Reading/Language Arts Grades 9-10: Holt, 2005
Grades 11-12: Holt, 2006
Yes 0
Mathematics Secondary Math I: Mathematics Vision Project
Secondary Math II: Mathematics Vision Project
Geometry: Holt, 2008
Algebra II: Holt, 2008
Pre-Calculus: Hold, 2008
Calculus: Pearson/Prentice Hall, 2008
AP Statistics: Pearson/Prentice Hall, 2008
Yes 0
Science------- Adv. Biology: Glencoe, 2007
AP Biology/IB Biology: On Hold
AP Chemistry: McDougal-Littell AP/IB Environmental Sci: Thomson, 2007
AP Physics: Thomson, 2007
Biology/CP Biology/Int. Ag Science 3-4: McDougal-Littell Bio. Horticulture: Thomson, 2007
Chemistry/CP Chemistry/Pre-AP Chemistry/Pre-IB, & Chemistry: Holt, 2007
Earth Science/Int Age Science 1-2: Holt, 2007
Human Anatomy & Physiology: Person 2007
IB/SL Chemistry: Glencoe, 2007
Forensics/Biotech 1-2/Int. Science 1: Glencoe, 2007
Forensics/Biotech 3-4/Int. Science 1: Glencoe, 2007
Forensics/Biotech 3-4/Int. Science 3: Pearson, 2007
Integrated Science 4: Holt, 2007
Physics: Holt, 2007
Pre-AP Biology: Pearson, 2007
Pre-AP/Pre-IB Physics: CPO Science, 2007
Yes 0
History-Social Science Wld Religion/Geo: Prentice Hall, 2006
Wld History: Prentice Hall, 2006
US History: McDougal Littell, 2006
Gov. Econ: Prentice Hall, 2006
Yes 0
Foreign Language Spanish 1, 2, 3, 4: Prentice Hall, 2007
French 1, 2, 3, 4: McDougal Littell, 2007
Spanish for Spanish Speakers 3: Holt, 2007
Spanish for Spanish Speakers 4, 5, 6: Holt; Prentice Hall, 2007
German 1, 2, 3: Holt, 2007
AP Spanish: Prentice Hall; Glencoe, 2007
Yes 0
Health------- Health, Glencoe, 2005 Yes 0
2013-14 School Accountability Report Card for James C. Enochs High Page 5 of 14
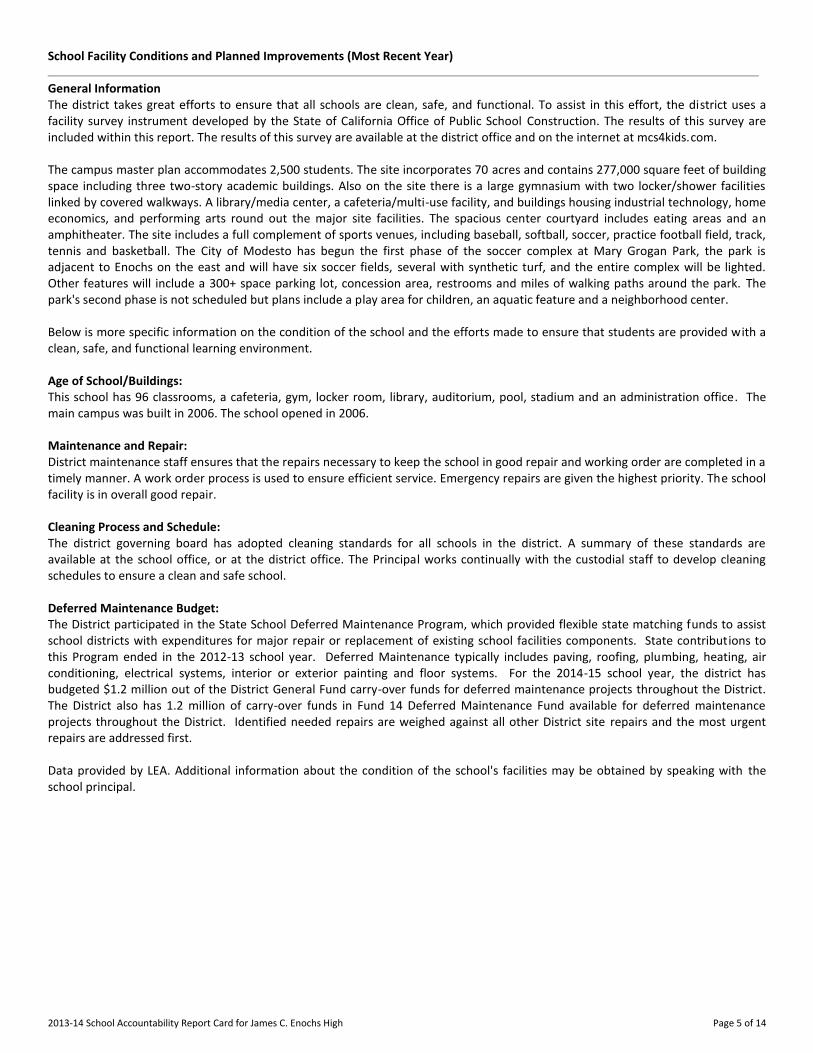
School Facility Conditions and Planned Improvements (Most Recent Year)
General Information The district takes great efforts to ensure that all schools are clean, safe, and functional. To assist in this effort, the district uses a facility survey instrument developed by the State of California Office of Public School Construction. The results of this survey are included within this report. The results of this survey are available at the district office and on the internet at mcs4kids.com. The campus master plan accommodates 2,500 students. The site incorporates 70 acres and contains 277,000 square feet of building space including three two-story academic buildings. Also on the site there is a large gymnasium with two locker/shower facilities linked by covered walkways. A library/media center, a cafeteria/multi-use facility, and buildings housing industrial technology, home economics, and performing arts round out the major site facilities. The spacious center courtyard includes eating areas and an amphitheater. The site includes a full complement of sports venues, including baseball, softball, soccer, practice football field, track, tennis and basketball. The City of Modesto has begun the first phase of the soccer complex at Mary Grogan Park, the park is adjacent to Enochs on the east and will have six soccer fields, several with synthetic turf, and the entire complex will be lighted. Other features will include a 300+ space parking lot, concession area, restrooms and miles of walking paths around the park. The park's second phase is not scheduled but plans include a play area for children, an aquatic feature and a neighborhood center. Below is more specific information on the condition of the school and the efforts made to ensure that students are provided with a clean, safe, and functional learning environment. Age of School/Buildings: This school has 96 classrooms, a cafeteria, gym, locker room, library, auditorium, pool, stadium and an administration office. The main campus was built in 2006. The school opened in 2006. Maintenance and Repair: District maintenance staff ensures that the repairs necessary to keep the school in good repair and working order are completed in a timely manner. A work order process is used to ensure efficient service. Emergency repairs are given the highest priority. The school facility is in overall good repair. Cleaning Process and Schedule: The district governing board has adopted cleaning standards for all schools in the district. A summary of these standards are available at the school office, or at the district office. The Principal works continually with the custodial staff to develop cleaning schedules to ensure a clean and safe school. Deferred Maintenance Budget: The District participated in the State School Deferred Maintenance Program, which provided flexible state matching funds to assist school districts with expenditures for major repair or replacement of existing school facilities components. State contributions to this Program ended in the 2012-13 school year. Deferred Maintenance typically includes paving, roofing, plumbing, heating, air conditioning, electrical systems, interior or exterior painting and floor systems. For the 2014-15 school year, the district has budgeted $1.2 million out of the District General Fund carry-over funds for deferred maintenance projects throughout the District. The District also has 1.2 million of carry-over funds in Fund 14 Deferred Maintenance Fund available for deferred maintenance projects throughout the District. Identified needed repairs are weighed against all other District site repairs and the most urgent repairs are addressed first. Data provided by LEA. Additional information about the condition of the school's facilities may be obtained by speaking with the school principal.

2013-14 School Accountability Report Card for James C. Enochs High Page 6 of 14
School Facility Good Repair Status (Most Recent Year)
School Facility Good Repair Status (Most Recent Year) Year and month in which data were collected: 12/12/2014
System Inspected Repair Status Repair Needed and
Action Taken or Planned Good Fair Poor
Systems: Gas Leaks, Mechanical/HVAC, Sewer
[X] [ ] [ ]
Interior: Interior Surfaces
[X] [ ] [ ]
Cleanliness: Overall Cleanliness, Pest/ Vermin Infestation
[X] [ ] [ ]
Electrical: Electrical
[X] [ ] [ ]
Restrooms/Fountains: Restrooms, Sinks/ Fountains
[X] [ ] [ ]
Safety: Fire Safety, Hazardous Materials
[X] [ ] [ ]
Structural: Structural Damage, Roofs
[X] [ ] [ ]
External: Playground/School Grounds, Windows/ Doors/Gates/Fences
[X] [ ] [ ]
Overall Facility Rating (Most Recent Year)
Overall Rating Exemplary Good Fair Poor
[X] [ ] [ ] [ ]
B. Pupil Outcomes
State Priority: Pupil Achievement The SARC provides the following information relevant to the Pupil Achievement State Priority (Priority 4): • Statewide assessments (i.e., California Assessment of Student Performance and Progress and its successor the Standardized
Testing and Reporting Program); • The Academic Performance Index; and • The percentage of pupils who have successfully completed courses that satisfy the requirements for entrance to the University
of California and the California State University, or career technical education sequences or programs of study. California Assessment of Student Performance and Progress / Standardized Testing and Reporting Results for All Students in Science (Three-Year Comparison)
Subject
Percent of Students Scoring at Proficient or Advanced (meeting or exceeding the state standards)
School District State
2011-12 2012-13 2013-14 2011-12 2012-13 2013-14 2011-12 2012-13 2013-14
Science (grades 5, 8, and 10) 68 64 77 53 53 58 60 59 60 Note: Science assessments include California Standards Tests (CSTs), California Modified Assessment (CMA), and California Alternate Performance Assessment (CAPA). Scores are not shown when the number of students tested is ten or less, either because the number of students in this category is too small for statistical accuracy or to protect student privacy.
2013-14 School Accountability Report Card for James C. Enochs High Page 7 of 14
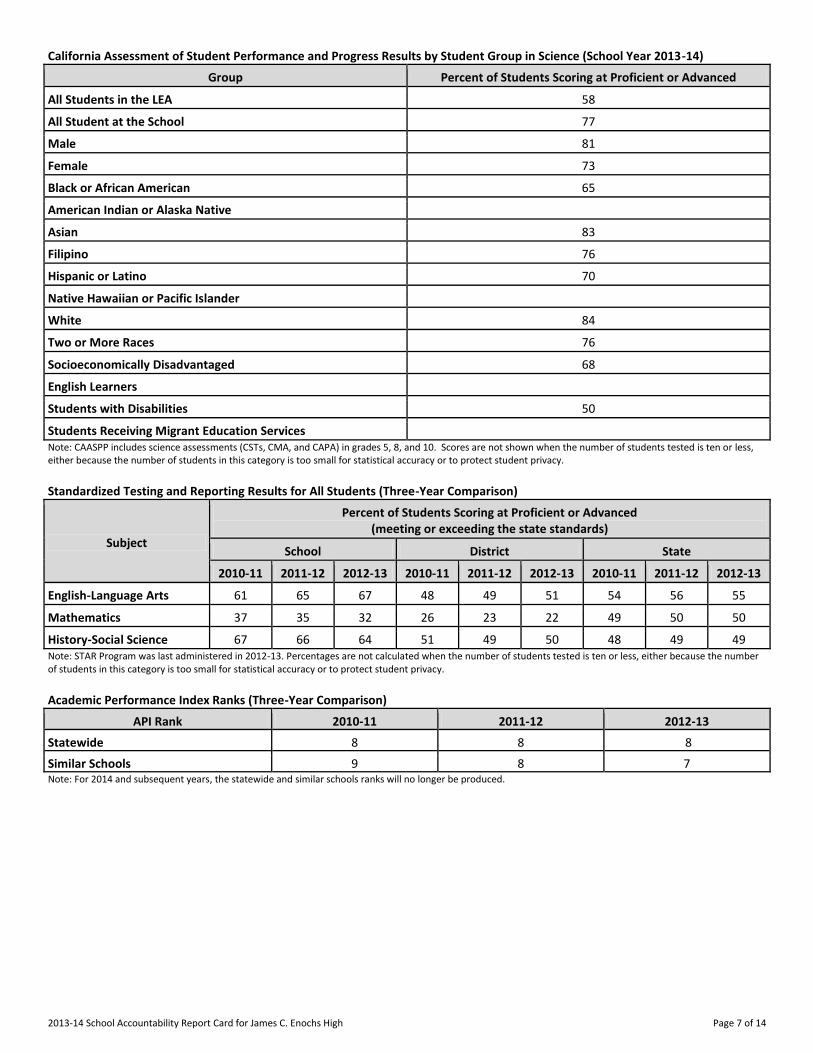
California Assessment of Student Performance and Progress Results by Student Group in Science (School Year 2013-14)
Group Percent of Students Scoring at Proficient or Advanced
All Students in the LEA 58
All Student at the School 77
Male------- 81
Female------- 73
Black or African American 65
American Indian or Alaska Native
Asian------- 83
Filipino------- 76
Hispanic or Latino 70
Native Hawaiian or Pacific Islander
White------- 84
Two or More Races------- 76
Socioeconomically Disadvantaged 68
English Learners-------
Students with Disabilities 50
Students Receiving Migrant Education Services Note: CAASPP includes science assessments (CSTs, CMA, and CAPA) in grades 5, 8, and 10. Scores are not shown when the number of students tested is ten or less, either because the number of students in this category is too small for statistical accuracy or to protect student privacy. Standardized Testing and Reporting Results for All Students (Three-Year Comparison)
Subject
Percent of Students Scoring at Proficient or Advanced (meeting or exceeding the state standards)
School District State
2010-11 2011-12 2012-13 2010-11 2011-12 2012-13 2010-11 2011-12 2012-13
English-Language Arts 61 65 67 48 49 51 54 56 55
Mathematics------- 37 35 32 26 23 22 49 50 50
History-Social Science 67 66 64 51 49 50 48 49 49 Note: STAR Program was last administered in 2012-13. Percentages are not calculated when the number of students tested is ten or less, either because the number of students in this category is too small for statistical accuracy or to protect student privacy. Academic Performance Index Ranks (Three-Year Comparison)
API Rank 2010-11 2011-12 2012-13
Statewide------- 8 8 8
Similar Schools------- 9 8 7 Note: For 2014 and subsequent years, the statewide and similar schools ranks will no longer be produced.

2013-14 School Accountability Report Card for James C. Enochs High Page 8 of 14
Academic Performance Index Growth by Student Group (Three-Year Comparison)
Group Actual API Change
2010-11 2011-12 2012-13
All Students at the School 6 6 -3
Black or African American 22
American Indian or Alaska Native
Asian-------
Filipino-------
Hispanic or Latino 10 -2 9
Native Hawaiian/Pacific Islander
White------- 0 10 -6
Two or More Races -13
Socioeconomically Disadvantaged 25 0 -2
English Learners -9 -10 -1
Students with Disabilities 22 15 34 Note: "N/D” means that no data were available to the CDE or LEA to report. “B” means the school did not have a valid API Base and there is no Growth or target information. “C” means the school had significant demographic changes and there is no Growth or target information.
Career Technical Education Programs (School Year 2013-14)
Modesto City Schools has a long history of operating successful Career Technical Education (CTE) programs. Traditionally called Vocational Education, today’s CTE programs are rigorous and relevant programs that combine academic knowledge with technical skills and application of learning in hands-on, real life contexts to prepare students with viable skills for today’s increasingly complex workforce. Modesto City Schools operates over 30 distinct CTE/ROP programs spread across its seven comprehensive high school sites and ancillary facilities. These programs provide workplace preparation to our high school students, including several programs specifically designed to provide training to students with special needs, as well as workforce training for adults in the community. CTE programs reflect the instructional and learning design of Common Core: problem or project-based learning, development of critical thinking and problem-solving skills, teaming/collaboration, and increased awareness of the expectations of business, industry, and the workplace. CTE is Common Core. State and national data indicate that students taking a CTE sequence perform better on assessments, graduate at higher rates, and are more successful in both college and the job market. CTE program data are monitored for enrollment trends, participation and completion rates, and performance on Carl D. Perkins grant core indicators. These data are reviewed annually with a wide array of stakeholders at a District CTE Advisory meeting, who give input on program effectiveness and development. Career Technical Education Participation (School Year 2013-14)
Measure CTE Program Participation
Number of pupils participating in CTE 5746
% of pupils completing a CTE program and earning a high school diploma 18
% of CTE courses sequenced or articulated between the school and institutions of postsecondary education 79
Courses for University of California and/or California State University Admission
UC/CSU Course Measure Percent
2013-14 Students Enrolled in Courses Required for UC/CSU Admission 73.75
2012-13 Graduates Who Completed All Courses Required for UC/CSU Admission 44.59

2013-14 School Accountability Report Card for James C. Enochs High Page 9 of 14
State Priority: Other Pupil Outcomes The SARC provides the following information relevant to the Other Pupil Outcomes State Priority (Priority 8): • Pupil outcomes in the subject areas of English, mathematics, and physical education. California High School Exit Examination Results for All Grade Ten Students (Three-Year Comparison)
Subject
Percent of Students Scoring at Proficient or Advanced
School District State
2011-12 2012-13 2013-14 2011-12 2012-13 2013-14 2011-12 2012-13 2013-14
English-Language Arts 60 64 65 49 52 42 56 57 56
Mathematics 69 69 72 55 53 46 58 60 62 Note: Percentages are not calculated when the number of students tested is ten or less, either because the number of students in this category is too small for statistical accuracy or to protect student privacy. California High School Exit Examination Grade Ten Results by Student Group (School Year 2013-14)
Group
English-Language Arts Mathematics
Not Proficient
Proficient Advanced Not
Proficient Proficient Advanced
All Students in the LEA 52 25 23 46 37 17
All Students at the School 35 30 35 28 44 28
Male------- 39 31 30 25 45 29
Female------- 30 28 41 30 43 27
Black or African American 52 30 19 58 31 12
American Indian or Alaska Native
Asian------- 14 37 49 9 26 66
Filipino------- 8 28 64 16 32 52
Hispanic or Latino 43 30 27 34 48 18
Native Hawaiian or Pacific Islander
White------- 31 27 41 21 46 34
Two or More Races 36 34 30 33 48 20
Socioeconomically Disadvantaged 44 33 23 35 45 19
English Learners------- 92 8
Students with Disabilities 84 11 5 75 19 6
Students Receiving Migrant Education Services Note: Percentages are not calculated when the number of students tested is ten or less, either because the number of students in this category is too small for statistical accuracy or to protect student privacy. California Physical Fitness Test Results (School Year 2013-14)
Grade Level
Percent of Students Meeting Fitness Standards
Four of Six Standards Five of Six Standards Six of Six Standards
-------9------- 22.5 24.2 38.1 Note: Percentages are not calculated when the number of students tested is ten or less, either because the number of students in this category is too small for statistical accuracy or to protect student privacy.
2013-14 School Accountability Report Card for James C. Enochs High Page 10 of 14
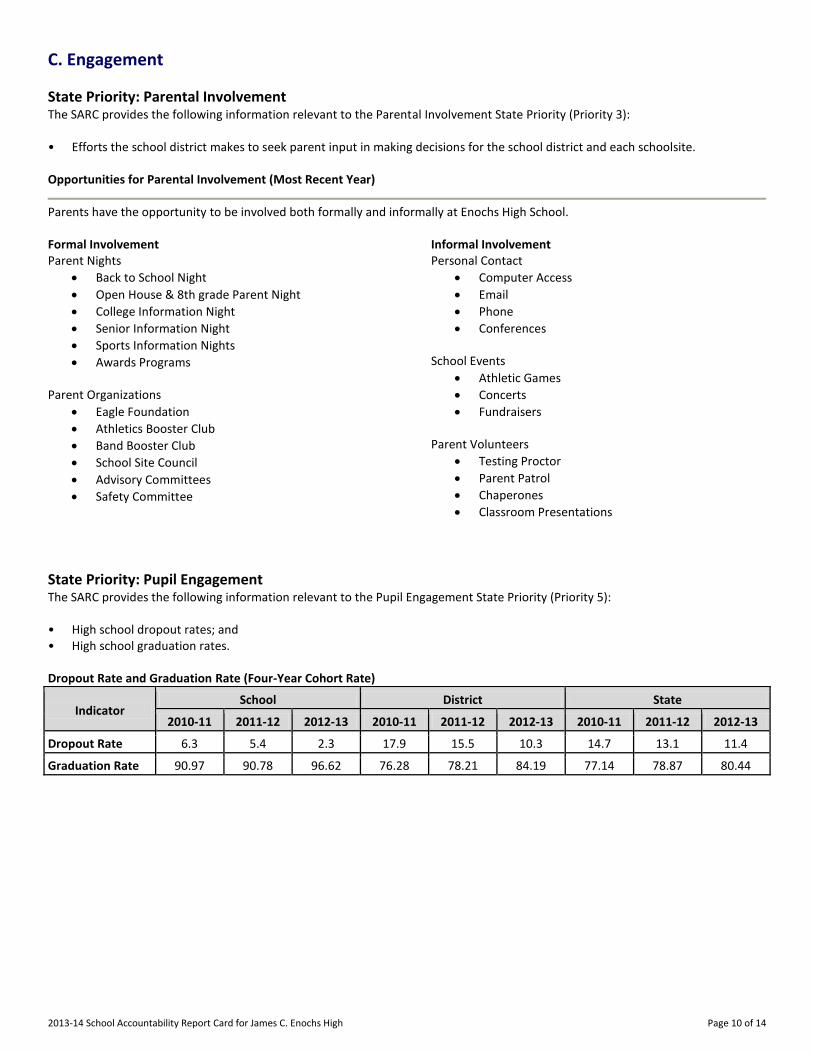
C. Engagement
State Priority: Parental Involvement The SARC provides the following information relevant to the Parental Involvement State Priority (Priority 3): • Efforts the school district makes to seek parent input in making decisions for the school district and each schoolsite. Opportunities for Parental Involvement (Most Recent Year)
Parents have the opportunity to be involved both formally and informally at Enochs High School. Formal Involvement Parent Nights
Back to School Night
Open House & 8th grade Parent Night
College Information Night
Senior Information Night
Sports Information Nights
Awards Programs Parent Organizations
Eagle Foundation
Athletics Booster Club
Band Booster Club
School Site Council
Advisory Committees
Safety Committee
Informal Involvement Personal Contact
Computer Access
Phone
Conferences School Events
Athletic Games
Concerts
Fundraisers Parent Volunteers
Testing Proctor
Parent Patrol
Chaperones
Classroom Presentations
State Priority: Pupil Engagement The SARC provides the following information relevant to the Pupil Engagement State Priority (Priority 5): • High school dropout rates; and • High school graduation rates. Dropout Rate and Graduation Rate (Four-Year Cohort Rate)
Indicator School District State
2010-11 2011-12 2012-13 2010-11 2011-12 2012-13 2010-11 2011-12 2012-13
Dropout Rate 6.3 5.4 2.3 17.9 15.5 10.3 14.7 13.1 11.4
Graduation Rate 90.97 90.78 96.62 76.28 78.21 84.19 77.14 78.87 80.44

2013-14 School Accountability Report Card for James C. Enochs High Page 11 of 14
Completion of High School Graduation Requirements (Graduating Class of 2013)
Group Graduating Class of 2013
School District State
All Students 93.94 82.86 84.56
Black or African American 100.00 83.13 75.90
American Indian or Alaska Native 100.00 69.23 77.82
Asian------- 100.00 91.54 92.94
Filipino------- 88.24 91.30 92.20
Hispanic or Latino 91.54 79.57 80.83
Native Hawaiian/Pacific Islander 100.00 97.83 84.06
White------- 94.47 86.64 90.15
Two or More Races 100.00 75.36 89.03
Socioeconomically Disadvantaged 94.69 78.16 82.58
English Learners 35.00 46.96 53.68
Students with Disabilities 73.85 56.47 60.31
State Priority: School Climate The SARC provides the following information relevant to the School Climate State Priority (Priority 6): • Pupil suspension rates; • Pupil expulsion rates; and • Other local measures on the sense of safety. Suspensions and Expulsions
Rate School District State
2011-12 2012-13 2013-14 2011-12 2012-13 2013-14 2011-12 2012-13 2013-14
Suspensions------- 9.3 8.7 7.3 17.1 14.8 10.3 5.7 5.1 4.4
Expulsions------- 0.2 0.2 0.0 0.8 0.3 0.1 0.1 0.1 0.1 Note: The rate of suspensions and expulsions is calculated by dividing the total number of incidents by the total enrollment x 100. School Safety Plan (Most Recent Year)
The Enochs High School Safety Plan is a comprehensive document the purpose of which is to outline protocols, plans, and procedures in place to ensure the maintenance of a safe and harmonious school environment. The plan is updated annually, reviewed with the Site Safety Committee and submitted to Modesto City Schools for review. One important component of the plan is routine drills to refine procedures and ensure readiness on the part of staff and students. Our Site Safety Plan identifies a number of events for which we hold practice drills. They are:
1. Fire 2. Emergency lockdown 3. Emergency school wide evacuation
In the event that such an emergency occurs, the Principal or his designee implements emergency protocols.

2013-14 School Accountability Report Card for James C. Enochs High Page 12 of 14
D. Other SARC Information
The information in this section is required to be in the SARC but is not included in the state priorities for LCFF. Adequate Yearly Progress Overall and by Criteria (School Year 2013-14)
AYP Criteria School District
Made AYP Overall No No
Met Participation Rate: English-Language Arts Yes No
Met Participation Rate: Mathematics Yes No
Met Percent Proficient: English-Language Arts No No
Met Percent Proficient: Mathematics Yes No
Met Graduation Rate (if applicable) Yes Yes
Federal Intervention Program (School Year 2014-15)
Indicator School District
Program Improvement Status In PI
First Year of Program Improvement 2004-2005
Year in Program Improvement* Year 3
Number of Schools Currently in Program Improvement --- 4
Percent of Schools Currently in Program Improvement --- 100.0 Note: Cells with “---“ do not require data. * DW (determination waiver) indicates that the PI status of the school was carried over from the prior year in accordance with the flexibility granted through the federal waiver process.
Average Class Size and Class Size Distribution (Secondary)
Subject
2011-12 2012-13 2013-14
Avg. Class Size
Number of Classrooms Avg. Class Size
Number of Classrooms Avg. Class Size
Number of Classrooms
1-22 23-32 33+ 1-22 23-32 33+ 1-22 23-32 33+
English------- ----------
29.2 23 12 46 24 50 12 56 23 46 16 52
Mathematics ----------
29.7 15 19 44 24 39 17 52 23 41 18 48
Science------- ----------
34.2 4 5 36 28 17 6 44 28 15 10 37
Social Science ----------
29.9 12 11 40 23 36 9 51 23 38 12 49 Note: Number of classes indicates how many classrooms fall into each size category (a range of total students per classroom). At the secondary school level, this information is reported by subject area rather than grade level. Academic Counselors and Other Support Staff (School Year 2013-14)
Title Number of FTE
Assigned to School Average Number of Students per
Academic Counselor
Academic Counselor------- 3.8 700
Counselor (Social/Behavioral or Career Development) ---
Library Media Teacher (Librarian) 1.0 ---
Library Media Services Staff (Paraprofessional) ---
Psychologist------- 0.2 ---
Social Worker------- ---
Nurse------- 0.8 ---
Speech/Language/Hearing Specialist 0.2 ---
Resource Specialist------- 2.0 ---
Other------- 0.6 --- Note: Cells with “---“ do not require data. One Full Time Equivalent (FTE) equals one staff member working full time; one FTE could also represent two staff members who each work 50 percent of full time.

2013-14 School Accountability Report Card for James C. Enochs High Page 13 of 14
Expenditures per Pupil and School Site Teacher Salaries (Fiscal Year 2012-13)
Level
Expenditures Per Pupil Average Teacher Salary Total
Supplemental/ Restricted
Basic/ Unrestricted
School Site------- $7,594.54 $2,052.82 $5,541.72 $85,659.25
District------- --- --- $5,795.56 $78,371.00
Percent Difference: School Site and District --- --- -4.4 9.3
State------- --- --- $4,690 $70,788
Percent Difference: School Site and State --- --- 18.2 21.0 Note: Cells with “---“ do not require data.
Types of Services Funded (Fiscal Year 2013-14)
All students benefit from the district’s emphasis on maintaining outstanding libraries. Students living a qualifying distance are provided transportation to and from their school. Special education students, gifted and talented students, and English learners receive the appropriate educational services. Programs are funded through a combination of local, state and federal resources. Teacher and Administrative Salaries (Fiscal Year 2012-13)
Category District Amount State Average for Districts In Same Category
Beginning Teacher Salary $50,123 $41,265
Mid-Range Teacher Salary $71,396 $60,386
Highest Teacher Salary $93,239 $78,656
Average Principal Salary (Elementary) $103,842 $98,325
Average Principal Salary (Middle) $105,697 $102,745
Average Principal Salary (High) $119,493 $110,360
Superintendent Salary $226,655 $170,518
Percent of Budget for Teacher Salaries 43.86% 41.14%
Percent of Budget for Administrative Salaries 6.14% 6.07% For detailed information on salaries, see the CDE Certificated Salaries & Benefits Web page at http://www.cde.ca.gov/ds/fd/cs/. Advanced Placement Courses (School Year 2013-14)
Subject Number of AP Courses Offered* Percent of Students In AP Courses
Computer Science ---
English------- 4 ---
Fine and Performing Arts ---
Foreign Language ---
Mathematics 5 ---
Science------- 4 ---
Social Science 12 ---
All courses 25 0.4 Note: Cells with “---“ do not require data. * Where there are student course enrollments.

2013-14 School Accountability Report Card for James C. Enochs High Page 14 of 14
Professional Development
12-13: Common Core – 4 Days ELA Common Core Transition – 4 Days Effective Classroom Management – 2 Days (optional) 13-14: Close Reading Research and Strategies with Dr. Tim Shanahan – 1 Day Data Works Effective Instructional Strategies – 2 Days Teaching Common Core to English Learners by DataWORKs for targeted K-6 Schools – 1 Day (optional) Next Generation Science Standards PD for 7-12 Educators – 2 days (optional) Cruise in to Common Core for K-6 educators – 3 Days (optional) DIBELS for K-1 educators – 2 Days Effective Classroom Management – 2 Days (optional) Lesson Study for Math and Science Educators – 2 Days (optional) 14-15: Effective Instructional Strategies and Curriculum & Lesson Development – 3 Days Common Core Standards Based Instruction for K-6 Educators – 1 Day Next Generation Science Standards PD for 7-12 Educators – 2 days (optional) Big Idea Workshop Series – Optional after school PD for K-6 Educators Lesson Study for Math and Science Educators – 2 Days (optional) Positive Behavior Intervention and Support – 2 Days College and Career Guidance with Naviance for Counselors and Work Experience Coordinators – 1 Day Effective Classroom Management – 2 Days (optional) Restorative Justice – 4 Days Chemical Safety Training – 1 Day