James B. Holt, C. P. Lo, and Thomas W....
18
Delivered by Publishing Technology to: University of Calgary IP: 95.25.89.148 on: Sat, 14 Jul 2012 04:13:26 Copyright (c) Cartography and Geographic Information Society. All rights reserved. Dasymetric Estimation of Population Density and Areal Interpolation of Census Data James B. Holt, C. P. Lo, and Thomas W. Hodler Abstract: This paper describes techniques to compute and map dasymetric population densities and to areally interpolate census data using dasymetrically derived population weights. These tech- niques are demonstrated with 1980-2000 census data from the 13-county Atlanta metropolitan area. Land-use/land-cover data derived from remotely sensed satellite imagery were used to determine the areal extent of populated areas, which in turn served as the denominator for dasymetric popula- tion density computations at the census tract level. The dasymetric method accounts for the spatial distribution of population within administrative areas, yielding more precise population density estimates than the choroplethic method, while graphically representing the geographic distribution of populations. In order to areally interpolate census data from one set of census tract boundaries to another, the percentages of populated areas affected by boundary changes in each affected tract were used as adjustment weights for census data at the census tract level, where census tract boundary shifts made temporal data comparisons difficult. This method of areal interpolation made it possible to represent three years of census data (1980, 1990, and 2000) in one set of common census tracts (1990). Accuracy assessment of the dasymetrically derived adjustment weights indicated a satisfactory level of accuracy. Dasymetrically derived areal interpolation weights can be applied to any type of geographic boundary re-aggregation, such as from census tracts to zip code tabulation areas, from census tracts to local school districts, from zip code areas to telephone exchange prefix areas, and for electoral redistricting. Introduction T he purpose of this paper is to discuss a dasymetric method for computing population densities, using a geographic information system (GIS) and remotely sensed satellite imagery, and to illustrate the use of dasy- metrically derived population densities for areal interpolation of statistical data. Examples of the use of these techniques will be presented from the metropolitan Atlanta, Georgia, area, using data from 1980 through 2000. Population mapping generally has two purposes—to cartographically portray the extent and density of population across an area of interest and to derive quantitative estimates of population density for use in subsequent spatial analytical modeling tasks (Langford 2003). Computing population density requires the standardization of population census data by enumeration areas. The usual manner of computing population density is to divide the total population for a given enumeration area by its total land area. This is easily accomplished in a GIS, which can also display the results in the form of choroplethic maps. Most map users are familiar with, and can easily interpret, choroplethic maps, which also make it easy to compare population densities across areas. Despite these advantages, several problems are inherent in computing and displaying population densities in this manner (Langford 2003). First, the traditional choroplethic method is subject to the Modifiable Areal Unit Problem or MAUP (Openshaw 1984), as it does not account for potential varia- tions in density due to scale and boundary effects. A change in the areal extent of a given enumeration area will result in a change in population density, due to changes in land area and population within that area. Furthermore, the population density for a given area will vary depending on how the boundary of the enumeration area is delineated. A second limitation of choroplethic maps is that they give the impression of abrupt changes at the boundaries of administrative areas (such as counties or census tracts), while representing population as a continuous variable across the entire land area. Population, comprised of individuals, is not a con- tinuous phenomenon; however, population density, which is the number of persons per unit area, is continuous, because a value of population density can be estimated for each discrete location. The traditional manner of population density computa- Cartography and Geographic Information Science, Vol. 31, No. 2, 2004, pp. 103-121 James B. Holt, MPA, PhD, Centers for Disease Control and Prevention, Atlanta, GA. E-mail: <[email protected]>. C. P. Lo, PhD, University of Georgia, Athens, GA. E-mail: <[email protected]>. Thomas W. Hodler, PhD, University of Georgia, Athens, GA. E-mail: <[email protected]>.
Transcript of James B. Holt, C. P. Lo, and Thomas W....
Del
iver
ed b
y P
ublis
hing
Tec
hnol
ogy
to U
nive
rsity
of C
alga
ry IP
95
258
914
8 on
Sat
14
Jul 2
012
041
326
Cop
yrig
ht (
c) C
arto
grap
hy a
nd G
eogr
aphi
c In
form
atio
n S
ocie
ty A
ll rig
hts
rese
rved
Dasymetric Estimation of Population Density and Areal Interpolation of Census Data
James B Holt C P Lo and Thomas W Hodler
Abstract This paper describes techniques to compute and map dasymetric population densities and to areally interpolate census data using dasymetrically derived population weights These tech-niques are demonstrated with 1980-2000 census data from the 13-county Atlanta metropolitan area Land-useland-cover data derived from remotely sensed satellite imagery were used to determine the areal extent of populated areas which in turn served as the denominator for dasymetric popula-tion density computations at the census tract level The dasymetric method accounts for the spatial distribution of population within administrative areas yielding more precise population density estimates than the choroplethic method while graphically representing the geographic distribution of populations In order to areally interpolate census data from one set of census tract boundaries to another the percentages of populated areas affected by boundary changes in each affected tract were used as adjustment weights for census data at the census tract level where census tract boundary shifts made temporal data comparisons difficult This method of areal interpolation made it possible to represent three years of census data (1980 1990 and 2000) in one set of common census tracts (1990) Accuracy assessment of the dasymetrically derived adjustment weights indicated a satisfactory level of accuracy Dasymetrically derived areal interpolation weights can be applied to any type of geographic boundary re-aggregation such as from census tracts to zip code tabulation areas from census tracts to local school districts from zip code areas to telephone exchange prefix areas and for electoral redistricting
Introduction
The purpose of this paper is to discuss a dasymetric method for computing population densities using a geographic
information system (GIS) and remotely sensed satellite imagery and to illustrate the use of dasy-metrically derived population densities for areal interpolation of statistical data Examples of the use of these techniques will be presented from the metropolitan Atlanta Georgia area using data from 1980 through 2000
Population mapping generally has two purposesmdashto cartographically portray the extent and density of population across an area of interest and to derive quantitative estimates of population density for use in subsequent spatial analytical modeling tasks (Langford 2003) Computing population density requires the standardization of population census data by enumeration areas The usual manner of computing population density is to divide the total population for a given enumeration area by its total land area This is easily accomplished in a
GIS which can also display the results in the form of choroplethic maps Most map users are familiar with and can easily interpret choroplethic maps which also make it easy to compare population densities across areas
Despite these advantages several problems are inherent in computing and displaying population densities in this manner (Langford 2003) First the traditional choroplethic method is subject to the Modifiable Areal Unit Problem or MAUP (Openshaw 1984) as it does not account for potential varia-tions in density due to scale and boundary effects A change in the areal extent of a given enumeration area will result in a change in population density due to changes in land area and population within that area Furthermore the population density for a given area will vary depending on how the boundary of the enumeration area is delineated A second limitation of choroplethic maps is that they give the impression of abrupt changes at the boundaries of administrative areas (such as counties or census tracts) while representing population as a continuous variable across the entire land area Population comprised of individuals is not a con-tinuous phenomenon however population density which is the number of persons per unit area is continuous because a value of population density can be estimated for each discrete location The traditional manner of population density computa-
Cartography and Geographic Information Science Vol 31 No 2 2004 pp 103-121
James B Holt MPA PhD Centers for Disease Control and
Prevention Atlanta GA E-mail ltjgh4cdcgovgt C P Lo PhD
University of Georgia Athens GA E-mail ltchpanglougaedugt
Thomas W Hodler PhD University of Georgia Athens GA E-mail
lttwhodlerugaedugt
Del
iver
ed b
y P
ublis
hing
Tec
hnol
ogy
to U
nive
rsity
of C
alga
ry IP
95
258
914
8 on
Sat
14
Jul 2
012
041
326
Cop
yrig
ht (
c) C
arto
grap
hy a
nd G
eogr
aphi
c In
form
atio
n S
ocie
ty A
ll rig
hts
rese
rved
104 Cartography and Geographic Information Science
tion yields positive values for population density at all locations1 The traditional manner of computing population density overestimates population density in unpopulated and sparsely populated areas and it underestimates population density in more-densely populated areas
Dasymetric mapping like choroplethic mapping is an area-based cartographic technique The major difference is that choropleth maps are based upon existing administrative boundaries that are indepen-dent of the phenomena to be mapped whereas in dasymetric maps the boundaries of the phenomenonrsquos distribution are revealed In dasymetric mapping the original administrative areas (or source zones) are divided into smaller spatial units onto which the socio-demographic variable of interest (eg population) is averaged to obtain a rate such as population density These smaller spatial units are areas estimated to contain population usually through the application of ancillary land-use data often acquired through classification of remotely sensed satellite images This technique is based on an explicit recognition of the fact that certain areas within an administrative area are populated while others are not (Wright 1936)2 The smaller spatial units used in dasymetric mapping have greater interval consistency (ie less variation) in the density of the variable being mapped Although some internal variation will remain it will be less than in a choroplethic map
Dasymetric mapping is also vulnerable to the MAUP and it still results in abrupt transitions at zonal boundaries However with dasymetric map-ping these transitions are a better reflection of the true underlying geography of the area than the transitions in choroplethic maps which are artifacts partially attributable to the arbitrary delineation of areal boundaries (Langford 2003)
This limitation of dasymetric mapping is offset by the techniquersquos better visualizations of population patterns due to the high degree of spatial disag-gregation that can be achieved especially if high spatial resolution satellite imagery is used as the basis for ancillary land-use data The technique also offers more precise estimates of population
density for use in analytical procedures such as areal interpolation (discussed below)3 Fisher and Langford (1995) have shown that the use of dasy-metric population densities result in highly accurate areally interpolated data estimates4
Areal interpolation is closely related to dasymetric mapping of population densities Areal interpo-lation (also called cross-area estimation) involves the transformation of data from one areal unit or zonation to another (Fisher and Langford 1996) Areal interpolation can be accomplished through simple areal weighting pycnophylactic interpola-tion (Tobler 1979) population-weighted centroids with a distance decay function (Martin 1989 1996) a regression-based modeling approach (Langford et al 1991 Yuan et al 1998) or dasymetric map-ping techniques (Langford and Unwin 1994 Eicher and Brewer 2001 Fisher and Langford 1995 1996 Langford 2003)5
Data are often collected and reported by admin-istrative areas that are either designed for the con-venience of data collection (but are not necessarily meaningful for analysis) or that change over time (Martin et al 2002) limiting temporal analyses of a particular phenomenon In these situations it may be desirable to represent the same data in dif-ferent administrative units (eg in census tracts in lieu of zip codes) In other situations data for some variables may be reported in one type of areal unit while other data variables are reported in another perhaps incompatible type of areal unit In such situations data sets should be normalized to the same type of compatible areal unit through areal interpolation
Objectives
This paper describes our efforts to derive dasy-metric population densities for areally interpolat-ing census tract level data from 1980 1990 and 2000 to a common set of census tract boundaries The areal interpolation was necessary in order to examine temporal trends in socioeconomic data These efforts were part of a larger research project (Holt 2003) that examined the association
1 This applies only to areal units that are populated An example of an exception to this statement is a census block which is unpopulated
and hence has a population density of zero 2 Wright (1936) notes that the name ldquodasymetricrdquo map meaning ldquodensity measuringrdquo (Wright p 104) originated in Russia although Wright
does not give a citation for that information It can be assumed therefore that Wright was not the first person to develop the concept
of the dasymetric map rather he was the first to publish an article on dasymetric maps in an English-language journal 3 Holloway et al (1996) argue that dasymetric mapping can be applied to other socioeconomic variables such as race religion income etc4 Crampton (2004) presents a detailed historical overview and conceptual comparison of choroplethic and dasymetric maps and argues for increased
usage of dasymetric maps5 Gotway and Young (2002) present an in-depth discussion of incompatible spatial data and methodologies for integrating spatially dis-
parate data
Del
iver
ed b
y P
ublis
hing
Tec
hnol
ogy
to U
nive
rsity
of C
alga
ry IP
95
258
914
8 on
Sat
14
Jul 2
012
041
326
Cop
yrig
ht (
c) C
arto
grap
hy a
nd G
eogr
aphi
c In
form
atio
n S
ocie
ty A
ll rig
hts
rese
rved
Vol 31 No 2 105
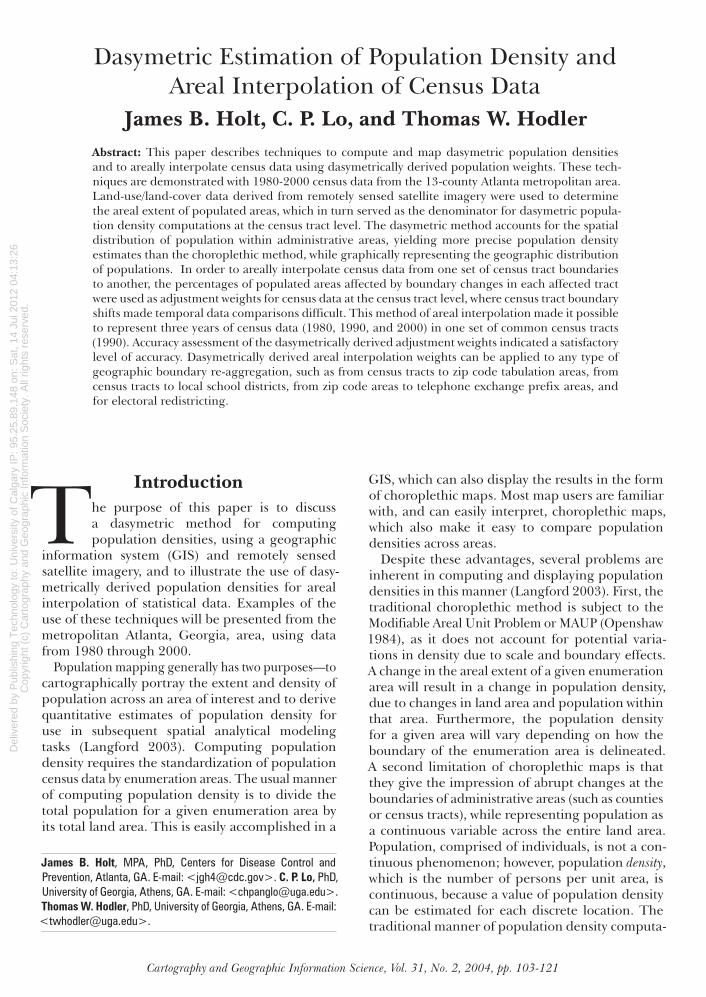
Figure 1 Metropolitan Atlanta study area a) County boundaries b) 1980 Census tract boundaries c) 1990 Census tract
boundaries and d) 2000 Census tract boundaries
a) b)
c) d)
Del
iver
ed b
y P
ublis
hing
Tec
hnol
ogy
to U
nive
rsity
of C
alga
ry IP
95
258
914
8 on
Sat
14
Jul 2
012
041
326
Cop
yrig
ht (
c) C
arto
grap
hy a
nd G
eogr
aphi
c In
form
atio
n S
ocie
ty A
ll rig
hts
rese
rved
106 Cartography and Geographic Information Science
between tract-level socioeconomic characteristics and health outcomes for the 13-county Atlanta Georgia metropolitan area (Figure 1a) In 1980 the 13-county Metropolitan Atlanta area was com-prised of 339 census tracts (Figure 1b) in 1990 this increased to 444 census tracts (Figure 1c) and in 2000 to 589 census tracts (Figure 1d) an increase of 74 percent
In many cases the new census tracts were created by simply splitting existing tracts in some cases the creation of new tracts involved minor adjustments to existing tract boundaries Even when new tracts were not created the boundaries between many adjacent tracts shifted The focus of the research presented here is on the practical application of dasymetric population density estimation and areal interpolation to facilitate small-area analyses spe-cifically for those situations where administrative boundaries (eg census tracts) have changed over time and data collected for an area at one point in time are not compatible with data collected for the same area at a later point in time due to changes in census tract boundaries
Data
We obtained satellite imagery of the 13 counties in the metropolitan Atlanta region from the US Geological Survey EROS Data Center for 1984 LT5019036037084172 Landsat 5 Thematic Mapper Path 019 Rows 036-037 [with 50 percent offset] acquired on June 20 1984) 1990 (Scene ID LT5019036037090268 Landsat 5 Thematic Mapper Path 019 Rows 036-037 [with 50 percent offset] acquired on September 25 1990) and 2000 (Scene ID L71019036-03620000928 Path 019 Row 036 acquired on September 28 2000 and Scene ID L71019037-03720000928 Path 019 Row 037 acquired on September 28 2000) We used these satellite images to derive land-useland-cover data for 1984 1990 and 2000
We used color infrared digital orthophoto quad-rangles of metropolitan Atlanta (February 1999) to ground truth the satellite-derived land-useland-cover data for 2000 We used black-and-white and color aerial photographs of portions of the metropolitan Atlanta area (particularly Gwinnett County 1988 and 1989) to ground truth the satellite-derived land-useland-cover data for 1990 We obtained road network data from the National Transportation Atlas Database (US Department of Transportation 2002) to assist in classifying land useland cover
We obtained county boundary files from the Digital Environmental Atlas of Georgia Version 2 published jointly by the Georgia Geologic Survey
and the US Geological Survey We obtained census tract boundary files from the US Census Bureau for 1990 and 2000 For 1980 we obtained census tract boundaries from Geolytics Inc which created the census tract boundaries based on Census TIGERLine Files (no longer downloadable for 1980 from the Census Bureau) We manually edited the 1980 Geolytics census tract boundaries in a GIS (ArcGIS 82 Environmental Systems Research Institute Redlands California) to remove small polygons corresponding to small-to-large bodies of water
We obtained US Census Long Form (SF-3) data for 1980 1990 and 2000 from Geolytics Inc We used selected original variables from the SF-3 as well as user-derived variables from the SF-3 data
Methodology
For the Atlanta study (Holt 2003) it was necessary to normalize all census data for 1980 1990 and 2000 to 1990 census tract boundaries as the anal-ysis addressed variables representing the social environment in 1990 and the potential health outcomes in the late 1990s Additional variables were added to that analysis namely the changes in the social environment from 1980 to 2000 To add these change variables to the existing 1990 variables it was necessary to use consistent census tract boundaries and we chose the 1990 boundar-ies Because we used 1990 boundaries we needed to account for census tract boundary changes by weighting the census data for 1980 and 2000 We accomplished this through areal interpolation based on dasymetric mapping of the population
Dasymetric Determination
of Population Densities
The basic procedure that we used in this project is similar to the binary dasymetric procedure described by Langford and Unwin (1994) and Fisher and Langford (1995 and 1996) The binary dasymetric procedure utilizes ancillary land-useland-cover data to differentiate populated and unpopulated areas Our ancillary land-useland-cover data were derived from a computer-assisted manual pixel-based classification of remotely sensed satellite data An example of the land-useland-cover data is in Figure 2 which depicts Gwinnett County in 1990 Figure 3 depicts popu-lated (low-density urban) areas and unpopulated areas (all other categories)
We overlaid the raster format land-useland-cover map in binary form (populated versus unpopulated) with a census tract boundary file which we had trans-
Del
iver
ed b
y P
ublis
hing
Tec
hnol
ogy
to U
nive
rsity
of C
alga
ry IP
95
258
914
8 on
Sat
14
Jul 2
012
041
326
Cop
yrig
ht (
c) C
arto
grap
hy a
nd G
eogr
aphi
c In
form
atio
n S
ocie
ty A
ll rig
hts
rese
rved
Vol 31 No 2 107
formed from the original vector shapefile format into a raster file We determined the number of residential land-use pixels per census tract using the Summary function in ERDAS Imagine 86 (Leica Geosystems Inc Atlanta Georgia) we added these values as a separate attribute field in the census tract vector shapefile We merged the census tract shapefile with a database file of census tract population extracted from the Geolytics Long Form (SF-3) database We then determined the population per residentially occupied pixel per census tract by simple arith-metic calculation in ArcGIS 82 We mathematically transformed the areal unit of the land-use pixels (each representing an area 30 meters x 30 meters) into hectares and square kilometers The resulting statistics represented the dasymetrically derived population density for each census tract We used this basic methodology to determine population density in 1980 1990 and 2000 For each year we implemented the dasymetric process in the GIS slightly differently because we needed to express the population densities in terms of the 1990 census tract boundaries In addition for 1980 and 2000 we used the dasymetric procedure as the basis for areal interpolation of census-derived data to 1990 census tract boundaries6
1990 Population Density in 1990 Census
Tract Boundaries
For the 1990 data we only needed to compute census tract population densities areal interpola-tion of 1990 census data was not necessary because we used 1990 census tract boundaries To compute the 1990 population densities we derived ancillary data from the unsupervised classification of a 1990 Landsat Thematic MapperTM satellite image with a scene acquisition date of September 25 1990 We classified the image with ERDAS Imagine 86 using the Iterative Self-Organizing Data Analysis Technique (ISODATA) unsupervised classification approach In an ISODATA classification satellite imagery pixels with similar spectral properties are grouped into a user-determined number of clusters This clustering is achieved through a computerized search for natural groupings of the pixelsrsquo spectral properties based on their dis-tances in multispectral feature space defined by the spectral bands of the image data (ie a cluster analysis) The analyst manually assigns these spectral classes a posteriori to information classes of interest such
as land-useland-cover categories (Jensen 1996) Overall accuracy for the ISODATA classification was 9294 percent Producerrsquos accuracy and userrsquos accuracy for the Low-Density Urban category (which is associated with residential land use) were 9692 percent and 8750 percent respectively In addition the overall Kappa index of agreement was 09124 and the conditional Kappa for the Low-Density Urban category was 08524 Thus our classification accuracies exceeded the com-monly accepted minimum thresholds for remotely sensed data (Anderson et al 1976) as well as the threshold necessary to ensure robustness to clas-sification error of the binary dasymetric technique (Fisher and Langford 1996)
We determined dasymetric population density for 1990 using the basic procedure described above For example census tract 50102 in northwestern Gwinnett County contained 4413 residential pixels and its 1990 population was 8684 We divided the tract population by the number of residential pixels yielding a dasymetric density of 197 people per pixel which translates to 218889 people per square kilometer
1980 and 2000 Population Densities
in 1990 Census Tract Boundaries
For the 1980 and 2000 data we computed census tract population densities expressed in terms of the 1990 census tract boundaries This involved modifying the basic procedure that we used to determine 1990 population density Essentially we first determined the population densities for 1980 in terms of the 1980 census tract boundar-ies and the population densities for 2000 in terms of the 2000 census tract boundaries We then re-expressed the 1980 and 2000 population densities in terms of the 1990 census tract boundaries
To compute the 1980 population densities we used a June 20 1984 LandsatTM scene to derive the ancillary data on residential land-use extent in 1980 The 1984 satellite image is a compromise because no satellite image with compatible spatial resolu-tion (30 meters) is available for 1980 Although we obtained a LandsatTM image from December 1982 we did not use it because of its poor radiometric contrast and because it was taken in the winter while the 1990 and 2000 images were taken in the summer We classified the 1984 image in the same manner as the 1990 image We did not conduct an accuracy assessment due to the lack of suitable ground truth
6 The 1990 census tract boundaries were selected because the 1980 1990 and 2000 population density values and their rates of change
were used as independent variables in the larger Atlanta mortality study (Holt 2003) in which mortality rates were expressed in terms
of 1990 census tracts
Del
iver
ed b
y P
ublis
hing
Tec
hnol
ogy
to U
nive
rsity
of C
alga
ry IP
95
258
914
8 on
Sat
14
Jul 2
012
041
326
Cop
yrig
ht (
c) C
arto
grap
hy a
nd G
eogr
aphi
c In
form
atio
n S
ocie
ty A
ll rig
hts
rese
rved
108 Cartography and Geographic Information Science
Figure 2 Land useland cover Gwinnett County Georgia 1990
Del
iver
ed b
y P
ublis
hing
Tec
hnol
ogy
to U
nive
rsity
of C
alga
ry IP
95
258
914
8 on
Sat
14
Jul 2
012
041
326
Cop
yrig
ht (
c) C
arto
grap
hy a
nd G
eogr
aphi
c In
form
atio
n S
ocie
ty A
ll rig
hts
rese
rved
Vol 31 No 2 109
Figure 3 Residential land use Gwinnett County Georgia 1990
Del
iver
ed b
y P
ublis
hing
Tec
hnol
ogy
to U
nive
rsity
of C
alga
ry IP
95
258
914
8 on
Sat
14
Jul 2
012
041
326
Cop
yrig
ht (
c) C
arto
grap
hy a
nd G
eogr
aphi
c In
form
atio
n S
ocie
ty A
ll rig
hts
rese
rved
110 Cartography and Geographic Information Science
data However because the image is of the same type and from the same satellite as the 1990 image and because we used the same classification technique the classification accuracies should be similar to those of the 1990 image Furthermore the classification accuracy probably exceeds the minimum 60 percent threshold determined by Fisher and Langford (1996) to be necessary for ensuring robustness to error of the binary dasymetric procedure
Once we determined the extent of Low-Density Urban (eg residential) land use we converted the land-useland-cover map into a binary map of residential versus non-residential pixels similar to the 1990 land-useland-cover map We overlaid the 1984 binary map with a rasterized map of 1980 census tract boundaries and using the Summary function in ERDAS Imagine 86 determined the number of residential pixels per census tracts We entered these values as a separate attribute field in the 1980 census tract vector shapefile which we merged with a database file containing 1980 tract populations We computed population densities for 1980 using 1980 boundaries by arithmetic opera-tion in ArcGIS 82
Expressing the 1980 population densities in terms of the 1990 census tract boundaries required addi-tional processing We combined the 1984 binary land-useland-cover map with the 1980 census tract vector shapefile using the Matrix operation in ERDAS Imagine 86 This essentially recoded the land-use mapsrsquo individual pixel values (formerly binary 0 and 1) to values representing the tract level population densities corresponding to each pixelrsquos census tract7 We then combined the rasterized 1990 census tracts with the recoded land-use map using the Summary function in Imagine and exported a data file containing the number of pixels of each attribute (density) for each 1990 census tract
Each census tract that experienced no boundary changes from 1980 to 1990 contained only one sum-mary number of pixels with an associated population density value Census tracts that experienced boundary changes contained more than one summary number of pixels each with its own associated population density values For both types of census tracts we calculated the 1980 population density values in terms of the 1990 census tract boundaries based on the number of pixels and their corresponding density values We merged the Excel file converted to a database file with the 1990 census tract vector shapefile this added the 1980 dasymetric popula-
tion density values as a separate attribute field in the 1990 shapefile
For the 2000 population densities calculations we used the same procedure We derived the 2000 ancillary land-useland-cover data from the ISODATA classification of a September 28 2000 Landsat 7 ETM+ scene with an overall classification accuracy of 9012 percent Producerrsquos and userrsquos accuracy for the Low-Density Urban category were 9344 percent and 8769 percent respectively In addition the overall Kappa index of agreement was 08759 and the conditional Kappa for the Low-Density Urban category was 08563 As with the 1990 ancillary data the 2000 data exceeded the minimum thresholds for classification accuracy
Areal Interpolation of Census Data
We used a form of areal interpolation to disaggre-gate the 1980 and 2000 census-derived data from their original tract boundaries and to re-aggregate these data into the 1990 census tract boundaries In the greater Atlanta area some census tracts were split into two or more constituent tracts between 1980 and 2000 the boundaries of some census tracts with neighboring tracts shifted and some tracts were both split and had their bound-aries changed (Figure 4) Most of the census tract changes between 1980 and 2000 involved split census tracts many of which were due to the rapid population growth in suburban Atlanta during this period
The basic procedure for areal interpolation we used was to determine where changes occurred to census tract boundaries from 1980 to 1990 and from 1990 to 2000 We then determined the percent-age of populated areas affected by those boundary changes in each affected census tract developed weights based on the percentage of affected popu-lated areas and applied the weights to 1980 and 2000 census-derived data to obtain estimates of the census data for 1980 and 2000 in terms of the 1990 census tract boundaries
We determined census tract boundary changes from 1980 to 1990 using Tract Comparability Files (Socioeconomic Data and Applications Center 2003) We used Tract Relationship Files (US Census Bureau 2002) to determine census tract boundary changes from 1990 to 2000 The Census Tract Comparability and Relationship Files list census tracts that experi-enced a significant change (25 percent of land area or greater) from one decennial census to the next
7 Because raster pixel values must be integers we first multiplied the population densities by 100 in the vector shapefile We used these
ldquopseudo-densitiesrdquo for the remaining steps of the procedure Once we completed the procedure we divided the pseudo-values by 100
to obtain the density values expressed in the original decimal format
Del
iver
ed b
y P
ublis
hing
Tec
hnol
ogy
to U
nive
rsity
of C
alga
ry IP
95
258
914
8 on
Sat
14
Jul 2
012
041
326
Cop
yrig
ht (
c) C
arto
grap
hy a
nd G
eogr
aphi
c In
form
atio
n S
ocie
ty A
ll rig
hts
rese
rved
Vol 31 No 2 111
(US Census Bureau 2002) We also displayed 1980 1990 and 2000 census tract boundary shapefiles in a GIS (ArcGIS 82) and confirmed differences in tract boundaries by visual inspection We cross-checked the results of the visual inspection of the GIS data with the information in the Census Tract Comparability and Relationship Files to identify the tract boundaries affected by changes and to develop a table of the nature of these changes
We calculated the percentages of populated areas affected by boundary changes in each affected tract by applying the ancillary land-useland-cover data we had derived to dasymetrically determine census tract population densities For boundary shifts from 1990 to 2000 we overlaid the 1990 and 2000 tract boundary shapefiles in a GIS (ArcGIS 82) We used the same process for the 1980 to 1990 tract boundary shifts We identified the land areas affected by tract boundary shifts by using the ldquoIntersectionrdquo opera-tion in ArcGIS and exporting each area as a unique shapefile We used ERDAS Imagine 86 to matrix each shapefile with a binary mask representing residential pixels and non-residential pixels We repeated this process for each intersection shapefile Summary reports from Imagine provided the numbers of resi-dential pixels contained in each intersection area For each boundary shift we divided the number of residential pixels in the shifted area by the number of residential pixels in the census tract to which the shifted area originally belonged using the attribute table of the 1990 tract boundary shapefile The resulting percentage represented the residential land-use area that shifted from the original census tract to the receiving census tract
We used the percentages of affected residential land use from the preceding step as interpola-tion weights for expressing the 2000 census data in terms of the 1990 census tract boundaries We accomplished this by multiplying the 2000 census data by the interpolation weights The step-by-step procedure for interpolating census data is illustrated in Figure 5 using DeKalb County census tracts 201 and 22401 as examples
In Figure 5a the portion of tract 201 that shifted to tract 22401 from 1990 to 2000 is highlighted by the cross-hatched area In Figure 5b the residential land-use pixels from 2000 are superimposed over the area of tracts 201 and 22401The number of residential land-use pixels in the portion of tract 201 that shifted to 22401 is 105 pixels the number of residential land-use pixels unaffected by the boundary shift is 484 pixels These numbers cor-respond to 18 percent and 82 percent of the total number of residential pixels (589) for the entire land area of tract 201 in 2000 These percentages
served as the dasymetric weights for the subsequent areal interpolation of the poverty data from their original 2000 boundaries to their 1990 boundaries Figure 5c depicts the population and poverty data for tracts 201 and 22401 in terms of the 2000 tract boundaries prior to areal interpolation Figure 5d illustrates the weighting of the data for tract 201 in accordance with the dasymetric weights of 82 percent and 18 percent Lastly Figure 5e shows the resulting census data for tracts 201 and 22401 after areal interpolation These data were obtained by subtracting the data corresponding to the cross-hatched area from tract 201 and adding these data to 22401
For census tract splits from 1980 to 1990 with no other shifts in tract boundaries areal interpolation was unnecessary Instead we assigned the census data for each 1980 census tract to its 1990 constitu-ent tracts For example Gwinnett Countyrsquos 1980 census tract 501 was split into tracts 50101 and 50102 for 1990 We assigned the census data values for 1980 tract 501 to each of the 1990 tracts In this manner the 1980 census data for 1980 tract 501 were expressed in terms of the 1990 census tract boundaries (tracts 50101 and 50102)
We handled census tract splits from 1990 to 2000 differently because we calculated our results based on the 1990 census tracts for our project We treated the 1990 to 2000 changes as though the 2000 census tracts had been ldquore-aggregatedrdquo back into their original 1990 census tracts For example if Gwinnett Countyrsquos 1990 census tract 50101 was split into two tracts for 2000 (tracts 50103 and 50104) the data for tracts 50103 and 50104 were aggregated and assigned to 1990 tract 50101 We aggregated the appropriate denominator data (eg total population) and the numerator data (eg total number of white population) for each of the 2000 tracts so that the resulting percentages could be computed for the aggregated tracts In this manner the 2000 census data for 2000 census tracts 50103 and 50104 were expressed in terms of the 1990 census tract 50101 boundaries
Results and Discussion
Population Density
In all 13 counties in the study area the census tract-level dasymetrically determined population densities exceeded the population densities com-puted with the choroplethic method Table 1 lists the 1990 choroplethic and dasymetric population densities for Gwinnett County Figure 6a depicts
Del
iver
ed b
y P
ublis
hing
Tec
hnol
ogy
to U
nive
rsity
of C
alga
ry IP
95
258
914
8 on
Sat
14
Jul 2
012
041
326
Cop
yrig
ht (
c) C
arto
grap
hy a
nd G
eogr
aphi
c In
form
atio
n S
ocie
ty A
ll rig
hts
rese
rved
112 Cartography and Geographic Information Science
the dasymetric popula-tion density for 1990 The different results provided by the dasymetric and choroplethic methods are illustrated in Figures 6a and 6b In both maps we assigned the data to five classes using the Jenksrsquo Optimal Breaks method A comparison of the two maps readily indicates dif-ferences in the outer coun-ties In particular all census tracts in Douglas Paulding Forsyth Rockdale Coweta Fayette Henry and (with one minor exception) Cherokee counties have the lowest class of population density in the choroplethic map suggesting broad homogeneity of census tract population density throughout the outer sub-urban fringe However the dasymetric map of popula-tion densities for the same counties depicts areas with higher population density within each county These generally correspond to county seats other small towns or especially in Paulding County areas of new higher-density hous-ing subdivisions Therefore the dasymetric map pro-vides more precision in dif-ferentiating areas of higher and lower population density within counties
To place these population densities in perspective if a given residential area is comprised of single-family housing units zoned for one-half acre lots there are approximately 48 housing units per hectare (2 housesacre x 24 acreshectare) As there are 100 hectares per square kilometer this translates to 480 housing units per square kilometer of residential area If one assumes a population-to-housing unit density of two persons per housing unit this would yield an estimated population density of 960 per-sons per square kilometer of residential area (480 housing units x 2 personshousing unit)
As a further comparison of these dasymetric population densities if the population densities
for tracts 50102 and 50202 had been calculated in the traditional manner of dividing each tractrsquos total population by its total land area their respec-tive densities would have been 24169 persons per square kilometer (8684 persons divide 3593 km2 total land area) and 5389 persons per square kilometer (3047 persons divide 5654 km2 total land area) While the ordinal ranking of the two tracts remains the same (tract 50102 is more densely populated than tract 50202) the relative difference in population density is dramatically different between the two methods of population density computation For the dasymetric method tract 50102 is roughly 25 times more densely populated than tract 50202 while for the traditional method tract 50102 is roughly 45 times more densely populated than tract 50202
Figure 4 Census tract boundaries north-central Gwinnett County 1990 and 2000
Del
iver
ed b
y P
ublis
hing
Tec
hnol
ogy
to U
nive
rsity
of C
alga
ry IP
95
258
914
8 on
Sat
14
Jul 2
012
041
326
Cop
yrig
ht (
c) C
arto
grap
hy a
nd G
eogr
aphi
c In
form
atio
n S
ocie
ty A
ll rig
hts
rese
rved
Vol 31 No 2 113
Figure 5 Areal interpolation using dasymetric weights
Del
iver
ed b
y P
ublis
hing
Tec
hnol
ogy
to U
nive
rsity
of C
alga
ry IP
95
258
914
8 on
Sat
14
Jul 2
012
041
326
Cop
yrig
ht (
c) C
arto
grap
hy a
nd G
eogr
aphi
c In
form
atio
n S
ocie
ty A
ll rig
hts
rese
rved
114 Cartography and Geographic Information Science
Therefore by not including unpopulated land areas in the calculations of population density the dasymetric method provides a more precise measure of population density within residential areas and the variation in population density among tracts can be substantial8
Unlike choroplethic maps dasymetric maps show which areas are unpopulated This is especially evi-dent in the outer counties which have large areas of non-residential land-use This trait of the dasymetric map makes it suitable for visually depicting tempo-ral changes to the landscape Although dasymetric maps provide more spatial precision in mapping population density than choroplethic maps they are subject to the same scale and aggregation effects as choroplethic maps
If the same census tract boundaries are maintained from one census to the next and the population increases with no increase in residential land-use area then the population density will increase But if residential land-use area increases the popula-tion density will increase or decrease depending on the relative magnitudes of the population and land-use area changes For this reason some census tracts in the suburban fringe counties experienced population increases concurrent with decreases in dasymetric population density while other tracts with population increases experienced increases in dasymetric population density
For example census tract 1707 in central Coweta experienced an increase in population from 6458 in 1990 to 7139 in 2000 (an increase of 105 percent) and an increase in residential land-use from 404 km2 to 510 km2 (an increase of 262 percent) The result-
ing dasymetric population density decreased from1 600 personskm2 to 1400 personskm2 When this change is analyzed with the choroplethic method of calculating population density the opposite happens a 1990 density of 29 personskm2 (6458 persons divide 22226 km2 of total land area) and a 2000 density of 32 personskm2 (7139 persons divide 22226 km2 of total land area) indicate an increase in popula-tion density from 1990 to 2000 For tract 1707 the decrease in dasymetric population density is prob-ably attributable to new residents (after 1990) living in newly constructed single-family houses built on relatively large lots (eg one acre or greater)
An example of a dasymetric population density increase is census tract 1205 in southeastern Paulding County Its population increased from 6809 to 14425 from 1990 to 2000 (an increase of 1119 percent) while its residential land-use area increased from 547 km2 to 889 km2 (an increase of 625 percent) While population and residential land-use area grew substantially population growth exceeded residential land-use growth This may be attributable to the construction of single-family houses on relatively smaller lots the construction of multi-family housing units an influx of families with multiple children or a combination of these factors
Tract-level dasymetric population densities for Gwinnett County in 1980 1990 and 2000 are listed in Table 2 The tracts with increasing population and decreasing population density probably experienced urban sprawl during this period The dasymetric mapping process can measure this at the tract level but choroplethic techniques cannot account for such
Table1 Population densities choroplethic versus dasymetric selected census tracts Gwinnett County Georgia 1990
Tract Number 1990 PopulationChoroplethic Population Density
(persons per square kilometer)
Dasymetric Population Density
(persons per square kilometer)
50101 8142 127 1700
50102 8684 242 2189
50305 9605 1913 8422
50408 10986 1372 3733
50410 4767 788 3311
50509 5231 153 1544
50601 8937 73 989
50705 6529 87 1044
50706 10425 673 3089
8 For the 1990 population data across the entire study area the mean dasymetric population density is 4085 personskm2 (sd=4764)
the mean choroplethic population density is 906 personskm2 (sd=925)
Del
iver
ed b
y P
ublis
hing
Tec
hnol
ogy
to U
nive
rsity
of C
alga
ry IP
95
258
914
8 on
Sat
14
Jul 2
012
041
326
Cop
yrig
ht (
c) C
arto
grap
hy a
nd G
eogr
aphi
c In
form
atio
n S
ocie
ty A
ll rig
hts
rese
rved
Vol 31 No 2 115
changes in residential land use within tracts Thus dasymetric mapping can pinpoint areas of urban sprawl (Figure 7) such as tracts made accessible by multi-lane expressways
Areal Interpolation of Census Data
We areally interpolated census data for 1980 and 2000 when boundary shifts occurred from one
census to the next The number (8 for 1980-1990 and 15 for 1990-2000) and percentage of bound-ary shifts were relatively small (18 percent of all census tracts for 1980-1990 and 25 percent for 1990-2000) Furthermore the percentages of affected population were generally small espe-cially for the 1990-2000 boundary shifts (1980-1990 range 0 to 47 percent mean 23 percent
Tract Number
1980 Population
Density
1990 Population
Density
2000 Population
Density
Change 1980 to
2000
50101 3418 1700 1700 -503
50102 3418 2189 1556 -545
50305 1797 8422 5589 2100
50408 1418 3733 3456 1437
50410 1418 3311 2511 771
50509 2608 1544 1467 -438
50601 2063 989 1500 -273
50705 1139 1044 1356 191
50706 2418 3089 2300 -49
Table 2 Dasymetric population density selected census tracts Gwinnett County Georgia 1980-2000
Affected Census Tracts Census YearsDasymetric Method
()
Tract Comparability
Relationship Files
()
Difference
(absolute)
107 1980-1990 0 0 0
21805 1980-1990 33 35 2
230 1980-1990 40 53 13
31204 1980-1990 8 4 4
31403 1980-1990 0 2 2
80798 1980-1990 22 22 0
1701 1980-1990 0 0 0
1702 1980-1990 10 17 7
1703 1980-1990 23 31 8
57 1990-2000 25 11 14
9401 1990-2000 4 2 2
11202 1990-2000 3 5 2
201 1990-2000 18 18 0
23415 1990-2000 4 0 4
30504 1990-2000 3 2 1
31112 1990-2000 9 7 2
40302 1990-2000 4 1 3
40304 1990-2000 5 3 2
40407 1990-2000 9 16 7
50106 1990-2000 3 0 3
50718 1990-2000 2 1 1
80301 1990-2000 9 4 5
80401 1990-2000 1 1 0
140303 1990-2000 4 2 2
Table 3 Comparison of percentages of affected population from census tract boundary shifts dasymetric method versus
Tract ComparabilityRelationship Files
Del
iver
ed b
y P
ublis
hing
Tec
hnol
ogy
to U
nive
rsity
of C
alga
ry IP
95
258
914
8 on
Sat
14
Jul 2
012
041
326
Cop
yrig
ht (
c) C
arto
grap
hy a
nd G
eogr
aphi
c In
form
atio
n S
ocie
ty A
ll rig
hts
rese
rved
116 Cartography and Geographic Information Science
Figure 6 Population density a) 1990 dasymetric population density
Del
iver
ed b
y P
ublis
hing
Tec
hnol
ogy
to U
nive
rsity
of C
alga
ry IP
95
258
914
8 on
Sat
14
Jul 2
012
041
326
Cop
yrig
ht (
c) C
arto
grap
hy a
nd G
eogr
aphi
c In
form
atio
n S
ocie
ty A
ll rig
hts
rese
rved
Vol 31 No 2 117
Figure 6 Population density b) 1990 choroplethic population density
Del
iver
ed b
y P
ublis
hing
Tec
hnol
ogy
to U
nive
rsity
of C
alga
ry IP
95
258
914
8 on
Sat
14
Jul 2
012
041
326
Cop
yrig
ht (
c) C
arto
grap
hy a
nd G
eogr
aphi
c In
form
atio
n S
ocie
ty A
ll rig
hts
rese
rved
118 Cartography and Geographic Information Science
median 265 percent and 1990-2000 range 0 to 18 percent mean 65 percent median 5 percent) Therefore the impact of census tract boundary shifts on the dataset was modest
We checked the accuracy of the dasymetrically derived areal interpolation weights against popu-lation-based percentage changes from the Tract Comparability and Relationship Files The per-centages of affected population determined by the dasymetric method and the Tract Comparability and Relationship Files are shown in Table 3 The mean absolute difference between the two methods is 365 percent with a range of 0 to 14 percent and a median of 2 percent Except for two outliers (tracts 230 and 57) the dasymetric method worked satisfactorily
Conclusion
In this paper we reported on our use of satellite-derived ancillary land-useland-cover data to map population densities using the dasymetric method The dasymetric method accounts for the spatial distribution of population within administrative areas yielding more precise population density estimates than the choroplethic method while graphically representing the geographic distri-bution of populations We presented dasymetric population density maps for 1980 1990 and 2000 for a rapidly growing 13-county area in met-ropolitan Atlanta Georgia These maps revealed more realistically the intra-county variations in population density and the urban sprawl growth characteristics than the conventional choroplethic method
We also used the ancillary land-useland-cover data to derive adjustment weights for census data at the census tract level where census tract bound-ary shifts made temporal data comparisons difficult By determining the percentages of residential areas affected by census tract boundary shifts we were able to re-weight the census data to estimate the census data in terms of the 1990 census tract boundaries making it possible to represent three years of census data (1980 1990 and 2000) in one set of common census tracts (1990) Accuracy assessment of the dasy-metrically derived adjustment weights indicated a satisfactory level of accuracy Dasymetrically derived areal interpolation weights can be applied to any type of geographic boundary re-aggregation such as from census tracts to zip code tabulation areas from census tracts to local school districts from zip code areas to telephone exchange prefix areas and for electoral redistricting
ACKNOWLEDGEMENTSThe authors wish to thank three anonymous reviewers for their insightful comments and sug-gestions which have greatly improved the content of this paper
REFERENCESAnderson JR EE Hardy JT Roach and RE Witmer
1976 A Land-useland-cover classification system for use with remote sensor data Washington DC United States Government Printing Office
Eicher CL and CA Brewer 2001 Dasymetric mapping and areal interpolation Implementation and evalu-ation Cartography and Geographic Information Science 28(2) 125-38
Fisher PF and M Langford 1995 Modeling the errors in areal interpolation between zonal systems by Monte Carlo Simulation Environment and Planning A 27 211-24
Fisher PF and M Langford 1996 Modeling sensitiv-ity to accuracy in classified imagery A study of areal interpolation by dasymetric mapping Professional Geographer 48(3) 299-309
Gotway CA and LJ Young 2002 Combining incom-patible spatial data Journal of the American Statistical Association 97(458) 632-48
Holloway SR J Schumacher and R Redmond 1996 People and place Dasymetric mapping using ArcInfo Wildlife Spatial Analysis Lab University of Montana Missoula Montana
Holt JB 2003 The use of a geographic information system (GIS) and satellite remote sensing for small-area mortality analysis PhD Dissertation University of Georgia Athens Georgia
Jensen JR 1996 Introductory digital image processing A remote sensing perspective Upper Saddle River New Jersey Prentice-Hall Inc
Langford M DJ Maguire and DJ Unwin 1991 The areal interpolation problem Estimating population using remote sensing in a GIS framework In Masser I and M Blakemore (eds) Handling geographical infor-mation Methodology and potential applications London Longman pp 55-77
Langford M and DJ Unwin 1994 Generating and mapping population density surfaces within a geographical information system The Cartographic Journal 31 21-6
Langford M 2003 Refining methods for dasymetric mapping using satellite remote sensing In Mesev V (ed) Remotely sensed cities New York New York Taylor amp Francis pp 137-56
Martin D 1989 Mapping population data from zone centroid locations Transactions of the Institute of British Geographers 14 90-7
Martin D 1996 An assessment of surface and zonal models of population International Journal of Geographical Information Systems 10(8) 973-89
Martin D D Dorling and R Mitchell 2002 Linking censuses through time Problems and solutions Area 34(1) 82-91
Del
iver
ed b
y P
ublis
hing
Tec
hnol
ogy
to U
nive
rsity
of C
alga
ry IP
95
258
914
8 on
Sat
14
Jul 2
012
041
326
Cop
yrig
ht (
c) C
arto
grap
hy a
nd G
eogr
aphi
c In
form
atio
n S
ocie
ty A
ll rig
hts
rese
rved
120 Cartography and Geographic Information Science
Figure 7 Urban sprawl by 1990 census tract Gwinnett County Georgia 1980-2000
Del
iver
ed b
y P
ublis
hing
Tec
hnol
ogy
to U
nive
rsity
of C
alga
ry IP
95
258
914
8 on
Sat
14
Jul 2
012
041
326
Cop
yrig
ht (
c) C
arto
grap
hy a
nd G
eogr
aphi
c In
form
atio
n S
ocie
ty A
ll rig
hts
rese
rved
Openshaw S 1984 The modifiable areal unit problem CATMOG 38 Norwich UK Geo Books
Socioeconomic Data and Applications Center (SEDAC) 2003 Census Tract Comparability Files Columbia University New York City [wwwsedacciesenorg accessed February 8 2003]
Tobler WR 1979 Smooth pycnophylactic interpola-tion for geographical regions Journal of the American Statistical Association 74(367) 519-30
US Census Bureau 2002 Census Tract Relationship Files Washington DC [wwwcensusgovgeowwwrelaterel_tracthtml accessed February 7 2003]
US Department of Transportation 2002 National Transportation Atlas Database 2002 Bureau of Transportation Statistics Washington DC
Wright JK 1936 A method of mapping densities of population With Cape Cod as an example The Geographical Review 26 103-110
Yuan Y RM Smith and WF Limp 1998 Remodeling census population with spatial information from LandsatTM imagery Computers Environmental and Urban Systems 21(3-4) 245-58

Del
iver
ed b
y P
ublis
hing
Tec
hnol
ogy
to U
nive
rsity
of C
alga
ry IP
95
258
914
8 on
Sat
14
Jul 2
012
041
326
Cop
yrig
ht (
c) C
arto
grap
hy a
nd G
eogr
aphi
c In
form
atio
n S
ocie
ty A
ll rig
hts
rese
rved
104 Cartography and Geographic Information Science
tion yields positive values for population density at all locations1 The traditional manner of computing population density overestimates population density in unpopulated and sparsely populated areas and it underestimates population density in more-densely populated areas
Dasymetric mapping like choroplethic mapping is an area-based cartographic technique The major difference is that choropleth maps are based upon existing administrative boundaries that are indepen-dent of the phenomena to be mapped whereas in dasymetric maps the boundaries of the phenomenonrsquos distribution are revealed In dasymetric mapping the original administrative areas (or source zones) are divided into smaller spatial units onto which the socio-demographic variable of interest (eg population) is averaged to obtain a rate such as population density These smaller spatial units are areas estimated to contain population usually through the application of ancillary land-use data often acquired through classification of remotely sensed satellite images This technique is based on an explicit recognition of the fact that certain areas within an administrative area are populated while others are not (Wright 1936)2 The smaller spatial units used in dasymetric mapping have greater interval consistency (ie less variation) in the density of the variable being mapped Although some internal variation will remain it will be less than in a choroplethic map
Dasymetric mapping is also vulnerable to the MAUP and it still results in abrupt transitions at zonal boundaries However with dasymetric map-ping these transitions are a better reflection of the true underlying geography of the area than the transitions in choroplethic maps which are artifacts partially attributable to the arbitrary delineation of areal boundaries (Langford 2003)
This limitation of dasymetric mapping is offset by the techniquersquos better visualizations of population patterns due to the high degree of spatial disag-gregation that can be achieved especially if high spatial resolution satellite imagery is used as the basis for ancillary land-use data The technique also offers more precise estimates of population
density for use in analytical procedures such as areal interpolation (discussed below)3 Fisher and Langford (1995) have shown that the use of dasy-metric population densities result in highly accurate areally interpolated data estimates4
Areal interpolation is closely related to dasymetric mapping of population densities Areal interpo-lation (also called cross-area estimation) involves the transformation of data from one areal unit or zonation to another (Fisher and Langford 1996) Areal interpolation can be accomplished through simple areal weighting pycnophylactic interpola-tion (Tobler 1979) population-weighted centroids with a distance decay function (Martin 1989 1996) a regression-based modeling approach (Langford et al 1991 Yuan et al 1998) or dasymetric map-ping techniques (Langford and Unwin 1994 Eicher and Brewer 2001 Fisher and Langford 1995 1996 Langford 2003)5
Data are often collected and reported by admin-istrative areas that are either designed for the con-venience of data collection (but are not necessarily meaningful for analysis) or that change over time (Martin et al 2002) limiting temporal analyses of a particular phenomenon In these situations it may be desirable to represent the same data in dif-ferent administrative units (eg in census tracts in lieu of zip codes) In other situations data for some variables may be reported in one type of areal unit while other data variables are reported in another perhaps incompatible type of areal unit In such situations data sets should be normalized to the same type of compatible areal unit through areal interpolation
Objectives
This paper describes our efforts to derive dasy-metric population densities for areally interpolat-ing census tract level data from 1980 1990 and 2000 to a common set of census tract boundaries The areal interpolation was necessary in order to examine temporal trends in socioeconomic data These efforts were part of a larger research project (Holt 2003) that examined the association
1 This applies only to areal units that are populated An example of an exception to this statement is a census block which is unpopulated
and hence has a population density of zero 2 Wright (1936) notes that the name ldquodasymetricrdquo map meaning ldquodensity measuringrdquo (Wright p 104) originated in Russia although Wright
does not give a citation for that information It can be assumed therefore that Wright was not the first person to develop the concept
of the dasymetric map rather he was the first to publish an article on dasymetric maps in an English-language journal 3 Holloway et al (1996) argue that dasymetric mapping can be applied to other socioeconomic variables such as race religion income etc4 Crampton (2004) presents a detailed historical overview and conceptual comparison of choroplethic and dasymetric maps and argues for increased
usage of dasymetric maps5 Gotway and Young (2002) present an in-depth discussion of incompatible spatial data and methodologies for integrating spatially dis-
parate data
Del
iver
ed b
y P
ublis
hing
Tec
hnol
ogy
to U
nive
rsity
of C
alga
ry IP
95
258
914
8 on
Sat
14
Jul 2
012
041
326
Cop
yrig
ht (
c) C
arto
grap
hy a
nd G
eogr
aphi
c In
form
atio
n S
ocie
ty A
ll rig
hts
rese
rved
Vol 31 No 2 105
Figure 1 Metropolitan Atlanta study area a) County boundaries b) 1980 Census tract boundaries c) 1990 Census tract
boundaries and d) 2000 Census tract boundaries
a) b)
c) d)
Del
iver
ed b
y P
ublis
hing
Tec
hnol
ogy
to U
nive
rsity
of C
alga
ry IP
95
258
914
8 on
Sat
14
Jul 2
012
041
326
Cop
yrig
ht (
c) C
arto
grap
hy a
nd G
eogr
aphi
c In
form
atio
n S
ocie
ty A
ll rig
hts
rese
rved
106 Cartography and Geographic Information Science
between tract-level socioeconomic characteristics and health outcomes for the 13-county Atlanta Georgia metropolitan area (Figure 1a) In 1980 the 13-county Metropolitan Atlanta area was com-prised of 339 census tracts (Figure 1b) in 1990 this increased to 444 census tracts (Figure 1c) and in 2000 to 589 census tracts (Figure 1d) an increase of 74 percent
In many cases the new census tracts were created by simply splitting existing tracts in some cases the creation of new tracts involved minor adjustments to existing tract boundaries Even when new tracts were not created the boundaries between many adjacent tracts shifted The focus of the research presented here is on the practical application of dasymetric population density estimation and areal interpolation to facilitate small-area analyses spe-cifically for those situations where administrative boundaries (eg census tracts) have changed over time and data collected for an area at one point in time are not compatible with data collected for the same area at a later point in time due to changes in census tract boundaries
Data
We obtained satellite imagery of the 13 counties in the metropolitan Atlanta region from the US Geological Survey EROS Data Center for 1984 LT5019036037084172 Landsat 5 Thematic Mapper Path 019 Rows 036-037 [with 50 percent offset] acquired on June 20 1984) 1990 (Scene ID LT5019036037090268 Landsat 5 Thematic Mapper Path 019 Rows 036-037 [with 50 percent offset] acquired on September 25 1990) and 2000 (Scene ID L71019036-03620000928 Path 019 Row 036 acquired on September 28 2000 and Scene ID L71019037-03720000928 Path 019 Row 037 acquired on September 28 2000) We used these satellite images to derive land-useland-cover data for 1984 1990 and 2000
We used color infrared digital orthophoto quad-rangles of metropolitan Atlanta (February 1999) to ground truth the satellite-derived land-useland-cover data for 2000 We used black-and-white and color aerial photographs of portions of the metropolitan Atlanta area (particularly Gwinnett County 1988 and 1989) to ground truth the satellite-derived land-useland-cover data for 1990 We obtained road network data from the National Transportation Atlas Database (US Department of Transportation 2002) to assist in classifying land useland cover
We obtained county boundary files from the Digital Environmental Atlas of Georgia Version 2 published jointly by the Georgia Geologic Survey
and the US Geological Survey We obtained census tract boundary files from the US Census Bureau for 1990 and 2000 For 1980 we obtained census tract boundaries from Geolytics Inc which created the census tract boundaries based on Census TIGERLine Files (no longer downloadable for 1980 from the Census Bureau) We manually edited the 1980 Geolytics census tract boundaries in a GIS (ArcGIS 82 Environmental Systems Research Institute Redlands California) to remove small polygons corresponding to small-to-large bodies of water
We obtained US Census Long Form (SF-3) data for 1980 1990 and 2000 from Geolytics Inc We used selected original variables from the SF-3 as well as user-derived variables from the SF-3 data
Methodology
For the Atlanta study (Holt 2003) it was necessary to normalize all census data for 1980 1990 and 2000 to 1990 census tract boundaries as the anal-ysis addressed variables representing the social environment in 1990 and the potential health outcomes in the late 1990s Additional variables were added to that analysis namely the changes in the social environment from 1980 to 2000 To add these change variables to the existing 1990 variables it was necessary to use consistent census tract boundaries and we chose the 1990 boundar-ies Because we used 1990 boundaries we needed to account for census tract boundary changes by weighting the census data for 1980 and 2000 We accomplished this through areal interpolation based on dasymetric mapping of the population
Dasymetric Determination
of Population Densities
The basic procedure that we used in this project is similar to the binary dasymetric procedure described by Langford and Unwin (1994) and Fisher and Langford (1995 and 1996) The binary dasymetric procedure utilizes ancillary land-useland-cover data to differentiate populated and unpopulated areas Our ancillary land-useland-cover data were derived from a computer-assisted manual pixel-based classification of remotely sensed satellite data An example of the land-useland-cover data is in Figure 2 which depicts Gwinnett County in 1990 Figure 3 depicts popu-lated (low-density urban) areas and unpopulated areas (all other categories)
We overlaid the raster format land-useland-cover map in binary form (populated versus unpopulated) with a census tract boundary file which we had trans-
Del
iver
ed b
y P
ublis
hing
Tec
hnol
ogy
to U
nive
rsity
of C
alga
ry IP
95
258
914
8 on
Sat
14
Jul 2
012
041
326
Cop
yrig
ht (
c) C
arto
grap
hy a
nd G
eogr
aphi
c In
form
atio
n S
ocie
ty A
ll rig
hts
rese
rved
Vol 31 No 2 107
formed from the original vector shapefile format into a raster file We determined the number of residential land-use pixels per census tract using the Summary function in ERDAS Imagine 86 (Leica Geosystems Inc Atlanta Georgia) we added these values as a separate attribute field in the census tract vector shapefile We merged the census tract shapefile with a database file of census tract population extracted from the Geolytics Long Form (SF-3) database We then determined the population per residentially occupied pixel per census tract by simple arith-metic calculation in ArcGIS 82 We mathematically transformed the areal unit of the land-use pixels (each representing an area 30 meters x 30 meters) into hectares and square kilometers The resulting statistics represented the dasymetrically derived population density for each census tract We used this basic methodology to determine population density in 1980 1990 and 2000 For each year we implemented the dasymetric process in the GIS slightly differently because we needed to express the population densities in terms of the 1990 census tract boundaries In addition for 1980 and 2000 we used the dasymetric procedure as the basis for areal interpolation of census-derived data to 1990 census tract boundaries6
1990 Population Density in 1990 Census
Tract Boundaries
For the 1990 data we only needed to compute census tract population densities areal interpola-tion of 1990 census data was not necessary because we used 1990 census tract boundaries To compute the 1990 population densities we derived ancillary data from the unsupervised classification of a 1990 Landsat Thematic MapperTM satellite image with a scene acquisition date of September 25 1990 We classified the image with ERDAS Imagine 86 using the Iterative Self-Organizing Data Analysis Technique (ISODATA) unsupervised classification approach In an ISODATA classification satellite imagery pixels with similar spectral properties are grouped into a user-determined number of clusters This clustering is achieved through a computerized search for natural groupings of the pixelsrsquo spectral properties based on their dis-tances in multispectral feature space defined by the spectral bands of the image data (ie a cluster analysis) The analyst manually assigns these spectral classes a posteriori to information classes of interest such
as land-useland-cover categories (Jensen 1996) Overall accuracy for the ISODATA classification was 9294 percent Producerrsquos accuracy and userrsquos accuracy for the Low-Density Urban category (which is associated with residential land use) were 9692 percent and 8750 percent respectively In addition the overall Kappa index of agreement was 09124 and the conditional Kappa for the Low-Density Urban category was 08524 Thus our classification accuracies exceeded the com-monly accepted minimum thresholds for remotely sensed data (Anderson et al 1976) as well as the threshold necessary to ensure robustness to clas-sification error of the binary dasymetric technique (Fisher and Langford 1996)
We determined dasymetric population density for 1990 using the basic procedure described above For example census tract 50102 in northwestern Gwinnett County contained 4413 residential pixels and its 1990 population was 8684 We divided the tract population by the number of residential pixels yielding a dasymetric density of 197 people per pixel which translates to 218889 people per square kilometer
1980 and 2000 Population Densities
in 1990 Census Tract Boundaries
For the 1980 and 2000 data we computed census tract population densities expressed in terms of the 1990 census tract boundaries This involved modifying the basic procedure that we used to determine 1990 population density Essentially we first determined the population densities for 1980 in terms of the 1980 census tract boundar-ies and the population densities for 2000 in terms of the 2000 census tract boundaries We then re-expressed the 1980 and 2000 population densities in terms of the 1990 census tract boundaries
To compute the 1980 population densities we used a June 20 1984 LandsatTM scene to derive the ancillary data on residential land-use extent in 1980 The 1984 satellite image is a compromise because no satellite image with compatible spatial resolu-tion (30 meters) is available for 1980 Although we obtained a LandsatTM image from December 1982 we did not use it because of its poor radiometric contrast and because it was taken in the winter while the 1990 and 2000 images were taken in the summer We classified the 1984 image in the same manner as the 1990 image We did not conduct an accuracy assessment due to the lack of suitable ground truth
6 The 1990 census tract boundaries were selected because the 1980 1990 and 2000 population density values and their rates of change
were used as independent variables in the larger Atlanta mortality study (Holt 2003) in which mortality rates were expressed in terms
of 1990 census tracts
Del
iver
ed b
y P
ublis
hing
Tec
hnol
ogy
to U
nive
rsity
of C
alga
ry IP
95
258
914
8 on
Sat
14
Jul 2
012
041
326
Cop
yrig
ht (
c) C
arto
grap
hy a
nd G
eogr
aphi
c In
form
atio
n S
ocie
ty A
ll rig
hts
rese
rved
108 Cartography and Geographic Information Science
Figure 2 Land useland cover Gwinnett County Georgia 1990
Del
iver
ed b
y P
ublis
hing
Tec
hnol
ogy
to U
nive
rsity
of C
alga
ry IP
95
258
914
8 on
Sat
14
Jul 2
012
041
326
Cop
yrig
ht (
c) C
arto
grap
hy a
nd G
eogr
aphi
c In
form
atio
n S
ocie
ty A
ll rig
hts
rese
rved
Vol 31 No 2 109
Figure 3 Residential land use Gwinnett County Georgia 1990
Del
iver
ed b
y P
ublis
hing
Tec
hnol
ogy
to U
nive
rsity
of C
alga
ry IP
95
258
914
8 on
Sat
14
Jul 2
012
041
326
Cop
yrig
ht (
c) C
arto
grap
hy a
nd G
eogr
aphi
c In
form
atio
n S
ocie
ty A
ll rig
hts
rese
rved
110 Cartography and Geographic Information Science
data However because the image is of the same type and from the same satellite as the 1990 image and because we used the same classification technique the classification accuracies should be similar to those of the 1990 image Furthermore the classification accuracy probably exceeds the minimum 60 percent threshold determined by Fisher and Langford (1996) to be necessary for ensuring robustness to error of the binary dasymetric procedure
Once we determined the extent of Low-Density Urban (eg residential) land use we converted the land-useland-cover map into a binary map of residential versus non-residential pixels similar to the 1990 land-useland-cover map We overlaid the 1984 binary map with a rasterized map of 1980 census tract boundaries and using the Summary function in ERDAS Imagine 86 determined the number of residential pixels per census tracts We entered these values as a separate attribute field in the 1980 census tract vector shapefile which we merged with a database file containing 1980 tract populations We computed population densities for 1980 using 1980 boundaries by arithmetic opera-tion in ArcGIS 82
Expressing the 1980 population densities in terms of the 1990 census tract boundaries required addi-tional processing We combined the 1984 binary land-useland-cover map with the 1980 census tract vector shapefile using the Matrix operation in ERDAS Imagine 86 This essentially recoded the land-use mapsrsquo individual pixel values (formerly binary 0 and 1) to values representing the tract level population densities corresponding to each pixelrsquos census tract7 We then combined the rasterized 1990 census tracts with the recoded land-use map using the Summary function in Imagine and exported a data file containing the number of pixels of each attribute (density) for each 1990 census tract
Each census tract that experienced no boundary changes from 1980 to 1990 contained only one sum-mary number of pixels with an associated population density value Census tracts that experienced boundary changes contained more than one summary number of pixels each with its own associated population density values For both types of census tracts we calculated the 1980 population density values in terms of the 1990 census tract boundaries based on the number of pixels and their corresponding density values We merged the Excel file converted to a database file with the 1990 census tract vector shapefile this added the 1980 dasymetric popula-
tion density values as a separate attribute field in the 1990 shapefile
For the 2000 population densities calculations we used the same procedure We derived the 2000 ancillary land-useland-cover data from the ISODATA classification of a September 28 2000 Landsat 7 ETM+ scene with an overall classification accuracy of 9012 percent Producerrsquos and userrsquos accuracy for the Low-Density Urban category were 9344 percent and 8769 percent respectively In addition the overall Kappa index of agreement was 08759 and the conditional Kappa for the Low-Density Urban category was 08563 As with the 1990 ancillary data the 2000 data exceeded the minimum thresholds for classification accuracy
Areal Interpolation of Census Data
We used a form of areal interpolation to disaggre-gate the 1980 and 2000 census-derived data from their original tract boundaries and to re-aggregate these data into the 1990 census tract boundaries In the greater Atlanta area some census tracts were split into two or more constituent tracts between 1980 and 2000 the boundaries of some census tracts with neighboring tracts shifted and some tracts were both split and had their bound-aries changed (Figure 4) Most of the census tract changes between 1980 and 2000 involved split census tracts many of which were due to the rapid population growth in suburban Atlanta during this period
The basic procedure for areal interpolation we used was to determine where changes occurred to census tract boundaries from 1980 to 1990 and from 1990 to 2000 We then determined the percent-age of populated areas affected by those boundary changes in each affected census tract developed weights based on the percentage of affected popu-lated areas and applied the weights to 1980 and 2000 census-derived data to obtain estimates of the census data for 1980 and 2000 in terms of the 1990 census tract boundaries
We determined census tract boundary changes from 1980 to 1990 using Tract Comparability Files (Socioeconomic Data and Applications Center 2003) We used Tract Relationship Files (US Census Bureau 2002) to determine census tract boundary changes from 1990 to 2000 The Census Tract Comparability and Relationship Files list census tracts that experi-enced a significant change (25 percent of land area or greater) from one decennial census to the next
7 Because raster pixel values must be integers we first multiplied the population densities by 100 in the vector shapefile We used these
ldquopseudo-densitiesrdquo for the remaining steps of the procedure Once we completed the procedure we divided the pseudo-values by 100
to obtain the density values expressed in the original decimal format
Del
iver
ed b
y P
ublis
hing
Tec
hnol
ogy
to U
nive
rsity
of C
alga
ry IP
95
258
914
8 on
Sat
14
Jul 2
012
041
326
Cop
yrig
ht (
c) C
arto
grap
hy a
nd G
eogr
aphi
c In
form
atio
n S
ocie
ty A
ll rig
hts
rese
rved
Vol 31 No 2 111
(US Census Bureau 2002) We also displayed 1980 1990 and 2000 census tract boundary shapefiles in a GIS (ArcGIS 82) and confirmed differences in tract boundaries by visual inspection We cross-checked the results of the visual inspection of the GIS data with the information in the Census Tract Comparability and Relationship Files to identify the tract boundaries affected by changes and to develop a table of the nature of these changes
We calculated the percentages of populated areas affected by boundary changes in each affected tract by applying the ancillary land-useland-cover data we had derived to dasymetrically determine census tract population densities For boundary shifts from 1990 to 2000 we overlaid the 1990 and 2000 tract boundary shapefiles in a GIS (ArcGIS 82) We used the same process for the 1980 to 1990 tract boundary shifts We identified the land areas affected by tract boundary shifts by using the ldquoIntersectionrdquo opera-tion in ArcGIS and exporting each area as a unique shapefile We used ERDAS Imagine 86 to matrix each shapefile with a binary mask representing residential pixels and non-residential pixels We repeated this process for each intersection shapefile Summary reports from Imagine provided the numbers of resi-dential pixels contained in each intersection area For each boundary shift we divided the number of residential pixels in the shifted area by the number of residential pixels in the census tract to which the shifted area originally belonged using the attribute table of the 1990 tract boundary shapefile The resulting percentage represented the residential land-use area that shifted from the original census tract to the receiving census tract
We used the percentages of affected residential land use from the preceding step as interpola-tion weights for expressing the 2000 census data in terms of the 1990 census tract boundaries We accomplished this by multiplying the 2000 census data by the interpolation weights The step-by-step procedure for interpolating census data is illustrated in Figure 5 using DeKalb County census tracts 201 and 22401 as examples
In Figure 5a the portion of tract 201 that shifted to tract 22401 from 1990 to 2000 is highlighted by the cross-hatched area In Figure 5b the residential land-use pixels from 2000 are superimposed over the area of tracts 201 and 22401The number of residential land-use pixels in the portion of tract 201 that shifted to 22401 is 105 pixels the number of residential land-use pixels unaffected by the boundary shift is 484 pixels These numbers cor-respond to 18 percent and 82 percent of the total number of residential pixels (589) for the entire land area of tract 201 in 2000 These percentages
served as the dasymetric weights for the subsequent areal interpolation of the poverty data from their original 2000 boundaries to their 1990 boundaries Figure 5c depicts the population and poverty data for tracts 201 and 22401 in terms of the 2000 tract boundaries prior to areal interpolation Figure 5d illustrates the weighting of the data for tract 201 in accordance with the dasymetric weights of 82 percent and 18 percent Lastly Figure 5e shows the resulting census data for tracts 201 and 22401 after areal interpolation These data were obtained by subtracting the data corresponding to the cross-hatched area from tract 201 and adding these data to 22401
For census tract splits from 1980 to 1990 with no other shifts in tract boundaries areal interpolation was unnecessary Instead we assigned the census data for each 1980 census tract to its 1990 constitu-ent tracts For example Gwinnett Countyrsquos 1980 census tract 501 was split into tracts 50101 and 50102 for 1990 We assigned the census data values for 1980 tract 501 to each of the 1990 tracts In this manner the 1980 census data for 1980 tract 501 were expressed in terms of the 1990 census tract boundaries (tracts 50101 and 50102)
We handled census tract splits from 1990 to 2000 differently because we calculated our results based on the 1990 census tracts for our project We treated the 1990 to 2000 changes as though the 2000 census tracts had been ldquore-aggregatedrdquo back into their original 1990 census tracts For example if Gwinnett Countyrsquos 1990 census tract 50101 was split into two tracts for 2000 (tracts 50103 and 50104) the data for tracts 50103 and 50104 were aggregated and assigned to 1990 tract 50101 We aggregated the appropriate denominator data (eg total population) and the numerator data (eg total number of white population) for each of the 2000 tracts so that the resulting percentages could be computed for the aggregated tracts In this manner the 2000 census data for 2000 census tracts 50103 and 50104 were expressed in terms of the 1990 census tract 50101 boundaries
Results and Discussion
Population Density
In all 13 counties in the study area the census tract-level dasymetrically determined population densities exceeded the population densities com-puted with the choroplethic method Table 1 lists the 1990 choroplethic and dasymetric population densities for Gwinnett County Figure 6a depicts
Del
iver
ed b
y P
ublis
hing
Tec
hnol
ogy
to U
nive
rsity
of C
alga
ry IP
95
258
914
8 on
Sat
14
Jul 2
012
041
326
Cop
yrig
ht (
c) C
arto
grap
hy a
nd G
eogr
aphi
c In
form
atio
n S
ocie
ty A
ll rig
hts
rese
rved
112 Cartography and Geographic Information Science
the dasymetric popula-tion density for 1990 The different results provided by the dasymetric and choroplethic methods are illustrated in Figures 6a and 6b In both maps we assigned the data to five classes using the Jenksrsquo Optimal Breaks method A comparison of the two maps readily indicates dif-ferences in the outer coun-ties In particular all census tracts in Douglas Paulding Forsyth Rockdale Coweta Fayette Henry and (with one minor exception) Cherokee counties have the lowest class of population density in the choroplethic map suggesting broad homogeneity of census tract population density throughout the outer sub-urban fringe However the dasymetric map of popula-tion densities for the same counties depicts areas with higher population density within each county These generally correspond to county seats other small towns or especially in Paulding County areas of new higher-density hous-ing subdivisions Therefore the dasymetric map pro-vides more precision in dif-ferentiating areas of higher and lower population density within counties
To place these population densities in perspective if a given residential area is comprised of single-family housing units zoned for one-half acre lots there are approximately 48 housing units per hectare (2 housesacre x 24 acreshectare) As there are 100 hectares per square kilometer this translates to 480 housing units per square kilometer of residential area If one assumes a population-to-housing unit density of two persons per housing unit this would yield an estimated population density of 960 per-sons per square kilometer of residential area (480 housing units x 2 personshousing unit)
As a further comparison of these dasymetric population densities if the population densities
for tracts 50102 and 50202 had been calculated in the traditional manner of dividing each tractrsquos total population by its total land area their respec-tive densities would have been 24169 persons per square kilometer (8684 persons divide 3593 km2 total land area) and 5389 persons per square kilometer (3047 persons divide 5654 km2 total land area) While the ordinal ranking of the two tracts remains the same (tract 50102 is more densely populated than tract 50202) the relative difference in population density is dramatically different between the two methods of population density computation For the dasymetric method tract 50102 is roughly 25 times more densely populated than tract 50202 while for the traditional method tract 50102 is roughly 45 times more densely populated than tract 50202
Figure 4 Census tract boundaries north-central Gwinnett County 1990 and 2000
Del
iver
ed b
y P
ublis
hing
Tec
hnol
ogy
to U
nive
rsity
of C
alga
ry IP
95
258
914
8 on
Sat
14
Jul 2
012
041
326
Cop
yrig
ht (
c) C
arto
grap
hy a
nd G
eogr
aphi
c In
form
atio
n S
ocie
ty A
ll rig
hts
rese
rved
Vol 31 No 2 113
Figure 5 Areal interpolation using dasymetric weights
Del
iver
ed b
y P
ublis
hing
Tec
hnol
ogy
to U
nive
rsity
of C
alga
ry IP
95
258
914
8 on
Sat
14
Jul 2
012
041
326
Cop
yrig
ht (
c) C
arto
grap
hy a
nd G
eogr
aphi
c In
form
atio
n S
ocie
ty A
ll rig
hts
rese
rved
114 Cartography and Geographic Information Science
Therefore by not including unpopulated land areas in the calculations of population density the dasymetric method provides a more precise measure of population density within residential areas and the variation in population density among tracts can be substantial8
Unlike choroplethic maps dasymetric maps show which areas are unpopulated This is especially evi-dent in the outer counties which have large areas of non-residential land-use This trait of the dasymetric map makes it suitable for visually depicting tempo-ral changes to the landscape Although dasymetric maps provide more spatial precision in mapping population density than choroplethic maps they are subject to the same scale and aggregation effects as choroplethic maps
If the same census tract boundaries are maintained from one census to the next and the population increases with no increase in residential land-use area then the population density will increase But if residential land-use area increases the popula-tion density will increase or decrease depending on the relative magnitudes of the population and land-use area changes For this reason some census tracts in the suburban fringe counties experienced population increases concurrent with decreases in dasymetric population density while other tracts with population increases experienced increases in dasymetric population density
For example census tract 1707 in central Coweta experienced an increase in population from 6458 in 1990 to 7139 in 2000 (an increase of 105 percent) and an increase in residential land-use from 404 km2 to 510 km2 (an increase of 262 percent) The result-
ing dasymetric population density decreased from1 600 personskm2 to 1400 personskm2 When this change is analyzed with the choroplethic method of calculating population density the opposite happens a 1990 density of 29 personskm2 (6458 persons divide 22226 km2 of total land area) and a 2000 density of 32 personskm2 (7139 persons divide 22226 km2 of total land area) indicate an increase in popula-tion density from 1990 to 2000 For tract 1707 the decrease in dasymetric population density is prob-ably attributable to new residents (after 1990) living in newly constructed single-family houses built on relatively large lots (eg one acre or greater)
An example of a dasymetric population density increase is census tract 1205 in southeastern Paulding County Its population increased from 6809 to 14425 from 1990 to 2000 (an increase of 1119 percent) while its residential land-use area increased from 547 km2 to 889 km2 (an increase of 625 percent) While population and residential land-use area grew substantially population growth exceeded residential land-use growth This may be attributable to the construction of single-family houses on relatively smaller lots the construction of multi-family housing units an influx of families with multiple children or a combination of these factors
Tract-level dasymetric population densities for Gwinnett County in 1980 1990 and 2000 are listed in Table 2 The tracts with increasing population and decreasing population density probably experienced urban sprawl during this period The dasymetric mapping process can measure this at the tract level but choroplethic techniques cannot account for such
Table1 Population densities choroplethic versus dasymetric selected census tracts Gwinnett County Georgia 1990
Tract Number 1990 PopulationChoroplethic Population Density
(persons per square kilometer)
Dasymetric Population Density
(persons per square kilometer)
50101 8142 127 1700
50102 8684 242 2189
50305 9605 1913 8422
50408 10986 1372 3733
50410 4767 788 3311
50509 5231 153 1544
50601 8937 73 989
50705 6529 87 1044
50706 10425 673 3089
8 For the 1990 population data across the entire study area the mean dasymetric population density is 4085 personskm2 (sd=4764)
the mean choroplethic population density is 906 personskm2 (sd=925)
Del
iver
ed b
y P
ublis
hing
Tec
hnol
ogy
to U
nive
rsity
of C
alga
ry IP
95
258
914
8 on
Sat
14
Jul 2
012
041
326
Cop
yrig
ht (
c) C
arto
grap
hy a
nd G
eogr
aphi
c In
form
atio
n S
ocie
ty A
ll rig
hts
rese
rved
Vol 31 No 2 115
changes in residential land use within tracts Thus dasymetric mapping can pinpoint areas of urban sprawl (Figure 7) such as tracts made accessible by multi-lane expressways
Areal Interpolation of Census Data
We areally interpolated census data for 1980 and 2000 when boundary shifts occurred from one
census to the next The number (8 for 1980-1990 and 15 for 1990-2000) and percentage of bound-ary shifts were relatively small (18 percent of all census tracts for 1980-1990 and 25 percent for 1990-2000) Furthermore the percentages of affected population were generally small espe-cially for the 1990-2000 boundary shifts (1980-1990 range 0 to 47 percent mean 23 percent
Tract Number
1980 Population
Density
1990 Population
Density
2000 Population
Density
Change 1980 to
2000
50101 3418 1700 1700 -503
50102 3418 2189 1556 -545
50305 1797 8422 5589 2100
50408 1418 3733 3456 1437
50410 1418 3311 2511 771
50509 2608 1544 1467 -438
50601 2063 989 1500 -273
50705 1139 1044 1356 191
50706 2418 3089 2300 -49
Table 2 Dasymetric population density selected census tracts Gwinnett County Georgia 1980-2000
Affected Census Tracts Census YearsDasymetric Method
()
Tract Comparability
Relationship Files
()
Difference
(absolute)
107 1980-1990 0 0 0
21805 1980-1990 33 35 2
230 1980-1990 40 53 13
31204 1980-1990 8 4 4
31403 1980-1990 0 2 2
80798 1980-1990 22 22 0
1701 1980-1990 0 0 0
1702 1980-1990 10 17 7
1703 1980-1990 23 31 8
57 1990-2000 25 11 14
9401 1990-2000 4 2 2
11202 1990-2000 3 5 2
201 1990-2000 18 18 0
23415 1990-2000 4 0 4
30504 1990-2000 3 2 1
31112 1990-2000 9 7 2
40302 1990-2000 4 1 3
40304 1990-2000 5 3 2
40407 1990-2000 9 16 7
50106 1990-2000 3 0 3
50718 1990-2000 2 1 1
80301 1990-2000 9 4 5
80401 1990-2000 1 1 0
140303 1990-2000 4 2 2
Table 3 Comparison of percentages of affected population from census tract boundary shifts dasymetric method versus
Tract ComparabilityRelationship Files
Del
iver
ed b
y P
ublis
hing
Tec
hnol
ogy
to U
nive
rsity
of C
alga
ry IP
95
258
914
8 on
Sat
14
Jul 2
012
041
326
Cop
yrig
ht (
c) C
arto
grap
hy a
nd G
eogr
aphi
c In
form
atio
n S
ocie
ty A
ll rig
hts
rese
rved
116 Cartography and Geographic Information Science
Figure 6 Population density a) 1990 dasymetric population density
Del
iver
ed b
y P
ublis
hing
Tec
hnol
ogy
to U
nive
rsity
of C
alga
ry IP
95
258
914
8 on
Sat
14
Jul 2
012
041
326
Cop
yrig
ht (
c) C
arto
grap
hy a
nd G
eogr
aphi
c In
form
atio
n S
ocie
ty A
ll rig
hts
rese
rved
Vol 31 No 2 117
Figure 6 Population density b) 1990 choroplethic population density
Del
iver
ed b
y P
ublis
hing
Tec
hnol
ogy
to U
nive
rsity
of C
alga
ry IP
95
258
914
8 on
Sat
14
Jul 2
012
041
326
Cop
yrig
ht (
c) C
arto
grap
hy a
nd G
eogr
aphi
c In
form
atio
n S
ocie
ty A
ll rig
hts
rese
rved
118 Cartography and Geographic Information Science
median 265 percent and 1990-2000 range 0 to 18 percent mean 65 percent median 5 percent) Therefore the impact of census tract boundary shifts on the dataset was modest
We checked the accuracy of the dasymetrically derived areal interpolation weights against popu-lation-based percentage changes from the Tract Comparability and Relationship Files The per-centages of affected population determined by the dasymetric method and the Tract Comparability and Relationship Files are shown in Table 3 The mean absolute difference between the two methods is 365 percent with a range of 0 to 14 percent and a median of 2 percent Except for two outliers (tracts 230 and 57) the dasymetric method worked satisfactorily
Conclusion
In this paper we reported on our use of satellite-derived ancillary land-useland-cover data to map population densities using the dasymetric method The dasymetric method accounts for the spatial distribution of population within administrative areas yielding more precise population density estimates than the choroplethic method while graphically representing the geographic distri-bution of populations We presented dasymetric population density maps for 1980 1990 and 2000 for a rapidly growing 13-county area in met-ropolitan Atlanta Georgia These maps revealed more realistically the intra-county variations in population density and the urban sprawl growth characteristics than the conventional choroplethic method
We also used the ancillary land-useland-cover data to derive adjustment weights for census data at the census tract level where census tract bound-ary shifts made temporal data comparisons difficult By determining the percentages of residential areas affected by census tract boundary shifts we were able to re-weight the census data to estimate the census data in terms of the 1990 census tract boundaries making it possible to represent three years of census data (1980 1990 and 2000) in one set of common census tracts (1990) Accuracy assessment of the dasy-metrically derived adjustment weights indicated a satisfactory level of accuracy Dasymetrically derived areal interpolation weights can be applied to any type of geographic boundary re-aggregation such as from census tracts to zip code tabulation areas from census tracts to local school districts from zip code areas to telephone exchange prefix areas and for electoral redistricting
ACKNOWLEDGEMENTSThe authors wish to thank three anonymous reviewers for their insightful comments and sug-gestions which have greatly improved the content of this paper
REFERENCESAnderson JR EE Hardy JT Roach and RE Witmer
1976 A Land-useland-cover classification system for use with remote sensor data Washington DC United States Government Printing Office
Eicher CL and CA Brewer 2001 Dasymetric mapping and areal interpolation Implementation and evalu-ation Cartography and Geographic Information Science 28(2) 125-38
Fisher PF and M Langford 1995 Modeling the errors in areal interpolation between zonal systems by Monte Carlo Simulation Environment and Planning A 27 211-24
Fisher PF and M Langford 1996 Modeling sensitiv-ity to accuracy in classified imagery A study of areal interpolation by dasymetric mapping Professional Geographer 48(3) 299-309
Gotway CA and LJ Young 2002 Combining incom-patible spatial data Journal of the American Statistical Association 97(458) 632-48
Holloway SR J Schumacher and R Redmond 1996 People and place Dasymetric mapping using ArcInfo Wildlife Spatial Analysis Lab University of Montana Missoula Montana
Holt JB 2003 The use of a geographic information system (GIS) and satellite remote sensing for small-area mortality analysis PhD Dissertation University of Georgia Athens Georgia
Jensen JR 1996 Introductory digital image processing A remote sensing perspective Upper Saddle River New Jersey Prentice-Hall Inc
Langford M DJ Maguire and DJ Unwin 1991 The areal interpolation problem Estimating population using remote sensing in a GIS framework In Masser I and M Blakemore (eds) Handling geographical infor-mation Methodology and potential applications London Longman pp 55-77
Langford M and DJ Unwin 1994 Generating and mapping population density surfaces within a geographical information system The Cartographic Journal 31 21-6
Langford M 2003 Refining methods for dasymetric mapping using satellite remote sensing In Mesev V (ed) Remotely sensed cities New York New York Taylor amp Francis pp 137-56
Martin D 1989 Mapping population data from zone centroid locations Transactions of the Institute of British Geographers 14 90-7
Martin D 1996 An assessment of surface and zonal models of population International Journal of Geographical Information Systems 10(8) 973-89
Martin D D Dorling and R Mitchell 2002 Linking censuses through time Problems and solutions Area 34(1) 82-91
Del
iver
ed b
y P
ublis
hing
Tec
hnol
ogy
to U
nive
rsity
of C
alga
ry IP
95
258
914
8 on
Sat
14
Jul 2
012
041
326
Cop
yrig
ht (
c) C
arto
grap
hy a
nd G
eogr
aphi
c In
form
atio
n S
ocie
ty A
ll rig
hts
rese
rved
120 Cartography and Geographic Information Science
Figure 7 Urban sprawl by 1990 census tract Gwinnett County Georgia 1980-2000
Del
iver
ed b
y P
ublis
hing
Tec
hnol
ogy
to U
nive
rsity
of C
alga
ry IP
95
258
914
8 on
Sat
14
Jul 2
012
041
326
Cop
yrig
ht (
c) C
arto
grap
hy a
nd G
eogr
aphi
c In
form
atio
n S
ocie
ty A
ll rig
hts
rese
rved
Openshaw S 1984 The modifiable areal unit problem CATMOG 38 Norwich UK Geo Books
Socioeconomic Data and Applications Center (SEDAC) 2003 Census Tract Comparability Files Columbia University New York City [wwwsedacciesenorg accessed February 8 2003]
Tobler WR 1979 Smooth pycnophylactic interpola-tion for geographical regions Journal of the American Statistical Association 74(367) 519-30
US Census Bureau 2002 Census Tract Relationship Files Washington DC [wwwcensusgovgeowwwrelaterel_tracthtml accessed February 7 2003]
US Department of Transportation 2002 National Transportation Atlas Database 2002 Bureau of Transportation Statistics Washington DC
Wright JK 1936 A method of mapping densities of population With Cape Cod as an example The Geographical Review 26 103-110
Yuan Y RM Smith and WF Limp 1998 Remodeling census population with spatial information from LandsatTM imagery Computers Environmental and Urban Systems 21(3-4) 245-58

Del
iver
ed b
y P
ublis
hing
Tec
hnol
ogy
to U
nive
rsity
of C
alga
ry IP
95
258
914
8 on
Sat
14
Jul 2
012
041
326
Cop
yrig
ht (
c) C
arto
grap
hy a
nd G
eogr
aphi
c In
form
atio
n S
ocie
ty A
ll rig
hts
rese
rved
Vol 31 No 2 105
Figure 1 Metropolitan Atlanta study area a) County boundaries b) 1980 Census tract boundaries c) 1990 Census tract
boundaries and d) 2000 Census tract boundaries
a) b)
c) d)
Del
iver
ed b
y P
ublis
hing
Tec
hnol
ogy
to U
nive
rsity
of C
alga
ry IP
95
258
914
8 on
Sat
14
Jul 2
012
041
326
Cop
yrig
ht (
c) C
arto
grap
hy a
nd G
eogr
aphi
c In
form
atio
n S
ocie
ty A
ll rig
hts
rese
rved
106 Cartography and Geographic Information Science
between tract-level socioeconomic characteristics and health outcomes for the 13-county Atlanta Georgia metropolitan area (Figure 1a) In 1980 the 13-county Metropolitan Atlanta area was com-prised of 339 census tracts (Figure 1b) in 1990 this increased to 444 census tracts (Figure 1c) and in 2000 to 589 census tracts (Figure 1d) an increase of 74 percent
In many cases the new census tracts were created by simply splitting existing tracts in some cases the creation of new tracts involved minor adjustments to existing tract boundaries Even when new tracts were not created the boundaries between many adjacent tracts shifted The focus of the research presented here is on the practical application of dasymetric population density estimation and areal interpolation to facilitate small-area analyses spe-cifically for those situations where administrative boundaries (eg census tracts) have changed over time and data collected for an area at one point in time are not compatible with data collected for the same area at a later point in time due to changes in census tract boundaries
Data
We obtained satellite imagery of the 13 counties in the metropolitan Atlanta region from the US Geological Survey EROS Data Center for 1984 LT5019036037084172 Landsat 5 Thematic Mapper Path 019 Rows 036-037 [with 50 percent offset] acquired on June 20 1984) 1990 (Scene ID LT5019036037090268 Landsat 5 Thematic Mapper Path 019 Rows 036-037 [with 50 percent offset] acquired on September 25 1990) and 2000 (Scene ID L71019036-03620000928 Path 019 Row 036 acquired on September 28 2000 and Scene ID L71019037-03720000928 Path 019 Row 037 acquired on September 28 2000) We used these satellite images to derive land-useland-cover data for 1984 1990 and 2000
We used color infrared digital orthophoto quad-rangles of metropolitan Atlanta (February 1999) to ground truth the satellite-derived land-useland-cover data for 2000 We used black-and-white and color aerial photographs of portions of the metropolitan Atlanta area (particularly Gwinnett County 1988 and 1989) to ground truth the satellite-derived land-useland-cover data for 1990 We obtained road network data from the National Transportation Atlas Database (US Department of Transportation 2002) to assist in classifying land useland cover
We obtained county boundary files from the Digital Environmental Atlas of Georgia Version 2 published jointly by the Georgia Geologic Survey
and the US Geological Survey We obtained census tract boundary files from the US Census Bureau for 1990 and 2000 For 1980 we obtained census tract boundaries from Geolytics Inc which created the census tract boundaries based on Census TIGERLine Files (no longer downloadable for 1980 from the Census Bureau) We manually edited the 1980 Geolytics census tract boundaries in a GIS (ArcGIS 82 Environmental Systems Research Institute Redlands California) to remove small polygons corresponding to small-to-large bodies of water
We obtained US Census Long Form (SF-3) data for 1980 1990 and 2000 from Geolytics Inc We used selected original variables from the SF-3 as well as user-derived variables from the SF-3 data
Methodology
For the Atlanta study (Holt 2003) it was necessary to normalize all census data for 1980 1990 and 2000 to 1990 census tract boundaries as the anal-ysis addressed variables representing the social environment in 1990 and the potential health outcomes in the late 1990s Additional variables were added to that analysis namely the changes in the social environment from 1980 to 2000 To add these change variables to the existing 1990 variables it was necessary to use consistent census tract boundaries and we chose the 1990 boundar-ies Because we used 1990 boundaries we needed to account for census tract boundary changes by weighting the census data for 1980 and 2000 We accomplished this through areal interpolation based on dasymetric mapping of the population
Dasymetric Determination
of Population Densities
The basic procedure that we used in this project is similar to the binary dasymetric procedure described by Langford and Unwin (1994) and Fisher and Langford (1995 and 1996) The binary dasymetric procedure utilizes ancillary land-useland-cover data to differentiate populated and unpopulated areas Our ancillary land-useland-cover data were derived from a computer-assisted manual pixel-based classification of remotely sensed satellite data An example of the land-useland-cover data is in Figure 2 which depicts Gwinnett County in 1990 Figure 3 depicts popu-lated (low-density urban) areas and unpopulated areas (all other categories)
We overlaid the raster format land-useland-cover map in binary form (populated versus unpopulated) with a census tract boundary file which we had trans-
Del
iver
ed b
y P
ublis
hing
Tec
hnol
ogy
to U
nive
rsity
of C
alga
ry IP
95
258
914
8 on
Sat
14
Jul 2
012
041
326
Cop
yrig
ht (
c) C
arto
grap
hy a
nd G
eogr
aphi
c In
form
atio
n S
ocie
ty A
ll rig
hts
rese
rved
Vol 31 No 2 107
formed from the original vector shapefile format into a raster file We determined the number of residential land-use pixels per census tract using the Summary function in ERDAS Imagine 86 (Leica Geosystems Inc Atlanta Georgia) we added these values as a separate attribute field in the census tract vector shapefile We merged the census tract shapefile with a database file of census tract population extracted from the Geolytics Long Form (SF-3) database We then determined the population per residentially occupied pixel per census tract by simple arith-metic calculation in ArcGIS 82 We mathematically transformed the areal unit of the land-use pixels (each representing an area 30 meters x 30 meters) into hectares and square kilometers The resulting statistics represented the dasymetrically derived population density for each census tract We used this basic methodology to determine population density in 1980 1990 and 2000 For each year we implemented the dasymetric process in the GIS slightly differently because we needed to express the population densities in terms of the 1990 census tract boundaries In addition for 1980 and 2000 we used the dasymetric procedure as the basis for areal interpolation of census-derived data to 1990 census tract boundaries6
1990 Population Density in 1990 Census
Tract Boundaries
For the 1990 data we only needed to compute census tract population densities areal interpola-tion of 1990 census data was not necessary because we used 1990 census tract boundaries To compute the 1990 population densities we derived ancillary data from the unsupervised classification of a 1990 Landsat Thematic MapperTM satellite image with a scene acquisition date of September 25 1990 We classified the image with ERDAS Imagine 86 using the Iterative Self-Organizing Data Analysis Technique (ISODATA) unsupervised classification approach In an ISODATA classification satellite imagery pixels with similar spectral properties are grouped into a user-determined number of clusters This clustering is achieved through a computerized search for natural groupings of the pixelsrsquo spectral properties based on their dis-tances in multispectral feature space defined by the spectral bands of the image data (ie a cluster analysis) The analyst manually assigns these spectral classes a posteriori to information classes of interest such
as land-useland-cover categories (Jensen 1996) Overall accuracy for the ISODATA classification was 9294 percent Producerrsquos accuracy and userrsquos accuracy for the Low-Density Urban category (which is associated with residential land use) were 9692 percent and 8750 percent respectively In addition the overall Kappa index of agreement was 09124 and the conditional Kappa for the Low-Density Urban category was 08524 Thus our classification accuracies exceeded the com-monly accepted minimum thresholds for remotely sensed data (Anderson et al 1976) as well as the threshold necessary to ensure robustness to clas-sification error of the binary dasymetric technique (Fisher and Langford 1996)
We determined dasymetric population density for 1990 using the basic procedure described above For example census tract 50102 in northwestern Gwinnett County contained 4413 residential pixels and its 1990 population was 8684 We divided the tract population by the number of residential pixels yielding a dasymetric density of 197 people per pixel which translates to 218889 people per square kilometer
1980 and 2000 Population Densities
in 1990 Census Tract Boundaries
For the 1980 and 2000 data we computed census tract population densities expressed in terms of the 1990 census tract boundaries This involved modifying the basic procedure that we used to determine 1990 population density Essentially we first determined the population densities for 1980 in terms of the 1980 census tract boundar-ies and the population densities for 2000 in terms of the 2000 census tract boundaries We then re-expressed the 1980 and 2000 population densities in terms of the 1990 census tract boundaries
To compute the 1980 population densities we used a June 20 1984 LandsatTM scene to derive the ancillary data on residential land-use extent in 1980 The 1984 satellite image is a compromise because no satellite image with compatible spatial resolu-tion (30 meters) is available for 1980 Although we obtained a LandsatTM image from December 1982 we did not use it because of its poor radiometric contrast and because it was taken in the winter while the 1990 and 2000 images were taken in the summer We classified the 1984 image in the same manner as the 1990 image We did not conduct an accuracy assessment due to the lack of suitable ground truth
6 The 1990 census tract boundaries were selected because the 1980 1990 and 2000 population density values and their rates of change
were used as independent variables in the larger Atlanta mortality study (Holt 2003) in which mortality rates were expressed in terms
of 1990 census tracts
Del
iver
ed b
y P
ublis
hing
Tec
hnol
ogy
to U
nive
rsity
of C
alga
ry IP
95
258
914
8 on
Sat
14
Jul 2
012
041
326
Cop
yrig
ht (
c) C
arto
grap
hy a
nd G
eogr
aphi
c In
form
atio
n S
ocie
ty A
ll rig
hts
rese
rved
108 Cartography and Geographic Information Science
Figure 2 Land useland cover Gwinnett County Georgia 1990
Del
iver
ed b
y P
ublis
hing
Tec
hnol
ogy
to U
nive
rsity
of C
alga
ry IP
95
258
914
8 on
Sat
14
Jul 2
012
041
326
Cop
yrig
ht (
c) C
arto
grap
hy a
nd G
eogr
aphi
c In
form
atio
n S
ocie
ty A
ll rig
hts
rese
rved
Vol 31 No 2 109
Figure 3 Residential land use Gwinnett County Georgia 1990
Del
iver
ed b
y P
ublis
hing
Tec
hnol
ogy
to U
nive
rsity
of C
alga
ry IP
95
258
914
8 on
Sat
14
Jul 2
012
041
326
Cop
yrig
ht (
c) C
arto
grap
hy a
nd G
eogr
aphi
c In
form
atio
n S
ocie
ty A
ll rig
hts
rese
rved
110 Cartography and Geographic Information Science
data However because the image is of the same type and from the same satellite as the 1990 image and because we used the same classification technique the classification accuracies should be similar to those of the 1990 image Furthermore the classification accuracy probably exceeds the minimum 60 percent threshold determined by Fisher and Langford (1996) to be necessary for ensuring robustness to error of the binary dasymetric procedure
Once we determined the extent of Low-Density Urban (eg residential) land use we converted the land-useland-cover map into a binary map of residential versus non-residential pixels similar to the 1990 land-useland-cover map We overlaid the 1984 binary map with a rasterized map of 1980 census tract boundaries and using the Summary function in ERDAS Imagine 86 determined the number of residential pixels per census tracts We entered these values as a separate attribute field in the 1980 census tract vector shapefile which we merged with a database file containing 1980 tract populations We computed population densities for 1980 using 1980 boundaries by arithmetic opera-tion in ArcGIS 82
Expressing the 1980 population densities in terms of the 1990 census tract boundaries required addi-tional processing We combined the 1984 binary land-useland-cover map with the 1980 census tract vector shapefile using the Matrix operation in ERDAS Imagine 86 This essentially recoded the land-use mapsrsquo individual pixel values (formerly binary 0 and 1) to values representing the tract level population densities corresponding to each pixelrsquos census tract7 We then combined the rasterized 1990 census tracts with the recoded land-use map using the Summary function in Imagine and exported a data file containing the number of pixels of each attribute (density) for each 1990 census tract
Each census tract that experienced no boundary changes from 1980 to 1990 contained only one sum-mary number of pixels with an associated population density value Census tracts that experienced boundary changes contained more than one summary number of pixels each with its own associated population density values For both types of census tracts we calculated the 1980 population density values in terms of the 1990 census tract boundaries based on the number of pixels and their corresponding density values We merged the Excel file converted to a database file with the 1990 census tract vector shapefile this added the 1980 dasymetric popula-
tion density values as a separate attribute field in the 1990 shapefile
For the 2000 population densities calculations we used the same procedure We derived the 2000 ancillary land-useland-cover data from the ISODATA classification of a September 28 2000 Landsat 7 ETM+ scene with an overall classification accuracy of 9012 percent Producerrsquos and userrsquos accuracy for the Low-Density Urban category were 9344 percent and 8769 percent respectively In addition the overall Kappa index of agreement was 08759 and the conditional Kappa for the Low-Density Urban category was 08563 As with the 1990 ancillary data the 2000 data exceeded the minimum thresholds for classification accuracy
Areal Interpolation of Census Data
We used a form of areal interpolation to disaggre-gate the 1980 and 2000 census-derived data from their original tract boundaries and to re-aggregate these data into the 1990 census tract boundaries In the greater Atlanta area some census tracts were split into two or more constituent tracts between 1980 and 2000 the boundaries of some census tracts with neighboring tracts shifted and some tracts were both split and had their bound-aries changed (Figure 4) Most of the census tract changes between 1980 and 2000 involved split census tracts many of which were due to the rapid population growth in suburban Atlanta during this period
The basic procedure for areal interpolation we used was to determine where changes occurred to census tract boundaries from 1980 to 1990 and from 1990 to 2000 We then determined the percent-age of populated areas affected by those boundary changes in each affected census tract developed weights based on the percentage of affected popu-lated areas and applied the weights to 1980 and 2000 census-derived data to obtain estimates of the census data for 1980 and 2000 in terms of the 1990 census tract boundaries
We determined census tract boundary changes from 1980 to 1990 using Tract Comparability Files (Socioeconomic Data and Applications Center 2003) We used Tract Relationship Files (US Census Bureau 2002) to determine census tract boundary changes from 1990 to 2000 The Census Tract Comparability and Relationship Files list census tracts that experi-enced a significant change (25 percent of land area or greater) from one decennial census to the next
7 Because raster pixel values must be integers we first multiplied the population densities by 100 in the vector shapefile We used these
ldquopseudo-densitiesrdquo for the remaining steps of the procedure Once we completed the procedure we divided the pseudo-values by 100
to obtain the density values expressed in the original decimal format
Del
iver
ed b
y P
ublis
hing
Tec
hnol
ogy
to U
nive
rsity
of C
alga
ry IP
95
258
914
8 on
Sat
14
Jul 2
012
041
326
Cop
yrig
ht (
c) C
arto
grap
hy a
nd G
eogr
aphi
c In
form
atio
n S
ocie
ty A
ll rig
hts
rese
rved
Vol 31 No 2 111
(US Census Bureau 2002) We also displayed 1980 1990 and 2000 census tract boundary shapefiles in a GIS (ArcGIS 82) and confirmed differences in tract boundaries by visual inspection We cross-checked the results of the visual inspection of the GIS data with the information in the Census Tract Comparability and Relationship Files to identify the tract boundaries affected by changes and to develop a table of the nature of these changes
We calculated the percentages of populated areas affected by boundary changes in each affected tract by applying the ancillary land-useland-cover data we had derived to dasymetrically determine census tract population densities For boundary shifts from 1990 to 2000 we overlaid the 1990 and 2000 tract boundary shapefiles in a GIS (ArcGIS 82) We used the same process for the 1980 to 1990 tract boundary shifts We identified the land areas affected by tract boundary shifts by using the ldquoIntersectionrdquo opera-tion in ArcGIS and exporting each area as a unique shapefile We used ERDAS Imagine 86 to matrix each shapefile with a binary mask representing residential pixels and non-residential pixels We repeated this process for each intersection shapefile Summary reports from Imagine provided the numbers of resi-dential pixels contained in each intersection area For each boundary shift we divided the number of residential pixels in the shifted area by the number of residential pixels in the census tract to which the shifted area originally belonged using the attribute table of the 1990 tract boundary shapefile The resulting percentage represented the residential land-use area that shifted from the original census tract to the receiving census tract
We used the percentages of affected residential land use from the preceding step as interpola-tion weights for expressing the 2000 census data in terms of the 1990 census tract boundaries We accomplished this by multiplying the 2000 census data by the interpolation weights The step-by-step procedure for interpolating census data is illustrated in Figure 5 using DeKalb County census tracts 201 and 22401 as examples
In Figure 5a the portion of tract 201 that shifted to tract 22401 from 1990 to 2000 is highlighted by the cross-hatched area In Figure 5b the residential land-use pixels from 2000 are superimposed over the area of tracts 201 and 22401The number of residential land-use pixels in the portion of tract 201 that shifted to 22401 is 105 pixels the number of residential land-use pixels unaffected by the boundary shift is 484 pixels These numbers cor-respond to 18 percent and 82 percent of the total number of residential pixels (589) for the entire land area of tract 201 in 2000 These percentages
served as the dasymetric weights for the subsequent areal interpolation of the poverty data from their original 2000 boundaries to their 1990 boundaries Figure 5c depicts the population and poverty data for tracts 201 and 22401 in terms of the 2000 tract boundaries prior to areal interpolation Figure 5d illustrates the weighting of the data for tract 201 in accordance with the dasymetric weights of 82 percent and 18 percent Lastly Figure 5e shows the resulting census data for tracts 201 and 22401 after areal interpolation These data were obtained by subtracting the data corresponding to the cross-hatched area from tract 201 and adding these data to 22401
For census tract splits from 1980 to 1990 with no other shifts in tract boundaries areal interpolation was unnecessary Instead we assigned the census data for each 1980 census tract to its 1990 constitu-ent tracts For example Gwinnett Countyrsquos 1980 census tract 501 was split into tracts 50101 and 50102 for 1990 We assigned the census data values for 1980 tract 501 to each of the 1990 tracts In this manner the 1980 census data for 1980 tract 501 were expressed in terms of the 1990 census tract boundaries (tracts 50101 and 50102)
We handled census tract splits from 1990 to 2000 differently because we calculated our results based on the 1990 census tracts for our project We treated the 1990 to 2000 changes as though the 2000 census tracts had been ldquore-aggregatedrdquo back into their original 1990 census tracts For example if Gwinnett Countyrsquos 1990 census tract 50101 was split into two tracts for 2000 (tracts 50103 and 50104) the data for tracts 50103 and 50104 were aggregated and assigned to 1990 tract 50101 We aggregated the appropriate denominator data (eg total population) and the numerator data (eg total number of white population) for each of the 2000 tracts so that the resulting percentages could be computed for the aggregated tracts In this manner the 2000 census data for 2000 census tracts 50103 and 50104 were expressed in terms of the 1990 census tract 50101 boundaries
Results and Discussion
Population Density
In all 13 counties in the study area the census tract-level dasymetrically determined population densities exceeded the population densities com-puted with the choroplethic method Table 1 lists the 1990 choroplethic and dasymetric population densities for Gwinnett County Figure 6a depicts
Del
iver
ed b
y P
ublis
hing
Tec
hnol
ogy
to U
nive
rsity
of C
alga
ry IP
95
258
914
8 on
Sat
14
Jul 2
012
041
326
Cop
yrig
ht (
c) C
arto
grap
hy a
nd G
eogr
aphi
c In
form
atio
n S
ocie
ty A
ll rig
hts
rese
rved
112 Cartography and Geographic Information Science
the dasymetric popula-tion density for 1990 The different results provided by the dasymetric and choroplethic methods are illustrated in Figures 6a and 6b In both maps we assigned the data to five classes using the Jenksrsquo Optimal Breaks method A comparison of the two maps readily indicates dif-ferences in the outer coun-ties In particular all census tracts in Douglas Paulding Forsyth Rockdale Coweta Fayette Henry and (with one minor exception) Cherokee counties have the lowest class of population density in the choroplethic map suggesting broad homogeneity of census tract population density throughout the outer sub-urban fringe However the dasymetric map of popula-tion densities for the same counties depicts areas with higher population density within each county These generally correspond to county seats other small towns or especially in Paulding County areas of new higher-density hous-ing subdivisions Therefore the dasymetric map pro-vides more precision in dif-ferentiating areas of higher and lower population density within counties
To place these population densities in perspective if a given residential area is comprised of single-family housing units zoned for one-half acre lots there are approximately 48 housing units per hectare (2 housesacre x 24 acreshectare) As there are 100 hectares per square kilometer this translates to 480 housing units per square kilometer of residential area If one assumes a population-to-housing unit density of two persons per housing unit this would yield an estimated population density of 960 per-sons per square kilometer of residential area (480 housing units x 2 personshousing unit)
As a further comparison of these dasymetric population densities if the population densities
for tracts 50102 and 50202 had been calculated in the traditional manner of dividing each tractrsquos total population by its total land area their respec-tive densities would have been 24169 persons per square kilometer (8684 persons divide 3593 km2 total land area) and 5389 persons per square kilometer (3047 persons divide 5654 km2 total land area) While the ordinal ranking of the two tracts remains the same (tract 50102 is more densely populated than tract 50202) the relative difference in population density is dramatically different between the two methods of population density computation For the dasymetric method tract 50102 is roughly 25 times more densely populated than tract 50202 while for the traditional method tract 50102 is roughly 45 times more densely populated than tract 50202
Figure 4 Census tract boundaries north-central Gwinnett County 1990 and 2000
Del
iver
ed b
y P
ublis
hing
Tec
hnol
ogy
to U
nive
rsity
of C
alga
ry IP
95
258
914
8 on
Sat
14
Jul 2
012
041
326
Cop
yrig
ht (
c) C
arto
grap
hy a
nd G
eogr
aphi
c In
form
atio
n S
ocie
ty A
ll rig
hts
rese
rved
Vol 31 No 2 113
Figure 5 Areal interpolation using dasymetric weights
Del
iver
ed b
y P
ublis
hing
Tec
hnol
ogy
to U
nive
rsity
of C
alga
ry IP
95
258
914
8 on
Sat
14
Jul 2
012
041
326
Cop
yrig
ht (
c) C
arto
grap
hy a
nd G
eogr
aphi
c In
form
atio
n S
ocie
ty A
ll rig
hts
rese
rved
114 Cartography and Geographic Information Science
Therefore by not including unpopulated land areas in the calculations of population density the dasymetric method provides a more precise measure of population density within residential areas and the variation in population density among tracts can be substantial8
Unlike choroplethic maps dasymetric maps show which areas are unpopulated This is especially evi-dent in the outer counties which have large areas of non-residential land-use This trait of the dasymetric map makes it suitable for visually depicting tempo-ral changes to the landscape Although dasymetric maps provide more spatial precision in mapping population density than choroplethic maps they are subject to the same scale and aggregation effects as choroplethic maps
If the same census tract boundaries are maintained from one census to the next and the population increases with no increase in residential land-use area then the population density will increase But if residential land-use area increases the popula-tion density will increase or decrease depending on the relative magnitudes of the population and land-use area changes For this reason some census tracts in the suburban fringe counties experienced population increases concurrent with decreases in dasymetric population density while other tracts with population increases experienced increases in dasymetric population density
For example census tract 1707 in central Coweta experienced an increase in population from 6458 in 1990 to 7139 in 2000 (an increase of 105 percent) and an increase in residential land-use from 404 km2 to 510 km2 (an increase of 262 percent) The result-
ing dasymetric population density decreased from1 600 personskm2 to 1400 personskm2 When this change is analyzed with the choroplethic method of calculating population density the opposite happens a 1990 density of 29 personskm2 (6458 persons divide 22226 km2 of total land area) and a 2000 density of 32 personskm2 (7139 persons divide 22226 km2 of total land area) indicate an increase in popula-tion density from 1990 to 2000 For tract 1707 the decrease in dasymetric population density is prob-ably attributable to new residents (after 1990) living in newly constructed single-family houses built on relatively large lots (eg one acre or greater)
An example of a dasymetric population density increase is census tract 1205 in southeastern Paulding County Its population increased from 6809 to 14425 from 1990 to 2000 (an increase of 1119 percent) while its residential land-use area increased from 547 km2 to 889 km2 (an increase of 625 percent) While population and residential land-use area grew substantially population growth exceeded residential land-use growth This may be attributable to the construction of single-family houses on relatively smaller lots the construction of multi-family housing units an influx of families with multiple children or a combination of these factors
Tract-level dasymetric population densities for Gwinnett County in 1980 1990 and 2000 are listed in Table 2 The tracts with increasing population and decreasing population density probably experienced urban sprawl during this period The dasymetric mapping process can measure this at the tract level but choroplethic techniques cannot account for such
Table1 Population densities choroplethic versus dasymetric selected census tracts Gwinnett County Georgia 1990
Tract Number 1990 PopulationChoroplethic Population Density
(persons per square kilometer)
Dasymetric Population Density
(persons per square kilometer)
50101 8142 127 1700
50102 8684 242 2189
50305 9605 1913 8422
50408 10986 1372 3733
50410 4767 788 3311
50509 5231 153 1544
50601 8937 73 989
50705 6529 87 1044
50706 10425 673 3089
8 For the 1990 population data across the entire study area the mean dasymetric population density is 4085 personskm2 (sd=4764)
the mean choroplethic population density is 906 personskm2 (sd=925)
Del
iver
ed b
y P
ublis
hing
Tec
hnol
ogy
to U
nive
rsity
of C
alga
ry IP
95
258
914
8 on
Sat
14
Jul 2
012
041
326
Cop
yrig
ht (
c) C
arto
grap
hy a
nd G
eogr
aphi
c In
form
atio
n S
ocie
ty A
ll rig
hts
rese
rved
Vol 31 No 2 115
changes in residential land use within tracts Thus dasymetric mapping can pinpoint areas of urban sprawl (Figure 7) such as tracts made accessible by multi-lane expressways
Areal Interpolation of Census Data
We areally interpolated census data for 1980 and 2000 when boundary shifts occurred from one
census to the next The number (8 for 1980-1990 and 15 for 1990-2000) and percentage of bound-ary shifts were relatively small (18 percent of all census tracts for 1980-1990 and 25 percent for 1990-2000) Furthermore the percentages of affected population were generally small espe-cially for the 1990-2000 boundary shifts (1980-1990 range 0 to 47 percent mean 23 percent
Tract Number
1980 Population
Density
1990 Population
Density
2000 Population
Density
Change 1980 to
2000
50101 3418 1700 1700 -503
50102 3418 2189 1556 -545
50305 1797 8422 5589 2100
50408 1418 3733 3456 1437
50410 1418 3311 2511 771
50509 2608 1544 1467 -438
50601 2063 989 1500 -273
50705 1139 1044 1356 191
50706 2418 3089 2300 -49
Table 2 Dasymetric population density selected census tracts Gwinnett County Georgia 1980-2000
Affected Census Tracts Census YearsDasymetric Method
()
Tract Comparability
Relationship Files
()
Difference
(absolute)
107 1980-1990 0 0 0
21805 1980-1990 33 35 2
230 1980-1990 40 53 13
31204 1980-1990 8 4 4
31403 1980-1990 0 2 2
80798 1980-1990 22 22 0
1701 1980-1990 0 0 0
1702 1980-1990 10 17 7
1703 1980-1990 23 31 8
57 1990-2000 25 11 14
9401 1990-2000 4 2 2
11202 1990-2000 3 5 2
201 1990-2000 18 18 0
23415 1990-2000 4 0 4
30504 1990-2000 3 2 1
31112 1990-2000 9 7 2
40302 1990-2000 4 1 3
40304 1990-2000 5 3 2
40407 1990-2000 9 16 7
50106 1990-2000 3 0 3
50718 1990-2000 2 1 1
80301 1990-2000 9 4 5
80401 1990-2000 1 1 0
140303 1990-2000 4 2 2
Table 3 Comparison of percentages of affected population from census tract boundary shifts dasymetric method versus
Tract ComparabilityRelationship Files
Del
iver
ed b
y P
ublis
hing
Tec
hnol
ogy
to U
nive
rsity
of C
alga
ry IP
95
258
914
8 on
Sat
14
Jul 2
012
041
326
Cop
yrig
ht (
c) C
arto
grap
hy a
nd G
eogr
aphi
c In
form
atio
n S
ocie
ty A
ll rig
hts
rese
rved
116 Cartography and Geographic Information Science
Figure 6 Population density a) 1990 dasymetric population density
Del
iver
ed b
y P
ublis
hing
Tec
hnol
ogy
to U
nive
rsity
of C
alga
ry IP
95
258
914
8 on
Sat
14
Jul 2
012
041
326
Cop
yrig
ht (
c) C
arto
grap
hy a
nd G
eogr
aphi
c In
form
atio
n S
ocie
ty A
ll rig
hts
rese
rved
Vol 31 No 2 117
Figure 6 Population density b) 1990 choroplethic population density
Del
iver
ed b
y P
ublis
hing
Tec
hnol
ogy
to U
nive
rsity
of C
alga
ry IP
95
258
914
8 on
Sat
14
Jul 2
012
041
326
Cop
yrig
ht (
c) C
arto
grap
hy a
nd G
eogr
aphi
c In
form
atio
n S
ocie
ty A
ll rig
hts
rese
rved
118 Cartography and Geographic Information Science
median 265 percent and 1990-2000 range 0 to 18 percent mean 65 percent median 5 percent) Therefore the impact of census tract boundary shifts on the dataset was modest
We checked the accuracy of the dasymetrically derived areal interpolation weights against popu-lation-based percentage changes from the Tract Comparability and Relationship Files The per-centages of affected population determined by the dasymetric method and the Tract Comparability and Relationship Files are shown in Table 3 The mean absolute difference between the two methods is 365 percent with a range of 0 to 14 percent and a median of 2 percent Except for two outliers (tracts 230 and 57) the dasymetric method worked satisfactorily
Conclusion
In this paper we reported on our use of satellite-derived ancillary land-useland-cover data to map population densities using the dasymetric method The dasymetric method accounts for the spatial distribution of population within administrative areas yielding more precise population density estimates than the choroplethic method while graphically representing the geographic distri-bution of populations We presented dasymetric population density maps for 1980 1990 and 2000 for a rapidly growing 13-county area in met-ropolitan Atlanta Georgia These maps revealed more realistically the intra-county variations in population density and the urban sprawl growth characteristics than the conventional choroplethic method
We also used the ancillary land-useland-cover data to derive adjustment weights for census data at the census tract level where census tract bound-ary shifts made temporal data comparisons difficult By determining the percentages of residential areas affected by census tract boundary shifts we were able to re-weight the census data to estimate the census data in terms of the 1990 census tract boundaries making it possible to represent three years of census data (1980 1990 and 2000) in one set of common census tracts (1990) Accuracy assessment of the dasy-metrically derived adjustment weights indicated a satisfactory level of accuracy Dasymetrically derived areal interpolation weights can be applied to any type of geographic boundary re-aggregation such as from census tracts to zip code tabulation areas from census tracts to local school districts from zip code areas to telephone exchange prefix areas and for electoral redistricting
ACKNOWLEDGEMENTSThe authors wish to thank three anonymous reviewers for their insightful comments and sug-gestions which have greatly improved the content of this paper
REFERENCESAnderson JR EE Hardy JT Roach and RE Witmer
1976 A Land-useland-cover classification system for use with remote sensor data Washington DC United States Government Printing Office
Eicher CL and CA Brewer 2001 Dasymetric mapping and areal interpolation Implementation and evalu-ation Cartography and Geographic Information Science 28(2) 125-38
Fisher PF and M Langford 1995 Modeling the errors in areal interpolation between zonal systems by Monte Carlo Simulation Environment and Planning A 27 211-24
Fisher PF and M Langford 1996 Modeling sensitiv-ity to accuracy in classified imagery A study of areal interpolation by dasymetric mapping Professional Geographer 48(3) 299-309
Gotway CA and LJ Young 2002 Combining incom-patible spatial data Journal of the American Statistical Association 97(458) 632-48
Holloway SR J Schumacher and R Redmond 1996 People and place Dasymetric mapping using ArcInfo Wildlife Spatial Analysis Lab University of Montana Missoula Montana
Holt JB 2003 The use of a geographic information system (GIS) and satellite remote sensing for small-area mortality analysis PhD Dissertation University of Georgia Athens Georgia
Jensen JR 1996 Introductory digital image processing A remote sensing perspective Upper Saddle River New Jersey Prentice-Hall Inc
Langford M DJ Maguire and DJ Unwin 1991 The areal interpolation problem Estimating population using remote sensing in a GIS framework In Masser I and M Blakemore (eds) Handling geographical infor-mation Methodology and potential applications London Longman pp 55-77
Langford M and DJ Unwin 1994 Generating and mapping population density surfaces within a geographical information system The Cartographic Journal 31 21-6
Langford M 2003 Refining methods for dasymetric mapping using satellite remote sensing In Mesev V (ed) Remotely sensed cities New York New York Taylor amp Francis pp 137-56
Martin D 1989 Mapping population data from zone centroid locations Transactions of the Institute of British Geographers 14 90-7
Martin D 1996 An assessment of surface and zonal models of population International Journal of Geographical Information Systems 10(8) 973-89
Martin D D Dorling and R Mitchell 2002 Linking censuses through time Problems and solutions Area 34(1) 82-91
Del
iver
ed b
y P
ublis
hing
Tec
hnol
ogy
to U
nive
rsity
of C
alga
ry IP
95
258
914
8 on
Sat
14
Jul 2
012
041
326
Cop
yrig
ht (
c) C
arto
grap
hy a
nd G
eogr
aphi
c In
form
atio
n S
ocie
ty A
ll rig
hts
rese
rved
120 Cartography and Geographic Information Science
Figure 7 Urban sprawl by 1990 census tract Gwinnett County Georgia 1980-2000
Del
iver
ed b
y P
ublis
hing
Tec
hnol
ogy
to U
nive
rsity
of C
alga
ry IP
95
258
914
8 on
Sat
14
Jul 2
012
041
326
Cop
yrig
ht (
c) C
arto
grap
hy a
nd G
eogr
aphi
c In
form
atio
n S
ocie
ty A
ll rig
hts
rese
rved
Openshaw S 1984 The modifiable areal unit problem CATMOG 38 Norwich UK Geo Books
Socioeconomic Data and Applications Center (SEDAC) 2003 Census Tract Comparability Files Columbia University New York City [wwwsedacciesenorg accessed February 8 2003]
Tobler WR 1979 Smooth pycnophylactic interpola-tion for geographical regions Journal of the American Statistical Association 74(367) 519-30
US Census Bureau 2002 Census Tract Relationship Files Washington DC [wwwcensusgovgeowwwrelaterel_tracthtml accessed February 7 2003]
US Department of Transportation 2002 National Transportation Atlas Database 2002 Bureau of Transportation Statistics Washington DC
Wright JK 1936 A method of mapping densities of population With Cape Cod as an example The Geographical Review 26 103-110
Yuan Y RM Smith and WF Limp 1998 Remodeling census population with spatial information from LandsatTM imagery Computers Environmental and Urban Systems 21(3-4) 245-58
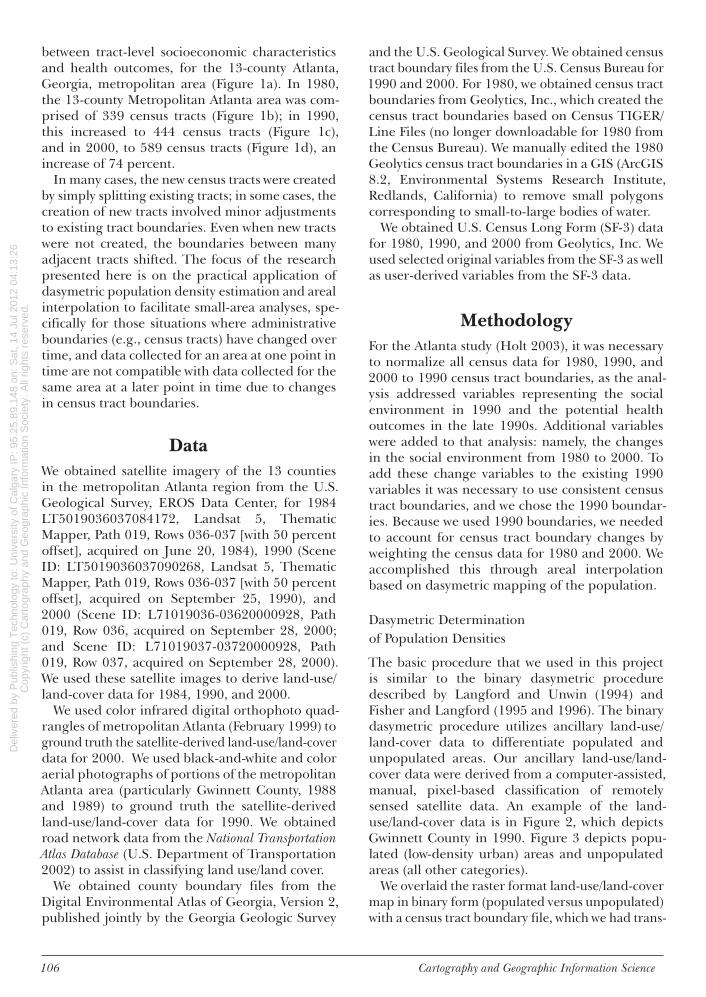
Del
iver
ed b
y P
ublis
hing
Tec
hnol
ogy
to U
nive
rsity
of C
alga
ry IP
95
258
914
8 on
Sat
14
Jul 2
012
041
326
Cop
yrig
ht (
c) C
arto
grap
hy a
nd G
eogr
aphi
c In
form
atio
n S
ocie
ty A
ll rig
hts
rese
rved
Openshaw S 1984 The modifiable areal unit problem CATMOG 38 Norwich UK Geo Books
Socioeconomic Data and Applications Center (SEDAC) 2003 Census Tract Comparability Files Columbia University New York City [wwwsedacciesenorg accessed February 8 2003]
Tobler WR 1979 Smooth pycnophylactic interpola-tion for geographical regions Journal of the American Statistical Association 74(367) 519-30
US Census Bureau 2002 Census Tract Relationship Files Washington DC [wwwcensusgovgeowwwrelaterel_tracthtml accessed February 7 2003]
US Department of Transportation 2002 National Transportation Atlas Database 2002 Bureau of Transportation Statistics Washington DC
Wright JK 1936 A method of mapping densities of population With Cape Cod as an example The Geographical Review 26 103-110
Yuan Y RM Smith and WF Limp 1998 Remodeling census population with spatial information from LandsatTM imagery Computers Environmental and Urban Systems 21(3-4) 245-58