James Asa Strong1*, Eider Andonegi2 3 4 1 - IRepirep.ntu.ac.uk/id/eprint/27589/1/5181_Little.pdf ·...
70
1 Marine biodiversity and ecosystem function relationships: the potential for practical monitoring applications James Asa Strong 1* , Eider Andonegi 2 , Kemal Can Bizsel 3 , Roberto Danovaro 4 , Mike Elliott 1 , Anita Franco 1 , Esther Garces 5 , Sally Little 1 , Krysia Mazik 1 , Snejana Moncheva 6 , Nadia Papadopoulou 7 , Joana Patrício 8 , Ana M. Queirós 9 , Chris Smith 7 , Kremena Stefanova 6 and Oihana Solaun 2 . 1 The Institute of Estuarine and Coastal Studies, University of Hull, Hull, HU6 7RX, UK. 2 AZTI - Tecnalia, Astondo Bidea, Edificio 609, Parque Tecnológico de Bizkaia, 48160 Elexalde Derio, Vizcaya, Spain. 3 Institute of Marine Sciences and Technology Baku, Blvd. No 100, P.K. 478, Inciralti-Izmir, Turkey. 4 CONISMA, Polytechnic University of Marche, Piazza Roma, 22, 60121 Ancona, Italy. 5 Institut de Ciències del Mar, CSIC, Spain. Passeig Marítim de la Barceloneta, 37-49. E-08003 Barcelona, Spain. 6 Institute of Oceanology-BAS, First May Street 40, P.O.Box 152, Varna 9000, Bulgaria. 7 Hellenic Centre of Marine Research, Athens Sounio Ave. P.C. 19013, Anavyssos Attiki, Greece. 8 European Commission, Joint Research Centre, E. Fermi 2749, 21027 Ispra (VA), Italy. 9 Plymouth Marine Laboratory, Prospect Place, The Hoe, Plymouth, PL1 3DH, UK. *Corresponding author: [[email protected], +44 1482 433685] Running header: Potential of marine BEF relationships in monitoring
Transcript of James Asa Strong1*, Eider Andonegi2 3 4 1 - IRepirep.ntu.ac.uk/id/eprint/27589/1/5181_Little.pdf ·...
1
Marine biodiversity and ecosystem function relationships: the potential for practical monitoring applications
James Asa Strong1*, Eider Andonegi2, Kemal Can Bizsel3, Roberto Danovaro4, Mike Elliott1, Anita
Franco1, Esther Garces5, Sally Little1, Krysia Mazik1, Snejana Moncheva6, Nadia Papadopoulou7, Joana
Patrício8, Ana M. Queirós9, Chris Smith7, Kremena Stefanova6 and Oihana Solaun2.
1 The Institute of Estuarine and Coastal Studies, University of Hull, Hull, HU6 7RX, UK.
2 AZTI - Tecnalia, Astondo Bidea, Edificio 609, Parque Tecnológico de Bizkaia, 48160 Elexalde Derio,
Vizcaya, Spain.
3 Institute of Marine Sciences and Technology Baku, Blvd. No 100, P.K. 478, Inciralti-Izmir, Turkey.
4 CONISMA, Polytechnic University of Marche, Piazza Roma, 22, 60121 Ancona, Italy.
5 Institut de Ciències del Mar, CSIC, Spain. Passeig Marítim de la Barceloneta, 37-49. E-08003
Barcelona, Spain.
6 Institute of Oceanology-BAS, First May Street 40, P.O.Box 152, Varna 9000, Bulgaria.
7 Hellenic Centre of Marine Research, Athens Sounio Ave. P.C. 19013, Anavyssos Attiki, Greece.
8 European Commission, Joint Research Centre, E. Fermi 2749, 21027 Ispra (VA), Italy.
9 Plymouth Marine Laboratory, Prospect Place, The Hoe, Plymouth, PL1 3DH, UK.
*Corresponding author: [[email protected], +44 1482 433685]
Running header: Potential of marine BEF relationships in monitoring

2
Abstract
There is an increasing demand for environmental assessments of the marine environment to include
ecosystem function. However, existing schemes are predominantly based on taxonomic (i.e. structural)
measures of biodiversity. Biodiversity and Ecosystem Function (BEF) relationships are suggested to
provide a mechanism for converting taxonomic information into surrogates of ecosystem function. This
review assesses the evidence for marine BEF relationships and their potential to be used in practical
monitoring applications (i.e. operationalized).
Five key requirements were identified for the practical application of BEF relationships: 1) a complete
understanding of strength, direction and prevalence of marine BEF relationships, 2) an understanding
of which biological components are influential within specific BEF relationships, 3) the biodiversity of
the selected biological components can be measured easily, 4) detail which ecological mechanisms are
the most important for generating marine BEF relationships, e.g. identity effects or complementarity,
and 5) establish what proportion of the overall functional variance is explained by biodiversity, and
hence BEF relationships.
Many positive and some negative BEF relationships were found within the literature, although many
reproduced poorly the natural species richness, trophic structures or multiple functions of real
ecosystems. Null relationships were also reported. The consistency of the positive and negative
relationships was often low that compromised the ability to generalize BEF relationships and confident
application of BEF within marine monitoring. Equally, some biological components and functions have
received little or no investigation.
Expert judgement was used to attribute biological components using spatial extent, presence and
functional rate criteria. This approach highlighted the main contributing biological components to the
ecosystem functions, and that many of the particularly influential components were found to have
received the least amount of research attention.
The need for biodiversity to be measureable (requirement 3) is possible for most biological components
although difficult within the functionally important microbes.

3
Identity effects underpinned most marine BEF relationships (requirement 4). As such, processes that
translated structural biodiversity measures into functional diversity were found to generate better BEF
relationships.
The analysis of the contribution made by biodiversity, over abiotic influences, to the total expression
of a particular ecosystem function was rarely measured or considered (requirement 5). Hence it is not
possible to determine the overall importance of BEF relationships within the total ecosystem
functioning observed. In the few studies where abiotic factors had been considered, it was clear that
these modified BEF relationships and have their own direct influence on functional rate.
Based on the five requirements, the information required for immediate ‘operationalization’ of BEF
relationships within marine functional monitoring is lacking. However, the concept of BEF inclusion
within practical monitoring applications shows promise for providing surrogate indicators of
functioning.
Keywords
Biodiversity and ecosystem function relationships, marine, practical applications, operationalization,
monitoring
4
1. Introduction
The physical, chemical and biological processes that transform and translocate energy or materials in
an ecosystem are termed ecosystem functions (Naeem, 1998; Paterson et al., 2012). Ecosystem
functioning generally describes the combined effects of individual functions, with the overall rate of
functioning being governed by the interplay of abiotic (physical and chemical) and/or biotic factors
(Reiss et al., 2009). Furthermore, these ecosystem functions represent a significant component of
ecosystem health (Tett et al., 2013) and provide ecosystem services that benefit society (Paterson et al.,
2012). It is now widely hypothesised that ecosystem function is compromised by a global trend of
biodiversity loss, linked to human activities and climate change (Loreau, et al. 2001; Covich et al. 2004).
This is widely referred to as the Biodiversity Ecosystem Function relationship (BEF).
The need to ensure the sustainable functioning of aquatic ecosystems is acknowledged by many marine
policy obligations, either explicitly (e.g. the European Marine Strategy Framework Directive, MSFD,
2008/56/EU), or indirectly (by addressing structural aspects which can be related to functioning; e.g.,
EU Water Framework Directive WFD, Habitats Directive). The MSFD aims to achieve Good
Environmental Status (GEnS) of European seas by 2020.The MSFD definition of GEnS includes the
requirement that ‘the structure, functions and processes of the constituent marine ecosystems allow
those ecosystems to function fully and to maintain their resilience to human-induced environmental
change ‘The GEnS assessment can be interpreted as requiring 1) functioning to be considered at all
levels of biological organization (cell, individual, population, community and ecosystem) and 2) the
potential to relate these functions to GEnS indicators and overall ecosystem health (Tett et al., 2013).
Consequently, this review aims to fulfil the clear need of addressing functioning in ecosystem
monitoring by assessing the evidence for biodiversity and ecosystem function relationships and their
potential to support this objective.
Structurally-based biodiversity assessments, such as species richness and abundance (Gray and Elliott
2009), are extensively used to monitor components of the marine ecosystem (Birk et al., 2012). These
structural indicators are routinely used because they are well established, cost-effective and provide
structural surrogates (proxies) for ecosystem condition and functional state (Gray and Elliott, 2009).

5
However, development of Biodiversity and Ecosystem Functioning (BEF) relationship theory
potentially provides a more direct, proven and tangible link between structural measures of biodiversity,
specific ecosystem functions and ultimately ecosystem functioning assessments. Using these
relationships in practical monitoring applications (‘operationalizing’ BEF) provides a route by which
biological diversity information can be translated potentially into surrogates of ecosystem functionality
that ultimately help fulfil monitoring obligations and policy goals. Although direct measurements of
specific ecosystem functions are often more straight-forward and cost-effective, the use of biodiversity
information and BEF relationships has the following benefits: 1) one biological dataset can provide
surrogates of multiple ecosystem functions; 2) combines the analysis of structural and functional status;
3) predictions of function can be generated, based on known sensitivity of individual species, within
realistic patterns of biodiversity loss, and 4) a transparent approach where functional evaluations are
based on biodiversity, thereby incorporating the biological apparatus of functional delivery within these
assessment.
This review aims to explore the prevalence and nature of marine BEF relationships and the potential
of these relationships to be used in operational monitoring of marine environmental health. The key
objectives are to 1) discuss what information is required for the consistent and confident application of
BEF relationships within ecosystem functioning monitoring; 2) review the available information on
how marine biodiversity relates with specific ecosystem functions and examine both strength,
consistency, direction and important application principles such as mechanism of delivery
(complementarity and identity effects); 3) identify the biological components that are most relevant in
their contribution to specific ecosystem functions, taking into account also their relevance to current,
key management and policy frameworks; 4) assess the limitations and future work required to fully
operationalize BEF relationships, and 5) provide a framework for the incorporation of BEF relationships
within marine monitoring. Hence we give: 1) the key requirements for the practical application, 2) a
review of the BEF evidence in relation to these requirements and 3) an overall assessment of the
potential of BEF relationships to be used in practical applications of ecosystem monitoring and a
framework by which this could be achieved.

6
1.1. Biodiversity and Ecosystem Functioning relationships
Biodiversity and Ecosystem Functioning research has recently proliferated in response to scientific and
public awareness of the widespread and unprecedented human-induced biodiversity turnover (β
diversity scale) and loss in many biological components (i.e. biodiversity is routinely deconstructed into
measureable, manageable and meaningful biological components or features: broad groupings, based
on either taxonomic or ecological similarity, could include for example microbes, benthic invertebrates,
phytoplankton, and fish) resulting in the global emergence of communities with novel species
configurations (Pimm et al., 1995; Bulling et al., 2010; Dornelas et al., 2014; Pandolfi et al., 2014).
Such changes have potential implications for the provision of ecosystem services and societal benefits
(Chapin et al. 1997, Covich et al. 2004; Solan et al., 2004; Worm et al., 2006; Atkins et al., 2011;
Cardinale et al., 2012; Hooper et al., 2012; UK National Ecosystem Assessment, 2014).
Biodiversity and Ecosystem Functioning research is increasingly centred on whether altered species
diversity affects functions (Loreau, et al. 2001; Covich et al. 2004). The underlying BEF theory
postulates that changes in biodiversity will result in altered ecosystem functions or, more particularly,
that higher and more efficient functioning rates comes from highly diverse areas. This is presumed to
be because diverse communities are more likely to contain a greater range of functional traits and
environmental sensitivities (Chapin et al. 1997). High diversity therefore entails opportunities for more
efficient resource use as well as providing stability to ecosystem processes in variable environments
and in the face of disturbance (Chapin et al. 1997). Alternatively, systems with species-poor
communities are theoretically likely to be functionally poorer, less resistant (capacity to resist change)
and resilient (capacity to recover from change) to disturbance than systems with species-rich
communities (Covich et al. 2004; Stachowicz et al. 2007). However, this has been questioned for
naturally stressed areas such as estuaries in which a lower diversity but high physico-chemical
variability appears to confer greater resilience and resistance (Elliott and Quintino, 2007).
Before analyzing the evidence on BEF relationships in the marine environment and its potential for
practical application within monitoring programmes, it is important to clarify the main concepts
7
regarding the BEF theory. Precision of the definition and measurement of BEF relationships and their
elements is especially important to understand the potential and limitations for the general
operationalization within monitoring programmes. A brief summary of BEF concepts and mechanisms
is only given here to allow a better understanding of the results presented in this paper; further detailed
information can be found in Scherer-Lorenzen (2005) and Reiss et al. (2009).
Biodiversity and ecosystem function relationships, if present, can take many forms (Figure 1). These
arise from linear positive or negative relationships (proportional gain or loss) or exponential (high and
low redundancy models) (Naeem and Wright, 2003). Positive, linear BEF relationships suggest that
additional units of biodiversity (this can be taxonomic units such as species richness or functional
diversity) have an equal and additive contribution to an ecosystem function (Naeem and Wright, 2003).
This would be indicative of situations where complementarity (transgressive over-yielding) was
occurring, i.e. individual species perform better in diverse communities when compared to monoculture
due to facilitation and niche partitioning in shared resource use. When several biodiversity units are
capable of providing the same function, and therefore the same change in ecosystem function,
logarithmic relationships are likely. The species range beyond the asymptote are often considered to be
redundant (Naeem and Wright, 2003). Complementarity provides what might be considered the truest
form of BEF relationships. However, in situations where particular species have a disproportionate
functional role, they can also generate positive BEF relationships and are termed identity effects (this
form of non-transgressive over-yielding can also be called sampling or selection effects). Where identity
effects (see glossary) are prevalent, stepped or riveted relationships might be apparent. Functional
diversity measures (such as Biological Traits Analysis that uses a series of life history, morphological
and behavioural characteristics of species present in assemblages to indicate aspects of their ecological
functioning e.g. Bremner, 2008), rather than taxonomic methods, are suggested as way of partially
compensating for both redundancy and identity effects.

8
Figure 1. Potential ‘Biodiversity and Ecosystem Function’ relationships.
Despite equivocal evidence, there is a general consensus that marine biodiversity and ecosystem
function relationships do exist, and positive and negative effects of biodiversity have been observed in
several marine ecosystem functions (Worm et al., 2006; Stachowicz et al., 2007; Cardinale et al., 2012;
Gamfeldt et al., in press). Assessing the existence, strength and shape of this relationship provides a
basis for the indirect estimation of key ecosystem functions using structural measures of biodiversity.
This implies the potential to use BEF relationships in practical applications (often termed
operationalization) and generate predictions of specific ecosystem functions from existing biodiversity
information.
2. Practical application of BEF relationships within GEnS monitoring and
management
Although the overall form of many BEF relationships has been documented (Stachiwicz et al., 2007;
Naeem et al., 2009; Cardinale et al., 2012; Gamfeldt et al., in press) this alone does not provide
sufficient information to immediately use these relationships for practical applications (operationalize).

9
Five key issues, as considered below, aim to define whether BEF relationships can form an integrated
component in consistent, pragmatic and indicative marine monitoring. This requires us to investigate
the following issues: 1) the existence of BEF relationships, 2) which biological components contribute
to which ecosystem functions and therefore involved in specific BEF relationships, 3) whether the
biodiversity and function of the selected biological components be measured easily, 4) detail which
mechanisms generates BEF relationships, e.g. identity effects, and 5) establish what proportion of the
overall variance of a given function is explained by biodiversity, and hence BEF relationships.
2.1. Operational requirement 1: do BEF relationships exist in marine ecosystems?
Although there is broad acceptance of marine BEF relationships, there is also recognition of their
variability and context dependency (Bulling et al. 2010; Cardinale et al., 2012). Practical monitoring
applications, i.e. operationalization, of the BEF concept however, requires the existence of a clear,
consistent and unambiguous relationship between habitats, biological components and ecosystem
functions. Furthermore, simply knowing the presence and direction of a BEF relationship is not
sufficient for its operational use. The shape of the functional response between a biodiversity indicator
and a specific ecosystem function (linear, logarithmic, exponential, power, etc.) also needs to be
determined so that predictions can be made across the range of natural gradients of biodiversity.
Although different types of BEF relationships have been demonstrated in the literature, especially
positive relationships, there is no reason why negative BEF relationships cannot be used in monitoring
methodologies. However, the incorporation of positive BEF relationships within a practical ecosystem
monitoring application is particularly desirable as improvements in the system structure (biodiversity)
would also lead to an improvement in its functioning, thereby generating synergistic enhancements in
both conservation and ecological objectives.
In the same way that biodiversity needs to be defined and separated into manageable units, total
ecosystem functioning also needs to be subdivided into meaningful components that can be described
and measured. High level and holistic measures of ecosystem functioning that account for
multifunctionality are rare, with the majority of the literature focusing on the relevance of biodiversity
in the context of specific functions (Mouillot et al., 2011). Accordingly, evidence for BEF relationships

10
in marine temperate systems is grouped under five broad processes (groupings of ecosystem functions)
of 1) biomass production, 2) organic matter transformation, 3) ecosystem metabolism, 4) nutrient
cycling and 5) physical engineering (Figure 2). This grouping is generally agrees with that used by
Giller et al. (2004), representing key functions that control and distribute resources in marine
ecosystems (nutrients, energy, physical space/habitat), through interactions such as production,
consumption and transformation. Within these five categories, the reviewed evidence is collated by
discrete biological components including microbes, phytoplankton, zooplankton, macroalgae,
angiosperms, benthic invertebrates, fish and cephalopods, seabirds, reptiles and marine mammals.
Figure 2. Relationships between ecosystem functions used within the review.
Different biological components can contribute to the same ecosystem function (e.g. phytoplankton,
macroalgae and angiosperms all contribute to primary production) although several attributes of a
biological component may modify and scale its functional contribution (Table 1). These include: 1) its
spatial extent/occurrence within multiple habitats; 2) presence (biomass/abundance), and 3) functional
rate. These factors were considered to rank the relative contribution of the different biological
components to each ecosystem function (Table 1), as informed by the BEF literature review. Due to the
high variability in the measurement units characterizing these attributes within the reviewed studies,
and given the need of obtaining comparable data across the different components, functions, studies,
etc., a rigorous quantitative assessment method could not be applied, and a scoring system was used

11
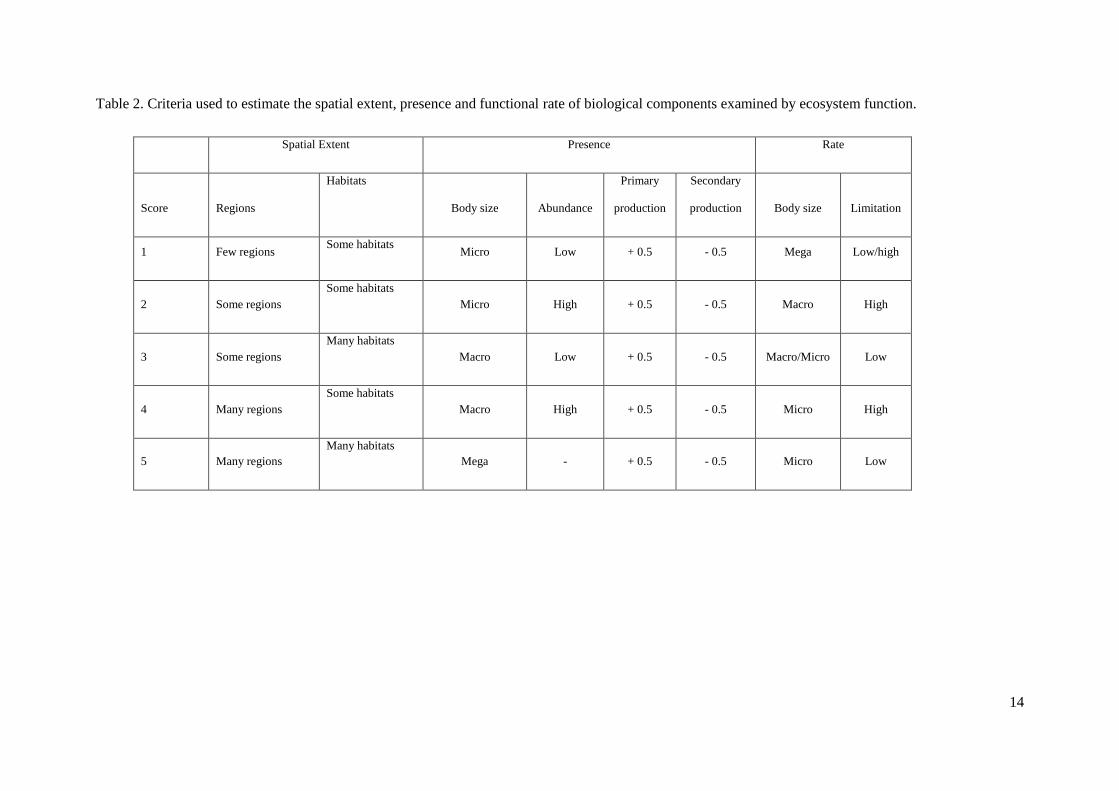
based on semi-quantitative criteria, with a certain degree of expert judgment also involved (Table 2). In
particular, the spatial extent of a biological component was scored based on its degree of occurrence at
both the habitat and regional scales (Table 2), under the assumption that, although different components
can be locally important, those that are more widespread and resident in multiple habitats are more
likely to contribute to an ecosystem function at the regional level, in line with the scale of assessment
required for regional marine monitoring.
Presence was scored based on the relative biomass typically characterizing a biological component, as
assessed by combining the evaluation of its abundance, body size and trophic level. Based on food web
reviews, the productivity of a trophic level is typically between 5 – 20% of the level below it (Trites,
2001). Total biomass declines with increasing trophic level whilst average body size increases. This
leads to consistent ratios within food webs and the well-recognized pyramidal form of trophic webs.
The steepness of these pyramids is related to the transfer efficiency between trophic levels. It therefore
seems appropriate to scale the presence of the biological components according to trophic position, i.e.
biological components at high higher trophic levels may be less important for certain ecosystem
functions that those at lower levels (Table 1 and Table 2).
The assessment of functional rate by each biological component, using body size as a proxy (assuming
increasing rates with decreasing body size (Kleiber, 1947)) is important given the potential availability
of resources required as function substrates, i.e. potential levels of limitation (Table 2). For example,
considering the contribution of phytoplankton, macroalgae and angiosperms to primary production,
presence and rate scaling were assessed based on the information on biomass and growth rate. As
indicated above, the relative presence of ocean phytoplankton in terms of biomass is very low (Field et
al., 1998), but the high growth rate and wide spatial extent makes the phytoplankton a critical and
significant contributor to primary production in marine ecosystems. In contrast, although angiosperms
and macroalgae have high growth rates and standing biomass, they are confined to a limited number of
habitats and regions, thereby decreasing their regional contribution to primary production, hence their
lower score compared to phytoplankton (Table 1).

12
Finally, ecosystem functions that are disproportionately influenced by aspects of spatial extent, presence
or rate have been adjusted using expert judgment. For example, functionality provided by physical
engineering may be more related to presence (biomass/abundance), whereas biogeochemical processes
may be more dependent on processing rates (e.g. of nutrient cycling, organic matter decomposition).
2.1.1. Ecosystem process: biomass production
The rate at which biomass is generated, both by autotrophic and heterotrophic organisms, is a key
process supporting the functioning of a viable ecosystem. Primary production, via photosynthesis and
chemosynthesis, provides the biomass to support secondary production, thereby allowing energy and
nutrient transfer across trophic levels (Figure 2). Secondary production is widely accepted as a critical
ecosystem process and is regularly used as a functional metric. Phytoplankton, chemosynthetic
microbes, macroalgae and angiosperms are the main primary producers in temperate marine ecosystems
(Table 1), supporting heterotrophic microbes, zooplankton, nekton and benthic invertebrates via trophic
links. In addition, both primary and secondary production generate by-products that support other
ecosystem functions (e.g. ecosystem metabolism, nutrient cycling).

13
Table 1. Ecosystem functions associated with differing marine biological components (functions modified from Giller et al. 2004). Expert judgment was used
to allocate low (1) to high (5) values for spatial extent/prevalence (first value), presence, i.e. standing biomass/abundance (second value) and functional rate
(third value). Values have been multiplied together to generate a summary value of the potential functional output.
Biological component
Ecosystem process Ecosystem function Microbes Phytoplankton Zooplankton Macroalgae Angiosperms Benthic invertebrates Higher trophic
levels1
Biomass production
Primary productivity 5*1.5*3.5=26.25 4*2.5*5.5=55 2*5*3.5=35 1*5*3.5=17.5
Secondary
productivity 5.5*2.5*3.5=48.125 4.5*3*4.5=60.75 3.5*3*3.5=36.75 4.5*2*1.5=13.5
Organic matter
transformation
Organic matter
decomposition and
removal 5*2.5*4.5=56.25 4*3*4.5=54 3*3*3.5=31.5 4*2*1.5=12
Import/export of
organic matter 4*2.5*5.5=55 4*3*4.5=54 2*5*3.5=35 1*5*3.5=17.5 3*3*3.5=31.5 4*2*1.5=12
Ecosystem
metabolism
Carbon mineralization 5*3*4.5=67.5 4*3.5*4.5=63 3*3.5*3.5=36.75 4*2.5*1.5=15
Oxygen consumption 5*2.5*4.5=56.25 4*3*4.5=54 3*3*3.5=31.5 4*2*1.5=12
Oxygen production 4*3*5.5=66 2*5.5*3.5=38.5 1*5.5*3.5=19.25
Elemental cycling
Denitrification 2*2.5*4.5=22.5
Nitrification 5*2.5*4.5=56.25
Nitrogen fixation 4*2.5*4.5=45
Exchange of limiting
nutrients 5*3*4.5=67.5 4*3*5.5=66 4*3.5*4.5=63 2*5.5*3.5=38.5 1*5.5*3.5=19.25 3*3.5*3.5=36.75 4*2.5*1.5=15
Physical structuring
Bioturbation 3*3*3.5=31.5
Habitat provision 2*5.5*3=33 1*5.5*3=16.5 3*3.5*3=31.5
Water velocity and
particle flux
modification 2.5*5.5*3=41.25 1.5*5.5*3=24.75 3.5*3.5*3=36.75
1 Fish, cephalopods, seabirds, reptiles and marine mammals.
14
Table 2. Criteria used to estimate the spatial extent, presence and functional rate of biological components examined by ecosystem function.
Spatial Extent Presence Rate
Score Regions
Habitats
Body size Abundance
Primary
production
Secondary
production Body size Limitation
1 Few regions Some habitats
Micro Low + 0.5 - 0.5 Mega Low/high
2 Some regions
Some habitats
Micro High + 0.5 - 0.5 Macro High
3 Some regions
Many habitats
Macro Low + 0.5 - 0.5 Macro/Micro Low
4 Many regions
Some habitats
Macro High + 0.5 - 0.5 Micro High
5 Many regions
Many habitats
Mega - + 0.5 - 0.5 Micro Low

15
2.1.1.1. Ecosystem function: primary production
The primary route of carbon fixation is photosynthesis, although the required context of functional
importance necessitates the separation of the biological components of biodiversity. Phytoplankton
photosynthetically fixes up to 50,000 Tg of carbon per year, contributing to nearly half of global primary
production (Longhurst et al., 1995) (on average 140 g C m−2 yr−1 Falkowski et al., 1998).
In addition, photosynthetic carbon fixation by macroalgal kelps such as the giant kelp Macrocystis
pyrifera, ranges from 0.46 to 3.50 kg C m-2 yr-1, with fucoid species contributing around 0.30 to 1.30
kg C m-2 yr-1 (Lüning 1990; Barrón et al., 2003). Seagrass meadows are also highly productive habitats
contributing an estimated mean net community productivity of 1.19 kg C m-2 yr-1 (Duarte et al., 2010).
Suzuki (1997) suggests that the total global area of marine macroalgae and angiosperms is approx.
600,000 km2 producing approx. 0.460 Tg C yr-1. Muraoka (2004) suggests that this is equal to 23% of
the total of oceanic carbon dioxide uptake estimation by Siegenthaler and Sarmiento (1993). Microbes
can also synthesize inorganic carbon using reduced chemical compounds as energy sources,
contributing to about 52% of carbon fixation globally via microbial nitrification processes (estimated
addition of organic matter approx. 7700 Tg C y-1; Middelburg, 2011). This suggests that chemosynthetic
processes can be quantitatively more important than previously thought (Molari et al. 2013). Despite
this, there have been no investigations of microbial BEF associated with chemosynthetic primary
production.
Although oceanic autotrophs account for approximately 46 % of the biospheric net primary production,
they only account for about 0.2% of the global primary producer biomass (Field et al., 1998), and so
standing biomass does not reflect production (Cebrian, 2002). However, many BEF-related studies have
identified positive relationships between phytoplankton species richness (taken as an indicator of
biodiversity) and primary production (Balvanera et al. 2006; Cardinale et al. 2006; Cardinale et al.
2007; Hector et al. 2007; Ptacnik et al. 2008; Goebel et al., 2014). Experimental studies have revealed
positive, asymptotically saturating relationships between ecosystem-wide phytoplankton diversity and
productivity (Goebel et al., 2014). Within the positive BEF relationships identified, both identity effects

16
and complementarity can produce positive diversity-productivity relationships (Loreau and Hector
2001; Cardinale et al., 2006).
Both negative (Kraufvelin et al., 2010; Bracken and Williams, 2013) and positive BEF relationships
have been reported within macroalgal assemblages in the context of photosynthetic carbon fixation
(Bruno et al., 2005; Arenas et al., 2009; Boyer et al., 2009; Griffin et al., 2009). Although not using an
experiment designed to specifically test the relationship between diversity and productivity, Kraufvelin
et al. (2010) observed declining primary production within increasing macroalgal species richness in
temperate rocky shores (SE Norway) driven by strong identity effects associated with the resident
fucoids. A similar relationship was observed by Bracken and Williams (2013) for seaweed assemblages
in a northern California (USA) rocky shore, where photosynthetic efficiency was used as an indicator
of primary production. Unlike many other studies, experimental species richness gradients species
richness gradients were obtained through random allocation (typical of most studies) and non-random
methods (mimicking naturally occurring assemblages). While increases in species richness did not lead
to changes in function when species were randomly combined, a negative relationship with
photosynthetic efficiency was detected when using realistic (non-randomly selected) assemblages
(although no relationship was found with maximum photosynthetic rate). Alternatively, Griffin et al.
(2009) found that functional diversity of rock pool macroalgae (a measure of the range of species
functional traits in the system; Tilman, 2001), rather than species richness, correlated positively with
primary productivity. However, the consistency of such BEF relationships may be weakened in natural
trophic structures, as typical BEF experiments do not include consumers. Indeed, Reynolds and Bruno
(2012) incorporated herbivores in their macroalgal treatments and showed that the positive relationship
observed between macroalgal diversity and primary production disappeared in the presence of
consumers. Doubt thus remains about the predictability of potentially positive BEF relationships
between macroalgae and carbon fixation in real ecosystems.
Regardless of whether species richness (Bruno et al., 2005, Lanari and Coutinho, 2014) or functional
diversity (Griffin et al., 2009) is used, species identity appears to be an important driver in determining
the rate of primary production in macroalgae (with the exception of Boyer et al., 2009), even when
17
negative BEF relationships are considered (Kraufvelin et al., 2010). Davies et al. (2011) found that
individual species biomass explained observed changes in primary production in macroalgae
assemblages, and that this could be related proportionally to the effect of changes in single species
biomass. This effect was also observed in similar experiments with saltmarsh plants and indicates that
biomass may in some circumstances underlie identity effects in primary producer BEF relationships,
thereby complicating the importance of biodiversity per se for the sustenance of primary production in
such systems.
Angiosperm studies provide the only substantial evidence for the role of genetic diversity within BEF
relationships for productivity. Positive BEF relationships were apparent between seagrass genetic
diversity (Zostera marina) (Williams, 2001; Hughes and Stachowicz, 2004; Ehlers et al., 2008; Hughes
and Stachowicz, 2009; Hughes et al., 2010) and primary productivity, and also between angiosperm
species richness (seagrass and transitional angiosperms in the Baltic) and primary productivity
(Gustafsson and Bostrӧm, 2011). Genetic diversity was found to be particularly important for sustaining
primary production during stressful conditions or following perturbations (Williams, 2001; Hughes and
Stachowicz, 2004; Ehlers et al., 2008; Hughes and Stachowicz, 2009). Reusch et al. (2005) found that
genetically diverse treatments also supported more epiphytic fauna, suggesting the influence of genetic
diversity can propagate through to changes in secondary productivity. However, Hughes et al. (2010)
found that BEF relationships were heavily influenced by grazer species identity. Overall, it is apparent
that this relationship cannot be generalized and the context (i.e. the wider system of which angiosperms
are part, including grazers) is a determinant factors affecting BEF relationships.
2.1.1.2. Ecosystem function: secondary production
Within microbial assemblages, about half of the carbon fixed into marine organic matter is consumed
by heterotrophic prokaryotes (both direct consumption of primary production and undirected detritus
sources). Typically only approx. 20% of the detrital organic pools used to sustain heterotrophic
metabolism is converted into prokaryotic biomass, whereas most is respired (del Giorgio and Cole,
1998). Prokaryotic biomass thus transfers some energy and material to the higher trophic levels of the
marine food webs (Di Poi et al., 2013) and its metabolism largely contributes to carbon mineralization
18
and respiration rates of benthic ecosystems (Arndt et al., 2013). Investigations of the links between
prokaryotic diversity and functioning in marine ecosystems are, however, rare. Available studies
indicate a positive relationship between prokaryote diversity and prokaryote carbon conversion
efficiency and metabolism (Danovaro and Pusceddu 2007; Langenheder et al., 2010), i.e. a higher
prokaryotic diversity can promote higher levels of secondary production.
Their global distribution, abundance and dominance, makes ciliates among protozoa, and the copepods
and euphausiids among metazoa, perhaps the most significant primary consumers. Despite their
importance for secondary production (Irigoien et al., 2004; Johnson et al., 2011), nutrient cycling and
the translocation of organic matter, there have been no studies examining its BEF relationships. This
may be due to difficulties in working with species with small body sizes, occupying intermediate trophic
levels and detecting small changes in functional output. Although there are some freshwater and tropical
studies, there is little to extrapolate these findings to temperate, marine situations.
Capture and conversion of pelagic and benthic primary production into benthic secondary production
is one of the most important functions undertaken by benthic invertebrates (Fowler and Knauer 1986).
Benthic biomass is in turn consumed by mobile epifaunal species and fish, thereby supporting other
trophic levels and pelagic habitats (Townsend and Cammen, 1988). Evidence for clear and consistent
relationships between macrofaunal biodiversity and secondary production is lacking, as both positive
(O’Gorman et al., 2008; Harvey et al., 2013) and no (Valdivia et al., 2009) relationships have been
reported for this component. However such relationships are likely to be of less relevance in relation to
the importance of macrofaunal biomass and identity in predicting secondary production, given the well-
established paradigm that secondary productivity decreases with increasing macrofaunal size
(production to biomass (P:B) ratio increases with a decrease in size, shorter longevity and age of an
organism; Jennings et al., 2002; Gray and Elliott, 2009). As the historical separation between
macrofauna and meiofauna in the literature is artificially stipulated by separation at 500 and 63 µm
sieves respectively, and that both components include different life stages of the same organisms, this
attribute is also likely to apply to meiofauna (Higgins and Thiel, 1988). Thus, it seems that secondary
19
production may more easily be predicted by macrofauna and meiofauna abundance and biomass, and
that biodiversity may thus be a less useful predictor for monitoring purposes.
The meiofaunal biomass turnover rate is on average 5 times higher than that of macrofauna and, despite
having a lower biomass (Giere, 2009), this component frequently exceeds the production of
macrofaunal assemblages. The potential significance of meiofauna in the functioning of benthic
sedimentary environments has been examined within relatively low diversity, free-living nematode
communities, whose biodiversity (measured through a set of different indices, including, for example,
species richness, Shannon diversity, functional diversity as number of trophic traits) is generally related
positively with rates of biomass production and heterotrophic prokaryotic carbon production (Danovaro
et al. 2008a; Danovaro et al. 2008b, Pusceddu et al. 2014). The shape of this positive relationship (linear
to exponential functions) varied when habitats from different water depths were considered (Danovaro
et al. 2008b). Experimental responses of natural nematode assemblages to thermal stress led Gingold
et al. (2013) to hypothesize that either (saturating) rivet-like or idiosyncratic relationships are equally
probable between nematode species richness and secondary production. Due to the constraints of the
manipulative meiofauna experiments, only correlations between free-living nematodes biodiversity and
ecosystem functioning have been investigated (Danovaro et al. 2008b, Leduc et al. 2013, Pusceddu et
al. 2014). Although nematodes can dominate some meiofaunal communities (e.g. estuaries examined
by Alves et al. (2009), in other habitats they may only account for only a modest contribution to
community composition, suggesting that the potential for meiofaunal BEF relationships to exist within
these habitats remains largely to be investigated.
O’Gorman et al. (2008) found that as the diversity of predatory mobile epifaunal fish species increased
(with density controlled between treatments), there was an associated increasing trend in secondary
production for all intermediate trophic components examined (although only significant for 4 out of the
16 taxonomic components). The greater interference among predators might have been responsible for
the higher secondary production recorded in treatments with higher predator diversity, although there
is a possible effect of behavioural changes in feeding activity during confinement within the benthic
experimental cages. Using functional diversity, Harvey et al. (2013) found clear monotonic

20
relationships with two functional variables (consumption of macroalgae and of periphyton) which are
presumed to generate proportional increases in secondary production in a rocky shore community.
Despite very strong identity effects within the functional groups, functional richness did play a
substantial role in explained some of the variance in ecosystem functionality during removal treatments.
Seagrass habitats provide an additional source of BEF investigations within epiphytic consumer
assemblages. Although some studies have failed to find positive BEF relationships between grazer
diversity and grazer secondary production (Duffy et al., 2001, 2005, but only in the absence of higher
trophic level consumers; Canuel et al., 2007), others have detected them (Duffy et al., 2003, 2005, in
the presence of higher trophic level consumers; France and Duffy, 2006). A negative relationship was
observed by Duffy et al. (2001) within mesocosm experiments (lacking trophic levels above the grazers)
and it was associated with a low grazers species range (three rather than six species in Duffy et al.
(2003) and four species in Duffy et al. (2005)), indicating that grazer diversity effects on secondary
production may only be apparent at wider ranges of grazer richness (Duffy et al., 2003). The contrasting
findings between treatments by Duffy et al. (2005) were influenced by the presence of higher trophic
levels. Functioning did increase with richness when higher trophic predators were present. Duffy et al.
(2005) suggest that richness is linked to the enhanced epifaunal grazing pressure on resources and the
dampening of community fluctuation from predation pressure. France and Duffy (2006) developed this
theme by experimentally modifying grazer diversity, dispersal and spatial scale within a meta-
community structure. Richness within meta-community units and, to a less extent, the dispersal
potential affected the net productivity at multiple levels within experimental units and large meta-
communities. Most BEF relationships observed, both positive and negative, were underpinned by strong
species identity effects that sometimes obscured the influence of species richness alone. It was
suggested that the identity effects were mediated through a combination of qualitative and quantitative
differences in grazing methods and different population growth rates between species (Duffy et al.,
2001). Similarly, Canuel et al. (2007) found that identity effects dominated epifaunal grazer functions
that convert primary productivity, from seagrass and associated epiphytic algae, into organic matter

21
within the sediment, with grazer richness and food chain length having little or no influence (the latter
finding being in contrast to that of Duffy et al., 2005).
Fish and cephalopods are both opportunistic predators taking zooplankton, macroalgae and other fishes
and cephalopod species, and are themselves prey for other organisms (Cury et al., 2003), hence they
play a pivotal role in marine food webs by linking lower and upper trophic levels. Cephalopods
(particularly squid) have exceptionally high feeding rates (Clarke, 1996; Wells and Clarke 1996;
Hunsicker and Essington, 2008) and also sustain many marine predators, such as bony fish,
elasmobranchs, marine birds and mammals, especially whales (e.g. Clarke, 1996; Smale, 1996). Their
importance as prey is enhanced by their very high individual growth rates, which, together with other
life cycle characteristics (exclusively carnivorous diet, semelparity, short lifespan) leads to high
biomass turnover rates or productivity (Boyle, 2002). Despite this, there has been no investigation of
BEF relationships between fish or cephalopod diversity and temperate marine secondary production, a
fact most likely due to the higher mobility and longer life cycles of these organisms e.g. compared to
benthic invertebrates, leading to greater difficulties in undertaking manipulation experiments for testing
of BEF relationships. Equally, BEF does not appear to have been studies in seabirds and marine
mammals.
2.1.2. Ecosystem process: organic matter removal and transformation
The transformation of non-living organic matter encompasses the essential ecosystem functions that
distribute and remove organic matter from the ecosystem (Figure 1). The consumption of organic matter
is associated with an additional input of secondary production as well as with the mobilization of
nutrients in the system, both resources being made available for re-use in primary production processes,
via the microbial loop. Benthic invertebrate bioturbation can also bury matter thereby removing it from
the ecosystem (Figure 2). Almost all biological components move organic matter between habitats (e.g.
faecal production by zooplankton is particularly important for the vertical transport of organic matter
from the photic zone).
Organic material produced in the pelagic zone (e.g. as waste products of biological processes) is a
resource which is transferred and made available to the benthic system through settlement, with

22
zooplankton faecal pellets being believed to be the main biological vehicle for bentho-pelagic coupling.
Aggregates may disintegrate physically (Milligan and Hill, 1998), as well as being solubilized and
remineralized by micro-organisms (Smith et al., 1992) and zooplankton (Kiørboe, 2000) whilst settling.
A significant amount of dissolved organic matter (DOM) can also be released through inefficient
feeding, excretion and defaecation, which suggests that herbivory might be an important source of
bacterial substrate (Lampert, 1978; Gude, 1988). Despite the role of zooplankton in facilitating the flux
of organic matter to the seabed, there are no relevant BEF studies investigating the effect of zooplankton
diversity of such process. Larger animals also contribute to the horizontal and vertical transfer of
organic matter between ecosystems, in the form of living biomass (Stowasser et al., 2005; Hastie et al.,
2009). Fish and cephalopods are highly mobile animals and often undertake long feeding and spawning
migrations. Combined with their role as intermediate predators in marine food webs, this leads to
significant translocation of organic matter that can affect ecosystem functioning and community
structure on a seasonal and regional basis (Hastie et al., 2009). However, as with other ecosystem
functions, experimentation difficulties with large and mobile species may have contributed to the lack
of BEF evidence for these higher trophic components.
Both marine seagrass and macroalgal communities are significant sources of organic carbon to the
ecosystem, as more than 85% of temperate seagrass and macroalgal communities studied by Barrón et
al. (2012) supported a net dissolved organic carbon release. Furthermore, there are substantial amounts
of macrophyte-generated detritus exported to remote habitats where it provides a substantial organic
input (Harrold et al., 1998; Maslo and Lockwood 2014). Harrold et al. (1998) observed that significant
amounts of macroalgal biomass were being transported from the inshore habitats of production into
deep-water canyon systems.
Macrofaunal species are capable of substantial filtration/gathering of organic matter and sizeable
biodeposit production (Widdows et al., 1998; Arntz et al., 1999), especially in densely populated
epifaunal communities such as bivalve beds (Giles and Pilditch, 2006). Once consumed, material is
either assimilated into biomass or rejected in the form of faeces and pseudo-faeces (Wotton and
Malmqvist 2001). These biodeposits and the benthic invertebrate biomass are available for consumption

23
by other species, hence providing organic transfer between habitats and trophic levels (Snelgrove 1999).
The subsequent flux of bioavailable nitrogen compounds from metabolized biodeposits can be
considerable, leading to rapid recycling of nutrients, thereby enhancing rates of primary production and
phytoplankton biomass locally (references in Newell, 2004).
With regard to BEF relationships between macrofaunal diversity and organic matter-related ecosystem
functions, Godbold et al. (2009) documented a positive BEF relationship between species richness of
benthic echinoderms and the use of phytodetrital food sources. Equally, the merging of productivity,
decomposition and infiltration (water-drainage characteristics of the salt marsh) into one metric, termed
multifunctionality, by Hensel and Silliman (2013) increased as taxonomically diverse marsh-consuming
species were progressively combined within treatments. It was suggested that redundancy within the
system was low as each function was controlled by no more than two consumers, and that it is likely
that the apparent redundancy is reduced when more ecosystem functions are examined simultaneously.
As with almost all of the studies examined, both Godbold et al. (2009) and Hensel and Silliman (2013)
stated that functional differences between the species (i.e. identity effects – see glossary) were
responsible for the positive relationships between diversity and functionality.
Prokaryotic microbes are mostly responsible for organic decomposition (Cho and Azam, 1988; Arnosti,
2011), especially archaeal assemblages degrading detrital proteins (Lloyd et al., 2013) and recycling
organic matter (Takano et al., 2010). As with other microbial ecosystem functions, there are few studies
and hence less evidence for the presence of BEF relationships within microbial assemblages. Danovaro
and Pusceddu (2007), using prokaryotic diversity (through molecular fingerprinting analysis), observed
several positive relationships including one with organic matter decomposition rates. The diversity of
free-living nematodes and other meiofaunal species was also found to generally relate positively with
rates of organic matter degradation (Danovaro et al., 2008; Pusceddu et al., 2014; but in contrast see
Leduc et al., 2013 for null relationships).
2.1.3. Ecosystem process: ecosystem metabolism
In addition to nutrients and energy needed to support ecosystem functioning, other elements are
involved in the metabolic processes behind the production, consumption and decomposition of organic

24
matter (Figure 2). They can be both essential resources and waste products of ecosystem functions such
as carbon mineralization (using respiratory waste products from all biological components; Table 1),
oxygen consumption (metabolic precursor for all biological components) and oxygen production (net
excess of photosynthetic waste product from primary producers).
The relationship between carbon assimilation during primary production and oxygen production is
expressed by the photosynthetic quotient. This ratio typically lies between 1:1.1 and 1:1.4 (Laws, 1991;
Williams and Robertson, 1991), although deviations from these values can be observed depending on
the particular primary producer (e.g. macroalgae examined by Rosenberg et al., 1995). Hence net
oxygen production is approximately equal to the amount of carbon captured during primary production
suggesting that some of the BEF relationships related to primary production might help to understand
these metabolic functions. However, abiotic factors may substantially control some ecosystem
metabolic functions (e.g. the atmospheric control of dissolved oxygen content in open ocean water),
suggesting that BEF relationships probably have little influence; this may explain the absence of
dedicated studies for these ecosystem functions.
The dissolved oxygen generated during macroalgal and seagrass photosynthesis exceeds overall
consumption and constitutes a major contributor for water column oxygenation (Boudouresque et al.
2012). These sources can be particularly important in coastal areas where water bodies range from full
oxygen saturation to hypoxia. Seagrass root systems also permeate oxygen into the surrounding
sediments, exerting important controls on the depth of the redox transition in coastal areas (Queirós et
al., 2011). Based on the relationship provided by the photosynthetic quotient and the BEF evidence
with primary production (Williams, 2001; Hughes and Stachowicz, 2004; Ehlers et al., 2008; Hughes
et al., 2009; Hughes and Stachowicz, 2009), it is likely seagrass genetic diversity may well also relate
to oxygen production. This however is currently untested. There are some freshwater studies examining
oxygen production along gradients of macroalgal diversity (e.g. Power and Cardinale, 2009), but there
have been no marine studies that have specifically dealt with BEF relationships with this ecosystem
function.

25
Ammonia excretion, phosphate excretion and, in particular, oxygen uptake by marine zooplankton are
body-mass dependent and under the influence of habitat temperature, e.g. 84 to 96% of the observed
variation in metabolic rate of epipelagic marine zooplankton (Ikeda, 1985). Metabolic needs for
maintenance are a function of body weight raised by a power function of 0.75 (Kleiber, 1947), hence
energy requirements, oxygen consumption and carbon dioxide production decrease proportionally as
body size increases. This may suggest again that BEF relationships may not be as important as biomass
and/or species identity within certain functions.
Janson et al. (2012) examined a benthic invertebrate assemblage together with sediment and faunal
oxygen uptake rates in a temperate estuarine system. Faunal oxygen uptake correlated positively with
the species number of some, but not all, functional groups. Equally, abundance and biomass also
correlated with faunal oxygen uptake, suggesting other biotic factors were just as important in
modifying oxygen update, and hence carbon mineralization functions, as diversity. However, the
dominant influence over the total oxygen uptake was abiotic factors such as grain size, organic matter
content and temperature; this suggests that biotic influences on this ecosystem function are
proportionally smaller than abiotic factors.
Although macroscopic faunal components are important, benthic prokaryotic assemblages in the thin
oxic layer of the seabed account for more than half of the total organic carbon mineralization (Jørgensen
and Revsbech, 1989; Arndt et al., 2013), with respiration rates ranging from 1 to 10 μmol O2 cm−3 d−1
(Rasmussen and Jørgensen, 1992). Although biodiversity and ecosystem functioning studies have often
examined various aspects of ecosystem production, the specific functions relating to oxygen
consumption and carbon mineralization have been rarely studied. Leduc et al. (2013) observed no
relationships between species and functional nematode diversity with the sediment community oxygen
consumption in naturally highly diverse meiofaunal communities along the upper slope off New
Zealand. This was in contrast to the positive relationships detected by Danovaro et al. (2008b) and
Pusceddu et al (2014) within higher diversity meiofaunal assemblages, suggesting a breakdown of the
exponential BEF relationship at high levels of diversity, which may be due to increased competition or
greater functional redundancy (Leduc et al., 2013).
26
2.1.4. Ecosystem process: nutrient cycling
The C:N:P stoichiometry of phytoplankton ultimately controls the water column nutrient ratios, which
are subsequently modified by microbial reactions such as the microbial degradation of settling material,
nitrification, anaerobic ammonium oxidation (‘anammox’)/denitrification and nitrogen fixation (Figure
1). These microbial processes can significantly influence the overall budget of nitrogen availability and
can generate significant differences between oceanic regions (Gruber and Sarmiento, 1997). The
physical processes, such as the bioturbation of sediments by benthic invertebrates (Table 1), can also
increase the flux of nutrients released from sediment-based, microbial processes (Gray and Elliott,
2009).
2.1.4.1. Ecosystem function: denitrification, nitrification and nitrogen fixation
As denitrification is inhibited in the presence of oxygen, this process only occurs within anoxic water
and sediment conditions (Tiedje, 1988). By contrast, nitrogen fixation occurs in all of the oceanic basins
(Gruber and Sarmiento, 1997), with a major contribution from the marine diazotrophic cyanobacterium
Trichodesmium spp. (Carpenter, 1983) and secondarily from diatom genera Rhizosolenia and
Hemiaulus (containing the endosymbiotic nitrogen fixing cyanobacteria Richelia intracellularis)
(Arrigo, 2005 and references therein), accounting overall for an estimated increase in the current global
supply of nitrogen by 28 Tg N yr-1 (Gruber and Sarmiento, 1997). Seagrass meadows are also zones of
intense nitrogen fixation which can significantly contribute to the overall primary production (Welsh
2000). Despite the importance of denitrification, nitrification and nitrogen fixation in determining the
availability of nitrogenous products to other ecosystem processes, these functions have yet to be
examined in relation to biodiversity gradients. This paucity probably reflects the difficulty in defining
microbial biodiversity and measuring functional output within experimental manipulations.
2.1.4.2. Exchange of limiting nutrients
The availability of limiting compounds is also heavily modified by primary producer uptake and vice
versa. In addition to the use of inorganic sources, various phytoplankton species can use dissolved
organic nitrogen directly to meet their N needs and heterotrophic uptake of dissolved organic carbon
has been observed in a number of dinoflagellates (Lewitus and Caron, 1991) and chrysophytes (Wheeler

27
et al., 1977, Kristiansen, 1990). Bacterioplankton (Liu et al., 2010; Tappin et al., 2012) and
phytoplankton (Mulholland and Lee, 2009) can directly utilize oligopeptides by both external
hydrolysis and direct assimilation depending on molecular size. Ptacnik et al. (2008) and Goebel et al.
(2014) found positive BEF relationships in the phytoplankton. Using more than 3000 natural
phytoplankton samples, Ptacnik et al. (2008) found that the amount of algal carbon per unit total
phosphorus was positively related to genus richness suggesting a positive relationship between
phytoplankton diversity and resource use efficiency of the phytoplankton communities in freshwater
environments and the Baltic Sea. Goebel et al. (2014) also observed positive, asymptotically saturating
relationships between ecosystem-wide phytoplankton diversity and nutrient uptake. Complementarity,
and specifically facilitation, interactions between coexisting phytoplankton types were found to underlie
much of the positive relationship - the composition of traits in assemblages determining the magnitude
of complementarity and identity effects.
Macroalgal species assimilate both nitrate and ammonium from the water column (Naldi and Wheeler,
1999). Annual macrolagae act as carbon and nutrient (mainly nitrogen and phosphorus) sinks during
bloom periods and subsequently become sources during die off periods through leaf shedding, grazing
and mechanical breakage of leaves. Perennials, particularly those capable of forming dense stands such
as kelp forests, also represent significant elemental pools. Seagrasses are capable of assimilating
nitrogenous sources from both roots and leaves, although the uptake from the sediment, via the roots,
is the major source (e.g. Zostera marina; Short and McRoy, 1984). Both positive and negative BEF
relationships have been documented within macroalgal assemblages. Bracken and Stachowicz (2006)
observed a positive relationship between species richness and nitrogen assimilation, but only when both
ammonium and nitrate uptake rates were examined simultaneously, indicating increased resource
partitioning and hence complementarity within intertidal macroalgal assemblages. By contrast, a
decrease in nutrient uptake with increasing seaweed species richness was detected by Bracken and
Williams (2013) on rocky shores. This negative relationship was only apparent when they used realistic,
non-randomly assigned, species richness for treatments. This suggests that random species allocation
to treatments, typical of many BEF experiments, may significantly change the expression of BEF

28
relationships, potentially confounding many BEF findings. Positive relationships were also highlighted
between seagrass (Zostera marina) genetic diversity and nutrient cycling (Hughes et al. 2009; Hughes
and Stachowicz, 2004). As shown with other functions, genetic diversity was particularly important
following disturbance as pore water ammonium concentrations also decreased with increased genetic
diversity after disturbance (Hughes and Stachowicz, 2004).
Although sediment microbial activity is recognized as the main source of nutrients to the overlying
water column, ammonium excretion from benthic invertebrates can be a significant contribution to this
recycling function (Wotton and Malmqvist 2001; Jordan et al., 2009). The flux of nutrients, liberated
by microbial processes within the sediment, can be significantly enhanced by macrofaunal bioturbation
processes (Birchenough et al., 2012). Bioturbation can enhance nutrient cycling by as much as 35%
(Gutiérrez, 2011), and nutrients derived in this way can contribute up to 80% of those required by
pelagic primary producers (Dale and Prego, 2002). With the exception of one study (Bolam et al., 2002),
positive relationships between benthic invertebrate species richness and nutrient sediment flux were
present in several studies including Emmerson and Raffaelli (2000) (ammonium flux), Waldbusser et
al. (2004) (inverse phosphate flux), Ieno et al. (2006) (ammonium and phosphate), Bulling et al. (2010)
(ammonia only but not with phosphate) and Karlson et al. (2010) (nutrient incorporation within the
sediment through biodeposit production). In all of these studies, except for Karlson et al. (2010), identity
effects underpinned the observed BEF relationships, hence highlighting the overwhelming importance
of the role of individual species in affecting nutrient fluxes rather than species richness per se. Although
failing to detect either a positive or negative BEF relationship, Bolam et al. (2002) also suggested
identity effects were present and, expressed through functional diversity, are important in maintaining
nutrient fluxes. By contrast, Karlson et al. (2010) concluded that the positive, over-yielding relationship
between benthic macrofaunal deposit feeders and phytodetrial processing observed was mainly
explained by niche partitioning and/or facilitation (complementarity) rather than identity effects.
The importance of the role of individual species (hence identity effects) within infaunal BEF
relationships was also highlighted by Biles et al. (2003) who examined both species and functional
richness against ammonium release from sediments. In fact, while there was not a relationship between

29
nutrient flux and species richness, the use of functional richness (trait diversity) produced a stronger,
positive association with the studied ecosystem function, thus highlighting the potential value of traits
analysis to provide biodiversity measures for BEF assessment and operationalization while
compensating for identity effects (Biles et al., 2003; Hensel and Silliman, 2013). However, Emmerson
et al. (2001) showed that the effect of either benthic species richness or functional diversity on ammonia
release in intertidal areas varied spatially, with highly idiosyncratic relationships occurring in different
sites. Similarly Queiros et al. (2011) highlighted the influence of habitat complexity and sediment type
on the relative role of infaunal species as drivers of function. Hence, geographic location (and associated
abiotic environmental features) and species identity can significantly affect the expression of BEF
relationships, especially when underpinned by identity effects, therefore they need to be taken into
account while attempting to operationalize BEF relationships for monitoring purposes.
There are few studies examining BEF relationships in fish, cephalopod, seabird, reptile and mammal
assemblages. This is probably due to the difficulty of experimental manipulations with these animals in
controlled conditions, their occupation of higher trophic levels and possibly their probable small
contribution to these functions (Table 1). In studies other than temperate marine habitats, McIntyre et
al. (2007) (tropical freshwater lake system) and Allgeier et al. (2014) (tropical habitat) both found that
declining fish diversity reduced nutrient recycling processes. These relationships were dominated by
identity effects with relatively few species dominating nutrient recycling (McIntyre et al., 2007;
Allgeier et al., 2014).
2.1.5. Ecosystem process: physical environmental modification
The occurrence of many species provides habitat for others, such as dense vegetated habitats generated
by macroalgal and angiosperm beds (Table 1). Species adding complexity to seabed habitats tend to
accentuate BEF relationships by promoting additional diversity, which in turn can lead to elevated
functioning (Rilov et al., 2012; Kochmann et al., 2008). Ecosystem engineer species may also have a
disproportionate effect on the physical environment, which can improve conditions for other species or
significantly change other functional rates (Figure 2).

30
2.1.5.1. Ecosystem function: reef building, water velocity and particle flux/sedimentation modification
Epifaunal benthic invertebrates can be found in extremely high densities and generate biogenic
structures that can influence the physical environment and provide important habitat for other species
(Rigolet et al., 2014). The rugosity (complexity) and elevation of some of these structures is sufficient
to reduce flow rates and resuspension and increase accretion (Wildish and Kristmanson, 1984).
Macroalgae, such as the fucoids (order Fucales) intertidally and kelps (order Laminariales) subtidally,
are the main foundation species on most temperate hard substrata habitats (Jones et al., 1994). Both of
these macrophyte groups modify environmental parameters, for example, by providing moist intertidal
microclimates during emersion (Jenkins et al., 1999); modification of boundary conditions,
sedimentation and shoreline stabilization (Hull, 1987; Boudouresque et al. 2012, Infantes et al. 2012,
Jackson et al. 2013) and also providing a physical structure for colonization (Epifanio et al., 2003;
Rabaut et al., 2007).
With regard to BEF relationships within the context of provision of physical habitat, Williams (2001)
found a positive association between intra-specific genetic diversity within Z. marina and leaf shoot
density. Although Hughes and Stachowicz (2004) failed to find the same relationship under normal
growth conditions, following a period of intense grazing by wildfowl, they did find that more leaf
shoots, and hence greater habitat provision, remained in plots with higher genetic diversity, suggesting
greater resistance in these treatments. The greater remaining biomass may also lead to a greater output
of other functional products. There are no studies that have examined benthic invertebrate diversity and
habitat provision.
2.1.5.2. Ecosystem function: biomodification of the sediment matrix
Biomodification of the sediment matrix through bioturbation, bioirrigation, biodeposition and
biostabilisation (Gray and Elliott, 2009) are fundamental infaunal processes with implications for a
range of ecosystem functions. These activities exert significant influence over benthic sedimentary
geochemical environments through impacts on oxygen, pH and redox gradients (Lohrer et al., 2004;
Stahl et al., 2006; Pischedda et al., 2007; Queiros et al., 2011; Birchenough et al., 2012), contaminant
sequestration and release (Teal et al., 2009) and sediment granulometry (Montserrat et al., 2009),

31
biomodification processes affect bacterial activity and composition (Mermillod-Blondin, 2011;
Gilbertson et al., 2012), carbon (Kristensen, 2001) and nitrogen cycling (Gilbert et al., 1998; Emmerson
and Raffaelli, 2000). As with the nutrient fluxes discussed above, there are positive relationships
between species richness and sediment oxygenation/sediment mixing, as indicated by the depth of the
redox potential discontinuity layer (Waldbusser et al., 2004; Godbold and Solan, 2009). Waldbusser et
al. (2004) also observed that the variability of the oxygen flux was reduced in the multispecies
treatment, indicating that richness may also stabilize certain ecosystem functions. Both Waldbusser et
al. (2004) and Godbold and Solan (2009) suggest that the positive influence of species richness on
ecosystem function was again a product of identity effects mediated through functional traits, and that
higher levels of biodiversity reduce the relative influence of abiotic factors (Godbold and Solan, 2009).
2.1.6. Conclusions for operational requirement 1
The evidence for BEF relationships within different functions and for all biological components has
been summarized in Table 3. Biodiversity and ecosystem function relationships, stemming from both
taxonomic and functional diversity measures, were demonstrated in the literature for several functions
and biological components. The vast majority of the reported relationships were positive. However, not
all components or functions were involved, with notable knowledge gaps that might inhibit the
development of mechanisms that could convert biodiversity measures to holistic and realistic surrogates
of ecosystem function: this may ultimately prevent the application of BEF relationships for practical
monitoring roles.

32
Table 3. Biodiversity and ecosystem function relationship evidence summary table for the biological components of microbes, phytoplankton, zooplankton,
macroalgae, angiosperms, benthic invertebrates, fish and cephalopods.
Ecosystem process Ecosystem function Biological component with BEF
relationship evidence
Biodiversity
mechanism
underpinning BEF
relationship
Additional observations
Biomass production
Primary productivity
Phytoplankton1 Identity +
complementarity
Measuring biodiversity problematic
Macroalgae2 Identity >
complementarity
Both species and functional richness
Angiosperms – genetic diversity3 Not known
Particularly important during disturbance/stress
Angiosperms – species diversity4 Identity (species
only)
Tropical and Baltic studies only4
Secondary productivity
Microbes5 Not known Measuring biodiversity problematic
Benthic invertebrates6 Identity >
complementarity
Meiofaunal evidence sparse
Organic matter
transformation
Organic matter
decomposition and
removal
Microbes7 Not known One study only
Meiofauna8 Not known Conflicting evidence
Benthic macro-invertebrates9 Identity One study only
Import/export of
organic matter No evidence
Ecosystem
metabolism
Oxygen consumption
and carbon
mineralization
No evidence
The dominant influence of abiotic factors for some of these ecosystem functions
may suggest that BEF relationships have little influence and may explain the
absence of dedicated studies for these ecosystem functions.
Oxygen production No evidence
Nutrient cycling
Denitrification No evidence
Nitrification No evidence
Nitrogen fixation No evidence

33
Exchange of limiting
nutrients
Phytoplankton10 Complementarity
(facilitation)
Limited evidence base
Macroalgae11 Complementarity Additional trophic levels modified the BEF relationship12
Angiosperms13 - Genetic diversity
Benthic invertebrates14 Identity >
complementarity
Both species and functional richness19
Fish15 Identity Evidence from a freshwater and tropical system15
Physical
environment
modification
Bioturbation Benthic invertebrates14 & 16 Identity Reduced variability with richness also documented17
Reef building Angiosperms – genetic diversity18 Not known Conflicting evidence from normal and disturbed conditions
Water velocity, particle
flux and sedimentation No evidence
References
1 Balvenera et al., 2006; Cardinale et al., 2006; Hector et al., 2007
2 Bruno et al., 2005; Arenas et al., 2009; O’Lanari and Coutinho, 2014
3 Hughes et al., 2009; Williams, 2001
4 Terrados et al., 1998; Duarte et al., 2000; Gustaffsson and Bӧstrom, 2011
5 Danovaro and Pusceddu 2007; Langenheder et al., 2010
6 Duffy et al., 2003; Duffy et al., 2005; France and Duffy, 2006 ; Gorman et al., 2008; Harvey et al., 2013; Hensel and Silliman, 2013
7 Danovaro and Pusceddu, 2007
8 Danovaro et al., 2008; Pusceddu et al., 2014
9 Solan et al., 2004; Godbold et al., 2009; Queirós et al., 2011; Hensel and Silliman, 2013 10 Ptacnik et al., 2008
11 Grififn et al., 2009; Bracken and Stachowicz, 2006
12 Reynolds and Bruno, 2012
13 Hughes et al., 2009
14 Emmerson and Raffaelli, 2000; Waldbusser et al., 2004; Ieno et al., 2006; Bulling et al., 2010; Karlson et al., 2010

34
15 McIntyre et al., 2007 (freshwater lake system); Allgeier et al., 2014 (trophical system)
16 Waldbusser et al., 2004; Godbold and Solan, 2009
17 Waldbusser et al., 2004
18 Williams, 2001
19 Biles et al., 2003

35
The lack of evidence for positive BEF relationships could partly be due to a lack of studies investigating
specific functions (e.g., oxygen production/consumption and carbon mineralization) or specific
components (e.g., zooplankton, fish, cephalopods, seabirds and mammals in secondary production). In
some cases, the evidence supporting positive BEF relationships was sparse or inconsistent (e.g., large
variability in the response of the relationships between meiofaunal biodiversity and secondary
production), with limited representativity of the geographic area (e.g., positive relationship between
angiosperm species diversity and primary production was available for tropical and Baltic areas only)
or the marine habitat (e.g., nutrient recycling and fish diversity in freshwater). Methodological
influences were due to: 1) the small number of species typically used in BEF experiments (see
Stachowicz et al. 2007); 2) the definition and number of ecosystem functions used (few studies are
multi-functional); 3) the use of random or realistic biodiversity gradients; 4) the type of experiments
(laboratory, mesocosm or field trials); 5) experimental duration; 6) spatial replication, 7) an absence of
the simultaneous testing of abiotic factors, and 8) the number of trophic levels included (see below).
These all contributed to occasionally over-powering contextual dependency, further complicating the
determination of over-arching BEF relationships.
In several cases, trophic interactions added complexity and ambiguity to BEF relationships, preventing
clear generalizations between studies. As well as BEF relationships changing the availability of
functional products within an ecosystem, biodiversity itself can directly influence trophic dynamics. As
food web size increases (measured by the number of species) the number of feeding links per species
(linkage density) also increases (Christensen and Pauly, 1993). This increases the abundance of prey
available to predators in species rich food webs and may also have implications for redundancy within
the system. Therefore, food webs with higher biodiversity may both increase in overall available
resource and have a higher connectivity between trophic levels allowing for more routes for the
movement of these resources. For example, Finke and Denno (2004), Hillebrand and Cardinale (2004),
Spivak et al. (2007), O’Gorman et al. (2008), Edwards et al. (2010), Reynolds and Bruno (2012) and
Hensel and Silliman (2013) all found that changes in species richness at differing trophic levels also
induced structural and functional changes in adjoining levels. Changes in both the resource distribution

36
within a food web (via BEF boosted functions) and the structural changes associated with diversity
changes alone might induce or modify ‘trophic cascades’, thereby complicating the expression of
biodiversity induced changes to ecosystem functioning. In contrast, Borer et al. 2005 and O’Connor
and Bruno (2009) did not observed trophic changes with species richness. The meta-analysis of
terrestrial and marine studies by Borer et al. 2005 indicated that predator and herbivore taxonomy and
physiology were more influential in stimulating cascades than richness (i.e. identity effects). The
complexity of both trophic dynamics and BEF relationships make it particularly difficult to predict
overall ecosystem functioning with increasing biodiversity in one or multiple biological
components/trophic levels (Snelgrove et al., 2014). On balance, there are many studies to support the
BEF premise that biodiversity does influence ecosystem function. Negative relationships were rarely
evident or reported when compared with positive relationships.
2.2. Operational requirement 2: what biological components are required to represent
biodiversity within a BEF relationship?
Biodiversity is routinely represented and deconstructed into measureable, manageable and meaningful
components. Biodiversity assessments often focus on specific components (e.g., benthic infauna,
angiosperms, and fish) which are assumed to be representative or proxies for the biodiversity of the
ecosystem as a whole. Measuring a component of the system is usually easier and more cost effective
than measuring the overall system biodiversity, considering also that the expertise of the researchers
undertaking the assessment is often limited to one or few biological components. Translating BEF
relationships into workable monitoring applications requires that the biodiversity components selected
are also relevant to the given BEF relationship. It is therefore necessary to identify which biological
components are required to represent biodiversity within a given BEF relationship of interest. For
example, the use of angiosperms alone for estimating total regional primary production will be
inadequate unless phytoplankton and macroalgae can also be combined, as they can significantly
contribute to this function. It is therefore necessary to establish: 1) what biological components are
needed to be selected to represent biodiversity for assessing a particular ecosystem function, and 2)
what is their relative importance in influencing and contributing to the overall functional output.
37
By providing a framework for contextualizing individual biological components within multi-
component systems, Table 1 aids in the selection of the required biological components and practical
application of BEF relationships into monitoring programmes. This is a simplistic attempt to examine
functional output by biological component that does not include the interactions between biological
components and functions (e.g., the availability, routes or processes that the products of a certain
function are subsequently used within). It indicates that value may stem from indicating which
biological components should be prioritized in biodiversity measurement for use in operationalized
BEF monitoring (assuming a BEF exists for a specific component within the context of a specific
function). In addition, these results, in combination together with the gaps in BEF evidence highlighted
above for certain biological components and functions, indicate research priorities to allow the
appropriate assessment of ecosystem functioning at the regional level. For example there is a lack of
studies examining the microbe, phytoplankton and zooplankton assemblages, which, according to Table
1, may have a primary contribution to several ecosystem functions.
2.2.1. Conclusions for operational requirement 2
The scoring of the biological components indicates that the large BEF evidence gaps align with several
of the more functionally important components. For example, microbial processes generating primary
and secondary production, phytoplankton translocation of organic matter, zooplankton secondary
production and the physical engineers of habitats by benthic invertebrates. Hence for many of the main
ecosystem functions, there is insufficient evidence for enough contributing biological components to
adequately represent ‘biodiversity’ in many BEF relationships. The approach in Table 1 needs further
development to provide a confident ‘look-up’ tool for practical applications using BEF relationships.
2.3. Operational requirement 3: can the biodiversity of the selected biological components be
measured easily?
Having selected the appropriate biological components for a given BEF relationship of interest,
monitoring methodologies require that biodiversity of those components can be assessed and expressed
in compatible units. Measures of biodiversity used in most reviewed studies appear straightforward at
the macroscopic scale (e.g. macrofaunal species richness) and have tangible relationships with several

38
ecosystem functions. However, defining and measuring biodiversity in consistent and meaningful units
for the microscopic biological components, such as the microbial assemblages, and at the genetic scale,
poses significant challenges. For example, most of the prokaryotes cannot be identified by cultivation-
based approaches but require molecular analyses (16S rRNA genes). Recently, the transition from
Sanger sequencing to the next generation of high throughput sequencing technologies has opened new
horizons in exploring the biodiversity of prokaryotic assemblages (Giovannoni and Stingl 2005; Sogin
et al., 2006; Roesch et al., 2007; Caporaso et al., 2010). Next generation sequencing technologies
applied to 16S rRNA genes have not only increased the current databases, but also allows the
identification of rare bacterial taxa for which ecological significance is even more uncertain than that
of the dominant taxa (Sogin et al., 2006; Gobet et al., 2012).
Overall, applications incorporating BEF relationships require that the biodiversity measures of the
biological components selected are consistent, cost-effective to monitor and calculate, and mechanisms
to control the estimate bias associated with sampling limitations are in place. It is clear that the working
monitoring tools, based on BEF relationships, will potentially span several biological components and
that this must ultimately be represented as comparable and easily obtained measures of biodiversity.
The difficulty in defining biodiversity units within functionally important components, such as
microbes, not only prevents the development of practical BEF-based applications, but also compromises
the development of the underlying evidence base. Furthermore, insufficient knowledge is available on
the other measures tiers of biodiversity, such as genetic or guilds, to establish the most appropriate
measure of biodiversity for the combined components.
2.5. Operational requirement 4: how does biodiversity generate ecosystem function relationships?
Depending on the underlying BEF relationship mechanism, standard units used to describe structural
elements of biodiversity may not have the most direct relationship with specific functions and therefore
may require expression as alternative measures of biodiversity. For example, BEF relationships
underpinned by identity effects are often irregular (similar to riveted BEF models) when maintained in
structural biodiversity units. In this situation, taxonomic units may benefit from translation into
functional diversity using traits-based analysis, such as Biological Traits Analysis (e.g. Bremner, 2008),

39
into more standardized units that have a more uniform and linear relationship with ecosystem
functioning. For BEF relationships emerging from complementarity, direct (taxonomic) measures of
biodiversity, such as species richness, may be sufficient to express the influence of biodiversity.
Therefore, operational use of BEF relationships requires: 1) that the mechanism of delivery for each
BEF/biological component combination is known, and 2) that the units used to express biodiversity best
represent the mechanisms that underpin positive BEF relationships.
Unlike many of the terrestrial studies where complementarity is prevalent (Cardinale et al., 2007),
positive marine BEF relationships examined in the marine environment (this study and others, e.g.
Stachiwicz et al., 2007; Cardinale et al., 2012; Gamfeldt et al., in press) are mostly driven by identity
effects (Table 3). In many studies, the increased functional rates observed were mostly ascribed to the
presence of particular species (and their associated functional abilities or traits), rather than to an
increase in species diversity (e.g. richness) per se. As a result, functional diversity has been used on
several occasions within BEF research (e.g. through Biological Traits Analysis, BTA) (Emmerson and
Raffaelli, 2000; Emmerson et al., 2001; Bolam et al., 2002; Godbold and Solan 2009; Harvey et al.,
2013). When compared with species richness, the expression of biodiversity as functional diversity has
often provided a better relationship with ecosystem functionality (Griffin et al., 2009). However, despite
this, identity effects were still apparent in some of these studies (Norling et al., 2007; Griffin et al.,
2009), suggesting that trait-based analysis is insufficient to fully capture the underlying properties that
generate identity effects. Roles are often repeated across species within assemblages, suggesting that
different species differ in either their performance or influence. For example, Törnroos et al. (2014)
found that 66% of all of the possible traits measured in marine benthic macrofaunal species (in Northern
Europe) were still expressed despite a reduction in species richness from 151 to 6 taxa, indicating that
most traits (hence functional roles) are shared and categorical descriptions of species role are replicated
within natural assemblages. This suggests that identity effects are not just an expression of the species
functional role, as assessed with BTA, but also ‘role performance’ and/or ‘role influence’ are relevant
in determining the species contribution to the overall functioning of the system. The rate, efficiency or
influence of a particular role is not coded within BTA, and this is understandable considering how the
40
performance of any species can change depending on numerous factors including age, abundance,
habitat, community composition and environmental conditions (Queiros et al., 2011).
Despite the difficulty of attributing species with both categorical functional roles (e.g. BTA) and
quantitative information of role performance or influence, these approaches demonstrate a greater
capability to detect and compensate for identity effects in BEF relationships, thus allowing ecosystem
function to be estimated from species information. Furthermore, species providing disproportionate
contributions to overall functionality can be identified from structural community data rather than from
functional response experimentation. Knowing when and which species are functionally important
allows for focused species-based monitoring and management. Furthermore, if the information on role,
performance/influence and pressure sensitivity of species can be combined, it should also be possible
to model, and therefore predict, the vulnerability of functionally important species and the expected loss
of ecosystem functionality along a realistic gradient of species loss.
2.4. Operational requirement 5: what proportion of the overall variance of a given function is
explained by biodiversity?
Although a BEF relationship may be present for a particular function, there is also a need to determine
the contribution made by biodiversity to the total expression of a particular ecosystem function. It is
possible to detect a BEF relationship (operational requirement 1) yet have it only explain a very small
proportion of the functional variance because other factors, such as abiotic variables, actually dominate
the functional rates (Figure 3). For BEF-based monitoring, the contribution of biodiversity to
functioning must be sufficiently large to be detected above the influence of abiotic factors, or the relative
biotic and abiotic variability needs to be understood.

41
Figure 3. Representation of overall capacity for a single ecosystem function as a composite of three
equally important contributing factors. Hypothetical contribution of each factor show in red.
This review shows that studies rarely measure or consider the magnitude of the biodiversity influence
on ecosystem functions compared to other abiotic or biotic factors (Figure 3). Hence it is not possible
to determine the overall importance of operationalized BEF measures within the total ecosystem
functioning observed. Where abiotic factors have been also considered, it was clear that these may
modify the BEF relationship and have their own direct influence on functional rate (Biles et al., 2003;

42
Godbold and Solan, 2009; Bulling et al., 2010; Queiros et al., 2011). As such, the effects of biodiversity
may be of secondary importance when compared to the influence of other abiotic and biotic drivers of
ecosystem function (Goldbold, 2012) and may also be substantially transformed under changing abiotic
regimes (Gamfeldt et al., in press). The practical application using BEF relationships require that the
contribution of all of the factors (both biotic and abiotic) to ecosystem functioning are quantified and
any interactions between factors are known and can be compensated for.
The influence of biodiversity on ecosystem functioning is further complicated as different functions
will interact in an ecosystem, hence an increase in the functional output within one ecosystem function
may change the availability of resources or substrate for use in other ecosystem functions. At the same
time, this ‘spill-over’ enhancement effect can be modified by resource availability, with scarce or
limited resources likely generating the greatest spill-over augmentation. For example, an increase in
nitrogen fixation will also enhance primary and secondary production locally, the potential
enhancement or ‘spill-over’ in this case being determined by the amount of nitrogen fixed and the
existing availability of nitrogen locally. In contrast, dissolved oxygen for respiration may already be
sufficiently available from the atmospheric input that further biological inputs induce little or no
functioning benefit, e.g. as in eutrophication. It is also possible that the excessive supply of functional
product resources may in fact become detrimental to some adjoining trophic levels. For example, the
metabolic production of ammonium may benefit autotrophs but potentially be toxic to heterotrophs.
Furthermore, some functional products may be in a form that is unavailable for subsequent reprocessing.
Phytoplankton biomass is rapidly consumed by the zooplankton, however, the biomass produced in
seagrass beds is often high in refractory carbon and rarely consumed by secondary producers directly
(Kennedy and Björk, 2009).
The interactions outline above increase the difficulties in obtaining accurate predictions about the value
of BEF-induced functional spill-over to other biological components/trophic levels. With regard to
practical application of BEF relationships and meaningful reporting, these interactions may complicate
or overwhelm the response of individual ecosystem functions to biodiversity. However, considerations

43
of resource demand and functional spill-over does provide a framework for putting BEF relationships
within separate ecosystem functions and biological components into a multicomponent perspective.
3. Conclusions
Five important considerations were identified for the practical application of BEF relationships in
monitoring (i.e. operationalization), however the information required for immediate use is currently
lacking and therefore prevents wide-spread implementation of BEF-based functional monitoring. This
review reported many positive and some negative relationships within many biological components,
habitat and ecosystem functions. Null relationships were also reported. The consistency of the positive
and negative relationships was often low which complicates universal acceptance and confident use of
BEF relationships within monitoring application. Equally, some biological components and functions
have received little or no investigation. There was a notable shortage of studies examining BEF
relationships within microbial, phytoplankton, zooplankton, fish, cephalopod, seabird and marine
mammal components, which is most likely explained by methodological constraints. The benthic flora
and fauna have received the greatest amount of BEF research effort and as such, there is more scope for
trialling operationalized BEF-based monitoring within these systems - other habitats will probably
remain dependent on direct measures of functional processes for the time being. The other significant
information shortage is on the relative contribution of biotic and abiotic effects on functioning for
almost all biological components and ecosystem functions. Without this information it is not possible
to contextualize the influence of BEF relationships for overall functional expression.
Although there are significant short-comings of the evidence for BEF relationships in many biological
components and the interactions between biological components and ecosystem functions, e.g. trophic
cascades and functional spill-over. Evidence is also lacking for the value of biodiversity per se in
ecosystem functional responses, the approach shows promise as a cost-effective (especially when
structure measures of biodiversity are already being collected) and sensitive surrogate measure of a
substantial element of ecosystem functioning. The use of BEF relationships represents the ability to
examine ecosystem functions via the species-based apparatus of functional delivery, for example, the
genotypes, individuals, species and assemblages of ecosystems, rather directly measure ecosystem

44
functions. Furthermore, as long as the appropriate biological components are sampled, functional
surrogates derived from biodiversity should be able to provide proxy information on multiple functions
simultaneously unlike direct measures on single functions. Once the underlying evidence is in place, a
methodology using biodiversity-based estimates of ecosystem function is likely to be cost-effective and
complementary to other forms of monitoring (especially as components of biodiversity are routinely
sampled for several other purposes). Furthermore, it should also be theoretically possible to combine
existing information on the sensitivity of species with BEF relationships so that predictions of
biodiversity-induced ecosystem functioning can be generated from realistic scenarios of species loss.
This approach might be particularly informative for relationships underpinned by identity effects and
hence a reduced number of highly influential species. There is also the potential for the wide-scale
identification of species with strong identity effects for use as indicator species and functionally-
relevant surrogates of total biodiversity with BEF relationships. This may reduce the need for full
enumeration of the contributing biological components or initial translation of biodiversity into
functional diversity units, thereby potentially reduce the cost of operationalizing BEF relationships.
Despite the current lack of sufficient evidence to support each of the operational requirements described
above, it is still possible to establish a protocol highlighting how BEF relationships might contribute
within a realistic ecosystem function monitoring framework (Figure 4). Figure 4 suggests a process by
which 1) the initial functionality requirement is divided into constituent functions, 2) biodiversity is
sampled, 3) the biodiversity is expressed as comparable and functionally-relevant units, 4) biodiversity
is combined with other important contributors of the rate of ecosystem function (i.e. abiotic influences),
and 5) estimated ecosystem functions are recombined into overall assessments of ecosystem
functionality. Although the currently available information is insufficient for implementing this
protocol in practice, it constitutes a conceptual framework that will stimulate and direct future work
focusing on developing operational applications for BEF relationships.
Until the significant knowledge gaps described above are filled, BEF-based functional monitoring
remains highly attractive yet unachievable. The greater need for the inclusion of functional
considerations within wide-spread marine monitoring and assessment, (for example the MSFD),

45
without a proportional increase in resources to deliver them, will hopefully promote BEF research and
its adoption within useful practical applications.

46
1
Functionality deconstructed into
individual ecosystem functions.
Select relevant biological
components for each ecosystem
function (Table 1):
Likely functional
contribution
BC1 BC2 BC3
F1 0.3 0.7 0.0
F2 0.0 0.1 0.9
F3 0.8 0.0 0.2
F = ecosystem function
BC = biological component
2
Sample data:
F1 BC1 BC2
Richness 9 5
Abundance 100 300
If required, convert structural
biodiversity measures into other
functional relevant units (e.g. traits
for identity effect compensation):
F1 BC1 BC2
FBU 5 3
Abundance 100 300
FBU = functional biodiversity units
3
Adjust according to other factors
using comparable functioning
units:
Biod Abd Abio Scaled FU
BC1 5 7 2 12
BC2 1 9 5 15
FU = functional units
4
Combine BCs for overall
assessment of ecosystem function
output:
Scaled FU
BC1 BC2 Total
F1 12 15 27
Combination of comparable
functional measures for ecosystem
‘functionality’ with compensation
for potential spill-over:
F1 F2 F3 MF (Σ F)
Site A 27 45 5 2505
Site B 2900 100 12 3012
MFU = multifunction units
Output ecosystem functionality (multi-metric)
Figure 4. Potential framework for the practical application of BEF relationships within marine ecosystem functionality monitoring.

47
Future work must strive to detail BEF relationships from more ecosystem functions and especially from
under-reported biological components. Many of the biological components that potentially contribute
the most to functional delivery have received the least amount of attention, for example, because of the
difficulty in measuring and defining biodiversity, which also needs addressing if BEF research and
useable working applications are to develop. Further work is also required to understand the influence
of biotic and abiotic on ecosystem functions and the interaction between functions (mutual inducement
and spill-over), in order to possibly generalize them for operational purposes. Detailed work is required
to understand both the functional form of BEF relationships over realistic spatial and temporal gradients
of biodiversity as well as the impact of scale. Although they have not been addressed in detail in this
review, the shortcomings of Biological Trait Analysis to fully compensate for identity effects need to
be better understood and the role performance and/or influence needs to be better represented within
these tools for the translation of identity effects.
Acknowledgements
This review has resulted from the DEVOTES (DEVelopment Of innovative Tools for understanding
marine biodiversity and assessing good Environmental Status) project funded by the European Union
Seventh Programme for research, technological development and demonstration, ‘The Ocean of
Tomorrow’ Theme (grant agreement no. 308392), www.devotes-project.eu.

48
References
2008/56/EC, D. Directive 2008/56/EC of the European Parliament and of the Council of 17 June 2008
establishing a framework for community action in the field of marine environmental policy (Marine
Strategy Framework Directive). E. Commission.
Allgeier, J.E., Layman, C.A., Mumby, P.J. and Rosemond, A.D. 2014. Consistent nutrient storage and
supply mediated by diverse fish communities in coral reef ecosystems. Global Change Biology,
doi: 10.1111/gcb.12566.
Alves, A. S., Adao, H., Patrício, J., Neto, J. M., Costa, M. J., & Marques, J. C. 2009. Spatial distribution
of subtidal meiobenthos along estuarine gradients in two southern European estuaries (Portugal).
Journal of the Marine Biological Association of the United Kingdom, 89(08), 1529-1540.
Arenas, F., Rey, F., and Sousa Pinto, I. 2009. Diversity effects beyond species richness: evidence from
intertidal macroalgal assemblages. Marine Ecology Progressive Series, 381, 99-108.
Arndt S., Jørgensen B.B., LaRowe D.E., Middelburg J.J., Pancost R.D., Regnier P. 2013 Quantifying
the degradation of organic matter in marine sediments: A review and synthesis. Earth-Science
Reviews 123, 53–86
Arnosti, C. 2011. Microbial extracellular enzymes and the marine carbon cycle. Annual Review of
Marine Science, 3, 401-425.
Arntz, W.E., Gili, J.M. and Reise, K. 1999. Unjustifiably ignored: Reflections on the role of benthos in
marine ecosystems. Dordrecht, Springer.
Arrigo K.R. 2005. Marine microorganisms and global nutrient cycles. Nature, 437, 349-355.
Atkins, J. P., Burdon, D., Elliott, M., & Gregory, A. J. 2011. Management of the marine environment:
integrating ecosystem services and societal benefits with the DPSIR framework in a systems
approach. Marine Pollution Bulletin, 62(2), 215-226.

49
Balvanera, P., Pfisterer, A.B., Buchmann, N., He, J.S., Nakashizuka, T., Raffaelli, D. and Schmid, B.
2006. Quantifying the evidence for biodiversity effects on ecosystem functioning and services.
Ecological Letters, 9, 1146-1156.
Barrón, C., Apostolaki, E. T., and Duarte, C. M. 2012. Dissolved organic carbon release by marine
macrophytes. Biogeosciences Discussions, 9(2), 1529-1555.
Barrón, C., Marbá, N., Duarte, C.M., Pedersen, M.F., Lindblad, C., Kersting, K., Moy, F. and Bokn, T.
2003. High Organic Carbon Export Precludes Eutrophication Responses in Experimental Rocky
Shore Communities. Ecosystems, 6, 144-153.
Biles, C. L., Solan, M., Isaksson, I., Paterson, D. M., Emes, C., and Raffaelli, D. G. 2003. Flow modifies
the effect of biodiversity on ecosystem functioning: an in situ study of estuarine sediments. Journal
of Experimental Marine Biology and Ecology, 285, 165-177.
Birchenough, S.N.R., Parker, R.E., McManus, E. and Barry, J. 2012. Combining bioturbation and redox
metrics: Potential tools for assessing seabed function. Ecological Indicators, 12(1), 8-16.
Bolam, S.G., Fernandes, T.F. and Huxham, M. 2002. Diversity, biomass, and ecosystem processes in
the marine benthos. Ecological Monographs, 72(4), 599-615.
Borer, E.T., Seabloom, E.W., Shurin, J.B., Anderson, K.E., Blanchette, C.A., Broitman, B., Cooper,
S.D and Halpern, B.S. 2005. What determines the strength of a trophic cascade? Ecology, 86(2),
528-537.
Boudouresque, C.F., Bernard, G., Bonhomme, P., Charbonnel, E., Diviacco, G., Meinesz, A., Pergent,
G., Pergent-martini, C., Ruitton, S. and Tunesi, L. 2012. Protection and conservation of Posidonia
oceanica meadows. RAMOGE and RAC/SPA publ., Tunis 1-202.
Boyer, K. E., Kertesz, J. S., and Bruno, J. F. 2009. Biodiversity effects on productivity and stability of
marine macroalgal communities: the role of environmental context. Oikos, 118(7), 1062-1072.
Boyle, P. 2002. Cephalopod biomass and production: an introduction to the symposium. Bulletin of
Marine Science, 71, 13-16.

50
Bracken, M.E. and Stachowicz, J.J. 2006. Seaweed diversity enhances nitrogen uptake via
complementary use of nitrate and ammonium. Ecology, 87(9), 2397-2403.
Bracken, M.E. and Williams, S.L. 2013. Realistic changes in seaweed biodiversity affect multiple
ecosystem functions on a rocky shore. Ecology, 94(9), 1944-1954.
Bremner, J. 2008. Species traits and ecological functioning in marine conservation and management.
Journal of Marine Biology and Ecology, 366, 37-47.
Bremner, J., Rogers, S.I. and Frid, C.L.J. 2003. Assessing functional diversity in marine benthic
ecosystems: a comparison of approaches. Marine Ecology Progress Series, 254, 11-25.
Bruno, J.F., Boyer, K.E., Duffy, J.E., Lee, S.C., and Kertesz, J.S. 2005. Effects of macroalgal species
identity and richness on primary production in benthic marine communities. Ecology Letters, 8(11),
1165-1174.
Bulling, M.T., Hicks, N., Murray, L., Paterson, D.M., Raffaelli, D., White, P.C., and Solan, M. 2010.
Marine biodiversity–ecosystem functions under uncertain environmental futures. Philosophical
Transactions of the Royal Society B: Biological Sciences, 365(1549), 2107-2116.
Canuel, E.A., Spivak, A.C., Waterson, E.J., and Duffy, J. 2007. Biodiversity and food web structure
influence short-term accumulation of sediment organic matter in an experimental seagrass system.
Limnology and oceanography, 52(2), 590-602.
Caporaso, J. G., Kuczynski, J., Stombaugh, J., Bittinger, K., Bushman, F. D., Costello, E. K., Knight,
R. 2010. QIIME allows analysis of high-throughput community sequencing data. Nature methods,
7(5), 335-336.
Cardinale, B.J., Srivastava, D.S., Duffy, J.E., Wright, J.P., Downing, A.L., Sankaran, M. and Jouseau,
C. 2006. Effects of biodiversity on the functioning of trophic groups and ecosystems. Nature, 443,
989-992.

51
Cardinale, B.J., Wright, J.P., Cadotte, M.W., Carroll, I.T., Hector, A., Srivastava, D.S., Loreau, M. and
Weis, J.J. 2007. Impacts of plant diversity on biomass production increase through time because of
species complementarity. Proceedings of the National Academy of Sciences 104, 18123-18128.
Cardinale, B. J., Duffy, J. E., Gonzalez, A., Hooper, D. U., Perrings, C., Venail, P., Narwani, A., MacE,
G. M., Tilman, D., Wardle, D. A., Kinzig, A. P., Daily, G. C., Loreau, M., Grace, J. B., Larigauderie,
A., Srivastava, D. S. and Naeem, S. 2012. Biodiversity loss and its impact on humanity. Nature,
486: 59-67.
Carpenter, E. J. 1983. Nitrogen fixation by marine Oscillatoria (Trichodesmium) in the world’s oceans.
In: Carpenter, E.J. and Capone, D.G. (eds) Nitrogen in the Marine Environment, 65-103. Academic
Press, New York.
Cebrian, J. 2002.Variability and control of carbon consumption, export, and accumulation in marine
Communities. Limnology and Oceanography, 47(1), 11–22.
Chapin, F.S., Walker, B.H., Hobbs, R.J., Hooper, D.U., Lawton, J.H., Sala O.E. and Tilman, D. 1997.
Biotic Control over the Functioning of Ecosystems. Science, 277(5325), 500-504.
Cho, B. C. and Azam, F. 1988 Major role of bacteria in biogeochemical fluxes in the ocean's interior.
Nature, 332, 441-443.
Christensen, V. and Pauly, D. (Eds.). 1993. Trophic models of aquatic ecosystems (No. 26). WorldFish.
Clarke, M.R. 1996. Cephalopods as prey III. Cetaceans. Philosophical Transactions of the Royal
Society of London B, 351, 1053–1065.
Covich, A. P., Austen, M. C., Bärlocher, F., Chauvet, E., Cardinale, B. J., Biles, C. L., Inchausti, P.,
Dangles, O., Solan, M., Gessner, M.O., Statzner, B. and Moss, B. 2004. The Role of Biodiversity
in the Functioning of Freshwater and Marine Benthic Ecosystems. BioScience, 54(8), 767-775.
Cury, P., Shannon, L., and Shin, Y. J. 2003. The functioning of marine ecosystems: a fisheries
perspective. In Sinclair, M. and Valdimarsson G. (eds.) Responsible Fisheries in the Marine
Ecosystem, pp. 103. FAO/CAB International, Rome, Italy/Wallingford, UK.

52
Dale, A. W., and Prego, R. 2002. Physico-biogeochemical controls on benthic-pelagic coupling of
nutrient fluxes and recycling in a coastal upwelling system. Marine Ecology Progress Series, 235,
15-28.
Danovaro, R., Corinaldesi, C., Filippini, M., Fischer, U.R., Gessner, M.R., Jaqchet, S., Magagnini, M.
and Velimirov, B. 2008a. Viriobenthos in freshwater and marine sediments: a review. Freshwater
Biology, 53, 1186-1213.
Danovaro, R., and Pusceddu, A. 2007. Biodiversity and ecosystem functioning in coastal lagoons: does
microbial diversity play any role? Estuarine, Coastal and Shelf Science, 75(1), 4-12.
Danovaro, R., Gambi, C., Dell’Anno, A., Corinaldesi, C., Fraschetti, S., Vanreusel, A., Vincx, M. and
Gooday, A.J. 2008b. Exponential decline of deep-sea ecosystem functioning linked to benthic
biodiversity loss. Current Biology, 18, 1-8.
Davies, T. W., Jenkins, S. R., Kingham, R., Kenworthy, J., Hawkins, S. J. and Hiddink, J. G. 2011.
Dominance, biomass and extinction resistance determine the consequences of biodiversity loss for
multiple coastal ecosystem processes. PloS One, 6.12: e28362.
del Giorgio, P.A. and Cole, J.J. 1998. Bacterial growth efficiency in natural aquatic systems. Annual
Review of Ecology and Systematics, 29, 503–541.
Di Poi, E., Blason, C., Corinaldesi, C., Danovaro, R., Malisana, E., Fonda-Umani, S. 2013. Structure
and interactions within the pelagic microbial food web (from viruses to microplankton) across
environmental gradients in the Mediterranean Sea. Global Biogeochemical Cycles, 27(4), 1034-
1045
Dornelas, M., Gotelli, N.J., McGill, B., Shimadzu, H., Moyes, F., Sievers, C. and Magurran, A.E. 2014.
Assemblage time series reveal biodiversity change but not systematic loss. Science, 344, 296-299.
Duarte, C.M., Marbà, N., Gacia, E., Fourqurean, J.W., Beggins, J., Barrón, C., and Apostolaki, E.T.
2010. Seagrass community metabolism: Assessing the carbon sink capacity of seagrass meadows.
Global Biogeochemical Cycles, 24(4).

53
Duffy, E., Richardson, P.J. and Canuel, E.A. 2003. Grazer diversity effects on ecosystem functioning
in seagrass beds. Ecology Letters, 6(7), 637-645.
Duffy, E., Richardson, P.J. and France, K.E. 2005. Ecosystem consequences of diversity depend on
food chain length in estuarine vegetation. Ecology Letters, 8(3), 301-309.
Duffy, J.E. and Harvilicz, A.M. 2001. Species-specific impacts of grazing amphipods in an eelgrass-
bed community. Marine Ecology Progress Series, 223, 201-211.
Duffy, J.E. and Stachowicz, J.J. 2006. Why biodiversity is important to oceanography: potential roles
of genetic, species, and trophic diversity in pelagic ecosystem processes. Marine Ecology
Progressive Series, 311, 179–189.
Edwards, K.F., Aquilino, K.M., Best, R.J., Sellheim, K.L. and Stachowicz, J.J. 2010. Prey diversity is
associated with weaker consumer effects in a meta‐analysis of benthic marine experiments. Ecology
Letters, 13(2), 194-201.
Ehlers, A., Worm, B. and Reusch, T.B. 2008. Importance of genetic diversity in eelgrass Zostera marina
for its resilience to global warming. Marine Ecology Progress Series, 355, 1-7.
Elliott, M. and Quintino, V. 2007. The Estuarine Quality Paradox, Environmental Homeostasis and the
difficulty of detecting anthropogenic stress in naturally stressed areas. Marine Pollution Bulletin,
54, 640-645.
Emerson, C.W. 1991. A method for the measurement of bedload sediment transport and passive faunal
transport on intertidal sandflats. Estuaries, 14(4), 361-371.
Emmerson, M.C., and Raffaelli, D.G. 2000. Detecting the effects of diversity on measures of ecosystem
function: experimental design, null models and empirical observations. Oikos, 195-203.
Emmerson, M.C., Solan, M., Emes, C., Paterson, D.M. and Raffaelli, D. 2001. Consistent patterns and
the idiosyncratic effects of biodiversity in marine ecosystems. Nature, 411(6833), 73-77.

54
Epifanio, C.E., Dittel, A.I., Rodriquez, R.A. and Targett, T.E. 2003. The role of macroalgal beds as
nursery habitat for juvenile blue crabs, Callinectes sapidus. Journal of Shellfish Research, 22, 881-
886.
Falkowski P.G., Barber, R.T. and Smetacek, V. 1998. Biogeochemical Controls and Feedbacks on
Ocean Primary Production. Science, 281: 200-206.
Field, C.B., Behrenfeld, M.J., Randerson, J.T. and Falkowski, P. 1998. Primary production of the
Biosphere: Integrating Terrestrial and Oceanic Components. Science, 281(5374), 237–240.
Finke, D.L. and Denno, R.F. 2004. Predator diversity dampens trophic cascades. Nature, 429(6990),
407-410.
Fowler, S.W. and G.A. Knauer. 1986. Role of large particles in the transport of elements and organic-
compounds through the oceanic water column. Progress in Oceanography, 16(3), 147-194.
France, K.E., and Duffy, J.E. 2006. Diversity and dispersal interactively affect predictability of
ecosystem function. Nature, 441(7097), 1139-1143.
Gamfeldt, L., Lefcheck, J.S., Byrnes, J.E.K., Cardinale, B.J., Duffy, J.E., Griffin, J.N. 2014. Marine
biodiversity and ecosystem functioning: what’s known and what’s next? PeerJ PrePrints 2:e249v1
http://dx.doi.org/10.7287/peerj.preprints.249v1
Giere, O. 2009. Meiobenthology: the microscopic motile fauna of aquatic sediments. 2nd Edition,
Springer, Berlin
Gilbert, F., Stora, G., and Bonin, P. 1998. Influence of bioturbation on denitrification activity in
Mediterranean coastal sediments: an in situ experimental approach. Marine Ecology Progress
Series, 163, 99-107.
Glibert, P.M., Anderson, D.M., Gentien, P., Granéli, E. and Sellner, K.G. 2005. The global, complex
phenomena of harmful algal blooms. Oceanography 18(2): 136-147.
Gilbertson, W. W., Solan, M., and Prosser, J. I. 2012. Differential effects of microorganism–
invertebrate interactions on benthic nitrogen cycling. FEMS Microbiology Ecology, 82(1), 11-22.

55
Giles, H. and Pilditch, C. A. 2006. Effects of mussel (Perna canaliculus) biodeposit decomposition on
benthic respiration and nutrient fluxes. Marine Biology, 150(2), 261-271.
Giller, P., Hillebrand, H., Berninger, U.G., Gessner, M.O., Hawkins, S., Inchausti, P., Inglis, C., Leslie,
H., Malmqvist, B., Monaghan, M. T., Morin, P. J. and O'Mullan, G. 2004. Biodiversity effects on
ecosystem functioning: emerging issues and their experimental test in aquatic environments. Oikos
104(3), 423-436.
Gingold, R., Moens, T., Rocha-Olivares, A. 2013. Assessing the response of nematode communities to
climate change-driven warming: a microcosm experiment. PLoS One 8: e66653.
Giovannoni, S.J., Stingl, U. 2005. Molecular diversity and ecology of microbial plankton. Nature 437,
343-348.
Gobet, A., Boeer, S.I., Huse, S.M., van Beusekom, J.J.E., Quince, C., Sogin, M.L., Boetius, A. and
Ramette, A. 2012. Diversity and dynamics of rare and of resident bacterial populations in coastal
sands. ISME Journal, 6, 542–553.
Godbold, J.A. 2012. Effects of biodiversity-environment conditions on the interpretation of
biodiversity-function relations. Marine Biodiversity and Ecosystem Functioning: Frameworks,
Methodologies, and Integration, 101.
Godbold, J.A., & Solan, M. 2009. Relative importance of biodiversity and the abiotic environment in
mediating an ecosystem process. Marine Ecology Progressive Series, 396, 273-282.
Godbold, J.A., Solan, M. and Killham, K. 2009. Consumer and resource diversity effects on marine
macroalgal decomposition. Oikos, 118, 77-86.
Goebel, N.L., Edwards, C.A., Follows, M.J. and Zehr, J.P. 2014. Modeled diversity effects on microbial
ecosystem functions of primary production, nutrient uptake, and remineralization. Ecology, 95,
153–163.
Gray, J. S., and Elliott, M. 2009. Ecology of marine sediments: from science to management. Oxford
University Press.
56
Griffin, J.N., Méndez, V., Johnson, A.F., Jenkins, S.R. and Foggo, A. 2009. Functional diversity
predicts overyielding effect of species combination on primary productivity. Oikos, 118(1), 37-44.
Gruber, N., and Sarmiento, J. L. 1997. Global patterns of marine nitrogen fixation and denitrification.
Global Biogeochemical Cycles, 11, 235-266.
Gude, H. 1988. Direct and indirect influences of crustacean zooplankton on bacterioplankton of Lake
Constance. Hydrobiologia, 159, 63-73.
Gustafsson, C. and Boström, C. 2011. Biodiversity influences ecosystem functioning in aquatic
angiosperm communities. Oikos, 120, 1037-1046.
Gutiérrez, J.L., Jones, C.G., Byers, J.E., Arkema, K.K., Berkenbusch, K., Commito, J.A., Duarte, C.M.
et al. 2011. Physical ecosystem engineers and the functioning of estuaries and coasts. In:
Functioning of Estuaries and Coastal Ecosystems’ (Eds CHR Heip, CJM Philippart and JJ
Middelburg.) Elsevier, Amsterdam.
Harrold, C., Light, K. and Lisin, S. 1998. Organic enrichment of submarine-canyon and continental-
shelf benthic communities by macroalgal drift imported from nearshore kelp forests. Limnology
and Oceanography, 43, 669–678.
Harvey, E., Se´ Guin., A., Nozais, C., Archambault, P. and Gravel, D. 2013. Identity effects dominate
the impacts of multiple species extinctions on the functioning of complex food webs. Ecology,
94(1), 169–179.
Hastie, L.C., Pierce, G.J., Wang, J., Bruno, I., Moreno, A., Piatkowski, U. and Robin, J.P. 2009.
Cephalopods in the north-eastern Atlantic: species, biogeography, ecology, exploitation and
conservation. Oceanography and Marine Biology: An Annual Review, 47, 111-190.
Hector, A., Joshi, J., Scherer-Lorenzen, M., Schmid, B., Spehn, E.M., Wacker, L., Weilenmann, M.,
Bazeley-White, E., Beierkuhnlein, C., Caldeira, M.C., Dimitrakopoulos, P.G., Finn, J.A., Huss-
Danell, K., Jumpponen, A., Leadley, P.W., Loreau, M., Mulder, C.P.H., Nesshoover, C., Palmborg,
C., Read, D.J., Siamantziouras, A.S.D., Terry, A.C. and Troumbis, A.Y. 2007. Biodiversity and

57
ecosystem functioning: reconciling the results of experimental and observational studies.
Functional Ecology, 21, 998-1002.
Hensel, M.J. and Silliman, B.R. 2013. Consumer diversity across kingdoms supports multiple functions
in a coastal ecosystem. Proceedings of the National Academy of Sciences, 110(51), 20621-20626.
Higgins, R.P., and Thiel, H. 1988. Introduction to the study of meiofauna. Smithsonian Institution Press,
Washington, DC London, p 488.
Hillebrand, H. and Cardinale, B.J. 2004.Consumer effects decline with prey diversity. Ecology Letters,
7, 192–201.
Hooper, D. U., Adair, E. C., Cardinale, B. J., Byrnes, J. E., Hungate, B. A., Matulich, Gonzalez, A.,
Duffy, J.E., Gamfeldt, L. and O’Connor, M. I. 2012. A global synthesis reveals biodiversity loss as
a major driver of ecosystem change. Nature, 486(7401), 105-108.
Hughes, A.R. and Stachowicz, J.J. 2004. Genetic diversity enhances the resistance of a seagrass
ecosystem to disturbance. Proceedings of the National Academy of Sciences of the United States
of America, 101(24), 8998-9002.
Hughes, A.R. and Stachowicz, J.J. 2009. Ecological impacts of genotypic diversity in the clonal
seagrass Zostera marina. Ecology, 90(5), 1412-1419.
Hughes, A.R., Best, R.J. and Stachowicz, J.J. 2010. Genotypic diversity and grazer identity interactively
influence seagrass and grazer biomass. Marine Ecology Progress Series, 403, 43-51.
Hull, S.C. 1987. Macroalgal mats and species abundance: a field experiment. Estuarine and Coastal
Shelf Science, 25, 519–532.
Hunsicker, M.E. and Essington, T.E. 2008. Evaluating the potential for trophodynamic control of fish
by the longfin inshore squid (Loligo pealeii) in the Northwest Atlantic Ocean. Canadian Journal of
Fisheries and Aquatic Sciences, 65, 2524-2535.
58
Ieno, E.N., Solan, M., Batty, P. and Pierce, G.J. 2006. How biodiversity affects ecosystem functioning:
roles of infaunal species richness, identity and density in the marine benthos. Marine Ecology
Progress Series, 311, 263-271.
Ikeda T. 1985. Metabolic rates of epipelagic marine zooplankton as a function of body mass and
temperature. Marine Biology 85, 1-11.
Infantes, E., Orfila, A., Simarro, G., Terrados, J., Luhar, M., and Nepf, H. 2012. Effect of a seagrass
(Posidonia oceanica) meadow on wave propagation. Marine Ecology Progress Series, 456, 63-72.
Irigoien, X., Huisman, J. and Harris, R. P. 2004. Global biodiversity patterns of marine phytoplankton
and zooplankton. Nature, 429: 863-867.
Jackson, E.l., Griffiths, C.A. and Durkin, O. 2013. A guide to assessing and managing anthropogenic
impact on marine angiosperm habitat- part 1: Literature review. Natural England Commissioned
Reports, Number 111. MAIA Marine Protected areas in the Atlantic Arc report.
Janson, A., Denis, L., Rauch, M and Desroy, N. 2012. Macrobenthic biodiversity and oxygen uptake in
estuarine systems: the example of the Seine estuary. Journal of Soils and Sediments, 12, 1568-1580.
Jenkins, S.R., Hawkins, S.J. and Norton, T.A. 1999. Direct and indirect effects of a macroalgal canopy
and limpet grazing in structuring a sheltered inter-tidal community. Marine Ecology Progress
Series, 188, 81-92.
Jennings, S., Nicholson, M.D., Dinmore, T.A., Lancaster, J., 2002. The effect of chronic trawling
disturbance on the production of infaunal communities. Marine Ecology Progressive Series, 243,
251–260.
Johnson, C.L., Runge, J.A., Curtis, K.A., Durbin, E.G., Hare, J.A., Incze, L.S., Link, J.S., Melvin, G.D.,
O'Brien, T.D. and Guelpen, L.V. 2011. Biodiversity and ecosystem function in the Gulf of Maine:
pattern and role of zooplankton and pelagic nekton. PLoS One, 6: e16491.
Jones, C.G., Lawton, J.H. and Shachak, M. 1994. Organisms as ecosystem engineers. Oikos 69, 373-
386.

59
Jordan, M.A., Welsh, D.T., Dunn, R.J. and Teasdale, P.R. 2009. Influence of Trypaea australiensis
population density on benthic metabolism and nitrogen dynamics in sandy estuarine sediment: A
mesocosm simulation. Journal of Sea Research, 61(3), 144-152.
Jørgensen, B.B. and Revsbech, N.P. 1989. Oxygen uptake, bacterial distribution, and carbon–nitrogen-
sulfur cycling in sediments from the Baltic Sea-North Sea transition. Ophelia, 31(1), 29-49.
Karlson, A.M., Nascimento, F.J., Näslund, J. and Elmgren, R. 2010. Higher diversity of deposit-feeding
macrofauna enhances phytodetritus processing. Ecology, 91(5), 1414-1423.
Kennedy, H., and Björk,M. 2009. Seagrasses, in The Management of Natural Coastal Carbon Sinks in
Coastal Ecosystems: Investigating and Realising the Potential, edited by D. d’A Laffoley and G.
Grimsditch, pp. 23–30, IUCN, Gland, Switzerland.
Kiørboe T. 2000. Colonization of marine snow aggregates by invertebrate zooplankton: Abundance,
scaling and possible role. Limnology and Oceanography, 45, 479-484.
Kleiber, M. 1947. Body size and metabolic rate. Physiological Reviews, 27, 511–541.
Kochmann, J., Buschbaum, C., Volkenborn, N., and Reise, K. 2008. Shift from native mussels to alien
oysters: differential effects of ecosystem engineers. Journal of Experimental Marine Biology and
Ecology, 364(1), 1-10.
Kraufvelin, P., Lindholm, A., Pedersen, M. F., Kirkerud, L. A., and Bonsdorff, E. 2010. Biomass,
diversity and production of rocky shore macroalgae at two nutrient enrichment and wave action
levels. Marine Biology, 157(1), 29-47.
Kristensen, E. 2001. Impact of polychaetes (Nereis spp. and Arenicola marina) on carbon
biogeochemistry in coastal marine sediments. Geochemical Transactions, 2, 92-103.
Kristiansen, J. 1990. Phylum Chrysophyta. In Handbook of Protoctista. Margulis, L., Corliss, J.O.,
Melkonian, M., and Chapman, D.J. (eds). Boston, MA, USA: Jones and Bartlett, pp. 438–453.
Lampert, W. 1978. Release of dissolved organic carbon by grazing zooplankton. Limnology and
Oceanography, 23, 831-834.

60
Lanari, M.D.O. and Coutinho, R. 2014. Reciprocal causality between marine macroalgal diversity and
productivity in an upwelling area. Oikos, 123(5), 630-640.
Langenheder, S., Bulling, M. T., Solan, M., and Prosser, J. I. 2010. Bacterial biodiversity-ecosystem
functioning relations are modified by environmental complexity. PloS One, 5(5), e10834.
Laws, E. A. 1991. Photosynthetic quotients, new production and net community production in the open
ocean. Deep Sea Research Part A. Oceanographic Research Papers, 38(1), 143-167.
Leduc, D., Rowden, A.A., Pilditch, C.A., Maas, E.W., Probert, P.K. 2013. Is there a link between deep-
sea biodiversity and ecosystem function? Marine Ecology 34, 334–344.
Lewitus, A.J. and Caron, D.A. 1991. Physiological responses of phytoflagellates to dissolved organic
substrate additions. 1. Dominant role of heterotrophic nutrition in Poterioochromonas malhamensis
(Chrysophyceae). Plant Cell Physiology, 32, 671-680.
Liu, Z., Kobiela, M., McKee, G., Tang, T., Lee, C., Mulholland, M. and Hatcher, P. 2010. The effect
of chemical structure on the hydrolysis of tetrapeptides in seawater: AVFA and SWGA. Marine
Chemistry, 119, 108-120.
Lloyd, K. G., Schreiber, L., Petersen, D. G., Kjeldsen, K.U., Lever, M. A., Steen, A. Stepanauskas R.,
Richter M., Kleindienst S., Lenk S., Schramm A., Jørgensen, B. B. 2013. Predominant archaea in
marine sediments degrade detrital proteins. Nature, 496, 215-218.
Lohrer, A.M., Thrush, S.F., Gibbs, M.M. 2004. Bioturbators enhance ecosystem function through
complex biogeochemical interactions. Nature, 431, 1092-1095.
Longhurst, A., Sathyendranath, S., Platt, T. and Caverhill, C. 1995. An estimate of global primary
production in the ocean from satellite radiometer data. Journal of Plankton Research, 17(6), 1245-
1271.
Loreau, M. and Hector, A. 2001. Partitioning selection and complementarity in biodiversity
experiments. Nature, 413, 548.

61
Loreau, M., Naeem, S., Inchausti, P., Bengtsson, J., Grime, J. P., Hector, A., Hooper, D. U., Huston,
M. A. Raffaelli, D., Schmid, B., Tilman, D. and Wardle, D.A. 2001. Biodiversity and Ecosystem
Functioning: Current Knowledge and Future Challenges. Science, 294 (5543), 804-808.
Lüning, K. 1990. Seaweeds: Their environment, biogeography, and ecophysiology. C. Yarish and H.
Kirkman (Eds). Wiley-Interscience Publication, New York. 527 pp.
McIntyre, P.B., Jones, L.E., Flecker, A.S. and Vanni, M.J. 2007. Fish extinctions alter nutrient recycling
in tropical freshwaters. Proceedings of the National Academy of Sciences, 104, 4461-4466.
McLusky, D. and Elliott, M. 2004. The Estuarine Ecosystem: Ecology, Threats and Management, 3rd
edn. Oxford University Press, UK. 214 pp.
Mermillod-Blondin, F. 2011. The functional significance of bioturbation and biodeposition on
biogeochemical processes at the water–sediment interface in freshwater and marine ecosystems.
Journal of the North American Benthological Society, 30(3), 770-778.
Middelburg, J.J. 2011 Chemoautotrophy in the ocean. Geophysical Research Letter, 38, L24604.
Miligan, T. and Hill, P. 1998. A laboratory assessment of the relative importance of turbulence, particle
composition and concentration in limiting maximal floe size and settling behaviour. Journal of Sea
Research, 39, 227-241.
Molari, M., Manini, E. and Dell'Anno, A. 2013. Dark inorganic carbon fixation sustains the functioning
of benthic deep-sea ecosystems. Global Biogeochemical Cycles, 27, 212–221.
Montserrat, F., Van Colen, C., Provoost, P., Milla, M., Ponti, M., Van Den Meersche, K., Ysebaertb,
T. and Herman, P. M. 2009. Sediment segregation by biodiffusing bivalves. Estuarine, Coastal and
Shelf Science, 83(4), 379-391.
Mouillot, D., Villéger, S., Scherer-Lorenzen, M. and Mason, N.W. 2011. Functional structure of
biological communities predicts ecosystem multifunctionality. PloS One, 6(3), e17476.
Mulholland, M.R. and Lee, C. 2009. Peptide hydrolysis and the uptake of dipeptides by phytoplankton
Limnology and Oceanography, 54(3), 856-868.

62
Muraoka, D. 2004. Seaweed Resources as a Source of Carbon Fixation. Bulletin of Fisheries Research
Agency, Supplement 1, 59-63.
Naeem, S. 1998. Species redundancy and ecosystem reliability. Conservation Biology, 12(1), 39-45.
Naeem, S., Bunker, D.E., Hector, A., Loreau, M. and Perrings, C. 2009. Biodiversity, ecosystem
functioning, and human wellbeing. An ecological and economic perspective.
Naeem, S. and Wright, J.P. 2003. Disentangling biodiversity effects on ecosystem functioning: deriving
solutions to a seemingly insurmountable problem. Ecology Letters 6 (6), 567-579, 2003.
Loreau, M., Naeem, S. and Inchausti, P. 2002. Biodiversity and ecosystem functioning: synthesis and
perspectives. Oxford University Press.
Naeem, S. and Wright, J.P. 2003. Disentangling biodiversity effects on ecosystem functioning: deriving
solutions to a seemingly insurmountable problem. Ecology letters, 6(6), 567-579.
Naldi, M., and Wheeler, P. A. 1999. Changes in nitrogen pools in Ulva fenestrata (Chlorophyta) and
Gracilaria pacifica (Rhodophyta) under nitrate and ammonium enrichment. Journal of Phycology,
35(1), 70-77.
Newell, R. 2004. Ecosystem influences of natural and cultivated populations of suspension-feeding
bivalve molluscs: a review. Journal of Shellfish Research, 23(1), 51-62.
Norling, K., Rosenberg, R., Hulth, S., Grémare, A. and Bonsdorff, E. 2007. Importance of functional
biodiversity and species-specific traits of benthic fauna for ecosystem functions in marine sediment.
Marine Ecology Progress Series, 332, 11-23.
O’Connor, M.I. and Bruno, J. F. 2009. Predator richness has no effect in a diverse marine food web.
Journal of Animal Ecology, 78(4), 732-740.
O’Gorman, E.J., Enright, R.A. and Emmerson, M.C. 2008. Predator diversity enhances secondary
production and decreases the likelihood of trophic cascades. Oecologia, 158(3), 557-567.
Pandolfi, J.M. and Lovelock, C.E. 2014. Novelty Trumps Loss in Global Biodiversity. Science 344,
266-267.

63
Paterson, D.M., Defew, E.C. and Jabour, J. 2012. Ecosystem function and co-evolution of terminology
in marine science and management. Marine biodiversity and ecosystem functioning. M. Solan, R.
J. Aspden and D. M. Paterson, Oxford University Press, 1, 1-240.
Pimm, S.L., Russell, G.J., Gittleman, J.L. and Brooks, T.M. 1995. The Future of Biodiversity. Science
269(5222), 347-350.
Pischedda, L., Poggiale, J. C., Cuny, P. and Gilbert, F. 2008. Imaging oxygen distribution in marine
sediments. The importance of bioturbation and sediment heterogeneity. Acta biotheoretica, 56(1-
2), 123-135.
Power, L.D., and Cardinale, B.J. 2009. Species richness enhances both algal biomass and rates of
oxygen production in aquatic microcosms. Oikos, 118(11), 1703-1711.
Ptacnik, R., Solimini, A.G., Andersen, T., Tamminen, T., Brettum, P., Lepistö, L., Willén, E. and
Rekolainen, S. 2008. Diversity predicts stability and resource use efficiency in natural
phytoplankton communities. Proceedings of the National Academy of Sciences of the United States
of America, 105, 5134-5138.
Pusceddu, A., Gambi, C., Manini, E., Danovaro, R. 2007. Trophic state, ecosystem efficiency and
biodiversity of transitional aquatic ecosystems: analysis of environmental quality based on different
benthic indicators. Chemistry and Ecology 23, 505-515.
Pusceddu, A., Gambi, C., Corinaldesi, C., Scopa, M., Danovaro, R. 2014. Relationships between
meiofaunal biodiversity and prokaryotic heterotrophic production in different tropical habitats and
oceanic regions. PLoS One 9(3), e91056.
Queirós, A. M., J. G. Hiddink, G. Johnson, H. N. Cabral, and M. J. Kaiser. 2011. Context dependence
of marine ecosystem engineer invasion impacts on benthic ecosystem functioning. Biological
Invasions, 13, 1059-1075.
Rabaut, M., Guilini, K., Van Hoey, G., Vincx, M., & Degraer, S. 2007. A bio-engineered soft-bottom
environment: The impact of Lanice conchilega on the benthic species-specific densities and
community structure. Estuarine, coastal and shelf Science, 75(4), 525-536.

64
Rasmussen, H. and Jørgensen, B.B. 1992. Microelectrode studies of seasonal oxygen uptake in a coastal
sediment: role of molecular diffusion. Marine Ecology Progress Series, 81, 289–303.
Reiss, J., Bridle, J. R. Montoya, J. M. and Woodward, G. 2009. Emerging horizons in biodiversity and
ecosystem functioning research. Trends in Ecology and Evolution, 24(9), 505-514.
Reusch, T.B., Ehlers, A., Hämmerli, A. and Worm, B. 2005. Ecosystem recovery after climatic
extremes enhanced by genotypic diversity. Proceedings of the National Academy of Sciences of
the United States of America, 102(8), 2826-2831.
Reynolds, P.L. and Bruno, J.F. 2012. Effects of trophic skewing of species richness on ecosystem
functioning in a diverse marine community. PloS One, 7(5), e36196.
Rigolet, C., Dubois, S.F. and Thiébaut, E. 2014. Benthic control freaks: Effects of the tubiculous
amphipod Haploops nirae on the specific diversity and functional structure of benthic communities.
Journal of Sea Research, 85, 413-427.
Rilov, G., Mant, R., Lyons, D., Bulleri, F., Benedetti-Cecchi, L., Kotta, J., Queirós, A.M.,
Chatzinikolaou, E., Crowe, T. and Guy-Haim, T. 2012. How strong is the effect of invasive
ecosystem engineers on the distribution patterns of local species, the local and regional biodiversity
and ecosystem functions. Environmental Evidence, 1(10).
Roesch, L. F., Fulthorpe, R. R., Riva, A., Casella, G., Hadwin, A. K., Kent, A. D., Daroub, S.H.,
Camargo, F.A., Farmerie, W.G. and Triplett, E.W. 2007. Pyrosequencing enumerates and contrasts
soil microbial diversity. The ISME Journal, 1(4), 283-290.
Rosenberg, G., Littler, D.S., Littler, M.M. and Oliveira, E.C. 1995. Primary production and
photosynthetic quotients of seaweeds from Sao Paulo State, Brazil. Botanica Marina, 38, 369–377.
Scherer-Lorenzen, M. 2005. Biodiversity and ecosystem functioning: basic principles, in: Barthlott, W.,
Linsenmair, K.E., Porembski, S. (Eds.), Biodiversity: Structure and Function. Encyclopedia of Life
Support Systems (EOLSS). UNESCO, Eolss Publishers, Oxford ,UK.

65
Short, F. T., and McRoy, C. P. 1984. Nitrogen uptake by leaves and roots of the seagrass Zostera marina
L. Botanica Marina, 27(12), 547-556.
Siegenthaler, U. and Sarmiento, J.L. 1993 Atmospheric carbon dioxide and the ocean. Nature, 365, 119-
125.
Smale, M.J. 1996. Cephalopods as prey. IV. Fishes. Philosophical Transactions of the Royal Society
London Series B, 351, 1067–1081.
Smith, D., Simon, M., Alldredge, A. and Azam, F. 1992. Intensive hydrolytic activity on marine
aggregates and implications for rapid particle dissolution. Nature, 359, 139-141.
Snelgrove, P.V.R. 1999. Getting to the Bottom of Marine Biodiversity: Sedimentary Habitats: Ocean
bottoms are the most widespread habitat on Earth and support high biodiversity and key ecosystem
services. BioScience, 49(2), 129-138.
Snelgrove, P.V.R, Thrush, S.F., Wall, D.H., and Norkko, A. 2014. Real world biodiversity–ecosystem
functioning: a seafloor perspective. Trends in Ecology and Evolution, 29: 398-405.
Sogin, M.L., Morrison, H.G., Huber, J.A., Welch, D.M., Huse, S.M., Neal, P.R., Arrieta, J.M. and
Herndl, G.J. 2006. Microbial diversity in the deep sea and the underexplored “rare biosphere”.
Proceedings of the National Academy of Sciences, 103(32), 12115-12120.
Solan, M., Cardinale, B. J., Downing, A. L., Engelhardt, K. A., Ruesink, J. L., and Srivastava, D. S.
2004. Extinction and ecosystem function in the marine benthos. Science, 306(5699), 1177-1180.
Spivak, A.C., Canuel, E.A., Duffy, J., and Richardson, J. 2007. Top-down and bottom-up controls on
sediment organic matter composition in an experimental seagrass ecosystem. Limnology and
Oceanography, 52(6), 2595-2607.
Stachowicz, J. J., Bruno, J. F. and Duffy, J. E. 2007. Understanding the Effects of Marine Biodiversity
on Communities and Ecosystems. Annual Review of Ecology, Evolution, and Systematics, 38(1),
739-766.

66
Stahl, H., Glud, A., Schröder, C. R., Klimant, I., Tengberg, A., & Glud, R. N. 2006. Time-resolved pH
imaging in marine sediments with a luminescent planar optode. Limnology and Oceanography:
Methods, 4, 336-345.
Stowasser, G., Bustamante, P., MacLeod, C.D., Wang, J. and Pierce, G.J. 2005. Spawning areas and
selected metal concentrations in squid (Loligo forbesi) in UK waters, with notes on metal
concentrations in other squid species. Report to Geotek Ltd and Hartley Anderson Ltd in the context
of the.UK Department of Trade and Industry’s offshore energy Strategic Environmental
Assessment programme. University of Aberdeen, Aberdeen, 24 pp.
Suzuki Y. (ed.), 1997: Marine biota and global carbon cycling, University of Tokyo press, Tokyo, 208
pp.
Takano, Y., Chikaraishi, Y., Ogawa, N. O., Nomaki, H., Morono, Y., Inagaki, F., Kitazato, H., Hinrichs,
K. U., Ohkouchi, N. (2010) Sedimentary membrane lipids recycled by deep-sea benthic archaea.
Nature Geoscience, 3, 858-861.
Tappin, A.D., Loughnane, J.P., Mc Carthy, A.J. and Fitzsimons, M.F. 2012 Removal of atrazine from
river waters by indigenous microorganisms. Environmental Chemistry Letters 10(1), 89-96
Teal, L., Parker, R., Fones, G., and Solan, M. 2009. Simultaneous determination of in situ vertical
transitions of color, pore-water metals, and visualization of infaunal activity in marine sediments.
Limnology and Oceanography, 54(5), 1801-1810.
Tett, P., Gowen, R.J., Painting, S.J., Elliott, M., Forster R., Mills, D. K., Bresnan, E., Capuzzo, E.,
Fernandes, T.F., Foden, J., Geider, R.J., Gilpin, L. C., Huxham, M., McQuatters-Gollop, A.L.,
Malcolm, S.J., Saux-Picart, S., Platt, T., Racault, M.F., Sathyendranath, S., van der Molen J. and
Wilkinson M. 2013. Framework for understanding marine ecosystem health. Marine Ecology
Progress Series 494: 1-27.
Tiedje, J. M. 1988. Ecology of denitrification and dissimilatory nitrate reduction to ammonium. Biology
of anaerobic microorganisms, 717, 179-244.
67
Tilman, D. 2001. Functional diversity. In: Levin, S. A. (ed.), Encyclopedia of biodiversity. Academic
Press.
Törnroos, A., Bonsdorff, E., Bremner, J., Blomqvist, M., Josefson, A. B., Garcia, C., and Warzocha, J.
2014. Marine benthic ecological functioning over decreasing taxonomic richness. Journal of Sea
Research. In press.
Townsend, D.W. and Cammen, L.M. 1988. Potential Importance of the Timing of Spring Plankton
Blooms to Benthic-Pelagic Coupling and Recruitment of Juvenile Demersal Fishes. Biological
Oceanography 5(3), 215-228.
Trites, A.W. 2003. 8 Food Webs in the Ocean: Who Eats Whom and How Much? Responsible fisheries
in the marine ecosystem, 125.
UK National Ecosystem Assessment. 2014. The UK National Ecosystem Assessment: Synthesis of the
Key Findings. UNEP-WCMC, LWEC, UK.
Valdivia, N., and Molis, M. 2009. Observational evidence of a negative biodiversity-stability
relationship in intertidal epibenthic communities. Aquatic Biology, 4, 263-271.
Waldbusser, G.G., Marinelli, R.L., Whitlatch, R.B. and Visscher, P.T. 2004. The effects of infaunal
biodiversity on biogeochemistry of coastal marine sediments. Limnology and Oceanography, 49(5),
1482–1492
Wells, M.J. and Clarke, M.R. 1996. Energetics: The costs of living and reproducing for an individual
cephalopod. Philosophical Transactions of the Royal Society of London Series B-Biological
Sciences, 351, 1083-1104.
Welsh, D.T. 2000. Nitrogen fixation in seagrass meadows: Regulation, plant-bacteria interactions and
significance to primary productivity. Ecology Letters, 3, 58-71.
Wheeler, P.A., North, B., Littler, M. and Stephens, G. 1977. Uptake of glycine by natural phytoplankton
communities. Limnology and Oceanography, 22, 900–909.

68
Widdows, J., Brinsley, M. and Elliott, M. 1998. Use of in situ flume to quantify particle flux
(biodeposition rates and sediment erosion) for an intertidal mudflat in relation to changes in current
velocity and benthic macrofauna. Geological Society, London, Special Publications, 139, 85-97.
Wildish, D.J. and Kristmanson, D.D. 1984. Importance to mussels of the benthic boundary layer.
Canadian Journal of Fisheries and Aquatic Sciences, 41(11), 1618-1625.
Williams, S.L. 2001. Reduced Genetic Diversity in Eelgrass Transplantations Affects both Population
Growth and Individual Fitness. Ecological Applications, Vol. 11, No. 5, pp. 1472-1488.
Williams, P. I., and Robertson, J. E. 1991. Overall planktonic oxygen and carbon dioxide metabolisms:
the problem of reconciling observations and calculations of photosynthetic quotients. Journal of
Plankton Research, 13(supp1), 153-169.
Worm, B., Barbier, E. B., Beaumont, N., Duffy, J. E., Folke, C., Halpern, B. S., Jackson, J. B., Heike
K. Lotze, H.K., Micheli, F., Palumbi, S.R., Sala, E., Selkoe, K.A., Stachowicz, J.J. and Watson, R.
2006. Impacts of biodiversity loss on ocean ecosystem services. Science, 314, 787-790.
Wotton, R. S. and Malmqvist, B. 2001. Feces in Aquatic Ecosystems: Feeding animals transform
organic matter into fecal pellets, which sink or are transported horizontally by currents; these fluxes
relocate organic matter in aquatic ecosystems. BioScience, 51(7), 537-544.

69
Glossary of common biodiversity and ecosystem functioning terms
Biodiversity: The variability among living organisms from all sources including inter alia, [terrestrial],
marine [and other aquatic ecosystems] and the ecological complexes of which they are part; cf. ‘includes
diversity within species, between species and of ecosystems’ (Article 2, Convention on Biological Diversity
1992: www.cbd.int/convention/text/default.shtml).
Biological (or biodiversity) components: groupings of species, separated by distinct functional, taxonomic
and/or habitat boundaries. These components are practical subdivisions of biodiversity. Eleven biodiversity
components have been used within this review: microbes, phytoplankton, zooplankton, angiosperms,
macroalgae, benthic invertebrates, fish, cephalopods, marine mammals, birds and reptiles.
Biological traits analysis: an analysis that uses a series of life history, morphological and behavioural
characteristics of species present in assemblages to indicate aspects of their ecological functioning (Bremner
et al., 2006).
Complementarity: see transgressive over-yielding. Species perform better in diverse communities when
compared to monoculture due to facilitation and niche partitioning in shared resource use. Contributes to
more efficient acquisition of limiting resources and therefore higher productivity.
Ecosystem functioning: This relates to rate processes at the ecosystem level, cf. ecosystem structure which
is the magnitude of ecosystem components at one time; all levels of biological organisation from the cell to
the ecosystem have structural and functional properties whereas ecosystem functioning only relates to the
highest level.
Ecosystem functions: the physical, chemical and biological processes that transform and translocate energy
or materials in an ecosystem are termed ecosystem functions (Naeem, 1998; Paterson et al. 2012).
Ecosystem process:
Identity effects: a small number of species dominates functionality. Typically reflected by non-transgressive
over-yielding (Table 1a and 1b).
Non-transgressive over-yielding: a diverse assemblage perform better than a weighted average of the
component species (Table 1a and 1b). Commonly related to identity effects.
Production/Productivity: biomass production is often expressed as production or productivity, these two
terms being often used as synonyms (e.g. McLusky and Elliott, 2004; Scherer-Lorenzen, 2005), and
expressing the units of biomass produced per unit area per unit time (e.g. grams of Carbon m-2 yr-1), with the
production efficiency (or biomass turnover rate) being measured by the P:B ratio (where P is production and
B is mean standing biomass; e.g. in yr-1 units; McLusky and Elliott, 2004).
Selection effects/sampling effects: diversity effects are caused by the greater chance of one or a few
dominant, high-biomass species being present in the polyculture. Related to identity effects.

70
Trait diversity: species defined in terms of their ecological roles. The concept of functional trait diversity is
based on the assumption that with increasing trait dissimilarity among species the diversity in resource use
strategies increases as well and species overlap along resource axes decreases.
Transgressive over-yielding: diverse assemblages perform better than the best performing species in
monoculture (Table 1a and 1b). Also considered a product of complementarity.