Jaime Aristy-Escuder, Maynor Cabrera, Blanca Moreno-Dodson ... · Aristy-Escuder, Cabrera,...
60
Aristy-Escuder, Cabrera, Moreno-Dodson and Sánchez-Martín, No. 46, 2016. 1 FISCAL POLICY AND REDISTRIBUTION IN THE DOMINICAN REPUBLIC Jaime Aristy-Escuder, Maynor Cabrera, Blanca Moreno-Dodson & Miguel Sánchez-Martín Working Paper No. 46 June 2016
Transcript of Jaime Aristy-Escuder, Maynor Cabrera, Blanca Moreno-Dodson ... · Aristy-Escuder, Cabrera,...
Aristy-Escuder, Cabrera, Moreno-Dodson and Sánchez-Martín, No. 46, 2016.
1
FISCAL POLICY AND REDISTRIBUTION IN THE DOMINICAN REPUBLIC
Jaime Aristy-Escuder, Maynor Cabrera, Blanca Moreno-Dodson & Miguel Sánchez-Martín
Working Paper No. 46 June 2016
The CEQ Working Paper Series
The CEQ Institute at Tulane University works to reduce inequality and poverty through rigorous tax and benefit incidence analysis and active engagement with the policy community. The studies published in the CEQ Working Paper series are pre-publication versions of peer-reviewed or scholarly articles, book chapters, and reports produced by the Institute. The papers mainly include empirical studies based on the CEQ methodology and theoretical analysis of the impact of fiscal policy on poverty and inequality. The content of the papers published in this series is entirely the responsibility of the author or authors. Although all the results of empirical studies are reviewed according to the protocol of quality control established by the CEQ Institute, the papers are not subject to a formal arbitration process. The CEQ Working Paper series is possible thanks to the generous support of the Bill & Melinda Gates Foundation. For more information, visit www.commitmentoequity.org.
The CEQ logo is a stylized graphical representation of a Lorenz curve for a fairly unequal distribution of income (the bottom part of the C, below the diagonal) and a concentration curve for a very progressive transfer (the top part of the C).

Aristy-Escuder, Cabrera, Moreno-Dodson and Sánchez-Martín, No. 46, 2016.
1
FISCAL POLICY AND REDISTRIBUTION IN THE DOMINICAN REPUBLIC*
Jaime Aristy-Escuder, Maynor Cabrera, Blanca Moreno-Dodson & Miguel E. Sánchez-Martín†
CEQ Working Paper No. 46
JUNE 2016
ABSTRACT
This paper assesses whether limited redistributive effect of fiscal policy in the Dominican Republic has slowed improvements in poverty and inequality during a period of strong economic growth. Departing from the Commitment to Equity methodology for fiscal incidence analysis (Lustig and Higgins, 2013) this paper introduces new methodological considerations and addresses the time gap between the current fiscal structure (2013) and the latest available household survey (2007) by deflating public revenue and spending data to 2007 prices. Results show that fiscal policy in the Dominican Republic is overall progressive given that, compared to other countries, the fiscal system achieves intermediate levels of inequality reduction (5 Gini points) through direct and indirect taxes, transfers and subsidies, and it generates very little horizontal inequality. At the same time, the impact of direct transfers on poverty reduction is modest, due to the limited cash amounts granted, and there seems to be scope to boosting revenue and enhancing progressivity by revising tax exemptions and indirect electricity subsidies.
Keywords: fiscal incidence, poverty, inequality, fiscal policy, Dominican Republic. JEL: D31, H22, I14.
* This is a working paper produced to inform a World Bank report titled Fiscal Policy and Redistribution in the Dominican Republic. The authors are obliged to the following World Bank colleagues for their substantive contributions: Javier Eduardo Báez, Alan Fuchs, Juan Barón, Omar Arias, Luis Felipe López-Calva, Francisco Galrao Carneiro, Gabriela Inchauste and McDonald Benjamin. Special thanks to Nora Lustig and Samantha Greenspun (Tulane University) for the exceptional help granted to validate the accuracy of results when applying the Commitment to Equity methodology. Launched in 2008, the CEQ project is an initiative of the Center for Inter-American Policy and Research (CIPR) and the Department of Economics, Tulane University, the Center for Global Development and the Inter-American Dialogue. The CEQ project is housed in the Commitment to Equity Institute at Tulane. For more details, visit www.commitmentoequity.org. The authors are grateful to the following government and donor counterparts for their collaboration: Magdalena Lizardo, Antonio Morillo, Alexis Cruz, Martín Francos (Ministry of Economy, Planning and Development); Luis Madera, Augusto de los Santos, Mabely Díaz (National Office for Statistics); José Luis Actis (Ministry of Finance); Guarocuya Félix, Marvin Cardoza, Hamlet Gutiérrez (General Directorate for Internal Taxation, Ministry of Finance), Matilde Chávez (Social Cabinet), Tirsis Quezada, Rafael Montero (Ministry of Public Health); Chanel Rosa (SENASA); Pedro Castellanos, Ayacx Mercedes (DIGEPEP, Presidency); Rafael Pérez (National Council for the Social Security); Ramón González Hernández (Central Bank of the Dominican Republic); Rita Mena (UNDP); Javier Casasnovas (European Union). † Jaime Aristy-Escuder, INTEC Santo Domingo ([email protected]); Maynor Cabrera, FEDES ([email protected]); Blanca Moreno-Doson, World Bank ([email protected]); Miguel E. Sánchez-Martín, World Bank ([email protected]).

Aristy-Escuder, Cabrera, Moreno-Dodson and Sánchez-Martín, No. 46, 2016.
1
1. Introduction In spite of sustained economic growth over the past two decades, the population in the Dominican Republic did not achieve significant welfare improvements until recently. Economic growth averaged 5.7 percent a year in 1991-2013, among the highest rates in the region. This performance enabled country’s GNI per capita (US$5,520 in 2012) to rise from 52 percent to 78 percent of the Latin America and the Caribbean (LAC) region’s average. From 2000 to 2013, a slight improvement in income inequality occurred, with the Gini index falling from 0.549 to 0.514. Disaggregation by area suggests that most of the inequality reduction took place in the rural parts of the country; inequality in urban areas did not decline significantly (World Bank, 2014a).
After a sharp rise in the early 2000s, poverty rates shave been falling in recent years, and one possible explanation is that fiscal policy may not be redistributive enough. Based on the official poverty measurement methodology for the Dominican Republic (ONE and MEPyD, 2012), moderate poverty incidence soared from 32 percent in 2000 to almost 50 percent in 2004, a period that included a severe banking crisis. It then declined gradually to around 41 percent in 2013 and to about 35 percent by October 2014. Rapid poverty reduction in 20141, a year of 7.3 percent economic growth, has been attributed to rising wages, increased employment in school construction, public support to agriculture, credit to small and medium enterprises, and allocating more public investment to disadvantaged areas.
At least until recently, the pace of poverty reduction has been slower in the Dominican Republic than in other countries with similar growth rates. Several studies have tried to explain the pre-2014 puzzle of slow poverty reduction at a time of rapid growth. Aristy (2016) analyzes whether the typical consumption basket for the poor differs significantly from that used to calculate the general consumer price index and the GDP deflator, but it does not find statistical distortions in the measure of poverty headcount. Other hypotheses include: (i) stagnant real wages (real earnings per hour of both self-employed and private-sector wage workers were about 27 percent lower in 2011 than in 2000) despite rising labor productivity (around 30 percent increase between 2000 and 2010, see Abdullaev and Estevao, 2013); (ii) the enclave nature of the economy, with activity in Special Economic Zones and tourist poles relatively isolated from the rest of the country; and (iii) the lack of redistributive capacity of the public sector (Carneiro et al., 2015). To explore the latter hypothesis, this paper uses the Commitment to Equity (CEQ) methodology (Lustig and Higgins, 2013)2 to perform a fiscal-incidence analysis on the poverty and equity implications of the Dominican Republic’s fiscal system, including current taxes, subsidies, and overall public spending.
The Dominican Republic’s tax policy has become more reliant on indirect taxes. Public revenues averaged 14.3 percent of GDP in 2004-14, with tax collections at 13.4 percent of GDP, below the
1 According to ONE and MEPyD, poverty headcount index fell from 41.2% in 2013 to 35.8% in 2014. 2 Led by Nora Lustig since 2008, the Commitment to Equity (CEQ) project is an initiative of the Center for Inter-American Policy and Research (CIPR) and the Department of Economics, both at Tulane University, along with the Center for Global Development and the Inter-American Dialogue. The CEQ project is housed in the Commitment to Equity Institute at Tulane. For more details visit www.commitmentoequity.org.

Aristy-Escuder, Cabrera, Moreno-Dodson and Sánchez-Martín, No. 46, 2016.
2
LAC average.3 It is worth noting that the Government responded to a fall in fiscal revenues (partly related to declining trade taxes in the context of DR-CAFTA implementation) by adopting a total of six tax reforms between 2004 and 2012. Annex describes in detail the main changes introduced by these different tax reforms. A country heavily dependent on indirect taxation, the Dominican Republic repeatedly increased VAT rates—from 12 percent to 16 percent (Law 288-04) and then to 18 percent (Law 253-12). This, together with the introduction of selective taxes on telecommunication services, have been the most far-reaching reforms. However, the tax bases have remained narrow, and extensive tax exemptions have persisted to erode the effective revenue base, since a large portion of the population (including both individuals and Special Economic Zones) have so far opposed an integral fiscal reform (World Bank, 2014b). Despite recent improvement, at 15.1 percent of GDP in 2014, fiscal revenues remain below their level in 2007 (16.6 percent). Revenue collection capacity is partly hampered by high levels of informality and existing tax exemptions, with tax expenditure amounting an estimate of 6.6 percent of GDP in 2014, including 3.2 percent of GDP in VAT exemptions (DGII, 2014).
The Dominican Republic has made notable efforts to increase social spending. As mandated by law and demanded by the citizenry, public outlays for education doubled in recent years—from around 2.2 percent of GDP in 2011 to close to 4 percent in 2013. In a social security reform, some health services were privatized and lower income households began to receive insurance under a subsidized scheme. However, a large part of the population remains uninsured. In addition, indirect subsidies on electricity (and technical and commercial losses) take a big toll on the public budget, equaling about 2 percent of GDP. Finally, a relatively large number of targeted social assistance programs represent around 0.5 percent of GDP. The structure of revenue and expenditure in the Dominican Republic is presented in more detail in the Annex to this paper.
A few existing fiscal incidence studies are relevant to the Dominican Republic: Santana and Rathe (1992),4 Lindert, Skoufias, and Shapiro (2006), and Barreix, Bès, and Roca (2009). Lindert et al. (2006) find low levels of social spending in the Dominication Republic. Their paper measures the extent to which social assistance and social security spending, consumption subsidies, and education and health spending favor the poor in eight LAC countries. For the Dominican Republic, the paper uses the National Survey on Living Conditions (ENCOVI) for 2004. At that time, the country had the lowest levels of social spending in the sample, and social insurance had negligible poverty impacts. The results reflect a combination of factors: (i) some programs had relatively low (net) unit subsides and weak targeting and coverage of the poor and vulnerable and (ii) social assistance programs like the school-based TAE transfer and school feeding ranked fairly high in terms of social welfare impact per dollar spent but were quite small in terms of budget and subsidy per person.
The paper by Barreix et al. (2009) examines the impact of fiscal policy (social spending and taxation) on inequality, finding Dominican fiscal policy progressive in 2004. It is based on a collection of
3 When both tax and non-tax revenue are considered, the Dominican Republic trails only Guatemala for the lowest revenue level in Latin America, according to ECLAC Statistics. When social security contributions are excluded, Dominican Republic tax revenue is similar to the regional average. 4 This study used 1989 household income data and found “a degree of progressivity” in direct and indirect taxation (Chu, Davoodi, and Gupta, page 38).

Aristy-Escuder, Cabrera, Moreno-Dodson and Sánchez-Martín, No. 46, 2016.
3
studies for Central America and the Dominican Republic written by various authors who followed a common methodology.5 The analysis uses ENCOVI 2004 and covers direct and indirect taxes; spending on education, health, and social assistance programs; and subsidies on electricity and gas. The paper finds that fiscal policy in 2004 was progressive, and inequality was overall reduced thanks to a progressive social spending despite regressive tax system at that time. In addition, health and education spending was pro-poor, i.e. progressive in absolute terms. 6 Some social assistance programs, like the general subsidies on electricity (Programa de Reducción de Apagones) and LPG gas that were in place prior to the shift to targeted subsidies in 2008 (Gallina et al, 2015), were progressive.7
In January 2013, a series of microsimulation exercises looked at the impact of selected fiscal policy tools on poverty and inequality; the results were mixed. The analysis found: (i) the tax reform of November 2012 (Law 253-12) had a neutral impact on poverty and inequality; (ii) the freezing of the lower exemption threshold on individual income taxes had a positive impact in terms of redistribution; and (iii) the VAT rate increases were regressive (MEPyD, 2013). A parallel microsimulation exercise showed that an RD$125 increase in the amount allocated to beneficiaries under the Comer es Primero conditional cash transfer (CCT) program would result in a 0.22 percent reduction in moderate poverty and a 0.0013 reduction in inequality (Gini index). Similarly, the expansion in the number of beneficiaries of the subsidized health regime would contribute to better equity outcomes.
This paper goes beyond previous exercises. It analyzes the impact of fiscal policy in 2013, using the CEQ methodology that includes several fiscal instruments and social programs targeting the poor (direct and indirect taxes, transfers, CCTs, public services in educations and health). Some taxes (like the CIT) and public spending categories (like some infrastructure and rural development items) are not included due to the difficulty of assessing their effects on the disposable income of citizens, specially the poor.
The paper’s main contributions are: First, understanding how selected taxes and transfers programs affect income distribution in the Dominican Republic by introducing an innovative approach to address the time gap between the current fiscal structure (2013) and the year of the latest household survey (2007). Second, comparing the Dominican Republic’s results with a number of countries in which the Commitment to Equity methodology has been applied, including some with similar incomes per capita such as Costa Rica (Sauma & Trejos, 2014) and Peru (Jaramillo, 2013).8 Third, discussing a series of alternative scenarios that would help enhance the redistributive capacity of the state.
5 For the Dominican Republic’s analysis, the background study was prepared by Díaz (2008). 6 A transfer will be progressive in absolute terms if the per capita amount received decreases as income rises (Lustig & Higgins, 2013). 7 Progressive in relative terms: subsidy increases as a percentage of income but per capita subsidy decline as income rises. 8 The common methodology is described in Lustig and Higgins (2013).

Aristy-Escuder, Cabrera, Moreno-Dodson and Sánchez-Martín, No. 46, 2016.
4
2. Methodology and sources of information
2.1. CEQ methodology This paper’s goal is to estimate the impact of taxes and transfers on income inequality and poverty in the Dominican Republic. We use the CEQ methodology, applying the fiscal incidence analysis described in Lustig and Higgins (2013). This starts with the individual’s market income and adds transfers and subtracts taxes in different stages (Figure 1).
Market income is a measure of pre-tax income that does not include the effects of government policies. It is composed of pre-tax wages, salaries, self-employed income, income from capital (dividends, interest, and rent), and pensions. It is worth mentioning that the question asked in household survey ENIGH 2007 is about labor income gross of taxes.
We estimate three scenarios. The difference between the Benchmark and Sensitivity Analysis 2 scenarios is that, in order to estimate the impact of the significant increase in public education expenditures in 2013, an alternative Sensitivity Analysis 2 featuring the lower expenditure level of 2011 is built. Since there is no theoretical consensus on whether contributory pensions are part of the market income or a government transfer, in the scenario Sensitivity Analysis 1 does not include public pensions in market income, making them instead a transfer contained in disposable income, in contrast with Benchmark and Sensitivity Analysis 2, in which contributory pensions are consider to be part of market income.
Net market income subtracts direct taxes. Personal income taxes on wages, dividends, and interest are included in the analysis. The Dominican Republic’s old public-pension system was privatized, so social security contributions are not included as direct taxes. Disposable income adds direct cash and food transfers to net market income. As explained in the previous section, we include CCTs for nutrition and education, non-conditional cash transfers, goods transfers like food, shoes, uniforms, and backpacks, and the alphabetization program (Quisqueya Aprende Contigo).
Post-fiscal income adds implicit subsidies on electricity and subtracts indirect taxes. These levies include the Tax on the Transfer of Industrialized Goods and Services (ITBIS), a value-added tax applied on domestic and imported goods and services, or VAT, and excises on alcoholic beverages, beer, tobacco, and oil derivatives.
Final income includes in-kind transfers. These are measured by the monetized value of public expenditures in health (Ministry of Health, social security and others) and education (pre-school, primary, lower secondary, upper secondary, and tertiary). It is important to take into consideration that contributive health insurance is not included in the analysis, since it works de facto as a private insurance.

Aristy-Escuder, Cabrera, Moreno-Dodson and Sánchez-Martín, No. 46, 2016.
5
Co-payments,userfees
Figure 1. Income concepts used in fiscal incidence analysis
Source: Lustig & Higgins (2013).
2.2. Data sources This fiscal-incidence analysis uses several sources of information. The main one is the National Survey of Household Income and Expenditure 2006-07 (ENIGH). This survey was collected by the National Office of Statistics (ONE) between January 2007 and January 2008 for 22,000 households and 80,131 individuals. It is representative at the national level and for four main domains: Metropolitan or Ozama, North or Cibao, South and East. ENIGH contains data on income,
MarketIncomeWagesandsalaries,incomefromcapital,privatetransfers;beforegovernmenttaxes,socialsecuritycontributionsandtransfers;benchmark(sensitivityanalysis1)includes(does
notinclude)contributorypensions
TAXES TRANSFERS
NetMarketIncome
- Directtaxes(personalincometaxes)
DisposableIncome
Post-FiscalIncome
FinalIncome
Directtransfers(CCTtransfers,foodtransfers,
scholarships,etc.)
Indirectsubsidies(electricity)
In-kindtransfers(freeorsubsidizedgovernmentservicesineducationand
health)
+
+
+
Indirecttaxes(ITBIS,excisetaxesonbeverages,tobacco,
oil)
-
-

Aristy-Escuder, Cabrera, Moreno-Dodson and Sánchez-Martín, No. 46, 2016.
6
expenditures, auto-consumption, remittances, and use of educational services. To account for changes in health coverage, we complement ENIGH with the Demographic and Health Survey (ENDESA 2013). This survey has a nationally representative sample of 11,464 households, 9,372 women ages 15-49, and 10,306 men ages 15-59.
Additionally, data on government revenues were obtained from the General Directorate for Internal Taxation and the Ministry of Finance. Data on direct transfers come from ADESS, the Ministry of Finance, and the Ministry of Education. Information on electricity subsidies was facilitated by the Ministry of Finance. Finally, data on public health expenditures were obtained from the Ministry of Finance, the Ministry of Health, and SENASA.
2.3. Main assumptions Compared to other countries studies with the CEQ methodology, the Dominican Republic is especially challenging because the “departure point,” the most recent household income and expenditure survey, dates to 2007. It is necessary to consider that numerous policy decisions were adopted between 2007 and 2013, including the modification of the rates and bases of the main taxes (e.g., ITBIS, ISR, ISC). Furthermore, there has been a notable expansion in the coverage of direct transfers (e.g., Comer es Primero, Bonogas Hogar, Bonogas Chofer), and the value of certain in-kind transfers, such as education, has been expanded.
In the light of these changes, the methodology applied the tax and public expenditure structures of 2013 to ENIGH 2007. On the tax side, rates and definitions of the 2013 tax base were used. On the expenditure side, the value of the 2013 peso was deflated by the change in the consumer price index (CPI) between 2007 and 2013. In other words, the public revenues and spending vectors of 2013 were used to calculate income poverty—but in 2007 prices. Expenditures were adjusted only for inflation and not by GDP growth. This is because the majority of the recorded public-spending variations were below the growth rate during the period. Overall, the objective was to adapt the CEQ methodology’s various definitions of income using the ENIGH 2007 and the public revenue and expenditure structure of 2013, expressed in 2007 prices. We opted for this alternative (instead of inflating to 2013 the variables of the ENIGH 2007) because, besides inflation between 2007 and 2013, relative prices of production factors, structure of employment and size of households in Dominican Republic could have experimented important changes in income distribution, that we otherwise would not have been able to replicate with available information. The adjustment factor was 42.5 percent, i.e. inflation between June 2007, date of the survey, and December 2013.
It is worth noting that the following analysis only evaluates the tax system along one dimension—its impact on equity. It does not assess other important features of a tax system, such as its efficiency—which measures the amount collected given the rate— buoyancy (i.e. response of tax collections to economic growth), simplicity, and ease of administration.
Aristy-Escuder, Cabrera, Moreno-Dodson and Sánchez-Martín, No. 46, 2016.
7
An estimation of direct taxes was made by applying statutory rates and income brackets from 2012 (in 2007 prices) to the salaries and wages declared in ENIGH 2007. Individuals have to pay direct taxes out of market income. Because income tax payments in 2013 were made taking into consideration income from 2012, we deflate from 2012 to 2007 prices. Due to the fact that income brackets were adjusted by inflation from 2008 to 2012, mismatch between effective income brackets is expected to be minimal. As pointed out by Dominican authorities, tax evasion among the self-employed is considered significant, while we were unable to access to profiles of payments of independent business or official estimations of evasion; thus, so we do not calculate personal income taxes for those groups. In addition, we do not use assumptions on informality of wage earners or other assumptions on tax evasion on personal income tax. In order to ensure incidence analysis is not detached from reality due to assumptions, we contrasted simulated collections applying statutory tax rates and actual collections, and discussed results with the tax authority in the Dominican Republic to ensure consistency.
The personal income tax is levied on individuals with income above the exemption threshold. The system uses three rates that rise with tax brackets: 15 percent, 20 percent, and 25 percent. Dividends and interest income are taxed at 10 percent. It is assumed that informal self-employed workers do not pay income taxes. The corporate income tax is also not included in the analysis. Two caveats apply: (i) using statutory rates does not measure taxes actually paid and (ii) even if the survey’s simulated total income tax payment is similar to actual collection, the incidence by quintile could be over or under the estimated values. We assume the household survey includes labor income gross of taxes, because ENIGH 2007 survey asks for gross salary without deductions (see details in Annex).
Indirect taxes were estimated using the simulation method. We include ITBIS, excises, a tax on telecommunications, and the insurance tax. ENIGH 2007 has a detailed list of household purchases of goods and services, categorized according to the Classification of Individual Consumption According to Purpose (COICOP).9 We separate each good or service into one of three groups: (i) those exempt in 2007 and 2013, (ii) those exempt in 2007 but not in 2013, and (iii) those taxable by both ITBIS and excises.
Within ITBIS, it was necessary to distinguish between goods that were and were not exempt. To avoid overestimating the taxes paid by low income earners, we decided, after discussion with authorities, to include tax evasion in all scenarios—a practice that follows previous CEQ papers. We incorporated the assumption of tax evasion by creating four groups of goods and services: (i) high propensity for evasion; (ii) high propensity to pay ITBIS; (iii) products with estimated compliance rates, according to the General Directorate for Internal Taxation;10 and (iv) products on which the VAT was paid as a condition of purchase. 11 Indirect taxes were down-scaled to prevent overestimation, using the method in Lustig and Higgins (2013). For example, we adjust VAT payments to equalize the ratio of total VAT to disposable income in the survey to the ratio of VAT
9 See http://unstats.un.org/unsd/cr/registry/regcst.asp?Cl=5. 10 DGII provided a list with estimated compliance rates for VAT payments. 11 We estimated a detailed list of goods and services according to these assumptions.

Aristy-Escuder, Cabrera, Moreno-Dodson and Sánchez-Martín, No. 46, 2016.
8
collection to private consumption in the national accounts in 2013. Also, we take into account exemptions and reduced rates on each kind of good and services according to statutory rates.
Direct transfers received were assigned if the household fell into a SIUBEN category that indicates eligibility for each program—e.g., categories “poor” 1 and “poor2” in the case of Comer es Primero. Ultimately, beneficiaries were randomly selected as a sub-group of the household, based on coverage statistics. A series of steps were taken: (i) adjust the population of ADESS beneficiaries in 2013, taking into consideration the variation in the population between 2007 and 2013; (ii) calculate transfers at 2007 prices; (iii) adjust the coverage in terms of SIUBEN categories to reproduce the number of beneficiaries and coverage as a percent of the population. When the household survey and the national accounts differed on the ratio of direct transfers to national income, we down-scaled the value of the transfer to make the ratios comparable. Other transfers, like those on shoes, uniforms, and backpacks, plus the alphabetization program, were imputed using average costs estimated by the Ministry of Education and UNICEF—once again, 2013 values adjusted to 2007 prices.
Implicit electricity transfers were calculated by applying existing tariffs. Using 2007 prices, we estimated the implicit kwh consumed by each household and applied the subsidy to users consuming less than 700 kwh a month. For those in the ENIGH survey who consume electricity but declare not to pay the bill, an implicitly standard subsidy is calculated.
Education benefits depend on the number of students and the average cost of education. The survey identifies individuals who attend school, their levels of education, and whether the schools are private or public. The education benefit is based on the cost per student by level, estimated by UNESCO and the Dominican Republic Ministry of Education. We adjust these figures to 2007 prices. Following Lustig and Higgins (2013), we prevent overestimation by adjusting the ratio of education expenditures to disposable income, making it equal the ratio calculated using national accounts.
An alternative analysis examines the impact of larger budget for public education. To account for the significant increase in public education expenditures in 2013, from 1.9 percent of GDP in 2011 to 3.8 of GDP in 2013, we estimated the alternative Sensitivity Analysis 2, featuring the lower expenditure level of 2011. Because gross coverage rates did not significantly change in primary schools and changed little in elementary and secondary schools between 2007 through 2013, the different scenarios assume coverage did not change.12
Finally, we account for in-kind health transfers by estimating the impact of the subsidized social security regime only, which is free for the poor and vulnerable, and not the contributory regime, which works as a private insurance.13 We use the Demographics and Health Survey (ENDESA 2013) to determine whether individuals with health insurance belong in social security's subsidized 12 The rise in spending mostly went for construction and repairing classrooms, extension of school hours from five to eight, higher salaries for teachers, and hiring new teachers. 13 The contributive system is actuarially fair. In the case of the subsidized regime, workers do not make contributions. This regime, financed by the Dominican state, covers the self-employed, disabled, and the extreme poor (as defined by the national poverty line).
Aristy-Escuder, Cabrera, Moreno-Dodson and Sánchez-Martín, No. 46, 2016.
9
regime. For the uninsured, we identify only those who use the services of public hospitals or ambulatory centers. It is also possible to identify those who are insured by the Dominican Institute of Social Security (IDSS). Finally, public spending under the Essential Medicines Program (PROMESE) is also computed; this includes spending to purchase medicines and medical supplies for public health institutions as well as the distribution of subsidized medicines to the population. Drawing from information in the ENDESA 2013 survey, we use matching-score analysis to identify beneficiaries in the ENIGH 2007 survey.
For beneficiaries of the subsidized regime, we impute an insurance value based on the average transfer by insured (per capita) from the government to SENASA. For IDSS affiliates, we estimated an average insurance value by dividing the government transfer by the total number of insured. For the uninsured who report using public facilities, we impute an average cost per user at hospital and ambulatory centers. It is estimated by dividing total expenditure on each level of health services from National Health Accounts (Ministry of Health, 2013) by users of health public services in the survey, identified using matching-score analysis from ENDESA 2013. For PROMESE, once we selected the beneficiaries of this program, we estimate an average benefit by dividing the program’s expenditures in 2013 by the number of users reported in ENDESA 2013. As with education, the ratio of health expenditure to disposable income under the survey is adjusted to match the ratio calculated using national accounts.
In sum, counting with a dated household survey in the Dominican Republic implied a number of additional assumptions when applying the CEQ methodology. Overall, the validity of results depends on the fact that changes in income distribution between 2007 and 2013 have been observed but are not dramatic (e.g. a decline in GINI from 0.487 to 0.471, according to World Development Indicators); this is the most relevant caveat in our analysis. In the case of education, since no significant change in enrollment is observed between 2007 and 2013 (except for pre-primary education), and given that the team accessed official data detailing the cost of delivery of education services, we are confident that incidence analysis for this sector is relatively precise. In the case of health services, having counted with ENDESA 2013, a specialized survey collected during the year of analysis that details information on the insurance beneficiaries and effective use of health services by income level, helps ensuring the robustness of results. In addition, a matching scores technique has been applied, and results should be thus as robust as those in other CEQ exercises using a specialized health survey. With respect to conditional cash transfers, a careful revision of the indicators was performed to ensure consistency with actual population coverage, transfers per capita, and budget for the different programs in 2013. In the case of indirect electricity subsidies, results should be interpreted with caution, since administrative registries do not adequately identify beneficiaries, and the analysis was performed on the basis of a profile of beneficiaries described by authorities of the sector.
Some mitigation measures on potential caveats include the use of additional sources of information to the household survey, discussions with authorities, and revision of results by the developers of the CEQ methodology. Discussions with authorities helped ensure results are consistent with
Aristy-Escuder, Cabrera, Moreno-Dodson and Sánchez-Martín, No. 46, 2016.
10
existing evidence and knowledge. This includes discussions with the General Directorate for Internal Taxation, the Ministry of Finance and the Electricity Distribution Holding (CDEEE), the Social Cabinet and the ADESS, the Ministry of Education, the Ministry of Health, and SENASA. Finally, estimations have gone through two thorough review rounds by Tulane University, to verify results, correct for mistakes, and ensure the consistency with CEQ methodology (Lustig and Higgins, 2013) and the comparability to similar analyses.
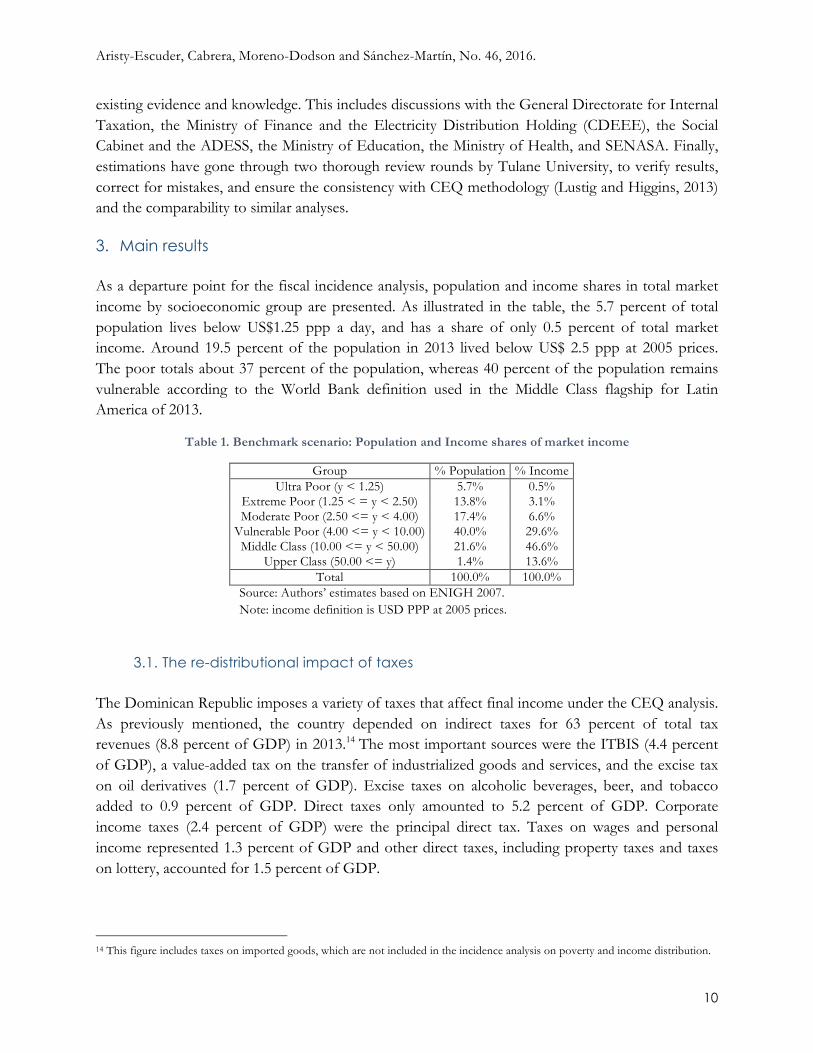
3. Main results As a departure point for the fiscal incidence analysis, population and income shares in total market income by socioeconomic group are presented. As illustrated in the table, the 5.7 percent of total population lives below US$1.25 ppp a day, and has a share of only 0.5 percent of total market income. Around 19.5 percent of the population in 2013 lived below US$ 2.5 ppp at 2005 prices. The poor totals about 37 percent of the population, whereas 40 percent of the population remains vulnerable according to the World Bank definition used in the Middle Class flagship for Latin America of 2013.
Table 1. Benchmark scenario: Population and Income shares of market income
Group % Population % Income Ultra Poor (y < 1.25) 5.7% 0.5%
Extreme Poor (1.25 < = y < 2.50) 13.8% 3.1% Moderate Poor (2.50 <= y < 4.00) 17.4% 6.6%
Vulnerable Poor (4.00 <= y < 10.00) 40.0% 29.6% Middle Class (10.00 <= y < 50.00) 21.6% 46.6%
Upper Class (50.00 <= y) 1.4% 13.6% Total 100.0% 100.0%
Source: Authors’ estimates based on ENIGH 2007. Note: income definition is USD PPP at 2005 prices.
3.1. The re-distributional impact of taxes The Dominican Republic imposes a variety of taxes that affect final income under the CEQ analysis. As previously mentioned, the country depended on indirect taxes for 63 percent of total tax revenues (8.8 percent of GDP) in 2013.14 The most important sources were the ITBIS (4.4 percent of GDP), a value-added tax on the transfer of industrialized goods and services, and the excise tax on oil derivatives (1.7 percent of GDP). Excise taxes on alcoholic beverages, beer, and tobacco added to 0.9 percent of GDP. Direct taxes only amounted to 5.2 percent of GDP. Corporate income taxes (2.4 percent of GDP) were the principal direct tax. Taxes on wages and personal income represented 1.3 percent of GDP and other direct taxes, including property taxes and taxes on lottery, accounted for 1.5 percent of GDP.
14 This figure includes taxes on imported goods, which are not included in the incidence analysis on poverty and income distribution.

Aristy-Escuder, Cabrera, Moreno-Dodson and Sánchez-Martín, No. 46, 2016.
11
According to the results of the CEQ analysis, and using the Lorenz curves estimates, both direct and indirect taxes appear to be progressive.15 As shown in rogressive than indirect taxes.
Figure 2, the concentration curves for direct and indirect taxes lie below the Lorenz curve for market income. As expected, direct taxes are much more progressive than indirect taxes.
Figure2.Progressivityofdirectandindirecttaxes:concentrationcurvesandLorenzcurveformarketincome
Source: Authors’ estimates based on ENIGH 2007.
Direct taxes only have a significant average incidence on the market income of individuals in the middle and upper classes, although it is perhaps smaller than what might be expected (Table 2).16 Direct taxes reduce the market income of the upper class (per capita income above US$50 PPP a day) by 4.1 percent.
Indirect taxes reduce the market income of the total population, but the incidence is progressive in absolute terms. The market income of the ultra-poor is reduced 4.7 percent, while the upper classes’ income is reduced by 10.4 percent. This is explained by the higher levels of consumption by the upper class, especially on goods that are outside the basic consumption basket (currently exempt).
15 A tax is everywhere progressive (regressive) if its concentration curve lies everywhere below (above) the market income Lorenz curve. 16 For Benchmark and Sensitivity Analysis 2, the results are the same and for Sensitivity Analysis 1 are very similar. For this reason, we include only the Benchmark results.
0%
20%
40%
60%
80%
100%
0% 20% 40% 60% 80% 100%
MarketIncome Indirecttaxes
Population Directtaxes

Aristy-Escuder, Cabrera, Moreno-Dodson and Sánchez-Martín, No. 46, 2016.
12
Table 2. Benchmark scenario: Incidence of direct and indirect taxes by socioeconomic group (% of market income)
Source: Authors’ estimates based on ENIGH 2007. Note: income definition is USD PPP at 2005 prices
3.1.1. Direct taxes Direct taxes (i.e., taxes on wages and personal income, interest income, and dividends) are found to be progressive (Figure 3). They represent 1.3 percent of total market income. Concentration shares show that the top decile of the population pays 92 percent of direct taxes, while it receives 40.5 percent of total market income. Direct taxes decrease market income 3 percent for the top decile; they only decrease the market income of the seventh decile by 0.1 percent. In terms of socioeconomic groups, middle-class households (per capita income between US$10 and US$50 a day) pay 56.3 percent of direct taxes, and the richest (above US$50 a day per capita income) pay 42.5 percent. It is important to take into account that the middle class accounts for 21.6 percent of total population and 46.6 percent of market income. Meanwhile, the richest group represents 1.4 percent of population and 13.6 percent of market income. This means that the relative tax burden is much higher among the rich.
Figure 3. Progressivity of direct taxes: Concentration curves and Lorenz curve for market income
Source: Authors’ estimates based on ENIGH 2007.
Direct taxes Indirect taxesUltra Poor (<1.25 USD PPP) 0.0% 4.7%Extreme Poor (1.25-2.5 USD PPP) 0.0% 5.4%Moderate Poor (2.5-4 USD PPP) 0.0% 5.4%Vulnerable (4-10 USD PPP) 0.0% 6.3%Middle Class (10-50 USD PPP) 1.6% 7.8%Upper Class (>50 USD PPP) 4.1% 10.4%
1.3% 7.5%
0.0%
20.0%
40.0%
60.0%
80.0%
100.0%
0.0% 20.0% 40.0% 60.0% 80.0% 100.0%
MarketIncome PersonalIncome Population
Interest Dividends

Aristy-Escuder, Cabrera, Moreno-Dodson and Sánchez-Martín, No. 46, 2016.
13
Figure 4. Direct taxes concentration shares per socioeconomic groups
Source: Authors’ estimates based on ENIGH 2007.
Note: y means income; for example, y<2.5 means income lower than 2.5 USD PPP at 2005 prices.
Personal income taxes—which account for 90.6 percent of the direct taxes in the analysis—are highly progressive in the Dominican Republic. These taxes. Personal income taxes reduce the market income of the top decile by 2.75 percent and the ninth decile by 0.46 percent. In terms of socioeconomic groups, personal income taxes reduce the average market income of the middle class by 1.5 percent and the richest segment of the population by 3.6 percent. The middle class represent 58.3 percent of total personal income tax payments and the highest-income group 41.6 percent (Figure 4). It is worth noting that the mean dividend tax in upper class is higher than middle class but, since the second group has more individuals, share of tax paid by the middle class over total collections is larger. In addition there could be some under reporting of income dividends in the household survey by high income individuals.
The tax on interest income affects the middle and upper socioeconomic groups. Established by the November 2012 tax reform, this tax represents 7.8 percent of total direct tax revenues. It reduces the market income of the population by 0.09 percent. The top decile’s income is reduced by 0.2 percent due to the 10 percent tax on interest earnings. The middle class pays 27.6 percent and of the total interest tax and the upper class 65.9 percent. In terms of socioeconomic groups, the data show that some people within the vulnerable population are paying tax on interest, resulting in a 0.02 percent reduction of their market income.
0%
50%
100%
PersonalIncometax Interesttax Dividendtax
ExtremePoor(y<2.5) ModeratePoor(2.5<y<4)Vulnerable(4<y<10) MiddleClass(10<y<50)UpperClass(y>50)

Aristy-Escuder, Cabrera, Moreno-Dodson and Sánchez-Martín, No. 46, 2016.
14
Table 3. Benchmark scenario: Incidence of personal income, interest, and dividend taxes by socioeconomic group (% of Market income)
Source: Authors’ estimates based on ENIGH 2007. Note: income definition is USD PPP at 2005 prices.
Figure 5. Direct taxes concentration shares per decile, country comparison
Source: Authors’ estimates and Lustig et al. (2013), CEQ Standard Indicators by a number of authors.
Dividend-tax payments reduce the average Dominican’s market income by 0.03 percent. The top three deciles account for 84.8 percent of total dividend tax payments. In terms of socioeconomic groups, the middle class pays 67.3 percent of dividend taxes, a much higher proportion than the richest population (6.3 percent). Those taxes reduce the market income of the middle class by 0.04 percent, while the toll on the richest population was only 0.01 percent (Table 3).
Figure 5 suggests that direct taxes could be more progressive in the Dominican Republic than in other countries. Of the selected cases, Jordan, and Peru have similar or higher progressivity. Low-income households in other countries, such as Armenia, Brazil, and Uruguay, pay much higher percentages of their market income as direct taxes. At the same time, it is worth noting that the Dominican Republic’s high exemption threshold results in the lowest share of direct taxes to GDP
Personal Income tax Interest tax Dividend taxUltra Poor (<1.25 USD PPP) 0.00% 0.00% 0.00%Extreme Poor (1.25-2.5 USD PPP) 0.00% 0.01% 0.00%Moderate Poor (2.5-4 USD PPP) 0.00% 0.01% 0.01%Vulnerable (4-10 USD PPP) 0.01% 0.02% 0.02%Middle Class (10-50 USD PPP) 1.49% 0.06% 0.04%Upper Class (>50 USD PPP) 3.65% 0.45% 0.01%
1.19% 0.09% 0.03%
-1%1%3%5%7%9%11%13%15%
0%2%4%6%8%
10%12%14%16%18%20%
ShareofGDP
(rightaxis)
Shareofm
arketincom
e
Poorestdecile Richestdecile ShareofGDP(rightaxis)
Aristy-Escuder, Cabrera, Moreno-Dodson and Sánchez-Martín, No. 46, 2016.
15
among surveyed countries. A decrease in informality, which currently accounts for 56 percent of labor activity, could also have a positive effect on personal income tax revenues. Nonetheless, the high amounts of foregone revenue can probably be explained by evasion among the richest. All these cross-country comparisons are based on a same estimation methodology (Lustig, 2013); nonetheless, since the taxes, rates, and exemptions may differ across countries, results should be interpreted with caution.
3.1.2. Indirect taxes
The analysis includes the ITBIS and several excises paid by Dominican Republic residents. The indirect taxes are subtracted from disposable income (i.e., net market income plus direct government transfers) to calculate post-fiscal incomes (once indirect subsidies are also added). The indirect taxes considered in the analysis are: the ITBIS; excise taxes on alcoholic beverages, beer, and cigarettes; and excise taxes on oil products, telecommunications, insurance services, and several other imported goods.
Rates vary on the Dominican Republic’s indirect taxes. The ITBIS is a value-added tax, which had two tax rates in 2013. The general tax rate was 18 percent and the reduced tax rate, levied on a group of primary goods, was 8 percent.17 The excise taxes on consumption are a single stage sales tax. The excise taxes on alcoholic beverages, beer, and cigarettes include specific taxes and ad valorem taxes.18 Telecommunications services are taxed at 10 percent and insurance services at 16 percent.
In terms of concentration, the share of indirect tax payments of the first eight deciles (35.3 percent) is below their share of market income (43.5 percent). By socioeconomic groups, the concentration share of those living on less than US$4 a day is lower for indirect taxes (7.3 percent) than for market income (10.2 percent). The middle class (per capita income between US$10 and US$50 a day)19 has a higher share in indirect taxes (48.9 percent) than market income (46.6 percent).
Indirect taxes have reduced the market income across all deciles; at the same time, their incidence is higher on the richer deciles, which makes these taxes progressive. Indirect taxes reduce the market income of the poorest decile by 5.1 percent, compared to 9.0 percent in the top decile. In terms of the socioeconomic groups, indirect taxes reduce middle class market income (per capita income between US$10 and US$50 a day) by 7.8 percent.
17 Law No. 253-12 of November 2012 states that the reduced tax rates would be increasing annually until 16 percent in 2016. It was also stated that the general tax rates would be reduced to 16 percent if the tax income achieve 16 percent of GDP in 2015. 18 See Title IV of the Law No. 11-92 Tax Code of the Dominican Republic. Ad valorem taxes are 10 percent on alcoholic beverages and beer and 20 percent on cigarettes. In this analysis, only ad valorem excise taxes are included because there is not enough information to map fixed excise taxes onto consumption of alcoholic beverages and cigarettes. 19 For a definition of middle class specific to the Dominican Republic, please see Guzmán (2011).
Aristy-Escuder, Cabrera, Moreno-Dodson and Sánchez-Martín, No. 46, 2016.
16
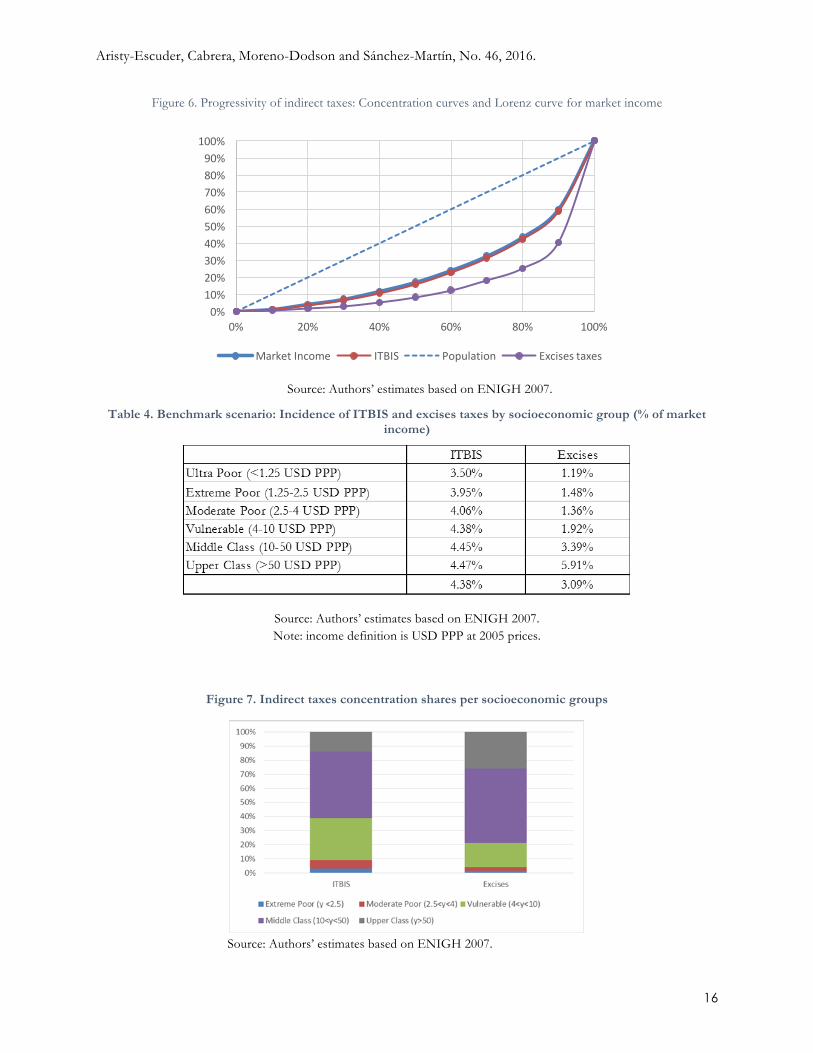
Figure 6. Progressivity of indirect taxes: Concentration curves and Lorenz curve for market income
Source: Authors’ estimates based on ENIGH 2007.
Table 4. Benchmark scenario: Incidence of ITBIS and excises taxes by socioeconomic group (% of market income)
Source: Authors’ estimates based on ENIGH 2007. Note: income definition is USD PPP at 2005 prices.
Figure 7. Indirect taxes concentration shares per socioeconomic groups
Source: Authors’ estimates based on ENIGH 2007.
0%10%20%30%40%50%60%70%80%90%
100%
0% 20% 40% 60% 80% 100%
MarketIncome ITBIS Population Excisestaxes

Aristy-Escuder, Cabrera, Moreno-Dodson and Sánchez-Martín, No. 46, 2016.
17
Note: Socio-economic income groups are defined in USD PPP at 2005 prices.
Excise taxes account for 41.4 percent of the indirect taxes included in this paper. These taxes are more progressive than ITBIS. Almost 60 percent of excise taxes are paid by the top decile of the population. In terms of socioeconomic groups, the middle class receives 46.6 percent of total market income and pays 51.1 percent of excise taxes (Figure 7). The 1.4 percent richest population (per capita income above US$50 PPP a day) accounts for 13.6 percent of total market income and pays 26 percent of excise taxes. Excise taxes reduce the market income received by the upper class by 5.9 percent, which is significantly higher than the reduction for the ultra-poor (1.2 percent).
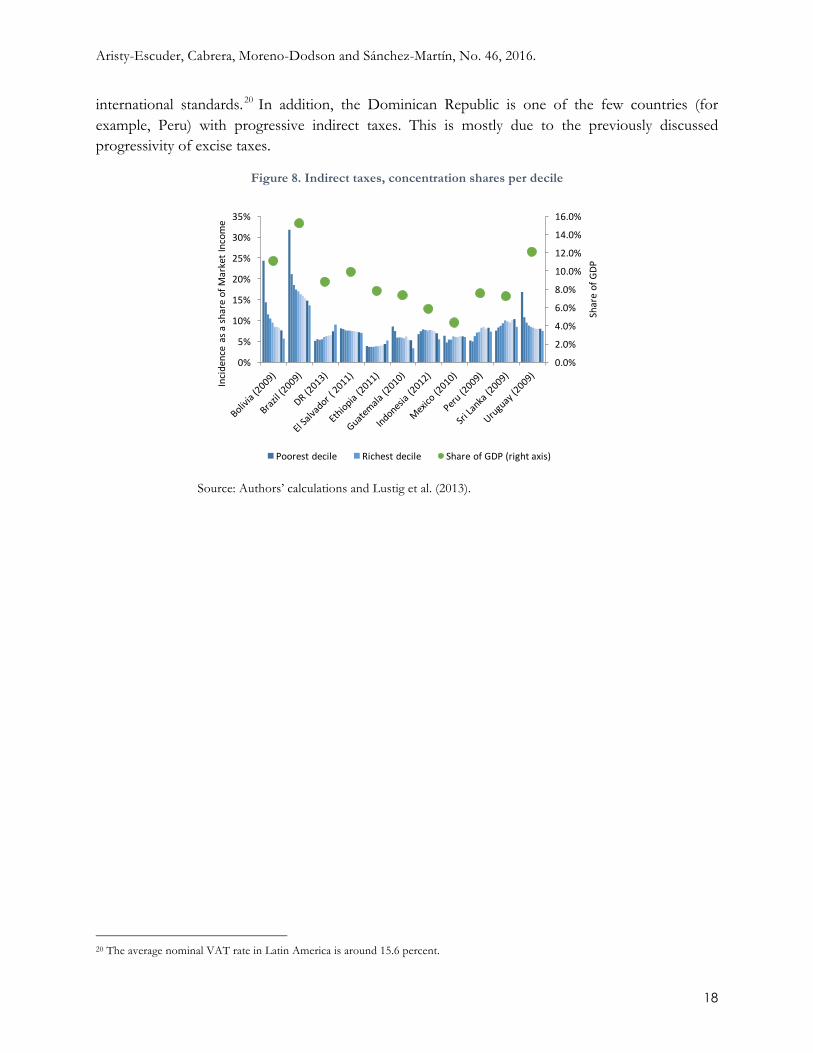
As a percentage of GDP, the Dominican Republic receives a relatively high level of revenue through indirect taxes. Compared with selected countries, indirect-tax revenues are higher in the Dominican Republic than in Mexico, Indonesia, Guatemala, Sri Lanka, Peru, and Ethiopia. At the same time, it is worth noting that the Dominican Republic’s VAT tax rate is also high (18 percent) by
Box1. IncludingVATevasionassumptionsintheDominicanRepublic
Value-added tax (VAT) evasion is a problem in the Dominican Republic. According to General Directorate of Internal Taxation (DGII) estimates for 2010, about 29.7 percent of this tax was evaded. Therefore, it was important to include an adjustment for evasion in estimating the CEQ.
In consultation with DGII experts, estimates of actual tax payments for a limited group of products were obtained. It was necessary to make assumptions of tax evasion for the products not covered by DGII data. The evidence suggests that taxes on some goods are either regularly evaded or paid in full, while evasion or payment depends on place of purchase for another group of goods. With this in mind, goods were clustered in the following four groups:
1. Highly probable that no tax is paid (100 percent evasion on the purchases of these goods).
2. Highly probably that taxes are paid (0 percent evasion on the purchases of these goods).
3. On those which the DGII has information on the proportion of tax paid, the effective tax rate was applied.
4. On those which it is assumed that tax payments are conditional on place of purchase, a different evasion rate was applied to urban and rural consumers.
To make these adjustments, we created two auxiliary files. The first includes each of the goods contained in the ENIGH 2007 that were classified in one of the four categories described above (product code and product group). The second defines whether the tax on the product is evaded or paid according to the place of purchase for those cases where evasion is conditional.
With the information on tax evasion, and taking into account the nominal tax rate for 2007 (16 percent), we calculated the VAT tax base for each household, given the level of consumption for each good in 2007. Then we applied the nominal tax rates for 2013 (18 percent and a reduced rate of 8 percent for some goods) for each type of good, adjusted by evasion levels. This allowed us to estimate the VAT payment for each good consumed by households in the survey.
Aristy-Escuder, Cabrera, Moreno-Dodson and Sánchez-Martín, No. 46, 2016.
18
international standards.20 In addition, the Dominican Republic is one of the few countries (for example, Peru) with progressive indirect taxes. This is mostly due to the previously discussed progressivity of excise taxes.
Figure 8. Indirect taxes, concentration shares per decile
Source: Authors’ calculations and Lustig et al. (2013).
20 The average nominal VAT rate in Latin America is around 15.6 percent.
0.0%
2.0%
4.0%
6.0%
8.0%
10.0%
12.0%
14.0%
16.0%
0%
5%
10%
15%
20%
25%
30%
35%
ShareofGDP
Incidenceasash
areofM
arketIncom
e
Poorestdecile Richestdecile ShareofGDP(rightaxis)

Aristy-Escuder, Cabrera, Moreno-Dodson and Sánchez-Martín, No. 46, 2016.
19
Table 5. Progressivity indices for direct and indirect taxes, country comparison
Kakwani index for
direct taxes
Direct taxes as a share of
GDP
RS index
Kakwani index for indirect
taxes
Indirect taxes as a share of
GDP
RS index
(1) (2) (3) =
(1)*(2)*100 (1) (2) (3) =
(1)*(2)*100
Armenia (2011) 0.23 5.2% 1.19 -0.04 12% -0.48
Bolivia (2009) -0.13 11% -1.46
Brazil (2009) 0.27 4.2% 1.13 -0.03 14% -0.46
Costa Rica( 2010) 0.00 0.00
Dominican Republic (2013) 0.42 1.3% 0.54 0.05 7% 0.37
El Salvador ( 2011) 0.00 0.00
Ethiopia (2011) 0.28 3.9% 1.11 0.06 8% 0.50
Indonesia (2012) -0.05 4% -0.22
Jordan (2010) 0.63 3.3% 2.09 -0.06 11% -0.60
Mexico (2010) 0.30 3.9% 1.14 0.01 4% 0.05
Peru (2009) 0.43 1.5% 0.65 0.02 7% 0.14
South Africa (2010) 0.13 14.3% 1.79 -0.08 10% -0.86
Sri Lanka (2009) 0.53 2.9% 1.52 0.00 7% 0.02
Uruguay (2009) 0.25 4.7% 1.18 -0.05 7% -0.37
Sources: Armenia (Younger et al., 2014), Bolivia (Paz et al., 2014), Brazil (Higgins and Pereira, 2014), Ethiopia (Hill et al., 2014), Indonesia (Jellema et al., 2014), Jordan (Serajuddin et al., 2014), Mexico (Scott, 2014), Peru (Jaramillo,
2014), Sri Lanka (Arunatilake et al., 2014), Uruguay (Bucheli et al., 2014), and authors’ estimates for Dominican Republic.
Tax progressivity in the Dominican Republic is high compared to other developing countries. Table 5 shows the Kakwani indexes for direct and indirect taxes in selected countries, allowing us to compare the progressivity of taxes. This index is equal to the difference between the concentration coefficients of a particular tax and the Gini coefficient of the reference income. When the Kakwani index is above zero, the tax is progressive. If it is below zero, the tax is regressive. And if it is equal to zero, the tax is neutral. The Reynolds-Smolensky (RS) Index shows the difference in value of Gini coefficient after Direct or Indirect Taxes. Among the selected countries, the Dominican Republic has one of most progressive direct taxes, with a Kakwani index of 0.42. Only Jordan, Sri Lanka, and Peru have more progressive direct-tax systems. In the Dominican Republic, indirect taxes are slightly progressive, with a Kakwani index of 0.05. International practice dictates that a Kakwani index between -0.1 and 0.1 could be considered neutral; however, looking at this group of countries, we conclude that the Dominican Republic has the second most progressive indirect tax system, just behind Ethiopia.

Aristy-Escuder, Cabrera, Moreno-Dodson and Sánchez-Martín, No. 46, 2016.
20
3.2. Social spending in the Dominican Republic This section assesses the incidence of direct transfers. These include the conditional cash transfer (CCT) food program Comer es Primero, CCT programs related to education, targeted transfers for LPG and electricity consumption, transfers to policemen and marines, indirect subsidies (mainly on electricity), and health and education services. The aim is to gain a better understanding of the extent to which Dominican social spending is progressive, using other countries as a benchmark for comparison.
3.2.1. Direct transfers Total concentration shares from the fiscal-incidence analysis show that some of the Dominican Republic’s direct transfer do better than others in reaching the poor. Around 52 percent of the public expenditures under Comer es Primero reaches poor households (per capita income below US$4 a day), 38 percent goes to the vulnerable (between US$4 and US$10 a day), and less than 10 percent benefits middle-class households (above US$10 a day per capita). For Bonogas Hogar and Bono Luz, more than 60 percent of total spending goes to the non-poor (earning more than US$4 a day); as previously explained, this relates to the fact that, unlike the CCTs, a group of the non-poor according to the SIUBEN life quality index can be beneficiaries of these programs. This makes Bonogas Hogar and Bono Luz the only programs progressive in relative terms (Figure 9, left panel). In contrast, Comer es Primero and the aggregate of other direct transfers are progressive in both relative and absolute terms, since, apart from representing a larger share of market income for poor households than for non-poor households, total transferred amount in aggregate terms are also larger for the former group. The CCT incentivizing school attendance, ILAE, would be the most progressive direct transfer program in the Dominican Republic.

Aristy-Escuder, Cabrera, Moreno-Dodson and Sánchez-Martín, No. 46, 2016.
21
Figure 9. Distribution of direct transfer spending by level (percentages)
Source: authors´ elaboration using the CEQ methodology. Note: Socio-economic income groups are defined in USD PPP at 2005 prices.
In terms of incidence, Comer es Primero would be the program with the largest impact. These direct transfers represent 5.5 percent of market income among the ultra-poor (less than US$1.25 a day) and 2.1 percent for the extremely poor (below US$2.50 a day) (Table 6). This has to do with the amount of the transfer, which is significantly larger for Comer es Primero than for ILAE; the latter is included in the Other Direct Transfers category. The incidence of Bonogas Hogar, Bono Luz, and Quisqueya Aprende Contigo is more limited due to the relatively modest amount transferred and the fact that some the funds go to the non-poor population.
Table 6. Incidence of direct transfer programs on socioeconomic class income (percentages)
Comer es Primero Bono Luz
Quisqueya Aprende Contigo
Bono Gas Hogares
Other Direct Transfers
Ultra-poor (<1.25 USD PPP) 5.55% 1.14% 1.15% 1.18% 5.92% Extreme Poor (1.25-2.5 USD PPP) 2.15% 0.51% 0.57% 0.52% 2.29%
Moderate Poor (2.5-4 USD PPP) 1.00% 0.28% 0.31% 0.27% 1.15%
Vulnerable (4-10 USD PPP) 0.39% 0.16% 0.17% 0.11% 0.32%
Middle Class (10-50 USD PPP) 0.06% 0.05% 0.05% 0.03% 0.04%
Upper Class (>50 USD PPP) 0.00% 0.00% 0.01% 0.00% 0.00%
0.31% 0.11% 0.12% 0.09% 0.29% Source: Authors’ estimates based on ENIGH 2007. Note: income definition is USD PPP at 2005 prices.
0.0%
20.0%
40.0%
60.0%
80.0%
100.0%
0.0% 20.0% 40.0% 60.0% 80.0% 100.0%
Population MarketIncome
Comeresprimero BonoGasHogares
BonoLuz Quisqueyaaprendecontigo
OtherDirectTransfers
0.0%10.0%20.0%30.0%40.0%50.0%60.0%70.0%80.0%90.0%100.0%
Comeresprimero
BonoGasHogares
BonoLuz Quisqueyaaprendecontigo
OtherDirect
Transfers
ExtremePoor(y<2.5) ModeratePoor(2.5<y<4)
NonPoor(y>4)
Aristy-Escuder, Cabrera, Moreno-Dodson and Sánchez-Martín, No. 46, 2016.
22
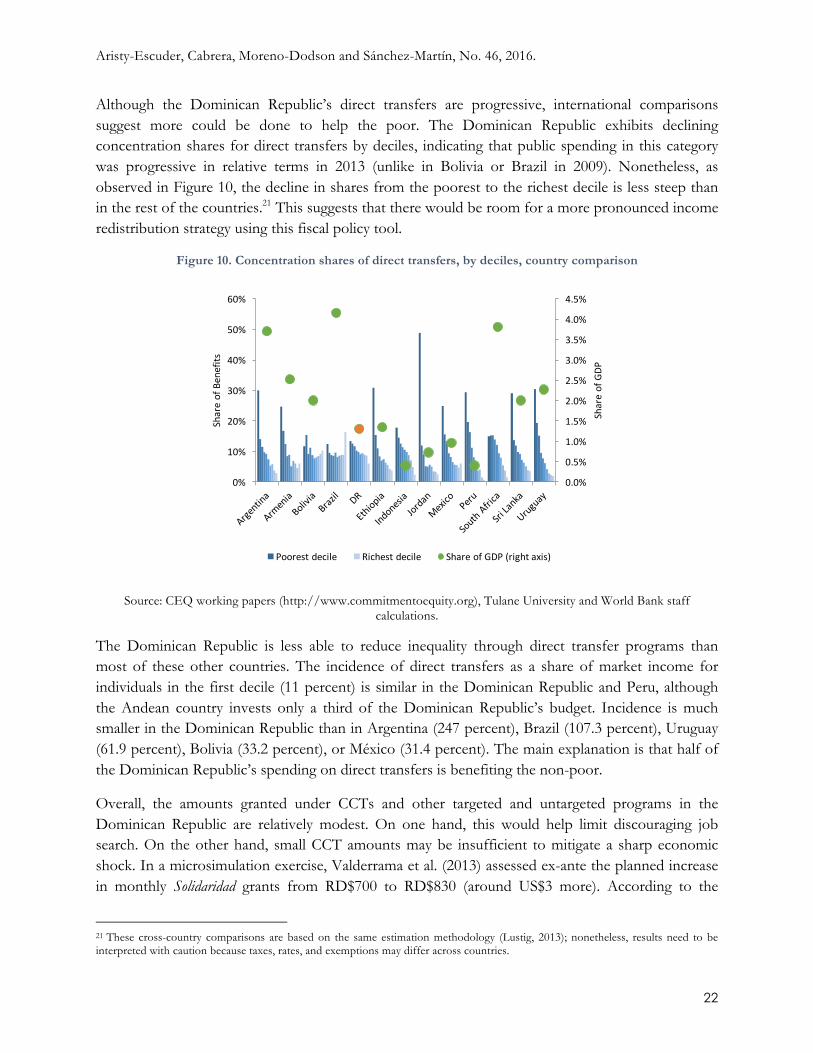
Although the Dominican Republic’s direct transfers are progressive, international comparisons suggest more could be done to help the poor. The Dominican Republic exhibits declining concentration shares for direct transfers by deciles, indicating that public spending in this category was progressive in relative terms in 2013 (unlike in Bolivia or Brazil in 2009). Nonetheless, as observed in Figure 10, the decline in shares from the poorest to the richest decile is less steep than in the rest of the countries.21 This suggests that there would be room for a more pronounced income redistribution strategy using this fiscal policy tool.
Figure 10. Concentration shares of direct transfers, by deciles, country comparison
Source: CEQ working papers (http://www.commitmentoequity.org), Tulane University and World Bank staff calculations.
The Dominican Republic is less able to reduce inequality through direct transfer programs than most of these other countries. The incidence of direct transfers as a share of market income for individuals in the first decile (11 percent) is similar in the Dominican Republic and Peru, although the Andean country invests only a third of the Dominican Republic’s budget. Incidence is much smaller in the Dominican Republic than in Argentina (247 percent), Brazil (107.3 percent), Uruguay (61.9 percent), Bolivia (33.2 percent), or México (31.4 percent). The main explanation is that half of the Dominican Republic’s spending on direct transfers is benefiting the non-poor.
Overall, the amounts granted under CCTs and other targeted and untargeted programs in the Dominican Republic are relatively modest. On one hand, this would help limit discouraging job search. On the other hand, small CCT amounts may be insufficient to mitigate a sharp economic shock. In a microsimulation exercise, Valderrama et al. (2013) assessed ex-ante the planned increase in monthly Solidaridad grants from RD$700 to RD$830 (around US$3 more). According to the
21 These cross-country comparisons are based on the same estimation methodology (Lustig, 2013); nonetheless, results need to be interpreted with caution because taxes, rates, and exemptions may differ across countries.
0.0%
0.5%
1.0%
1.5%
2.0%
2.5%
3.0%
3.5%
4.0%
4.5%
0%
10%
20%
30%
40%
50%
60%
ShareofGDP
ShareofBenefits
Poorestdecile Richestdecile ShareofGDP(rightaxis)

Aristy-Escuder, Cabrera, Moreno-Dodson and Sánchez-Martín, No. 46, 2016.
23
results, this would have resulted in a decrease of 0.22 percent in moderate poverty and 0.65 percent in extreme poverty.
Summarizing, cash transfers in the Dominican Republic are generally well targeted and benefit the poor and vulnerable more than proportionately. Most direct transfer programs are built on three transparent mechanisms or institutions: the Solidaridad debit card, the SIUBEN census of beneficiaries, and ADESS as independent administrator for transferring funds. Comer es Primero and Incentivo a la Asistencia Escolar are highly progressive programs. On the other hand, 60 percent of public spending on Bono Luz, and Bonogas Hogar goes to the non-poor (vulnerable and middle class), making them barely progressive. Compared to other countries, the impact of direct transfers on poverty and equity is modest due to the fact that, while coverage has noticeably expanded over the past eight years, the amount of individual transfers is relatively small, and part of public spending is directed to the non-poor.
3.2.2. Indirect subsidies
In addition to targeted direct transfer mechanisms, generalized subsidies remain in place—for electricity. As previously mentioned, both subsidies have in common a structure of explicit (tariffs below costs) and implicit (irregular connections, fraud, non-payment) components. Given this partly informal nature, few studies have analyzed the distributional impact of utility subsidies in the Dominican Republic. In what is probably the most comprehensive of them, Actis (2012) estimated that 83 percent of electricity subsidies were directed to non-poor households. Following a similar approach, an analysis consistent with the CEQ methodology has been prepared (Box 2).
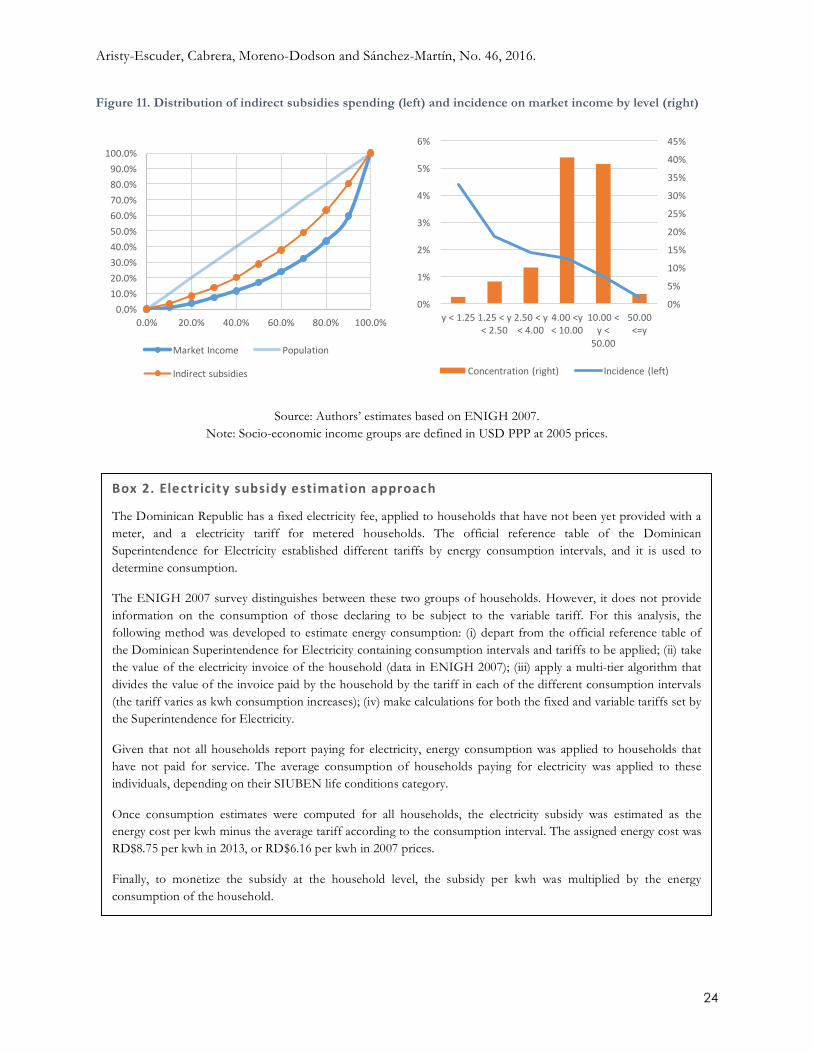
Results confirm that around 81 percent of total spending on electricity in 2013 benefited non-poor individuals. As in many countries, indirect subsidies were only progressive in relative terms (improving the distribution relative to market income), but are regressive in absolute terms (remain below the 45 degree line in Figure 11, left panel). Most spending on indirect subsidies is concentrated on the vulnerable and middle class. Nonetheless, indirect subsidies represent 4.4 percent of the market income of the ultra-poor and around 2.5 percent of the market income of the extreme poor (Figure 11, right panel). So eliminating these subsidies, if feasible, would need compensatory mechanisms to shield the poor from a deterioration in their purchasing power. This could be done through well-targeted and formally established mechanisms, such as Bono Luz.
Aristy-Escuder, Cabrera, Moreno-Dodson and Sánchez-Martín, No. 46, 2016.
24
Figure 11. Distribution of indirect subsidies spending (left) and incidence on market income by level (right)
Source: Authors’ estimates based on ENIGH 2007. Note: Socio-economic income groups are defined in USD PPP at 2005 prices.
0.0%10.0%20.0%30.0%40.0%50.0%60.0%70.0%80.0%90.0%100.0%
0.0% 20.0% 40.0% 60.0% 80.0% 100.0%
MarketIncome Population
Indirectsubsidies
0%
5%
10%
15%
20%
25%
30%
35%
40%
45%
0%
1%
2%
3%
4%
5%
6%
y<1.25 1.25<y<2.50
2.50<y<4.00
4.00<y<10.00
10.00<y<
50.00
50.00<=y
Concentration(right) Incidence (left)
Box2.Electricitysubsidyestimationapproach
The Dominican Republic has a fixed electricity fee, applied to households that have not been yet provided with a meter, and a electricity tariff for metered households. The official reference table of the Dominican Superintendence for Electricity established different tariffs by energy consumption intervals, and it is used to determine consumption.
The ENIGH 2007 survey distinguishes between these two groups of households. However, it does not provide information on the consumption of those declaring to be subject to the variable tariff. For this analysis, the following method was developed to estimate energy consumption: (i) depart from the official reference table of the Dominican Superintendence for Electricity containing consumption intervals and tariffs to be applied; (ii) take the value of the electricity invoice of the household (data in ENIGH 2007); (iii) apply a multi-tier algorithm that divides the value of the invoice paid by the household by the tariff in each of the different consumption intervals (the tariff varies as kwh consumption increases); (iv) make calculations for both the fixed and variable tariffs set by the Superintendence for Electricity.
Given that not all households report paying for electricity, energy consumption was applied to households that have not paid for service. The average consumption of households paying for electricity was applied to these individuals, depending on their SIUBEN life conditions category.
Once consumption estimates were computed for all households, the electricity subsidy was estimated as the energy cost per kwh minus the average tariff according to the consumption interval. The assigned energy cost was RD$8.75 per kwh in 2013, or RD$6.16 per kwh in 2007 prices.
Finally, to monetize the subsidy at the household level, the subsidy per kwh was multiplied by the energy consumption of the household.

Aristy-Escuder, Cabrera, Moreno-Dodson and Sánchez-Martín, No. 46, 2016.
25
Figure 12. Concentration shares (left) and incidence of indirect subsidies (right) in comparable countries
Source: CEQ working papers (http://www.commitmentoequity.org), Tulane University and World Bank staff calculations.
Indirect subsidies are also regressive in absolute terms in these other countries—except for Brazil, where concentration shares decline toward the richer deciles (Figure 12, left panel). In Jordan, Mexico, and Sri Lanka, these subsidies help by improving the income of the bottom deciles significantly more than the rest of the distribution (Figure 12, right panel). In the Dominican Republic, with a similar level of spending to GDP, the incidence on the bottom deciles is more modest.22
3.2.3. In kind-transfers: education and health
While the effect on inequality of taxes, direct transfers, and subsidies has been small in the Dominican Republic, public expenditures in education and health seem to have greater contributions in terms of inequality reduction. This is because both categories of social spending are progressive in absolute terms—i.e., the per capita amount received declines as income increases. As a result, the accumulated shares of public expenditure in health or education is higher than their accumulated percentage of the total population (Figure 13). In fact, the bottom 40 percent of the population receives around 52 percent of spending for education and 58 percent for health.
We estimate the incidence of education spending on inequality at its 2013 level and simulate an alternative scenario to try to assess a counterfactual with spending levels remaining at 2011 levels. By contrasting the impact of these two different levels of spending on poverty and inequality, we conclude that the size of social spending matters. In the benchmark scenario, which includes the
22 These cross-country comparisons are based on the same estimation methodology (Lustig, 2013); nonetheless, results need to be interpreted with caution because taxes, rates, and exemptions differ across countries.
0.0%
0.5%
1.0%
1.5%
2.0%
2.5%
3.0%
3.5%
4.0%
4.5%
0%
5%
10%
15%
20%
25%
30%
35%
40%
ShareofGDP
ShareofBenefits
Poorestdecile Richestdecile ShareofGDP(rightaxis)
00%
01%
01%
02%
02%
03%
03%
04%
04%
05%
0%
2%
4%
6%
8%
10%
12%
ShareofGDP
Incidenceasash
areofm
arketincom
e
Poorestdecile Richestdecile ShareofGDP(rightaxis)

Aristy-Escuder, Cabrera, Moreno-Dodson and Sánchez-Martín, No. 46, 2016.
26
increased education expenditures (to 3.8 percent of GDP), Gini-coefficient inequality was reduced by 5.6 points. This reduction compares favorably with a scenario where public education expenditures stay at the 2011 level of 1.9 percent of GDP; the Gini would be reduced by only 4.5 points. Using the same logic, the impact of health spending in reducing inequality is lower because health spending levels are half those for education, even if health spending is more progressive.
Figure 13. Progressivity of health and education spending: concentration curves and Lorenz curve for market income
Source: Authors’ estimates based on ENIGH 2007.
The monetized value of in-kind transfers is more significant for the lower income strata. Education spending increases overall market income by 3.3 percent; however, the effect of education is equivalent to more than 10 percent of income for the extremely and moderately poor. In Sensitivity Analysis 2, the scenario of lower spending of education, it is important to note that benefits increased by a greater proportion for poor households (Table 7). The impact on market income is lower for health spending than for education, and these expenditures do not significantly affect the middle class and upper classes.
Progressivity benefits the poorest segments of population, but it could be an indicator of other social trends in education and health care. Those with higher incomes might be opting out for private education and, in the case of health, participate in contributive health insurance schemes. For example, more than 90 percent of ultra-poor or extreme-poor children in primary school (ages 7 to 12 years) went to public schools. In contrast, around 33 percent of middle-class children went to public schools (see the discussion in Sánchez-Martin and Senderowitsch (2012), pp.10-20).
0%10%20%30%40%50%60%70%80%90%
100%
0% 20% 40% 60% 80% 100%
MarketIncome Education Population Health

Aristy-Escuder, Cabrera, Moreno-Dodson and Sánchez-Martín, No. 46, 2016.
27
Table 7. Distribution of health and education spending by socioeconomic group (% of Market income)
Education 2011* Education 2013 Health Ultra-poor (<1.25 USD PPP) 25.2% 50.9% 28.4% Extreme Poor (1.25-2.5 USD PPP) 9.9% 19.9% 12.0% Moderate Poor (2.5-4 USD PPP) 5.5% 11.1% 6.4% Vulnerable (4-10 USD PPP) 2.1% 4.2% 2.2% Middle Class (10-50 USD PPP) 0.5% 0.9% 0.3% Upper Class (>50 USD PPP) 0.0% 0.1% 0.0% Note: * Sensitivity Analysis 2 1.7% 3.3% 1.7%
Source: Authors’ estimates based on ENIGH 2007. Note: income definition is USD PPP at 2005 prices.
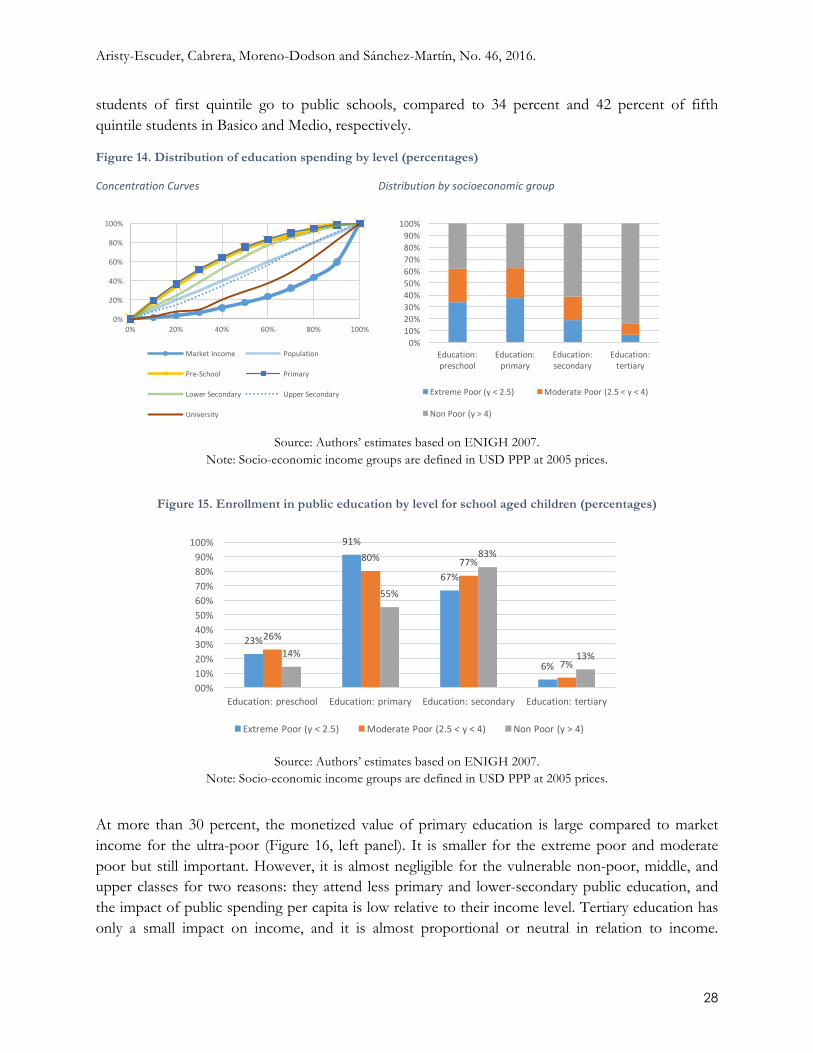
Education Total public education expenditures are progressive in absolute terms, according the CEQ analysis, but only pre-school, primary, and lower secondary levels achieve this standard of progressivity. For these levels, the bottom 40 percent of the population receives close to two-thirds of spending (Figure 14, left). Upper secondary income is progressive in relative terms and almost proportional to population, which means that the proportion received in relation to market income decreases with income. As in other countries, tertiary education is the least progressive, with more that 20 percent of public spending going to non-poor students.
Educational failure and opt-out reduce participation of the poor in higher levels of education. In lower levels, like pre-school and primary, almost 60 percent of total expenditures go to poor households. The share shrinks to 40 percent for secondary levels and less than 20 percent for tertiary levels (Figure 14, right panel). This may be caused by quality concerns about public education, which leads to those who can afford it opting out form the public system and into private schools. Sánchez-Martín and Senderowitsch (2012, p. 13) explained that “the education sector in the DR presents faulty public service delivery, which originates a private offer that is more of a reactive upshot to deficiencies in state education than a high quality alternative (at least not in every case).”
For the poor, the benefits of education are high for primary schooling but not at other levels. First, Figure 15 shows that almost all children from extremely poor households are enrolled in primary education. This declines to two-thirds in secondary education, less than a quarter in pre-school, and only 6 percent in university. 23 Second, public primary-school enrollment declines as income increases; in increases for secondary school and university. For the lower levels, it could be the result of opt-out to private schools for quality concerns. Finally, pre-school enrollment is low in public schools. Around three quarters of students go to public schools;24 however close to 90 percent of
23 According to the Ministry of Education, using a different classification, net enrollment rates in 2012-13 were 44.0 percent for Inicial, 92.6 percent for Básico, and 54.1 percent for Medio. 24 According to administrative records, this figure is 75 percent of Básica students and 77 percent of Medio students in 2012-201. In our analysis, 74 percent of students of Básica and 70 percent of Medio go to public schools.
Aristy-Escuder, Cabrera, Moreno-Dodson and Sánchez-Martín, No. 46, 2016.
28
students of first quintile go to public schools, compared to 34 percent and 42 percent of fifth quintile students in Basico and Medio, respectively.
Figure 14. Distribution of education spending by level (percentages)
ConcentrationCurves Distributionbysocioeconomicgroup
Source: Authors’ estimates based on ENIGH 2007.
Note: Socio-economic income groups are defined in USD PPP at 2005 prices.
Figure 15. Enrollment in public education by level for school aged children (percentages)
Source: Authors’ estimates based on ENIGH 2007.
Note: Socio-economic income groups are defined in USD PPP at 2005 prices.
At more than 30 percent, the monetized value of primary education is large compared to market income for the ultra-poor (Figure 16, left panel). It is smaller for the extreme poor and moderate poor but still important. However, it is almost negligible for the vulnerable non-poor, middle, and upper classes for two reasons: they attend less primary and lower-secondary public education, and the impact of public spending per capita is low relative to their income level. Tertiary education has only a small impact on income, and it is almost proportional or neutral in relation to income.
0%
20%
40%
60%
80%
100%
0% 20% 40% 60% 80% 100%
MarketIncome Population
Pre-School Primary
LowerSecondary UpperSecondary
University
0%10%20%30%40%50%60%70%80%90%100%
Education:preschool
Education:primary
Education:secondary
Education:tertiary
ExtremePoor(y<2.5) ModeratePoor(2.5<y<4)
NonPoor(y>4)
23%
91%
67%
6%
26%
80% 77%
7%14%
55%
83%
13%
00%10%20%30%40%50%60%70%80%90%100%
Education:preschool Education:primary Education:secondary Education:tertiary
ExtremePoor(y<2.5) ModeratePoor(2.5<y<4) NonPoor(y>4)

Aristy-Escuder, Cabrera, Moreno-Dodson and Sánchez-Martín, No. 46, 2016.
29
Because pre-school has low coverage, it has a lower impact than secondary education, even though both are progressive (Figure 16, right panel). In particular, upper-secondary incidence is significant for the vulnerable non-poor population, even more important than lower secondary and pre-school.
The middle and upper classes make up around 23 percent of the population, and they hardly use the public education services, with the exception of higher education and upper secondary. However, education reform introduced extended school days. This program not only increases school hours but also provides breakfast, lunch, and snacks. Education reform also includes improvements in education infrastructure, postgraduate programs for teachers, innovative teaching practices, foreign languages, and technology (OECD, 2015). As a result, public-education use probably will increase in non-poor households, especially among vulnerable and middle class in the near future.
Figure 16. Incidence of education expenditures by level for school aged children (percentages)
Source: Authors’ estimates based on ENIGH 2007. Note: Socio-economic income groups are defined in USD PPP at 2005 prices.
Figure 17. Incidence of education expenditure by level for school aged children (percentages)
Source: CEQ working papers (http://www.commitmentoequity.org), Tulane University and World Bank staff calculations.
32%
12%
6%2% 0% 0%
0%
5%
10%
15%
20%
25%
30%
35%
Primary
0%1%2%3%4%5%6%7%8%
Pre-School LowerSecondaryUpperSecondary University
0.0%
1.0%
2.0%
3.0%
4.0%
5.0%
6.0%
-60%
-10%
40%
90%
140%
190%
Armenia(2011)
Brazil(2009)
DR(2013) Indonesia(2012)
Mexico(2010)
Peru(2009)
Uruguay(2009)
ShareofGDP
Incidenceasash
areofM
arketIncom
e
Poorestdecile Richestdecile ShareofGDP(rightaxis)

Aristy-Escuder, Cabrera, Moreno-Dodson and Sánchez-Martín, No. 46, 2016.
30
The Dominican Republic compares favorably with other countries in education spending’s incidence on the income of the poorest deciles. For example, countries with similar levels of education spending, like Indonesia and Armenia, have smaller income impacts on the poorest decile (Figure 17). In contrast, education expenditures have a higher incidence on the poorest deciles in Uruguay than in the Dominican Republic. Peru spends less on education, but it has almost the same spending incidence as the Dominican Republic.25 Health Health expenditures are even more progressive than education, according to the CEQ results. Due to the limited resources devoted to health, however, the redistributive effect is lower. All components of public health in the analysis are progressive in absolute terms. Subsidized health insurance covers a large portion of the extreme poor, and non-contributive programs (hospital and outpatient care) reach a big portion of the moderate poor. In contrast, the Essential Medicines Program (PROMESE), which includes spending to purchase medicines and medical supplies for public health institutions as well as the distribution of subsidized medicines, is just barely progressive (Figure 18, left panel).
Figure 18. Distribution of health spending by level (percentages)
Concentration Curves Distribution by socioeconomic group
Source: Authors’ estimates based on ENIGH 2007. Note: Socio-economic income groups are defined in USD PPP at 2005 prices.
Despite the progressivity, many people in the low-income strata are still not covered by subsidized or non-contributive health insurance. Figure 19 shows coverage is low in poor households. The finding is consistent with information from ENDESA 2013 (CESDEM, 2014), where the poorest
25 These cross-country comparisons are based on the same estimation methodology (Lustig, 2013); nonetheless, the results need to be interpreted with caution because taxes, rates, and exemptions may differ across countries.
0%
20%
40%
60%
80%
100%
0% 20% 40% 60% 80% 100%MarketIncome PopulationSubsidizedHealthInsurance Promese- MedicinesNoncontributive
32% 30%20%
23% 25%
20%
46% 45%60%
00%
10%
20%
30%
40%
50%
60%
70%
80%
90%
100%
SubsidizedHealthInsurance
Noncontributive Promese
ExtremePoor(y<2.5) ModeratePoor(2.5<y<4)NonPoor(y>4)

Aristy-Escuder, Cabrera, Moreno-Dodson and Sánchez-Martín, No. 46, 2016.
31
two quintiles had coverage of less than 25 percent in the subsidized regime and less than 21 percent in the non-contributive regime. In the lowest quintile, two-thirds of the population does not report having health insurance. Hence, substantial challenges remain in terms of increasing health-insurance coverage. Despite the progress already made, further increases could benefit poor households. Valderrama, et al. (2012) analyze the impact of the projected increase in SENASA coverage to 4 million in 2016. Using the ENFT household survey to simulate the impact on income, they conclude that this policy could reduce extreme poverty 0.78 percent to 1.18 percent.
Figure 19. Individuals who live in beneficiary households by health program and socioeconomic ranking (percentages)
Source: Authors’ estimates based on ENIGH 2007. Note: Socio-economic income groups are defined in USD PPP at 2005 prices.
The incidence of non-contributive health is the most important of this category. This is because the amount of the health insurance granted under the non-contributive health regime is six times larger than the subsidized scheme. As designed, the subsidized regime does not benefit the non-poor and moderate poor, only the extreme poor and ultra-poor (Figure 20). Finally, PROMESE expenditures—related to cheaper medicines that can be acquired by poor and non-poor at the so-called Boticas Populares—is small compared to market income. However, pharmaceutical products are very important, accounting for 2.6 percent of household budget (CPI basket).
26% 28%
16%21% 23%
18%
53% 49%
66%
0%10%20%30%40%50%60%70%80%90%100%
SubsidizedHealthInsurance Noncontributive Promese
ExtremePoor(y<2.5) ModeratePoor(2.5<y<4) NonPoor(y>4)

Aristy-Escuder, Cabrera, Moreno-Dodson and Sánchez-Martín, No. 46, 2016.
32
Figure 20. Incidence of health expenditures by coverage regime
Source: Authors’ estimates based on ENIGH 2007.
Note: Socio-economic income groups are defined in USD PPP at 2005 prices.
In the Dominican Republic, spending policies vary greatly in their impact on the poor. To better understand the effects of the different lines of social spending on equity, Figure 21 adds to the previously presented concentration curves by presenting concentration coefficients for each fiscal instrument.26 Most social programs are progressive in absolute terms, with a coefficient below -0.1. This includes most components of education expenditures—except for tertiary education, which is regressive, as in most countries. All health-spending components are also progressive in absolute terms. The most progressive cash transfer is the Incentivo a la Asistencia Escolar (-0.5), followed by Bonogas Chofer and Comer es Primero. Bonogas Hogar and Bono Luz are practically neutral in terms of redistribution; Incentivo a la Marina is regressive. Both the indirect electricity subsidy and the tax expenditure are highly regressive in the sense that they contribute to increasing the disposable income per capita of the wealthier proportionately more than they benefit the poor. We include also contributory pensions (analyzed in Sensitivity Analysis 2), whose incidence is almost neutral (very close to Gini of Market Income), and analysis of VAT tax expenditure, which is detailed in section 5.1, Alternative VAT scenarios for a Fiscal Impact Pact.
26 Concentration coefficients are calculated in the same manner as the Gini; when the concentration coefficient is above the diagonal, the difference between the triangle of perfect equality and the area under the curve is negative and spending is progressive in absolute terms (i.e., the size of the transfer per capita falls with per capita income).
0%
5%
10%
15%
20%
25%
UltraPoor ExtremePoor ModeratePoor
Vulnerable MiddleClass UpperClass
SubsidizedHealthInsurance NonContributivePromese- Medicines

Aristy-Escuder, Cabrera, Moreno-Dodson and Sánchez-Martín, No. 46, 2016.
33
Figure 21. Concentration coefficients with respect to market income, by fiscal instrument
Source: Authors’ estimates based in ENIGH 2007.
0.510.470.46
0.440.300.29
0.05-0.01-0.02
-0.04-0.12-0.12
-0.17-0.19-0.19-0.19
-0.24-0.25-0.26-0.26-0.27
-0.30-0.33-0.33-0.33-0.33
-0.50
-0.60 -0.40 -0.20 0.00 0.20 0.40 0.60
Gini(MarketIncome)TaxExpenditures
TotalContributoryPensionsIncentivoalaMarina
TertiaryEducationSpendingElectricitySubsidy
UpperSecondaryEducationSpendingBonoLuz
BonoGasHogaresPromese
TotalCEQSocialSpendingQuisqueyaAprendeEducation(alllevels)
SuplementoalimienticioenvejecientesLowerSecondaryEducationSpending
AllCashTransfersComeresprimero
RegimenSubsidiadoSenasaHealthSpending
SaludnocontributivaHospitalesSaludnocontributivaAmbulatoria
Pre-schoolEducationSpendingBonoGasChoferes
SchoolFoodProgramSchoolsupplies
PrimaryEducationSpendingIncentivoalaAsistenciaEscolar
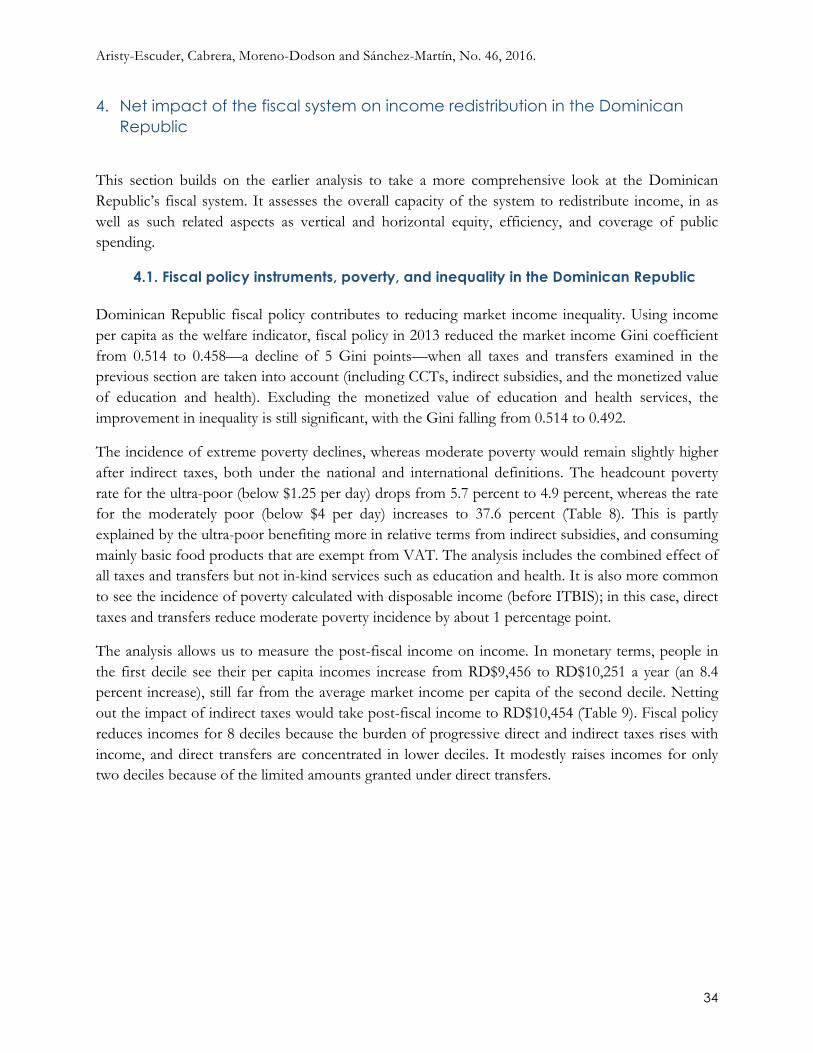
Aristy-Escuder, Cabrera, Moreno-Dodson and Sánchez-Martín, No. 46, 2016.
34
4. Net impact of the fiscal system on income redistribution in the Dominican Republic
This section builds on the earlier analysis to take a more comprehensive look at the Dominican Republic’s fiscal system. It assesses the overall capacity of the system to redistribute income, in as well as such related aspects as vertical and horizontal equity, efficiency, and coverage of public spending.
4.1. Fiscal policy instruments, poverty, and inequality in the Dominican Republic Dominican Republic fiscal policy contributes to reducing market income inequality. Using income per capita as the welfare indicator, fiscal policy in 2013 reduced the market income Gini coefficient from 0.514 to 0.458—a decline of 5 Gini points—when all taxes and transfers examined in the previous section are taken into account (including CCTs, indirect subsidies, and the monetized value of education and health). Excluding the monetized value of education and health services, the improvement in inequality is still significant, with the Gini falling from 0.514 to 0.492.
The incidence of extreme poverty declines, whereas moderate poverty would remain slightly higher after indirect taxes, both under the national and international definitions. The headcount poverty rate for the ultra-poor (below $1.25 per day) drops from 5.7 percent to 4.9 percent, whereas the rate for the moderately poor (below $4 per day) increases to 37.6 percent (Table 8). This is partly explained by the ultra-poor benefiting more in relative terms from indirect subsidies, and consuming mainly basic food products that are exempt from VAT. The analysis includes the combined effect of all taxes and transfers but not in-kind services such as education and health. It is also more common to see the incidence of poverty calculated with disposable income (before ITBIS); in this case, direct taxes and transfers reduce moderate poverty incidence by about 1 percentage point.
The analysis allows us to measure the post-fiscal income on income. In monetary terms, people in the first decile see their per capita incomes increase from RD$9,456 to RD$10,251 a year (an 8.4 percent increase), still far from the average market income per capita of the second decile. Netting out the impact of indirect taxes would take post-fiscal income to RD$10,454 (Table 9). Fiscal policy reduces incomes for 8 deciles because the burden of progressive direct and indirect taxes rises with income, and direct transfers are concentrated in lower deciles. It modestly raises incomes for only two deciles because of the limited amounts granted under direct transfers.

Aristy-Escuder, Cabrera, Moreno-Dodson and Sánchez-Martín, No. 46, 2016.
35
Table 8. Dominican Republic: Poverty and inequality indicators at each income concept
Market income
Net market income
Disposable income
Post-fiscal income
Final income
-1 -2 -3 -4 -5
(2) =(1) -- Direct taxes
(3)=(2)+Cash transfers
(4)= (3)--Indirect taxes
5=4 + In-kind transfers
Inequality indicators
Gini coefficient 0.514 0.509 0.502 0.492 0.458
Theil index 0.521 0.506 0.495 0.468 0.413
90/10 10.41 10.34 9.69 9.28 7.13
Headcount poverty indicators
National extreme poverty line* 13.8% 13.8% 12.5% 13.1% –
National moderate poverty line* 41.2% 41.2% 40.1% 42.3% –
US$1.25 PPP per day 5.7% 5.7% 4.7% 4.9% –
US$2.50 PPP per day 19.5% 19.5% 18.2% 19.5% –
US$4.0 PPP per day 37.0% 37.0% 35.9% 37.6% –
Source: Authors’ estimates based in ENIGH 2007. * Official poverty estimates based in ONE and MEPyD (2012). The lower bound poverty line was set at RD$1,397 per month in 2005/06 using March 2006 prices for urban areas and RD$1,458 for urban areas. The upper bound poverty line was set at RD$2,883 per month in 2005/06 using March 2006 prices for rural areas and RD$3,238 for urban areas. Socio-economic income groups are defined in USD PPP at 2005 prices.
Table 9. Average per capita income in each market income decile, in Dominican pesos a year
Decile Market income (1)
Net market income
(2)
Disposable income
(3)
Post-fiscal income
(4)
Poorest 9,456 9,456 10,454 10,251
2 17,977 17,972 18,924 18,361
3 25,507 25,503 26,339 25,429
4 32,515 32,512 33,282 32,066
5 40,341 40,334 41,033 39,387
6 49,635 49,628 50,251 47,934
7 62,468 62,447 63,047 60,021
8 80,991 80,941 81,466 77,422
9 117,220 116,510 116,953 109,930
Richest 296,428 287,676 287,939 263,070 Source: Authors’ estimates based in ENIGH 2007.
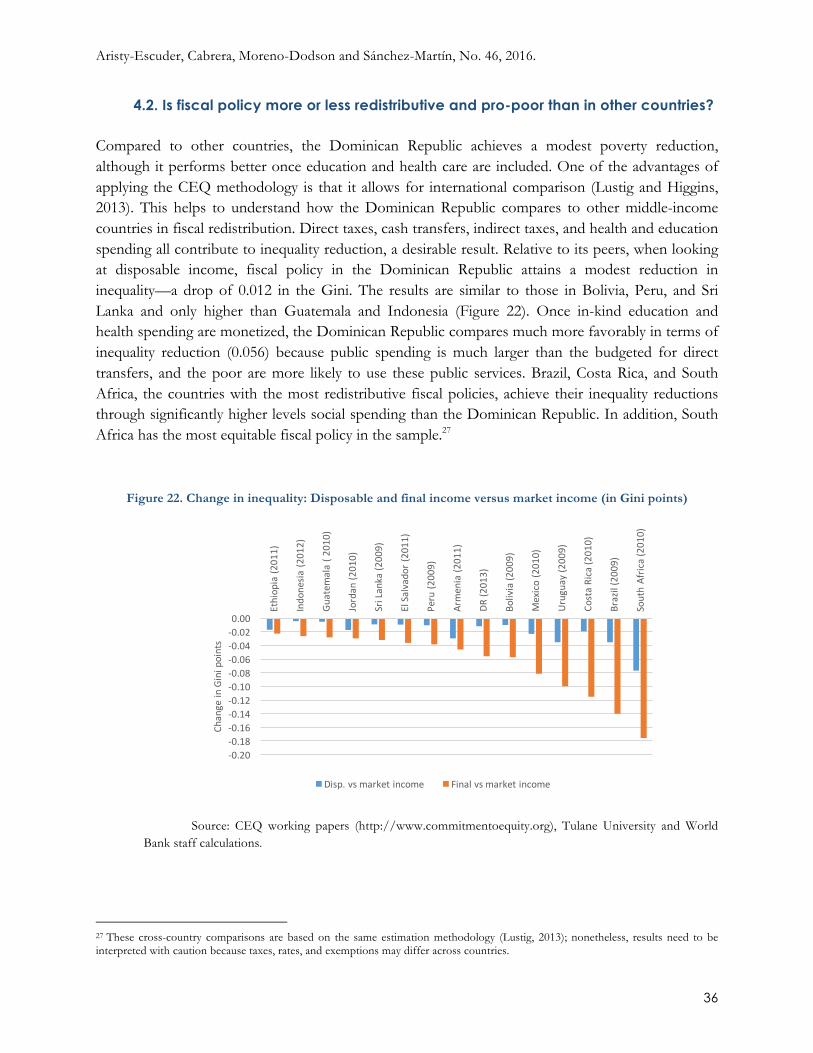
Aristy-Escuder, Cabrera, Moreno-Dodson and Sánchez-Martín, No. 46, 2016.
36
-0.20-0.18-0.16-0.14-0.12-0.10-0.08-0.06-0.04-0.020.00
Ethiop
ia(2
011)
Indo
nesia
(201
2)
Guatem
ala(2
010)
Jordan(2
010)
SriLanka(2
009)
ElSalvado
r(20
11)
Peru(2
009)
Armenia(2
011)
DR(2
013)
Bolivia(2
009)
Mexico(201
0)
Uruguay(200
9)
CostaRica(2
010)
Brazil(200
9)
SouthAfric
a(201
0)
Changein
Ginipoints
Disp.vsmarketincome Finalvsmarketincome
4.2. Is fiscal policy more or less redistributive and pro-poor than in other countries? Compared to other countries, the Dominican Republic achieves a modest poverty reduction, although it performs better once education and health care are included. One of the advantages of applying the CEQ methodology is that it allows for international comparison (Lustig and Higgins, 2013). This helps to understand how the Dominican Republic compares to other middle-income countries in fiscal redistribution. Direct taxes, cash transfers, indirect taxes, and health and education spending all contribute to inequality reduction, a desirable result. Relative to its peers, when looking at disposable income, fiscal policy in the Dominican Republic attains a modest reduction in inequality—a drop of 0.012 in the Gini. The results are similar to those in Bolivia, Peru, and Sri Lanka and only higher than Guatemala and Indonesia (Figure 22). Once in-kind education and health spending are monetized, the Dominican Republic compares much more favorably in terms of inequality reduction (0.056) because public spending is much larger than the budgeted for direct transfers, and the poor are more likely to use these public services. Brazil, Costa Rica, and South Africa, the countries with the most redistributive fiscal policies, achieve their inequality reductions through significantly higher levels social spending than the Dominican Republic. In addition, South Africa has the most equitable fiscal policy in the sample.27
Figure 22. Change in inequality: Disposable and final income versus market income (in Gini points)
Source: CEQ working papers (http://www.commitmentoequity.org), Tulane University and World Bank staff calculations.
27 These cross-country comparisons are based on the same estimation methodology (Lustig, 2013); nonetheless, results need to be interpreted with caution because taxes, rates, and exemptions may differ across countries.

Aristy-Escuder, Cabrera, Moreno-Dodson and Sánchez-Martín, No. 46, 2016.
37
Poverty incidence, using the standard of $2.50 per day, does not significantly change when considering post-fiscal income in the Dominican Republic (Table 10). In other countries, even in countries where the incidence of direct taxes and cash transfers on poverty reduction is slightly below average, indirect taxes have a lower incidence on the income of the poor. For example, in Brazil or Bolivia is significantly reduce poverty incidence through cash transfers; however, when looking at post-fiscal income (after indirect taxes), extreme poverty incidence has increased in those countries.
Table 10. Poverty headcount rate for the US$2.50 PPP a day for each income concept
Market Income
Net Market Income
Disposable Income
Post-fiscal Income
Net variation (post fiscal to
market)
Net variation (disposable to
market) (1) (2) (3) (4)
2= 1- Direct
Taxes 3=2 +Cash
Transfers 4=3-Indirect
Taxes =4-1 =3-1
Armenia (2011) 31.3% 32.0% 28.9% 34.9% 3.6% -2.4% Bolivia (2009) 19.6% 19.6% 17.6% 20.2% 0.6% -2.0% Brazil (2009) 15.1% 15.7% 11.2% 16.3% 1.2% -3.9%
Costa Rica (2010) 5.4% 5.7% 3.9% 4.2% -1.2% -1.5% Dominican Republic (2013) 19.5% 19.5% 18.2% 19.5% 0.0% -1.3%
El Salvador (2011) 14.7% 15.1% 12.9% 14.4% -0.2% -1.8%
Ethiopia (2011) 81.7% 82.7% 82.4% 84.2% 2.6% 0.7% Guatemala ( 2010) 35.9% 36.2% 34.6% 36.5% 0.6% -1.3% Indonesia (2012) 56.4% 56.4% 55.9% 54.8% -1.6% -0.5%
Jordan (2010) 4.2% 4.2% 2.4% 1.8% -2.4% -1.8% Mexico (2010) 12.6% 12.6% 10.7% 10.7% -1.9% -1.9%
Peru (2009) 15.2% 15.2% 14.0% 14.5% -0.7% -1.1% South Africa (2010) 46.2% 46.4% 33.4% 39.0% -7.2% -12.8%
Notes: Year of the survey in parenthesis. Bolivia and Indonesia include indirect taxes only. Source: CEQ working papers (http://www.commitmentoequity.org), Tulane University and
World Bank staff calculations.
Fiscal policy reduces poverty in the Dominican Republic. Overall, when looking at post-fiscal income in the Dominican Republic, we observe a decline in the share of population living on less than US$1.25 a day, while the percentages of extremely poor, moderately poor, and vulnerable increase. At the same time, we see a reduction in the size of the middle and upper classes (Figure 23). Nonetheless, it is worth noting that poverty incidence figures do not give a sense of the total impact on the poor. When using the non-anonymous measure of fiscal impoverishment, 27 percent of the post-fiscal poor were impoverished using the US$1.25 line (poor made poorer and non-poor made poor). However, these results do not consider the effects the monetized value of in-kind education and health services would have on household income (final income).
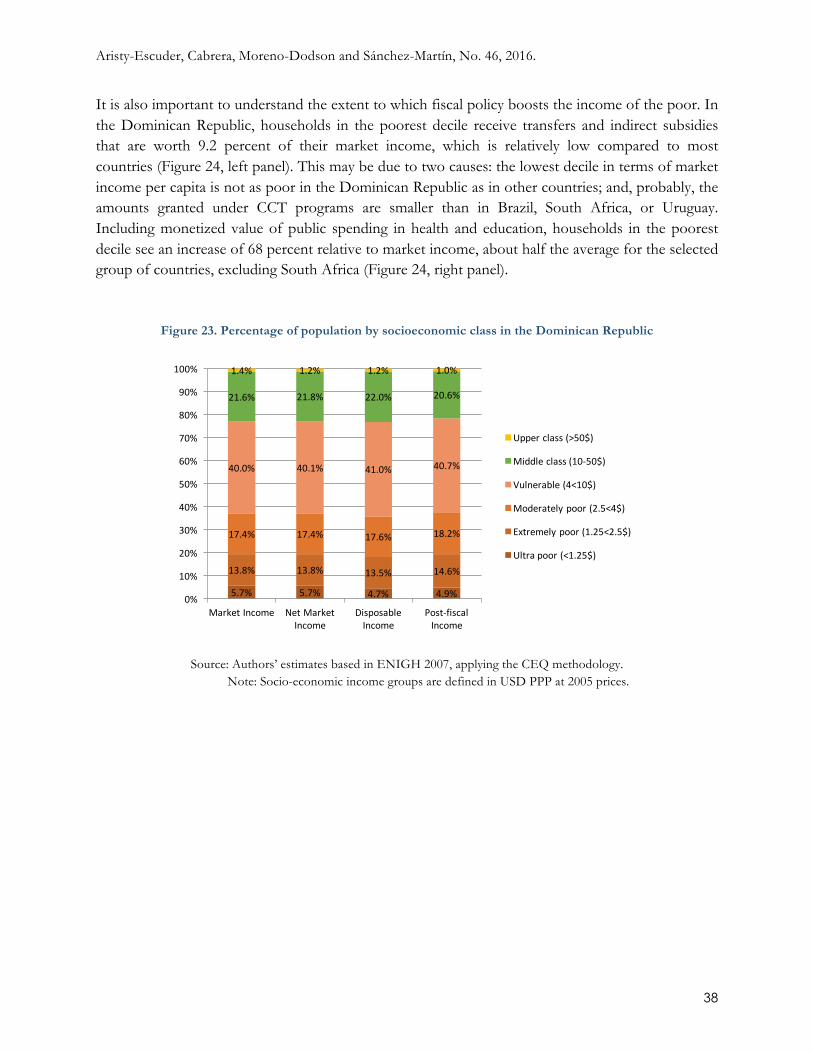
Aristy-Escuder, Cabrera, Moreno-Dodson and Sánchez-Martín, No. 46, 2016.
38
It is also important to understand the extent to which fiscal policy boosts the income of the poor. In the Dominican Republic, households in the poorest decile receive transfers and indirect subsidies that are worth 9.2 percent of their market income, which is relatively low compared to most countries (Figure 24, left panel). This may be due to two causes: the lowest decile in terms of market income per capita is not as poor in the Dominican Republic as in other countries; and, probably, the amounts granted under CCT programs are smaller than in Brazil, South Africa, or Uruguay. Including monetized value of public spending in health and education, households in the poorest decile see an increase of 68 percent relative to market income, about half the average for the selected group of countries, excluding South Africa (Figure 24, right panel).
Figure 23. Percentage of population by socioeconomic class in the Dominican Republic
Source: Authors’ estimates based in ENIGH 2007, applying the CEQ methodology. Note: Socio-economic income groups are defined in USD PPP at 2005 prices.
5.7% 5.7% 4.7% 4.9%
13.8% 13.8% 13.5% 14.6%
17.4% 17.4% 17.6% 18.2%
40.0% 40.1% 41.0% 40.7%
21.6% 21.8% 22.0% 20.6%
1.4% 1.2% 1.2% 1.0%
0%
10%
20%
30%
40%
50%
60%
70%
80%
90%
100%
MarketIncome NetMarketIncome
DisposableIncome
Post-fiscalIncome
Upperclass(>50$)
Middleclass(10-50$)
Vulnerable(4<10$)
Moderatelypoor(2.5<4$)
Extremelypoor(1.25<2.5$)
Ultrapoor(<1.25$)

Aristy-Escuder, Cabrera, Moreno-Dodson and Sánchez-Martín, No. 46, 2016.
39
Figure 24. Post fiscal (left) and final income (right) as a share of market income
Source: CEQ working papers (http://www.commitmentoequity.org), Tulane University and World Bank staff calculations.
Households’ net cash position after taxes and transfers is positive for the bottom 30 percent of the population, which is similar to other middle-income countries. The fact that the line is flatter for the Dominican Republic than for similar countries reflects an overall lower income per capita redistribution across deciles. Once the monetized value of in-kind spending on education and health are included, only the top 30 percent are net contributors in fiscal terms in the Dominican Republic.
-40%
-20%
0%
20%
40%
60%
80%
100%Armenia(2011)
Brazil(2009)
Mexico(2010)
Peru(2009)
SouthAfrica(2010)
Uruguay(2009)
DR(2013)
-40%
-20%
0%
20%
40%
60%
80%
100%
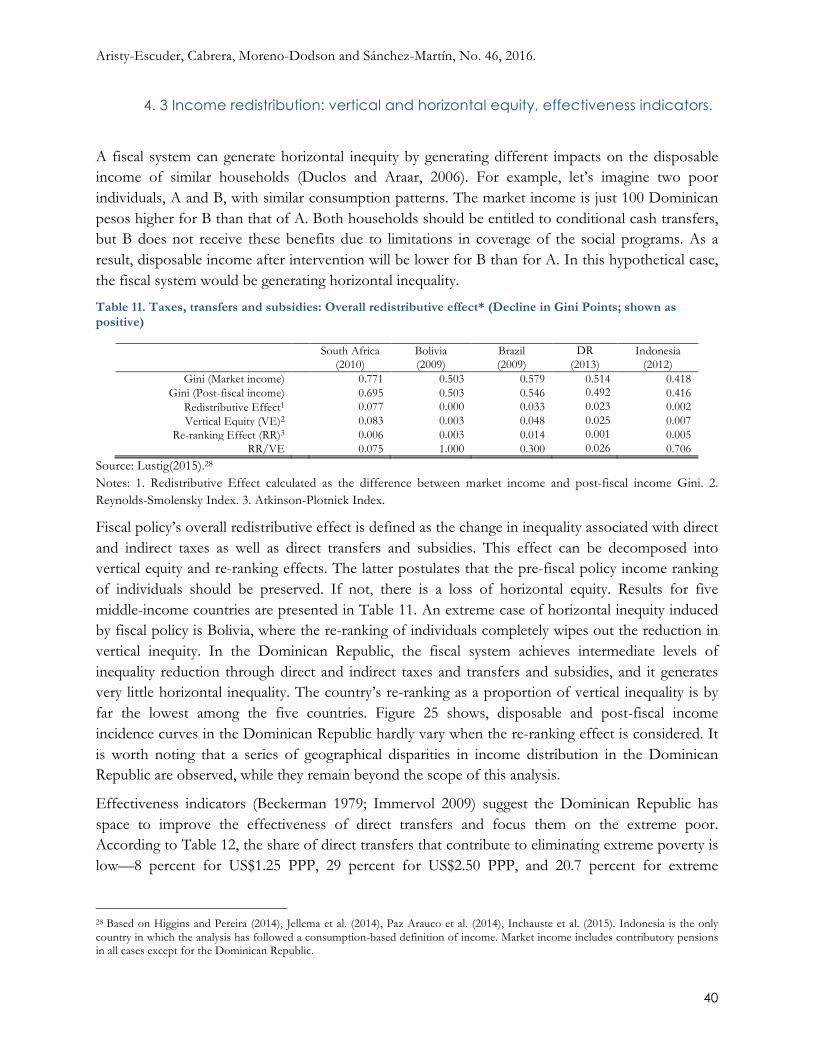
Aristy-Escuder, Cabrera, Moreno-Dodson and Sánchez-Martín, No. 46, 2016.
40
4. 3 Income redistribution: vertical and horizontal equity, effectiveness indicators.
A fiscal system can generate horizontal inequity by generating different impacts on the disposable income of similar households (Duclos and Araar, 2006). For example, let’s imagine two poor individuals, A and B, with similar consumption patterns. The market income is just 100 Dominican pesos higher for B than that of A. Both households should be entitled to conditional cash transfers, but B does not receive these benefits due to limitations in coverage of the social programs. As a result, disposable income after intervention will be lower for B than for A. In this hypothetical case, the fiscal system would be generating horizontal inequality.
Table 11. Taxes, transfers and subsidies: Overall redistributive effect* (Decline in Gini Points; shown as positive)
South Africa Bolivia Brazil DR Indonesia (2010) (2009) (2009) (2013) (2012)
Gini (Market income) 0.771 0.503 0.579 0.514 0.418 Gini (Post-fiscal income) 0.695 0.503 0.546 0.492 0.416
Redistributive Effect1 0.077 0.000 0.033 0.023 0.002 Vertical Equity (VE)2 0.083 0.003 0.048 0.025 0.007
Re-ranking Effect (RR)3 0.006 0.003 0.014 0.001 0.005 RR/VE 0.075 1.000 0.300 0.026 0.706
Source: Lustig(2015).28 Notes: 1. Redistributive Effect calculated as the difference between market income and post-fiscal income Gini. 2. Reynolds-Smolensky Index. 3. Atkinson-Plotnick Index.
Fiscal policy’s overall redistributive effect is defined as the change in inequality associated with direct and indirect taxes as well as direct transfers and subsidies. This effect can be decomposed into vertical equity and re-ranking effects. The latter postulates that the pre-fiscal policy income ranking of individuals should be preserved. If not, there is a loss of horizontal equity. Results for five middle-income countries are presented in Table 11. An extreme case of horizontal inequity induced by fiscal policy is Bolivia, where the re-ranking of individuals completely wipes out the reduction in vertical inequity. In the Dominican Republic, the fiscal system achieves intermediate levels of inequality reduction through direct and indirect taxes and transfers and subsidies, and it generates very little horizontal inequality. The country’s re-ranking as a proportion of vertical inequality is by far the lowest among the five countries. Figure 25 shows, disposable and post-fiscal income incidence curves in the Dominican Republic hardly vary when the re-ranking effect is considered. It is worth noting that a series of geographical disparities in income distribution in the Dominican Republic are observed, while they remain beyond the scope of this analysis.
Effectiveness indicators (Beckerman 1979; Immervol 2009) suggest the Dominican Republic has space to improve the effectiveness of direct transfers and focus them on the extreme poor. According to Table 12, the share of direct transfers that contribute to eliminating extreme poverty is low—8 percent for US$1.25 PPP, 29 percent for US$2.50 PPP, and 20.7 percent for extreme
28 Based on Higgins and Pereira (2014), Jellema et al. (2014), Paz Arauco et al. (2014), Inchauste et al. (2015). Indonesia is the only country in which the analysis has followed a consumption-based definition of income. Market income includes contributory pensions in all cases except for the Dominican Republic.
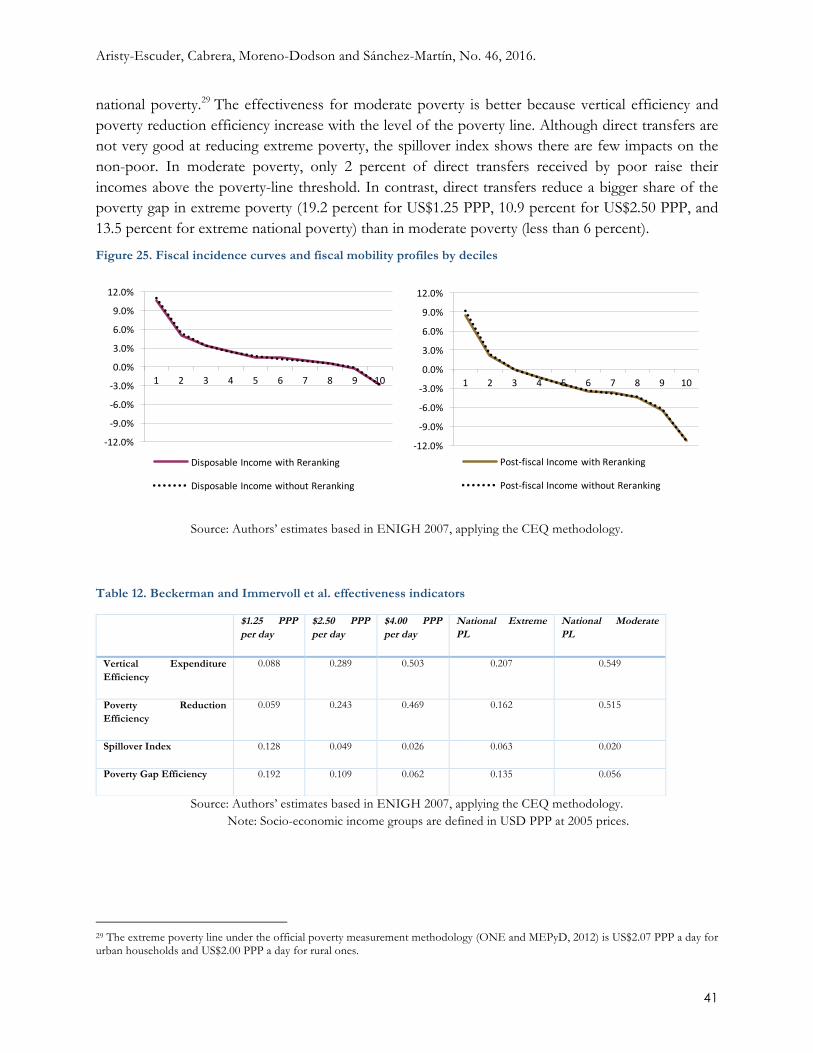
Aristy-Escuder, Cabrera, Moreno-Dodson and Sánchez-Martín, No. 46, 2016.
41
national poverty.29 The effectiveness for moderate poverty is better because vertical efficiency and poverty reduction efficiency increase with the level of the poverty line. Although direct transfers are not very good at reducing extreme poverty, the spillover index shows there are few impacts on the non-poor. In moderate poverty, only 2 percent of direct transfers received by poor raise their incomes above the poverty-line threshold. In contrast, direct transfers reduce a bigger share of the poverty gap in extreme poverty (19.2 percent for US$1.25 PPP, 10.9 percent for US$2.50 PPP, and 13.5 percent for extreme national poverty) than in moderate poverty (less than 6 percent).
Figure 25. Fiscal incidence curves and fiscal mobility profiles by deciles
Source: Authors’ estimates based in ENIGH 2007, applying the CEQ methodology.
Table 12. Beckerman and Immervoll et al. effectiveness indicators
$1.25 PPP per day
$2.50 PPP per day
$4.00 PPP per day
National Extreme PL
National Moderate PL
Vertical Expenditure Efficiency
0.088 0.289 0.503 0.207 0.549
Poverty Reduction Efficiency
0.059 0.243 0.469 0.162 0.515
Spillover Index 0.128 0.049 0.026 0.063 0.020
Poverty Gap Efficiency 0.192 0.109 0.062 0.135 0.056
Source: Authors’ estimates based in ENIGH 2007, applying the CEQ methodology. Note: Socio-economic income groups are defined in USD PPP at 2005 prices.
29 The extreme poverty line under the official poverty measurement methodology (ONE and MEPyD, 2012) is US$2.07 PPP a day for urban households and US$2.00 PPP a day for rural ones.
-12.0%
-9.0%
-6.0%
-3.0%
0.0%
3.0%
6.0%
9.0%
12.0%
1 2 3 4 5 6 7 8 9 10
DisposableIncomewithReranking
DisposableIncomewithoutReranking
-12.0%
-9.0%
-6.0%
-3.0%
0.0%
3.0%
6.0%
9.0%
12.0%
1 2 3 4 5 6 7 8 9 10
Post-fiscalIncomewithReranking
Post-fiscalIncomewithoutReranking

Aristy-Escuder, Cabrera, Moreno-Dodson and Sánchez-Martín, No. 46, 2016.
42
4.4 Resource needs to fill in coverage gaps The relatively high efficiency of Dominican public education and health expenditures in reducing inequality has to do with their high levels of progressiveness in terms of coverage. The Dominican Republic has a subsidized health regime targeted to the poor; it is estimated that 90 percent of the extreme poor and 83 percent of the moderately poor benefit from public health services. Compared with other countries, the Dominican middle and upper classes participate less in subsidized health care because they usually benefit from the contributory health regime or private health insurance. As a result, the percentage of beneficiaries declines markedly by socioeconomic strata as daily market income increases (Figure 26, left panel). This is a distinguishing feature of the Dominican Republic when compared with the other surveyed countries.
Turning to education expenditures, markedly declining percentages of beneficiaries by socioeconomic strata are more common as daily market income increases (Figure 26, right panel). Yet, only about 65 percent of the extreme poor in the Dominican Republic benefit from public education spending—a low figure compared to other middle-income countries for which results are available. This may be due to the perceived low quality of public education, which compels household heads (even in poor families) to send their children to private schools (Sánchez-Martín and Senderowitsch, 2012). It is worth noting that this opting-out behavior may have declined with the significant increases of education expenditures after 2012. This would, of course, not be reflected in the ENIGH 2007 survey used in this analysis.
Figure 26. Percentage of individuals benefiting from health (left) and public education (right) services, by daily
income
Source: CEQ working papers (http://www.commitmentoequity.org), Tulane University and World Bank staff calculations.
Note: income definition is USD PPP at 2005 prices.
68%
51%
27%
90%94% 93% 99%
53%
0%10%20%30%40%50%60%70%80%90%
100%
y<2.5 2.5<y<4 4<y<10 10<y<50 y>50
78%83%
65%
81%
58%
70%
0%
10%
20%
30%
40%
50%
60%
70%
80%
90%
Bolivia Brazil DominicanRepublic
Mexico Peru SriLanka
y<2.5 2.5<y<4 4<y<10 10<y<50 y>50
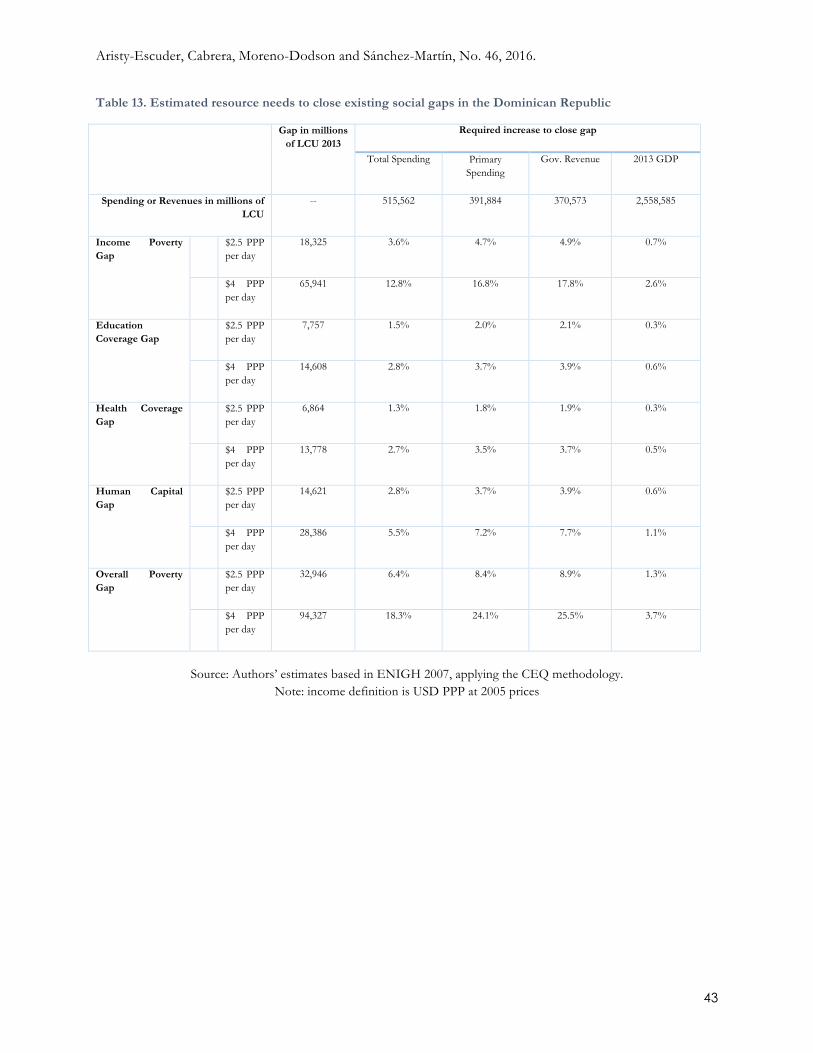
Aristy-Escuder, Cabrera, Moreno-Dodson and Sánchez-Martín, No. 46, 2016.
43
Table 13. Estimated resource needs to close existing social gaps in the Dominican Republic
Gap in millions of LCU 2013
Required increase to close gap
Total Spending Primary Spending
Gov. Revenue 2013 GDP
Spending or Revenues in millions of LCU
-- 515,562 391,884 370,573 2,558,585
Income Poverty Gap
$2.5 PPP per day
18,325 3.6% 4.7% 4.9% 0.7%
$4 PPP per day
65,941 12.8% 16.8% 17.8% 2.6%
Education Coverage Gap
$2.5 PPP per day
7,757 1.5% 2.0% 2.1% 0.3%
$4 PPP per day
14,608 2.8% 3.7% 3.9% 0.6%
Health Coverage Gap
$2.5 PPP per day
6,864 1.3% 1.8% 1.9% 0.3%
$4 PPP per day
13,778 2.7% 3.5% 3.7% 0.5%
Human Capital Gap
$2.5 PPP per day
14,621 2.8% 3.7% 3.9% 0.6%
$4 PPP per day
28,386 5.5% 7.2% 7.7% 1.1%
Overall Poverty Gap
$2.5 PPP per day
32,946 6.4% 8.4% 8.9% 1.3%
$4 PPP per day
94,327 18.3% 24.1% 25.5% 3.7%
Source: Authors’ estimates based in ENIGH 2007, applying the CEQ methodology.
Note: income definition is USD PPP at 2005 prices
Aristy-Escuder, Cabrera, Moreno-Dodson and Sánchez-Martín, No. 46, 2016.
44
Using calculations from applying the CEQ methodology, it is possible to quantify the resources that would be needed to lift all Dominicans out of poverty and cover education and health coverage gaps. Closing the extreme poverty gap (below US$2.50 PPP per capita a day) would require from an additional RD$18.3 billion in cash transfers, the equivalent to 4.9 percent of government revenue and 0.7 percent of GDP in 2013 (Table 13). This would mean doubling the current level of spending on direct transfers. Closing the human-capital gap, defined by public education and health coverage needs for the moderately poor (US$4 PPP a day), would require RD$28.4 billion, or 1.1 percent of 2013 GDP. To fill in the overall poverty gap (US$4 PPP a day), additional resources equivalent to a quarter of total government revenue would be needed, other policies (e.g. taxation) equal. These results are in Dominican Pesos of 2013, and take into account population growth since 2007. One caveat: this exercise assumes that the Government has the capacity to manage and efficiently allocate the higher funding, which may not be always the case because of administrative bottlenecks encountered when scaling-up public spending.
5. Options to enhance the equity outcomes of fiscal policy in the Dominican Republic
5.1. Alternative VAT scenarios for a Fiscal Impact Pact Dependence on indirect taxes remains a challenge for the Dominican Republic. As previously mentioned, tax expenditures derived from ITBIS exemptions amount to around 3 percent of GDP in the Dominican Republic (DGII, 2015). The estimations in Figure 27 suggest that the bulk of total tax expenditures (88 percent) benefits non-poor households. The share of tax expenditures hold by the poor (US$4 a day PPP definition) would be largest in the case of exemptions relating to food (around 20 percent) and household furnishings (16 percent).
Taking as a starting point the analysis of the World Bank (2006), we estimate alternative ITBIS reform scenarios, with the purpose of exploring the likely effects on revenue collection, poverty, and inequality that would follow total or partial elimination of ITBIS exemptions. As a caveat, it is important to note that this is based on a static incidence analysis, and simulations do not consider potential changes in the behavior of taxpayers due to the changes in ITBIS. The four scenarios simulated are: (i) total elimination of ITBIS exemptions; (ii) elimination of all exemptions except for health, education, and electricity; (iii) partial elimination of exemptions, preserving those on the basic basket of goods and services; (iv) finally, partial elimination of exemptions except for electricity, health, education, and basic goods—a combination of ii and iii.
In the first scenario, we simulate the elimination of all exemptions; i.e., all exempted goods and those with reduced rate would pay a rate of 18 percent. This exercise also takes into account ITBIS tax evasion, drawing from information by the General Directorate of Internal Taxation for 2010 by different product lines (Box 1). So we assume that tax payments on ITBIS goods that had been exempted will have an average evasion rate about 29.7 percent in 2010, equal to what was estimated by DGII (2015).
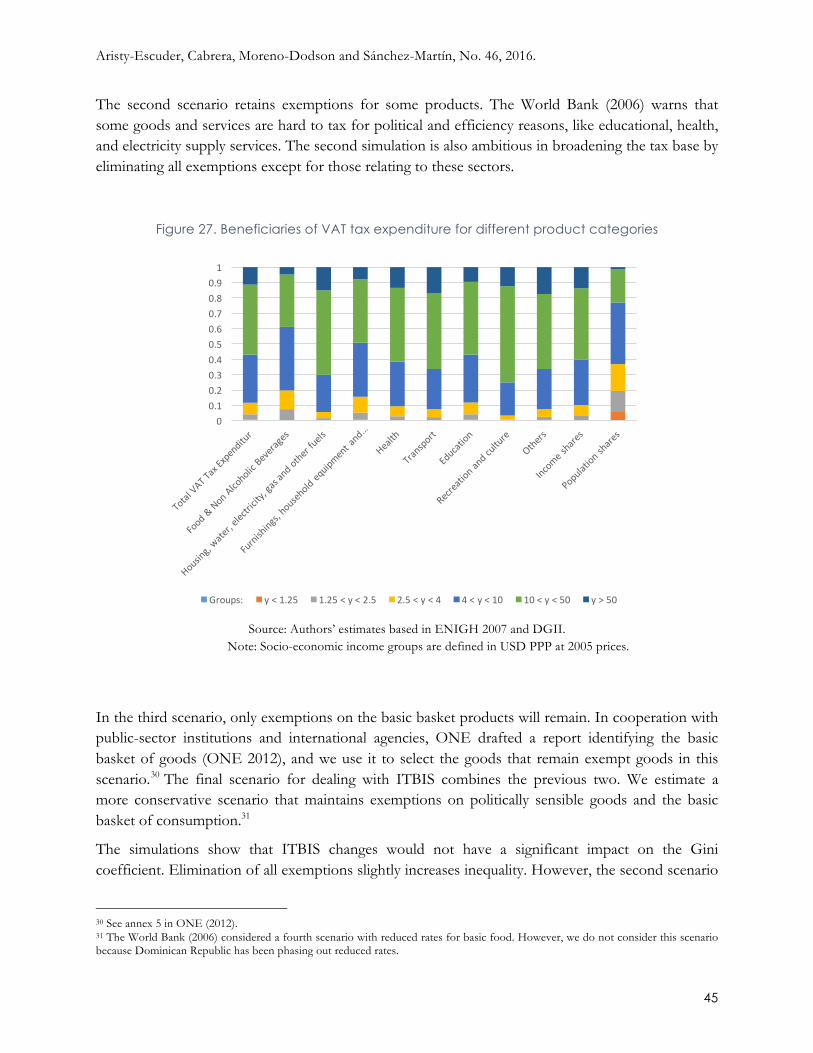
Aristy-Escuder, Cabrera, Moreno-Dodson and Sánchez-Martín, No. 46, 2016.
45
The second scenario retains exemptions for some products. The World Bank (2006) warns that some goods and services are hard to tax for political and efficiency reasons, like educational, health, and electricity supply services. The second simulation is also ambitious in broadening the tax base by eliminating all exemptions except for those relating to these sectors.
Figure 27. Beneficiaries of VAT tax expenditure for different product categories
Source: Authors’ estimates based in ENIGH 2007 and DGII.
Note: Socio-economic income groups are defined in USD PPP at 2005 prices.
In the third scenario, only exemptions on the basic basket products will remain. In cooperation with public-sector institutions and international agencies, ONE drafted a report identifying the basic basket of goods (ONE 2012), and we use it to select the goods that remain exempt goods in this scenario.30 The final scenario for dealing with ITBIS combines the previous two. We estimate a more conservative scenario that maintains exemptions on politically sensible goods and the basic basket of consumption.31
The simulations show that ITBIS changes would not have a significant impact on the Gini coefficient. Elimination of all exemptions slightly increases inequality. However, the second scenario
30 See annex 5 in ONE (2012). 31 The World Bank (2006) considered a fourth scenario with reduced rates for basic food. However, we do not consider this scenario because Dominican Republic has been phasing out reduced rates.
00.10.20.30.40.50.60.70.80.91
Groups: y<1.25 1.25<y<2.5 2.5<y<4 4<y<10 10<y<50 y>50

Aristy-Escuder, Cabrera, Moreno-Dodson and Sánchez-Martín, No. 46, 2016.
46
had the greatest inequality increases because of the elimination of exemptions in some basic goods and services (including food products). The third and fourth scenarios preserve basic food exemptions, and inequality remains unchanged.
Eliminating all exemptions would increase poverty. In the first scenario, moderate poverty incidence would increase by 1.3 percentage points, and extreme poverty incidence by 0.7 percentage points. If only politically sensitive goods were exempt, moderate poverty increase would be lower but still significant. By contrast, extreme poverty would not increase if ITBIS when exemptions on the basic basket of goods are kept in place (Figure 28), which seems to indicate that the poor purchase almost exclusively products in this basket. This is not surprising, since the national poverty definitions are according country specific patterns of consumption and caloric requirements (ONE and MEPyD, 2012).
Figure 28. Effects on inequality and poverty of alternative ITBIS exemption scenarios
Ginicoefficient Headcountratio(nationalpovertylines)
Source: Authors’ estimations based on ENIGH 2007.
0.5141
0.4922
0.4925
0.4932
0.4922
0.4922
0.4750 0.4850 0.4950 0.5050 0.5150
MarketIncomeBM
PostFiscalIncomeBM
Sim1Allexceptions
Sim2(Sim1- Edu,health&electricity)
Sim3(OnlyNationalBasicBasket)
Sim4NationalBasicBasket+hlth+edu+elec)
13.8% 13.1% 13.8% 13.7% 13.2% 13.2%
41.2% 42.3% 43.6% 43.4% 42.4% 42.4%
0%
10%
20%
30%
40%
50%
Extreme Moderate

Aristy-Escuder, Cabrera, Moreno-Dodson and Sánchez-Martín, No. 46, 2016.
47
Figure 29. Effects on revenue increase in scenarios of ITBIS (as a percentage of total disposable income)
Source: Author’s estimates based on ENIGH 2007.
In the first scenario, with all exemptions removed, revenue collection would increase the most—around 2.2 percent of disposable income, assuming other things equal (and no change in the behavioral response of economic agents). In the second scenario, with all exemptions but those on education, health, and electricity removed, revenue collection would increase by 1.7 percent of disposable income. Finally, if basic food were also exempt, tax revenue would increase by only about 0.3 percent of disposable income (Figure 29). It is worth noting that the incidence analysis simulated using the ENIGH 2007 has been adjusted to reflect the amount of tax expenditure estimated by official sources in 2013.
According to our analysis, eliminating exemptions would result in improved tax collection. In all scenarios, inequality would not increase significantly, but income poverty would be sensitive to changes in ITBIS exemptions under simulation scenarios 1 and 2. There seems to be an important tradeoff in terms of revenue collection (most improved under first and second scenarios) and poverty incidence (less affected under the third and fourth scenarios).
5.2. Policy options and conclusion Fiscal incidence analysis applying the CEQ methodology show that, as of 2013, the Dominican Republic’s fiscal policy was progressive overall. Compared to other countries subject to the same methodology, the Dominican fiscal system achieves intermediate levels of inequality reduction through direct and indirect taxes as well as transfers and subsidies, and it generates very little horizontal inequality. Re-ranking of households as a proportion of vertical inequality is by far the lowest among similar countries. Using income per capita as the welfare indicator, fiscal policy in 2013 reduced the market income Gini coefficient from 0.514 to 0.458—a decline of 5 Gini points—
2.2%
1.7%
0.3% 0.3%
0.0%
0.5%
1.0%
1.5%
2.0%
2.5%
Sim1Allexceptions Sim2(Sim1- Edu,health&electricity)
Sim3(OnlyNationalBasicBasket)
Sim4NationalBasicBasket+
hlth+edu+elec)

Aristy-Escuder, Cabrera, Moreno-Dodson and Sánchez-Martín, No. 46, 2016.
48
when all taxes and transfers (including the monetized value of education and health) are taken into account. Excluding the monetized value of education and health services, the improvement in inequality is more modest, with the Gini falling to 0.492. The incidence of extreme poverty also declines when comparing market and post-fiscal incomes (excluding education and health), whereas moderate poverty would remain slightly higher after indirect taxes, both under the national and international definitions.
In terms of poverty reduction, the incidence of direct transfers is modest. This is due to the fact that households in the poorest decile receive transfers and indirect subsidies worth 10 percent of their market income, which is relatively low compared to most countries (back to Figure 24, left panel). This likely relates to the amounts granted under CCT programs being smaller than in Brazil, South Africa, or Uruguay.
For the Dominican Republic, resources amounting 1.3 percent of GDP would be needed to lift the extremely poor in the Dominican Republic. Under the international poverty line of US$2.50 PPP a day, ending extreme poverty and ensuring the poor have access to public education and health would require an increase in public resources to social services equivalent to 1.3 percent of GDP, other things remaining equal. This section presents a series of policy options that could help in further improving equity outcomes using fiscal policy.
On the education front, the challenge will be increasing the quality of education through measures included in the Education Pact. The Dominican Republic has already significantly boosted public spending, from 2.2 percent of GDP in 2011 to around 4 percent of GDP from 2013 onwards. This has had a significant effect in terms of inequality reduction, given that education spending is highly progressive. In the analysis, we are monetizing the value of public spending in education to estimate changes in inequality. However, if the quality of the service provided is not good, the de facto welfare improvement would be smaller. Enrollment in primary school is higher among the poor than among the non-poor; this is probably because the latter have the resources to opt out and choose private education because of the perception that the quality of public education remains mediocre. Thus, the priority in the sector at the moment should be increasing the quality of education through implementation of the measures included in the Education Pact. In addition, authorities could try to improve access and coverage among the poor, especially in pre-primary and secondary education, where enrollment remains low among the extreme poor (23 percent in pre-primary and 67 percent secondary). Finally, introducing a series of grants to support top performers among the poor could help mitigating school dropout and improve access to and equity in tertiary education.
Unlike education, health will require significant increases in expenditures in the Dominican Republic. The country’s public health resources remain low by international standards at around 1.7 percent of GDP, half the amount spent by South Africa and Brazil and a third of Costa Rica’s outlays. The Dominican Republic has had noticeable improvements in terms of coverage, with the percentage of population with health insurance improving from 27 percent in 2007 to 55 percent in 2013. According to the ENDESA 2013 (CESDEM, 2014). However, the bottom 40 percent of the population has coverage of less than 25 percent in the subsidized regime and less than 21 percent in the non-contributive regime. In the first quintile, two-thirds of the population does not report

Aristy-Escuder, Cabrera, Moreno-Dodson and Sánchez-Martín, No. 46, 2016.
49
having health insurance. In fact, a number of people who do not have insurance are using the Ministry of Health’s hospitals and clinics in emergency situations. A strategy to increase the subsidized regime’s coverage while improving the quality of services would likely result in substantial equity gains, and may require also from upgrading in public facilities in order to attract non-poor individuals into the contributory regime as well. As discussed in the previous section, health spending would need to be increased by around 0.3 percent of GDP to extend coverage to the population living under US$2.50 PPP a day per capita. All the analyzed components and programs of health spending are highly progressive except for PROMESE, which is barely progressive and could be revised to focus resources and medicines on the poor and vulnerable. The non-poor could pay for these health services.
A revision of tax policies could be considered to finance the 1.3 percent of GDP in additional resources needed to fill the abovementioned gaps. Personal income taxes make up the lion’s share of direct tax collections; yet, according to our simulations, effective rates of 3.5 percent among upper-class earners (more than US$40 a day PPP) are far from the 15 percent called for in the tax schedule. A positive impact on personal income tax revenue would come from tax administration measures to reduce evasion by the upper class and measures to decrease informality among independent workers, which currently accounts for 56 percent of the active working force.
In the Dominican Republic, the challenge will be raising added revenue while maintaining the tax system’s progressivity. The country’s tax progressivity seems high compared to other countries. Of the selected countries, only Jordan, Sri Lanka, and Peru have more progressive direct tax systems. On income taxes, it bears repeating that we have applied statutory rates, and preliminary evidence would need to be contrasted with actual data on collections by income level.
The Dominican Republic’ could raise additional revenue by reforming its system of indirect taxes, focusing on the ITBIS exemptions. The indirect taxes are slightly progressive, mostly due to the progressivity of excise taxes; ITBIS is almost neutral. The ITBIS exemptions represent close to 3 percent of GDP (Ministerio de Hacienda, 2015), and the majority of tax expenditures from these exemptions is related to the consumption of middle and upper class households. At the same time, phasing out certain exemptions would have negative impacts on poverty and inequality. With that in mind, a possible option could be for goods in the basic consumption basket (based on the national poverty measurement methodology) to remain taxed at a zero rate, along with health and education services. Other exemptions, especially those that are regressive, could be removed, potentially granting up to 0.5 percent of GDP in additional revenue collection. The impact of the removal of ITBIS exemptions on electricity for the poor could be mitigated through the Bono Luz program.
Electricity subsidies could be withdrawn from the non-poor, while taking care of the poor through Bono Luz. Explicit (tariffs below costs) and implicit (irregular connections, fraud, non-payment) electricity subsidies are equalizing in absolute terms but not in relative terms. Simulations applying the CEQ methodology confirm evidence presented by Actis (2012), who estimated that 83 percent of electricity subsidies benefited non-poor households. Fostering a culture of payment by improving service quality and reducing blackouts and adjusting tariffs to market rates are among the measures that could help reduce the deficit in the electricity sector (more than 1.5 percent of GDP in 2013).

Aristy-Escuder, Cabrera, Moreno-Dodson and Sánchez-Martín, No. 46, 2016.
50
At the same time, the poor and vulnerable could be shielded from decreases in purchasing power through Bono Luz.
Bono Luz and Bonogas Hogar are among the programs that could be slightly reshaped because, at the moment, they are just barely progressive in relative terms. One way would be phasing out the eligibility of beneficiaries in SIUBEN quality of living index category 3 (non-poor). The savings, totaling around 0.1 percent of GDP, could be used to expand both programs’ coverage among the poor. Since these programs are pretty much functioning as universal transfers, another policy alternative would be maintaining non-poor as beneficiaries but focusing future coverage expansions on the poor. According to ADESS, 843,000 would be beneficiaries of Bonogas Hogar in 2013 and 533,000 for Bono Luz, compared to a universe of up to 2.4 million potential beneficiaries.
Finally, conditional cash transfers have been effective in reaching the poor, and could be further strengthened. These programs, such as Comer es Primero and Incentivo a la Asistencia Escolar, are highly progressive, with less than 10 percent of public expenditures seeming to go to the middle class. Comer es Primero are fruitful in terms of reducing poverty and inequality, representing 5.5 percent of market income for the ultra-poor (living on less than US$1.25 a day) and 2.1 percent for the extremely poor (below US$2.50 a day). Even so, authorities could consider increasing the individual cash amounts transferred through these well-targeted instruments, or at least make sure they are indexed to prevent an erosion of purchasing power. The past decade’s success in putting both conditional and non-conditional cash transfers under the SIUBEN single-targeting mechanism and ADESS administration should be continued. At the same time, the more recent proliferation of small incentive programs may need to be limited to attain more powerful outcomes. Some promising steps are being taken by establishing support schemes and facilitate labor-market integration to those households that have reached non-poor status and will graduate from Progresando con Solidaridad, thus facilitating other poor households to become beneficiaries of the CCT in a context of still limited coverage and resources.
All in all, overall fiscal policy in the Dominican Republic is already progressive. Going forward, the challenge is rising revenue collection without affecting the poor and vulnerable, at the same time that public service delivery is improved. As abovementioned, compared to other countries, the fiscal system achieves intermediate levels of inequality reduction (5 Gini points) through direct and indirect taxes, transfers and subsidies, and it generates very little horizontal inequality. Some European States are able to reduce the Gini by more than 15 percentage points, but achieve it through reinvesting large revenue collection in social programs and public services. In this sense, enhancing the quality of public services would be a priority in the Dominican Republic, as it would not only help achieving social outcomes, but also improve citizen trust in institutions, which could ultimately lead towards formalization of economic activity and improved revenue collection.

Aristy-Escuder, Cabrera, Moreno-Dodson and Sánchez-Martín, No. 46, 2016.
51
6. BibliographyAbdullaev, U., and Estevao, M., 2013. "Growth and Employment in the Dominican Republic: Options for a Job-Rich Growth," IMF Working Papers 13/40, International Monetary Fund.
Actis, J.L. 2012. “Una evaluación de la eficacia de los subsidios al consumo residencial de energía eléctrica en la República Dominicana.” Mimeo.
Artana, D., Bour, J.L., Catena, M., and Navajas, F. 2012. “Una Revisión del Gasto Público de República Dominicana.” Banco Interamericano de Desarrollo, Fundación de Investigaciones Económicas Latinoamericanas. Junio 2012. Mimeo.
Aristy, J., 2016. “Income definition, prices indices and poverty headcount in the Dominican Republic”. Forthcoming. Barreix, A., Bès, M., & Roca, J. (2009). Equidad fiscal en Centroamérica, Panamá y República Domicana. Washington, D.C.: Interamerican Development Bank / Eurosocial.
Gallina A, I. G.-M. (2015 (upcoming)). The Political Economy of Subsidy Reform in the Dominican Republic. The World Bank.
Jaramillo, M. (2013). The Incidence of Social Spending and Taxes in Peru. CEQ Working Paper No.9, Center for Inter-American Policy and Research (CIPR) and Department of Economics, Tulane University, New Orleans.
Sauma, P., & Trejos, J. D. (2014). Social Public Spending, Taxes, Redistribution of Income and Poverty In Costa Rica. CEQ Working Paper No. 18, Economics Department and Center por Inter-American Policy and Research (CIPR), Tulane University, New Orleans.
Bucheli, M., Lustig, N., Rossi, M., and Amábile, F. 2014. “Social Spending, Taxes, and Income Redistribution in Uruguay.” Public Finance Review. May 2014, Volume 42, Issue 3.
Cabrera, Maynor, Nora Lustig, and Hilcías Morán. 2014. Fiscal Policy, “Inequality and the Ethnic Divide in Guatemala.” CEQ Working Paper No. 20, Center for Inter-American Policy and Research and Department of Economics, Tulane University and Inter-American Dialogue.
CESDEM/ICF. 2014. “Encuesta Demográfica y de Salud República Dominicana 2013,” retrieved from http://countryoffice.unfpa.org/dominicanrepublic/drive/DRDHS2013-Final02-10-2013.pdf, September 20, 2015.
Chu, M. K. Y., Davoodi, M. H. R., and Gupta, M. S. 2000. Income distribution and tax and government social spending policies in developing countries (No. 0-62). International Monetary Fund.
DGII. 2014. “Gastos Tributarios en República Dominicana. Estimación para el Presupuesto General del Estado del año 2015” Dirección General de Impuestos Internos, Ministerio de Hacienda. Septiembre, 2014.
DGII. 2015. “Sistema tributario en República Dominicana.” Dirección General de Impuestos Internos, Ministerio de Hacienda. Abril, 2015.
Duclos, J.Y., and Araar, A.. 2006. Poverty and Equity: Measurement, Policy, and Estimation with DAD. New York: Springer and International Development Research Centre.
Gallina, A., Inchauste, G., Isa., P., Lee, C., and Sánchez-Martín, M.E. 2015. “Political Economy of Subsidy Reform Case Study for the Dominican Republic.” Mimeo.

Aristy-Escuder, Cabrera, Moreno-Dodson and Sánchez-Martín, No. 46, 2016.
52
Galrão Carneiro, Francisco, Aleksandra Iwulska, José-Daniel Reyes, and Miguel Eduardo Sánchez-Martín. 2015. “Resilient Growth, Persisting Inequality: Identifying Potential Factors Limiting Shared Prosperity in the Dominican Republic.” World Bank Other Operational Studies 21499. World Bank.
Garza, M., P. Morra, and D. Simard. 2012. “The Fiscal Position: Prospects and Options for Adjustment.” In Piñón et al. Central America, Panama, and the Dominican Republic. Challenges Following the 2008-09 Global Crisis. IMF, Washington, DC.
Guzmán, R.. 2011. “Composición Económica Dominicana. El Estrato de Ingresos Medios en el Umbral del Siglo XXI.” Mimeo. Document prepared for the Ministry of Economy, Planning, and Development of Dominican Republic.
Higgins, S., and Pereira, C. 2014. “The Effects of Brazil’s Taxation and Social Spending on the Distribution of Household Income.” Public Finance Review. May 2014, Volume 42, Issue 3.
IADB and World Bank. 2014. República Dominicana, Notas de Política. Versión para el Día del Diálogo.
Inchauste, Gabriela, Lustig, Nora, Maboshe, Mashekwa, Purfield, Catriona, and Woolard, Ingrid. 2015. “The distributional impact of fiscal policy in South Africa.” Policy Research Working Paper Series 7194. The World Bank. Jaramillo, M. 2013. The Incidence of Social Spending and Taxes in Peru. CEQ Working Paper No. 9, Center for Inter-American Policy and Research (CIPR) and Department of Economics, Tulane University. New Orleans.
Jellema, Jon, Matthew Wai-Poi, and Rythia Afkar. 2014. “The Distributional Impact of Fiscal Policy in Indonesia.” World Bank. (forthcoming).
Lindert, K., Skoufias, E., and Shapiro, J. 2006. “Redistributing income to the poor and the rich: Public transfers in Latin America and the Caribbean.” Social Safety Nets Primer Series.
Lustig, Nora and Carola Pessino. 2014. “Social Spending and Income Redistribution in Argentina in the 2000s: the Rising Role of Noncontributory Pensions.” Public Finance Review. May 2014, Volume 42, Issue 3.
Lustig, Nora and Sean Higgins. 2013. “Commitment to Equity Assessment (CEQ): Estimating the Incidence of Social Spending, Subsidies and Taxes. Handbook.” CEQ Working Paper No. 1, July 2011; revised September 2013.
Lustig, Nora, Florencia Amábile, Marisa Bucheli, George Gray Molina, Sean Higgins, Miguel Jaramillo, Wilson Jiménez Pozo, Veronica Paz Arauco, Claudiney Pereira, Carola Pessino, Máximo Rossi, John Scott, and Ernesto Yáñez Aguilar. 2013. “The Impact of Taxes and Social Spending on Inequality and Poverty in Argentina, Bolivia, Brazil, Mexico, Peru, and Uruguay: An Overview.” CEQ Working Paper No. 13, August 2013.
Lustig, Nora. 2015. “Fiscal Policy, Inequality and the Poor in the Developing World.” CEQ Working Paper No. 23, Center for Inter-American Policy and Research and Department of Economics, Tulane University and Inter-American Dialogue (forthcoming).
Margarita Beneke de Sanfeliu, Nora Lustig, and José Andrés Oliva. 2015. “La incidencia de los impuestos y el gasto social sobre la pobreza y la desigualdad en El Salvador” (forthcoming).

Aristy-Escuder, Cabrera, Moreno-Dodson and Sánchez-Martín, No. 46, 2016.
53
MEPyD. 2013. “El efecto de la Ley de fortalecimiento de la capacidad recaudadora del Estado (Ley 253-12) sobre la pobreza y desigualdad.” Ministerio de Economía Planificación y Desarrollo y Oficina Nacional de Estadística. Enero de 2013. Documento de Trabajo.
Minerd. 2014. “Tercer estudio regional y comparativo,” retrieved from http://www.minerd.gob.do/documentosminerd/ResultadosComparado.pdf. September 20, 2015.
Ministerio de Hacienda. 2012. “Gastos Tributarios en República Dominicana, Estimación para el Presupuesto General del Estado del año 2013,” Informe de la Comisión Interinstitucional Coordinada por la Dirección General de Política y Legislación Tributaria.
Ministry of Health. 2014. “Gasto Nacional en Salud,” Powerpoint presentation.
National Office of Statistics (ONE) and MEPyD, 2012. Metodología para el cálculo de la medición oficial de la pobreza monetaria en la República dominicana. Dominican Republic Poverty Committee, July 2012. Accessible at www.one.gob.do/Multimedia/Download?ObjId=1936.
Pablo Sauma, Juan and Diego Trejos, Gasto. 2014. “Público Social, Impuestos, Redistribución del Ingreso y Pobreza en Costa Rica.” CEQ Working Paper No. 18, January 31, 2014.
Paz Arauco, Veronica, George Gray Molina, Wilson Jiménez Pozo, and Ernesto Yáñez Aguilar. 2014. “Explaining Low Redistributive Impact in Bolivia.” Public Finance Review. May 2014, Volume 42, Issue 3.
Pecho, Miguel, Peláez, Fernando and Jorge Sánchez. 2012. “Estimación del incumplimiento tributario en América Latina: 2000-2010”, Dirección de Estudios e Investigaciones Tributarias, Documento de Trabajo No. 3-2012. CIAT: Panamá.
Pessino, C. and R. Fenochietto. 2010). “Determining Countries’ Tax Effort.” Hacienda Pública Española/Revista de Economía Pública, Vol. 195, No. 4, pp. 65-87.
Sánchez-Martín, Miguel Eduardo and Roby Senderowitsch. 2012. “The political economy of the middle class in the Dominican Republic: individualization of public goods, lack of institutional trust and weak collective action.” Policy Research Working Paper Series 6049. World Bank. Sauma, P., and Trejos, J. D. 2014. “Social Public Spending, Taxes, Redistribution of Income, and Poverty in Costa Rica.” CEQ Working Paper No. 18, Economics Department and Center por Inter-American Policy and Research (CIPR), Tulane University, New Orleans.
Santana, Isidoro, and Magdalena Rathe. 1993. “The Distributive Impact of Fiscal Policy in the Dominican Republic.” in Government Spending and Income Distribution in Latin America, ed. by Ricardo Hausmann and Roberto Rigobon. Washington: Inter-American Development Bank.
Scott, John. 2014. “Redistributive Impact and Efficiency of Mexico’s Fiscal System.” Public Finance Review. May 2014, Volume 42, Issue 3.
SENASA. (2014). “Reconversión del IDSS y Red Pública única.” Mimeo.
Valderrama, D., Francos, M., Jiménez, M., Lizardo, M., and Morillo, A. 2013. “El efecto de un programa de transferencias condicionadas sobre la pobreza y desigualdad en el corto plazo: El caso de Progresando con Solidaridad en República Dominicana.” MEPyD and ONE. Mimeo.
Valderrama, D., Francos, M., Lizardo, M., and Morillo, A. 2013. “Seguro Familiar de Salud en el Régimen Subsidiado: Sus efectos de corto plazo sobre la pobreza y desigualdad.” ONE and MEPyD. Dominican Republic.
Aristy-Escuder, Cabrera, Moreno-Dodson and Sánchez-Martín, No. 46, 2016.
54
Woldehanna, Tassew, Eyasu Tsehaye, Ruth Hill, Gabriela Inchauste, and Nora Lustig. 2014. “A Fiscal Incidence Analysis for Ethiopia.” Background Paper for World Bank Poverty Assessment (forthcoming).
World Bank, 2006. “Achieving More Pro-Poor Growth.” Poverty Assessment, Report No. 32422-DO. The World Bank, October 30t, 2006.
World Bank, 2014a. “When Prosperity is not Shared: the Puzzle of the Weak Links between Growth and Equity in Dominican Republic.” Equity Assessment, the World Bank.
World Bank, 2014b. “Patronage or Reform? The Political Economy of Reform in the Dominican Republic.” An Institutional and Governance Review. Washington, DC.
World Bank. 2015. “Public Expenditure Management and Financial Accountability Review for the Dominican Republic.” Washington, DC. Mimeo.
Younger, Stephen D. and Artsvi Khachatryan. 2014. “Fiscal Incidence in Armenia.” Background Paper for World Bank Armenia Public Expenditure Review (forthcoming).

Aristy-Escuder, Cabrera, Moreno-Dodson and Sánchez-Martín, No. 46, 2016.
55
7. Annex: structure of revenue and expenditure Table 14. Composition of taxes in the Dominican Republic (2013)
Revenue Included in Analysis
Estimation Method
% of total taxes
% of GDP
Total Revenue 14.5 Taxes 100.0 13.8
Direct Taxes 37.0 5.1 Direct Taxes on Individuals 9.4 1.3
On Wages & income on personal income Yes Simulation 5.7 0.8 On Dividends Yes Simulation 1.7 0.2 On Interest Yes Simulation 0.6 0.1 Other personal income tax No 1.3 0.2
Corporate Income Tax No 16.5 2.3 Other Direct Taxes No 11.1 1.5
VAT and Other Indirect Taxes 63.0 8.7
ITBIS (VAT) Yes
Simulation with assumptions of tax
evasion and tax expenditures
32.0 4.4
Excises on Alcoholic Beverages Yes Simulation 2.4 0.3 Excises on Beer Yes Simulation 2.7 0.4 Excises on Tobacco Yes Simulation 1.2 0.2 Excises on Oil Derivates Yes Simulation 12.2 1.7 Other Indirect Taxes No 12.4 1.7
Other Taxes No 0.0 0.0
Contributions Included in Analysis % of
GDP Contributions to social security No 0.4 0.1 TOTAL 100.0 13.9
Source: Authors’ calculations based on Ministry of Finance data.

Aristy-Escuder, Cabrera, Moreno-Dodson and Sánchez-Martín, No. 46, 2016.
56
Table15.CompositionofexpendituresinDominicanRepublic(2011and2013)
Included In Analysis Estimation Method 2011 (SA2)
2013 (Benchmark & SA1)
Total Government Spending (A+B)
% of total Gov. Spending % of GDP % of total Gov.
Spending % of GDP
100.0 18.0 100.0 20.2 A. Primary Government Spending (a+b+c) 74.2 13.3 76.0 15.3
a. Social Spending (excludes contrib pensions) (1+2+3+4) 32.7 5.9 39.9 8.0
1.Total Cash Transfers 2.3 0.4 4.0 0.8 Cash Transfers (excluding all
Pensions) Yes Imputation 2.3 0.4 4.0 0.8
Noncontributory Pensions N.A. N.A. 0.0 0.0 0.0 0.0 2.Total In-kind Transfers 20.9 3.7 27.8 5.6
Education Yes Imputation 10.5 1.9 18.7 3.8 of which Tertiary Yes Imputation 1.2 0.2 1.3 0.3
Health 10.4 1.9 9.1 1.8
Social Security Partially (only subsidized) Imputation using alternate survey DHS Endesa 2013 1.7 0.3 1.5 0.3
Ministry of Health Yes Imputation using alternate survey DHS Endesa 2013 7.2 1.3 6.2 1.3
Other (PROMESE and other ncp) Partial Imputation using alternate survey
DHS Endesa 2013 1.5 0.3 1.4 0.3
3.Housing and Urban 1/ No 4.3 0.8 3.4 0.7 4.Other Social Spending No 5.3 1.0 4.7 1.0 b. Contributory Pensions Yes Direct Identification 4.9 0.9 4.2 0.8 c. Non-Social Spending (1+2) 36.6 6.6 31.9 6.4 1.Indirect Subsidies 7.0 1.3 6.7 1.3 On Final Goods Yes Simulation 7.0 1.3 6.7 1.3 On Inputs No 0.0 0.0 0.0 0.0 2.Other Non-Social Spending No 29.6 5.3 25.2 5.1
Memo: 0.0 0.0 0.0 Debt Servicing No 25.8 4.6 24.0 4.8 Social Spending plus contributory pensions 38.2 6.8 44.1 8.9
Interest payments No 11.2 2.0 11.5 2.3 B. Amortization payments No 14.5 2.6 12.5 2.5
Source: Authors’ calculations based on Ministry of Finance data. Note: See Details in Annex 8.4.

Aristy-Escuder, Cabrera, Moreno-Dodson and Sánchez-Martín, No. 46, 2016.
57
Table16.DominicanRepublic:Compositionofpubliceducationexpenditure(2013)
Spending Component % of GDP % GDP In analysis
Education 3.8% 3.5%
Pre-School (From 3 to 5 years old) 0.2% 0.2% Primary (From 6 to 11 years old, 1st to 6th Básico) 1.8% 1.8% Lower Secondary (12 to 13 years, 7th and 8th Básico) 0.5% 0.5% Upper Secondary (14 to 17 years, 1st to 4th Medio) 0.8% 0.8% Tertiary 0.3% 0.3% Other expenses in education 0.2% 0.0%
Source: Ministry of Education and Ministry of Finance. Note: Levels of education in this table are equivalent to CINE categories.
Table17.DominicanRepublic:Compositionofpublichealthexpenditure(2013)
Spending Component % of GDP
% GDP in analysis
Health 1.8% 1.6%
Ministry of Public Health 1.3% 1.3%
Outpatient services /b 0.3% 0.3%
Hospitals /b 0.9% 0.9%
Social Security System 0.3% 0.3%
Subsidized Regime Social Security /c 0.2% 0.2%
Dominican Institute for Social Security (IDSS) /d 0.1% 0.1%
Retired (SENASA) /c 0.0% 0.0%
Others 0.2% 0.1%
PROMESE 2012 /a,e 0.1% 0.1% Others: Military and Police Hospital, National VIH Commision
(CONAVIHSIDA), Health reform commission (CERS) /a,e 0.2% 0.0%
Sources: a/Informe Nacional de Gasto en Salud 2013; b/Authors’ calculations based on Informe Nacional de Gasto en Salud 2011, 2012 y 2013; c/CNSS, Informe a Diciembre 2013; d/Senasa (2014), “Reconversión del IDSS y Red Pública única,” Mimeo; e/Ministry of Finance.
Table18.DirecttransfersprogramsinDominicanRepublicin2013Categories of Direct Transfers Programs #Beneficiaries % of 2013 GDP CCT food program Comer es Primero (CEP) 698,196 0.24% Education CCT programs Incentivo a la Asistencia Escolar (ILAE)
Bono Estudiando Progreso (BEEP) Incentivo a la Educación Superior (IES)
299,111 45,982 25,795
0.03% 0.01% 0.01%
Targeted Non-CCT transfers on utilities and commodities
Gas bonus to households: Bono Gas Hogar (BGH) Electricity: Bonus Bono Luz (BL) Gasoline bonus to public transport drivers: Bono Gas Choferes (BGC)
843,439 533,766 15,726
0.08% 0.09% 0.03%
Other transfers Incentive to preventive police (PIPP) Marine officials (PIAMG) Contributive pensions from old regime
22,493 -
99,802
0.01% 0.00% 0.01%
Source: ADESS and authors’ calculations.