JAIL MAIL: Ten Things You Should Know About Indian Prisons...Policy Research based on the data at...
19
1 January 15, 2020 JAIL MAIL: Ten Things You Should Know About Indian Prisons An Analysis of NCRB’s Prison Statistics India 2018 Dear Friends, Warm wishes for the New Year! The National Crime Records Bureau (NCRB) released its annual publication on prisons in India for the year 2018, on 4 th January 2020. The Prison Statistics India (PSI) is the ‘principle databank’ available with the government of India on prisons. It is a compilation of detailed annual statistical information on prisons, prisoners and prison administration received from all the states and UTs. Since 2015, CHRI analyses NCRB’s annual report on prisons to come up with trends, major findings and a comparative commentary on certain indicators to present the status of prisons and prisoners in India. You may read our previous analysis here – 2015, 2016 and 2017. PSI 2018 presents national and state wise data running into twelve chapters. Caste and Religion data of prisoners which was excluded from the PSI 2016 and 2017, has been added back to the PSI 2018. The caste and religion data of prisoners is statistically important for academicians and policy makers. Since NCRB did not receive data from West Bengal for the year 2018, the PSI 2018 includes 2017 data of the state for national level figures. There were 4,66,084 prisoners in 1339 prisons in India as on 31 st December, 2018. Our analysis shows that the undertrial population in the prisons is increasing at a higher rate and with the continuing pace the share of undertrial prisoners would have crossed the 70% mark in 2019, highest since 2001 – making India’s proportion of pre-trial detainees 12 th highest in the world. CHRI’s analysis attached with this newsletter, presents major findings, trends and a comparative commentary on 10 indicators – prison population and occupancy, undertrial prisoners ratio, period of confinement, women and prisons: inmates and staff, education, caste and religion profile of prisoners, prison staff, foreign national prisoners, prison inspections, expenditure on prisoners and deaths in prisons. What you can do 1. Individuals and organisations working on prisons may, a) access the data on prisons in their state and conduct trend analysis on key aspects to produce evidence based research, and/or
Transcript of JAIL MAIL: Ten Things You Should Know About Indian Prisons...Policy Research based on the data at...

1
January 15, 2020
JAIL MAIL: Ten Things You Should Know About Indian Prisons
An Analysis of NCRB’s Prison Statistics India 2018
Dear Friends,
Warm wishes for the New Year!
The National Crime Records Bureau (NCRB) released its annual publication on prisons in India
for the year 2018, on 4th January 2020. The Prison Statistics India (PSI) is the ‘principle databank’
available with the government of India on prisons. It is a compilation of detailed annual statistical
information on prisons, prisoners and prison administration received from all the states and UTs.
Since 2015, CHRI analyses NCRB’s annual report on prisons to come up with trends, major
findings and a comparative commentary on certain indicators to present the status of prisons and
prisoners in India. You may read our previous analysis here – 2015, 2016 and 2017.
PSI 2018 presents national and state wise data running into twelve chapters. Caste and Religion
data of prisoners which was excluded from the PSI 2016 and 2017, has been added back to the PSI
2018. The caste and religion data of prisoners is statistically important for academicians and policy
makers. Since NCRB did not receive data from West Bengal for the year 2018, the PSI 2018
includes 2017 data of the state for national level figures.
There were 4,66,084 prisoners in 1339 prisons in India as on 31st December, 2018. Our analysis
shows that the undertrial population in the prisons is increasing at a higher rate and with the
continuing pace the share of undertrial prisoners would have crossed the 70% mark in 2019,
highest since 2001 – making India’s proportion of pre-trial detainees 12th highest in the world.
CHRI’s analysis attached with this newsletter, presents major findings, trends and a comparative
commentary on 10 indicators – prison population and occupancy, undertrial prisoners ratio, period
of confinement, women and prisons: inmates and staff, education, caste and religion profile of
prisoners, prison staff, foreign national prisoners, prison inspections, expenditure on prisoners and
deaths in prisons.
What you can do
1. Individuals and organisations working on prisons may,
a) access the data on prisons in their state and conduct trend analysis on key aspects to
produce evidence based research, and/or
2
b) write to appropriate authorities to bring to their notice any disturbing trends or data that
warrants immediate action such as vacancies in staff, occupancy rates, custodial deaths
etc.
2. Prison administrators may,
a) ensure that a standardised prisoner file management system is maintained in their
prison/s, which would guarantee accuracy of national prison statistics, and
b) make efforts to proactively disclose data on their websites, preferably every quarter.
You can also write to us at [email protected] with comments and suggestions.
Please send us an email if you wish to unsubscribe from these updates.
With best regards,
Madhurima Dhanuka
Programme Head, Prison Reforms Programme
Commonwealth Human Rights Initiative
3rd floor, 55A, Siddhartha Chambers I, Kalu Sarai, New Delhi-110016
Tel: +91-11-4318 0200, 9331127001, 9748927001
*This jail mail has been prepared by Siddharth Lamba, Project Officer, Prison Reforms, Access to Justice
Programme, CHRI.
Our mailing address is: Commonwealth Human Rights Initiative
Prison Reforms Programme 55A, Third Floor, Siddharth Chambers-1
Kalu Sarai, New Delhi 110016, India Tel: +91 11 43180200, Fax: +91 11 43180217
[email protected] www.humanrightsinitiative.org
About Jail Mail
Jail Mail is a regular series of Prison Reform Updates from CHRI for readers interested in the rights of
prisoners and the reform of prisons as a matter of public concern. The engagement of civil society in the
management and monitoring of prisons and the rights of prisoners is vital to the transparency of this
traditionally closed institution and to ensure the practical realisation of the rights of those behind bars. Jail
Mail invites discussion between civil society members and those entrusted to oversee and manage prisons.
Evidence-based research and watch reports of CHRI’s Prison Reforms Programme, interviews with critical
stakeholders, topical issues and developments concerning the liberty of prisoners, and health of prisons in
India and around the world will form the sources of Jail Mail. Its periodicity will depend on the urgency of
issues and the interest they generate.
About CHRI and the Prison Reforms Programme
The Commonwealth Human Rights Initiative (CHRI) is an independent, non-profit, non-partisan,
international non-governmental organisation, mandated to ensure the practical realisation of human rights
in the countries of the Commonwealth. In 1987, several Commonwealth professional associations founded
CHRI, with the conviction that there was little focus on the issues of human rights within the Commonwealth
although the organisation provided member countries a shared set of values and legal principles from which
to work.
The Prison Reforms Programme of CHRI is more than 15 years old. The programme focuses on improving
prison monitoring through the strengthening of undertrial review mechanisms and prison visiting system
nationally, and ensuring early safeguards against unnecessary pre-trial detentions, specifically in Rajasthan
and West Bengal. The programme also advocates for timely repatriation of foreign national prisoners and
immediate release of asylum seekers. Evidence-based research, advocacy, capacity-building of actors of the
criminal justice system including prison officials, welfare and probation officers, criminal defense lawyers,
magistrates, legal aid functionaries and civil society actors are the regular activities of the programme

TEN THINGS YOU SHOULD KNOW ABOUT INDIAN PRISONS
An analysis of National Crime Records Bureau’s
PRISON STATISTICS OF INDIA 2018

1.60%0.25%
3.18%
4.21%
3.41%
1.57%
-0.28%
3.89%
5.34%
4.80%
2.52%2.86%
3.84%
2.80%
1.18%
17.40%14.40% 13.70%
15.10% 17.60%
-20.00%
-15.00%
-10.00%
-5.00%
0.00%
5.00%
10.00%
15.00%
20.00%
-1.00%
0.00%
1.00%
2.00%
3.00%
4.00%
5.00%
6.00%
7.00%
Percentage Change in Prison Population, Undertrial Population, Prison Capacity and Overcrowding in respective years
Prison Population
UndertrialPopulation
Prison Capacity
Overcrowding
I. PRISON POPULATION AND OCCUPANCY
Findings – PSI 2018
In 2018, the occupancy rate at 117.6% was highest in the last six years.
District Jails bear the burden of overcrowding at 132.8% occupancy followed by Central Jails at 119%.
Among the states, Uttar Pradesh with the highest prison population (22.3% of national prison population) has
worst occupancy rate of 176.5 %.
Seven states, namely Uttar Pradesh, Madhya Pradesh, Maharashtra, Chhattisgarh, Uttarakhand, Sikkim and
Meghalaya have an occupancy rate of above 140 %.
From 2013 to 2018, the total prison population has increased by 13.12 % against an increase of 13.9 % in the
prison capacity.
From 2013 to 2018, the undertrial population increased by 16.17 %.
At the end of 2018, there were 4,66,084 total prisoners out of which 3,23,537 were undertrials.
2013-14 2014-15 2015-16 2016-17 2017-18

CHRI’s Comments
The country’s prison population is increasing at a higher rate. According to a report published by Institute of Criminal
Policy Research based on the data at the end of October 2015, the world’s prison population has increased by “almost
20 %” since 2000. India’s prison population, from 2000 to 2018 has increased by staggering 71%, from 2,72,079 in 2000
to 4,66,084 in 2018. The graph shows that increase in total prison population is directly proportional to the increase in
undertrial population. It reflects that the increasing rate of growing prison population can be addressed by checking
the increase in undertrial population. It also shows that overcrowding increases when the rate of increase in prison
capacity is slower.
The average occupancy rate of 117.6 % does not adequately reflect the actual status of overcrowding in Indian
prisons. State wise occupancy rate reveal extreme variation ranging from Nagaland’s 30.5 % to Uttar Pradesh’s 176.5
% (excludes Union Territory Lakshadweep (1.6%). The District Jails in Uttar Pradesh have an occupancy of 183 %. CHRI
believes that overcrowding can be addressed by strategically increasing prison capacity at one hand and checking
the increasing rate of undertrial population on the other hand.
II. PROPORTION OF UNDERTRIAL PRISONERS
Findings - PSI 2018
In 2018, 69.4% of the prison population comprised undertrial prisoners, highest since 2002.
From 2016 to 2018, while the convict population increased by 2.8%, the undertrial population increased by
10%.
The annual rate of increase of undertrial population has amplified more than 3 times since 2013-14 (1.57%) to
2017-18 (4.8%).
Uttar Pradesh (23.2%) and Bihar (9.7%), combined have more than 1/3th of the country’s total undertrial
population.
*In last six years, highest decrease in UT ratio was in Arunachal Pradesh from 88% to 48.2%.

*In last six years, highest increase in UT ratio was in Himachal Pradesh from 49.9% UTPs in 2013 to 61.6% UTPs in
2018 followed by Uttarakhand from 50% UTPs in 2013 to 60.7% in 2018.
*In last six years, seventeen states reduced their UTP ratio while eleven states recorded an increased UTP ratio.1
CHRI’s Comments
The graph shows that the undertrial population is consistently increasing post 2011 barring an exception in 2015. The
increase in convict population in prisons on the other hand has not crossed 3% mark since 2008. If this increase in the
undertrial population is not addressed urgently, the UTP ratio will cross 70% mark which was last recorded in 2001
1 *This excludes Tamil Nadu, Telangana, A & N Islands, Chandigarh, Dadar & Nagar Haveli, Daman & Diu, Lakshadweep and Puducherry. Tamil Nadu and Telangana. These have been excluded from the comparison because in 2014 the two states were merged. The rest of the Union Territories were excluded because of their dynamic and comparatively small prison population.
257928250204
240098 241200254857
278503 282879 282076293058
308718323537
123307 123941 125789 128592 127789 1,29,608 1,31,517 1,34,168 1,35,683 1,39,149 1,39,488
0
50000
100000
150000
200000
250000
300000
350000
Change in Undertrial and Convict Prison Population
2018 2017 2016 2015 2014 2013 2012 2011 2010 2009 2008
Undertrial
Prisoners
25.43%
(2008-18)
Convict
Prisoners
13.12%
(2008-18)
0.51% 1.49% 2.23% -0.62% 1.42% 1.47% 2.02% 1.13% 2.55% 0.24%
-0.45%
-0.28%
(70.4%). The annual data on UTP ratio shows that it was confined between 64-67 percent from 2003 to 2016. However,
a steep increase can be seen post 2016.
A higher undertrial population means more burden on the criminal justice system. The ten year (2008 – 2018) increase
in UT population by 25.4% against 13.1% increase in convict population may indicate that trials are taking longer to
complete leading to an adverse UTP ratio as well as increase in number of prisoners spending longer durations behind
bars. However, the fact that seventeen states have reduced their UTP ratio in comparison to lesser number of states
(eleven) where it has got worse calls for a state level introspection on the reasons for increasing undertrial population.
It important to note that only 6 states (Arunachal Pradesh, Chhattisgarh, Madhya Pradesh, Mizoram, Sikkim and Tripura)
have 60% or less UTP ratio. An in-depth study on factors such as crime rate, judicial pendency, working of Undertrial
Review Committees, status of legal aid, etc. in these states may reveal the factors behind a balanced UTP ratio. The
UTP ratio is higher than 70% in 12 states (Bihar, J & K, Jharkhand, Karnataka, Maharashtra, Manipur, Meghalaya, Odisha,
Rajasthan, Uttar Pradesh, West Bengal and Delhi). CHRI believes that case studies on states such as Arunachal Pradesh
which have reduced the UTP ratio might help in policy formulation.
III. PERIOD OF CONFINEMENT OF UNDERTRIAL PRISONERS
Findings – PSI 2018
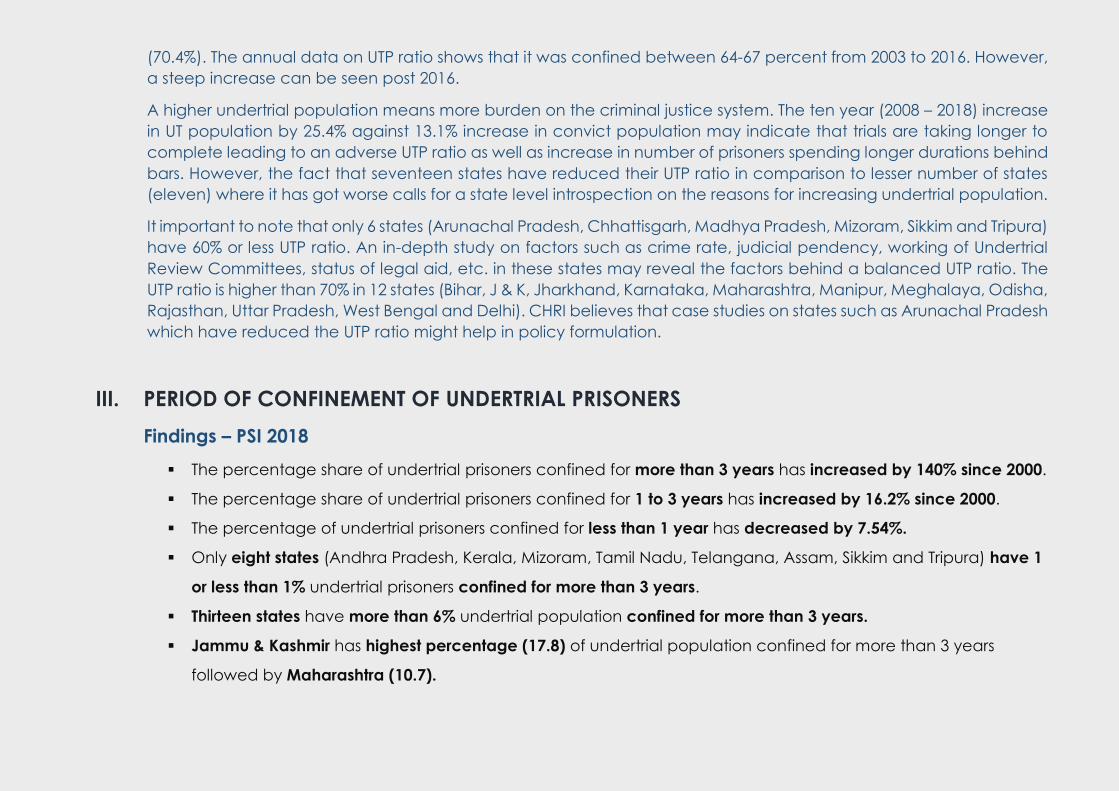
The percentage share of undertrial prisoners confined for more than 3 years has increased by 140% since 2000.
The percentage share of undertrial prisoners confined for 1 to 3 years has increased by 16.2% since 2000.
The percentage of undertrial prisoners confined for less than 1 year has decreased by 7.54%.
Only eight states (Andhra Pradesh, Kerala, Mizoram, Tamil Nadu, Telangana, Assam, Sikkim and Tripura) have 1
or less than 1% undertrial prisoners confined for more than 3 years.
Thirteen states have more than 6% undertrial population confined for more than 3 years.
Jammu & Kashmir has highest percentage (17.8) of undertrial population confined for more than 3 years
followed by Maharashtra (10.7).

CHRI’s Comments
Analysis of the duration of confinement of undertrial prisoners shows that the share of undertrial prisoners confined for
larger durations (more than 1 year) is consistently increasing while an inverse fall in the share of undertrial population
spending shorter duration (less than 1 year) is decreasing. The increase in number of prisoners confined for longer
duration is conservatively represented in the macro figures as the undertrial population itself is increasing at a growing
pace every year.
There were 4,976 undertrial prisoners confined for more than 3 years in 2000 which increased to 19,420 in 2018. The
socio economic impacts of pre-trial detention are well known; An Open Society Justice Initiative’s report on pre-trial
detention noted that poor are more likely to remain longer in pre-trial detention and are exposed to health and social
vulnerabilities. Therefore, the increasing number of undertrial prisoners confined for more than 1 year need to be
checked and addressed by the Government immediately.
These increasing numbers also cast a doubt upon the functioning of the Under-trial Review Committees2. In 2018, there
were 1822 undertrial prisoners eligible for release under section 436 A of CrPC out of which 1072 (58.83%) undertrial
2 An Undertrial Review Committee (UTRC) is a district level oversight mechanism headed by the senior most judicial officer of the district and comprises members from district
administration, District Legal Services Authority , police and prison department, that primarily focuses on addressing overcrowding in the prisons.
80.8 80.9 7874.9 74.7
16.6 15.818.3 19.7 19.3
2.5 3.3 3.6 5.4 6
05
10152025303540455055606570758085
2000 2005 2010 2015 2018
Percentage of Undertrial Prisoners by Period of Confinement
Upto 1 year
1 year to 3years
More than 3years
prisoners were released. It must be noted that section 436A is only one of 14 categories of prisoners who may be
recommended for release by the Undertrial Review Committee. CHRI believes that an effective implementation of
the NALSA’s SOP on UTRCs shall ensure that unnecessary and prolonged detention is kept under check.
IV. WOMEN AND PRISONS – INMATES & STAFF
Findings – PSI 2018
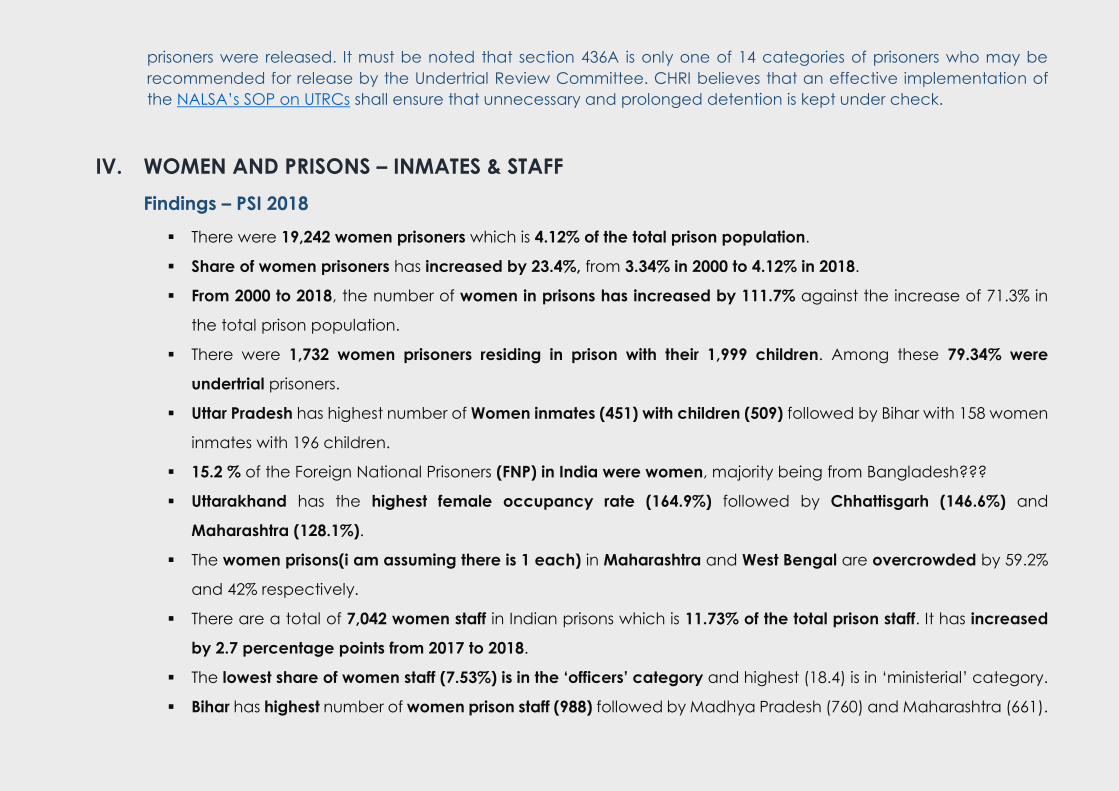
There were 19,242 women prisoners which is 4.12% of the total prison population.
Share of women prisoners has increased by 23.4%, from 3.34% in 2000 to 4.12% in 2018.
From 2000 to 2018, the number of women in prisons has increased by 111.7% against the increase of 71.3% in
the total prison population.
There were 1,732 women prisoners residing in prison with their 1,999 children. Among these 79.34% were
undertrial prisoners.
Uttar Pradesh has highest number of Women inmates (451) with children (509) followed by Bihar with 158 women
inmates with 196 children.
15.2 % of the Foreign National Prisoners (FNP) in India were women, majority being from Bangladesh???
Uttarakhand has the highest female occupancy rate (164.9%) followed by Chhattisgarh (146.6%) and
Maharashtra (128.1%).
The women prisons(i am assuming there is 1 each) in Maharashtra and West Bengal are overcrowded by 59.2%
and 42% respectively.
There are a total of 7,042 women staff in Indian prisons which is 11.73% of the total prison staff. It has increased
by 2.7 percentage points from 2017 to 2018.
The lowest share of women staff (7.53%) is in the ‘officers’ category and highest (18.4) is in ‘ministerial’ category.
Bihar has highest number of women prison staff (988) followed by Madhya Pradesh (760) and Maharashtra (661).

CHRI’s Comments
Women prisoners in India are increasing at a higher rate (111.7%) than the increase in number of prisoners (71%).
According to the World Prison Brief’s World Female Imprisonment List (fourth edition), the increase in world’s (Africa,
Americas, Asia, Europe and Oceania) female prison population has increased by 53.3% since 2000. In India, with an
increase of 111.7%, the rate of increase of female prison population is twice that of the world rate.
It is also alarming to note that almost 80% of the women with children in prisons are awaiting trial (undertrial) and in
total, there were 1,999 children in prisons accompanying 1,732 women prisoners. In light of undeniable poor living
conditions and adversarial environment in prisons it is a crisis that almost 2000 children are forced to be in prisons . CHRI
urges for the implementation of the the recommendations given in the ‘Women in Prisons – India’ report of the Ministry
of Women and Child Development 2017/18??.
Though, the women staff in prisons has increased from 9% in 2017 to 11.7% in 2018; it remains much lower than the
gender share in the general population. The share of women in prison staff (11.7%) is twice that of women in prison
population (4.1%). However, this should not be interpreted as adequate because women staff are also deployed at
tasks not concerning women prisoners. This is further affirmed by the fact that highest share of women in staff is
reflected in the ministerial category of prison staff. CHRI believes that prisons, as correctional institutions must reflect
progressive standards in their operations and particularly be gender representative.
19242
446842
Gender Classification of Prisoners
Women Men
1732
17510
Share of Women Prisoners with Children
Women Prisoners with Children
Other Women prisoners
1376, 79.4%
355, 20.7%
Category wise classification of Women Prisoners with Children
Undertrial Convict

V. EDUCATION, CASTE AND RELIGION OF PRISONERS
Findings – PSI 2018
Education
Every 1 out of 3 prisoner in India is illiterate.
Only 30% prisoners have studied above class X.
49.4% prisoners in the ‘others’ category are illiterate.
Only 6.4% are graduate, 1% have a technical degree or diploma and only 1.6% are post graduate.
Caste
Other Backward Castes (OBC) form the highest share (33.7%) of prisoners.
Schedule Castes (SC) form 20.8%, Schedule Tribes (ST) form 11.6% and the ‘others’ category forms 28.1% of total
prisoners in India.
From 2013 to 2018, the share of OBC in Detenues has increased by 16.8 percentage points while ST and SC
combined decreased by 19.3 percentage points.
Religion
Hindus form 67.4%, Muslims 19.1%, Sikh 3.6%, Christian 3% and ‘others’ are 1.1% of the total prison population.
From 2013 to 2018, population of Hindus in prisons decreased by 2.5 percentage points, Muslims decreased by
0.6 percentage points and Sikhs decreased by 1.3 percentage points.
From 2013 to 2018, Hindu detenues decreased by 15.1 percentage points while Muslim detenues increased by
15.9 percentage points.
Muslim (19.1%), Christian (3%) and Sikh (3.6%) have higher share of population in prisons than in the country.
The population of Hindus in prisons (67.4%) is lower than the religion’s share (79.8%) in the country.

CHRI’s Comments
7 out of 10 prisoners in India are either illiterate or have not studied till class X. This reflects the social vulnerability of 70%
of the prison population. High uneducated prison population should be an area of concern for the legal aid
authorities, courts and correctional institutions who are tasked with rehabilitation of prisoners. Illiteracy is often
associated with poverty as well which necessitates literacy programmes in prisons so that prisoners are informed and
aware.
The PSI 2016 and 2017 did not contain caste and religion data of prisoners. However, the PSI 2018 has included the
caste and religion data of prisoners. The chart above shows that ST form 11.6% of the total prison population which is
disproportionate to their share in the country’s population. Similarly the share of SC in prison population at 20.8% is
higher than their share in the general population. Similarly, the chart on ‘Percentage Share of Religion of Prisoners’
highlights the disproportionate share of Muslim, Sikh and Christian population in Prisons..
20.8
11.6
33.7
28.1
Percentage Share of Caste of Prisoners
SC
ST
OBC
Others0
20
40
60
80
Hindu Muslim Sikh Christian Other
67.4
19.1
3.6 3 1.1
79.8
14.2
1.7 2.3 1.9
Percentage Share of Religion of Prisoners*
Prison Population India Census 2011
29%
40%
22%
6%1% 2%
Education Profile of Prisoners
Illiterate
Below X
Class X & above butbelow graduationGraduate
Diploma
Post Graduate

VI. PRISON STAFF
Findings – PSI 2018
In 2018, there were 60,024 actual staff in prisons against the sanctioned strength of 85,840. The average staff
vacancy in Indian prisons has slightly reduced to 30.07% in 2018 from 31.2% in last year.
Nagaland (0.5%), Arunachal Pradesh (6.9%) and Kerala (7%) are the top three states to have lowest staff
vacancy in their prisons.
Jharkhand (67.8%), Chandigarh (52%) and Sikkim (51.6%) have highest staff vacancy in their prisons.
18 states and UTs have no sanctioned probation or welfare officers. Punjab which had 10 sanctioned probation/
welfare officers in 2017 recorded zero such sanctioned strength in 2018.
23 states and UTs have no sanctioned psychologists/psychiatrists. Chandigarh, Tripura and Odisha which had
zero sanctioned positions of Psychologists/psychiatrists recorded 1, 1 and 4 sanctioned strength in 2018.
20 states and UTs have no sanctioned social workers in 2018, without any change from 2017.
9 States and UTs have no sanctioned correctional staff while 14 states and UTs had not appointed any
correctional staff at the end of 2018.
The inmate to staff ratio is unchanged in 2018 at 7:1. The ratio of inmate to correctional staff is 756:1 and inmate
to medical staff is 243:1.
85%
1%
3%
7%
4%
Distribution of Actual Prison Staff Strength (%)
Executive Staff
Correctional Staff
Medical Staff
Ministerial Staff
Others
254
31
331
Segregation of Correctional Staff in Indian Priosns
Probabtion/Welfare Officer
Psychologist/Psychiatrist
Social Worker/Others

CHRI’s Comments
Statistics continue to indicate that the Prison Administration is extremely overburdened because of acute staff
shortage of 30%. Though, there has been a reduction in the staff vacancy, nevertheless there is a need of urgent filling
up of vacancy in prisons. The 7:1 inmate to staff ratio is not truly reflective of the actual number of staff available to
tend to the prisoners. The number of actual staff includes the staff that is suspended or on leave or deputation etc.
Further, the distribution of the cadres in actual prison staff further reveal an extremely disproportionate inmate to staff
ratio in correctional and medical category. The fact that the correctional staff is completely absent in 14 states
uncovers the ‘correctional’ natures of Indian prisons.
In 2018, 18.8% of total prison staff received trainings which include refresher / specialised / re-orientation courses. From
2017 to 2018, there was an increase of 4.5% in actual staff strength. Now assuming that all the new recruits had
received training at the time of recruitment leaves the actual number of staff getting training to a mere 14.3%. It
cannot be found out from the PSI data that whether the staff gets trainings on rotational basis or not.
VII. FOREIGN NATIONAL PRISONERS
Findings – PSI 2018
In 2018, there were 5,168 Foreign National Prisoners (FNP) in India out of which 787 (15.2%) are women.
From 2016 to 2018, the FNPs have decreased by 18.9% however, from 2017 to 2018 FNPs increased by 4.9%.
In 2018, 40.8% of the FNPs are convicts, 50.5% are undertrial prisoners and 0.8% are detenues. 406 FNPs (7.9%)
were categorised as ‘others’.
The highest number of FNPs are housed in the prisons of West Bengal (2,316) followed by Maharashtra (587) and
Delhi (416).
The most number of FNPs are from Bangladesh (2,495) followed by Nepal (683) and Nigeria (622).
From 2016 to 2018, the highest increase in FNPs is in Manipur (159%), Gujarat (130%) and Uttarakhand (115.4%).
From 2016 to 2018, the highest decrease in FNPs is in Nagaland and Dadar & Nagar Haveli (0 FNPs in 2018),
followed by Andaman & Nicobar Islands (59.3%) and Tripura (56.5%).
CHRI’s Comments
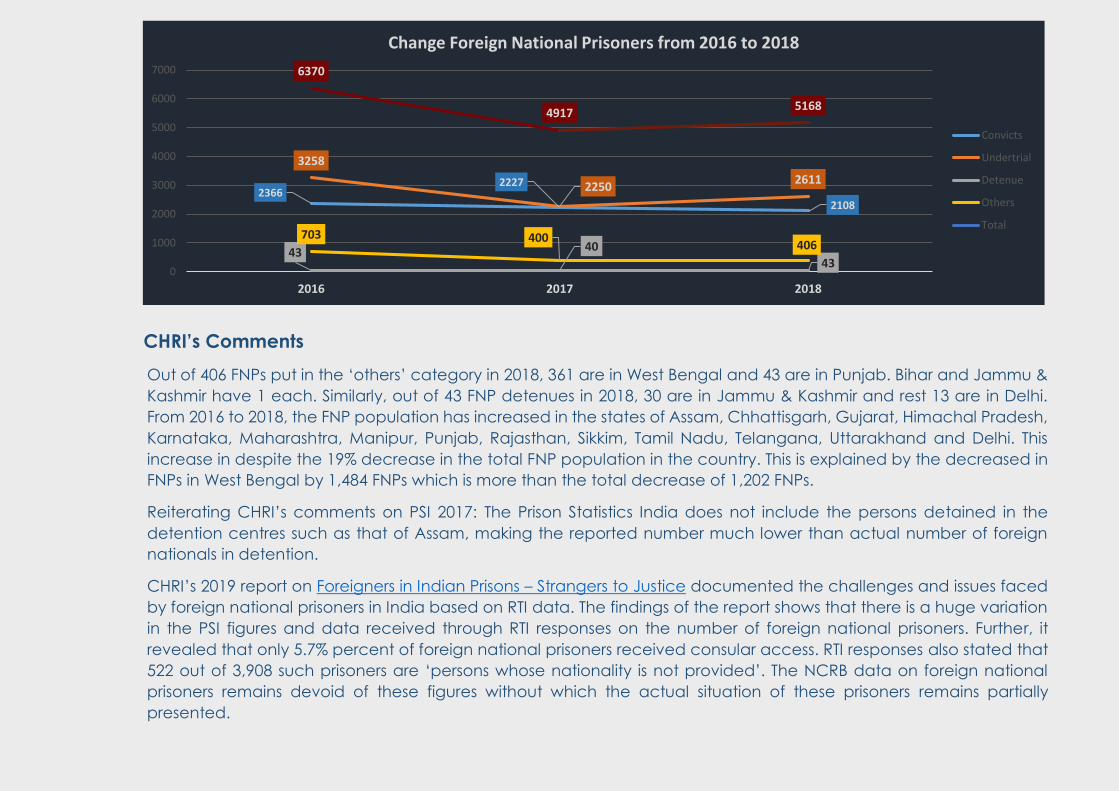
Out of 406 FNPs put in the ‘others’ category in 2018, 361 are in West Bengal and 43 are in Punjab. Bihar and Jammu &
Kashmir have 1 each. Similarly, out of 43 FNP detenues in 2018, 30 are in Jammu & Kashmir and rest 13 are in Delhi.
From 2016 to 2018, the FNP population has increased in the states of Assam, Chhattisgarh, Gujarat, Himachal Pradesh,
Karnataka, Maharashtra, Manipur, Punjab, Rajasthan, Sikkim, Tamil Nadu, Telangana, Uttarakhand and Delhi. This
increase in despite the 19% decrease in the total FNP population in the country. This is explained by the decreased in
FNPs in West Bengal by 1,484 FNPs which is more than the total decrease of 1,202 FNPs.
Reiterating CHRI’s comments on PSI 2017: The Prison Statistics India does not include the persons detained in the
detention centres such as that of Assam, making the reported number much lower than actual number of foreign
nationals in detention.
CHRI’s 2019 report on Foreigners in Indian Prisons – Strangers to Justice documented the challenges and issues faced
by foreign national prisoners in India based on RTI data. The findings of the report shows that there is a huge variation
in the PSI figures and data received through RTI responses on the number of foreign national prisoners. Further, it
revealed that only 5.7% percent of foreign national prisoners received consular access. RTI responses also stated that
522 out of 3,908 such prisoners are ‘persons whose nationality is not provided’. The NCRB data on foreign national
prisoners remains devoid of these figures without which the actual situation of these prisoners remains partially
presented.
23662227
2108
3258
22502611
43 40
43
703 400406
6370
49175168
0
1000
2000
3000
4000
5000
6000
7000
2016 2017 2018
Change Foreign National Prisoners from 2016 to 2018
Convicts
Undertrial
Detenue
Others
Total

Despite bilateral agreements for transfer of sentenced prisoners, lack of diligent consular assistance, restrictions on
making international calls to family, lack of implementation of agreements on transferring of prisoners between India
and Bangladesh, sketchy application of deportation/repatriation procedures and absence of alternative facilities to
house the released prisoners contribute to this enormous humanitarian and administrative problem.
VIII. PRISON INSPECTION
Findings – PSI 2018
There were a total of 46,291 prison inspections in the year 2018. On an average, there were 3 inspections per
prison per month.
44.8% of the inspections were Medical, 13.7% were Executive, 30.6% were Judicial and 10.8% were in the ‘others’
category.
Andhra Pradesh (17.2%) had highest number of prison inspections followed by Madhya Pradesh (9.9%) and Uttar
Pradesh (7.7%).
Chandigarh with one prison has highest (32) inspections per prison per month. It is followed by Himachal Pradesh
and Haryana with 11 and 9 inspections per prison per month, respectively.
Manipur, Tamil Nadu, Lakshadweep and Puducherry reported less than 1 prison inspection per prison per month.
In judicial inspections, Haryana followed by Gujarat with 4 and 3 inspections had most number of judicial
inspections per prison per month.
In 2018, with a total of 14185 judicial inspections in 1339 prisons, there wasn’t even 1 judicial inspection per prison
per month.
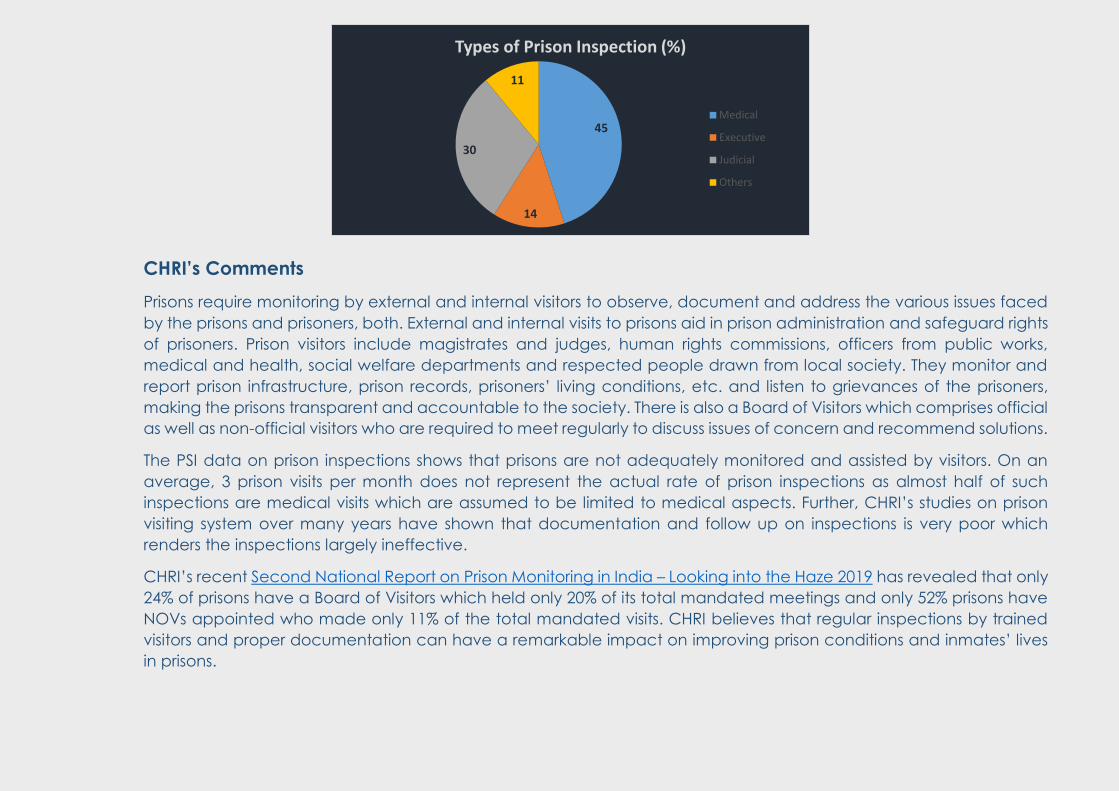
CHRI’s Comments
Prisons require monitoring by external and internal visitors to observe, document and address the various issues faced
by the prisons and prisoners, both. External and internal visits to prisons aid in prison administration and safeguard rights
of prisoners. Prison visitors include magistrates and judges, human rights commissions, officers from public works,
medical and health, social welfare departments and respected people drawn from local society. They monitor and
report prison infrastructure, prison records, prisoners’ living conditions, etc. and listen to grievances of the prisoners,
making the prisons transparent and accountable to the society. There is also a Board of Visitors which comprises official
as well as non-official visitors who are required to meet regularly to discuss issues of concern and recommend solutions.
The PSI data on prison inspections shows that prisons are not adequately monitored and assisted by visitors. On an
average, 3 prison visits per month does not represent the actual rate of prison inspections as almost half of such
inspections are medical visits which are assumed to be limited to medical aspects. Further, CHRI’s studies on prison
visiting system over many years have shown that documentation and follow up on inspections is very poor which
renders the inspections largely ineffective.
CHRI’s recent Second National Report on Prison Monitoring in India – Looking into the Haze 2019 has revealed that only
24% of prisons have a Board of Visitors which held only 20% of its total mandated meetings and only 52% prisons have
NOVs appointed who made only 11% of the total mandated visits. CHRI believes that regular inspections by trained
visitors and proper documentation can have a remarkable impact on improving prison conditions and inmates’ lives
in prisons.
45
14
30
11
Types of Prison Inspection (%)
Medical
Executive
Judicial
Others
IX. EXPENDITURE ON PRISONERS
Findings – PSI 2018
In 2018, 33.6% of the annual expenditure was spent on prisoners which is 2 percentage points lesser than that in
2017.
In 2018 on an average, INR 104.4 was spent on a prisoner per day which is INR 1.4 more than last year.
On an average per prisoner per day, INR 52.4 (50.2%) was spent on food, INR 43.8 (42.3%) was spent on ‘others’,
INR 4.5 (4.3%) was spent on medical, INR 1.5 (1.4%) was spent on welfare activities, INR 1.5 (1.4%) was spent on
clothing and INR 0.5 (0.5%) was spent on vocational/ educational trainings.
Andhra Pradesh (99.2%) spent highest share of their expenditure on inmates followed by Haryana at 79.7% and
Chhattisgarh at 71.9%.
Nagaland (5.4%), A & N Islands (7.7%) and Arunachal Pradesh (9.8%) spent lowest share of their expenditure on
inmates.
CHRI’s Comments The expenditure on prisoners has increased slightly by INR 1.4 however the share of expenditure on prisoners against total
expenditure has decreased in 2018 from the last year. INR 104 on per prisoner per day seems inadequate. Further, since
92.5% of this expenditure is on food and ‘other’ activities which include transport for hearings, transfers, hospital etc. and
expense on sanitation hygiene etc., only a meagre amount is left for vocational/educational, welfare and medical needs
of a prisoner. The data on expenditure on prisoners shows that the prison institutions do not have adequate funds nor do
they have staff (as indicated earlier) for imparting correctional services. The extreme variation in the state wise share of
expenditure on prisoners indicates lack of uniformity in resources for sustainable living conditions in prisons, which continues
to be an area of concern.

X. DEATHS IN PRISON
Findings – PSI 2018
In 2018, there were 1,845 total deaths in Indian prisons, highest since 1998.
Out these 1,845, 149 (8.08%) were ‘unnatural’ deaths and 1,639 (88.8%) were ‘natural’ and 57 (reported in
Rajasthan) had undetermined causes of death.
From 2013 to 2018, while the increase in total prison population was 13.12%, increase in deaths in prison was 15.5%.
From 2013 to 2018, increase in ‘unnatural’ deaths was by 29.6%.
Punjab (28) had highest unnatural deaths followed by Uttar Pradesh (17) and West Bengal (12).
Uttar Pradesh (426) had highest natural deaths followed by Madhya Pradesh (133) and Maharashtra (127).
CHRI’s Comments
Deaths in judicial custody is a serious concern for the state as it is a death under the direct watch of the state. PSI data
over the years shows that the deaths in prisons are increasing at a higher rate than the increase in prison population. This
increase in the mortality rate in prisons must be seen in the light of expenditure on medical and availability of medical
staff in prisons. Further, it also shows the failure of Undertrial Review Committees designed and mandated to review
individual cases for release from prisons3. For instance, in 2018, 5 prisoners died due to ‘Schizophrenia with Epilepsy’, 80
died due to ‘Cancer’, 46 died due to ‘HIV’, and 85 died due to ‘TB’. These are commonly understood as fatal diseases
and probability of death of such patients can be medically foreseen. It is difficult to understand the reasons behind
continued incarceration of prisoners suffering and at advanced stages of such diseases. The state has a sovereign duty
to provide medical treatment to its subjects, which in case of direct physical custody only becomes unilateral. All these
prisoners either should have been released or be hospitalised. PSI does not record data about place of death (in prison,
on the way to hospital or in hospital), however it can be safely assumed that most of these prisoners would have died at
the prison itself. In either case, the death would have occurred while they were in the custody of the prison department.
CHRI believes that there must be better access to medical facilities, 24x7 presence of medical officers and robust training
of medical officers to address the increasing rate of deaths in prisons in India.
3 UTRC may recommend release of Undertrial prisoners on bail or temporarily who are sick and infirm and require specialised treatment. See Paragraph 3.3.10, page 9 of the NALSA SOP for UTRCs. Available at https://districts.ecourts.gov.in/sites/default/files/NALSA%20SOP.pdf.