Jae-Hyung Park , Tae-Hwan Kim , Kwang-Suk Lee3) · Because bolt failures might cause tragic ... the...
19
Novel bolt-loosening detection technique using image processing for bolt joints in steel bridges Jae-Hyung Park 1) , Tae-Hwan Kim 2) , Kwang-Suk Lee 3) , Tuan Cuong Nguyen 4) and *Jeong-Tae Kim 5) 1), 2), 3), 4), 5) Department of Ocean Engineering, Pukyong Nat’l Univ., Busan 608-737, Korea 3) idis.pknu.ac.kr ABSTRACT This paper presents a novel bolt-loosening detection technique using image information of bolted joints in steel bridges. Existing bolt-loosening detection techniques are briefly reviewed and their benefits and limitations are analyzed. Then, a bolt- loosening detection algorithm using image processing techniques is newly proposed. It consists of 6 steps: (1) taking a picture for a bolt joint, (2) extracting an image for a splice plate from the picture, (3) correcting perspective distortion of the image for the splice plate, (4) segmenting the image for each nut, (5) extracting edge of each nut and identifying their rotation angles, and (6) detecting bolt-loosening by comparing with the pre-identified nut angles. As a key technique, Hough transform is used to identify the splice plate and the rotation angles of nuts. The applicability of the proposed technique is evaluated by experimental tests with bolt-loosening scenarios. A test specimen which consists of a splice plate, 8 bolts and 8 nuts with 2×4 array is used for the tests. 1. INTRODUCTION Recently, many bridges have been constructed, and the number of bridges reaches about twice during the last 10 years in Korea. With increment of the number of bridges, the costs for their management and maintenance have been rapidly increased. Therefore many researchers have focused on developing cost-efficient health monitoring techniques to ensure the safety and reliability of bridges (Kim 2013, Nagayama 2007, Yun 2011). Bolts are important elements to connect members of steel structures. In most steel bridges, the members connect to each other by friction bolt joints. Insufficient preload by bolt-loosening leads to bolt joint failure and reducing load carrying capacity 1) BK21+ Research Professor 2) Graduate Student 3) Professor
Transcript of Jae-Hyung Park , Tae-Hwan Kim , Kwang-Suk Lee3) · Because bolt failures might cause tragic ... the...

Novel bolt-loosening detection technique using image processing for bolt joints in steel bridges
Jae-Hyung Park1), Tae-Hwan Kim2), Kwang-Suk Lee3),
Tuan Cuong Nguyen4) and *Jeong-Tae Kim5)
1), 2), 3), 4), 5) Department of Ocean Engineering, Pukyong Nat’l Univ., Busan 608-737, Korea
3) idis.pknu.ac.kr
ABSTRACT This paper presents a novel bolt-loosening detection technique using image information of bolted joints in steel bridges. Existing bolt-loosening detection techniques are briefly reviewed and their benefits and limitations are analyzed. Then, a bolt-loosening detection algorithm using image processing techniques is newly proposed. It consists of 6 steps: (1) taking a picture for a bolt joint, (2) extracting an image for a splice plate from the picture, (3) correcting perspective distortion of the image for the splice plate, (4) segmenting the image for each nut, (5) extracting edge of each nut and identifying their rotation angles, and (6) detecting bolt-loosening by comparing with the pre-identified nut angles. As a key technique, Hough transform is used to identify the splice plate and the rotation angles of nuts. The applicability of the proposed technique is evaluated by experimental tests with bolt-loosening scenarios. A test specimen which consists of a splice plate, 8 bolts and 8 nuts with 2×4 array is used for the tests. 1. INTRODUCTION Recently, many bridges have been constructed, and the number of bridges reaches about twice during the last 10 years in Korea. With increment of the number of bridges, the costs for their management and maintenance have been rapidly increased. Therefore many researchers have focused on developing cost-efficient health monitoring techniques to ensure the safety and reliability of bridges (Kim 2013, Nagayama 2007, Yun 2011). Bolts are important elements to connect members of steel structures. In most steel bridges, the members connect to each other by friction bolt joints. Insufficient preload by bolt-loosening leads to bolt joint failure and reducing load carrying capacity
1) BK21+ Research Professor 2) Graduate Student 3) Professor

of bridges. In accordance with a report for structural defects in steel bridges operated by Korea Expressway Corporation (2013), bolt defects occurred in 33.3% of the bridges and a main cause of the defects was investigated as bolt-loosening by insufficient preload or vibration as shown in Fig. 1. Because bolt failures might cause tragic structural failure, bolt-loosening detection is important to maintain the structural performance of steel bridges.
(a) Defect Types and Occurrence Rate (b) Causes of Bolt Defect
Fig. 1 Structural Defects Occurred in Steel Bridges To date, many techniques to detect bolt-loosening in the steel bridges have been developed and they can be classified into two groups as: (1) in-situ inspection techniques including visual inspection, hammer impact inspection method and torque wrench technique (Korea Infrastructure Safety & Technology Corporation 2008) and (2) sensor-based monitoring techniques including methods using acoustoelastic wave, guided wave, electro-mechanical impedance (Wang 2013), magnet field (You 2010) and electric potential drop (Hyun 2013). However, feasibility of these methods could be reduced in real applications due to impossible early detection, large error in measurement, high-cost monitoring system and so on. Meanwhile, image processing technologies have been widely adopted to recognize medical image, object, pattern, character and so on. Also, many researchers have applied them to inspection and monitoring of civil structures. They have applied the technologies to identify crack on concrete (Abdel-Qader 2003, Yamaguchi 2010) and pavement surface (Subirats 2006), detect damage on surface of stay-cable (Ho 2013), diagnose steel bridge coating (Korea Expressway Corporation 2006), and measure displacement of bridge (Ho 2012, Fukuda 2013). The benefits of using the image processing technologies in the areas of inspection and monitoring are as follows: (1) providing intuitive and scientific information for bridge maintenance, and (2) using low-cost equipment such as cameras. In this study, a novel bolt-loosening detection technique using image information of bolted joints in steel bridges is presented. Existing bolt-loosening detection techniques are analyzed by reviewing them. Then, a bolt-loosening detection algorithm using image processing technologies is newly proposed. It consists of 6 steps: (1)

taking a picture for a bolt joint, (2) extracting an image for a splice plate from the picture, (3) correcting perspective distortion of the image for the splice plate, (4) segmenting the image for each nut, (5) extracting edge of each nut and identifying their rotation angles, and (6) detecting bolt-loosening by comparing with the pre-identified nut angles. As a key technique, Hough transform is used to identify the splice plate and the rotation angles of nuts. The applicability of the proposed technique is evaluated by experimental tests with bolt-loosening scenarios. A test specimen which consists of a splice plate, 8 bolts and 8 nuts with 2×4 array is used for the tests. 2. BRIEF REVIEW OF EXISTING BOLT-LOOSENING DETECTION TECHNIQUES 2.1 In-situ inspection techniques The in-situ inspection techniques detect bolt-loosening by the visual inspection or using mechanical devices such as hammer and torque wrench (Korea Infrastructure Safety & Technology Corporation 2008). They are the most widely used techniques for the bolt joint inspection of steel bridges in real applications. Visual inspection is the simplest method and provides intuitive information for the bolt-loosening detection. However it cannot detect bolt-loosening until a bolt is completely loosened as shown in Fig. 2. Note that the loosened bolt does not contribute any more to friction resistance of a joint in a steel bridge. Bolt joints in steel bridges must be inspected every 2 or 3 years by using the impact hammer technique according to law for structural safety in Korea (Korea Infrastructure Safety & Technology Corporation 2008). To implement the technique, an inspector touch his finger around a bolt and hit the bolt head by a hammer. If he feels abnormal vibration from the bolt, he decides bolt-loosening. It is relatively simple but its accuracy depends on the inspector’s experience and sense. Current practice relies on the torque wrench technique as the best way to detect bolt-loosening and measure axial preload of bolt. However, the torque wrench method was reported to show large intrinsic errors in bolt tension measurement by up to 50% due to the friction between the bolt threads and the nut (Kim 2009, Wang 2013). Also, the method needs cost- and time-consuming process in large structures with thousands bolts such as steel bridges because it is applied to one by one bolt.
Fig. 2 Examples of completely loosened bolts

2.2 Sensor-based monitoring techniques The sensor-based monitoring techniques detect bolt-loosening by electric or
electronic instruments. They can provide real-time monitoring by attaching transducer(s) and sensor(s) on or around a bolt. They can be classified into 5 methods: acoustoelastic effect based method, guide wave based method, impedance-based method, magnet field-based method, and electric potential drop method.
Acoustoelastic effect based method is similar to the impact hammer technique but provides scientific bolt-loosening detection results by measuring ultrasonic wave and vibration. The method, which includes time-of-flight method, velocity ratio method and mechanical resonance frequency shift method, is an ideal way for the bolt-loosening monitoring, but the stress-induced velocity changes are quite small; thus the time-of-flight variation and frequency shift are very small. Furthermore, there are many factors, such as the material-microstructure effects, environmental noise, temperature, and the thickness of bonding layer to increase measurement accuracy (Wang 2013). Also, the method requires a lot of sensors and high cost systems to cover whole bolts in large structures.
Guided wave based method uses that bolt preload changes the dynamic characteristics of the splice plate, and it affects the ultrasonic wave, which is generated by the piezoelectric transducer, passing through the splice plate. By monitoring and analyzing the received ultrasonic signals, the bolt-loosening can be detected (Wang 2013). Because the method can investigate all bolts on a splice plate, it has a great potential for bolt-loosening detection monitoring. However, it is difficult to pin-point loosened bolts and the method needs high-cost for a monitoring system to cover all bolts in the steel bridge.
Impedance based method has high sensitivity to the local structural damage and a large-frequency bandwidth. It is specially fitted for monitoring bolted joints which are dominated by local dynamics of high-frequency characteristics. The impedance method has a good potential for in situ monitoring of bolted connections (Wang 2013, Kim 2011). However, it has low monitoring range and so needs a lot of sensors and impedance analyzers to cover all bolts in the steel bridges. Also, the method is affected by temperature and environmental noise (Hong 2012).
Magnetic field-based method uses a simple phenomenon which the bolt-loosening is caused by rotating a nut and this rotation changes magnetic field around the nut. This method consists of a nut cap with magnets and a reed switch. If a nut is rotated in the nut cap, magnet field is changed and then the reed switch is turned on and bolt-loosening is detected (You 2010). This method is very simple but it can apply only one bolt. Therefore, many nut caps are required to detect all bolts in the steel bridge.
Electric potential drop method uses relationship between electrical resistance and change in thickness of a steel plate. If a bolt is loosened, cross-section area of a splice plate is increased and then the electric resistance is decreased. When constant current flows through the splice plate, the voltage is decreased by bolt-loosening and then bolt loosening can be detected (Hyun 2013). Also, this method can approximately estimate bolt preload from finite element analysis. For field applications, however, paint coating to prevent corrosion must be removed and a lot of sensors is required to cover all bolts

in the steel bridge. Also, environmental conditions such as temperature should be considered. 3. IMAGE-BASED BOLT-LOOSENING TECHNIQUE
In this study, a bolt-loosening detection technique using image information such as pictures is proposed to overcome the disadvantages of the existing techniques. An image can include all bolts installed on a splice plate. If rotation angle of each nut can be estimated by image processing techniques from the picture, bolt-loosening can be detected from the change in the rotation angle of each nut. Also, the cost for bolt-loosening monitoring is very low because only a camera is required, the picture is not affected by temperature and no sensor is attached on the structure. 3.1 Basics of image processing
An image is a single picture which represents something. It may be a picture of a person, of people or animals, or of an outdoor scene, or a microphotograph of an electronic component, or the result of medical imaging. Image processing involves changing the nature of an image in order to either: 1) improve its pictorial information for human interpretation, and 2) render it more suitable for autonomous machine perception. Digital image processing involves using a computer to change the nature of a digital image which is digitized to represent an image in the computer as shown in Fig. 3. A procedure of the digital image processing to identify an object in a digital image may include the following tasks (McAndrew 2004):
1) Acquiring the image: a digital image is produced from a picture. This can be done using either a CCD (charge-coupled device) camera, or a scanner.
2) Preprocessing: this is the step taken before the “major” image processing task. Some basic tasks are performed in order to render the resulting image more suitable for the job to follow.
3) Segmentation: part of the object is extracted from the image. 4) Representation and description: these terms refer to extracting the particular
features which is to differentiate between objects. 5) Recognition and interpretation: this means assigning labels to objects based on
their descriptors (from the previous step), and assigning meanings to those labels.
Fig. 3 Representation of a grayscale digital image

3.2 Bolt-loosening technique via image processing The proposed bolt-loosening detection technique consists of 6 steps according to
the image processing tasks as shown in Fig. 4. In the first step, a digital image for a bolt joint in a steel bridge is acquired from a digital camera. In the second step, a splice plate on the bolt joint is extracted by using an edge detector and Hough transform. In the third step, perspective distortion of the extracted image, which is caused by picturing angle of the camera, is corrected. In the fourth step, parts of all nuts in the image are individually extracted by using circular Hough transform. In the fifth step, outlines of each nut are identified by an edge detector, and rotation angles of the nuts are estimated by using Hough transform. In the final step, the bolt-loosening is detected by investigating the changes between before and current the estimated rotation angles. Therefore Hough transform is a key method of the proposed bolt-loosening detection technique. The detail of each step is as follows.
Fig. 4 Bolt-loosening detection process using image processing Step 1: Taking a picture A bolt joint of a steel bridge is consisted of splice plates, bolts, nuts and washers. Because the bolt-loosening is occurred by rotation of the nuts, an image must be shot on an area including the nuts and the corresponding splice plate for the bolt-loosening detection. The image can be acquired by various cameras using CCD such as digital cameras, video cameras and cameras embedded in smart phones. Step 2: Extracting an image for a splice plate The splice plate image is extracted by the following two stages: (1) extracting outline of the splice plate and (2) finding four
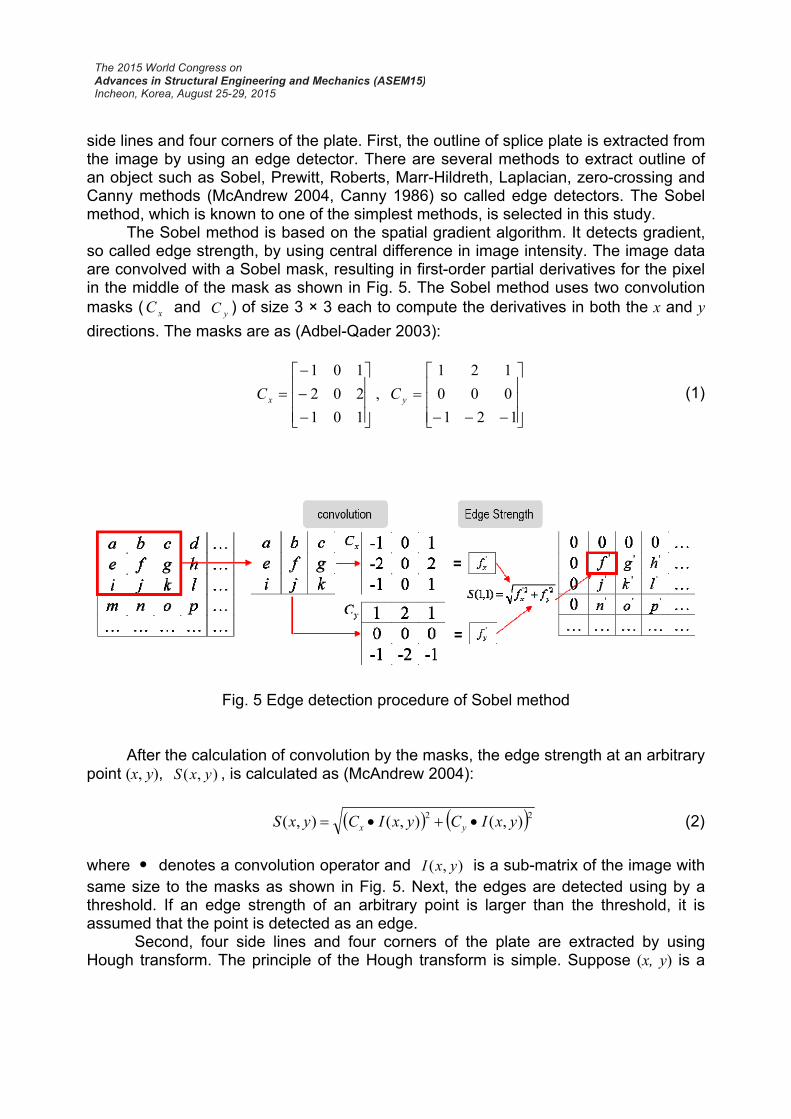
side lines and four corners of the plate. First, the outline of splice plate is extracted from the image by using an edge detector. There are several methods to extract outline of an object such as Sobel, Prewitt, Roberts, Marr-Hildreth, Laplacian, zero-crossing and Canny methods (McAndrew 2004, Canny 1986) so called edge detectors. The Sobel method, which is known to one of the simplest methods, is selected in this study.
The Sobel method is based on the spatial gradient algorithm. It detects gradient, so called edge strength, by using central difference in image intensity. The image data are convolved with a Sobel mask, resulting in first-order partial derivatives for the pixel in the middle of the mask as shown in Fig. 5. The Sobel method uses two convolution masks ( xC and yC ) of size 3 × 3 each to compute the derivatives in both the x and y
directions. The masks are as (Adbel-Qader 2003):
121
000
121
,
101
202
101
yx CC (1)
Fig. 5 Edge detection procedure of Sobel method
After the calculation of convolution by the masks, the edge strength at an arbitrary point (x, y), ( , )S x y , is calculated as (McAndrew 2004):
22 ),(),(),( yxICyxICyxS yx (2)
where denotes a convolution operator and ( , )I x y is a sub-matrix of the image with same size to the masks as shown in Fig. 5. Next, the edges are detected using by a threshold. If an edge strength of an arbitrary point is larger than the threshold, it is assumed that the point is detected as an edge.
Second, four side lines and four corners of the plate are extracted by using Hough transform. The principle of the Hough transform is simple. Suppose (x, y) is a

point in the image. We can write y=ax+b, and consider all pairs (a, b) which satisfy this equation, and plot them into an “accumulator array”. The (a, b) array is the “transform array”. Each point in the image is mapped onto a line in the transform as shown in Fig. 6. The points in the transform corresponding to the greatest number of intersections correspond to the strongest line in the image as shown in the right figure in Fig. 6. From Fig. 6, the two strongest lines can written as xy and 1y x . Note that the points found in the transform are (1, 0) and (1, -1). However, a vertical line cannot be expressed in the form y=ax+b, and so another parameterization of lines is used as:
ryx sincos (3) where r is the perpendicular distance from the line to the origin, and is the angle of the line’s perpendicular as shown in Fig. 7 (McAndrew 2004). When the four lines of the splice plate from the image are found, the four corners’ coordinates of the splice plate can be easily obtained from cross points of the lines. The coordinates are used for correcting perspective distortion in the next step.
Fig. 6 An image and its corresponding lines in the transform (McAndrew 2004)
Fig. 7 Representation of a straight line using r and

Step 3: Correcting perspective distortion of the splice plate When images are acquired by not fixed cameras, they have perspective distortion by picturing angle of the camera. Thus, the distortion must be corrected to improve the accuracy estimating the rotation angles of the nuts. The correction is performed by projective transformation so called homography. Let’s set an image coordinate and a world coordinate to
Tvui )1,,( and Tyxw )1,,( . Note that the image coordinate is corresponding to the estimate coordinate in the previous step and the world coordinate is corresponding to the real size of the splice plate. Relationship of the two coordinates can be written as:
11 12 13 1
21 22 23 2
31 32 31
T
T
T
h h h h w
i Hw h h h w h w
h h h w
(4)
where H is a homography matrix and T
jjjj hhhh )( 321 . When we use 4 points for the
each coordinate, we can calculate homography matrix by
111 1 1 1 1 1
121 1 1 1 1 1
132 2 2 2 2 2
212 2 2 2 2 2
223 3 3 3 3 3
233 3 3 3 3 3
314 4 4 4 4 4
324 4 4 4 4 4
1 0 0 0
0 0 0 1
1 0 0 0
0 0 0 1
1 0 0 0
0 0 0 1
1 0 0 0
0 0 0 1
hx y u x u y
hx y v x v y
hx y u x u y
hx y v x v y
hx y u x u y
hx y v x v y
hx y u x u y
hx y v x v y
1
1
2
2
3
3
4
4
u
v
u
v
u
v
u
v
(5)
By using the homography matrix, the geometrically corrected image is as shown in Fig. 8. Fig. 9 shows an example for the correction of perspective distortion.
Fig. 8 Correspondence of 4 points by using projection transformation

(a) Image of splice plate with perspective distortion (b) corrected image
Fig. 9 An example for correction of perspective distortion Step 4: Segmenting part of nut In general, tens bolts and nuts are installed on a splice plate and so the image must be segmented for each nut. The each nut image is extracted by the following two stages: (1) identifying circles of bolts ends and (2) segmenting each nut image. In the first stage, the circle of each bolt end is extracted from the image by using circular Hough transform. Circular Hough transform is extension of the Hough transform. In a two dimensional space, an equation of a circle is:
2 2 2( ) ( )cr x a y b (6) where a and b represent the x and y coordinates for the center of the circle, and cr is
the radius of the circle. As shown in the left of Fig. 10, let’s assume a circle with an arbitrary center point (a, b) and a known radius cr . For an fixed point (x1, y1), the Eq. (6)
can be rewritten as 2
12
12 )()( ybxarc (7)
Eq. (7) represents a circle with the center point (x1, y1) and the radius cr in a
transformed space with a and b axes. For all sets of (x, y), circles in the transformed space are drawn as shown in the right of Fig. 10. Then, we can obtain the center coordinate (a, b) of the circle in the image by finding the greatest number of intersections of the circles in the transformed space. Note that this process is similar to Hough transform. If the radius is not known, however, the process is repeated for all possible radiuses. It requires a larger computation time and memory of storage, therefore a specific range prior to running the application is set for simplicity.
In the second stage, the images for nuts are segmented by using the identified circles in the previous stage. Generally, a ratio between a bolt’s radius cr and a
distance from a center to a corner of a nut R is about 1.5~1.6 as shown in Fig. 11. From this fact, the image size L for each nut is selected by
crnL 2 (8)
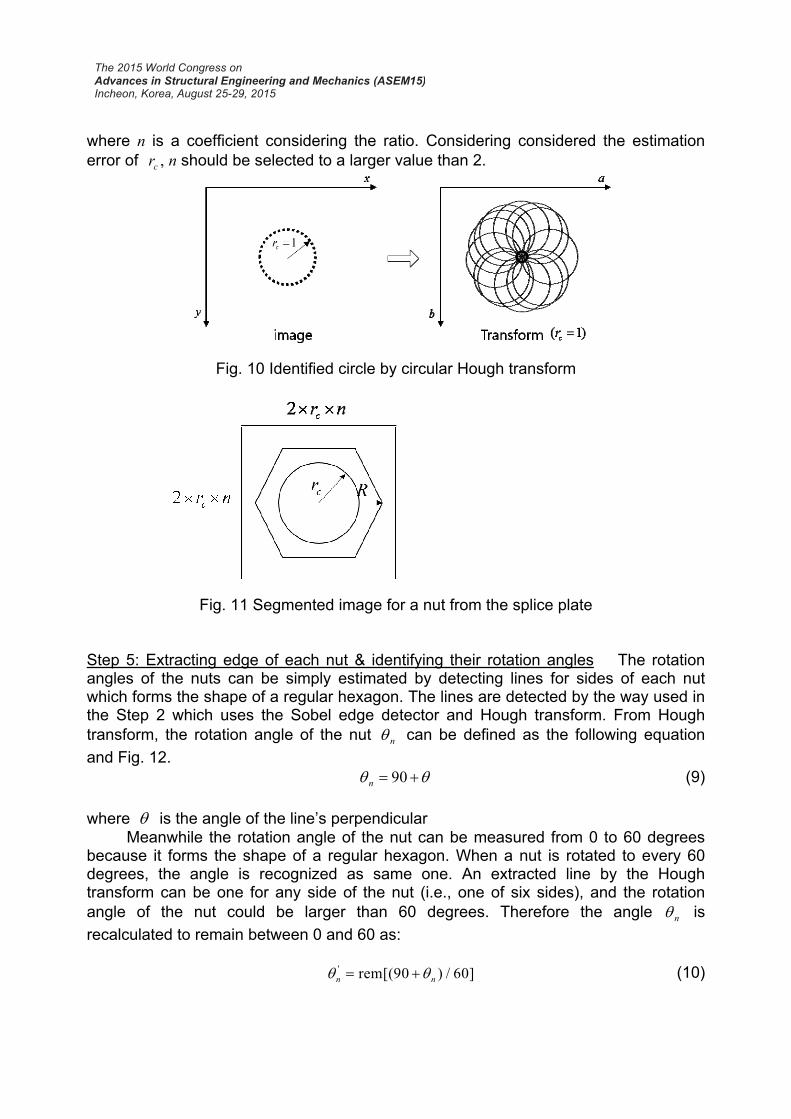
where n is a coefficient considering the ratio. Considering considered the estimation error of cr , n should be selected to a larger value than 2.
Fig. 10 Identified circle by circular Hough transform
Fig. 11 Segmented image for a nut from the splice plate Step 5: Extracting edge of each nut & identifying their rotation angles The rotation angles of the nuts can be simply estimated by detecting lines for sides of each nut which forms the shape of a regular hexagon. The lines are detected by the way used in the Step 2 which uses the Sobel edge detector and Hough transform. From Hough transform, the rotation angle of the nut n can be defined as the following equation
and Fig. 12. 90n (9)
where is the angle of the line’s perpendicular
Meanwhile the rotation angle of the nut can be measured from 0 to 60 degrees because it forms the shape of a regular hexagon. When a nut is rotated to every 60 degrees, the angle is recognized as same one. An extracted line by the Hough transform can be one for any side of the nut (i.e., one of six sides), and the rotation angle of the nut could be larger than 60 degrees. Therefore the angle n is
recalculated to remain between 0 and 60 as:
' rem[(90 ) / 60]n n (10)

where ]rem[ is an operator to calculate the remainder after division.
Fig. 12 Identified line from Hough transform and rotation angle of nut Step 6: Detecting bolt-loosening The nut is loosened counter-clockwise. If the rotation angle of the nut estimated from a current image is smaller than one from a previous image, the bolt-loosening is easily detected. However, the proposed technique has measurement errors and the errors should be considered in the making decision. The final decision can be made as:
loosened. isbolt then if 'en (11)
where e is the maximum measurement error.
The proposed technique can be applied for the bolt joint inspection and monitoring. For the monitoring, the amount of bolt-loosening can be continuously measured by accumulation of the change in the rotation angle of the nut. For the inspection, the technique may give a false-negative detection result for the bolt-loosening because it has the measurement error and cannot detect when the nut is rotated to about 60 degrees. In this study, a bolt-loosening detection rate is defined to evaluate the performance of the proposed technique as the following Eq. (12).
(%)100360
6360
e (12)
4. EXPERIMENTAL VERIFICATION
4.1 Experimental Setup In order to evaluate the applicability of the proposed technique, experimental tests
were performed for a bolt joint model. The bolt joint model was consisted of a splice plate, and eight bolts and nuts. The splice plate was made by steel with length (L) of

310 mm, height (H) of 200 mm and thickness (t) of 10 mm as shown in Fig. 13. Eight standard bolts and nuts, M20, were used. The bolts and nuts were installed by 2 × 4 array, and the distances between the centers of bolts are 70 mm in the horizontal direction and 100 mm in the vertical direction. Also, the bolt joint model is coated by gray anticorrosive paint to simulate real steel structures.
A digital camera (D7000 model by Nikon Co.) was used to take pictures of the splice plate. The camera was fixed by a tripod and approximately set to that the center of the camera screen locate at the center of the splice plate as shown in Fig. 14. The pictures were shot by using the maximum resolution (3253×4928 pixels). At taking the pictures, the camera was set to turn on the camera flash to remove shadows of the nuts by fluorescent lamps.
The initial condition of the bolt joint model is shown in Fig. 15. In Fig. 15, numbers in circles are the initial rotation angles of the nuts measured by a digital goniometer. A bolt-loosening scenario was selected as shown in Table 1. Firstly, Bolt 1 is loosened to 5, 15 and 45 degrees step by step. Then Bolt 7 is loosened to 12, 23 and 57 degrees step by step. Therefore total 7 cases including the initial condition were used to simulate bolt-loosening. For each cases, 10 pictures were shot to evaluate the measurement error of the proposed technique.
Fig. 13 Main dimensions of bolt joint model

Fig. 14 Experimental Setup
Fig. 15 Initial condition of bolt joint model
Table 1. Bolt-loosening scenario
Case Loosened Bolt No. of Pictures Intact - - 10 Damage 1 Bolt 1 5 10 Damage 2 Bolt 1 15 10 Damage 3 Bolt 1 45 10 Damage 4 Bolt 7 12 10 Damage 5 Bolt 7 23 10 Damage 6 Bolt 7 57 10
4.2 Bolt-loosening Detection Results Fig. 16 shows edge detection and line detection results by the Sobel edge detector and Hough transform as described in Step 2 of Chapter 3. For the edge detection, the threshold is set to 0.03, the four lines in Fig. 16(c) are manually selected by checking each line. The four circles in the Fig. 16(c) are identified corners. As shown in Fig. 16(c), the image of the splice plate is distorted a little. Note that the picture was shot in front of the plate as possible.

(a) Orignal image (b) edge image (c) identifed lines of plate
Fig. 16 Identified splice plate by Hough transform
Fig. 17(a) shows a corrected image for perspective distortion by using the identified corners, he known size of the plate and Eq. (4). As shown in Fig. 17(a), the distorted image is projected to a rectangular shape corresponding to the size of the splice plate. Fig. 17(b) shows circles, which means bolt ends, found by using circular Hough transform. Eight circles are exactly identified. Fig. 18 shows images segmented by using Eq. (8) with n=2. Fig. 19 shows identified side lines of the all nuts by Hough transform. For each nut, the first 3 strongest lines are selected to estimate the rotation angle by averaging the angles of lines. Fig. 20 shows rotation angles of the nuts identified by the Hough transform in the initial condition. Also, the angles are compared with ones measured by the goniometer. As shown in Fig. 20, the estimated angles by the proposed method are good matched to ones by the goniometer with the error of ±2 degrees.
(a) Corrected image for distortion (b) circles found by circular Hough transform
Fig. 17 Corrected image and identified circles
Fig. 18 Segmented images for the nuts

Fig. 19. Identified side lines of the nuts by Hough transform
(a) Initial rotation angle (b) Measurement errors
Fig. 20 Rotation angles of nuts estimated in the initial condition
Fig. 21 shows the changes in the rotation angles of the nuts estimated by the proposed technique. As shown in Fig. 21, the loosened Bolt 1 and Bolt 7 were exactly detected and the rotation angles of all nuts estimated within error of ±2 degrees. From the results, the error of the proposed technique was estimated to ±2 degrees. That is, if the change in rotation angle of a nut is larger than 2 degrees, the bolt-loosening can detected. Note that minus value of the change means that the bolt is tightened but it cannot be naturally occurred in real structures. By using the Eq. (12), the bolt-loosening detection rate is 93.3%.

Fig. 21 Bolt-loosening detection results
5. CONCLUSIONS AND REMARKS In this study, a novel bolt-loosening detection technique using image information of bolted joints in steel bridges was presented. Firstly, existing bolt-loosening detection techniques were analyzed by reviewing them. Secondly, a bolt-loosening detection

algorithm using the image processing technologies was newly proposed. It consists of 6 steps: (1) taking a picture for a bolt joint, (2) extracting an image for a splice plate from the picture, (3) correcting perspective distortion of the image for the splice plate, (4) segmenting the image for each nut, (5) extracting edge of each nut and identifying their rotation angles, and (6) detecting bolt-loosening by comparing with the pre-identified nut angles. As a key technique, the line Hough transform was used to identify the splice plate and the rotation angles of nuts, and the circular Hough transform was used to segment the image for each nut. Finally, the applicability of the proposed technique was evaluated by experimental tests with several bolt-loosening scenarios. A test specimen consisting of a splice plate, 8 bolts and 8 nuts with 2×4 array was used for the tests.
From the results, the nut angles estimated by the proposed technique were good matched to ones by the goniometer with the error of ±2 degrees. Furthermore, the proposed technique found the change in the nut angles and detected bolt-loosening exactly within the error of ±2 degrees. From the error, the bolt-loosening detection rate by the proposed technique was estimated to 93.3%. The proposed technique can be applied for bolt-loosening inspection as well as continuous monitoring. In order to implement in real structures, however, the following studies are needed as:
(1) To reduce measurement error: the image processing techniques used in this study are traditional ones. If improved techniques are utilized, the measurement error might be reduced and the bolt-loosening detection rate could be increased.
(2) To reduce calculation time: calculation time was about 4.1 seconds for the 8 bolts in this study. Because much more bolts are investigated in real structures, calculation time should be reduced for field applications. REFERENCES Abdel-Qader, I., Abudayyeh, O. and Kelly, M.E. (2003), “Analysis of edge-detection
techniques for crack identification in bridges”, Journal of Computing in Civil Engineering ASCE, 17(4), 255-263.
Canny, J.F. (1986), “A computational approach to edge detection”, IEEE Transactions on Pattern Analysis and Machine Intelligence, 8(6), 679-698.
Choi, K.Y. and Kim, S.S. (2005), “Morphological analysis and classification of types of surface corrosion damage by digital image processing”, Corrosion Science, 47, 1-15.
Fukuda, Y., Feng, M.Q., Narita, Y., Kaneko, S. and Tanaka, T. (2013), “Vision-based displacement sensor for monitoring dynamic response using robust object search algorithm”, IEEE Sensor Journal, 13(12), 4725-4732.
Ho, H.N., Kim, K.D., Park, Y.S. and Lee, J.J. (2013), “An efficient image-based damage detection for cable surface in cable-stayed bridges”, NDT&E International, 58, 18-23.
Ho, H.N., Lee, J.H., Park, Y.S. and Lee, J.J. (2012), “A synchronized multipoint vision-based system for displacement measurement of civil infra structures”, The Scientific World Journal, 2012, Article ID 519146, 1-9.
Hutchinson, T.C., and Chen, Z. (2006), “Improved image analysis for evaluating concrete damage”, Journal of Computing in Civil Engineering, 20(3), 200-216.

Hyun, S.H. (2013), “The study on inspection for relaxation of bolted joins by electric potential drop method”, Master’s thesis, Chung-Ang University (In Korean).
Kim, J.T., Nguyen, K.D., and Hyunh, T.C. (2013), “Wireless health monitoring of stay calbe using piezoelectric strain response and smart skin technique”, Smart Structures and Systems, 9(4), 381-397.
Kim, J.T., Park, J.H., Hong, D.S., Ho, D.D. (2011), “Hybrid acceleration-impedance sensor nodes on Imote2-platform for damage monitoring in steel girder connections”, Smart Structures and Systems, 7(5), 393-416.
Kim, N. and Hong, M. (2009), “Measurement of axial stress using mode-converted ultrasound”, NDT and E International, 42(3), 164-169.
Korea Expressway Corporation (2006), “Performance optimization of steel bridge coating diagnosing system for field application”, Research Report (In Korean).
Korea Expressway Corporation (2013), “Improvement of bridge inspection system by the damage analysis”, Research Report (In Korean).
Korea Infrastructure Safety & Technology Corporation (2008), “Guideline for bridge inspection”, Technical Report (In Korean).
Lee, J.J., Fukuda, Y., Shinozuka, M., Cho, S. and Yun, C.B. (2007), “Development and application of a vision-based displacement measurement system for structural health monitoring of civil structures”, Smart Structures and Systems, 3(3), 373-384.
Lee, S., Chang, L.M. and Skibniewski, M. (2006), “Automated recognition of surface defects using digital color image processing”, Automation in Construction, 15, 540-549.
McAndrew, A. (2004), An introduction to digital image processing with matlab, Course Technology Press, Boston, MA, USA.
Nagayama, T., Sim, S.H., Miyamori, Y. and Spencer, B.F. (2007), “Issues in structural health monitoring employing smart sensors”, Smart Structures and Systems, 3(3), 299-320.
Subirats, P., Dumoulin, J., Legeay, V. and Barba, D. (2006), “Automation of pavement surface crack detection using the continuous wavelet transform”, Proceeding of 2006 IEEE International Conference on Image Processing, 8-11 Oct., Atlanta, USA.
Wang, T., Song, G., Liu, S., Li, Y. and Xiao, H. (2013), “Review of Bolted Connection Monitoring”, International Journal of Distributed Sensor Networks, 2013, Article ID 871213, 1-8.
Yamaguchi, T. and Hashimoto, S. (2010), “Fast crack detection method for large-size concrete surface images using percolation-based image processing”, Machine Vision and Applications, 21, 797-809.
You, Y.J., Park, K.T., Lee, W.S. and Han, S.H. (2010), “Development of information detection unit on the loosening of bolted joints using USN technology”, Proceeding of Korea Society of Civil Engineers (KSCE) Conference & Expo 2010, Korea (In Korean).
Yun, C.B., Lee, J.J. and Koo, K.Y. (2011), “Smart structure technologies for civil infrastructures in Korea: recent research and application”, Structure and Infrastructure Engineering, 7(9), 673-688.
Zou, Q., Cao, Y., Li, Q., Mao, Q. and Wang. S. (2012), “CrackTree: automatic crack detection from pavement images”, Pattern Recognition Letters, 33, 227-238.