
Jacques Jiha, Ph.D., Director Message of the Mayor
249
The City of New York Executive Budget Fiscal Year 2022 Bill de Blasio, Mayor Mayor's Office of Management and Budget Jacques Jiha, Ph.D., Director Message of the Mayor
Transcript of Jacques Jiha, Ph.D., Director Message of the Mayor

The City of New YorkExecutive BudgetFiscal Year 2022
Bill de Blasio, Mayor
Mayor's Office of Management and BudgetJacques Jiha, Ph.D., Director
Message ofthe Mayor

The City of New YorkExecutive BudgetFiscal Year 2022
Bill de Blasio, MayorMayor’s Office of Management and Budget
Jacques Jiha, Ph.D., DirectorApril 26, 2021
Message ofthe Mayor

BUDGET AND FINANCIAL PLAN SUMMARY Budget and Financial Plan Overview .......................................................................... 3 State and Federal Agenda ........................................................................................................... 4 Sandy Recovery .......................................................................................................................... 6 Contract Budget .......................................................................................................................... 9 Community Board Participation in the Budget Process ............................................................ 10 Economic Outlook .................................................................................................. 11 Tax Revenue .......................................................................................................... 27 Miscellaneous Receipts ............................................................................................ 52 Capital Budget ........................................................................................................ 58 Financing Program .................................................................................................. 76ANALYSIS OF AGENCY BUDGETS Department of Education ............................................................................................................ 87 Administration of Justice .......................................................................................... 96 Police Department ................................................................................................... 100 Department of Correction ........................................................................................................... 106 Departments of Social and Homeless Services:
Department of Social Services ............................................................................. 110 Department of Homeless Services ........................................................................ 120
Administration for Children’s Services ........................................................................ 124 Department of Youth and Community Development ................................................................ 133 Department for the Aging ......................................................................................... 138 Department of Health and Mental Hygiene .................................................................. 142 Fire Department ...................................................................................................... 154 Department of Sanitation .......................................................................................... 158 Department of Parks and Recreation ........................................................................... 163 Department of Environmental Protection ..................................................................... 168 Department of Transportation .................................................................................... 176 Housing Preservation and Development ...................................................................... 181 Department of Citywide Administrative Services .......................................................... 187 Department of Information Technology and Telecommunications .......................... 194 Economic Development ........................................................................................... 198 Libraries ................................................................................................................ 204 Department of Cultural Affairs .................................................................................. 209 City University of New York ....................................................................................................... 213 Pensions and Other Fringe Benefits ............................................................................ 220 Judgments and Claims ............................................................................................. 224COVERED ORGANIZATIONS New York City Health + Hospitals ............................................................................. 227 New York City Transit ............................................................................................. 230APPENDIX Exhibit 1: Expenditure Assumptions Fiscal Years 2021-2025 ........................................ 237 Exhibit 2: Fiscal Year 2022 Executive Budget & Projections, FY 2023-2025 ................... 242 Exhibit 3: Actual Revenue: Fiscal Years 2017-2020 .................................................... 244 Exhibit 4: Revenue Estimates: Fiscal Years 2021-2025 ................................................ 245 Exhibit 5: Full-Time and Part-Time Positions (FTEs) ................................................... 247 Exhibit 6: Fiscal Year 2022 Citywide Savings Program ......................................................... 248
Contents

Printed on paper containing 30% post-consumer material.

Budget and FinancialPlan Summary
1
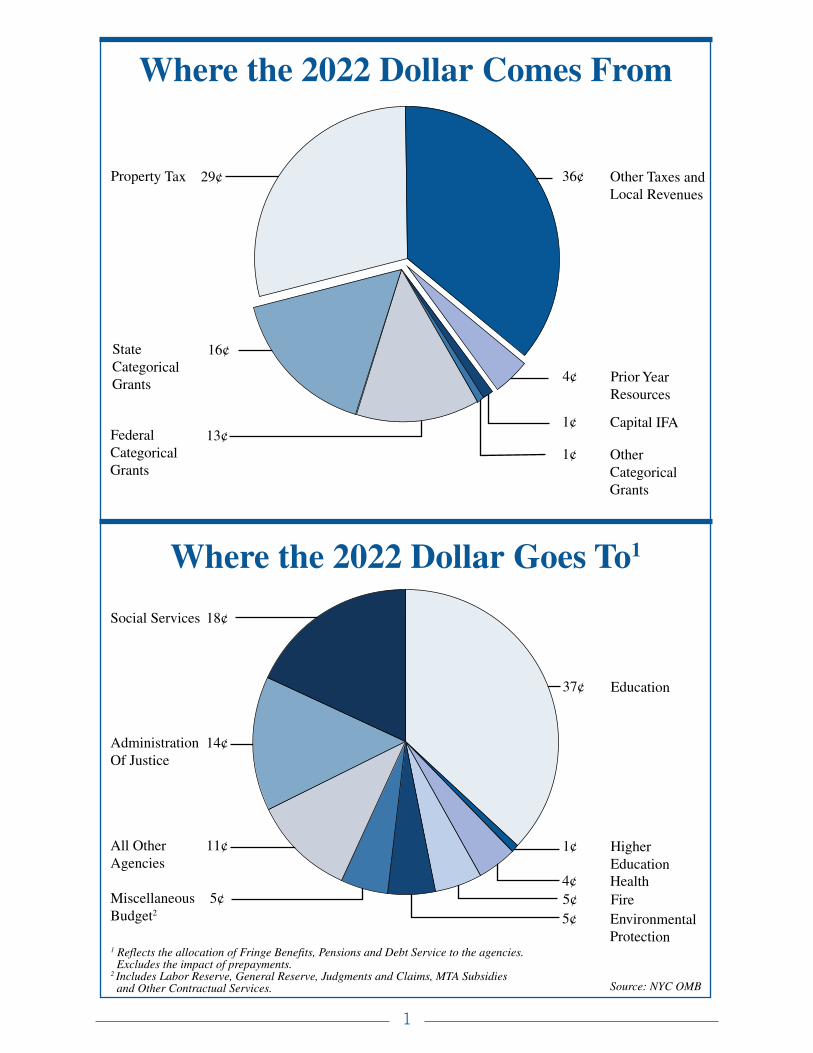
5¢ Fire
Where the 2022 Dollar Comes From
Property Tax 29¢
Federal 13¢CategoricalGrants
State 16¢CategoricalGrants 4¢ Prior Year
Resources
36¢ Other Taxes and Local Revenues
Where the 2022 Dollar Goes To1
All Other 11¢Agencies
Administration 14¢Of Justice
37¢ Education
1 Reflects the allocation of Fringe Benefits, Pensions and Debt Service to the agencies. Excludes the impact of prepayments.2 Includes Labor Reserve, General Reserve, Judgments and Claims, MTA Subsidies and Other Contractual Services.
Social Services 18¢
1¢ Higher Education4¢ Health
5¢ Environmental Protection
Miscellaneous 5¢Budget2
1¢ Capital IFA
1¢ Other Categorical Grants
Source: NYC OMB

Budget and Financial Plan Summary Fiscal Year 2022
3
BUDGET AND FINANCIAL PLAN OVERVIEW
The Fiscal Year 2022 Executive Expense Budget is $98.6 billion. This is the forty-second consecutive budget which is balanced under Generally Accepted Accounting Principles (GAAP), except for the application of Statement No. 49 of the Governmental Accounting Standards Board (“GASB 49”) which prescribes the accounting treatment of pollution remediation costs, and without regard to changes in certain fund balances described in General Municipal Law 25. The following chart details the revenues and expenditures for the five year financial plan.
($ in Millions)_______________________________________________________________________________________________________________________________________________________________________________________________________________
FY 2021 FY 2022 FY 2023 FY 2024 FY 2025_______________________________________________________________________________________________________________________________________________________________________________________________________________
Revenues Taxes: General Property Tax ..................... $30,954 $29,370 $30,042 $30,471 $30,881 Other Taxes .................................... 30,307 32,065 34,674 36,372 37,833 Tax Audit Revenue ........................ 1,171 921 721 721 721 _____ ____________ _____ ____________ _____ ____________ _____ ____________ _____ ____________
Subtotal - Taxes ............................ $62,432 $62,356 $65,437 $67,564 $69,435
Miscellaneous Revenues ...................... 7,239 6,873 6,887 6,878 6,891 Unrestricted Intergovernmental Aid ..... 1 — — — — Less: Intra-City Revenues .................... (2,091) (1,891) (1,858) (1,858) (1,853) Disallowances Against Categorical Grants .............................. (15) (15) (15) (15) (15) _____ ____________ _____ ____________ _____ ____________ _____ ____________ _____ ____________
Subtotal - City Funds ..................... $67,566 $67,323 $70,451 $72,569 $74,458
Other Categorical Grants ...................... 1,121 1,025 993 991 990 Inter-Fund Revenues ............................ 658 725 725 725 725 Federal Categorical Grants ................... 16,305 13,566 9,157 8,598 7,904 State Categorical Grants ....................... 15,011 15,921 16,305 16,624 16,874 _____ ____________ _____ ____________ _____ ____________ _____ ____________ _____ ____________
Total Revenues ..................................... $100,661 $98,560 $97,631 $99,507 $100,951 =========== ========== ========== ========== ==========
Expenditures Personal Service: Salaries and Wages ........................ $29,294 $31,086 $30,740 $30,875 $31,158 Pensions ......................................... 9,503 10,263 10,468 10,660 10,597 Fringe Benefits ............................. 11,295 12,382 11,846 12,940 13,897 _____ ____________ _____ ____________ _____ ____________ _____ ____________ _____ ____________
Subtotal – Personal Service ........... $50,092 $53,731 $53,054 $54,475 $55,652
Other Than Personal Service: Medical Assistance ........................ 6,140 6,418 6,494 6,494 6,494 Public Assistance ........................... 1,604 1,651 1,650 1,650 1,650 All Other ........................................ 38,706 34,891 32,555 32,408 32,342 _____ ____________ _____ ____________ _____ ____________ _____ ____________ _____ ____________
Subtotal – Other Than Personal Service .......................... $46,450 $42,960 $40,699 $40,552 $40,486
Debt Service1,2 ...................................... 6,351 7,088 8,391 8,788 9,352 FY 2020 Budget Stabilization1 ............. (3,819) — — — — FY 2021 Budget Stabilization2 ............. 3,628 (3,628) — — — Capital Stabilization Reserve ............... — — 250 250 250 General Reserve ................................... 50 300 1,000 1,000 1,000 Less: Intra-City Expenses .................... (2,091) (1,891) (1,858) (1,858) (1,853) _____ ____________ _____ ____________ _____ ____________ _____ ____________ _____ ____________
Total Expenditures................................ $100,661 $98,560 $101,536 $103,207 $104,887 =========== ========== ========== ========== ==========
Gap To Be Closed ...................................... $— $— $(3,905) $(3,700) $(3,936)_______________________________________________________________________________________________________________________________________________________________________________________________________________
1 Fiscal Year 2020 Budget Stabilization totals $3.819 billion, including GO of $1.269 billion and TFA-FTS of $2.550 billion.
2 Fiscal Year 2021 Budget Stabilization totals $3.628 billion, including GO of $946 million and TFA-FTS of $2.682 billion.

Budget and Financial Plan Summary Fiscal Year 2022
4
STATE AND FEDERAL AGENDA
STATE
The State Executive Budget proposal included $619 million in cuts and cost shifts, with $310 million of these cuts proposed for FY21 and $309 million proposed for FY22.
As a result of actions taken by the Legislature, the
Enacted Budget rejected most of the proposed cuts in the Executive Budget, including the supplantation of $800 million in State education support with Federal aid, reducing Health + Hospitals (H+H) funding by $139 million in FY21 and $334 million in FY22, and significant cuts in Social Services and Health. The Enacted Budget also provided the State with the ability to refinance the bonds of the Sales Tax Asset Receivable Corp (STAR), including a payment to of $46 million, which would be available to the City following such refinancing.
In Education, the Enacted Budget committed to fully funding the Campaign for Fiscal Equity (CFE) over three years ($530 million in SY21-22, $270 million in SY22-23, and $270 million in SY23-24). Additionally, cuts in other key areas were restored, including charter school facilities aid ($150 million restored in FY21 and $100 million in FY22), the queue of prior year aid ($28 million in FY22), and Teachers of Tomorrow and Teacher Mentor Program ($17 million in FY22).
For Social Services, the Enacted Budget restored $28.3 million in FY21 and $43.8 million in FY22 by rejecting a 5% across-the-board cut to key services. The restored funding will provide increased support for the Foster Care Block Grant, Child Welfare Preventative Services, Adoption Subsidies, Adult Shelter Reimbursements, Adult Protective Services, and grants for care and supervision of youth in secure and non-secure detention.
The Enacted Budget rejected significant reductions to Health, including 20% cuts scheduled for tobacco enforcement activities, tuberculosis services and the affiliated public health campaign, and the Nurse-Family Partnership program, which provides support and services to new mothers. The Enacted Budget also rejects Executive proposals to reduce NYC reimbursement for core health service areas, decrease local aid for mental health services, and cut funding for school-based health centers. In total, the Enacted budget restores $4 million in FY21 and $50 million in FY22 for Health programs and initiatives.
The Enacted budget also restored most cuts to Health + Hospitals. Notable actions include the delay of Medicaid Pharmacy Carve-out of Managed Care ($37 million in FY21 and $150 million in FY22), the Executive’s proposed 1% across-the-board Medicaid reduction, and the continuation of the State Share of the Public Indigent Care Pool (which account for $15 million in FY21 and $60 million in FY22 each). Coupled with other significant restorations, the Enacted Budget rejects cuts of $74 million in FY21 and $312 million in FY22 for H+H.
The Enacted Budget maintains several cuts from the Executive Budget. Funding for Health + Hospitals included a 5% decrease for infrastructure improvements in hospitals typically covered by Medicaid ($3.5 million in FY22) and accepted the Executive's proposed Medicaid managed care rate claw back ($65 million in FY21 and $21.7 million in FY22). In Transportation, state support for the Staten Island Ferry was reduced by $1.3 million in FY21 and $5.2 million in FY22. The Enacted Budget also included a $25 million reduction in reimbursement for school transportation in FY21.
The Enacted Budget also rejected language that allowed the New York State Division of Budget (NYS DOB) to periodically reduce appropriations.
FEDERAL
On March 13, 2020, President Trump declared a national emergency concerning the novel coronavirus disease (COVID-19) outbreak. Since March 2020, several administrative actions have been utilized to help address the effects of the pandemic, including an Executive Order by President Biden that increased FEMA reimbursement to 100% through September 2021. As a result of these actions, NYC projects $1.37 billion in federal support. We expect to receive additional allocations in the coming months.
In addition to administrative actions, four stimulus bills and two supplemental appropriations bills have been signed into law. Congress approved two of the stimulus measures in the current City fiscal year—in December 2020 and March 2021.
The Coronavirus Response and Relief Supplemental Appropriations Act, 2021 (CRRSA), enacted on December 27th, 2020, included $868 billion of federal support to help mitigate the economic

Budget and Financial Plan Summary Fiscal Year 2022
5
impact of the COVID-19 pandemic. Of this amount, $82 billion was directed toward education aid through the Education Stabilization Fund, of which two-thirds supported elementary and secondary education learning. The enacted State FY2021-22 budget allocates $2.15 billion in CRRSA K-12 education funds to New York City. This funding can support a broad variety of uses, including maintenance of operations and continuity of services; preparedness and response to COVID-19; purchase of PPE and improvement of school facilities to reduce the risk of transmitting the coronavirus; programming to address learning loss; and other activities authorized under existing education law.
The CRRSA also provides $22 billion for COVID-19 testing, contact tracing, and mitigation efforts. NYC has received notification that $555 million has been allocated for the City. The stimulus aid also funds relief programs targeted to small businesses, direct payments to individuals, increased unemployment benefits, and aid for transportation and social services programs.
The American Rescue Plan (ARP), enacted on March 11, 2021, provides $1.9 trillion in additional federal stimulus relief in several areas, including $130 billion in direct aid to local governments. NYC has been awarded $5.9 billion in coronavirus local fiscal recovery funds over two years. The US Treasury is developing guidance on permissible uses. The legislation also includes additional education aid totaling $170 billion, most of which is allocated to help facilitate the safe reopening of K-12 schools and higher education institutions, and is eligible for the same uses as education aid included in the CRRSA. The enacted State FY2021-22 budget allocates $4.8 billion in K-12 education funds to New York City. In total, NYC has received $7 billion through the K-12 funds appropriated by both the CRRSA and ARP. The ARP also provides additional funding for vaccines and testing (for which NYC has been notified of $345 million), direct relief to residents, extension of unemployment benefits, tax incentives in the form of tax credits, funding for small businesses, emergency rental assistance, and relief to prevent homelessness. The City also received $269 million in homelessness assistance grants through the ARP.
In total, the Executive Budget reflects approximately $15.25 billion in additional funds from federal stimulus and administrative actions.
There is no budget for FFY22 as of this point. The appropriations process is a multi-step process that involves agency budget requests, the President’s Budget, House and Senate Appropriations Committees and Subcommittees, hearings, and twelve spending bills. These appropriations bills must be enacted prior to the start of the 2022 Federal Fiscal Year, which begins October 1, 2021. In the past, however, Congress has used Continuing Resolutions to extend funding for agencies at current-year levels when they are unable to complete appropriations before the new fiscal year begins.

Budget and Financial Plan Summary Fiscal Year 2022
6
SANDY RECOVERY AND RESILIENCY
Sandy’s Impact on the City and its Communities
When Hurricane Sandy made landfall on October 29, 2012, it caused devastation in all five boroughs of New York City and claimed the lives of 44 people. The City has made substantial and meaningful progress in its Sandy recovery over the eight-and-a-half years since the storm occurred, including the construction of resilient infrastructure, and repair work in residents’ homes, businesses, and communities. Investments from Sandy allow the City to enhance its ability to withstand future disasters related to climate change and to reduce risk to life and property.
Hurricane Sandy Expense and Capital Cost Estimates by Agency ($ in millions)
Capital - Capital - Expense Repair Mitigation Total
Health + Hospitals (H+H)1 .......................................................... $127 $987 $757 $1,871 Parks ............................................................................................. 97 774 245 1,116 DEP .............................................................................................. 617 263 295 1,175 Education (DOE and SCA) .......................................................... 95 549 192 836Transportation (DOT)2 ................................................................. 10 758 5 773Police Department ........................................................................ 202 85 11 298Fire Department ........................................................................... 25 208 4 237Sanitation ..................................................................................... 177 32 11 220All Other Agencies ...................................................................... $171 $658 $120 $949 Subtotal ........................................................................................ $1,521 $4,314 $1,640 $7,475
------------------ ------------------ ------------------ ------------------New York City Housing Authority3.............................................. 268 1,464 1,458 3,190
------------------ ------------------ ------------------ ------------------Grand Total ................................................................................. $1,789 $5,778 $3,098 $10,665
========= ========= ========= =========
1. 1. Total estimates include $1.73 billion for H+H 428 PAAP grants for four hospitals.2. Transportation includes $630 million of Federal Highway Administration and Federal Transit Administration funding.3. NYCHA figures include damages to be covered by approximately $421 million of insurance.
Data as of March 29, 2021
Funding for Sandy Recovery: Infrastructure and Community Investment
Funding for Sandy Recovery has come primarily from two sources, the Federal Emergency Management Agency (FEMA), and the U.S. Department of Housing and Urban Development (HUD), totaling approximately $15 billion.
FEMA funding supports the City’s costs for emergency response and repairs to damaged infrastructure including resiliency improvements. The overall cost of the City’s FEMA-funded emergency response and infrastructure recovery is projected to be about $10.7 billion. Of the $10.6 billion in federal grants secured, the City has been reimbursed over $4.8 billion to date.

Budget and Financial Plan Summary Fiscal Year 2022
7
HUD provides funding through the Community Development Block Grant–Disaster Recovery (CDBG-DR) program to cover unmet recovery needs remaining after all other funding sources are accounted for in the areas of housing, assistance for businesses, and long-term resiliency improvements. The City was awarded $4.2 billion in CDBG-DR funds and has been reimbursed over $3.74 billion to date, or approximately 89% of the grant. Additionally, the City was awarded $176 million in competitive CDBG-National Disaster Resilience (CDBG-NDR) funds from HUD for coastal protection work in Lower Manhattan.
CDBG-Disaster Recovery Funding($ in millions)
Program Area Total Funding
Housing $3,002 Build It Back Single Family 2,263 Build It Back Multifamily 411 NYCHA 317 Other 11 Business $91 Infrastructure and Other City Services $404 Coastal Resiliency $432 Rebuild by Design - East Side Coastal Resiliency 338 Rebuild by Design - Hunts Point 20 Other 74 Planning/Admin $285 ___________Total $ 4,214
CDBG-National Disaster Resilience Funding($ in millions)
Total $ 176
Source: www.nyc.gov/cdbgdr
Recovery Accomplishments
Much has been accomplished in the eight-and-a-half years since Sandy. The expense-budgeted emergency response activities conducted by City agencies are largely over, with anticipated reimbursements from FEMA for emergency work estimated at $1.8 billion.
The City has partnered with FEMA to pursue innovative approaches to improving long-term recovery efforts. For example, the City is the largest participant in FEMA’s 428 Public Assistance Alternative Procedures pilot program designed to expedite disaster recovery and was awarded both the largest and second largest disaster assistance grants in the history of the FEMA Public Assistance program. The City’s pioneering approach to the 428 program resulted in more than $6.0 billion of funding that the City is optimizing to rebuild damaged assets in a more resilient and useful fashion. Examples include elevation of critical building infrastructure, upgrading miles of conduit throughout the City, major
redesign of City hospitals, and rebuilding Rockaway Boardwalk in a manner that protects the structure in the long-term.
One of the primary investments of CDBG-DR funds has been the Build It Back program, which assists homeowners and tenants with the resources necessary to recover and make their homes and communities more resilient. Construction work on the Build It Back Single Family program has been substantially completed, with the remaining work focused on reconciling contracts and homeowner awards for close-out. Work on a handful of multifamily developments and on public housing under the jurisdiction of the New York City Housing Authority continues, and the vast majority of funding has been disbursed. For small businesses, financial assistance has been disbursed, and the remaining work is focused on preparedness and resiliency.

Budget and Financial Plan Summary Fiscal Year 2022
8
Preparing for a Protected City and Resilient Neighborhoods
Remaining work for Sandy recovery is primarily associated with large-scale resilient infrastructure and coastal protection projects. These infrastructure repair, coastal protection and mitigation projects are funded significantly by federal resources from FEMA and HUD and include City funds, as outlined in the City’s over $20 billion resiliency plan. Highlights of these projects include the following:
• NYCHA: 33 housing developments at $3.2 billion.
• H+H: four hospitals (Coney Island, Bellevue, Metropolitan, and Coler) at $1.8 billion.
• East Side Coastal Resiliency: coastal protection along the East Side of Manhattan from East 25th Street to Montgomery Street at $1.78 billion, an increase at this Executive Plan.
• DPR: beaches, parks, and recreational facilities estimated at $1.2 billion.
• DEP: wastewater treatment plants and pump stations citywide estimated at $1.2 billion.
• SCA: 43 public schools across the five boroughs estimated at $793 million.
• DOT: transportation infrastructure (roads, ferries, and lighting systems) estimated at $773 million.
• Brooklyn Bridge to Montgomery Coastal Resiliency (BMCR): critical coastal protection as part of the larger Lower Manhattan Coastal Resiliency (LMCR) investments, with funding of $522.7 million, an increase at this Executive Plan.
• Additional investments: coastal protection work is also being done for the Rockaways, Coney Island, the South Shore of Staten Island, and other vulnerable shorelines across the City.

Budget and Financial Plan Summary Fiscal Year 2022
9
CONTRACT BUDGET
The Contract Budget is presented as part of the 2022 Executive Budget submission. The Contract Budget includes all projected expenditures for contracts that are personal service, technical or consulting in nature, as defined in Section 104 of the City Charter. Purchase orders and open market orders, as well as small purchases that do not require registration by the Comptroller’s Office, are included in the Contract Budget. Contracts for the purchase of supplies, materials and equipment are not included.
The 2022 Executive Contract Budget contains an estimated 17,955 contracts totaling approximately $19.11 billion. Over 76 percent of the total contract budget dollars will be entered into by the Department of Social Services, the Administration for Children’s Services, the Department of Homeless Services, the Department of Health and Mental Hygiene and the Department of Education. The Administration for Children’s Services has $1.54 billion in contracts, approximately 64 percent of which represents contracts allocated for Children’s Charitable Institutions ($494 million) and Day Care ($489 million). Of the $9.18 billion in Department of Education contracts, approximately 47 percent of the contracts are allocated for Transportation of Pupils ($1.58 billion) and Charter Schools ($2.74 billion).
Each agency’s Contract Budget is delineated by object code within the agency’s other than personal service units of appropriation. The Executive Budget Supporting Schedules further break down the Contract Budget by budget code within unit of appropriation. All object codes in the 600 object code series are included in the Contract Budget. In addition, the Executive Budget Supporting Schedules reference the 2021 Modified Budget condition for these contract object codes.
Agencies in preparing their contract budgets were requested to categorize their contracts into 51 specific contract objects. The distribution of these contracts is summarized as follows
__________________________________________________________________________________________________________________________________________________________________________________________
Est # of Dollars % Total Contracts (Millions) Dollars __________________________________________________________________________________________________________________________________________________________________________________________
Social Service Related and Health Services ............. 4,692 $6,175 32.3%• Home Care, Child Welfare, Employment Services,
Public Assistance, Day Care, Family Services, Homeless Programs, AIDS, Senior Citizen Programs, Health, Mental Hygiene & Prison Health, etc.
Youth and Student Related Services ......................... 3,096 7,106 37.2%• (including Transportation of Pupils and Payments
to Contract Schools)
Other Services ........................................................... 3,210 2,096 11.0%• Custodial, Security Services, Secretarial, Cultural
Related, Employee Related, Economic Development, Transportation, Municipal Waste Exporting, etc.
Professional Services/Consultant .............................. 3,599 1,924 10.0%• Accounting, Auditing, Actuarial, Education,
Investment Analysis, Legal Engineering & Architectural, System Development & Management Analysis, etc.
Maintenance & Operation of Infrastructure ............. 1,660 1,330 7.0%• Lighting, Street Repair, Buildings, Parks,
Water Supply, Sewage and Waste Disposal, etc. .
Maintenance of Equipment ....................................... 1,698 474 2.5%• Data Processing, Office Equipment,
Telecommunications & Motorized Equipment, etc. _________________ ________________ __________________
TOTAL ............................................................... 17,955 $19,105 100.00% ================ =============== =================

Budget and Financial Plan Summary Fiscal Year 2022
10
COMMUNITY BOARDS
New York City’s 59 community boards provide a formal structure for local citizen involvement in the budget process as well as other areas of City decision making. The Charter mandates that the community boards play an advisory role in three areas: changes in zoning and land use, monitoring the delivery of City services in the community district and participating in the development of the City’s capital and expense budgets.
Each community board receives an annual budget to support a district manager, additional staff, and other operating expenses. This excludes the cost of office rent and heat, light and power, which are in a separate unit of appropriation.
Each Borough President appoints board members for staggered two-year terms. City Council members in proportion to each member’s share of the district’s population select nominees from which half the appointments are made. All fifty members of the community board either live or work in the district.
Each year agencies that deliver local services consult with community boards about budget issues and the needs of the districts, prior to preparing their departmental estimates. Each board then develops and prioritizes a maximum of 40 capital and 25 expense budget requests. For FY 2022 community boards submitted 1,906 capital requests and 1,692 expense requests to 38 agencies. Community board expense budget requests concentrate on local services and personnel increases.
District specific budget information is available in the following geographic budget reports, which accompany the release of the FY 2022 budget.
Register of Community Board Budget Requests for the Executive Budget, Fiscal Year 2022 – lists the funding status for all community board proposals in priority order within community district.
Geographic Report for the Executive Expense Budget for Fiscal Year 2022 – details the expense budgets of fourteen agencies that deliver local services by borough and service district. Includes FY 2022 Executive Budget information as well as FY 2021 current modified budget and budgeted headcount data.
Executive Capital Budget for Fiscal Year 2022 – details the Mayor’s Capital Budget by project within agency. Budget data is presented by community district and by agency within borough.
Geographic Fiscal Year 2022 Executive Budget Commitment Plan – presents information on capital appropriations and commitments by community board, including implementation schedules for the current year and four plan years for all active projects by budget line.

Budget and Financial Plan Summary Fiscal Year 2022
11
ECONOMIC OUTLOOK
Overview
The U.S. economy is staging a rebound in the aftermath of a third wave of COVID-19 infections and a difficult spell of winter weather that hampered growth and led to a contraction of payrolls at the end of 2020. Since the start of the pandemic, Congress has authorized five Coronavirus relief and stimulus packages, with total appropriations surpassing a quarter of nominal GDP. Growth in 2021 will be augmented by the two most recent programs, the Coronavirus Response and Relief Supplemental Appropriations Act (CRSSA), signed at the end of 2020, and the American Rescue Plan (ARP), enacted at the beginning of 2021. Elevated federal transfers, high precautionary savings, and gains in asset prices have boosted household net worth, an unusual divergence from previous economic downturns that sets the stage for the normalization of spending. As a result, the pace of GDP growth is projected to remain above-average for the next two years before converging back to long-run trends.
Although a higher pace of consumption will drive growth, its recovery will depend on a return of spending on services; goods expenditures have already recovered from pandemic losses. Spending on transportation, recreation, and food and accommodation services are particularly sensitive to the ebb and flow of Coronavirus infections and remain depressed relative to pre-pandemic levels. In addition, consumers remain risk averse with the current saving rate over twice the long-run average. Moreover, evidence from household spending behavior after the CARES Act and the CRSSA indicates that most of the transfers will be saved or used to pay down debt. Strengthening investment spending helped offset the slump in consumption at the end of 2020 and indicators from early 2021 point to further growth despite winter disruptions. Likewise, low mortgage rates and a shift of preferences towards lower density housing have spurred homebuilding and sales, which will sustain the growth contribution of residential investment. The national labor market has bounced back after stalling at the end of 2020 due to the last surge of COVID cases and a large share of the returning jobs came from the vulnerable leisure and hospitality sector. By March, national payrolls had recouped 62 percent of jobs lost in the downturn. With widespread vaccinations, payroll growth is expected to jump to over a million jobs per quarter through mid 2022, which will bring employment levels back to pre-pandemic highs by the end of 2022.
While uncertainty about the near-term path of the economy lingers, financial markets are reflecting expectations of higher growth and greater tolerance for risk. The major equity indices were up over five percent in the first quarter and have gained nearly 80 percent from the March 2020 trough. This strong appreciation appears to be drawing investors back to equity funds,
which saw the first positive inflows in nearly three years. The favorable conditions were a boon to Wall Street, which finished 2020 with profits of nearly $51 billion – the second strongest performance in 40 years of recordkeeping. The recent jump in longer-term yields has led to a steeper yield curve, which typically helps financial sector earnings through higher net interest income. However, loan portfolio growth has been anemic due to household debt repayment and the shift of corporate financing to fixed income markets in place of bank loans. As a result, net interest income at the nation’s four largest commercial banks declined in the first quarter 2021. Due to the Federal Reserve’s (Fed) cautious position on the recovery and its pledge to keep the fed funds target near zero, the short end of the yield curve will remain low for several more years. Not only are inflation indicators still below the Fed’s two percent target, but Chairman Powell reiterated that the Fed is willing to tolerate sustained inflation above the target before tightening monetary policy.
New York City’s economy is reflecting national trends, with a nascent rebound starting in early 2021. However, the City’s job growth has been more measured than the nation’s and, as of March, only 36 percent of pandemic losses had been recovered. Like national employment, local employment is forecast to accelerate significantly and remain above-average for the next two years. The rapid expansion of payrolls will likewise drive faster wage earnings growth over the next several years. Nonetheless, the recovery continues to be uneven, with slow hiring in the leisure and hospitality sector due to public health restrictions and sluggish tourism activity. In contrast, ongoing real estate development has driven a strong rebound in construction employment, which has recovered nearly two-thirds of job losses.

Budget and Financial Plan Summary Fiscal Year 2022
12
The rapid shift to telecommuting arrangements during the pandemic reduced new office leasing by more than half in 2020 and pushed office vacancy rates to 27-year highs. A full construction pipeline will bolster supply, keeping vacancy rates elevated for the near future, while asking rents are expected to weaken due to downward pressure from a substantial inventory of sublease space. In contrast to the national housing market, sales of condos, co-ops, and single-family homes in the City all contracted sharply in 2020. Prices of condos and co-ops weakened, while single-family home prices rose moderately. Low mortgage rates, price concessions from sellers, and pent-up demand are expected to push sales growth to double digits in 2021. The recovery of the City’s tourism industry is expected to be protracted. With many attractions still closed or restricted, activity is only expected to begin recovering in the second half of 2021.
* All economic data are reported on a calendar year basis.

Budget and Financial Plan Summary Fiscal Year 2022
13
THE U.S. ECONOMY
After a slowdown due to the third wave of Coronavirus infections combined with severe winter weather, the U.S. economy has begun to accelerate once again. Aided by an unprecedented fiscal stimulus, a faster-than-anticipated distribution of COVID-19 vaccines, and the loosening of public health restrictions, GDP growth is expected to jump to an annual pace last seen during the rebound from the double-dip “Volcker” recession in the early 1980’s. However, in the post-WWII period, the nature of the current recovery is historically exceptional, with only the 1957 recession associated with a worldwide pandemic. In both 1957 and 2020, the economy suffered sharp interruptions in activity, more akin to a large-scale natural disaster than an economic slump. Until the 31 percent plunge in the second quarter of 2020, the 1957 decline held the prior record for the fastest quarterly contraction – a drop of ten percent in the first quarter of 1958. Similarly, despite the rapid disruption and loss of life, both downturns were short-lived with the 1957 recession lasting just eight months. However, the fiscal policy responses have been dissimilar. Over the past year, the federal government has enacted an unprecedented
level of fiscal stimulus through five Coronavirus relief programs totaling over $5.6 trillion or 26 percent of nominal GDP.
The elevated flow of federal transfers to households, high precautionary savings, and a robust appreciation of asset prices has resulted in household balance sheets that are stronger now than prior to the downturn. Although household net worth dropped six percent in the middle of the pandemic, it recouped the losses after just one quarter, and by the fourth quarter 2020, household wealth was up 10.4 percent, year-over-year (YoY). In contrast, during the 2008 financial crisis, net worth dropped 15 percent and subsequently took over three years to return to the prior peak. Facing higher uncertainty, households stockpiled savings in readily accessible assets. In the fourth quarter of 2020, cash and similarly liquid assets held by households were up $2.8 trillion (21 percent) YoY. Moreover, the Federal reserve’s (Fed) balance sheet data does not reflect the two most recent pandemic-relief programs, the Coronavirus Response and Relief Supplemental Appropriations (CRRSA) signed at the end of 2020 and the American
GDP AND EMPLOYMENT GROWTH
Forecast
-40%
-30%
-20%
-10%
0%
10%
20%
30%
40%
-12%
-9%
-6%
-3%
0%
3%
6%
9%
12%
Q4Q3Q2Q1Q4Q3Q2Q1Q4Q3Q2Q1Q4Q3Q2Q1
After a sharp contraction and rebound in 2020, the pace of U.S. GDP and employment are projected to remain above-average for the next two years.
Ann
uali
zed
Gro
wth
Rat
eG
rowth R
ate (Quater-over-Q
uarter)
Total Non-farm Employment (Right)
GDP (Left)
Source: U.S. Bureau of Economic Analysis, U.S. Bureau of Labor Statistics, NYC OMB2019 2020 2021 2022

Budget and Financial Plan Summary Fiscal Year 2022
14
Rescue Plan (ARP) enacted at the beginning of 2021. Thus, households’ financial positions will strengthen even further in the first quarter, which will help support a resurgence of spending.
These unique features of the current transition make projecting the strength of the emerging expansion particularly inexact. One symptom of this uncertainty is the wide forecast dispersion in the Blue Chip Consensus survey. At the beginning of the previous expansion following the financial crisis, the spread between the bottom ten and top ten GDP growth forecasts averaged 1.7 percentage points. In the current cycle, this dispersion hit 2.6 percentage points. OMB expects that full-year GDP growth will accelerate to 5.7 percent in 2021 and remain elevated at 4.1 percent in 2022 before returning to a more normalized pace in the out-years.
Consumption typically accounts for about two-thirds of overall growth so a crucial factor will be how inclined consumers are to return to pre-pandemic spending levels. The ebb and flow of Coronavirus cases is creating fickle consumers and scrambled spending patterns. In the third quarter 2020, over three-quarters of the growth rebound came from surging consumption. However, as infections grew in the fourth quarter, the growth contribution of consumption dropped to just over a third. Not surprisingly, spending on items that were not viewed as risky, such as durable and non-durable goods, remained relatively stable. Overall goods spending recovered from the pandemic slump by mid-2020 and as of February 2021, was up 9.9 percent on an annual basis. In contrast, spending on services deteriorated quickly as the infection rates jumped last spring and has rebounded unevenly. This is particularly true of COVID-sensitive services (food and accommodation, transportation, and recreation) that require face-to-face interaction. Monthly expenditures on these categories dropped to less than half of peak levels by April 2020, and by February 2021 were still down 24 percent. At the same time, spending on less vulnerable services, including housing, healthcare, and finance, fell 15 percent below peak levels at the beginning of the pandemic, but had nearly recovered by February.
Whether consumption normalizes depends not only on the ability to bring COVID-19 to heel, but also on the emergence of less risk-averse consumers, who are currently accumulating remarkable amounts of precautionary savings. For full-year 2020, the personal saving rate was 16 percent, more than twice the long-
run average of 7.4 percent. In the first two months of 2021, this jumped to 16.7 percent as households saved a significant share of their relief checks. The research on government transfers suggests that the propensity to consumer out of non-recurring windfalls is low since the income is not viewed as permanent. The New York Fed, through its Survey of Consumer Expectations, has been querying households on how they used their transfers from the April 2020 CARES Act, the December 2020 CRSSA, and how they will treat new funds from the ongoing ARP.1 Overall the Fed reports that the share of stimulus payments used for consumption declined from 29 percent in the first round to 26 percent in the second. Respondents expect to spend a similar share (25 percent) of the third-round ARP checks. The remainder of the transfers were used either for paying down debt or saved. As a result, the pace at which the uncertainty recedes will be the key driver of any spending revival. Nonetheless, many higher frequency indicators are showing signs of returning demand in 2021. Retail sales jumped 9.8 percent in March, reflecting both the impact of the ARP stimulus checks and a February base impaired by weather-related slowdowns. For the entire first quarter, monthly sales growth averaged 4.9 percent, up from -0.9 percent per month in the fourth quarter. National restaurant bookings via the OpenTable system were up nearly 13 percent in the first quarter (quarter-over-quarter), albeit still down by a quarter at the end of March from normal volumes. Domestic air travel is also turning up with TSA checkpoint throughput up 11 percent in the first quarter.
While consumption wavered at the end of 2020, residential and non-residential fixed investment provided a counterbalance. In the fourth quarter 2020, fixed investment contributed three percentage points (70 percent) of the total 4.3 percent growth in GDP. From the second quarter trough, the growth of investment components is following a typical recovery pattern: residential and business equipment investment are leading into the expansion, while spending on non-residential structures continues to be a net drag on growth. Early first quarter 2021 indicators point to continued strength. Despite disruptive winter weather in February, durable goods orders were up 4.9 percent YoY in the first two months of the year. Core durable goods (non-defense capital goods excluding aircraft), a proxy for business investment, grew even faster, up 9.3 percent YoY for the same two-month period.
Housing-related activity has been surprisingly resilient. Except for the second quarter of 2020, which
1 Olivier Armantier, Leo Goldman, Gizem Koşar, and Wilbert van der Klaauw, “An Update on How Households Are Using Stimulus Checks,” Federal Reserve Bank of New York Liberty Street Economics, April 7, 2021

Budget and Financial Plan Summary Fiscal Year 2022
15
was disrupted by the pandemic lockdown, residential investment has contributed to growth in five of the last six quarters. Historically low borrowing rates and demand for lower density suburban housing have spurred homebuilding and sales. Early data for 2021 showed that new home sales grew 37 percent YoY in the first quarter and existing home sales expanded nearly 15 percent, despite challenging winter weather. In addition, the construction pipeline responded to improving conditions. After contracted in January and February, housing starts jumped 19 percent in March. Likewise, after three months of strong gains, housing permits dropped in February but turned around in March with a 2.7 percent monthly gain.
The recent fluctuations in the national labor market mirrored the swings in Coronavirus cases. As the third wave of the pandemic peaked at the end of 2020, monthly job growth decelerated and finally turned negative in December with a loss of 306,000 nonfarm positions. The bulk of the cuts came in the COVID-vulnerable leisure and hospitality industry. As new caseloads began to wane in early 2021, employment rebounded, adding 1.6 million jobs through the first three months of the year. Of this 664,000 (41 percent) came in the leisure and hospitality sector. Unlike past downturns, service-providing jobs initially dropped faster than goods-producing employment and continue to lag during the recovery. As of March, employment in goods-producing sectors was 3.7 percent below the pre-pandemic peak, while service jobs were down 5.8 percent.
The March advance of 916,000 jobs was the highest monthly rise in payrolls since August 2020 and the national labor market has recouped 62 percent (14 million) of the 22.4 million jobs lost in the pandemic. OMB expects the employment pace to remain above a million per quarter through mid-2022, which implies that employment levels will return to pre-pandemic highs by the fourth quarter of 2022, the same date as projected in OMB’s February forecast.
The unemployment rate has also improved significantly, dropping to six percent in March, the lowest reading since March 2020 and 8.8 percentage points below the post-war record of 14.8 percent set in April 2020. This dramatic decline reflects substantial movement of workers off unemployment rolls – continuing unemployment claims dropped by nearly a third from the fourth quarter of 2020 to the first quarter of 2021. However, the lower unemployment rate is also a function of a diminished labor force, which remains
over four million below the pre-pandemic peak and has not grown for the past five months. Had these workers remained in the labor force, the unemployment rate would be 2.3 percentage points higher than currently reported. It appears that early retirement accounts for a significant share of the attrition. The labor force participation rate of workers 55 and older is now even lower than during the pandemic as the pool of older workers is 1.4 million below pre-pandemic highs.
Despite the lingering health risks and uncertainty about the near-term path of the economy, financial markets are anticipating accelerating growth and reflecting an increase of investor tolerance for risk. The S&P 500 and Dow advanced 5.8 and 7.8 percent, respectively, in the first quarter 2021 following double digit gains in the fourth quarter of 2020. However, volatility measures such as the CBOE’s volatility index (VIX) remained relatively elevated averaging 23 in the first quarter – slightly below the prior quarter average of 26 but well above the five-year average (prior to the pandemic) of 15. Some of the uncertainty stemmed from the political turmoil in Washington during the storming of the U.S. Capitol Building and the temporary volatility created by the “meme stock” episode at the end of January. However, in the first half of April, the VIX finally dropped to levels last seen before the start of the pandemic. The trading days ratio – the share of trading days with absolute price movements in excess of one percent – was also elevated at 30 percent in the first quarter, above the long-run average of 20 percent.
The astonishing 80 percent appreciation of the S&P 500 and Dow since the March 2020 trough is finally enticing investors back to riskier equity funds. According to Investment Company Institute data, net flows into equity-based mutual and exchange-traded funds finally turned positive in the first quarter after eleven consecutive quarters of outflows, signifying an increase in investor risk tolerance. In the first quarter, retail investors added $104 billion to equity fund holdings and $225 billion to bond funds. The aggregate inflows to all funds of $121 billion and $138 billion in February and March, represent the two highest monthly totals in data going back to 2015. The timing suggests that at least some of the federal stimulus money is finding its way into the financial markets.
The economic disruption and fiscal response to the pandemic resulted in a federal deficit of $3.1 trillion in 2020 and the Congressional Budget Office is estimating the 2021 shortfall at $2.3 trillion. The financing of this gap has resulted in a flood of new
Budget and Financial Plan Summary Fiscal Year 2022
16
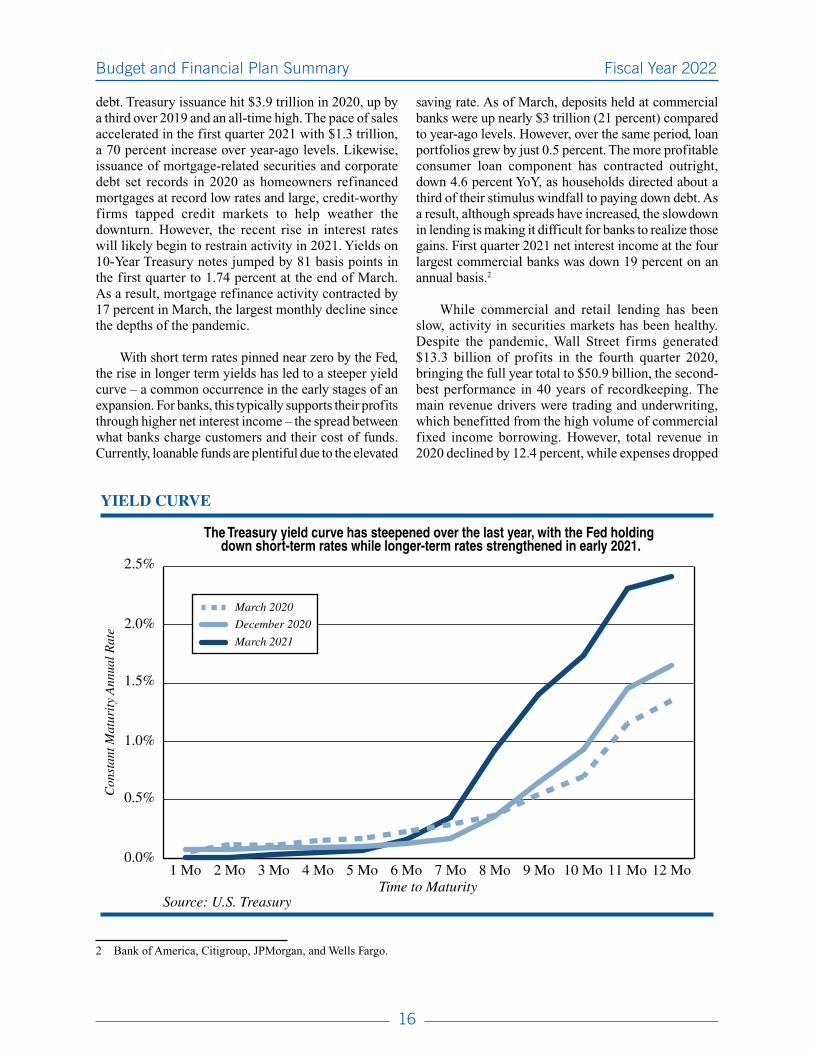
debt. Treasury issuance hit $3.9 trillion in 2020, up by a third over 2019 and an all-time high. The pace of sales accelerated in the first quarter 2021 with $1.3 trillion, a 70 percent increase over year-ago levels. Likewise, issuance of mortgage-related securities and corporate debt set records in 2020 as homeowners refinanced mortgages at record low rates and large, credit-worthy firms tapped credit markets to help weather the downturn. However, the recent rise in interest rates will likely begin to restrain activity in 2021. Yields on 10-Year Treasury notes jumped by 81 basis points in the first quarter to 1.74 percent at the end of March. As a result, mortgage refinance activity contracted by 17 percent in March, the largest monthly decline since the depths of the pandemic.
With short term rates pinned near zero by the Fed, the rise in longer term yields has led to a steeper yield curve – a common occurrence in the early stages of an expansion. For banks, this typically supports their profits through higher net interest income – the spread between what banks charge customers and their cost of funds. Currently, loanable funds are plentiful due to the elevated
saving rate. As of March, deposits held at commercial banks were up nearly $3 trillion (21 percent) compared to year-ago levels. However, over the same period, loan portfolios grew by just 0.5 percent. The more profitable consumer loan component has contracted outright, down 4.6 percent YoY, as households directed about a third of their stimulus windfall to paying down debt. As a result, although spreads have increased, the slowdown in lending is making it difficult for banks to realize those gains. First quarter 2021 net interest income at the four largest commercial banks was down 19 percent on an annual basis.2
While commercial and retail lending has been slow, activity in securities markets has been healthy. Despite the pandemic, Wall Street firms generated $13.3 billion of profits in the fourth quarter 2020, bringing the full year total to $50.9 billion, the second-best performance in 40 years of recordkeeping. The main revenue drivers were trading and underwriting, which benefitted from the high volume of commercial fixed income borrowing. However, total revenue in 2020 declined by 12.4 percent, while expenses dropped
YIELD CURVE
0.0%
0.5%
1.0%
1.5%
2.0%
2.5%
12 Mo11 Mo10 Mo9 Mo8 Mo7 Mo6 Mo5 Mo4 Mo3 Mo2 Mo1 Mo
The Treasury yield curve has steepened over the last year, with the Fed holding down short-term rates while longer-term rates strengthened in early 2021.
Con
stan
t Mat
urit
y A
nnua
l Rat
e
March 2021
December 2020
March 2020
Time to MaturitySource: U.S. Treasury
2 Bank of America, Citigroup, JPMorgan, and Wells Fargo.

Budget and Financial Plan Summary Fiscal Year 2022
17
even further (down 24.2 percent), mainly due to a 74 percent plunge in interest expenses. OMB expects favorable conditions to persist, but projects that profits will decline to a still-elevated $27.5 billion in 2021 and $22.9 billion in 2022.
Although the NYSE member firm data for the first quarter has not been published yet, the early evidence from the Big-5 quarterly earnings releases is suggesting another strong performance.3 The investment banking units reported first quarter earnings of $35 billion, over two and a half times that of the first quarter 2020. One factor that is contributing to this robust outcome is the more optimistic outlook of near-term growth. This is allowing banks to free up loan reserves that were previously set aside for potential loan defaults, bolstering income. Removing these short-term flows, investment banking earnings growth drops to a still-respectable 56 percent YoY.
While financial markets are expecting in a strong recovery, the Fed has been more cautious, arguing for continued monetary accommodation and low interest rates. The Fed’s Chairman, Jerome Powell, stated that the path of the economic recovery depends heavily on the course of the pandemic, which brought the world economy to a near-standstill. Overall, the U.S. economy has slowly improved due to progress with vaccinations but remained uneven and uncertain as a new wave of COVID-19 infections in Europe and Latin America threaten the global economy. In addition, U.S. household spending on services and employment in multiple service sectors remained weak. According to March’s Beige Book, a summary of current economic conditions across the 12 Federal Reserve districts, demand for high-skilled jobs—for example, in legal services, health care, and scientific and technical services—has continued to significantly recover. However, the market for low-skilled labor in the services sector displayed conspicuous slack in the first quarter of 2021. In response, Chairman Powell reiterated the Fed’s commitment to the monetary policy goals of maximum employment and price stability and promised to provide the economy with the “powerful support” that it needs until the economy has completely recovered.
Given the uneven recovery and persistently low inflation, the Federal Open Market Committee (FOMC) kept interest rates near zero and maintained the pace of asset purchases as of March 2021. The Fed first enacted a series of interest rates cuts in March 2020 as
the pandemic pushed the economy into a recession. The reductions brought the federal funds target rate down no more than 0.25 percent and the effective federal funds rate (EFFR) consequently dropped to a low of 0.04 percent in April 2020. Since that nadir, however, the EFFR has edged higher, reaching 0.07 percent in early April 2021. It nevertheless has remained well below the pre-pandemic peak of 2.44 percent in April 2019. Chairman Powell has signaled that the Fed is likely to let the economy overshoot before hiking rates. OMB is projecting that the federal funds rates will remain flat for the year, in line with the Fed’s median projection of 0.1 percent for 2021. The Blue Chip estimates a 55 percent probability that the Fed would lift the federal funds rate in 2023. In contrast, OMB expects that the national economy will approach full employment and the personal consumption expenditures (PCE) inflation rate will finally breach the Fed’s two-percent target in 2024, setting the stage for a gradual lift-off of the Fed’s policy rate.
The Fed has communicated that it will tolerate inflation moderately above two percent before tightening monetary policy and recent inflation data shows that the economy remains far from this objective. The core PCE grew in February, increasing 1.4 percent YoY, but has thus far remained under the Fed’s two-percent target. The Fed projects the core PCE to edge higher this year, within a range of 2.0 percent to 2.3 percent for 2021. Likewise, the market expectation for inflation ticked up as the federal deficit continued to expand. Notably, the breakeven inflation rate on 10-year Treasury Inflation-Protected Securities (TIPS) – a measure that reflects long-run inflation expectations – climbed above 2.3 percent in March 2021 for the first time since 2013. The federal deficit will remain elevated in 2021 at 14.3 percent of total GDP. This growing deficit, prospects for stronger growth, and the potential for higher inflation have also weakened demand for 10-year Treasury notes, which saw yields rise above 1.7 percent in March, the highest rate since before the pandemic.
The Fed will also maintain its purchases of Treasury securities and mortgage-backed securities in order to help smooth market functioning and guarantee the flow of credit to households and businesses. At the March 2021 meeting, the FOMC agreed to continue buying Treasury securities at a pace of $80 billion per month and agency mortgage-backed securities by an estimated $40 billion per month until the substantial progress is made towards the recovery. As a result, the
3 Bank of America, Citigroup, Goldman Sachs, JPMorgan, and Morgan Stanley

Budget and Financial Plan Summary Fiscal Year 2022
18
Fed’s balance sheet rose to $7.7 trillion in early April 2021, more than thrice the asset level ($2.2 trillion) held by the Fed right after the Great Recession. In terms of market functioning, the Fed planned to roll back a number of its pandemic-era policies, thus suggesting that financial institutions are well capitalized. Fed officials announced in March 2021 that the Fed will seek to end the temporary and supplemental restrictions on dividends and share repurchases after June 30, 2021, following the current round of stress tests. Treasury Secretary and prior Fed chair, Janet Yellen, stated that banks have improved their capital positions since last year, which further supports the Fed’s move. The Fed’s stress test, also known as the Board’s stress capital buffer (SCB), was created to ensure that large financial institutions hold enough capital to withstand a severe recession. Although the Fed imposed additional restrictions on capital distributions last year due to economic uncertainty triggered by the pandemic, the Fed’s latest decision signified the easing of pandemic-era policy.
CORE INFLATION AND FEDERAL FUNDS RATE
0.0%
0.5%
1.0%
1.5%
2.0%
2.5%
3.0%
20252024202320222021202020192018201720162015
The core inflation rate is projected to cross the Fed's two-percent target in 2024, triggering a rise in the Fed Funds rate.
Ann
ual R
ate
Inflation Target
Core PCE
Federal Funds Rate
Source: U.S. Federal Reserve, U.S. Bureau of Economic Analysis, NYC OMB
Forecast

Budget and Financial Plan Summary Fiscal Year 2022
19
THE NEW YORK CITY ECONOMY
After a winter slowdown, New York City’s economy has started to rebound in early 2021. Through March, the local labor market had recovered approximately 36 percent of the 910,000 jobs lost during the height of the COVID-19 pandemic in March and April last year. However, the pace of job growth has been far from uniform. The jump in new COVID-19 cases in the fourth quarter last year coincided with a weakening job market as uncertainty and tighter public health restrictions restrained activity. The labor market began to expand again in the first quarter 2021 as business restrictions were loosened and COVID-19 vaccines became more widely available. By March, the City had more than replaced the jobs lost during the winter lull and the unemployment rate began to decline again, dropping to 11.7 percent – the lowest level since the start of the pandemic. With the COVID-19 threat receding, job growth is forecast to average above 100,000 per quarter through the final three quarters of 2021 before dropping to an average pace of 39,000 per quarter in 2022. This results in an annual average growth of 3.7 and 6.8 percent in 2021 and 2022, respectively. This above-average employment growth will push total wage
earnings higher. After contracting an estimated four percent in 2020, wage earnings are expected to rebound to 4.8 and 9.4 percent in 2021 and 2022 respectively.
On a sectoral level, the ongoing recovery has been uneven. By far, the leisure & hospitality sector has been the most volatile; after losing 298,400 jobs at the height of the pandemic, this sector has only recovered 26 percent of its losses as of March. Of the components, the accommodation & food services subsector regained 31 percent of its job cuts, while arts, entertainment & recreation recovered 13 percent. Leisure & hospitality employment is projected to accelerate, growing by 11 percent in 2021 and 31 percent in 2022 as restaurants and businesses reopen. However, given the severity of the contraction and weak tourism projections, the sector’s employment is expected to remain below pre-pandemic levels throughout the forecast horizon.
In contrast to leisure & hospitality, the construction sector’s recovery has been more rapid as real estate development recovered quickly. Despite employment falling by nearly half during the height of the pandemic,
NYC EMPLOYMENT RECOVERY BY SECTOR
-50 0 50 100 150 200 250 300 350
Government
Financial Activities
Information
Manufacturing
Other Services
Construction
Prof. & Business Serv.
Education & Health
Trade, Trans. & Utilities
Leisure & Hospitality
Over the last eleven months, the NYC labor market has recovered over a third of the 910,000 jobs lost in the 2020 downturn.
Source: New York State Department of Labor, NYC OMB
Net Losses
Net Gains
26%
41%
55%
14%
65%
40%
55%
22%
N/A
N/A
Gains aspercent
of losses

Budget and Financial Plan Summary Fiscal Year 2022
20
this sector has regained 65 percent of its job losses as of March. Construction employment is expected to increase sharply by 5.2 percent in 2021 and 4.9 percent in 2022.
Unlike the face-to-face service sectors, the office-using sectors registered relatively mild contractions due to the ability to implement work-from-home arrangements.1 For example, employment in financial activities remained relatively stable through the current crisis compared to prior recessions. Job losses totaled 46,400 positions (a ten percent decline) in the Financial Crisis and 61,600 positions (13 percent) in the 2001 recession. However, from February through July 2020, finance suffered only 25,900 job losses, corresponding to a five percent peak-to-trough decline. By March, financial activities recovered 15 percent of these job losses. OMB projects the recovery will continue throughout the forecast horizon, with jobs in this sector increasing by 0.8 percent in 2021 and 3.6 percent in 2022. Likewise, employment in the information sector, the smallest component of office-using employment, decreased by 33,600 jobs from February through June 2020, and the sector recovered a net 15,400 jobs (46
percent) through the following nine months. OMB forecasts job growth of two percent in 2021 and 6.2 percent in 2022, and headcount is expected to fully recover by 2023.
The largest component of office-using employment, professional & business services, shed 97,200 jobs from February through June 2020 and recouped 19,900 (20 percent) over the following nine months. However, over half of the pandemic job cuts stem from the administrative services subsector, which includes a sizeable share of temporary positions.2 Work-from-home and telecommuting arrangements affected this subsector because clerical work and cleaning services were temporally discontinued. However, as vaccinations become more widespread, anecdotal evidence suggests that many workers will return to their Manhattan offices this year. Financial giants such as Citigroup, JPMorgan, and Goldman Sachs are expected to bring workers back over the summer. Meanwhile, tech companies, which accounted for approximately a third of office leasing last year, have started planning to reopen offices on a limited basis. A survey of the city’s major employers conducted by the Partnership for New York City reveals
New York City Job Growth Forecast
Forecast 2020 2021 2022Industry Level Level Change Level ChangeTotal 4,133 151 293 Private 3,545 152 290 Financial Activities 470 4 17 Securities 180 9 9 Professional & Business Services 709 54 61 Information 207 4 13 Education 235 -1 13 Health & Social Services 770 20 25 Leisure & Hospitality 272 30 93 Wholesale & Retail Trade 407 15 35 Transportation & Utilities 127 10 11 Construction 138 7 7 Manufacturing 53 2 2 Other Services 158 5 12 Government 588 3 3Source: NYC OMBNote: Totals may not add up due to rounding.
1 The office-using sector includes financial activities, information, and professional & business services.2 Administrative service establishments provide daily support to other organizations including office administration, clerical work,
and cleaning services.

Budget and Financial Plan Summary Fiscal Year 2022
21
that almost half of all Manhattan office employees will return to their offices by September.3 Overall, the professional & business services sector is projected to bounce back 7.6 percent in 2021 and reach pre-pandemic levels by the third quarter of that year.
Office demand is projected to remain modest throughout the forecast due to the slow return to in-office work and the continued use of telecommuting arrangements. According Cushman and Wakefield, Manhattan office leasing activity in 2020 totaled 12.8 million square feet (msf), a 63 percent decrease from 2019. As a consequence, the primary market vacancy rate rose to 15.7 percent in March, a 27-year high. New developments are expected to enter the market, putting upward pressure on vacancy rates. Some notable projects in the pipeline include several World Trade Center and Hudson Yards developments, as well as the Farley Post Office and 100 Pearl Street. As the demand for office space struggles to keep pace with new supply, primary vacancy rates are projected to rise to 16.7 percent in 2021 and 17.5 percent in 2022.
A sizeable amount of sublease space has entered the market, putting downward pressure on asking rents. In 2020, available sublease space totaled 19.3 msf — a 73 percent annual increase. Meanwhile, primary asking rents grew by only 0.5 percent in 2020 and fell 0.9 percent in the first quarter of 2021 on an annual basis. Primary market rents are expected to deteriorate 13.6 percent in 2021 with rents in Midtown dropping 14.6 percent and Downtown declining by 9.5 percent. Overall primary asking rents are expected to begin recovering in 2022 with a 0.7 percent rebound.
The City’s housing market, which contracted substantially in 2020 due to the turmoil created by the pandemic, is projected to rebound, aided by low mortgage rates. NYC Department of Finance data indicate sales in 2020 totaled 35,700 — a 24 percent reduction from the prior year. All property types suffered from the downturn, with sales of condos, co-ops, and single-family homes each falling by over 20 percent. However, the latest data reveal signs of improvement – total transactions in the three-month period ending in February 2021 are down just six percent YoY, with this
3 Feinberg, Katy. “Return to Office Survey Results Released - March 2021.” Partnership for New York City, March 11, 2021.
COMMERCIAL VACANCY RATES AND ASKING RENTS
Forecast
0%
2%
4%
6%
8%
10%
12%
14%
16%
18%
20%
$62
$64
$66
$68
$70
$72
$74
$76
$78
$80
$82
202320222021202020192018201720162015
The vacancy rate jumped in 2020 due to weaker office demand and remote-work arrangements. New office development is expected to keep vacancy rates
high while a record supply of sublease space will dampen rent growth.
Pri
mar
y Va
canc
y R
ate P
rimary A
sking Rent
Vacancy Rates (Left)
Asking Rents (Right)
Source: Cushman & Wakefield, NYC OMB

Budget and Financial Plan Summary Fiscal Year 2022
22
year’s data likely diminished by severe winter weather. NYC OMB forecasts total sales volume to rebound by 21.5 percent in 2021 due to low mortgage rates, price concessions, and pent-up demand.
Average housing prices declined 3.8 percent in 2020 from the prior year, particularly due to weakness in the higher-end market — condo prices fell 11.4 percent. Controlling for price variations due to compositional shifts, repeat-sales index data from StreetEasy – tracking activity in Manhattan, Queens and Brooklyn – reveal that prices fell 1.3 percent in 2020 for the sharpest decline since 2011. The buyers’ market continued into the current year, with the March price index down 4.2 percent on an annual basis, particularly due to price markdowns in Manhattan and Brooklyn.
Focusing on the Manhattan apartment market, Douglas Elliman Real Estate reports that for 2020, the average sales price in Manhattan was 1.7 percent higher than the prior year while sales volume dropped 29.8 percent. In the first quarter of 2021, average prices in Manhattan began to decline, down 9.4 percent on an annual basis. However, in the same period, Manhattan sales increased 2.1 percent following three quarters of
decline, suggesting that buyers may be responding to the lower prices.
The rental market also contracted in 2020, a trend that has continued into 2021. The StreetEasy repeat-rent index, derived from the Manhattan, Queens, and Brooklyn rental markets, was down 2.8 percent in 2020 for the largest annual decline since 2009. As of March, momentum was still negative with the rent index slumping another 2.8 percent relative to the end of 2020. The inventory of available units posted on the StreetEasy site jumped in mid-2020 and as of March remained over 100 percent higher than year-ago levels.
According to the U.S. Census Bureau, NYC building permit filings led to the authorization of 19,610 new residential units in 2020, a 26 percent decline from a year ago. Brooklyn and Bronx were the main drivers of these new developments, accounting for 58 percent of the permits in 2020. Since then, permits have continued to decline, registering 4,071 in the first two months of this year, 18.6 percent lower than in the same year-ago period. The forecast projects permits to contract by nearly 8 percent in 2021 before starting to recover in 2022.
STREETEASY REPEAT PRICE AND REPEAT RENT GROWTH
-15%
-10%
-5%
0%
5%
10%
The StreetEasy indexes tracking same-unit sales prices andsame-unit rental rates contracted due to weak demand for housing.
Ann
ual P
erce
mt C
hang
e
Source: StreetEasy20
21Q1
2020
Q1
2019
Q1
2018
Q1
2017
Q1
2016
Q1
2015
Q1
2014
Q1
2013
Q1
2012
Q1
2011
Q1
2010
Q1
2009
Q1
2008
Q1
Sales Price Index
Rent Index
Recession
Budget and Financial Plan Summary Fiscal Year 2022
23
One of the hardest hit sectors during the pandemic was the global tourism industry. As one of the top international destinations prior to the recession, the course of the recovery in the City economy partially depends on the return of tourism and business travel. The latest data from Port Authority showed that total air passenger volume remained weak in November 2020, down 76 percent YoY. With international travel languishing, domestic travel has led a modest recovery. Domestic travelers accounted for 77 percent of all passengers arriving in New York City, up from a share of 67 percent in February 2020.
Many City attractions for leisure travelers remain shuttered or restricted. However, Broadway League President Charlotte St. Martin recently stated that some shows were ‘tentatively’ holding September dates for reopening or opening, with the possibility of even earlier performances. Meanwhile, some city theaters reopened on April 2 at a limited capacity and currently have testing or vaccination requirements in place. As widespread vaccinations enable venues and events to reopen, hotel occupancy rates are expected to rebound modestly to 65.3 percent, starting in the fourth quarter of 2021. However, given the uncertainty in leisure and business travel, occupancy rates are projected to remain below the pre-pandemic level through 2021.
Weak hotel demand constrains hotel room rates in the near-term. In addition, many hotels that were temporarily closed during the pandemic are expected to reopen over the next few quarters adding to the supply of available hotel rooms. As a result, OMB projects that room rates will remain weak this year before rebounding in the second half of 2022. However, rates remain below pre-pandemic levels throughout the forecast horizon.
Risks to the Forecast
The foremost forecast risk continues to be the uneven path of the COVID-19 pandemic and the potential for further waves of infections that necessitate the return of public health restrictions. While the rapid distribution of vaccines has resulted in declining caseloads, resistant coronavirus variants remain an enduring threat. Likewise, the widespread disruption of consumer behavior, social norms, and business practices will require an indeterminate period to recover and, in some cases, may have long-lasting impacts on the economy. The combination of the Fed’s accommodative monetary policy and an unprecedented fiscal response to the pandemic may also pose a challenge to public finance, control of inflation, and financial market stability. Finally, U.S. geopolitical frictions with China, North Korea, and Iran continue to be less significant but potentially disruptive hazards.

Budget and Financial Plan Summary Fiscal Year 2022
24
Forecasts of Selected Economic Indicators for the United States and New York City Calendar Year 2020-2025
_________________________________________________________________________________________________________________________________
1979- 2020 2021 2022 2023 2024 2025 2019*
_________________________________________________________________________________________________________________________________NATIONAL ECONOMY Real GDP Billions of 2012 Dollars ......................... 18,423 19,465 20,270 20,767 21,284 21,787 Percent Change ...................................... -3.5 5.7 4.1 2.5 2.5 2.4 2.6% Non-Agricultural Employment Millions of Jobs ...................................... 142.3 145.6 150.6 153.3 155.1 156.2 Level Change .......................................... -8.6 3.4 4.9 2.7 1.7 1.1 Percent Change ....................................... -5.7 2.4 3.4 1.8 1.1 0.7 1.3% Consumer Price Index All Urban (1982-84=100) ....................... 258.8 264.6 268.7 274.0 280.2 287.0 Percent Change ...................................... 1.2 2.2 1.5 2.0 2.3 2.4 3.2% Wage Rate Dollars Per Year ...................................... 65,601 68,015 69,293 71,512 74,336 77,554 Percent Change ....................................... 6.3 3.7 1.9 3.2 3.9 4.3 3.8% Personal Income Billions of Dollars .................................. 19,692 20,683 20,761 21,690 22,805 23,985 Percent Change ....................................... 6.1 5.0 0.4 4.5 5.1 5.2 5.6% Before-Tax Corporate Profits Billions of Dollars .................................. 2,101 2,392 2,466 2,611 2,768 2,938 Percent Change ....................................... -6.1 13.8 3.1 5.9 6.0 6.1 5.1% Unemployment Rate Percent .................................................... 8.1 5.5 4.1 3.6 3.4 3.5 6.2% avg 10-Year Treasury Note Percent .................................................... 0.9 1.8 2.3 2.4 2.6 2.9 6.1% avg Federal Funds Rate Percent .................................................... 0.4 0.1 0.1 0.1 0.3 0.5 4.8% avg
NEW YORK CITY ECONOMY Real Gross City Product** Billions of 2012 Dollars ......................... 895.3 940.5 1000.4 1038.5 1064.2 1088.1 Percent Change ....................................... 1.3 5.1 6.4 3.8 2.5 2.2 1.9% Non-Agricultural Employment*** Thousands of Jobs .................................. 4,133 4,285 4,577 4,725 4,789 4,861 Level Change .......................................... -516.7 151.3 292.5 147.5 64.3 72.2 Percent Change ...................................... -11.1 3.7 6.8 3.2 1.4 1.5 0.9% Consumer Price Index All Urban (1982-84=100) ....................... 282.9 288.6 293.6 299.8 306.6 314.0 Percent Change ....................................... 1.7 2.0 1.7 2.1 2.3 2.4 3.4% Wage Rate Dollars Per Year ...................................... 102,737 104,682 107,260 110,577 113,622 116,585 Percent Change ....................................... 7.4 1.9 2.5 3.1 2.8 2.6 4.6% Personal Income Billions of Dollars .................................. 694.2 728.0 740.3 775.4 810.4 844.6 Percent Change ....................................... 3.7 4.9 1.7 4.7 4.5 4.2 5.7%
NEW YORK CITY REAL ESTATE MARKET Manhattan Primary Office Market Asking Rental Rate**** Dollars per Square Feet .......................... 80.2 69.3 69.7 72.4 74.4 76.2 Percent Change ....................................... 0.5 -13.6 0.7 3.8 2.8 2.3 2.3% Vacancy Rate**** Percent .................................................... 14.9 16.7 17.5 16.8 16.5 16.3 10.5% avg_________________________________________________________________________________________________________________________________ * Compound annual growth rates for 1979-2019. Compound growth rate for Real Gross City Product covers the period 1990-2019. ** Starting in 2021, forecasts of gross city product reflect estimates of local area GDP (for NYC) published by the U.S. Bureau of Economic
Analysis. Estimates of NYC gross city product published prior to 2021 represent OMB's estimates of NYC economic activity. *** Annual averages derived from non-seasonally adjusted quarterly forecasts. **** Office market statistics are based on 1985-2019 data published by Cushman & Wakefield.
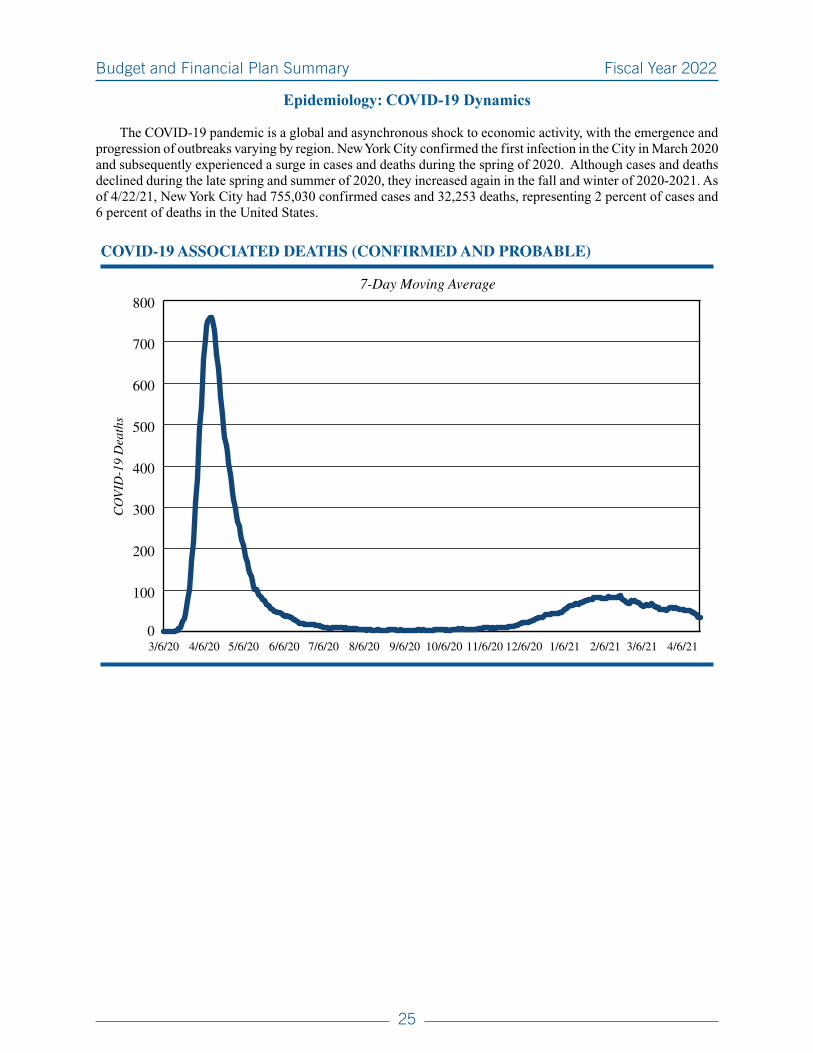
Budget and Financial Plan Summary Fiscal Year 2022
25
Epidemiology: COVID-19 Dynamics
The COVID-19 pandemic is a global and asynchronous shock to economic activity, with the emergence and progression of outbreaks varying by region. New York City confirmed the first infection in the City in March 2020 and subsequently experienced a surge in cases and deaths during the spring of 2020. Although cases and deaths declined during the late spring and summer of 2020, they increased again in the fall and winter of 2020-2021. As of 4/22/21, New York City had 755,030 confirmed cases and 32,253 deaths, representing 2 percent of cases and 6 percent of deaths in the United States.
COVID-19 ASSOCIATED DEATHS (CONFIRMED AND PROBABLE)
0
100
200
300
400
500
600
700
800
4/6/213/6/212/6/211/6/2112/6/2011/6/2010/6/209/6/208/6/207/6/206/6/205/6/204/6/203/6/20
7-Day Moving Average
CO
VID
-19
Dea
ths

Budget and Financial Plan Summary Fiscal Year 2022
26
NEW YORK CITY DAILY VACCINATIONS ADMINISTERED
0
20,000
40,000
60,000
80,000
100,000
4/4/213/21/213/7/212/21/212/7/20211/24/211/10/2112/27/20
14-Day Moving Average
CO
VID
-19
Vacc
inat
ions
In December 2020, the United States Food and Drug Administration authorized the emergency use of two COVID-19 vaccines. Through 4/23/21, 3,289,016 New York City residents have received at least one vaccine dose, representing 50 percent of the adult population. The daily rate of vaccination has increased over time as supply has expanded.
As the vaccination campaign has progressed and COVID-19 cases have fallen, the State and City have begun to gradually ease social distancing restrictions in the City.
• February 12th: Indoor dining reopens with 25 percent occupancy.
• February 25th: In-person instruction for middle schools reopens, with social distancing restrictions.
• February 26th: Indoor dining capacity increased to 35 percent.
• March 5th: Movie theaters allowed to reopen at 25 percent occupancy.
• March 19th: Indoor dining capacity increased to 50 percent.
• March 22nd: In-person instruction for high schools reopened, with social distancing restrictions.
• April 2nd: Events and arts venues allowed to reopen at 33 percent capacity.
The future progression of the pandemic is unknown and will be determined by many factors, including:
• The trend in the vaccination rate of New Yorkers.
• The potential emergence of more infectious virus strains that can evade vaccine immunity.

Budget and Financial Plan Summary Fiscal Year 2022
27
TAX REVENUE 1
Tax Revenue Summary
A year ago, New York City was in the midst of the first wave of the deadly COVID-19 pandemic. Considered the epicenter of the nation’s outbreak, New York City and New York State introduced strict public health measures to stem the growth of the pandemic, essentially ordering all non-essential business closed. The immediate economic consequences were severe, and the unprecedented nature of the pandemic left the economic and tax revenue outlook bleak and uncertain. At the time of the April 2020 Executive Budget, the 2021 tax revenue forecast was revised down to $60.2 billion, a $5.4 billion reduction from the pre-pandemic forecast.
The year has certainly been challenging as the pandemic continues to plague the City and public health officials race to vaccinate the population before new variants spread. There is promise though, as the pace of vaccination has picked up and several rounds of federal fiscal and monetary stimulus have successfully stabilized the nation’s economy and provided significant resources for New Yorkers to weather the worst of the storm.
As a result, the tax revenue outlook improved considerably for 2021 and the remaining forecast period. Total tax revenue is now estimated to be $62.4 billion in 2021 nearly $1.4 billion above the most recent January 2021 Financial Plan forecast, and $2.2 billion above the Executive Budget outlook one year prior, although still nearly $3.2 billion below the pre-pandemic forecast.
The biggest improvements in tax revenue during 2021 have come from both personal and business income taxes, even as total employment in the City remains around half a million below the prior peak. The expansion of unemployment insurance as well as the influx of several billion dollars in PPP loans had a significant impact. In addition, record Wall Street profits lifted financial sector bonuses as well as corporate tax liability. The Personal Income tax is forecast at $13.3 billion, nearly unchanged compared to the prior year, while Corporate business taxes are forecast at $4.4 billion, about three percent shy of the 2020 record $4.5 billion collections. The Unincorporated business tax is projected at nearly $2.0 billion, up slightly from 2020.
Alternatively, the outlook for consumption based taxes remains poor, as a number of factors offset the influx of federal stimulus. Tourism, which came to
an abrupt halt as the City shut down non-essential services and both domestic and international travel was restricted, has not yet improved. Hotel tax collections are estimated at only $75 million for the year down nearly 90 percent from pre-pandemic levels. As a result, visitor spending, historically estimated at 10-15 percent of total taxable spending in the City is practically nonexistent. In addition, remote work has limited the number of commuters into the City. Furthermore, while it is not clear the exact number of temporary and or permanent relocations outside of the City, various studies suggest somewhere between 200-400k people left the City in the last calendar year. As a result, sales tax is estimated at $6.5 billion, 12 percent below 2020.
Property-based taxes have been mixed. Real property tax revenue is expected to be $31 billion in 2021, 4.4 percent above 2020. There was considerable concern that the pandemic would limit payments. While property tax delinquencies have increased compared to prior years, it has remained consistent with earlier forecasts and in fact overall collections through March were $241 million above the prior January 2021 plan forecast. The real property transfer tax stalled in the first half of the fiscal year as the pandemic limited non-essential business for several months. Residential activity has picked up in the second half of the year, making up for last year’s lost selling season. However, commercial activity remains a drag. Real property transfer tax revenue is forecast at $992 million in 2021, down 12.6 percent from the prior year. Mortgage recording tax revenue reflects the same trends, down 16.3 percent from the prior year. Surprisingly, the commercial rent tax has held up better than originally expected even with the pandemic’s clear impact on commercial real estate in Manhattan. The commercial rent tax is forecast to be $841 million, a slight decline of 2.7 percent compared to 2020.
Total taxes are forecast at $62.4 billion in 2022, $164 million more than projected in the January 2021 plan essentially unchanged from the 2021 level as a 6.1 percent rebound in non-property taxes are offset by a 5.1 percent decrease in property taxes.
The outlook for fiscal year 2022 is dominated by the pandemic’s lagged impact on property taxes. Fiscal year 2022 property values are based on the valuation in January 2021, the first property tax roll
1 All years referenced in the Tax section are City fiscal years unless otherwise noted.

Budget and Financial Plan Summary Fiscal Year 2022
28
impacted by COVID-19. The tentative roll released in January reported a significant reduction in the value of property throughout the City, and most dramatically in commercial property in Manhattan. Consequently, property taxes are forecast at $29.4 billion in 2022, a 5.1 percent decline compared to 2021. This is the most significant decline since the early 1990s. The forecast for 2022 has not changed compared to the January 2021 plan as the final roll is not expected to be released until May 2021.
Other property-related taxes remain largely in line with the January 2021 plan outlook. Transaction taxes (the real property transfer tax and the mortgage recording tax) rebound to $2.0 billion reflecting a 13.3 percent increase, driven by improving commercial market transactions. The commercial rent tax rebounds by nearly five percent reflecting stronger post-pandemic activity.
Income-related taxes have been revised up from January reflecting the higher base established in 2021 and a continued post pandemic economic expansion.
Personal income taxes climb 3.6 percent, corporate business taxes remain elevated, and the unincorporated tax rises 2.2 percent.
The largest gains, percentage wise, can be seen in consumption taxes, as both hotel and sales taxes were impacted so severely by the pandemic. Sales tax bounces back to $7.4 billion, growth of 14.5 percent. Hotel taxes reach $215 million, 187 percent above the 2021 estimate.
The outyear forecast assumes a return to trend growth as the property tax begin to recover starting in 2023 and non-property taxes rapidly return to pre-pandemic levels. Overall revenue growth is forecast to average more than three percent per year in the outyears. This forecast is predicated on a continued improvement in public health, with less restrictive social distancing mandates, and a return to normalcy. Local economic activity is expected to improve each year and the City’s tourism industry is expected to regain its pre-pandemic levels by the end of the forecast period.
2021 and 2022 Tax Revenue Forecast($ in Millions)
Increase/(Decrease) 2021 2022 From 2021 to 2022 Tax Amount Percent Change
Real Property $30,954 $29,370 ($1,584) (5.1%) Personal Income 13,344 13,827 483 3.6% Business Corporation1 4,382 4,378 (4) (0.1%) Unincorporated Business 1,962 2,005 43 2.2% Sales and Use 6,484 7,423 939 14.5% Real Property Transfer 992 1,155 163 16.4% Mortgage Recording 816 894 78 9.6% Commercial Rent 841 880 39 4.6% Utility 357 374 17 4.8% Hotel 75 215 140 186.7% Cigarette 20 19 (1) (5.0%) All Other 880 833 (47) (5.4%) ––––––––– ––––––––– ––––––––– –––––––––
Subtotal $61,107 $61,373 $266 0.4% STAR Aid 154 152 (2) (1.0%) Tax Audit Revenue 1,171 921 (250) (21.4%) City Tax Program -Property Tax Rebate — (90) (90) 0.0% ––––––––– ––––––––– ––––––––– ––––––––– Total (After Tax Program)† $62,432 $62,356 ($76) -0.1% 1. Business Corporation Tax Includes both General Corporation and Banking Corporation tax revenues.
† Totals may not add due to rounding.

Budget and Financial Plan Summary Fiscal Year 2022
29
REAL PROPERTY TAX
REAL PROPERTY TAX 2012 - 2022
$ in
Bil
lion
s
Fiscal Year
14
16
18
20
22
24
26
28
30
32
20222021202020192018201720162015201420132012
Source: NYC OMB
Forecast

Budget and Financial Plan Summary Fiscal Year 2022
30
Distribution of Property Parcels by Class
Parcels* Percentage Share
Class 1 698,632 64.62% Class 2 283,496 26.22% Class 3 302 0.03% Class 4 98,646 9.12%
Citywide 1,081,076 100.00%
* FY 2021 final roll
Real property tax revenue is projected to account for 47.1 percent of total tax revenue in 2022, or $29.370 billion.
2021 Forecast: Property tax revenue is forecast at $30.954 billion, growth of 4.4 percent over the prior year, $263 million above January 2021 Plan.
In 2021, collections year-to-date through March have come in $241 million above the January 2021 Plan, growth of 4.7 percent. For the year, collections for the current year levy are expected to be over plan by $210 million while collections from the prior years’ levy is expected to be over plan $53 million, for a total change of $263 million above January 2021 Plan. Increase in current year collections result from lower-than-expected reserves for uncollectible taxes.
2022 Forecast: Property tax revenue is forecast at $29.370 billion, a decline of 5.1 percent from the current year, no change from January 2021 Plan.
The property tax levy forecast is based on the 2022 tentative roll released in January wherein citywide total billable assessed value decreased by $10.5 billion to $260.3 billion, a decline of 3.9 percent. The tentative roll is expected to be reduced on the final roll by $2.8 billion as a result of Tax Commission actions, Department of Finance change-by-notices, and completion of exemption processing.
On the 2022 tentative roll, Class 1 billable assessed value increased 5.3 percent over the prior year. After the tentative-to-final roll reduction change, billable assessed value on the final roll is expected to grow 5.1 percent, higher than last year’s growth of 4.4 percent.
Class 2 billable assessed value on the tentative roll fell by 0.4 percent. With an estimated tentative-to-final roll reduction of $1.5 billion, billable assessed value is expected to fall by 1.8 percent the final roll, whereas last year’s growth was 6.6 percent.
On the tentative roll, Class 3 (utilities) properties saw billable assessed value growth of 6.8 percent. After the assessments for Class 3 special franchise properties are completed by the New York State Office of Real Property Tax Services, Class 3 billable assessed value growth on the final roll is expected to be 10.7 percent.
Class 4 billable assessed value on the tentative roll declined by 9.6 percent. With an estimated tentative-to-final roll reduction of $2.1 billion, billable assessed value is expected to fall by 11.2 percent on the final roll, compared to last year’s growth of 5.2 percent.
2023 through 2025 Forecast: Class 1 billable assessed value is forecast to grow at annual average of 4.6 percent from 2023 through 2025.
For Class 2, as the vaccine rollouts usher in the recovery from the pandemic’s impact on the owners’ rent rolls, overall market value is expected to grow 3.3 percent from 2023 through 2025 and average overall billable assessed value growth is at 1.8 percent.
Class 3 billable assessed value growth is forecast at an annual average of 1.1 percent from 2023 through 2025.
A slow recovery is expected for Class 4 office buildings, hotels, stores, theaters, and cultural and recreation properties. Office buildings and hotels are expected to reach the pre-COVID-19 levels by 2025, while the rest of Class 4 is expected to reach the pre-COVID-19 levels by 2024. The overall billable assessed value growth is forecast at an annual average of 0.5 percent from 2023 through 2025.
With a prolonged recovery of both Class 2 and Class 4, the total property tax levy is expected to grow 1.5 percent on average from 2023 through 2025, after declining 4.8 percent in 2022. Total property tax revenues are expected to recover with an annual average growth of 1.7 percent from 2023 through 2025.

Budget and Financial Plan Summary Fiscal Year 2022
31
COMMERCIAL RENT TAX
The commercial rent tax is projected to account for 1.4 percent of total tax revenue in 2022, or $880 million.
2021 Forecast: Commercial rent tax revenue is forecast at $841 million in 2021, a decrease of 2.7 percent over the prior year and an increase of $10 million compared to the January 2021 Plan. The increase between plans is associated with higher than anticipated collections. Year-to-date collections through March are slightly above January plan, but down 2.1 percent from the prior year. Collections for April through the end of the fiscal year are expected to decline 3.0 percent from the same period the prior year. These declines reflect the sustained impact of the pandemic.
It is surprising that the decline in the commercial rent tax has not been more severe since the tax is only levied on business in Manhattan, which has endured the brunt of the economic impact of the pandemic. Through March 2021, office-using employment remained 118,000 jobs below the pre-pandemic February 2020 total. At the same time, the overall vacancy rate in Manhattan climbed to 16.3% in March 2021 from 11.3% seen in March 2020, while retail faced steep year-over-year declines in asking rents paired with increases in availability rates in most Manhattan submarkets.1 In the short term, commercial rent tax revenue has likely done better than expected because of the length of commercial leases and firms uncertainty about how, and when to send employees back to the office.
COMMERCIAL RENT TAX 2012 - 2022
400
500
600
700
800
900
1,000
20222021202020192018201720162015201420132012
Fiscal Year
$ in
Mil
lion
s
Source: NYC OMB
Forecast
1 Cushman & Wakefield Manhattan Office & Retail Marketbeat Reports Q1 2021. Retrieved from: https://www.cushmanwakefield.com/en/united-states/insights/us-marketbeats/new-york-city-area-marketbeats

Budget and Financial Plan Summary Fiscal Year 2022
32
2022 Forecast: Commercial rent tax revenue in 2022 is forecast at $880 million, an increase of 4.6 percent from 2021 and $6 million up from January 2021 Plan. This increase is based on a slightly stronger recovery for office using employment. However, this forecast tempers expectations for the relationship between office using employment and demand for commercial space because it is yet to be seen how this association will shift after the COVID-19 pandemic. Primary asking rents are expected to continue declining in the coming year and they are not expected to reach pre pandemic levels for at least several years. At this point, it remains difficult to determine how much of the divergence between office using employment and primary asking rents is associated with pressing safety concerns versus a shift toward hybrid or fully remote work schedules.
There remains substantial risk that commercial rent tax revenue could face steeper drops when businesses are no longer contractually obligated to pay rents. Commercial leases in the city typically span about three to ten years, meaning that it is yet to be seen what choices businesses will make for their commercial space needs as these leases expire. Surveys show mixed results on expectations between executives and employees for remote work practices,2 and just this past year some companies have decided to leave office spaces while others have expanded.3 Though the general consensus is for a shift in how office space is used, it is still uncertain what these changes will be or how they will affect commercial rents in the long term.
Despite risks to the forecast, commercial rent tax collections for years 2023 to 2025 are expected to increase 2.9 percent on average. This modest growth corresponds with anticipated improvements in public health associated with the vaccine rollout and recoveries in office-using employment, where many will likely return to the office in some form.
2 PwC. (2021, January 12). It’s time to reimagine where and how work will get done. Retrieved from: https://www.pwc.com/us/en/library/covid-19/us-remote-work-survey.html
3 Evais, P, & Hagg, M. (2021, April 8). After Pandemic, Shrinking Need for office Space Could Crush landlords. Retrieved from: https://www.nytimes.com/2021/04/08/business/economy/office-buildings-remote-work.html?action=click&module=Spotlight&pgtype=Homepage

Budget and Financial Plan Summary Fiscal Year 2022
33
REAL PROPERTY TRANSFER TAX
The real property transfer tax (RPTT) is projected to account for 1.9 percent of total tax revenue in 2022, or $1.155 billion.
2021 Forecast: Real property transfer tax revenue is forecast at $992 million, a decrease of 12.6 percent from the prior year, and $56 million above the January 2021 Plan estimate.
Revenue from residential transactions is forecast to increase 0.2 percent in 2021. The current forecast reflects the beginning of a modest recovery after a 14 percent decline in 2020 due to the COVID-19 related shut-down of the economy along with lingering negative effects from the glut in the luxury condo market and the retreat of foreign buyers. Collections are expected to increase in the fourth quarter, reflecting the acceleration of residential purchases as the economy begins to recover.
Revenue from commercial transactions is forecast to decline 28.5 percent in 2021, representing continued broad-based impacts to commercial real estate; specifically, in office, retail, multifamily rentals and hotels. There is considerable uncertainty related to
how work from home arrangements, staggered return to office plans, and continuing pandemic restrictions will affect the demand for, and the price of, office and retail space. Furthermore, the value of rental properties remains unclear as the pandemic weakened demand for Manhattan apartments. It will also take some time for the hotel sector to regain its pre-pandemic value given the limited activity in that sector. Collections in the fourth quarter are expected to be very similar to the third quarter.
2022 and beyond: Real property transfer tax is forecast at $1.155 billion, an increase of 16.4 percent from the current year, and $14 million above the January 2021 Plan estimate. This increase is due almost entirely to a rebound in commercial RPTT revenue. As the pandemic subsides next year, prospective buyers and sellers will move forward with transactions as they will have a better understanding of the longer-term value of the different segments of the commercial market and will be able to reflect that in the pricing of the real estate. Residential revenue is expected to increase 3.8 percent in 2022. Growth is forecast to average 3.9 percent in 2023 through 2025. Commercial RPTT revenue is expected to grow 38.5 percent in 2022, 30 percent in 2023, and then average 7.4 percent growth from 2024 to 2025.
REAL PROPERTY TRANSFER TAX 2012 - 2022
0
500
1,000
1,500
2,000
20222021202020192018201720162015201420132012
Fiscal Year
$ in
Mil
lion
s
Source: NYC OMB
Forecast

Budget and Financial Plan Summary Fiscal Year 2022
34
MORTGAGE RECORDING TAX
The mortgage recording tax (MRT) is projected to account for 1.4 percent of total tax revenue in 2022, or $894 million.
2021 Forecast: Mortgage recording tax revenue is forecast at $816 million, a decline of 16.3 percent from the prior year and $46 million above the January 2021 Plan estimate.
This decline mirrors the changes seen in the residential and commercial RPTT forecast. Revenue from residential mortgages is forecast to increase 12.4 percent in 2021. As residential purchases continue to recover, mortgage originations will also recover. Additionally, collections were buoyed by the continued interest in refinancing activity given the sustained lower interest rates in the market. Revenue from commercial mortgages is forecast to decline 38.1 percent in 2021. This reflects a similar weakness in the commercial real estate market.
2022 and beyond: Mortgage recording tax is forecast at $894 million, an increase of 9.6 percent from the current year, and $9 million above the January 2021 Plan estimate.
Revenue from residential mortgage recordings is forecast to fall 11.6 percent in 2022 reflecting the slowdown of refinancing activity in the residential markets. Residential MRT is forecasted to average 3.8 percent growth in 2023 through 2025. Commercial MRT revenue is forecasted to increase 38.9 percent in 2022, reflecting a similar rebound in the commercial real-estate transactions. In 2023, commercial MRT is forecast to grow 1.3 percent, while commercial RPTT is forecast to grow 30 percent. This discrepancy reflects a slowdown in commercial refinancing activity in 2023. Commercial MRT is forecast to average 7.4 percent growth in 2024 and 2025.
MORTGAGE RECORDING TAX 2012 - 2022
0
300
600
900
1,200
1,500
20222021202020192018201720162015201420132012
Fiscal Year
$ in
Mil
lion
s
Source: NYC OMB
Forecast

Budget and Financial Plan Summary Fiscal Year 2022
35
PERSONAL INCOME TAX
The personal income tax (PIT) is projected to account for 22.2 percent of tax revenue in 2022, or $13.827 billion.
2021 Forecast: PIT revenue is forecast at $13.344 billion, a drop of 1.5 percent, and $600 million above the January 2021 Plan estimate. Accelerating strength in collections since the January 2021 plan has led to more optimistic projections for the year. Withholding in 2021 is forecast to decrease 2.2 percent from the prior year. Through March 2021 withholding collections are down 4.5 percent compared to the prior year, as the City’s labor market remains weak due to the impact of COVID-19 on the service-related industries. The City is over 500,000 jobs shy of its pre-pandemic levels, a loss of over 10 percent. However, the concentration of these jobs in lower wage industries has had a limited impact on withholding. As lockdown restrictions are lifted and New Yorkers return to work, the fourth quarter is expected to show year-over-year growth for the first time since the start of the pandemic.
Bonus payments are another factor contributing to better than anticipated withholding collections. The bonus portion of withholding performed better than expected on the back of record Wall Street firm profits, showing solid growth, and maintaining a high overall level. Total bonus withholding increased by 4.1 percent over the prior year to almost $1.4 billion in revenue. This level is only beat by the historically high 2018 bonus season which was buoyed by one-time payments related to the repatriation of non-qualified deferred compensation.
At the January 2021 plan, 2021 estimated payments were expected to decrease 15.2 percent from the prior year. The outlook has changed reflecting a significant acceleration in January installment payments that mitigated weaker collections from earlier in the fiscal year. The current outlook calls for estimated payments to decline only 5.6 percent compared to the prior year.
PERSONAL INCOME TAX 2012 - 2022
6
7
8
9
10
11
12
13
14
15
20222021202020192018201720162015201420132012
Fiscal Year
$ in
Bil
lion
s
Source: NYC OMB
Forecast

Budget and Financial Plan Summary Fiscal Year 2022
36
Settlement Payments which include extensions, finals, offsets, and refunds are projected to decrease $256 million in 2021. This change is driven by a fall in extension payments of 30.1 percent. Absent extensions the settlement payments are expected to increase by $141 million, driven by a 10.3 percent increase in expected finals payments and a 1.2 percent increase in offset payments.
2022 Forecast: Personal income tax revenue is forecast at $13.827 billion, an increase of 3.6 percent over the current year, and $321 million above the January 2021 Plan estimate. This growth reflects a continuing rebound in withholding collections and firming estimated payments.
Withholding in 2022 is forecast to increase 5.5 percent over the prior year. In 2022 withholding collections exceed their 2019 mark as trends in employment levels approach their pre-pandemic norm. In the December-March period, bonus withholding is forecast to remain flat.
Estimated payments in 2022 are expected to increase 5.4 percent as non-wage income, including business and capital gains income sources, follow the rest of the economy’s recovery on a stable upward trajectory.
Extension payments are forecast to bounce back 33.0 percent in 2022. Total settlements are expected to increase 6.4 percent, dragged down by a decrease in offsets and finals.
Personal income tax revenue is forecast to average annual growth of 4.7 percent from 2023 through 2025 after a 3.6 percent gain in 2022 that brings total revenue above its 2020 level.
SETTLEMENT PAYMENTS
-800
-600
-400
-200
0
200
400
600
800
1,000
1,200
1,400
1,600
1,800
202120202019201820172016201520142013201220112010200920082007200620052004200320022001
Note: Adjusted for the City/State final return reconciliation.
$ in
Mil
lion
s
Tax Year
Forecast
Source: NYC OMB
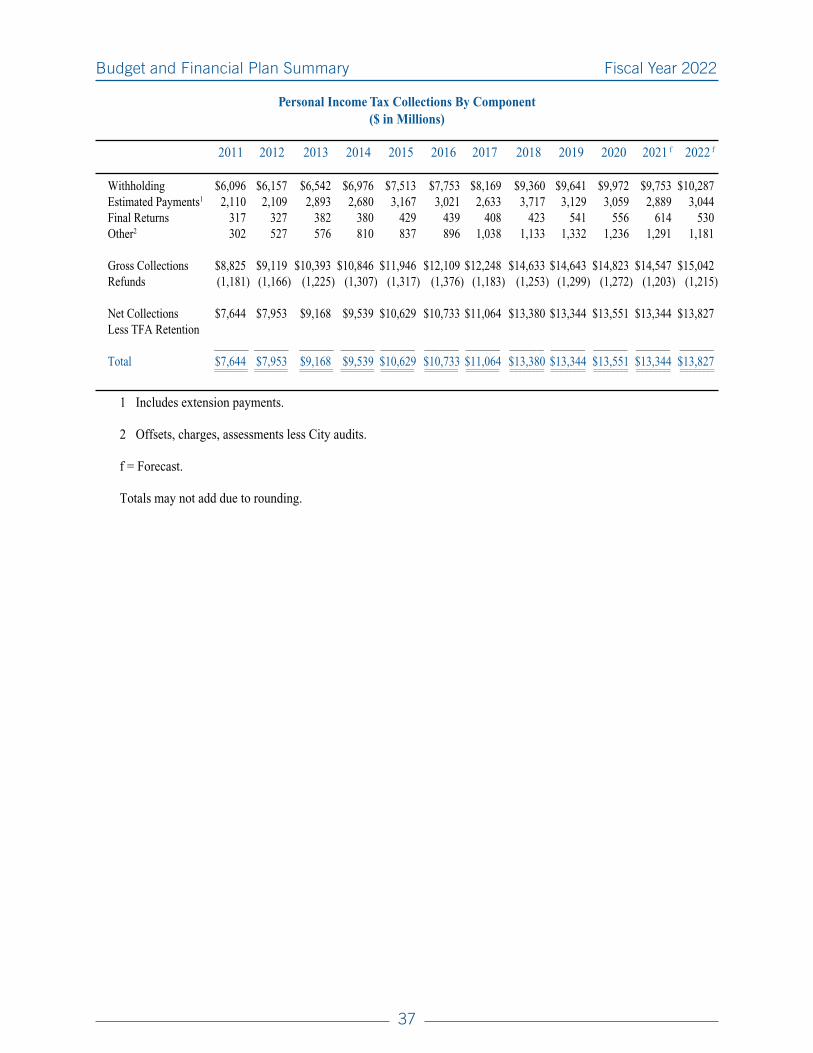
Budget and Financial Plan Summary Fiscal Year 2022
37
Personal Income Tax Collections By Component($ in Millions)
2011 2012 2013 2014 2015 2016 2017 2018 2019 2020 2021 f 2022 f
Withholding $6,096 $6,157 $6,542 $6,976 $7,513 $7,753 $8,169 $9,360 $9,641 $9,972 $9,753 $10,287 Estimated Payments1 2,110 2,109 2,893 2,680 3,167 3,021 2,633 3,717 3,129 3,059 2,889 3,044Final Returns 317 327 382 380 429 439 408 423 541 556 614 530Other2 302 527 576 810 837 896 1,038 1,133 1,332 1,236 1,291 1,181
Gross Collections $8,825 $9,119 $10,393 $10,846 $11,946 $12,109 $12,248 $14,633 $14,643 $14,823 $14,547 $15,042 Refunds (1,181) (1,166) (1,225) (1,307) (1,317) (1,376) (1,183) (1,253) (1,299) (1,272) (1,203) (1,215)
Net Collections $7,644 $7,953 $9,168 $9,539 $10,629 $10,733 $11,064 $13,380 $13,344 $13,551 $13,344 $13,827 Less TFA Retention
_____________ _____________ _____________ _____________ _____________ _____________ _____________ _____________ _____________ _____________ _____________ _____________
Total $7,644 $7,953 $9,168 $9,539 $10,629 $10,733 $11,064 $13,380 $13,344 $13,551 $13,344 $13,827 ======== ======== ======== ======== ======== ======== ======== ======== ======== ======== ======== ========
1 Includes extension payments.
2 Offsets, charges, assessments less City audits.
f = Forecast.
Totals may not add due to rounding.

Budget and Financial Plan Summary Fiscal Year 2022
38
BUSINESS CORPORATION TAX
The business corporation tax is forecast to account for 7.0 percent of the total tax revenue in fiscal year 2022, or $4.378 billion.1
2021 Forecast: Business corporation tax revenues are forecast to decline 2.8 percent to $4.382 billion, a small decline in collections given the growth witnessed in 2019 and 2020, and an increase of $452 million over the January 2021 Plan.
In fiscal year 2021 through March, business corporation tax gross collections less audits decreased 2.4 percent over the prior year. At the beginning of the year, there was a high risk of a steep decline due to New York City’s lockdown and the resulting economic damage. However, corporate tax collections showed resiliency and declined to a lesser degree than had been anticipated. Federal actions in response to COVID-19, particularly the Paycheck Protection Program (PPP), have assisted many New York City businesses to remain open during the pandemic, and may have played a part in sustaining corporate tax collections in the current fiscal year. New York City businesses are estimated to have received close to $25 billion in PPP loans from April 2020 through February 2021.
1 Business corporation tax collections for reporting purposes include S-corporations under the general corporation tax.
BUSINESS CORPORATION TAX 2012 - 2022
2.0
2.5
3.0
3.5
4.0
4.5
5.0
20222021202020192018201720162015201420132012
Fiscal Year
$ in
Bil
lion
s
Source: NYC OMB
Forecast

Budget and Financial Plan Summary Fiscal Year 2022
39
Tax collections in the finance sector this fiscal year-to-date through February reflect a strong Wall Street performance in calendar year 2020. NYSE member firm profitability reached record levels in calendar year 2020 with pre-tax profits at nearly $51 billion, highest since 2009. The finance subsector registered the largest year-over-year increase in collections so far this fiscal year. On the other hand, non-finance collections have declined in line with the profit decline in the rest of the economy. Real estate and information subsectors showed the biggest declines in collections between April 2020 and February 2021. Year-over-year, corporate tax collections are forecast to increase by 14 percent in the final quarter of the fiscal year, in response to the City’s ongoing vaccination drive, re-opening of the City’s economy, continued Wall Street strength, and a better outlook for corporate profitability and the City’s economy.2
2022 Forecast: Corporate tax collections are forecast at $4.378 billion in 2022, an increase of $143 million over the January 2021 Plan. The forecast in fiscal year 2022 reflects the post-pandemic re-opening of the City and the revival of its economy. Total employment in the City is forecast to increase by 3.7 percent in the current calendar year after a decline of 11.1 percent last year, while New York City’s economic output is also forecast to increase. It is anticipated that the non-finance sector will grow 3.1 percent in fiscal year 2022, while finance will decline by 4 percent as Wall Street profits retreat from the record 2020 levels.
Corporate collections are forecast to grow by 5.3 percent in fiscal year 2023. Overall, fiscal year 2023 through 2025 corporate collections are forecast to grow by an average of 2.5 percent on an annual basis.
2 Fourth Quarter year-over-year growth rates will be artificially distorted by the delay in federal and state filing dates in 2020. This year spring payments will likely display higher than typical growth, while the accrual months of July/August are expected to fall significantly.

Budget and Financial Plan Summary Fiscal Year 2022
40
UNINCORPORATED BUSINESS TAX
Unincorporated business tax is projected to account for 3.2 percent of tax revenue in 2022, or $2.005 billion.
2021 Forecast: Unincorporated business tax revenue is forecast at $1.962 billion, an increase of 1.2 percent over the prior year, and $30 million above the January 2021 Plan. Net collections year-to-date through March increased 6.2 percent. Unincorporated business tax payments have stabilized after declining for the past two years following the passage of the Tax Cuts and Jobs Act, which appeared to have persuaded some firms to incorporate.
Although COVID-19 impacted small service-related businesses disproportionately, UBT held up better than expected. This is partially due to the implementation of Federal stimulus programs which directly or indirectly supported businesses.
Approximately $8.5 billion of PPP loans were directed to NYC unincorporated business.1 The federal fiscal stimulus, as well as the Federal Reserve loose monetary policy, lifted financial markets to record levels and helped hedge funds achieve double-digit growth in their assets under management.
Professional service companies, such as legal, technical, and accounting firms also appear to have weathered the pandemic as evidenced by modest year-over-year increases in UBT tax payments. However, payments from real estate, performing arts, health care, food services, and accommodation businesses declined 33 percent.
For the final quarter, UBT payments (cash based) are expected to grow 4.8 percent year-over-year.2
1 Estimate of PPP loans based on data released by the US SBA. Total includes loans from April 2020 through February 2021. UBT total included limited liability companies, partnerships, and sole proprietors. https://www.sba.gov/funding-programs/loans/covid-19-relief-options/paycheck-protection-program/ppp-data
2 Fourth quarter year-over-year growth rates are distorted. Last year payments were delayed from the fourth quarter into July and August. As a result growth will appear larger in the fourth quarter but smaller in the July/August accrual period.
UNINCORPORATED BUSINESS TAX 2012 - 2022
800
1,000
1,200
1,400
1,600
1,800
2,000
2,200
2,400
20222021202020192018201720162015201420132012
Fiscal Year
$ in
Mil
lion
s
Source: NYC OMB
Forecast

Budget and Financial Plan Summary Fiscal Year 2022
41
2022 Forecast: Unincorporated business tax revenue is forecast at $2.005 billion, a $43 million increase over the prior year and unchanged from the January Plan. Finance sector payments are forecast to decline from the prior year. Non-finance sector payments are expected to grow, offsetting the decline of the finance sector. In 2023 through 2025, unincorporated business tax revenue is forecast to have annualized average growth of 4.3 percent.

Budget and Financial Plan Summary Fiscal Year 2022
42
SALES AND USE TAX
The sales and use tax is projected to account for 11.9 percent of tax revenue in 2022, or $7.423 billion.
2021 Forecast: Sales tax revenue is forecast at $6.484 billion, a decline of 12.0 percent from the prior year including the Distressed Hospital Assistance Account and MTA State intercepts.1 Sales tax collections year-to-date through March declined 22.4 percent from the same period the previous year. Economic concerns due to the persistence of COVID-19 has led many individuals to continue to constrain their discretionary
spending, while a dearth of tourists limit consumption, even with curbs to indoor dining and several travel restrictions being lifted. The forecast has been reduced by $67 million from the previous plan. While the forecast has declined, collections are still expected to rebound from current levels in the fourth quarter due to the Federal stimulus and widespread access to vaccines.
Service-related industries such as accommodation, food services, entertainment as well as others have been heavily impacted by the pandemic and the social
1 The 2019-20 NYS Enacted Budget legislation appropriates a portion of sales tax revenue generated from legislation that requires remote sellers making $500,000 in sales or 100 transactions (as NYS aligns with the SCOUTS Wayfair v. South Dakota decision), as well as online marketplaces such as Amazon (Part G of the 2019-20 NYS Enacted Budget), to collect and remit sales tax on sales to NYS residents for the purposes of the MTA, retroactive June 21, 2018. The amounts to be intercepted by the State are $127.5 million in SFY20, $170 million in SFY21 and increase 1 percent annually from SFY22 onward and is taken in monthly installments. Without the STAR C payments and MTA State intercept, sales tax in fiscal year 2021 is expected to decline 8.4 percent.
The NYS Education, Labor and Family Assistance (ELFA) Budget (S. 7056-B PART ZZ) legislates that NYS will intercept a portion of NYC sales tax collections and redirect them to the New York State Agency Trust Fund, under a Distressed Provider & Assistance Account, for the purpose of relief for financially distressed hospitals and nursing home facilities. This is in addition to the monthly MTA sales tax intercept that is placed into the NYS Agency Trust Fund which is already in effect. The Comptroller will withhold a portion of sales tax collections, penalties and fees, in the amounts of $200M in quarterly installments on January 15, April 15, July 15, and October 15. The comptroller will defer withholding the total value of the withholdings that would have occurred on April 15, 2020, July 15, 2020, October 15, 2020 and January 15, 2021 until January 15, 2021. At which time, the full $200M will be withheld and the normal quarterly installments will occur thereafter. The cost to City revenue will be $250 million in 2021 and $150 million in 2022, for a total cost of $400 million. This act shall end two years after the effective date.
SALES TAX 2012 - 2022
4.5
5.0
5.5
6.0
6.5
7.0
7.5
8.0
8.5
20222021202020192018201720162015201420132012
Fiscal Year
$ in
Bil
lion
s
Source: NYC OMB
Forecast

Budget and Financial Plan Summary Fiscal Year 2022
43
distance limitations placed on them. The recent decline in cases along with the rollout of the vaccination campaign has allowed some businesses to ease those restrictions, such as indoor dining which has reopened at a limited capacity starting February 12th, 2021. At the same time, warmer weather and additional federal stimulus are expected to foster greater economic activity, allowing vendors opportunity to expand their business, hire employees displaced by the outbreak, and increase sales.
Early evidence of a change in sentiment can be seen in consumer confidence, which declined in December amid the surge in COVID-19 cases but began to rebound in January and February as consumers expressed cautious optimism about their outlook. Then in March consumer confidence soared to a one-year high, with the sharpest one-month gain in almost 18 years, exceeding many of the most optimistic economists’ forecasts. The huge jump in consumer confidence likely stemmed from millions of individuals receiving the vaccine, along with business restrictions being lifted on a broad scale. The Federal stimulus also boosted confidence by lifting expectations for economic growth and the job market in the coming months.2
National retail sales data supports this progression. After modest growth during the holiday shopping season, retail sales declined in December as COVID-19 cases were rising, leading to increased business restrictions. Retail sales in January jumped to the largest monthly increase since June 2020, mainly supported by the $600 stimulus payments. Then in February sales declined more than expected as harsh weather swept the nation, along with the fading boost from the stimulus payments and delayed tax refunds. Retail sales then increased considerably in March due to the recent $1,400 Federal stimulus and the accelerated pace of vaccinations.3 Retail sales are expected to continue rebounding in the coming months as vaccinations become more accessible, along with the weekly unemployment supplement being extended through September 6th, 2021 and record amounts of personal savings since the beginning of pandemic supporting future consumption.
Even though NYC is no longer the epicenter of the pandemic in the US, City sales tax collections continue to experience slower growth than the rest of the nation and the remainder of the State. This is because NYC businesses continue to be restricted by social distancing mandates to curtail the spread of the virus. In addition,
many of City commuters continue to work remotely while hundreds of thousands of residents relocated both temporarily and permanently.
But one of the biggest factors impacting NYC more dramatically than the rest of the State as well as the nation is the dramatic reduction in tourism. The accommodation industry has been devastated by the pandemic, with thousands of hotel rooms closing temporarily since April 2020, and some potentially permanently. With mass gatherings now restricted to 100 people indoors and 200 people outdoors starting March 22, 2021, many tourist attractions such as concerts, sports games, conventions, and others are still limited or banned altogether. While indoor dining is now allowed, there are still strict limitations and social distancing protocols in effect. Broadway is now expected to resume shows in September. The CDC has recently made air travel to the US, including international visitors, which is a strength in the NYC market, more accessible by allowing visitors with negative COVID-19 test results three days prior to arrival, into the country.
The remainder of the 2021 forecast assumes collections will improve in the fourth quarter compared to the third quarter as the Federal stimulus bolsters consumption along with vaccinations becoming more widespread, easing COVID-19 concerns and allowing businesses to operate more freely.
2022 Forecast: Sales tax revenue is forecast at $7.423 billion, growth of 14.5 percent over the current year, net of the Distressed Hospital Assistance Account and MTA State intercepts. The forecast is $225 million below the prior plan. Consumer spending is still expected to increase noticeably with vaccinations becoming more widespread, dampening COVID-19 concerns as businesses continue to ease restrictions, allowing for greater economic activity due to pent up demand and higher employment. Wage earnings is also expected to grow at a strong pace, which should bolster discretionary spending. Many workers are expected to return to offices in the City at least on a part-time basis, further facilitating NYC consumption. The Federal stimulus and increased unemployment benefits should aid in consumer spending as well. In fact, local based consumption is expected to return to pre-pandemic levels in fiscal year 2022. Tourism is anticipated to return steadily as travel restrictions continue to diminish and Broadway along with other tourist attractions begin to return. Collection growth may be subdued if business
2 https://www.bloomberg.com/news/articles/2021-03-30/u-s-consumer-confidence-surged-to-one-year-high-in-march3 https://www.cnbc.com/2021/03/16/retail-sales-february-2021-.html

Budget and Financial Plan Summary Fiscal Year 2022
44
restrictions and social distancing mandates persist due to uncertainty surrounding the COVID-19 variants.
Sales tax revenue continues to rebound rapidly in 2023, with growth of 12.3 percent. In 2024 and 2025, sales tax revenue is forecast to average growth of 6.7 percent, reflecting healthy wage growth, steady growth in tourism reaching pre-COVID levels by 2025 and a return to a stable macro economy.

Budget and Financial Plan Summary Fiscal Year 2022
45
UTILITY TAX
The utility tax is projected to account for 0.6 percent of total tax revenue in 2022, or $374 million.
2021 Forecast: Utility tax revenue is forecast at $357 million, a 0.2 percent increase compared to the prior year, essentially unchanged compared to the January 2021 Plan. Year-to-date collections through March decreased 2.2 percent from the prior year, likely resulting from a broad-based reduction in demand related to COVID-19. Fourth quarter utility tax revenue is forecast to be considerably higher than last year, due to colder weather late in winter as well as a pick-up in economic activity as the City eases restrictions.
2022 Forecast: Utility tax revenue is forecast at $374 million, growth of 4.8 percent over the current year, unchanged from the January 2021 Plan. With COVID-
19 impacts expected to decrease and as businesses begin to resume, an increase in energy demand is anticipated. Additionally, the New York Public Service Commission approved Consolidated Edison rate increases beginning calendar year 2020. Under the approved rate plan, electric rates will increase 4.2% in calendar year 2020, followed by a 4.7% increase starting January 2021 and another 4.0% jump for January 2022. Con Edison gas customers saw a rate hike of 7.5% in calendar year 2020, followed by an 8.8% increase in 2021 and a 7.2% spike in 2022. The growth in fiscal year 2022 reflects elevated electricity and natural gas prices, with normal temperatures expected to return.
Utility tax collections in 2023 are expected to be flat and grow by an average of 2.5 percent in 2024 & 2025 as the economy continues to expand.
UTILITY TAX 2012 - 2022
0
100
200
300
400
500
20222021202020192018201720162015201420132012
Fiscal Year
$ in
Mil
lion
s
Source: NYC OMB
Forecast

Budget and Financial Plan Summary Fiscal Year 2022
46
CIGARETTE TAX
Cigarette tax is forecast to account for 0.03 percent of total revenue in 2022, or $19 million.
2021 Forecast: Cigarette tax revenue is forecast at $20 million in 2021, a decline of 21.6 percent from 2020.
2022 Forecast: Cigarette tax is forecast at $19 million in 2022. This will represent a decline of 5.0 percent from the previous year. With a combined City and State tax on a pack of cigarettes at $5.85, New York relinquishes its position as the highest City/State cigarette tax levied in the country, coming second to Chicago. The high rate of cigarette taxes has led to a noticeable further decline in the amount of packs of cigarettes sold within New York City. The tax rate has either diverted purchases to jurisdictions outside the City with lower tax rates or a change to other alternatives.
CIGARETTE TAX 2012 - 2022
0
40
80
120
160
200
20222021202020192018201720162015201420132012
Fiscal Year
$ in
Mil
lion
s
Source: NYC OMB
Forecast
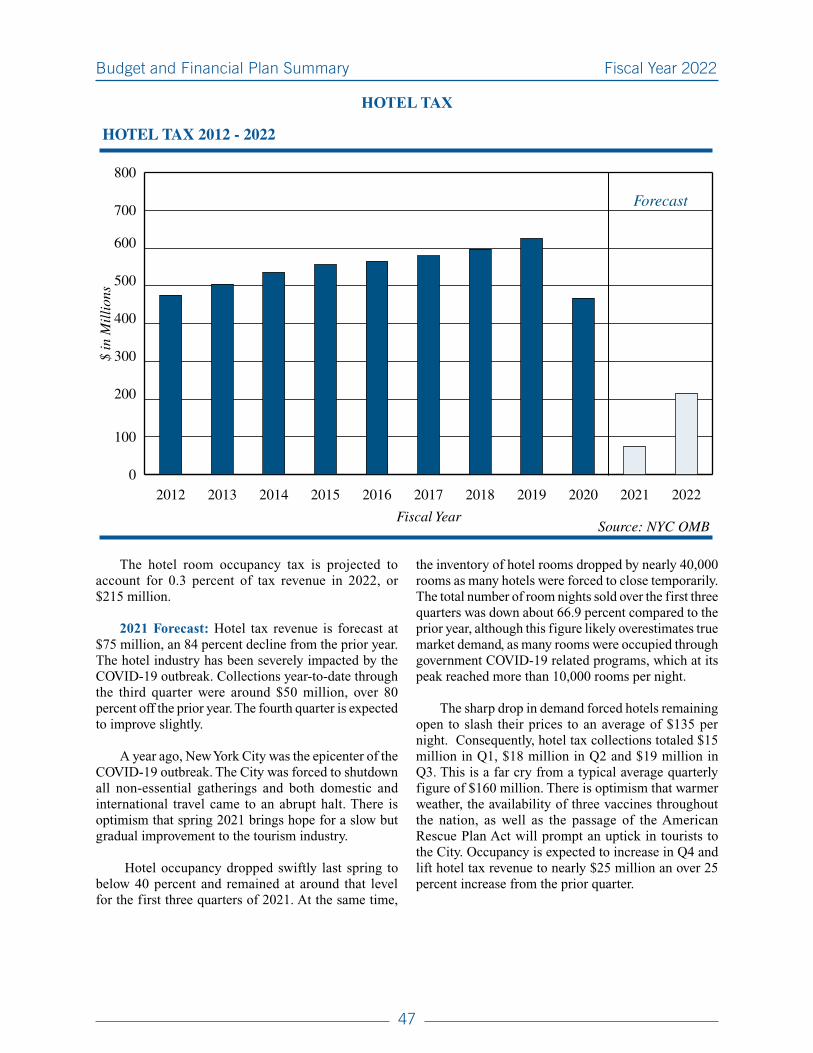
Budget and Financial Plan Summary Fiscal Year 2022
47
HOTEL TAX
The hotel room occupancy tax is projected to account for 0.3 percent of tax revenue in 2022, or $215 million.
2021 Forecast: Hotel tax revenue is forecast at $75 million, an 84 percent decline from the prior year. The hotel industry has been severely impacted by the COVID-19 outbreak. Collections year-to-date through the third quarter were around $50 million, over 80 percent off the prior year. The fourth quarter is expected to improve slightly.
A year ago, New York City was the epicenter of the COVID-19 outbreak. The City was forced to shutdown all non-essential gatherings and both domestic and international travel came to an abrupt halt. There is optimism that spring 2021 brings hope for a slow but gradual improvement to the tourism industry.
Hotel occupancy dropped swiftly last spring to below 40 percent and remained at around that level for the first three quarters of 2021. At the same time,
the inventory of hotel rooms dropped by nearly 40,000 rooms as many hotels were forced to close temporarily. The total number of room nights sold over the first three quarters was down about 66.9 percent compared to the prior year, although this figure likely overestimates true market demand, as many rooms were occupied through government COVID-19 related programs, which at its peak reached more than 10,000 rooms per night.
The sharp drop in demand forced hotels remaining open to slash their prices to an average of $135 per night. Consequently, hotel tax collections totaled $15 million in Q1, $18 million in Q2 and $19 million in Q3. This is a far cry from a typical average quarterly figure of $160 million. There is optimism that warmer weather, the availability of three vaccines throughout the nation, as well as the passage of the American Rescue Plan Act will prompt an uptick in tourists to the City. Occupancy is expected to increase in Q4 and lift hotel tax revenue to nearly $25 million an over 25 percent increase from the prior quarter.
HOTEL TAX 2012 - 2022
0
100
200
300
400
500
600
700
800
20222021202020192018201720162015201420132012
Fiscal Year
$ in
Mil
lion
s
Source: NYC OMB
Forecast

Budget and Financial Plan Summary Fiscal Year 2022
48
2022 Forecast: Hotel tax revenue is forecast at $215 million, a 186.7 percent increase over the current year, but still about $400 million below pre-covid levels. The gradual recovery that begins at the end of 2021 Q4 continues into 2022. Occupancy rates average 62 percent for the year, although the inventory remains 20,000 below pre pandemic levels. The total number of room nights sold reaches 22 million in FY 2022, a marked improvement over the estimated 9 million in all of FY 2021, but still over 15 million shy of the pre-COVID-19, 2019 figure of 38 million. The increased demand boosts room rates by 10 percent to $150 per night on average in 2022.
The hotel occupancy tax is expected to continue to improve in the out years, reaching pre-pandemic levels in fiscal year 2025 as demand returns and hotels reopen.
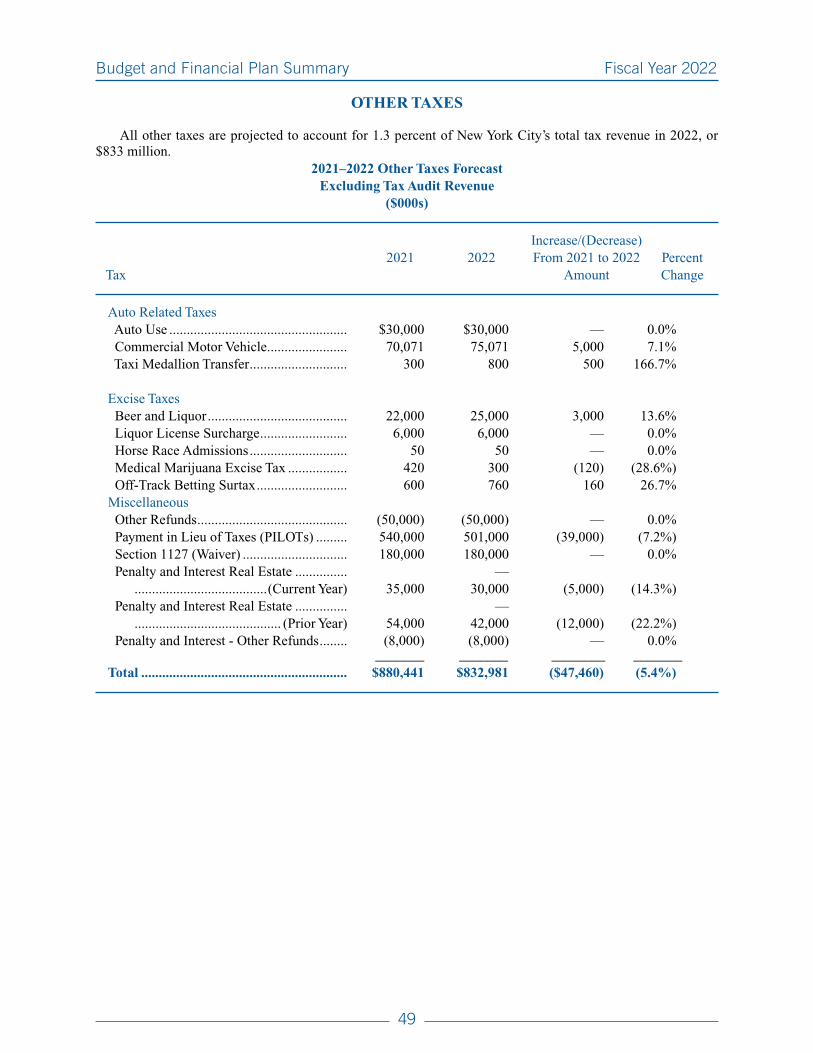
Budget and Financial Plan Summary Fiscal Year 2022
49
OTHER TAXES
All other taxes are projected to account for 1.3 percent of New York City’s total tax revenue in 2022, or $833 million.
2021–2022 Other Taxes ForecastExcluding Tax Audit Revenue
($000s)
Increase/(Decrease) 2021 2022 From 2021 to 2022 Percent Tax Amount Change
Auto Related Taxes Auto Use ................................................... $30,000 $30,000 — 0.0% Commercial Motor Vehicle....................... 70,071 75,071 5,000 7.1% Taxi Medallion Transfer ............................ 300 800 500 166.7%
Excise Taxes Beer and Liquor ........................................ 22,000 25,000 3,000 13.6% Liquor License Surcharge ......................... 6,000 6,000 — 0.0% Horse Race Admissions ............................ 50 50 — 0.0% Medical Marijuana Excise Tax ................. 420 300 (120) (28.6%) Off-Track Betting Surtax .......................... 600 760 160 26.7%Miscellaneous Other Refunds ........................................... (50,000) (50,000) — 0.0% Payment in Lieu of Taxes (PILOTs) ......... 540,000 501,000 (39,000) (7.2%) Section 1127 (Waiver) .............................. 180,000 180,000 — 0.0% Penalty and Interest Real Estate ............... — ......................................(Current Year) 35,000 30,000 (5,000) (14.3%) Penalty and Interest Real Estate ............... — .......................................... (Prior Year) 54,000 42,000 (12,000) (22.2%) Penalty and Interest - Other Refunds ........ (8,000) (8,000) — 0.0%
_______ _______ ________ _______Total ........................................................... $880,441 $832,981 ($47,460) (5.4%)

Budget and Financial Plan Summary Fiscal Year 2022
50
Auto Use Tax: This tax is imposed by the City on privately-owned vehicles at an annual rate of $15 per vehicle. The tax is administered by the State Department of Motor Vehicles, with an administrative charge levied on the City for this service. The Auto Use tax is expected to generate $30 million in both 2021 and 2022.
Commercial Motor Vehicle Tax: This tax is levied on vehicles used for transportation of passengers (medallion taxi cabs, omnibuses and other for-hire passenger vehicles) and all other commercial trucks and vehicles. The tax is administered the State Department of Motor Vehicles and is charged at different rates depending on the purpose for which the vehicles are used. The annual rate for other commercial vehicles (weighing less than 10,000 pounds) is $40, with rates increasing progressively for heavier vehicles. Trucks weighing 15,000 pounds pay the highest rate of $300 per year. Medallion taxicabs pay twice a year (December and June), while owners of other types of commercial vehicles pay annually (June). This tax is forecast to generate $70.1 million in 2021 and $75.1 million 2022.
Taxi Medallion Transfer Tax: This tax is imposed at a rate of 0.5 percent on consideration paid for the transfer of taxicab licenses (medallions). The rate was reduced from 5.0 percent to 0.5 percent in 2017. The tax is administered by the NYC Taxi and Limousine Commission. This tax is forecast to generate $300 thousand in 2021 and $800 thousand in 2022.
EXCISE TAXES
Beer and Liquor Excise Tax: This tax is imposed on licensed distributors and non-commercial importers on the sale of beer and liquor within New York City. The current tax rate is 12 cents per gallon of beer and 26.4 cents per liter of liquor with alcohol content greater than 24 percent. The City does not impose a tax on wine. This tax is administered by New York State and is forecast to generate $22 million in 2021 and $25 million in 2022.
Horse Race Admission Tax: This is a 3.0 percent tax imposed on the price of all paid admissions to horse races on grounds or enclosures located wholly or partially within New York City. This tax is forecast to generate $50 thousand in 2021 and 2022.
Liquor License Surcharge: This tax is imposed on distributors and non-commercial importers of beer and liquor at the rate of 25 percent of license fees payable under the New York State Alcoholic Beverage Control Law. This tax is forecast to generate $6 million in 2021 and 2022.
Medical Marijuana Excise Tax: The City of New York has received payments from the New York State medical marijuana trust fund since July 2016. This represents 22.5 percent of the New York State medical marijuana excise tax revenue collected in New York City. This tax is forecast to generate $420 thousand in 2021 and $300 thousand in 2022.
Off-Track Betting Surtax: This is a surcharge levied on most bets placed at New York City Off-Track Betting offices and on most bets placed statewide on races held within New York City. This tax is forecast to generate $600 thousand in 2021 and $760 thousand in 2022.
MISCELLANEOUS
Other Refunds: These are refunds primarily paid out on the commercial rent tax, business taxes and Section 1127 (waiver) and are forecast at $50 million in 2021 and 2022.
Payments in Lieu of Taxes (PILOTs): PILOTs are contractual agreements between public agencies and private property owners. There are three primary sponsor agencies that serve as intermediaries between the City and the PILOT facility owners: New York City Housing Authority, Industrial Development Agency and Battery Park City Authority. The tax is forecast to generate a revenue of $540 million in 2021 and $501 million in 2022.
Section 1127 (Waiver): Under Section 1127 of the New York City Charter, the City may collect payments from non-resident employees of the City or any of its agencies in an amount equal to what their personal income tax liability would be if they were City residents. Revenue for this tax is forecast to generate $180 million in 2021 and 2022.
AUTO RELATED TAXES

Budget and Financial Plan Summary Fiscal Year 2022
51
Prior Year and Current Year Penalty and Interest - Real Estate: Taxpayers who do not pay their real property tax on time are liable for interest charges on outstanding balances. Penalties and interest received against current year delinquencies are forecast to at $35 million for 2021 and $30 million in 2022, while penalty and interest collections from prior year delinquencies are expected to be $54 million for 2021 and $42 million for 2022.
Penalty and Interest – Other Refunds: The City currently pays out interest on refunds claimed for overpayment against business income taxes and on audits of business corporation and unincorporated business taxes already collected by the Department of Finance or overturned in Federal or State rulings. These refunds are forecast at $8 million in both 2021 and 2022.
TAX ENFORCEMENT REVENUE
As part of the City’s continuous tax enforcement efforts, the Department of Finance targets delinquent taxpayers through agency audit activities, the selected use of collection agencies, and computer matches. Audit revenue is forecast at $1.2 billion in 2021 and $921 million in 2022.
CITY TAX PROGRAM
Property tax rebate: To alleviate the tax burden on Class 1 homeowners, the City is proposing a one year $300 property tax rebate in 2022 for Class 1 primary homeowners. The rebate will be the lesser of $300 or the amount of annual tax liability on the property. Taxpayers are expected to save an estimated $90 million from this proposal.
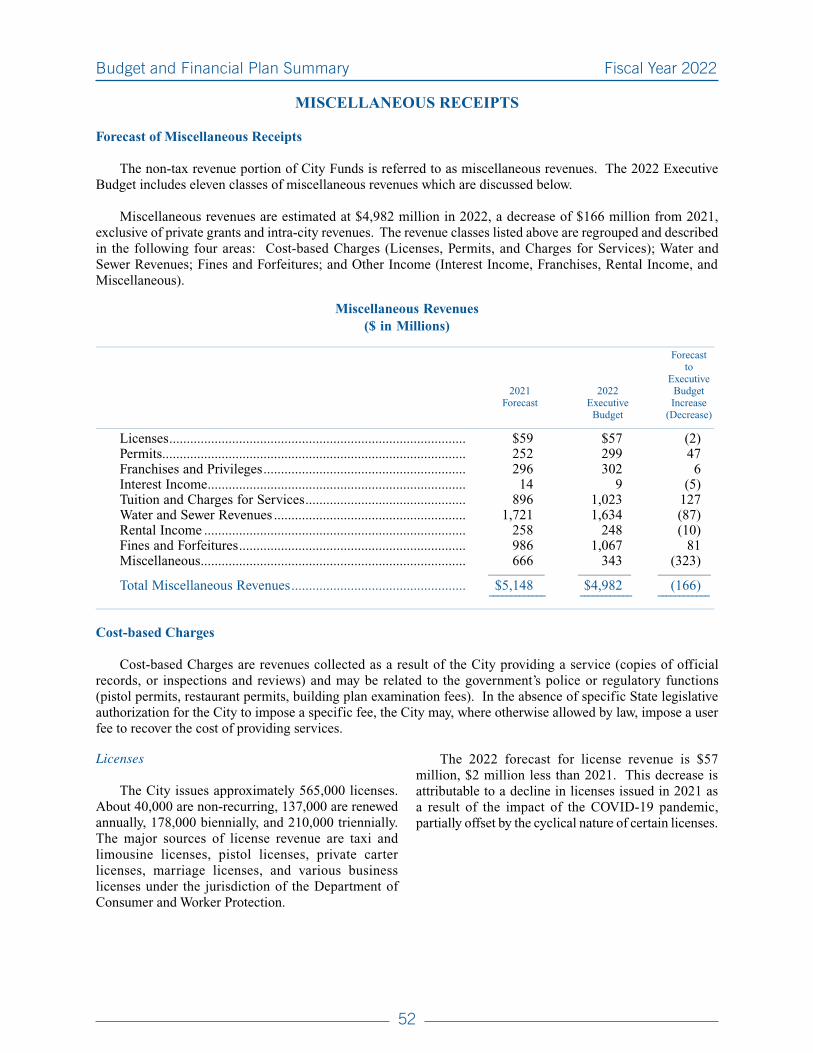
Budget and Financial Plan Summary Fiscal Year 2022
52
MISCELLANEOUS RECEIPTS
Forecast of Miscellaneous Receipts
The non-tax revenue portion of City Funds is referred to as miscellaneous revenues. The 2022 Executive Budget includes eleven classes of miscellaneous revenues which are discussed below.
Miscellaneous revenues are estimated at $4,982 million in 2022, a decrease of $166 million from 2021, exclusive of private grants and intra-city revenues. The revenue classes listed above are regrouped and described in the following four areas: Cost-based Charges (Licenses, Permits, and Charges for Services); Water and Sewer Revenues; Fines and Forfeitures; and Other Income (Interest Income, Franchises, Rental Income, and Miscellaneous).
Miscellaneous Revenues($ in Millions)
__________________________________________________________________________________________________________________________________________________________________________________________
Forecast to Executive 2021 2022 Budget Forecast Executive Increase Budget (Decrease) __________________________________________________________________________________________________________________________________________________________________________________________
Licenses ..................................................................................... $59 $57 (2)Permits....................................................................................... 252 299 47 Franchises and Privileges .......................................................... 296 302 6 Interest Income .......................................................................... 14 9 (5)Tuition and Charges for Services .............................................. 896 1,023 127 Water and Sewer Revenues ....................................................... 1,721 1,634 (87)Rental Income ........................................................................... 258 248 (10)Fines and Forfeitures ................................................................. 986 1,067 81 Miscellaneous ............................................................................ 666 343 (323)
_________________ ________________ ________________
Total Miscellaneous Revenues .................................................. $5,148 $4,982 (166) ============= ============ ============__________________________________________________________________________________________________________________________________________________________________________________________
Cost-based Charges
Cost-based Charges are revenues collected as a result of the City providing a service (copies of official records, or inspections and reviews) and may be related to the government’s police or regulatory functions (pistol permits, restaurant permits, building plan examination fees). In the absence of specific State legislative authorization for the City to impose a specific fee, the City may, where otherwise allowed by law, impose a user fee to recover the cost of providing services.
Licenses
The City issues approximately 565,000 licenses. About 40,000 are non-recurring, 137,000 are renewed annually, 178,000 biennially, and 210,000 triennially. The major sources of license revenue are taxi and limousine licenses, pistol licenses, private carter licenses, marriage licenses, and various business licenses under the jurisdiction of the Department of Consumer and Worker Protection.
The 2022 forecast for license revenue is $57 million, $2 million less than 2021. This decrease is attributable to a decline in licenses issued in 2021 as a result of the impact of the COVID-19 pandemic, partially offset by the cyclical nature of certain licenses.

Budget and Financial Plan Summary Fiscal Year 2022
53
Permits
Permits are issued to 1,141,000 individuals or entities for the use of facilities, premises or equipment. Approximately 252,000 permits are renewable on an annual, biennial or triennial basis. Seasonal or single occurrence permits, such as tennis and building permits, account for 889,000 additional permits, all of which are issued and regulated by twelve City agencies.
The major sources of revenue are permits for building construction and alterations, street openings, restaurants, hazardous materials, and air pollution control. The 2022 forecast for permit revenue is $299 million, $47 million more than 2021. The increase is due to a decline in receipts in 2021 for construction-related permits issued by the Department of Buildings due to the impact of the COVID-19 pandemic.
Tuition and Charges for Services
The City collects tuition from students enrolled at community colleges. In addition, the City collects money from charges to the public and other governmental agencies for services rendered. There are over 100 different service fees in this category, including fees for parking, towing, copies of certificates, processing applications, searches, and performing fire and building inspections. The 2022 forecast for tuition and charges for services is $1.023 billion, $127 million more than 2021. This increase is due to a decline in various fees collected in 2021 as a result of the impact of the COVID-19 pandemic including reduced booting and enforcement, reduced parking meter usage, special event cancellations, restricted camp activities and the closure of recreation centers. Tuition revenue was adjusted downward in 2021 to reflect student enrollment.
COMPONENTS OF MISCELLANEOUS REVENUES
As a Percentage of 2022
Source: NYC OMB
33% Water and SewerFines and 21%Forfeitures
Fines and 20% Forfeitures
Licenses, 13% Permits andFranchises
0% Interest Income
5% Rental Income
7% Miscellaneous
Tuition and 21% Charges for Services

Budget and Financial Plan Summary Fiscal Year 2022
54
Water and Sewer Revenues
Water and Sewer charges are collected by the New York City Water Board. From these charges the Board currently reimburses the City for the operation and maintenance (O&M) of the water delivery and waste water disposal systems. The O&M reimbursement is equal to the amount spent by the City to supply water and treat and dispose of waste water on behalf of the Board. The City is reimbursed only for its expenditures. The City will receive $1.634 billion for O&M services rendered in the delivery of water and the collection, treatment, and disposal of waste water.
Fines and Forfeitures
The City collects fine revenue through courts and administrative tribunals for violations issued under the New York City Administrative Code, New York State Vehicle and Traffic Law, and other laws. Forfeiture revenue is obtained from the surrender and conversion of bail and cash bonds, and contractors’ performance bonds. The 2022 forecast for forfeitures is $1.1 million. The revenue expected from fines in 2021 and 2022 is listed below:
Fine Revenue__________________________________________________________________________________________________________________________________________________________________________________________
2022 Type 2021 Executive ($ in 000’s) Forecast Budget__________________________________________________________________________________________________________________________________________________________________________________________
Parking Violations ..................................................................... $505,000 $556,920Speed Camera Violations .......................................................... 160,000 165,000Environmental Control Board Violations ................................. 101,000 116,775Department of Buildings Penalties ........................................... 88,000 80,000Red Light Camera Violations.................................................... 16,000 18,000Department of Health Violations .............................................. 7,400 15,000Taxi and Limousine Commission Violations ............................ 5,600 14,800Bus Lane Violations .................................................................. 15,000 10,000State Court Fines ....................................................................... 3,400 9,050Department of Consumer and Worker Protection ..................... 5,850 7,200Department of Finance Late Penalties ...................................... 13,400 5,400Traffic Violations ...................................................................... 768 0Other Sources ............................................................................ 63,825 68,089
_________________ __________________
Total ........................................................................................... $985,243 $1,066,234 ============== ===============
__________________________________________________________________________________________________________________________________________________________________________________________

Budget and Financial Plan Summary Fiscal Year 2022
55
The Parking Violation division of the Department of Finance is forecasted to collect $749.9 million in parking, red light, bus lane, and speed camera fines in 2022, $53.9 million more than in 2021.
The Parking Violation division processes and adjudicates enforcement camera violations. The red light camera program is designed to promote safe, responsible driving by photographing and fining registrants of vehicles “running” red lights. The Department of Transportation currently has 211 red light cameras operating at 150 intersections. Red light camera violations will generate $18 million in 2022. In addition, the Department operates a fixed bus lane camera enforcement program along 30 MTA regular and Select Bus Service routes. The Department also partners with New York City Transit to operate bus-mounted cameras on six Select Bus Service routes. The revenue from these mobile cameras is remitted to New York City Transit. The Department will generate approximately $10 million from fixed bus lane cameras in in 2022. Legislation passed in 2019 authorizes the Department to use speed camera enforcement in 750 school zones. Currently, 1219 fixed and 40 mobile cameras are operational within the authorized zones. Speed cameras must be placed within a quarter mile radius of a school and can operate on weekdays between 6:00 a.m. and 10:00 p.m. Collections are expected to be $165 million in 2022.
The Office of Administrative Trials and Hearings is comprised of several administrative tribunals: Health, Taxi and Limousine Commission, and the Environmental Control Board. The Environmental Control Board adjudicates violations issued by over a dozen City agencies for infractions of the City’s Administrative Code related to street cleanliness, waste disposal, street peddling, fire prevention, air, water and noise pollution, building safety and construction, and other quality of life issues. Revenue from these violations is expected to generate $135 million in 2022.
The Department of Consumer and Worker Protection enforces the City’s consumer protection, licensing, tobacco, municipal workplace, and Truth-in-Pricing laws. In 2022, the Department will generate $7.2 million in fine revenue, an increase of $1.4 million from 2021. The increase is due to a decline in 2021 collections attributable to the impact of the COVID-19 pandemic. The Department of Consumer and Worker Protection will continue its enforcement strategy which includes an expanded emphasis on education and outreach. The Department will also expand the universe of violations that will have cure periods.
The Department of Finance assesses penalties for failure to timely file Real Property Income and Expense statements and Real Property Transfer documents. The Department’s enforcement efforts are expected to improve compliance due to increased penalties for non-filers who have not filed for 3 consecutive years. It is anticipated that penalties issued will drop to $5.4 million in 2022.
Revenue is also collected from certain fines adjudicated through the State-operated Criminal and Supreme Court system; revenue net of state processing costs is collected from the adjudication of traffic violations issued in the City of New York. As a result of the COVID-19 pandemic, traffic violation issuance has declined to the point where no net revenue is expected above the State processing costs for 2022. In addition, the City collects fines for administrative code violations and building code violations.

Budget and Financial Plan Summary Fiscal Year 2022
56
Other Income
Other income includes interest earned on the City’s cash balances, concession and franchise payments, rental income, and income from other areas in which productivity may have a positive effect on the amount of revenue collected. Each of the sources included in this area has its own unique basis for management and improvement, some of which are directly affected by the City’s policy toward such varied items as housing, economic development, and transportation issues.
Interest Income
The City earns interest income by investing funds from four sources: overnight cash balances, debt service accounts, sales tax, and cash bail balances. Overnight cash balances are invested and historically earn interest at approximately the federal funds rate. Property tax receipts are held by the State Comptroller to satisfy City debt service payments, and earnings are forwarded to the City monthly based on bond payment schedules. The determinants of the value of this revenue source are the value of cash balances, tax receipts, available investment instruments, and the interest rate.
The 2022 forecast for interest earnings is $9 million, a decrease of $5 million from 2021. This decrease is attributable to a decline in the projected federal funds rate for 2022 and higher earnings on long term investments made in 2020 that matured in 2021.
Franchises and Privileges
This revenue consists of franchise fees for the public use of City property and privilege and concession fees for the private use of City property. These uses include conduits that run under City streets, concessions in public parks and buildings, and payments from utility companies for transformers on City property.
The 2022 forecast for franchise revenue is $302 million, $6 million more than in 2021. The increase is attributable to an increase in concession revenues collected by the Department of Parks and Recreation in 2022 as revenues recover from the impact of the COVID-19 pandemic.
Rental Income
Rental income is derived from both long and short-term agreements for the occupancy of City-owned property, including condemnation sites and in rem buildings. Roughly 2,500 properties are rented from the City. Approximately 500 are in rem or condemnation sites, 200 are covered by long term agreements, and nearly 1,800 are schools that are rented on a per event basis after school hours.
The 2022 forecast for rental income is $248 million, $10 million less than in 2021. The decrease is a result of declining rental income for DCAS managed properties, and a one-time payment received from the Port Authority in 2021 as a result of the Airport lease extension.
Miscellaneous
Miscellaneous revenue is composed of a variety of revenues not otherwise classified in the City’s Chart of Accounts. The primary items are the sale of City assets, cash recoveries from litigation and audits, E-911 telephone surcharges, revenue from Police Department Property Clerk auctions, refunds of prior year expenditures, the sale of the City Record and other publications, and subpoena fees. This source of revenue has, at times, contributed significantly to the miscellaneous receipts.
The 2022 forecast for miscellaneous revenue is $343 million, $323 million less than in 2021. The decrease is related to one-time revenue in 2021 including the collection of a debt service payment from H+H, settlement from the UPS case and the one time purchase of residual interest from securitized loan transactions.

Budget and Financial Plan Summary Fiscal Year 2022
57
Private Grants
The Executive Budget includes $1,025 million in private grants in 2022, $96 million less than 2021. Additional private grant funding will be modified into the budget during the course of the year, as additional funding sources are identified, and grants are defined.
Interfund Revenues
Interfund Revenues (IFA’s) are reimbursements from the Capital Fund to the General Fund for authorized first-line architectural, engineering, and design costs incurred by the City’s own engineering and support staff. These costs also include employee costs for expenses incurred in connection with eligible capital projects for the development of computer software, networks and systems. All IFA costs are assigned to particular capital projects and are valid capital charges under generally accepted accounting principles. In 2022 expected reimbursements will be $724 million.

Budget and Financial Plan Summary Fiscal Year 2022
58
CAPITAL BUDGET
The Executive Capital Budget and Four-Year Plan, 2022-2025
The 2022 Executive Capital Budget includes new appropriations of $15.5 billion, of which $14.6 billion are to be funded from City sources. These appropriations, together with available balances from prior years, authorize total commitments of $21.9 billion for 2022, of which $20.2 billion will be City-funded. City funds include proceeds from the New York City Municipal Water Finance Authority and the New York City Transitional Finance Authority as well as City general obligation bonds.
Four-Year Plan Highlights
The 2022-2025 Capital Plan totals $76.7 billion for the construction and rehabilitation of the City’s infrastructure. This will provide funding targeted to building and improving schools, maintaining the drinking water system, improving transportation, providing affordable housing, and building new borough based jail facilities.
The Capital Plan will provide $15.1 billion for new school construction and expansion, as well as the modernization, rehabilitation, and improvements to existing school buildings. The City will invest $3.1 billion to upgrade the operational integrity and resiliency of its wastewater resource recovery facilities, as well as $1.6 billion to address water quality problems from combined sewer overflow (CSO) discharges into the City’s waterways, partly through a combination of grey and green infrastructure. In addition, the City will invest $1.5 billion for the rehabilitation and construction of water supply tunnels and associated
infrastructure, including the Brooklyn/Queens section of City Tunnel No. 3, a tunnel between Kensico Reservoir and the Catskill/Delaware Ultraviolet Disinfection Facility, and Hillview Reservoir. The City will invest $5.1 billion to reconstruct and rehabilitate bridges to ensure a state of good repair, including the Henry Hudson Parkway Bridge over West 158th Street, the Grand Street Bridge over Newtown Creek, and the Trans-Manhattan Expressway. The City will also invest $1.1 billion to repave 1,100 vehicle lane miles and 50 bike lane miles of roadway per year. The City will provide $5.7 billion for the preservation and new construction of affordable housing for low to moderate incomes and those with special needs. Additionally, the City will provide $300.0 million to support NYCHA’s Rental Assistance Demonstration (RAD) transactions. The Capital Plan will also provide $5.5 billion for the design and construction of new borough based jail facilities.

Budget and Financial Plan Summary Fiscal Year 2022
59
FY 2021 - 2025 Commitment Plan($ in Millions)
2021 2022 2023 2024 2025 ____________________________ ___________________________ ____________________________ ____________________________ ___________________________
City All City All City All City All City All Funds Funds Funds Funds Funds Funds Funds Funds Funds Funds
Environmental Protection Equipment ................................... $65 $65 $55 $55 $19 $19 $24 $24 $215 $215 Sewers.......................................... 436 457 769 776 472 472 430 430 650 650 Water Mains, Sources & Treatment 463 464 377 377 462 516 714 733 693 819 Water Pollution Control .............. 785 805 1,638 1,811 1,113 1,172 738 756 1,131 1,131 Water Supply ............................... 497 497 49 49 16 16 757 757 634 634
____________________________ ___________________________ ____________________________ ____________________________ ___________________________
Subtotal ............................................. $2,246 $2,288 $2,888 $3,068 $2,081 $2,195 $2,663 $2,701 $3,322 $3,449
Transportation Mass Transit ................................ $1,338 $1,356 $40 $40 $40 $40 $130 $130 $500 $500 Bridges ........................................ 214 226 909 1,150 845 971 1,402 1,474 1,627 1,627 Highways ..................................... 556 676 853 978 1,180 1,235 761 789 1,527 1,576
____________________________ ___________________________ ____________________________ ____________________________ ___________________________
Subtotal ............................................. $2,109 $2,259 $1,803 $2,168 $2,065 $2,246 $2,293 $2,393 $3,654 $3,703 Education Education ..................................... $3,012 $3,214 $5,566 $5,566 $4,546 $4,546 $3,772 $3,772 $1,206 $1,206 Higher Education ........................ 42 42 115 119 138 138 165 165 138 138
____________________________ ___________________________ ____________________________ ____________________________ ___________________________
Subtotal ............................................. $3,054 $3,257 $5,680 $5,685 $4,685 $4,685 $3,937 $3,937 $1,344 $1,344 Housing & Economic Development Economic Development .............. $778 $920 $946 $1,101 $453 $456 $453 $463 $710 $737 Housing ....................................... 1,486 1,529 1,723 1,755 1,393 1,425 1,395 1,427 1,449 1,481
____________________________ ___________________________ ____________________________ ____________________________ ___________________________
Subtotal ............................................. $2,264 $2,449 $2,669 $2,856 $1,846 $1,881 $1,848 $1,889 $2,159 $2,218 Administration of Justice Corrections .................................. $79 $114 $786 $786 $1,333 $1,333 $1,937 $1,937 $2,316 $2,316 Courts .......................................... 43 44 271 274 205 208 275 279 263 263 Police ........................................... 144 144 451 492 162 164 47 47 340 340
____________________________ ___________________________ ____________________________ ____________________________ ___________________________
Subtotal ............................................. $267 $302 $1,508 $1,552 $1,700 $1,705 $2,258 $2,262 $2,918 $2,918 City Operations and Facilities Cultural Institutions .................. $76 $183 $173 $175 $122 $122 $442 $442 $179 $179 Fire .............................................. 135 152 172 207 252 278 179 205 161 161 Health & Hospitals ..................... 488 744 752 964 709 1,008 490 716 480 514 Parks ............................................ 757 848 1,018 1,205 366 445 834 941 2,293 2,293 Public Buildings .......................... 276 285 387 390 115 115 312 312 296 296 Sanitation .................................... 284 285 208 209 477 486 579 579 429 429 Resiliency, Technology & Equipment 859 1,099 1,875 2,207 1,062 1,062 804 804 1,041 1,041 Other ............................................ 2,062 2,142 1,093 1,257 864 948 805 853 968 1,013
____________________________ ___________________________ ____________________________ ____________________________ ___________________________
Subtotal ............................................. $4,937 $5,739 $5,678 $6,614 $3,967 $4,463 $4,446 $4,852 $5,845 $5,925
Total Commitments .......................... $14,877 $16,293 $20,226 $21,943 $16,345 $17,175 $17,445 $18,034 $19,244 $19,557
Reserve for Unattained Commitments .................................... ($4,421) ($4,421) ($3,195) ($3,195) ($771) ($771) ($655) ($655) ($859) ($859)
Commitment Plan ............................ $10,456 $11,872 $17,031 $18,748 $15,574 $16,404 $16,790 $17,379 $18,385 $18,698
Total Expenditures ........................... $9,025 $10,182 $10,602 $12,066 $12,262 $13,423 $12,993 $14,023 $14,197 $15,043
Note: Individual items may not add up due to rounding.

Budget and Financial Plan Summary Fiscal Year 2022
60
Non-City capital funding sources include $1.7 billion in the 2022 plan and $3.4 billion over the 2022-2025 four-year plan period. The majority of non-City funding supports Transportation, Hospitals, Environmental Protection, Parks, and Resiliency Measures.
Transportation programs are projected to receive non-City funding of $923.9 million over the 2022-2025 period, with $722.0 million from the Federal government, $165.9 million from the State, and private funds of $36.0 million. Hospitals programs are projected to receive $767.0 million in Federal funding
over the 2022-2025 period. Environmental Protection programs anticipate receiving $458.5 million over the 2022-2025 period, with $258.0 million from the Federal government, $200.0 million from the State, and $0.5 million from private funds. Parks programs are projected to receive $373.0 million over the 2022-2025 period, with $319.8 million from the Federal government, $34.7 million from private funds, and $18.5 million from the State. Resiliency Measures anticipate receiving $331.9 million over the 2022-2025 period, with $217.8 from the Federal government and $114.1 from private funds.
Non-City Funding Sources
FY 2017 - 2025 CAPITAL COMMITMENTS BY FUNDING SOURCE
0
5
10
15
20
20252024202320222021*2020201920182017Fiscal Year
* Projected
Actual Commitment 2022 Executive Commitment Plan
$ in
Bil
lion
s
Non-City Funding
Water Authority Funding
Other City Funding
Source: NYC OMB

Budget and Financial Plan Summary Fiscal Year 2022
61
The Capital Program since 2017
The table below illustrates the changes in the size of the City’s capital program over the 2017-2020 period.
FY 2017-2020 COMMITMENTS($ in Millions)
2017 2018 2019 2020 City All City All City All City All Funds Funds Funds Funds Funds Funds Funds Funds
Environmental Protection Equipment ..................................................... $86 $86 $53 $53 $113 $113 $13 $13 Sewers ............................................................ 670 685 637 652 463 471 303 323 Water Mains, Sources and Treatment ............ 867 883 620 624 534 538 175 176 Water Pollution Control ................................. 667 675 362 371 843 847 474 484 Water Supply ................................................. 162 162 225 225 62 62 33 33
Subtotal ............................................................... $2,452 $2,491 $1,896 $1,925 $2,015 $2,032 $999 $1,029
Transportation Mass Transit................................................... $76 $80 $169 $169 $432 $433 $117 $117 Bridges ........................................................... 327 598 988 1,235 382 447 61 108 Highways ....................................................... 505 631 663 776 527 613 404 452
Subtotal ............................................................... $908 $1,310 $1,821 $2,180 $1,342 $1,493 $582 $677
Education Education ....................................................... $3,073 $3,136 $3,029 $3,546 $3,620 $3,993 $2,703 $2,802 Higher Education ........................................... 33 33 79 79 77 77 42 42
Subtotal ............................................................... $3,106 $3,169 $3,108 $3,625 $3,697 $4,071 $2,745 $2,845
Housing & Economic Development Economic Development ................................ $325 $342 $301 $320 $378 $397 $272 $276 Housing ......................................................... 852 880 1,191 1,231 1,484 1,509 680 700
Subtotal ............................................................... $1,177 $1,222 $1,492 $1,551 $1,863 $1,906 $952 $976
Administration of Justice Correction ...................................................... $58 $61 $29 $34 $30 $58 $40 $42 Courts ............................................................ 24 26 19 27 28 29 4 4 Police ............................................................. 204 204 327 327 187 194 128 128
Subtotal ............................................................... $286 $291 $376 $388 $246 $282 $172 $174
City Operations & Facilities Cultural Institutions ....................................... $65 $148 $70 $75 $215 $217 $128 $126 Fire ................................................................. 122 123 85 86 97 103 107 115 Health & Hospitals ........................................ 160 224 237 301 328 526 373 582 Parks .............................................................. 530 586 410 437 479 537 305 333 Public Buildings ............................................ 72 72 101 101 140 140 197 197 Sanitation ....................................................... 256 258 296 289 287 286 266 267 Resiliency, Technology & Equipment ........... 403 403 253 253 284 284 297 313 Other .............................................................. 380 565 682 751 663 730 403 430
Subtotal ............................................................... $1,988 $2,378 $2,135 $2,294 $2,492 $2,822 $2,075 $2,362
Total Commitments ............................................ $9,916 $10,860 $10,827 $11,963 $11,654 $12,605 $7,525 $8,064
Total Expenditures ............................................. $7,444 $8,826 $8,887 $9,640 $9,278 $10,848 $9,331 $9,774
Note: Individual items may not add up due to rounding.

Budget and Financial Plan Summary Fiscal Year 2022
62
Comprehensive Planning Process
Developing a long-term capital investment strategy to improve, expand and sustain the City’s physical plant requires comprehensive planning. The Ten-Year Capital Strategy, updated by OMB and the Department of City Planning every two years through consultation with City agencies, establishes overall programmatic goals. The Four-Year Plan, revised annually, is consistent with the basic priorities established in the Ten-Year Capital Strategy. As annual budgets are prepared, goals are adjusted to reflect newly-identified needs and changes in mandated programs within the context of the City’s Ten-Year Capital Strategy and Four-Year Plan.
Ten-Year Capital Strategy 2022-2031($ in Thousands)
City Funds Non-City Funds Total Funds Environmental Protection
• Sewers ................................................................................................... $5,389,466 $9,186 $5,398,652 • Water Mains, Sources and Treatment................................................... 5,551,872 203,277 5,755,149 • Water Pollution Control ........................................................................ 8,106,143 409,927 8,516,070 • Water Supply ........................................................................................ 2,386,654 0 2,386,654 • DEP Equipment .................................................................................... 611,824 576 612,400 Subtotal Environmental Protection .......................................................... $22,045,959 $622,966 $22,668,925
Education
• Education .............................................................................................. $22,199,930 $0 $22,199,930 • CUNY ................................................................................................... 766,943 4,139 771,082 Subtotal Education ................................................................................... $22,966,873 $4,139 $22,971,012
Transportation
• Mass Transit .......................................................................................... $1,700,000 $0 $1,700,000 • Highways & Transit Operations ........................................................... 10,812,761 891,765 11,704,526 • Bridges .................................................................................................. 10,561,796 579,593 11,141,389 Subtotal Transportation ............................................................................ $23,074,557 $1,471,358 $24,545,915
Housing & Economic Development
• Housing ................................................................................................. $11,911,586 $320,000 $12,231,586 • Housing Authority ................................................................................ 2,893,488 0 2,893,488 • Economic Development ........................................................................ 4,778,058 220,545 4,998,603 Subtotal Housing & Economic Development .......................................... $19,583,132 $540,545 $20,123,677
Administration of Justice
• Correction ............................................................................................. $9,556,925 $0 $9,556,925 • Police .................................................................................................... 1,455,997 43,200 1,499,197 • Courts .................................................................................................... 2,516,150 9,639 2,525,789 Subtotal Administration of Justice ........................................................... $13,529,072 $52,839 $13,581,911
Health & Social Services
• Health ................................................................................................... $1,059,603 $9,511 $1,069,114 • Hospitals ............................................................................................... 2,533,334 767,010 3,300,344 • Homeless Services ................................................................................ 668,309 1,731 670,040 • Human Resources ................................................................................. 338,526 92,940 431,466 • Children’s Services ............................................................................... 445,455 39,091 484,546 • Aging ..................................................................................................... 51,305 0 51,305 Subtotal Health & Social Services ........................................................... $5,096,532 $910,283 $6,006,815
Other City Services
• Sanitation .............................................................................................. $3,342,310 $10,355 $3,352,665 • Public Buildings .................................................................................... 2,120,907 2,400 2,123,307 • Fire ........................................................................................................ 1,325,541 86,561 1,412,102 • Parks & Recreation ............................................................................... 5,208,792 404,489 5,613,281 • Cultural Institutions & Libraries .......................................................... 1,959,706 18,674 1,978,380 • Resiliency, Technology & Equipment ................................................. 9,035,360 331,897 9,367,257 Subtotal Other City Services .................................................................... $22,992,616 $854,376 $23,846,992
Total ......................................................................................................... $129,288,741 $4,456,506 $133,745,247

Budget and Financial Plan Summary Fiscal Year 2022
63
2022 Ten–Year Capital Strategy Highlights
TEN-YEAR CAPITAL STRATEGY FOR 2022 - 2031
17%
17%
17%
11%
10%
5%
4%
4%
3%
12%
$22,846
22,669
22,200
15,125
13,582
6,398
5,613
4,999
4,369
15,944
% of Plan Program FY 2022to FY 2031
Total $133,745
Parks
EnvironmentalProtection
Education
EconomicDevelopment
Housing
Health& Hospitals
OtherCity
Services
($ in Millions - All Funds)
Bridges & Highways
Environmental Protection
Education
Housing
Administration of Justice
Resiliency & Energy Efficiency
Parks
Economic Development
Health & Hospitals
Other City Services
Source: NYC OMB
Resiliency& Energy Efficiency
Bridges &Highways
Adminof Justice
Technology
• Information and Communication Systems: Broadband Initiative, including the expansion of wireless access for City residents ($107.0 million); DoITT Enterprise Online Services project to ensure continued licensing coverage for additional Agency users, Citywide ($49.4 million); and DCWP Licensing Automation System and Online Licensing Portal ($14.8 million).
Environmental Protection and Sanitation
• Sewers: continued replacement of chronically failing components ($1.6 billion); Southeast Queens sewer work ($1.6 billion); emergency replacement of malfunctioning or collapsed sewers ($749.2 million); and site acquisition and construction for the Staten Island Bluebelt program ($222.1 million). The total Sewers program for 2022-2031 is $5.4 billion.
• Water Mains, Sources and Treatment: continued in-City water main construction and ancillary work ($2.9 billion), including various state of good repair projects, Citywide ($2.0 billion), water main rehabilitation in partnership with DOT street reconstruction and Vision Zero projects ($371.4 million), and emergency reconstruction of failing infrastructure ($300.4 million); and continued improvements to infrastructure associated with water supply systems ($2.8 billion), including the rehabilitation of the Ashokan Reservoir, Olive Bridge Dam, and Dividing Weir Bridge ($1.1 billion) and projects related to the Filtration Avoidance Determination ($191.7 million). The total Water Mains, Sources, and Treatment program for 2022-2031 is $5.8 billion.
• Wastewater Treatment: conducting essential projects at wastewater resource recovery facilities and related infrastructure to sustain uninterrupted wastewater treatment operation ($5.1 billion); addressing water quality problems attributed to

Budget and Financial Plan Summary Fiscal Year 2022
64
combined sewer overflow (CSO) discharges into the City’s surrounding waterways during wet weather conditions ($2.6 billion); and working with multiple City agencies to construct, install, and maintain various Green Infrastructure projects for stormwater capture, such as bioswales, tree pits, constructed wetlands, and green roofs ($569.9 million). The total Wastewater Treatment program for 2022-2031 is $8.5 billion.
• Water Supply: construction of a tunnel connecting the Kensico Reservoir to the Catskill/Delaware Ultraviolet Light Facility, necessary to provide redundancy in the water supply system ($1.6 billion); modification of chambers at Hillview Reservoir ($481.3 million); and construction of the remaining shafts of the Brooklyn/Queens Leg of City Tunnel No. 3 ($179.6 million). The total Water Supply program for 2022-2031 is $2.4 billion.
• Equipment: reconstruction of agency facilities ($165.9 million); relocation of private utilities in coordination with sewer and water main work ($162.6 million); management information systems ($118.3 million); and continued water conservation programs ($90.9 million), including the installation of large water meters ($47.0 million). The total Equipment program for 2022-2031 is $612.4 million.
• Sanitation: replacement of vehicles ($1.9 billion); component rehabilitation and construction of other garages ($574.8 million); construction of a new garage for Bronx Community Districts 9, 10, and 11 ($287.6 million); construction of a new garage for Manhattan Community Districts 6 and 8 ($199.7 million); construction of a new garage for Queens Community District 1 ($142.6 million); construction and renovation of transfer stations and other facilities in accordance with the City’s Long Term Solid Waste Management Plan ($156.0 million); and purchases of information technology and telecommunications equipment ($49.8 million).
Transportation
• Bridges: rehabilitation of bridges, including Brooklyn-Queens Expressway (BQE) bridges ($1.5 billion) and the Trans-Manhattan Expressway ($421.6 million); bridge protective coating projects ($533.7 million); and continued reconstruction and rehabilitation for the East River bridges, including the Williamsburg Bridge ($155.8 million). The total Bridge Program for 2022-2031 is $11.1 billion.
• Highways: street reconstruction ($3.5 billion); street and arterial resurfacing of approximately 11,000 vehicle lane miles and 500 bike lane miles ($3.0 billion); installation and rehabilitation of pedestrian ramps ($2.7 billion); and replacement of sidewalks ($515.3 million). The total Highways Program for 2022-2031 is $10.2 billion.
• Traffic: signal installation ($654.4 million); upgrade and replacement of lampposts, luminaires, and associated infrastructure ($101.8 million); and installation of streetlights, signals and lane markings associated with the Highway and Bridge Programs ($82.2 million). The total Traffic Program for 2022-2031 is $1.0 billion.
• Ferries: ferry terminal building improvements ($320.1 million); and ferry boats ($132.4 million). The total Ferries Program for 2022-2031 is $452.5 million.
• Transit: contributions to the MTA’s capital program, including subway and bus fleet enhancements, infrastructure improvements, in-house track rehabilitations, and reconstruction of bus and subway lines for New York City. The Transit program for 2022-2031 is $1.7 billion.

Budget and Financial Plan Summary Fiscal Year 2022
65
Education, Health and Social Services
• Education: rehabilitate, replace, and upgrade building components ($6.8 billion); construct new schools ($5.6 billion); cover emergency projects, research and development, and prior plan completion costs ($4.1 billion); capital improvements that enhance educational programs ($2.8 billion); expand facilities through leases, Universal 3-K, building additions, gymnasiums, athletic fields, and playgrounds ($2.3 billion); and address the need for security systems, emergency lighting, and code compliance ($533.9 million). The total Education program for 2022-2031 is $22.2 billion.
• Higher Education: miscellaneous reconstruction and new construction ($717.3 million); and data processing and other equipment ($49.9 million). The total Higher Education program for 2022-2031 is $771.1 million.
• Health: NYC Health + Hospitals (H+H) facility infrastructure improvements ($2.5 billion); a new Public Health Laboratory ($535.8 million); ambulance purchases ($424.3 million); various public health facility renovations and rehabilitation ($163.5 million); system-wide equipment purchases ($122.4 million); animal care centers and other animal welfare investments ($115.5 million); technology infrastructure improvements for the Department of Health and Mental Hygiene ($77.3 million); IT infrastructure upgrades ($71.8 million); technology and laboratory equipment upgrades for the Office of the Chief Medical Examiner ($64.2 million); revenue cycle management system upgrades ($46.1 million); and electronic medical record system upgrades ($44.9 million).
• Aging: rehabilitation of senior centers, with focus on structural and accessibility issues ($36.4 million); and computer and network upgrade and equipment purchase ($14.9 million).
• Administration for Children’s Services: renovation and upgrades of Juvenile Detention Facilities ($327.2 million); telecommunications and data infrastructure upgrades and improvements ($84.6 million); and renovation and upgrades of facilities ($54.0 million).
• Homeless Services: renovation and upgrade of adult shelters ($423.9 million); renovation and upgrade of family shelters ($210.3 million); and computer network upgrade and equipment purchases ($35.8 million).
• Human Resources: construction and initial outfitting for citywide facilities ($279.0 million); data infrastructure upgrades and improvements ($116.5 million); telecommunications ($30.7 million); and automotive equipment ($5.0 million).
Housing and Development
• Housing: provision of low-interest loans to finance the preservation or creation of affordable housing in privately-owned buildings through preservation ($4.2 billion), new construction ($4.0 billion), supportive housing ($2.9 billion), and disposition programs ($597.0 million); and funding for technology, infrastructure, demolition, and other ancillary investments to fulfill the goals of the Housing New York 2.0 Plan ($215.0 million).
• Housing Authority: funding to meet the requirements of NYCHA’s Consent Decree with SDNY ($2.1 billion); and upgrades to building exteriors and systems, including roof replacement, lead abatement, pest mitigation, elevator rehabilitation, upgrades to heating components, improvements to common areas and other construction projects ($843.5 million).
• Economic Development: Neighborhood Development Fund to help provide for critical infrastructure work for re-zonings proposed in neighborhood plans developed by the Department of City Planning ($680.8 million); development, management and rehabilitation of City-owned waterfront sites, Citywide, including Phase 1 and II of Stapleton Waterfront ($552.8 million); various development and infrastructure improvements at the Brooklyn Navy Yard ($546.2 million); funding for the Mayor’s Life Sciences Initiative ($514.2 million); development of the Manhattan Greenway, a continuous 32.5-mile route around Manhattan intended to transform the waterfront into a green attraction for recreational and commuting use ($465.2 million); infrastructure work to support affordable housing sites in the five boroughs ($325.6 million); subgrade improvements at Willets Point West ($172.4 million); rehabilitation of existing structures, public access improvements, and infrastructure upgrades to support public open space and future redevelopment at Governors Island ($158.1 million); purchase new ferries and infrastructure work for the NYC Ferry System ($133.3 million); and development of Made in New York Campus at Bush Terminal ($115.3 million).

Budget and Financial Plan Summary Fiscal Year 2022
66
Administration of Justice and Public Safety
• Correction: new jail facilities ($8.1 billion); improvements to building systems, infrastructure and support space including a new training academy ($1.2 billion); and lifecycle replacement of equipment ($297.1 million).
• Courts: infrastructure and operational improvements of courts facilities ($1.9 billion); fire/life safety work ($309.3 million); exterior renovations ($103.1 million); electrical upgrades ($99.1 million); elevator upgrades ($72.4 million); and HVAC improvements ($63.0 million).
• Police: construction, rehabilitation and relocation of facilities, Citywide ($783.4 million); lifecycle replacement of vehicles ($274.9 million); replacement and upgrade of critical network infrastructure equipment and data management systems ($202.2 million); replacement and upgrade of portable radios, radio equipment, infrastructure and systems ($191.9 million); and replacement and upgrade of general equipment, Citywide ($46.8 million).
• Fire: mandated and support vehicle replacements and necessary fire-fighting tools and equipment ($632.6 million); replacement of building components within FDNY facilities ($482.2 million); replacement and upgrade of electronic data processing equipment components ($94.0 million); replacement of conduit and wiring in the inundation zones for the Department’s outside cable plant that was damaged during Hurricane Sandy ($91.4 million); design and construction of new FDNY facilities ($46.2 million); radio and telecommunication equipment upgrades ($25.3 million); upgrade of the 911 communications system infrastructure ($20.4 million); cabling and components to support the Department’s fire alarm box network ($13.3 million); and upgrades to the administrative systems and applications ($6.7 million).
Recreation and Culturals
• Parks: rehabilitation of Parks-owned pedestrian bridges, Citywide ($1.3 billion), including Riverside Park Amtrak Overbuild ($348.0 million), E.14th Street Flyover Bridge ($182.1 million), and reconstruction of 15 pedestrian bridges, Citywide, to ensure the safety and integrity of Parks-owned bridges ($382.9 million); reconstruction of recreation centers, Citywide ($657.0 million), including Shirley Chisholm Recreation Center in Brooklyn ($141.0 million), Roy Wilkins Park in Queens ($92.0
million), Red Hook Recreation Center in Brooklyn ($32.7 million), Hamilton Fish Recreation Center ($21.0 million) and Hansborough Recreation Center ($20.0 million) in Manhattan, and expansion and reconstruction of other recreation and nature centers, Citywide ($349.8 million); planting of new street trees and park trees, the reforestation and restoration of natural areas and the reconstruction of sidewalks damaged by trees, Citywide ($211.8 million); continued implementation of the Anchor Parks Initiative, which builds off of the Community Parks Initiative and directs capital funding to historically underfunded larger parks that are greater than six acres ($43.2 million); continued implementation of phases one and two of the Community Parks Initiative (CPI), which directs capital funding to historically underfunded parks in areas with high population density, high concentration of poverty, and above average population growth ($32.5 million); and funding to continue closing the Walk to a Park gap, including the renovation of schoolyards to allow them to be opened to the public outside of school hours, and the acquisition and development as parkland of public partnership and private sites ($27.7 million).
• Public Libraries: Queens Public Library improvements including expansion of the Arverne branch ($13.6 million), interior alteration and HVAC upgrade for the Hollis branch ($11.3 million), and renovations and ADA compliance upgrades at Astoria branch ($7.1 million); New York Public Library improvements including partial renovation of the Castle Hill branch ($8.3 million) and expansion of the Woodlawn branch ($8.0 million) in the Bronx, renovation of the Hudson Park branch ($6.2 million) and Hamilton Grange exterior rehabilitation ($4.5 million) in Manhattan, and new HVAC at the New Dorp branch in Staten Island ($3.3 million); and Brooklyn Public Library improvements including renovation of the Arlington branch ($8.2 million), renovation of the 2nd floor at the Midwood branch ($6.7 million), and upgrade of the teen center at the Carroll Garden branch ($4.2 million).
• Department of Cultural Affairs: renovation of the Visitor/Education Center at the Queens County Farm Museum ($21.1 million); renovation at the Nuyorican Poets Café ($19.0 million); electrical upgrade at the Bronx Zoo ($12.0 million); construction of the Sea Cliffs Exhibit at the New York Aquarium ($10.7 million); Clove Road Restoration at the Staten Island Zoo ($8.9 million); and phase 2 renovations of the Bronx Net ($3.3 million).

Budget and Financial Plan Summary Fiscal Year 2022
67
Department of Citywide Administrative Services
• Public Buildings: reconstruction and rehabilitation of public buildings and City-owned facilities ($686.4 million), including projects at the Manhattan Municipal Building ($153.6 million), 137 Centre Street ($45.0 million), 100 Gold Street ($42.7 million), 253 Broadway ($37.4 million), and 280 Broadway ($25.2 million) in Manhattan, 2556 Bainbridge Avenue ($34.7 million) and 1932 Arthur Avenue ($25.4 million) in the Bronx, Queens Borough Hall ($20.2 million), and 10 Richmond Terrace in Staten Island ($8.7 million); legal mandates ($645.0 million), including fire/life safety upgrades to ensure Local Law 5 compliance ($422.4 million), fuel tank replacement and remediation ($86.5 million), façade upgrades to ensure Local Law 11 compliance ($74.9 million), and upgrades to bathrooms and other facilities to ensure ADA compliance ($44.0 million); renovation of leased space ($360.5 million), including expansion of New York City Emergency Management’s leased space in Brooklyn ($85.0 million); equipment and interagency services ($139.3 million), including development of a Real Estate Management System ($5.3 million); renovation of other City-owned facilities ($105.0 million), including the reconstruction of 70 Mulberry Street ($80.0 million); miscellaneous construction at other facilities ($96.0 million); rehabilitation
of waterfront properties ($48.3 million) and non-waterfront properties ($3.5 million); acquisition of real property ($27.1 million); Board of Elections modernization ($10.4 million); rehabilitation of court buildings ($1.4 million); and communications equipment ($0.4 million).
• Energy Efficiency and Sustainability: energy efficiency measures and building retrofits ($3.8 billion), including funding for the Accelerated Conservation and Efficiency (ACE) Program ($161.5 million), solar panels at citywide facilities ($66.2 million), Local Law 87 deep retrofits ($14.8 million), and other energy efficiency upgrades for various projects ($3.5 billion). The One City, Built to Last plan will achieve an 80 percent reduction in GHG emissions from 2005 levels by 2050.
• Citywide Agency Facility and Operational Protective Measures: citywide agency resiliency and waterfront rehabilitation ($2.6 billion), including the East Side Coastal Resiliency project ($1.3 billion), the Brooklyn Bridge – Montgomery Coastal Resiliency project ($496.0 million), rehabilitation of the substructure of Harlem River Park between 132nd and 135th streets ($117.5 million), and rehabilitation of Pier 36 ($114.6 million).

Budget and Financial Plan Summary Fiscal Year 2022
68
Technology
• Information and Communication Systems: Broadband Initiative, including the expansion of wireless access for City residents ($107.0 million); DoITT Enterprise Online Services project to ensure continued licensing coverage for additional Agency users, Citywide ($49.4 million); and DCWP Licensing Automation System and Online Licensing Portal ($8.3 million).
Environmental Protection and Sanitation
• Sewers: resiliency measures at East River Park ($300.0 million); Southeast Queens Infrastructure build out ($173.2 million); continued replacement of chronically failing components ($103.5 million); and emergency replacement of failing sewer segments ($83.8 million). The total Sewers program for 2022 is $776.1 million.
• Water Mains, Sources and Treatment: continued reconstruction and improvements to infrastructure associated with water supply systems ($170.2
million), including projects related to the Filtration Avoidance Determination ($38.4 million); and continued in-City water main construction and ancillary work ($206.6 million), including various state of good repair projects, Citywide ($115.5 million), and water main rehabilitation in partnership with DOT street reconstruction and Vision Zero projects ($27.3 million). The total Water Mains, Sources, and Treatment program for 2022 is $376.8 million.
• Wastewater Treatment: conducting essential projects at wastewater resource recovery facilities and related infrastructure to sustain uninterrupted wastewater treatment operation ($1.2 billion); addressing water quality problems attributed to combined sewer overflow discharges into the City’s surrounding waterways during wet weather conditions ($303.3 million); and working with multiple City agencies to construct, install, and maintain various Green Infrastructure projects for stormwater capture, such as bioswales, tree pits, constructed wetlands, and green roofs ($209.3 million). The total Wastewater Treatment program for 2022 is $1.8 billion.
2022 Agency Highlights
2022 AUTHORIZED CAPITAL COMMITMENTS, BY PROGRAM
25%
14%
11%
10%
7%
6%
6%
5%
4%
12%
$5,566
3,068
2,436
2,158
1,552
1,414
1,205
1,101
964
2,479
% of Plan Program 2022 Plan
Total $21,943
Parks
Bridges &Highways
EnvironmentalProtection Education
EconomicDevelopment
Administrationof Justice
Housing
Health &Hospitals
($ in Millions - All Funds)
Education
Environmental Protection
Bridges & Highways
Housing
Administration of Justice
Resiliency & Energy Efficiency
Parks
Economic Development
Health & Hospitals
Other City Services
Source: NYC OMB
Resiliency &Energy
Efficiency
Other City
Services

Budget and Financial Plan Summary Fiscal Year 2022
69
• Water Supply: construction of a bypass tunnel for rehabilitation of the Delaware Aqueduct ($19.3 million); construction of a tunnel connecting the Kensico Reservoir and Catskill/Delaware Ultraviolet Light Disinfection Facility ($17.8 million); and engineering support contracts for various water supply projects ($8.4 million). The total Water Supply program for 2022 is $49.5 million.
• Equipment: continued water conservation programs ($14.1 million); fleet purchases ($8.4 million); and air monitoring and environmental compliance contracts ($7.2 million). The total Equipment program for 2022 is $55.4 million.
• Sanitation: component rehabilitation and construction of garages, Citywide ($131.9 million); replacement of vehicles and equipment ($45.8 million); construction and renovation of transfer stations and other facilities in accordance with the City’s Long Term Solid Waste Management Plan ($19.5 million); and information technology and telecommunications projects ($12.3 million).
Transportation
• Bridges: continued reconstruction and rehabilitation for the East River bridges including Williamsburg Bridge ($155.8 million); rehabilitation of bridges, including 5th Avenue Bridge over Long Island Rail Road in Brooklyn ($61.0 million); and bridge protective coating projects including Northern Boulevard over Flushing River ($18.1 million). The total Bridge Program for 2022 is $1.1 billion.
• Highways: street reconstruction ($399.7 million), which includes improvements on Delancey Street ($41.2 million) and Trinity Place ($40.3 million); primary and arterial street resurfacing of approximately 1,100 vehicle lane miles and 50 miles of bike lanes ($266.7 million); and reconstruction of sidewalks and pedestrian ramps ($253.4 million). The total Highways Program for 2022 is $978.5 million.
• Traffic: signal installation ($106.0 million); reconstruction of parking meters and facilities ($27.2 million); and upgrade and replacement of lampposts, luminaires, and associated infrastructure ($2.1 million). The total Traffic Program for 2022 is $160.9 million.
• Ferries: ferry terminal building improvements ($62.5 million). The total ferries program for 2022 is $121.7 million.
• Transit: contribution to the MTA’s capital program, including subway and bus fleet enhancements, infrastructure improvements, in-house track rehabilitations, and reconstruction of bus and subway lines for New York City. The Transit program for 2022 is $40.0 million.
Education, Health and Social Services
• Education: construct new schools ($1.9 billion); rehabilitate, replace, and upgrade building components ($1.4 billion); expand facilities through leases, Universal 3-K, building additions, gymnasiums, athletic fields, and playgrounds ($1.2 billion); cover emergency projects, research and development, and prior plan completion costs ($711.6 million); capital improvements that enhance educational programs ($365.3 million); and address the need for security systems, emergency lighting, and code compliance ($66.6 million). The total Education program for 2022 is $5.6 billion.
• Higher Education: miscellaneous reconstruction and new construction ($106.6 million); and data processing and other equipment ($11.6 million). The total Higher Education program for 2022 is $118.9 million.
• Health: a new Public Health Laboratory ($170.0 million); NYC Health + Hospitals (H+H) EMS ambulance purchases ($67.7 million); animal care centers and other animal welfare investments ($43.0 million); electronic medical records system upgrades ($32.9 million); network infrastructure refresh ($32.0 million); primary care facilities expansion ($27.1 million); revenue cycle management system upgrades ($8.1 million); COVID-19 Centers of Excellence development ($7.5 million); biomedical equipment purchases ($5.8 million); and technology and laboratory equipment upgrade for the Office of the Chief Medical Examiner ($4.7 million).
• Aging: rehabilitation of senior centers, with focus on structural and accessibility issues ($5.2 million); computer and network upgrade and equipment purchase ($0.6 million).
• Administration for Children’s Services: telecommunications and data infrastructure upgrades and improvements ($35.9 million); renovation and upgrades of facilities ($28.7 million); and renovation and upgrades of Juvenile Detention Facilities ($6.9 million).

Budget and Financial Plan Summary Fiscal Year 2022
70
• Homeless Services: renovation and upgrade of adult shelters ($35.9 million); renovation and upgrade of family shelters ($11.9 million); and computer network upgrade and equipment purchases ($5.0 million).
• Human Resources: data infrastructure upgrades and improvements ($52.9 million); telecommunications ($3.0 million); automotive equipment ($0.9 million); and construction and initial outfitting for citywide facilities ($0.7 million).
Housing and Development
• Housing: provision of low-interest loans to finance the preservation or creation of approximately 25,000 units in privately-owned buildings through preservation ($522.0 million), new construction ($494.0 million), supportive housing ($375.0 million) and disposition programs ($44.0 million); provision of low-interest loans to support NYCHA’s Rental Assistance Demonstration (RAD) transactions, through which NYCHA will also leverage other private and public financing sources to address its significant outstanding capital need ($300.0 million); and funding for technology, infrastructure, demolition and other ancillary investments ($20.0 million).
• Housing Authority: funding to meet the requirements of NYCHA’s Consent Decree with SDNY ($250.0 million); and upgrades to building exteriors and systems, including roof replacement, lead abatement, pest mitigation, elevator rehabilitation, upgrades to heating components, improvements to common areas and other construction projects ($152.8 million).
• Economic Development: Neighborhood Development Fund to help provide for critical infrastructure work for re-zonings proposed in neighborhood plans developed by the Department of City Planning ($200.1 million); various development and infrastructure improvements at the Brooklyn Navy Yard ($140.3 million) and at Governor’s Island ($52.0 million); development of the Manhattan Greenway, a continuous 32.5-mile route around Manhattan ($120.2 million); purchase of ferries and construction of landings for the NYC Ferry System ($87.7 million); subgrade improvements at Willets Point West ($73.7 million); and development of Made in New York Campus at Bush Terminal ($62.9 million).
Administration of Justice and Public Safety
• Correction: new jail facilities ($383.8 million); improvements to building systems, infrastructure and support space ($341.5 million); and lifecycle replacement of equipment ($60.4 million).
• Courts: infrastructure and operational improvements of courts facilities ($239.6 million); exterior renovations ($23.6 million); fire/life safety ($5.4 million); elevator upgrades ($2.6 million); HVAC improvements ($1.7 million); and electrical upgrades ($1.1 million).
• Police: construction, rehabilitation and relocation of facilities, Citywide ($293.0 million); replacement and upgrade of portable radios, radio equipment, infrastructure and systems ($62.0 million); replacement and upgrade of critical network infrastructure equipment and data management systems ($56.1 million); lifecycle replacement of vehicles ($56.1 million); and replacement and upgrade of general equipment, Citywide ($24.9 million).
• Fire: mandated and support vehicle replacements and necessary fire-fighting tools and equipment ($72.4 million); replacement of building components within FDNY facilities ($58.1 million); replacement of conduit and wiring in the inundation zones for the Department’s outside cable plant that was damaged during Hurricane Sandy ($33.6 million); purchase of mobile radios for first responders ($18.3 million); replacement of end of life technology and communications equipment ($17.3 million); and upgrade of the 911 communications system infrastructure ($7.4 million).
Recreation and Culturals
• Parks: reconstruction of the East River Esplanade Phase 4 ($92.5 million); planting of new street trees and park trees, the reforestation and restoration of natural areas, and the reconstruction of sidewalks damaged by trees, Citywide ($81.0 million); continued implementation of the Anchor Parks Initiative, including Fresh Kills South Park ($25.4 million); continued implementation of the Community Parks Initiative ($19.6 million); reconstruction of the Red Hook Ballfields and Recreation Area in Brooklyn ($13.2 million); reconstruction of Flushing Meadows Corona Park in Queens ($12.9 million); and park development of Melrose Commons in the Bronx ($7.8 million).

Budget and Financial Plan Summary Fiscal Year 2022
71
• Public Libraries: New York Public Library improvements including construction of a new Westchester Square branch ($28.4 million) and comprehensive renovation of the Melrose branch ($16.5 million) in the Bronx, comprehensive renovation of the Fort Washington branch ($16.6 million) and the 125th Street branch ($12.7 million) in Manhattan, and comprehensive renovation of the Port Richmond branch in Staten Island ($12.1 million); Brooklyn Public Library improvements including interior and exterior rehabilitation of Red Hook Library ($14.5 million) and various improvements at Mapleton Library ($5.9 million); and Queens Public Library improvements including comprehensive renovation of the Woodhaven branch ($13.4 million) and the Broadway branch ($5.0 million) in Queens.
• Cultural Affairs: replacement of the skylights at
the Metropolitan Museum of Art ($31.6 million); infrastructure upgrades at the Snug Harbor Cultural Center in Staten Island ($7.8 million); restoration of the historic Hunter Fly Houses at Weeksville Heritage Center ($3.9 million); replacement of the chiller system at New York Hall of Science ($2.8 million); and purchase of electric shuttles for the Bronx Zoo ($0.5 million).
Department of Citywide Administrative Services
• Public Buildings: legal mandates ($113.5 million), including fire/life safety upgrades to ensure Local Law 5 compliance ($52.7 million) and fuel tank
replacement and remediation ($41.9 million); rehabilitation of City-owned space ($81.0 million), including projects at the Manhattan Municipal Building ($21.2 million), 253 Broadway ($12.9 million), and 100 Gold Street ($12.7 million) in Manhattan; miscellaneous construction in other facilities ($57.0 million); equipment and interagency services ($49.3 million), including installation of charging infrastructure for electric vehicles ($2.8 million); renovation of leased space ($41.5 million), including the renovation and initial outfitting of Law Department office space to support Raise the Age activities in Queens, Manhattan, and Staten Island ($11.0 million); acquisition of real property ($27.0 million); renovation of other City-owned facilities ($20.3 million); and communications equipment ($0.1 million).
• Energy Efficiency and Sustainability: energy efficiency measures and building retrofits ($223.0 million), including the Accelerated Conservation and Efficiency (ACE) Program ($95.7 million), solar panels at citywide facilities ($44.3 million), and Local Law 87 deep retrofits ($11.1 million).
• Citywide Agency Facility and Operational Protective Measures: citywide agency resiliency and agency facility and operational protective measures ($1.2 billion), including the East Side Coastal Resiliency measures ($527.6 million) and the structural rehabilitation of Pier 36 ($34.6 million).

Budget and Financial Plan Summary Fiscal Year 2022
72
Borough Presidents’ Allocations
The Charter requires an amount equal to five percent of the proposed new capital appropriations for the ensuing four years to be allocated to the Borough Presidents. This allocation is to be distributed to each borough based upon a formula that equally weighs population and land area. The tables below indicate the amounts added by the Borough Presidents for each programmatic area.
FY 2022-2025 Borough Presidents’ Allocations*(City Funded Appropriations $ in thousands)
2022 2023 2024 2025
Bronx ProgramCultural Affairs ................................................. $4,200 — — — Education ......................................................... 6,403 — — — Health ............................................................... 1,369 — — — Hospitals ........................................................... 1,050 — — — Housing ........................................................... 2,150 — — — Parks ................................................................. 10,000 — — — GRAND TOTAL: BRONX .......................... $25,172 $0 $0 $0
Brooklyn ProgramBrooklyn Public Library ................................... $1,500 — — — Cultural Affairs ................................................. 159 — — — Economic Development ................................... 175 — — — Education ......................................................... 15,045 — — — Higher Education ............................................. 450 — — — Highways .......................................................... 1,000 — — — Hospitals ........................................................... 305 — — — Housing ........................................................... 1,600 — — — Housing Authority ........................................... 100 — — — Parks ................................................................. 1,000 — — — GRAND TOTAL: BROOKLYN .................... $21,334 $0 $0 $0
* Appropriations include reallocation of prior amounts recommended by the borough presidents.**Note: Individual items may not add to totals due to rounding

Budget and Financial Plan Summary Fiscal Year 2022
73
FY 2022-2025 Borough Presidents’ Allocations*(City Funded Appropriations $ in thousands)
2022 2023 2024 2025
Manhattan ProgramChildren’s Services ........................................... $320 — — — Cultural Affairs ................................................. 2,384 — — — Education ......................................................... 9,148 — — — Health .............................................................. 100 — — — Higher Education .............................................. 1,991 — — — Hospitals .......................................................... 606 — — — Housing Authority ............................................ 750 — — — New York Public Library ................................. 180 — — — Parks ................................................................. 4,991 — — — Police ................................................................ 250 — — — Public Buildings .............................................. 538 — — — GRAND TOTAL: MANHATTAN ................ $22,648 $0 $0 $0
Queens ProgramAging ................................................................ $100 — — — Cultural Affairs ................................................ 11,176 — — — Education ......................................................... 5,881 — — — Health ............................................................... 669 — — — Higher Education .............................................. 3,500 — — — Highways .......................................................... 1,250 — — — Hospitals ........................................................... 8,000 — — — Housing ............................................................. 1,500 — — — Parks ................................................................. 2,950 3,565 — — Public Buildings .............................................. 1,025 — — — Queens Public Library ...................................... 9,364 — — — Traffic ............................................................... 3,000 — — — GRAND TOTAL: QUEENS ........................ $48,415 $3,565 $0 $0
Staten Island ProgramEducation ......................................................... $3,580 — — — Public Buildings ............................................... 4,000 — — — GRAND TOTAL: STATEN ISLAND ............ $7,580 $0 $0 $0
* Appropriations include reallocation of prior amounts recommended by the borough presidents. **Note: Individual items may not add to totals due to rounding

Budget and Financial Plan Summary Fiscal Year 2022
74
Management Initiatives
Management initiatives continue to be developed and implemented to enhance the administration and advancement of the capital program. These include:
• continued improvements to capital program management.
• updating the charter-mandated capital asset condition assessment.
• application of value engineering to reduce capital and operating costs.
Capital Program Management
The Department of Design and Construction was created in October 1995 by Local Law 77, which authorized it to assume responsibility for construction projects performed by the Departments of Transportation, Environmental Protection and General Services. The Department delivers the City’s construction projects in an expeditious, cost-effective manner, while maintaining the highest degree of architectural, engineering and construction quality. The Department performs design and construction functions related to streets and highways; sewers; water mains; correctional and court facilities; cultural buildings; libraries; and other public buildings, facilities and structures.
The consolidation of design and construction into a single agency allows for the elimination of duplicative program units within agencies; the standardization of construction procedures and practices; the implementation of reforms of current practices relating to procurement for construction projects; and the expansion of the use of construction-related technology, including Computer-Aided Drafting and Design (CADD); and a project management information system. The Department also enables the city to coordinate a wide variety of construction projects with utilities, community representatives, and private industry, thus minimizing the disruption to individual neighborhoods caused by water-main projects, sewer construction, and road work, as well as reducing the costs associated with such projects. The Department of Design and Construction serves more than 22 client agencies.
Capital Project Scope Development and Cost Estimation
Some capital projects contain significant risks and uncertainties that can lead to cost escalation. Construction or site complexity, unclear or evolving programmatic requirements, regulatory or legal issues, and conflicting stakeholder objectives are some of the factors which can result in projects exceeding their budgets. In an effort to control cost overruns, capital projects undergo a more intensive scope development and cost estimation prior to being included in the capital plan.
Capital Asset Inventory and Maintenance Program
The Charter requires an annual assessment of the City’s major assets including buildings, piers, bulkheads, marinas, bridges, streets and highways, and the preparation of maintenance schedules for these assets. This assessment report (AIMS), based on field surveys by technical professionals, details state of good repair needs and is used by agencies for capital planning purposes. A separate volume, published as a reconciliation, reports on the amounts recommended in the annual condition surveys with amounts funded in budget. To incorporate current technology and standards into the Maintenance Program, the City conducts ongoing reviews of the methodologies used in surveying and estimating the cost of maintaining its fixed assets in a state of good repair.
The AIMS Program was enhanced by an intranet portal that allows for more agency access to asset data. This provides the client agencies with additional information with which to improve management of their facilities.
Value Engineering
Value Engineering (VE) is a systematic analytical methodology directed toward analyzing the functions of projects for the purpose of achieving the best value at the lowest life cycle project cost. From its inception in 1982 OMB’s VE program has utilized innovations in value management methodology to evaluate an ever-expanding group of projects, widening the scope and depth of project reviews to include Value Analysis (VA) reviews of the City’s operational processes and functions to assist agencies in streamlining their procedures to effect increased efficiency and improvements.
Value Engineering is a collaborative effort between all concerned city agencies with budgetary and operational jurisdiction over a project, and

Budget and Financial Plan Summary Fiscal Year 2022
75
outside consultants with expertise on critical project components. The City has utilized VE effectively in the last 39 years to review complex and costly capital projects to ensure they meet functional requirements and are cost effective and timely. These Value Management reviews enable agency decision makers to reach informed conclusions about a project’s scope, cost and schedule. In addition to defining potential cost reductions, the VE process frequently generates project improvements and anticipates project risks early in the design process, and solves functional problems by raising relevant issues which adversely compromise the project’s development, cost and schedule. OMB’s Value Management Program continues to be successful, both as an operational and capital management tool. The benefits of VE and the overall returns on the reviewed projects have proven to be effective in terms of both significant capital and life cycle cost reductions while protecting each project’s required functionality and mission. VA enables improvements to operational processes and more efficient service delivery. Studies scheduled for upcoming VE reviews include environmental projects, dams, bridges, treatment plants, and operational reviews.

Budget and Financial Plan Summary Fiscal Year 2022
76
FINANCING PROGRAM
The City financing program projects $56.3 billion of long-term borrowing for the period from 2021 through 2025 to support the current City capital program. The portion of the capital program not financed by the New York City Municipal Water Finance Authority (NYW or the Authority) will be split between General Obligation (GO) bonds of the City and Future Tax Secured (FTS) bonds of the New York City Transitional Finance Authority (TFA).
The City and TFA FTS expect to issue $22.8 billion and $25.2 billion, respectively, during the plan period. The City issuance supports 40 percent of the total, and TFA FTS issuance supports another 45 percent of the total. NYW expects to issue approximately $8.3 billion.
Financing Program($ in Millions)
__________________________________________________________________________________________________________________________________________________________________________________________
2021 2022 2023 2024 2025 Total__________________________________________________________________________________________________________________________________________________________________________________________
City General Obligation Bonds ................ $2,000 $4,330 $5,140 $5,440 $5,890 $22,800TFA Bonds ................................................ 3,173 5,530 5,140 5,440 5,890 25,173Water Authority Bonds1 ............................ 1,316 1,574 1,610 1,769 2,062 8,330 ______________ ______________ ______________ _____________ _______________ ______________
Total .......................................................... $6,489 $11,434 $11,890 $12,649 $13,842 $56,303 ______________ ______________ ______________ _____________ _______________ ______________
1 Includes commercial paper and revenue bonds issued for the water and sewer system's capital program. Figures do not include bonds that defease commercial paper or refunding bonds. Does not include bonds to fund reserves or cost of issuance.

Budget and Financial Plan Summary Fiscal Year 2022
77
Overview of the Financing Program
The following three tables show statistical information on debt issued and expected to be issued by the financing entities described above.
Debt Outstanding($ in Millions at Year End)
__________________________________________________________________________________________________________________________________________________________________________________________
2021 2022 2023 2024 2025__________________________________________________________________________________________________________________________________________________________________________________________
City General Obligation Bonds .................................. $38,574 $40,731 $43,403 $46,267 $49,560TFA Bonds .................................................................. 41,554 45,939 49,436 53,065 57,031TSASC Bonds ............................................................. 993 966 938 909 879Conduit Debt ............................................................... 995 929 838 769 701 ______________ ______________ _____________ _______________ ______________
Total ........................................................................... $82,116 $88,565 $94,615 $101,010 $108,170 ______________ ______________ _____________ _______________ ______________
Water Authority Bonds ............................................... $31,093 $32,339 $33,454 $34,709 $36,276__________________________________________________________________________________________________________________________________________________________________________________________
Annual Debt Service Costs($ in Millions, Before Prepayments)
__________________________________________________________________________________________________________________________________________________________________________________________
2021 2022 2023 2024 2025__________________________________________________________________________________________________________________________________________________________________________________________
City General Obligation Bonds .................................. $3,431 $3,876 $4,437 $4,741 $4,972TFA Bonds .................................................................. 2,815 3,087 3,806 3,929 4,264TSASC Bonds ............................................................. 82 76 76 76 76Conduit Debt ............................................................... 105 125 148 118 116 ______________ ______________ _____________ _______________ ______________
Total Debt Service ..................................................... $6,433 $7,164 $8,467 $8,864 $9,428 ______________ ______________ _____________ _______________ ______________
Water Authority Bonds1 .............................................. $1,375 $1,580 $1,748 $2,079 $2,161__________________________________________________________________________________________________________________________________________________________________________________________
1 Includes First Resolution debt service and Second Resolution debt service net of subsidy payments from the NYS Environmental Facilities Corporation.
Debt Burden__________________________________________________________________________________________________________________________________________________________________________________________
2021 2022 2023 2024 2025__________________________________________________________________________________________________________________________________________________________________________________________
Total Debt Service1 as % of:a. Total Revenue .......................................................... 6.3% 7.2% 8.6% 8.8% 9.3%b. Total Taxes ............................................................... 10.2% 11.4% 12.8% 13.0% 13.5%c. Total NYC Personal Income ................................... 0.9% 1.0% 1.1% 1.1% 1.1%
Total Debt Outstanding1 as % of:a. Total NYC Personal Income ................................... 11.3% 12.1% 12.4% 12.6% 13.0%__________________________________________________________________________________________________________________________________________________________________________________________
1 Total Debt Service and Debt Outstanding include GO, conduit debt and TFA FTS bonds.

Budget and Financial Plan Summary Fiscal Year 2022
78
Currently the debt service for the City, TFA FTS, and City appropriation debt, or conduit debt, excluding the effect of pre-payments, is 6.3 percent of the City’s total budgeted revenues in 2021. That ratio is projected to rise to 9.3 percent in 2025. As a percentage of tax revenues, the debt service ratio is 10.2 percent in 2021 and is projected to increase to 13.5 percent in fiscal year 2025.
All of the issuers financing the City capital program have maintained credit ratings in the AA category or better by Moody’s, S&P, and Fitch, as indicated in the table below. Following the economic uncertainty surrounding COVID-19, Moody’s and Fitch downgraded the City’s general obligation bonds and its related appropriation credits. Furthermore, Moody’s, Fitch, as well as S&P currently have the City’s general obligation bonds on negative outlook. Additionally, for TFA, the FTS bonds are on negative outlook by Moody’s. The BARBs were downgraded by Moody’s to Aa3 and are on negative outlook by S&P and Fitch due to the BARBs relationship to the State budget. The outlooks for NYW and bonds issued on behalf of NYW by EFC, however, remain stable. Despite the downgrades and negative outlooks, the entities financing the City’s capital program have maintained reliable market access to finance capital spending and undertake refinancing transactions, as discussed later.
RatingsIssuer Moody's S&P Fitch
NYC GO Aa2 AA AA- TFA Senior Aaa AAA AAATFA Subordinate Aa1 AAA AAA TFA BARBs Aa3 AA AA NYW First Resolution Aa1 AAA AA+NYW Second Resolution Aa1 AA+ AA+ EFC Senior SRF Bonds Aaa AAA AAAEFC Subordinated SRF Bonds Aaa AAA AAA__________________________________________________________________________________________________________________________________________________________________________________________
New York City General Obligation Bonds
Since July 1, 2020, the City has issued $2.0 billion in GO bonds for capital purposes and $2.9 billion in GO refunding bonds. The dates and principal amounts are as follows:
NYC GO Issuances($ in Millions)
(N)ew $/ Issue Tax Exempt Taxable Total ParSeries (R)efunding Date Amount Amount Amount2021 AB R 9/9/20 $1,100 $288 $1,3882021 C N 10/15/20 900 0 9002021 DE R 1/6/21 0 1,500 $1,5002021 F N 3/24/21 900 200 $1,100 ______ ______ ______Total $2,900 $1,988 $4,888

Budget and Financial Plan Summary Fiscal Year 2022
79
The GO refunding transactions the City completed to date in fiscal year 2021 generated approximately $445 million of debt service savings during the financial plan period.
In addition to the total issuance mentioned above, the City took steps to manage its outstanding floating rate debt. The City reoffered all or portions of several subseries of floating rate bonds amounting to approximately $930 million of par. Of those reoffered issues, approximately $584 million were fully or partially converted to fixed rates. Longer portions of certain subseries amounting to approximately $260 million were converted to a floating interest rate mode without need for an associated bank facility. One subseries amounting to approximately $86 million was converted to an interest rate mode bearing a short-term fixed rate.
The City plans to issue GO bonds for capital purposes of approximately $2.0 billion, $4.3 billion, $5.1 billion, $5.4 billion, and $5.9 billion in fiscal years 2021 through 2025, respectively.
New York City Related Issuers - Variable Rate Debt
The City and other issuers supporting the City capital program have maintained floating rate exposure to minimize interest costs. When reviewing the City’s variable rate debt, it is useful to include all sources of financing with the exception of NYW, which is typically considered separately for such purposes. Variable rate demand bonds, which require an accompanying bank facility, compose the majority of the City’s variable rate portfolio. The City, TFA, and its related entities also have floating rate bonds which do not require a bank facility,
where interest rates are set periodically according to a benchmark index, by, auction, or by a remarketing agent. The City and TFA continue to explore various debt instruments that will confer the benefit of floating rates. Currently, the City and its related entities, excluding NYW, have approximately $7.6 billion of floating rate exposure, which typically provides attractive financing costs relative to long term fixed rate debt.
While floating rate debt continues to provide significant savings relative to fixed rate debt, the exposure is of note because certain events can cause unexpected increased costs. Those events would include rising interest rates, reductions in tax rates in the tax code (in the case of tax-exempt debt), and the deterioration of the City’s credit. Additionally, the deterioration of the credit of a liquidity provider can also have an impact on net interest costs. Due to market disruptions related to the onset of COVID-19, floating rate debt experienced a spike in rates in March of 2020. Floating rates have since normalized and are expected to continue to provide lower overall rates compared to fixed rate debt.
The following table shows a breakout of the City’s and its related issuers’ floating rate exposure, excluding NYW. Floating rate exposure is currently at 9.3 percent, and this is even more manageable after taking into account the 10 year average balance of $7.5 billion of short-term assets in the City’s General Fund, which are an offset to these floating rate liabilities. Net of these floating rate assets, the floating rate exposure of the City, excluding NYW, is 0.2 percent of its outstanding debt. Moreover, the City uses conservative assumptions in budgeting interest rates and associated expenses from floating rate instruments.
NYC Floating-Rate Exposure1
($ in Millions) GO TFA Conduit TSASC Total ___________ __________ ______________ ____________ ______________
Floating Rate Bonds ........................................ $4,477 $3,091 $30 $0 7,598Synthetic Fixed ................................................ 17 0 31 0 48 ___________ __________ ___________ ____________ ______________
Total Floating-Rate ......................................... $4,494 $3,091 $61 $0 $7,646
Total Debt Outstanding .................................... $38,574 $41,554 $995 $993 $82,116
% of Floating-Rate / Total Debt Outstanding ................................................... 9.3%Total Floating-Rate Less $7.5 Billion Balance in General Fund (Floating-Rate Assets) .............................................................. 150% of Net Floating Rate / Total Debt Outstanding ............................................. 0.2%__________________________________________________________________________________________________________________________________________________________________________________________
1 End of Fiscal Year 2021 Debt Outstanding as of the April 2021 Financial Plan excluding NYW and HYIC

Budget and Financial Plan Summary Fiscal Year 2022
80
In addition to the floating rate debt instruments previously discussed, the City has utilized synthetic fixed rate debt (issuance of floating rate debt which is then swapped to a fixed rate). In contrast to variable rate demand bonds and other floating rate instruments, synthetic fixed rate debt is relatively insensitive to changes in interest rates and changes in the City’s credit, though it can provide exposure to decreases in marginal tax rates in the tax code. Given the limited floating rate exposure by these instruments, they are counted at 25 percent of par or notional amount in the table above. The City did not enter into any new interest rate swaps to date in fiscal year 2021. The TFA has no outstanding swaps. The total notional amount of GO swaps outstanding as of March 31, 2021 was $416 million, on which the termination value was negative $57 million. This is the theoretical amount that the City would pay if all of the swaps were terminated under market conditions as of March 31, 2021.
After June 30, 2023, the quotes to set the commonly used one-month and three-month London Inter-bank Offered Rate (LIBOR) are likely to be discontinued. LIBOR is a taxable index to which a percentage is applied to approximate a tax-exempt rate, so the discontinuation of this rate will impact floating rate instruments indexed to it. Because the tax-exempt index SIFMA has been the City’s preferred index, the City TFA, and NYW have no floating rate debt instruments linked to LIBOR. For some of the outstanding GO and NYW swaps, some variable rate payments received are based on a percentage of LIBOR and scheduled to still be in effect after 2023. Relative to their total debt portfolios, the City and its related issuers have very limited exposure to LIBOR. The City and its related issuers are monitoring all developments related to the LIBOR discontinuation and transition to an alternative index, which is currently expected to be the Secured Overnight Financing Rate (SOFR) developed by the Federal Reserve.
The New York City Municipal Water Finance Authority
The New York City Municipal Water Finance Authority (NYW) was created in 1985 to finance capital improvements to the City’s water and sewer system. Since its first bond sale in November 1985, the Authority has sold $75.5 billion of bonds. These bond issuances included a combination of general (first) resolution, second general resolution and subordinated special resolution crossover refunding water and sewer system revenue bonds.
Of the aggregate bond par amount sold, $31.6 billion is outstanding, $31.2 billion, including $665 million
of special resolution crossover bonds, was refinanced, $5.9 billion was defeased with Authority funds prior to maturity, and $6.8 billion was retired with revenues as they matured. In addition to this long-term debt, NYW uses bond anticipation notes (BANs) issued to the New York State Environmental Facilities Corporation (EFC) and a commercial paper program as a source of flexible short-term financing. EFC has entered into agreements to provide NYW with $564.7 million in funds for certain projects. On March 31, 2021, NYW had $155 million of BAN draws outstanding. The Authority is authorized to draw up to $600 million of commercial paper notes, including up to $400 million of the Extendable Municipal Commercial Paper. Currently, the Authority has no commercial paper outstanding, and does not expect to issue commercial paper for the remainder of the current fiscal year and in 2022.
NYW’s outstanding debt also includes floating rate bonds, which have been a reliable source of cost-effective financing. NYW has $4.7 billion of floating rate bonds or approximately 15 percent of its outstanding debt, including $401 million which was swapped to a fixed rate. NYW’s floating rate exposure primarily consists of tax-exempt floating rate debt supported by liquidity facilities. NYW’s exposure also includes $500 million of privately placed tax-exempt index rate bonds, which pay interest based on a specified index. Index rate bonds do not require liquidity facilities, however, they provide for an increased rate of interest commencing on an identified step up date if the bonds are not converted or refunded. Through the step up date, the bonds have an all-in cost similar to floating rate bonds supported by liquidity facilities.
NYW is a party to two interest rate exchange agreements (swaps) with a total notional amount of $401 million. Under these agreements, the Authority pays a fixed interest rate of 3.439% in exchange for a floating rate based on 67% of one-month LIBOR. As of March 31, 2021, the combined mark-to-market value of the swaps was negative $111.1 million. This is the theoretical amount, which NYW would pay if both swaps were terminated as of March 31, 2021. NYW is monitoring all developments related to the LIBOR discontinuation and transition to an alternative index, which is currently expected to be SOFR.
NYW participates in the State Revolving Fund (SRF) program administered by the EFC. The SRF provides a source of long-term below-market interest rate borrowing, subsidized by federal capitalization grants, state matching funds, and other funds held by EFC.

Budget and Financial Plan Summary Fiscal Year 2022
81
Summarized in the following table are the issuances that have closed to date in fiscal year 2021. The proceeds of the bonds were applied to pay the cost of improvements to the system or paid principal and interest on certain of the Authority’s outstanding debt and paid the costs of issuance.
NYW Issuance($ in Millions)
(N)ew True Money Issue Par Interest LongestSeries /(R)ef. Date Amount Cost (TIC) Maturity
2021 AA N/R 9/30/20 $650 2.80% 20502021 BB N/R 12/15/20 $534 2.85% 20502021 CC N/R 3/18/21 $553 2.78% 20512021 DD R 3/18/21 $575 1.21% 20382021 EE R 3/31/21 $326 VAR 2045
______ $2,638
During the period from 2022 to 2025, NYW expects to sell an average of approximately $1.7 billion of new money bonds per year. Of this amount, NYW plans to issue about $432 million of bonds in 2022 and $300 million bonds annually thereafter to EFC, taking advantage of the interest rate subsidy available for qualifying projects, and minimizing the overall costs of its financing program. NYW expects to issue approximately 90 percent of its new debt per year as fixed rate debt with the remainder issued as floating rate debt, subject to market conditions.
The New York City Transitional Finance Authority
The TFA is a public authority of New York State created by the New York Transitional Finance Authority Act in 1997. The TFA was created to issue
debt, primarily secured with the City’s personal income tax, to fund a portion of the capital program of the City. The TFA was originally authorized to issue up to $7.5 billion of bonds and notes. On September 13, 2001, the TFA was given statutory authority to borrow $2.5 billion to finance costs related to the September 11th terrorist attack on the City. Currently, TFA is permitted to have $13.5 billion of debt outstanding and any amounts over and above that level are subject to the City’s remaining debt incurring power under the State constitutional debt limit.
Since July 1, 2020, the TFA has issued approximately $3.2 billion in FTS bonds for capital purposes and $2.8 billion in refunding bonds. The dates and principal amounts are as follows:
NYC TFA Issuances($ in Millions)
(N)ew$/ Issue Tax Exempt Taxable Total ParSeries (R)efunding Date Amount Amount Amount2021 AB R 9/1/20 $1,349 $275 $1,624 2021 C N 9/24/20 900 173 1,073 2021 D N 11/5/20 700 200 900 2021 E N 2/11/21 900 300 1,200 2021 FG R 4/7/21 1,001 228 1,229 _____ _____ _______Total $4,850 $1,176 $6,026
The TFA refunding transactions completed to date in fiscal year 2021 generated approximately $627 million of debt service savings during the financial plan period.
Additionally, the TFA took steps to manage outstanding floating rate bonds by converting approximately $640 million of floating rate bonds to a fixed rate mode.

Budget and Financial Plan Summary Fiscal Year 2022
82
The TFA plans to issue TFA FTS bonds for capital purposes of approximately $3.2 billion, $5.5 billion, $5.1 billion, $5.4 billion, and $5.9 billion in years 2021 through 2025, respectively.
In April 2006, the State enacted legislation authorizing issuance by the TFA of an additional $9.4 billion of bonds (Building Aid Revenue Bonds, or BARBs) to be used to fund certain capital costs for the Department of Education. This legislation also provided for the assignment to TFA of State building aid that had previously been paid directly to the City. The TFA currently has approximately $8.4 billion of BARBs outstanding which fund a portion of the capital program of the Department of Education. While the financial plan does not currently reflect the issuance of BARBs for new money purposes, there may be BARB issuance for refunding purposes given market conditions, If TFA BARBs are not issued for new money purposes, the amounts previously intended to be issued through that program would be financed with City or TFA FTS bonds.
Since July 1, 2020, TFA has issued $200 million in BARBs for capital purposes.
NYC TFA BARB Issuances($ in Millions)
New$/ Issue Tax Exempt Taxable Total ParSeries Refunding Date Amount Amount Amount2021 S-1 N 10/22/20 $200 $0 $200 _____ _____ _______Total $200 $0 $200
Hudson Yards Infrastructure Corporation
Hudson Yards Infrastructure Corporation (HYIC), a not-for-profit local development corporation, was established to provide financing for infrastructure improvements to facilitate economic development on Manhattan’s far west side. Improvements include the extension of the No. 7 subway line west and south, construction of a park, as well as the acquisition of development rights over the MTA rail yards.
In December 2006, HYIC issued its first series of bonds in the principal amount of $2 billion. HYIC completed its second issuance of $1 billion of bonds in October 2011. Principal on the HYIC bonds is being repaid from revenues generated by this new development, notably payments-in-lieu-of-property taxes (PILOT) on the commercial development and various developer payments. To the extent these revenues are not sufficient to cover interest payments, the City has agreed to make interest support payments (ISP) to HYIC subject to appropriation. ISPs have not been required to be made since 2015.
In May 2017, HYIC issued approximately $2.1 billion of refunding bonds which refinanced all of its initial $2 billion bond issue and a portion of its second bond issue under a new legal structure. This refinancing allowed HYIC to remit approximately
$110 million of accumulated revenues for City benefit in 2017. Moreover, the refunding enabled HYIC to transfer to the City any excess revenues over and above amounts needed for HYIC debt service. HYIC remitted $450 million to the City in total in fiscal years 2019 through 2020.
Although the economic impact of COVID-19 has affected the credit ratings on HYIC bonds, the revenues securing the debt remain robust. In connection with credit rating action on the City, Moody’s downgraded its rating on HYIC to Aa3 with a negative outlook. Fitch downgraded the first and second indenture ratings to A+ and A, respectively, and assigned a negative outlook on HYIC. Despite the negative rating actions, revenues collected to date fully fund all debt service due this fiscal year obviating the need for ISP.
The No. 7 Subway extension was constructed by the MTA and began service in September 2015. The secondary entrance to this station located at W. 35th Street and Hudson Boulevard East opened in September 2018. Phase I of the Hudson Park and Boulevard opened to the public in August 2015 and is managed by the Hudson Yards Hell’s Kitchen Alliance Business Improvement District.

Analysis of Agency Budgets

Analysis of Agency Budgets Fiscal Year 2022
85
The following table reflects the allocation of fringe benefits, pensions, and debt service costs against the City to each agency to derive the total cost of agency operations.
Full Agency Costs for FY 2022($ in Millions)
Personal Service Costs Other Than Personal Service Costs Gross Total Net Total Salaries PA, MA All Funds All Funds City & Fringe PS Agency & Other Debt OTPS (Includes (Excludes FundsAgency Wages Benefits Pensions Subtotal OTPS Mandates Service Subtotal Intra-City) Intra-City) Total
Uniformed Forces Police .................................. $4,910 $2,605 $2,955 $10,470 $450 $— $243 $693 $11,163 $10,857 $10,457 Fire ..................................... 1,893 920 1,649 4,462 257 — 248 505 4,967 4,966 4,303 Correction .......................... 987 810 553 2,350 157 — 125 282 2,632 2,632 2,269 Sanitation ........................... 1,035 524 313 1,872 746 — 341 1,087 2,959 2,949 2,354
Subtotal ........................... $8,825 $4,859 $5,470 $19,154 $1,610 $— $957 $2,567 $21,721 $21,404 $19,383
Health And Welfare Admin. For Children’s Services ......... $537 $218 $104 $859 $2,149 $— $— $2,149 $3,008 $3,008 $1,127 Social Services .................. 877 429 174 1,480 2,071 8,069 84 10,224 11,704 11,694 8,910 Homeless Services ............ 163 69 31 263 1,991 — — 1,991 2,254 2,253 1,416 Health and Mental Hygiene 581 207 105 893 1,556 — 74 1,630 2,523 2,513 1,390 Health + Hospitals ............. — 44 — 44 980 — 269 1,249 1,293 1,212 879
Subtotal ........................... $2,158 $967 $414 $3,539 $8,747 $8,069 $427 $17,243 $20,782 $20,680 $13,722
Education Education ........................... $14,203 $4,644 $3,365 $22,212 $12,785 $836 $1,862 $15,483 $37,695 $37,669 $19,363 City University ................... 663 216 90 969 319 — 72 391 1,360 1,335 1,038
Subtotal ........................... $14,866 $4,860 $3,455 $23,181 $13,104 $836 $1,934 $15,874 $39,055 $39,004 $20,401
Other Agencies ....................... 3,239 1,335 683 5,257 7,173 — 3,355 10,528 15,785 14,599 11,649
Elected Officials .................... 690 227 129 1,046 156 — — 156 1,202 1,194 1,067
Miscellaneous ........................ 1,308 134 112 1,554 — 3,565 (1) 291 3,856 5,410 5,183 4,638
Debt Service (Unallocated) .................. — — — — — — 124 124 124 124 91
Total - All Funds (2) ........... $31,086 $12,382 $10,263 $53,731 $30,790 $12,470 $7,088 $50,348 $104,079 $102,188
Total - City Funds (2) ......... $19,965 $8,964 $10,119 $39,048 $14,767 $10,235 $6,901 $31,903 $70,951
Less: Prepayments ............... $— $— $— $— $— $— $3,628 $3,628 $3,628 $3,628 $3,628
Total After Prepayments ...... $31,086 $12,382 $10,263 $53,731 $30,790 $12,470 $3,460 $46,720 $100,451 $98,560 $67,323
(1) Includes Labor Reserve, General Reserve, Judgments and Claims, MTA Subsidies and Other Contractual Services.(2) Excludes the impact of prepayments.

Analysis of Agency Budgets Fiscal Year 2022
87
DEPARTMENT OF EDUCATION
The New York City Department of Education provides primary and secondary education for over one million school-age children. Through a network of elementary, junior high, intermediate, and high schools as well as full-day pre-kindergarten programs and special education schools, the Department provides basic instructional services, offering students special education, instruction for English Language Learners and career and technical training. Support services include free and subsidized transportation, free meals, and the operation and maintenance of approximately 1,800 schools.
Financial Review
The Department of Education’s 2022 operating budget is $31.4 billion, an increase of $2.3 billion over the 2021 forecast of $29.2 billion. In addition, education-related pension, debt service, and other fringe costs of $6.3 billion are budgeted in separate agencies. These additional costs include an increase of $311 million. City funds including pensions, debt service and other fringe support $19.4 billion of the Department of Education’s expense budget in 2022, a decrease of $502 million, or 2.5 percent. State funds
support $12.8 billion, an increase of $1.2 billion. The balance of the education budget is supported by $5.3 billion in Federal aid, an increase of $2.0 billion from the 2021 forecast, $26 million in intra-city funds and $163 million in other categorical funds. Including those funds budgeted centrally, total funds budgeted on behalf of the Department of Education increase from $35.1 billion in the 2021 forecast to $37.7 billion in the 2022 Executive Budget.
Total Department of Education Expenses2015-2022
($ in Millions)_______________________________________________________________________________________________________________________________________________________________________________________________________________
Executive Change Change Forecast Budget 2021 to 2015 to 2015 2016 2017 2018 2019 2020 2021 2022 2022 2022_______________________________________________________________________________________________________________________________________________________________________________________________________________
Department Of Education Operating Budget City .................................................................... $9,740 $10,607 $11,117 $12,190 $13,592 $14,065 $14,704 $13,932 ($772) $4,192 Other Categorical ............................................. $309 $287 $310 $327 $320 $294 $214 $163 ($50) ($146)State ................................................................... $9,189 $9,735 $10,260 $10,710 $11,217 $11,514 $10,853 $11,967 $1,114 $2,778 Federal ............................................................... $1,716 $1,744 $1,775 $1,856 $1,888 $2,141 $3,319 $5,337 $2,019 $3,622 Intra-City .......................................................... $45 $48 $45 $61 $51 $51 $61 $26 ($36) ($20) ____________ ____________ ____________ ____________ ____________ ____________ ____________ ____________ ____________ ____________
Total Operating Expenditures ...................... $20,999 $22,422 $23,508 $25,144 $27,067 $28,067 $29,151 $31,426 $2,275 $10,426 =========== =========== =========== =========== =========== =========== =========== =========== =========== ===========
Other City Funds Supporting EducationPensions ........................................................... $3,273 $3,700 $3,919 $3,927 $3,693 $3,575 $3,088 $3,365 $277 $92 State Aid for Pensions ....................................... $0 $0 $0 $0 $0 $0 $0 $0 $0 $0 Federal Aid for Pensions ................................... $0 $0 $0 $0 $0 $0 $0 $0 $0 $0 Other Fringe ...................................................... $146 $159 $159 $163 $160 $172 $196 $206 $11 $60 G.O. Bond Debt Service .................................. $903 $1,029 $1,055 $1,065 $1,117 $1,112 $1,051 $1,061 $10 $158 State Aid for Debt Service ............................... ($3) ($3) ($3) ($3) ($3) ($3) ($3) ($3) $0 $0TFA Debt Service ............................................ $1,027 $1,082 $1,148 $1,276 $1,532 $1,620 $1,624 $1,637 $14 $611State Aid for TFA Debt Service ........................ ($561) ($606) ($576) ($687) ($744) ($797) ($795) ($836) ($41) ($275) ____________ ____________ ____________ ____________ ____________ ____________ ____________ ____________ ____________ ____________
Total Additional City Funds .......................... $4,785 $5,361 $5,702 $5,741 $5,755 $5,679 $5,160 $5,430 $270 $645 =========== =========== =========== =========== =========== =========== =========== =========== =========== ===========
TOTAL CITY FUNDS OR EDUCATION ........................................ $14,525 $15,969 $16,819 $17,931 $19,347 $19,744 $19,865 $19,363 ($502) $4,837 =========== =========== =========== =========== =========== =========== =========== =========== =========== ===========
TOTAL STATE FUNDS FOR EDUCATION ...................................... $9,753 $10,343 $10,839 $11,400 $11,964 $12,314 $11,650 $12,806 $1,156 $3,053 =========== =========== =========== =========== =========== =========== =========== =========== =========== ===========__________________________________________________________________________________________________________________________________________________________________________________________
The amounts shown for 2015 through 2020 represent actual expenditures including pensions and debt service funds budgeted in other agencies. Numbers may not add due to rounding.

Analysis of Agency Budgets Fiscal Year 2022
88
Expense Budget Highlights
The 2022 Executive Budget includes funding for new policy initiatives, previously announced policies and mandated support services for NYC children.
School Reopening
School buildings closed in March 2020, in response to the global COVID-19 pandemic. The Department of Education transitioned to a fully remote learning model for the remainder of the 2019-2020 school year, supplying 500,000 iPads to students to learn from home. In the fall, New York City became the first major city in the United States to reopen school buildings for the 2020-2021 school year for blended learning, giving families the option to send children to school for part of the week. With safety measures including mask wearing, hand washing, regular testing for COVID-19, and physical distancing, schools have proven to be among the safest places in the City.
Federal Stimulus
Since March 2020, the Federal government has passed three stimulus bills that included funding for localities to safely reopen and continue to support schools: The Coronavirus Aid, Relief, and Economic Security Act (CARES), March 2020; Coronavirus Response and Relief Supplemental Appropriations Act (CRRSA), December 2020; and American Rescue Plan (ARP), March 2021. Although New York State fully supplanted the first round of Education stimulus funding (CARES), the State passed on subsequent allocations for CRRSA and ARP fully to the City.
As a result of CRRSA and ARP, the 2022 Executive Budget includes $7 billion of federal funding for the Department of Education. The Department received $2.15 billion from CRRSA and $4.8 billion from ARP; these funds are available through September 2023 and September 2024, respectively. While federal guidance is still pending, stimulus funds can broadly be used to support pandemic-related expenses (including preparedness and PPE), activities authorized under existing education law, technology for students, mental health support, summer and afterschool programming, facilities operations and cleaning, existing staff, and other activities related to maintaining operation and continuity of services. The March bill requires that a percentage of the funds received be spent on interventions to address learning loss, including evidence-based programming, summer enrichment, and afterschool programming.
State Foundation Aid and the Department of Education’s Fair Student Funding Formula
For many years, the State funding received by the City was less than the State was required to provide to meet the Campaign for Fiscal Equity (CFE) mandate. However, funds were included in the State’s 2022 enacted budget to fulfill the mandate, providing $1.1 billion in additional baseline funding, phased in over three years.
With this funding promise, the City will raise the Fair Student Funding (FSF) floor from 90 percent (already increased from a floor of 81 percent in 2016) to 100 percent, meaning schools will receive every dollar that the formula says they are owed for the first time since the formula was established in the 2007-2008 school year.
FSF is derived by calculating a basic allocation for each student based on class size and average teacher salaries. Adjustments are made to account for needs such as Special Education and English Language Learners. It is the largest source of funding for schools, and principals can use it at their discretion. Most of the funding is used to hire teachers and other school staff.
3-K for All
In the Executive budget, the City makes a significant investment in early childhood education, adding $334 million in 2022, growing to $753 million by 2024, to offer 3-K in all 32 school districts in the 2021-22 school year. Currently, 3-K for All is available in 12 districts. The program will continue to expand access in the ensuing years until a seat is available to any family with a three-year-old who wants one.
Mental Health Support and Community Schools
The Preliminary Budget included investments in 150 social workers and 27 new community schools. In the Executive Budget, both investments are expanded. The Executive budget supports an additional 350 social workers, including the restoration of 60 Single Shepherd Social Workers. In total, this represents an additional 500 social workers added over the past two financial plans, ensuring that students will have access to the mental health support they need. The Executive Plan also includes funding for 100 more Community schools, providing further support to students and families, especially those in neighborhoods most severely impacted by COVID-19.

Analysis of Agency Budgets Fiscal Year 2022
89
Restorations
Due to fiscal difficulties brought on by COVID-19, the Department has had to absorb funding reductions on many priority programs, including 3-K for All, Equity and Excellence, Fair Student Funding, Community Schools, Arts instruction, Health education, professional development for teachers, and more. With the availability of federal stimulus funding, savings taken from key programs are restored in the Executive Budget.
Additional Supports
The Executive Budget reflects major investments to ensure that students are supported, as many return to school for the first time in over a year in the fall. In the coming years, federal stimulus will fund investments to undergird academic recovery, including the following:
• Academic Recovery and Student Support: Includes direct aid to schools for academic acceleration opportunities, including a focus on establishing a baseline through assessment data, core instruction, personalized or group tutoring, and extended learning time. This also includes investments in vulnerable populations such as multilingual learners, students with disabilities, and those who need extra support following the pandemic.
• Instructional Support: Heightened focus on literacy for the entire student experience through the development of core instruction in ELA and math and strengthening the teacher workforce with professional learning, all of which will provide the supports necessary for an intensive academic recovery.
• Information Technology Support: Critical technology investments to ensure all students have access to 21st Century learning and digital tools that support technology literacy for every student. This will include increased help desk support, expanded WIFI access at school buildings, and the continuation of LTE service for the 2021-2022 school year on devices purchased in response to the pandemic.
• Special Education Services: Ensures the ability to provide services to students with disabilities that are needed to address related services missed due to the pandemic. Includes supports such as physical therapy and speech therapy.

Analysis of Agency Budgets Fiscal Year 2022
90
2021 20222020
Actual2021
ForecastPreliminary
BudgetExecutive
Budget Forecast Preliminary
BudgetExpenditures
Salary and Wages ………………… $13,163,377 $13,085,860 $13,114,556 $14,202,990 $1,117,130 $1,088,434Fringe Benefits …………………… 4,143,594 4,314,018 4,715,468 4,437,524 123,506 (277,944) OTPS ……………………………… 10,759,549 11,750,819 10,651,160 12,785,185 1,034,366 2,134,025 Total ……………………………… $28,066,520 $29,150,697 $28,481,184 $31,425,699 $2,275,002 $2,944,515
FundingCity ………………………………… $14,064,958 $14,704,479 $13,912,398 $13,932,348 ($772,131) $19,950Other Categorical Grants ………… 294,192 213,656 163,397 163,397 (50,259) — IFA ………………………………… — — — — — — State ……………………………… 11,514,481 10,852,730 12,259,990 11,967,176 1,114,446 (292,814) Federal CD ………………………… 79,175 172,891 10,508 10,508 (162,383) — Federal Other ……………………… 2,062,282 3,145,711 2,124,912 5,326,691 2,180,980 3,201,779 Intra-City Other …………………… 51,432 61,230 9,979 25,579 (35,651) 15,600 Total ……………………………… $28,066,520 $29,150,697 $28,481,184 $31,425,699 $2,275,002 $2,944,515
Additional Costs Centrally FundedPersonal Services (PS) Fringe Benefits …………………… $171,905 $195,561 $206,163 $206,268 $10,707 $105 Pensions ………………………… 3,574,632 3,088,001 3,364,816 3,364,816 276,815 $—Other Than Personal Service (OTPS) Debt Service (incl. BARBs) ……… 2,731,770 2,674,278 3,091,632 2,698,140 23,862 ($393,492)Total Additional Costs ………… $6,478,307 $5,957,840 $6,662,611 $6,269,224 $311,384 ($393,387)
FundingCity ………………………………… 5,679,287 5,160,216 5,770,753 5,430,262 270,046 ($340,491)Non-City …………………………… 799,020 797,624 891,858 838,962 41,338 ($52,896)
Full Agency Costs (including Central Accounts)Salary and Wages ………………… $13,163,377 $13,085,860 $13,114,556 $14,202,990 $1,117,130 $1,088,434Fringe Benefits …………………… 4,315,499 4,509,579 4,921,631 4,643,792 134,213 (277,839) Pensions …………………………… 3,574,632 3,088,001 3,364,816 3,364,816 276,815 — Total PS ………………………… $21,053,508 $20,683,440 $21,401,003 $22,211,598 $1,528,158 $810,595
OTPS ……………………………… $10,759,549 $11,750,819 $10,651,160 $12,785,185 $1,034,366 $2,134,025Debt Service (incl. BARBs) ……… 2,731,770 2,674,278 3,091,632 2,698,140 23,862 (393,492) Total OTPS ……………………… $13,491,319 $14,425,097 $13,742,792 $15,483,325 $1,058,228 $1,740,533
Total Agency Costs ……………… $34,544,827 $35,108,537 $35,143,795 $37,694,923 $2,586,386 $2,551,128Less Intra-City …………………… $51,432 $61,230 $9,979 $25,579 ($35,651) $15,600Net Agency Cost ………………… $34,493,395 $35,047,307 $35,133,816 $37,669,344 $2,622,037 $2,535,528
FundingCity ………………………………… 19,744,245 19,864,695 19,683,151 19,362,610 (502,085) (320,541) Non-City …………………………… 14,749,150 15,182,612 15,450,665 18,306,734 3,124,122 2,856,069
Personnel (includes FTEs at fiscal year-end)City ………………………………… 117,209 117,285 117,482 117,482 197 — Non-City …………………………… 30,583 33,272 36,166 37,580 4,308 1,414 Total ……………………………… 147,792 150,557 153,648 155,062 4,505 1,414
Summary of Agency Financial Data The following table compares 2022 Executive Budget with the 2022 Preliminary Budget, the 2021 forecast and actual expenditures for 2020, including fringe benefits, pensions, and debt service.
2022Increase/(Decrease)($ in 000's)

Analysis of Agency Budgets Fiscal Year 2022
91
New York City Public School EnrollmentSchool Year 2018-2022
__________________________________________________________________________________________________________________________________________________________________________________________
2018 2019 2020 2021 2022 Actual Actual Actual Projections Projections__________________________________________________________________________________________________________________________________________________________________________________________
DOE Facilities EnrollmentGeneral Education* ............................... 791,606 770,295 750,374 712,495 693,770 Special Education** ............................ 151,082 155,440 157,733 154,783 159,680 Full Day Pre-K*** ................................ 29,664 30,246 31,435 26,553 28,934 Full Day 3-K**** ................................. 520 2,429 5,997 4,432 9,587
Subtotal ................................................ 972,872 958,410 945,539 898,263 891,971 Non-DOE Facilities EnrollmentCharter Schools .................................... 109,683 115,908 125,798 135,896 141,866Contract Schools .................................. 6,779 6,622 6,363 6,054 6,300Full Day Pre-K at NYCEECs*** ......... 38,217 37,640 35,429 30,992 35,845Half Day Pre-K at NYCEECs***......... 2,485 2,170 2,024 1,796 1,045Full Day 3-K at NYCEECs****........... 304 931 12,440 10,880 26,185EarlyLearn***** ................................... 0 0 6,882 3,877 7,772Special Ed Pre-K ................................... 37,220 36,438 36,374 29,666 33,690
Subtotal ................................................ 194,688 199,709 225,310 219,161 252,703
TOTAL ................................................ 1,167,560 1,158,119 1,170,849 1,117,424 1,144,674__________________________________________________________________________________________________________________________________________________________________________________________
* General Education enrollment includes students served in ICT settings as well as those in traditional classrooms.** Special Education enrollment includes Community School District and High School Special Education students in self-contained
classrooms, Citywide, Home and Hospital Instruction, and Special Education students served in ICT settings.*** Students who turn four years old during the calendar year of admission.**** Students who turn three years old during the calendar year of admission and attend programs in 3-K for All districts.***** The EarlyLearn program transferred to DOE in FY 2020. EarlyLearn enrollment includes children aged 0-2. 3- and 4-year olds
in EarlyLearn settings are counted in Pre-K and 3-K lines.
FUNDING SOURCES 2015 - 2022
0
5
10
15
20
25
20222021202020192018201720162015
* City funds include TFA and GO debt service, pensions and other fringe.** State funds include debt service and pensions.
$ in
Bil
lion
s
City*
State**
FederalForecast
Source: NYC OMB
Fiscal Year

Analysis of Agency Budgets Fiscal Year 2022
92
NYC PUBLIC SCHOOL ENROLLMENT 2015 - 2022
Includes Charter Schools, Special Education Pre-K, Universal Pre-K, 3-K, Special Education Contract Schools,and Integrated Co-Teaching. Excludes Long Term Absences.* Projected as of 2022 Executive Budget
Fiscal Year
Pup
ils
in T
hous
ands
900
1,000
1,100
1,200
1,300
2022*2021*202020192018201720162015
Forecast
Source: NYC OMB
Programmatic Review and Service Impact
The Student Population
Total enrollment supported by the Department’s budget, including Pre-Kindergarten, charter school and special education contract school students, is projected to increase by 27,250 from 1,117,424 in 2021 1,144,674 in 2022. Of this total, the City projects that general education public school enrollment for Kindergarten through grade 12 will be 812,271. Of these students, 693,770 are expected to attend schools operated by the Department of Education and 118,501 are expected to attend charter schools.
In 2022, the City projects that 189,345 school-age students will be enrolled in special education programs (a 19 percent share of total K-12 enrollment). This projected enrollment level is 4,803 students higher than the 2021 special education population of 184,542. Of these students, 84 percent are expected to attend Department of Education facilities, 12 percent are expected to attend charter schools, and 3 percent are expected to attend specialized private facilities (“contract schools”) paid for through the Department’s budget.
The City projects that 101,596 three- and four-year-olds will be served in Pre-K for All and the expanding 3-K for All programs. Of these, 38 percent will attend DOE facilities and 62 percent will attend New York City Early Education Centers (NYCEECs). Enrollment in 3-K for All is projected to grow significantly as the program expands Citywide in the fall of 2021.

Analysis of Agency Budgets Fiscal Year 2022
93
Staffing Levels
In 2022, the City’s financial plan supports a staffing level of 155,062. Of the total, 141,341 are full-time and 13,721 are Full Time Equivalents (FTEs). Pedagogical employees (which include teachers, superintendents, principals, assistant principals, guidance counselors, school secretaries, educational paraprofessionals and other school support staff) make up 127,938 of the full-time employees and 857 of the FTEs. Civilian employees represent 13,403 of the full-time employees and 12,864 of the FTEs.
FULL TIME AND FULL TIME EQUIVALENTDEPARTMENT OF EDUCATION EMPLOYEES 2015 - 2022
* Projected as of 2022 Executive Budget
Fiscal Year
Em
ploy
ees
130,000
135,000
140,000
145,000
150,000
155,000
160,000
2022*2021*202020192018201720162015
Source: NYC OMB
Forecast

Analysis of Agency Budgets Fiscal Year 2022
94
Capital Review
The 2022-2031 Ten-Year Capital Strategy totals $22.2 billion, which includes $15.1 billion in the 2022-2025 Four-Year Plan. The table below shows capital commitments by program area over the 2022-2025 period.
Capital Commitments($ in 000’s)
_______________________________________________________________________________________________________________________________________________________________________________________________________________
2022 2023 2024 2025 Plan Plan Plan Plan _____________ ___________ ________________________ _______________________ _______________________
City All City All City All City All Funds Funds Funds Funds Funds Funds Funds Funds_______________________________________________________________________________________________________________________________________________________________________________________________________________
System Expansion New Schools.............................................. $1,852,850 $1,852,850 $1,875,230 $1,875,230 $1,859,750 $1,859,750 $0 $0System Expansion Other .............................................................. $1,155,367 $1,155,367 $816,380 $816,380 $374,720 $374,720 $0 $0Rehabilitation of School Components ......................................... $1,413,933 $1,413,933 $862,120 $862,120 $780,290 $780,290 $546,541 $546,541Educational Enhancements .......................................................... $365,331 $365,331 $360,840 $360,840 $347,050 $347,050 $246,978 $246,978Emergency, Unspecified and Miscellaneous ............................... $711,567 $711,567 $563,510 $563,510 $342,100 $342,100 $364,748 $364,748Safety and Security ...................................................................... $66,600 $66,600 $68,400 $68,400 $67,970 $67,970 $47,833 $47,833Smart Schools Bond Act .............................................................. $0 $0 $0 $0 $0 $0 $0 $0 __ _____________ _____________ ____________ ____________ ____________ ____________ ____________ ____________
Total .............................................................................................. $5,565,648 $5,565,648 $4,546,480 $4,546,480 $3,771,880 $3,771,880 $1,206,100 $1,206,100 =========== =========== =========== =========== =========== =========== =========== ===========
_______________________________________________________________________________________________________________________________________________________________________________________________________________
TOTAL DEPARTMENT OF EDUCATION EXPENDITURES 2015 - 2022*
* Total DOE expenditures include pensions, other fringe, TFA and GO debt service.
$ in
Bil
lion
s
0
8
16
24
32
40
20222021202020192018201720162015
Source: NYC OMB
Fiscal Year
Forecast

Analysis of Agency Budgets Fiscal Year 2022
95
The Capital Plan for the Department of Education is modeled after the School Construction Authority’s Five-Year Plan for 2020-2024. This $19.3 billion plan provides:
• $8.9 billion for capacity. This includes 55,145 seats for elementary, middle, and high schools in an estimated 93 buildings (12,107 in Brooklyn; 11,983 in the Bronx; 2,978 in Manhattan; 24,233 in Queens; and 3,844 in Staten Island). The capacity category also includes funding to construct 3-K centers, to add 684 Pre-K seats in Brooklyn and Queens, for Class Size Reduction projects in specific schools which would benefit from additional capacity, and for capacity to replace Transportable Classroom Units (TCUs).
• $3.1 billion for the capital improvement program, allowing for exterior and interior building upgrades and other necessary capital repairs to school buildings. This category also includes $50 million to continue the removal of TCUs.
• $2.8 billion for school enhancement projects to support upgrades to technology, bathrooms, and science labs. This category also includes $750 million for accessibility, $276 million for electrical upgrades to support air conditioning in all classrooms, and $200 million for safety and security projects.
• $3.6 billion for mandated programs such as asbestos remediation, boiler conversions, building code compliance, insurance, and emergencies.
The 2022-2031 Plan includes $785.0 million to provide 6,451 seats for Universal 3-K expansion, $289 million for Electric School Bus expansion, $39.7 million in Borough President funding, $30.0 million for Early Learn, and $5.0 million for the Governor’s Island pool.

Analysis of Agency Budgets Fiscal Year 2022
96
ADMINISTRATION OF JUSTICE
Overview
In calendar year 2020, the New York City Police Department (NYPD) faced significant challenges because of both the COVID-19 pandemic beginning in March and mass protests principally in May and June but continuing on a smaller scale for the balance of the year. The NYPD remained operational at all levels, responding to 911 and 311 calls for service, patrolling the entire City, investigating crimes, and taking police action whenever necessary. The Department maintained order, addressed criminal activity, countered threats of terrorism in New York City, managed traffic control, and ensured the safety of motorists, pedestrians and cyclists.
The FBI’s index crime statistics indicate that New York City remains one of the safest large cities in the nation, with the lowest rate of crime per capita among the 10 largest U.S. cities. The NYPD’s index crime data for calendar year 2020 shows that overall major felony crime decreased by 0.7 percent compared to calendar year 2019. Despite this small decline, however, there were large percentage increases in several index crime categories. Murder increased by 46.7 percent (468 vs. 319), burglary by 41.9 percent (15,478 vs. 10,909), and grand larceny auto by 66.7 percent (9,037 vs. 5,422), the largest increases in these categories in 30 years. There were decreases seen in the remainder of the major index crimes. Rape decreased by 19.2 percent (1,427 vs. 1,766), robbery by 2.5 percent (13,108 vs. 13,439), assault by 1.5 percent (20,569 vs. 20,874), and grand larceny by 18.4 percent (35,502 vs. 43,505).
Arrests totaled 138,839 in calendar year 2020, decreasing by 73,974 from calendar year 2019. In calendar year 2020, the distribution of arrests was 47.0 percent felonies, 52.6 percent misdemeanors, and 0.4 percent violations.
NEW YORK CITY FBI INDEX CRIMES
0
40
80
120
160
200
Motor VehicleTheft
LarcenyBurglaryAggravatedAssault
RobberyExpandedRape**
ForcibleRape
Murder
Calendar Years 2001* - 2020
Tho
usan
ds
* In 2001, for Murder and Aggravated Assault, the unshaded portion represents World Trade Center victims. ** Expanded Rape category added in 2013.
0
1
2
3
4
Expanded RapeForcible RapeMurder
2020
2019
2017
2015
2013
2011
2001
Source: NYPD

Analysis of Agency Budgets Fiscal Year 2022
97
In calendar year 2020, the overall arrest level decreased by 34.8 percent from calendar year 2019; felony arrests decreased by 21.7 percent, misdemeanor arrests decreased by 42.5 percent, and violation arrests decreased by 78.1 percent.
POLICE DEPARTMENT
NEW YORK CITY FELONY & MISDEMEANOR ARRESTS
0
50
100
150
200
250
300
350
400
202020192018201720162015201420132012201120102009200820072006200520042003200220012000
Tho
usan
ds
Calendar Years 2000 - 2020
Misdemeanor
Felony
Source: NYPD
Under the leadership of Police Commissioner Dermot Shea, the NYPD has continued the implementation of Neighborhood Policing in all 77 precincts, all nine of the Housing Bureau police service areas and in all of the 12 Transit Bureau districts. At a time when further police reforms are imminent and essential, Neighborhood Policing stands as a wide-ranging set of reforms that affirms the Department’s commitment to reducing crime, promoting trust and respect, and solving problems collaboratively, both within the Department and with neighborhood residents. The Department supports Neighborhood Policing with social media accounts and the interactive agency website, allowing community members to contact officers directly and enabling a one-on-one approach to sharing and addressing issues.
The NYPD has redoubled its focus on community concerns by enhancing training to include awareness of implicit biases; tactics to bring people safely into custody and de-escalate enforcement encounters;
guidance to appropriately handle mental health calls; and the use of life-saving medical techniques and equipment. Additionally, with invaluable input from the community and external stakeholders, the NYPD’s use-of-force policies have been revised and continue to exceed national standards.
DEPARTMENT OF CORRECTION
The Department of Correction dedicates itself to transforming the lives of those in its care and building safer communities across every borough. The staff collaborate across multiple divisions and facilities to create a safe and supportive environment for all persons in custody and providing incarcerated individuals with a path to successfully reenter their communities. The Department remains committed to acting with integrity and professionalism at all times and continues to lead the way in humane and transparent correctional practices. To that end, the Department has become a national leader in correctional best practices in a number of areas, including solitary confinement reform and housing

Analysis of Agency Budgets Fiscal Year 2022
98
incarcerated persons according to their gender identity. The Department is embarking on a historic reimagining of jail facilities by working collaboratively with sister agencies to design and build state of the art borough-based facilities by 2027. By closing Rikers Island and building borough-based jails, the Department will be able to provide people in custody with a better ability to remain connected to their communities and help end the cycle of reincarceration.
At the same time, the Department continues to invest in its staff through the creation of an on-island wellness center and significant training and leadership development opportunities. The Department temporarily paused its academy classes as it prepared to downsize its staff through natural attrition in advance of the transition to borough-based facilities, but in order to support current operations will welcome a class of 400 new officers in 2021.
OTHER CRIMINAL JUSTICE PROGRAMS
The Mayor’s Office of Criminal Justice (MOCJ) works with partners across the justice system, including mayoral agencies, courts, prosecutors, defendants, non-profits, foundations, and everyday New Yorkers to design, deploy, and evaluate citywide strategies. These strategies aim to increase safety, reduce unnecessary arrests and incarceration, and improve the system’s fairness. During the pandemic, MOCJ’s service providers were essential pieces of the City’s response, providing lifelines to hard-hit communities and standing up critical services to meet the increased need faced by residents. Examples of MOCJ’s work include:
• Emergency Jail Reduction Plan: At the onset of the pandemic, MOCJ worked quickly with justice system partners to initiate several changes focused on safety and security during the health crisis. Working with the Department of Correction (DOC), New York State Office of Court Administration (OCA), local district attorneys, and law enforcement, the City was able to safely and rapidly reduce the jail population to historic lows, including through the 6A city sentenced furlough program. MOCJ also worked with partners in the court system to quickly standup a remote hearing system that allowed arraignments to proceed virtually.
• The Office of Neighborhood Safety: Home to three distinct local safety initiatives—the Mayor’s Action Plan for Neighborhood Safety (MAP), the Office to Prevent Gun Violence (OPGV), and Atlas—
brought together under one office, the Office of Neighborhood Safety (ONS) was launched in December 2019. Each is focused on building long-term safety within communities, while addressing immediate needs of the individuals they serve.
• MAP: Launched in 15 New York City Housing Authority (NYCHA) developments that accounted for 20 percent of all violent crime in the City’s public housing at the start of the administration, MAP enlists residents, City agencies and community-based partners to help move beyond enforcement and address the factors underlying safety. Through NeighborhoodStat, the operational centerpiece of MAP, the collective expertise of residents, government, and community partners is harnessed to drive meaningful dialogue, problem solving and, ultimately, change at both the neighborhood and administrative levels. Neighborhoods where MAP operate were shown to have significant reductions in major felony (7.5 percent) and misdemeanor (20.0 percent) crime after the program began. During the COVID-19 pandemic, MAP teams ensured local NYCHA residents had access to basic resources like food and personal protective equipment.
• OPGV: Since 2010, the Crisis Management System (CMS) program has continued to expand, up to 31 sites by FY22. These violence interrupters are not only playing a key part in helping to break the cycle of gun violence in communities across the City—from 2010 to 2020, CMS locations saw a 3% reduction in shootings, compared to 17% rise in comparison sites. CMS providers also played critical roles during the pandemic, helping to keep communities safe during social distancing restrictions and distributing protective materials like masks.
• Atlas: Partnering with United Way of New York City, Atlas is set to fully launch its innovative service programs citywide in FY22. The $23.0 million program is a one-of-a-kind support and service model tailored for people residing at home in their communities pretrial. By providing voluntary access to therapy, job training, mental health services, and other programming, Atlas looks to break the cycle of recidivism and potential crime escalation that too often starts among this population. The Atlas model also serves as an incubator of community-based

Analysis of Agency Budgets Fiscal Year 2022
99
services, investing in local organizations to create a thriving, resource-rich network of sustainable and successful social entrepreneurship. Atlas aims to connect with over 1,000 families by the start of the next calendar year.
• Reentry Services: At the onset of the pandemic, MOCJ’s reentry services team quickly created a system from scratch to safely provide a place to stay for individuals being released from custody. A network of hotels was quickly set up and staffed with service providers trained specifically to help formerly incarcerated individuals through the reentry process. As the City worked with its partners to quickly and safely reduce the jail population, the reentry services team’s efforts helped dozens of individuals stay out of the homeless shelter system, while the service providers were able to engage directly and intensively with their clients to help them get back on their feet. These efforts provide a successful model for how reentry services can better serve our returning neighbors, giving them the resources to achieve more successful long-term outcomes.
• Office of Pretrial Justice Initiatives: Launched in late 2019, the Office of Pretrial Justice Initiatives (OPJI) is primarily responsible for the continued expansion of the City’s nationally recognized Supervised Release program. The program began 2020 in service of a significantly broader set of eligible clients, thanks to changes that went into effect with the State’s bail laws. The rollout of the expansion was interrupted by court closures during the pandemic severely limiting access to Supervised Release for new individuals. However, with the court system eyeing a return to more normal operations in FY22, Supervised Release is positioned to continue to provide services that helped the City reach historic lows in its jail population at the same time it became and remains the safest large City in the country.
• The Office of Special Enforcement: As a multi-agency task force charged with addressing illegal short-term rentals, the Office of Special Enforcement (OSE) continued to protect the City’s housing stock from individuals and companies that violate the law and put New Yorkers at risk. The office applied its enforcement expertise to the City’s efforts to address the impacts of the COVID-19 pandemic, playing a coordinating and inspection role in the City’s efforts to ensure compliance with executive orders relating to businesses reopening, and it served as the enforcement lead for emergency restrictions on fees charged to restaurants by food delivery service app companies.
• Borough-Based Jail Facilities: The design and construction of new facilities that will replace those closed on Rikers Island continue to move steadily forward. The design-build process foresees firm selection concluding by the end of FY22 in each borough, with preliminary site preparation and demolition work beginning midway through the fiscal year, if not sooner. The City continues to be deeply engaged with the communities around design, with feedback from justice advocates, neighborhood advisers, our architect-led peer review, and others being collected to better reflect the host of priorities around the new facilities. The updated timeline for the overall project has an August 2027 completion date, now with a $8.1 billion budget that reflects over $500.0 million in cost savings.
• Office for the Prevention of Hate Crimes: Mayor Bill de Blasio launched the Office for the Prevention of Hate Crimes (OPHC) in summer 2019. Embedded in the Mayor’s Office of Criminal Justice, OPHC takes a holistic approach to preventing hate crimes, developing and coordinating community-driven prevention strategies to address biases fueling such crimes, and fostering healing for victims and their communities. The office coordinates City efforts to prevent and respond to hate crimes through an interagency committee, which includes the NYPD, City Commission on Human Rights, Mayor’s Community Affairs Unit, Department of Education, Mayor’s Office to End Domestic and Gender-Based Violence, Mayor’s Office of Immigrant Affairs, Department of Health and Mental Hygiene, ThriveNYC, and Department of Youth and Community Development.
• NYPD Reform Implementation Working Group: MOCJ is taking a lead role in the implementation of the recently passed police reform agenda. The host of reforms passed by the City Council and signed into law by Mayor de Blasio will be publicly tracked online, with a number of MOCJ programs, most notably the CMS network, involved as a key piece of the reform agenda.
• Indigent Legal Services: The NYS Office of Indigent Legal Services (ILS) is funding localities, including New York City, to implement indigent defense program enhancements at institutional providers and assigned counsel plans (ACP). MOCJ’s ACP received funding to build out more program support services to the contracted attorneys.

Analysis of Agency Budgets Fiscal Year 2022
100
POLICE DEPARTMENT
The mission of the New York City Police Department is to enhance the quality of life in New York City by working in partnership with the community to enforce the law, preserve peace, protect the people, reduce fear, and maintain order.
Financial Review
The New York City Police Department’s 2022 Executive Budget provides for an operating budget of $5.4 billion, an increase of $22.5 million from the $5.4 billion forecast for 2021. This increase is primarily attributable to uniform overtime cuts in FY22 that are less significant than the overtime cuts in FY21. Capital commitments of $492.2 million are also provided in 2022.
Revenue Forecast
The Police Department collects revenue from fees charged for pistol licenses, rifle permits, fingerprint fees, tow fees, and unclaimed cash and property that is abandoned or confiscated as a consequence of the commission of a crime. The City also receives E-911 surcharges imposed on all New York City cellular telephones, landline telephones and voice over internet protocol service (VoIP). In addition, the Department is recouping traffic control costs from non-charitable athletic parades. In 2022, the revenue estimate for the Police Department is $104.0 million.
Expense Budget Highlights
Budgetary Priorities: Providing Core Services
• In 2022, the Department will have a uniformed headcount of approximately 35,030.
• The Department expects to receive up to $30.9 million for the protection of foreign missions under the Federal Fiscal Year 2021 Appropriation Act.
Streamlining and Restructuring
• The Department received $27.0 million in City funds to provide for Mobility data plans and back-end infrastructure. Funds for data plans support tablet computers in police vehicles as well as mobile phones for all uniform members of service, which help the Department with effective neighborhood policing. Funds for back-end infrastructure includes hardware and software maintenance, cyber security applications, development of new, and enhancing of existing, applications, and ongoing field support for approximately 40,000 devices.
• The Department received $14.1 million in City funds to address Executive Order 203, requiring each local government in New York State to adopt a policing reform plan that will maintain public safety while building mutual trust and respect between police and the communities they serve. The Department’s Police Reform plan includes funds for a Health and Wellness Program, enhancing precinct-based customer experiences, and providing additional implicit bias training techniques for uniform members of service.
• The Department received $2.5 million in City funds to provide bullet resistant vests for uniform members of service within the Detective Bureau as well as replacement bullet resistant vests for those that have reached their useful life.
• The Department received $0.8 hundred thousand in City funds to hire eight Community Ambassadors who will act as liaisons to the Department in order to provide a deeper connection between the Department and New York City communities.

Analysis of Agency Budgets Fiscal Year 2022
101
2021 20222020
Actual2021
ForecastPreliminary
BudgetExecutive
Budget Forecast Preliminary
BudgetExpenditures
Salary and Wages ……….. $5,375,484 $4,683,355 $4,952,429 $4,910,210 $226,855 ($42,219)Fringe Benefits …………… 78,510 80,054 75,435 75,435 (4,619) — OTPS ……………...……… 632,167 649,539 391,812 449,757 (199,782) 57,945 Total ……………...……… $6,086,161 $5,412,948 $5,419,676 $5,435,402 $22,454 $15,726
FundingCity ……………...………… $5,281,155 $4,887,113 $5,101,621 $5,117,345 $230,232 $15,724Other Categorical Grants … 26,525 6,179 — — (6,179) — IFA ……………...………… — — — — — — State ……………...……… 54,043 31,682 732 732 (30,950) — Federal CD ……………...… — — — — — — Federal Other ……………. 424,288 193,974 11,765 11,765 (182,209) — Intra-City Other …………… 300,150 294,000 305,558 305,560 11,560 2 Total ……………...……… $6,086,161 $5,412,948 $5,419,676 $5,435,402 $22,454 $15,726
Additional Costs Centrally FundedPersonal Services (PS) Fringe Benefits ………… $1,790,686 $2,201,762 $2,201,323 $2,529,920 $328,158 $328,597 Pensions ……………...… 2,699,370 2,728,803 2,955,449 2,955,449 226,646 — Other Than Personal Service (OTPS) Debt Service ……………. 195,166 196,300 227,972 242,548 46,248 14,576 Total Additional Costs $4,685,222 $5,126,865 $5,384,744 $5,727,917 $601,052 $343,173
FundingCity ……………...………… 4,463,308 4,842,247 5,316,691 5,339,734 497,487 23,043 Non-City ……………...…… 221,914 284,618 68,053 388,183 103,565 320,130
Full Agency Costs (including Central Accounts)Salary and Wages ………… $5,375,484 $4,683,355 $4,952,429 $4,910,210 $226,855 ($42,219)Fringe Benefits …………… 1,869,196 2,281,816 2,276,758 2,605,355 323,539 328,597 Pensions ……………...…… 2,699,370 2,728,803 2,955,449 2,955,449 226,646 — Total PS ……………...…… $9,944,050 $9,693,974 $10,184,636 $10,471,014 $777,040 $286,378
OTPS ……………...……… $632,167 $649,539 $391,812 $449,757 ($199,782) $57,945Debt Service …………….. 195,166 196,300 227,972 242,548 46,248 14,576 Total OTPS $827,333 $845,839 $619,784 $692,305 ($153,534) $72,521
Total Agency Costs ………$10,771,383 $10,539,813 $10,804,420 $11,163,319 $623,506 $358,899Less Intra-City …………… $300,150 $294,000 $305,558 $305,560 $11,560 $2Net Agency Cost ………… $10,471,233 $10,245,813 $10,498,862 $10,857,759 $611,946 $358,897
FundingCity ……………...………… 9,744,463 9,729,360 10,418,312 10,457,079 727,719 38,767 Non-City ……………...…… 726,770 516,453 80,550 400,680 (115,773) 320,130
Personnel (includes FTEs at fiscal year-end)City ……………...………… 53,331 51,844 52,278 52,462 618 184 Non-City ……………...…… 85 111 20 20 (91) — Total ……………...……… 53,416 51,955 52,298 52,482 527 184
Summary of Agency Financial Data The following table compares 2022 Executive Budget with the 2022 Preliminary Budget, the 2021 forecast and actual expenditures for 2020, including fringe benefits, pensions, and debt service.
2022Increase/(Decrease)($ in 000's)

Analysis of Agency Budgets Fiscal Year 2022
102
Programmatic Review and Service Impact
In calendar year 2020, the New York City Police Department (NYPD) faced significant challenges because of both the COVID-19 pandemic beginning in March and mass protests principally in May and June but continuing on a smaller scale for the balance of the year. The NYPD remained operational at all levels, responding to 911 and 311 calls for service, patrolling the entire City, investigating crimes, and taking police action whenever necessary. The Department maintained order, addressed criminal activity, countered threats of terrorism in New York City, managed traffic control, and ensured the safety of motorists, pedestrians and cyclists.
The FBI’s index crime statistics indicate that New York City remains one of the safest large cities in the nation, with the lowest rate of crime per capita among the 10 largest U.S. cities. The NYPD’s index crime data for calendar year 2020 shows that overall major felony crime decreased by 0.7 percent compared to calendar year 2019. Despite this small decline, however, there were large percentage increases in several index crime categories. Murder increased by 46.7 percent (468 vs. 319), burglary by 41.9 percent (15,478 vs. 10,909), and grand larceny auto by 66.7 percent (9,037 vs. 5,422), the largest increases in these categories in 30 years. There were decreases seen in the remainder of the major index crimes. Rape decreased by 19.2 percent (1,427 vs. 1,766), robbery by 2.5 percent (13,108 vs. 13,439), assault by 1.5 percent (20,569 vs. 20,874), and grand larceny by 18.4 percent (35,502 vs. 43,505).
Precision Policing provides an intensif ied investigative focus on continuously managing and controlling crime. It directs resources and attention to the relatively small percentage of the population responsible for committing most of the violence. In 2020, the Department coordinated efforts to maintain civil order during mass protests and facilitating peaceful protest while simultaneously identifying those responsible for violence among peaceful protestors.
Citywide, the Department is continuing to leverage every tool available to keep the City safe, including the use of new and innovative technology. The NYPD has invested in several technology upgrades to ensure our officers have all of the data necessary to make informed decisions. These upgrades included enhanced applications on smartphones and the use of ShotSpotter technology to detect gunshots.
To maintain transparency and accountability among officers and the subjects of police action, the Department has equipped more than 24,000 officers in field commands with body-worn cameras. Cameras are worn by all police officers, detectives, sergeants, lieutenants and executives regularly assigned to perform patrol and specialized duties. The cameras can now provide an objective record of encounters between police and the public throughout the city. Analysis of the use of body-worn cameras has shown that cameras may help de-escalate potentially volatile encounters and often provide important evidence in criminal and civil proceedings, as well as resolving civilian complaints.
The Department has taken further steps to set the standard for innovation and reform. In an effort to increase transparency, the NYPD has posted interactive dashboards on hate crimes and staffing demographics, proposed a new police misconduct discipline matrix for public comment, and published a customer survey to solicit feedback on customer service from members of the public. To ensure fair and equitable policing within our communities, the Department also established the new youth coordination officer to engage with young people, disbanded plainclothes anti-crime units, and began holding discussion forums for employees to share their experiences and views on race and law enforcement, and social justice.
The NYPD plays a vital role in public safety by enforcing traffic laws and educating the public regarding traffic safety. The Department is collaborating with the City’s Department of Transportation in an effort to reduce traffic fatalities and maintain the safety of pedestrians, motorists, and bicyclists alike. While the legislative mandates and governmental guidelines related to the COVID-19 pandemic resulted in fewer vehicles on the roadways, the NYPD continued to address traffic and vehicular violations. In calendar year 2020, the NYPD issued 125,007 summonses for speeding and 47,652 summonses issued for texting or using a cell phone while driving.

Analysis of Agency Budgets Fiscal Year 2022
103
ARRESTS VERSUS CRIME
Calendar Year
* In 2001, Index Crime data excludes World Trade Center victims.
Num
ber
of A
rres
ts
Source: NYPD
0
100,000
200,000
300,000
400,000
500,000
20202019
20182017
20162015
20142013
20122011
20102009
20082007
20062005
20042003
20022001*
2000
Index Crime Total Arrests

Analysis of Agency Budgets Fiscal Year 2022
104
TOTAL CITY, TRANSIT AND HOUSING POLICE FORCE HEADCOUNT
0
5,000
10,000
15,000
20,000
25,000
30,000
35,000
40,000
45,000
Fiscal Year
Ave
rage
Hea
dcou
nt
Source: NYC OMB & NYPD
Forecast
20222021
20202019
20182017
20162015
20142013
20122011
20102009
20082007
20062005
Uniformed Headcount
The Department continues its efforts to recruit and hire a diverse team of police officers. Of the 326 recruits hired for the February 2021 class, 72.7 percent identified as minorities. Ninety-seven were born in foreign countries and 145 speak a foreign language. The December 2020 recruit class consisted of 599 recruits, 61.6 percent of whom identified as minorities. One hundred and fifty-six were born in foreign countries, and 239 speak a foreign language. The November 2020 recruit class consisted of 920 recruits, 60.8 percent of whom identified as minorities. One hundred and eighty were born in foreign countries, and 304 speak a foreign language.

Analysis of Agency Budgets Fiscal Year 2022
105
Capital Review
The Ten-Year Capital Strategy for the Police Department provides the Department with a total of $1.5 billion for the replacement, reconstruction, and maintenance of facilities citywide; replacement and upgrade of computer, communication, and miscellaneous equipment; and the replacement of transportation equipment. Of this amount, $1.0 billion is allocated in the Four-Year Plan, which covers 2022 through 2025.
The table below shows capital plan commitments by program area over the 2020-2025 period.
Capital Commitments($ in 000’s)
_______________________________________________________________________________________________________________________________________________________________________________________________________________
2020 2021 2022 2023 2024 2025 Actual Plan Plan Plan Plan Plan ________________________ _______________________ ________________________ _______________________ ________________________ _______________________
City All City All City All City All City All City All Funds Funds Funds Funds Funds Funds Funds Funds Funds Funds Funds Funds_______________________________________________________________________________________________________________________________________________________________________________________________________________
Police Facilities .......................... $51,442 $51,508 $104,451 $104,503 $252,162 $293,046 $134,450 $136,766 $30,146 $30,146 $210,133 $210,133Computer Equipment ................. 66,725 66,725 35,020 35,020 56,145 56,145 5,700 5,700 1,081 1,081 57,997 57,997Communications ........................ 1,005 1,005 0 0 61,982 61,982 7,859 7,859 0 0 29,697 29,697Equipment .................................. 2,175 2,175 3,988 3,988 24,891 24,891 4,207 4,207 2,505 2,505 4,310 4,310Vehicles ...................................... 6,281 6,281 827 827 56,138 56,138 9,922 9,922 13,017 13,017 37,480 37,480 ___________ ___________ ___________ ___________ ___________ ___________ ___________ ___________ ___________ ___________ ___________ ___________
Total ........................................... $127,628 $127,694 $144,286 $144,338 $451,318 $492,202 $162,138 $164,454 $46,749 $46,749 $339,617 $339,617 ========= ========= ========= ========= ========= ========= ========= ========= ========= ========= ========= =========
_______________________________________________________________________________________________________________________________________________________________________________________________________________
Highlights of the 2022-2025 Four Year Capital Commitment Plan
Police Facilities (total commitment, $670.1 million)
• Construction of the Rodman’s Neck Firearms Training Facility ($225.4 million).
• Construction of a new 116th Precinct in Southeast Queens ($91.9 million).
• American with Disabilities Act (ADA) compliance renovations at various NYPD precincts, Citywide ($29.3 million).
• Facility maintenance and reconstruction Department-wide ($323.4 million).
Communications and Computer Equipment (total commitment, $220.5 million)
• Replacement of portable radios ($51.5 million) and mobile radios ($4.5 million).
• Radio infrastructure replacement ($35.2 million).
• Purchase and upgrade of miscellaneous computer equipment, including the Data Center Refresh ($13.2 million) and Customer Relationship Management (CRM) applications ($12.6 million).
• Replacement and upgrade of various Department technologies and equipment ($103.4 million).
Miscellaneous Equipment (total commitment, $35.9 million)
• Purchase and upgrade of miscellaneous equipment such as facility security camera upgrades, forensic lab equipment and diesel marine engines ($35.9 million).
Vehicles (total commitment, $116.6 million)
• Lifecycle replacement of Air-Sea rescue helicopters ($30.9 million).
• Lifecycle replacement of medium duty tow trucks ($25.2 million).
• Lifecycle replacement of all other vehicles ($60.5 million).

Analysis of Agency Budgets Fiscal Year 2022
106
DEPARTMENT OF CORRECTION
The Department of Correction provides a safe and secure environment to detainees awaiting trial or sentencing and misdemeanants or felons sentenced to one year or less. It also detains State prisoners with court appearances in New York City; newly sentenced felons awaiting transportation to State correctional facilities; and alleged parole violators awaiting revocation hearings. Over the course of their incarceration, the Department provides these individuals with programming opportunities and discharge planning services.
Financial Review
The Department of Correction’s 2022 Executive Budget provides for operating expenses of $1.2 billion, an increase of $38.0 million from the amount forecast in 2021. Capital commitments of $785.6 million are also planned in 2022.
Revenue Forecast
The Department of Correction collects revenue, which goes into the general fund, from jail commissary operations and vending machines. In 2022, the Department expects to collect approximately $15.5 million from all revenue sources.
Expense Budget Highlights
Budgetary Priorities: Savings
• The Department faced unique operational challenges due to the ongoing COVID-19 pandemic which led to a number of measures being taken in order to ensure the safety of people in Departmental custody and staff. The changing landscape of the criminal justice system in New York City has resulted in significant changes to Departmental operations. This has resulted in savings being achieved by the Department over the course of the past year, including a reduction of $132.4 million and 1,573 uniformed positions in the baseline related to the partial closure of AMKC and the full closures of MDC and OBCC. Additional operational changes include a uniformed overtime reduction of $69.9 million in 2022 and $25.0 in the baseline beginning in 2023 as a result of the facility closures.
• To ensure the Department effectively meets core services until the COVID-19 pandemic subsides, a new correction officer class will be hired. Well-functioning recruitment processes are central to the Department’s ability to remain optimally staffed. The recruit class will graduate from the Department’s training academy in 2022, resulting in 400 new officers on duty.
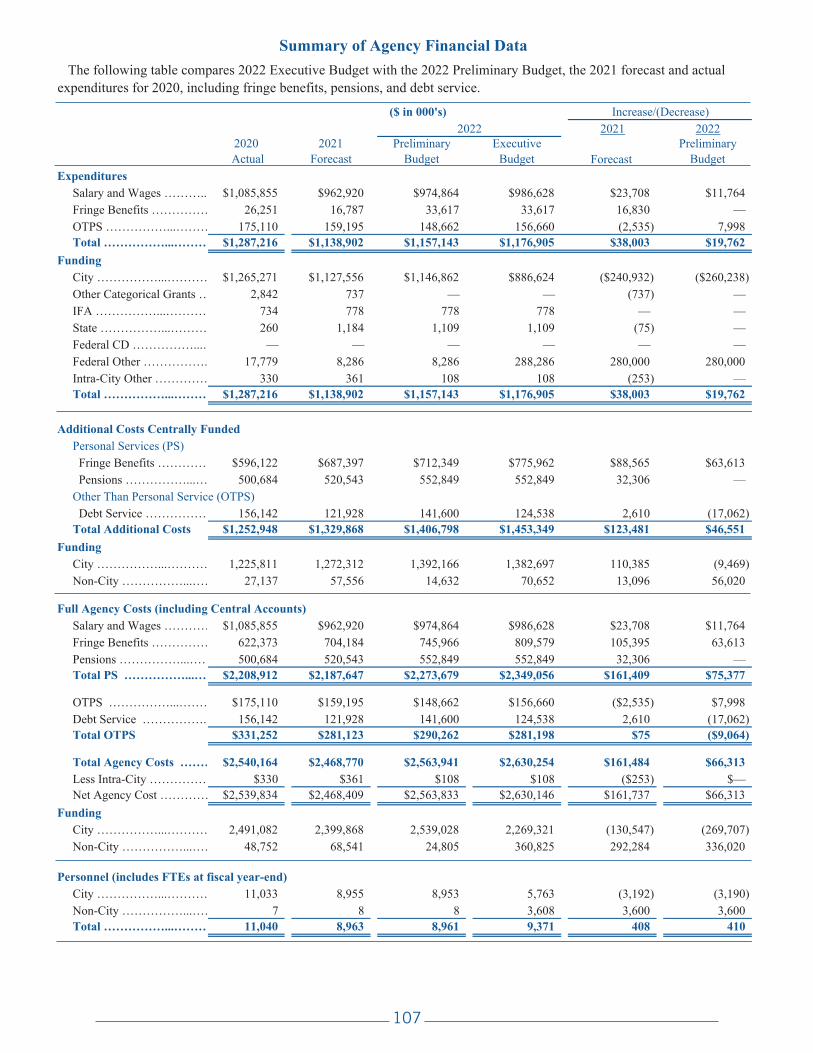
Analysis of Agency Budgets Fiscal Year 2022
107
2021 20222020
Actual2021
ForecastPreliminary
BudgetExecutive
Budget Forecast Preliminary
BudgetExpenditures
Salary and Wages ……….. $1,085,855 $962,920 $974,864 $986,628 $23,708 $11,764Fringe Benefits …………… 26,251 16,787 33,617 33,617 16,830 — OTPS ……………...……… 175,110 159,195 148,662 156,660 (2,535) 7,998 Total ……………...……… $1,287,216 $1,138,902 $1,157,143 $1,176,905 $38,003 $19,762
FundingCity ……………...………… $1,265,271 $1,127,556 $1,146,862 $886,624 ($240,932) ($260,238)Other Categorical Grants … 2,842 737 — — (737) — IFA ……………...………… 734 778 778 778 — — State ……………...……… 260 1,184 1,109 1,109 (75) — Federal CD ……………...… — — — — — — Federal Other ……………. 17,779 8,286 8,286 288,286 280,000 280,000 Intra-City Other …………… 330 361 108 108 (253) — Total ……………...……… $1,287,216 $1,138,902 $1,157,143 $1,176,905 $38,003 $19,762
Additional Costs Centrally FundedPersonal Services (PS) Fringe Benefits ………… $596,122 $687,397 $712,349 $775,962 $88,565 $63,613 Pensions ……………...… 500,684 520,543 552,849 552,849 32,306 — Other Than Personal Service (OTPS) Debt Service ……………. 156,142 121,928 141,600 124,538 2,610 (17,062) Total Additional Costs $1,252,948 $1,329,868 $1,406,798 $1,453,349 $123,481 $46,551
FundingCity ……………...………… 1,225,811 1,272,312 1,392,166 1,382,697 110,385 (9,469) Non-City ……………...…… 27,137 57,556 14,632 70,652 13,096 56,020
Full Agency Costs (including Central Accounts)Salary and Wages ………… $1,085,855 $962,920 $974,864 $986,628 $23,708 $11,764Fringe Benefits …………… 622,373 704,184 745,966 809,579 105,395 63,613 Pensions ……………...…… 500,684 520,543 552,849 552,849 32,306 — Total PS ……………...…… $2,208,912 $2,187,647 $2,273,679 $2,349,056 $161,409 $75,377
OTPS ……………...……… $175,110 $159,195 $148,662 $156,660 ($2,535) $7,998Debt Service …………….. 156,142 121,928 141,600 124,538 2,610 (17,062) Total OTPS $331,252 $281,123 $290,262 $281,198 $75 ($9,064)
Total Agency Costs ……… $2,540,164 $2,468,770 $2,563,941 $2,630,254 $161,484 $66,313Less Intra-City …………… $330 $361 $108 $108 ($253) $—Net Agency Cost ………… $2,539,834 $2,468,409 $2,563,833 $2,630,146 $161,737 $66,313
FundingCity ……………...………… 2,491,082 2,399,868 2,539,028 2,269,321 (130,547) (269,707) Non-City ……………...…… 48,752 68,541 24,805 360,825 292,284 336,020
Personnel (includes FTEs at fiscal year-end)City ……………...………… 11,033 8,955 8,953 5,763 (3,192) (3,190) Non-City ……………...…… 7 8 8 3,608 3,600 3,600 Total ……………...……… 11,040 8,963 8,961 9,371 408 410
Summary of Agency Financial Data The following table compares 2022 Executive Budget with the 2022 Preliminary Budget, the 2021 forecast and actual expenditures for 2020, including fringe benefits, pensions, and debt service.
2022Increase/(Decrease)($ in 000's)

Analysis of Agency Budgets Fiscal Year 2022
108
AVERAGE LENGTH OF STAY (By Fiscal Year)
In D
ays
*YTD through March 31, 2021
Fiscal YearSource: NYC Department of Correction
30
40
50
60
70
80
90
100
2021*20202019201820172016201520142013201220112010
DetaineeSystem
AVERAGE DAILY INMATE POPULATION
0
5,000
10,000
15,000
20,000
2021*20202019201820172016201520142013201220112010Fiscal Year
*YTD through March 31, 2021
9,790 9,5018,896
7,939
13,050 12,795 12,290 11,813 11,40810,435
StateSentencedDetainee
Source: NYC Department of Correction
Num
ber
of I
nmat
es
4,7215,841
Programmatic Review

Analysis of Agency Budgets Fiscal Year 2022
109
The average daily population through the first nine months of 2021 was 4,721, which is 19.2 percent lower than the average in 2020. System admissions are down 12 percent and overall system length of stay for the first nine months decreased from 90 to 79 days.
Capital Review
The 2022 – 2031 Ten-Year Capital Strategy totals $9.6 billion for the design and construction of new jail facilities, for support space, including a new training academy, for building systems and infrastructure, and for the lifecycle replacement of equipment.
The table below shows capital plan commitments by program area over the 2020-2025 period.
Capital Commitments($ in 000’s)
_______________________________________________________________________________________________________________________________________________________________________________________________________________
2020 2021 2022 2023 2024 2025 Actual Plan Plan Plan Plan Plan ________________________ ___________ ____________ ________________________ _______________________ ________________________ _______________________
City All City All City All City All City All City All Funds Funds Funds Funds Funds Funds Funds Funds Funds Funds Funds Funds_______________________________________________________________________________________________________________________________________________________________________________________________________________
New Jail Facilities ........................ $9,355 $9,355 $55,843 $55,843 $383,814 $383,814 $1,292,062 $1,292,062 $1,923,951 $1,923,951 $1,853,877 $1,853,877Capacity Replacement ................. 0 0 595 595 0 0 0 0 0 0 0 0Support Space .............................. 2,177 2,177 301 301 4,242 4,242 10,000 10,000 0 0 97,295 97,295Building Systems and Infrastructure.............................. 21,821 23,849 20,363 55,267 337,246 337,246 20,108 20,108 478 478 346,713 346,713Equipment .................................... 6,846 6,846 2,173 2,173 60,358 60,358 10,844 10,844 12,339 12,339 17,732 17,732 ___________ ___________ ___________ ___________ ___________ ___________ ___________ ___________ ___________ ___________ ___________ ___________
Total ............................................. $40,199 $42,227 $79,275 $114,179 $785,660 $785,660 $1,333,014 $1,333,014 $1,936,768 $1,936,768 $2,315,617 $2,315,617 ========= ========= ========= ========= ========= ========= ========= ========= ========= ========= ========= =========
__________________________________________________________________________________________________________________________________________________________________________________________
Highlights of the 2022-2025 Four Year Capital Commitment Plan
New Jail Facilities (total commitment, $5.5 billion)
The Department’s plan includes $5.5 billion for the design and construction of new jail facilities.
Building Systems, Infrastructure and Support Space (total commitment, $816.1 million)
The Department will undertake $816.1 million in improvements to building systems, infrastructure and support space during the Four-Year Plan. Projects include:
• Continuation of fire life safety upgrades ($136.9 million).
• Design and construction of a new training academy ($100.0 million).
• Heating, cooling, ductwork and ventilation upgrades ($93.8 million).
• Modification of facility entrances for ADA compliance ($58.0 million).
• Roof, façade, window and courtyard reconstruction and repair ($44.2 million).
Information Technology, Equipment, and Vehicles (total commitment, $101.3 million)
The Four-Year Plan provides $101.3 million for vehicles, computers, security equipment and communication systems. Priorities include:
• Various information technology upgrades ($64.8 million).
• Generator replacement ($4.7 million).

Analysis of Agency Budgets Fiscal Year 2022
110
DEPARTMENTS OF SOCIAL AND HOMELESS SERVICESDEPARTMENT OF SOCIAL SERVICES
The Department of Social Services / Human Resources Administration (“DSS” or “HRA”) provides a range of services and programs to fight poverty, inequality and homelessness and to increase the economic well-being of families and individuals.
In April 2016, a comprehensive plan to improve the delivery of effective and efficient homeless services in New York City was announced, subsequent to a 90-day review of homeless services across City agencies. As an outcome of the review, in 2017, an integrated management structure was created in DSS with HRA and the Department of Homeless Services (DHS) reporting to a single Commissioner for Social Services. Administrative support services have been streamlined through a shared services model that consolidates functions, including finance, human resources, contracting and information technology under the Department of Social Services (DSS).
The Human Resources Administration administers benefit programs including Cash Assistance (CA), Emergency Assistance, Supplemental Nutrition Assistance (SNAP), and Medical Assistance to support low-income New Yorkers. The Agency also provides child support services, and assists individuals returning to or entering the workforce by providing a variety of employment-related services, including access to education and job training, and assistance with job search and placement. In addition, HRA provides services and support to prevent and alleviate homelessness, including one-time emergency rent arrears grants, ongoing rental assistance and supportive housing, as well as community-based prevention services and legal services to prevent displacement and eviction, and address immigration-related issues. Programs for survivors of domestic violence, people with HIV or AIDS, the frail and elderly, and individuals with disabilities provide a safety net for those permanently or temporarily unable to work. In 2019, HRA began administering Fair Fares, a program that provides discounted public transit benefits for low-income New Yorkers.
Financial Review
The Department’s 2022 Executive Budget provides for operating expenses of $11 billion, of which $8.5 billion are City funds. A capital budget in 2022 of $194.6 million is also provided, of which $173.1 million are City funds.
Expense Budget Highlights
Program Enhancements
• An additional $168 million in 2022 will support the Department’s rental assistance and rehousing programs, developed and expanded in coordination with DHS, which have helped New Yorkers move out of shelter or avoid homelessness since calendar year 2014.
• An additional $53 million in 2022 will continue to support the Fair Fares program, which began in January of calendar year 2019. Fair Fares provides half-fare transit benefits to New York City residents at or below 100% of the federal poverty level who are not eligible for other transit subsidies or benefits. While transit ridership declined as a result of the COVID-19 pandemic, HRA continued to process applications remotely throughout 2021.
• An additional $48 million in 2022 for the HIV/AIDS Services Administration (HASA) to provide emergency housing placements in supportive transitional facilities and single room occupancy (SRO) units for homeless clients.
• An additional $32 million in 2022 to deliver fresh produce and shelf-stable goods to pantries and community-based organizations.

Analysis of Agency Budgets Fiscal Year 2022
111
• An additional $22 million in 2022 and the baseline for the Office of Civil Justice to provide access to counsel for all tenants facing eviction in Housing Court, making the City of New York the first in the United States to do so. With a $166 million total budget, the Office of Civil Justice will enable thousands of New Yorkers to stay in their homes.
• An additional $11 million in 2022 to provide support services for formerly homeless New Yorkers residing at more than 750 newly permanent affordable housing units.
• An additional $5 million in 2022 to support formerly homeless New Yorkers residing in permanent housing supported by the Master Lease program.

Analysis of Agency Budgets Fiscal Year 2022
112
2021 20222020
Actual2021
ForecastPreliminary
BudgetExecutive
Budget Forecast Preliminary
BudgetExpenditures
Salary and Wages ……… $833,063 $855,623 $874,556 $876,809 $21,186 $2,253Fringe Benefits ………… 649 913 913 913 — — Medical Assistance ……… 6,286,286 6,140,021 5,914,753 6,418,253 278,232 503,500 Public Assistance ……… 1,505,824 1,604,337 1,650,650 1,650,650 46,313 — Other OTPS …………… 1,930,124 1,995,938 1,649,697 2,070,840 74,902 421,143 Total …………………… $10,555,946 $10,596,832 $10,090,569 $11,017,465 $420,633 $926,896
FundingCity ……………………… $8,431,217 $7,879,637 $7,844,629 $8,463,442 $583,805 $618,813Other Categorical Grants — 1,722 — — (1,722) — IFA ……………………… — — — — — — State …………………… 620,085 762,952 752,779 779,115 16,163 26,336 Federal CD ……………… 1 50,407 — — (50,407) — Federal Other …………… 1,491,649 1,891,671 1,483,094 1,764,841 (126,830) 281,747 Intra-City Other ………… 12,994 10,443 10,067 10,067 (376) — Total …………………… $10,555,946 $10,596,832 $10,090,569 $11,017,465 $420,633 $926,896
Additional Costs Centrally FundedPersonal Services (PS) Fringe Benefits ………… $299,549 $362,038 $346,702 $427,886 $65,848 $81,184 Pensions ……………… 155,326 164,078 173,645 173,645 9,567 — Other Than Personal Service (OTPS) Debt Service …………… 81,467 72,534 84,237 84,000 11,466 (237) Total Additional Costs $536,342 $598,650 $604,584 $685,531 $86,881 $80,947
FundingCity ……………………… 366,019 376,402 452,310 446,312 69,910 (5,998) Non-City ………………… 170,323 222,248 152,274 239,219 16,971 86,945
Full Agency Costs (including Central Accounts)Salary and Wages ……… $833,063 $855,623 $874,556 $876,809 $21,186 $2,253Fringe Benefits ………… 300,198 362,951 347,615 428,799 65,848 81,184 Pensions ………………… 155,326 164,078 173,645 173,645 9,567 — Total PS ……………… $1,288,587 $1,382,652 $1,395,816 $1,479,253 $96,601 $83,437
Medical Assistance ……… $6,286,286 $6,140,021 $5,914,753 $6,418,253 $278,232 $503,500Public Assistance ……… 1,505,824 1,604,337 1,650,650 1,650,650 46,313 — Other OTPS …………… 1,930,124 1,995,938 1,649,697 2,070,840 74,902 421,143 Debt Service …………… 81,467 72,534 84,237 84,000 11,466 (237) Total OTPS …………… $9,803,701 $9,812,830 $9,299,337 $10,223,743 $410,913 $924,406
Total Agency Costs …… $11,092,288 $11,195,482 $10,695,153 $11,702,996 $507,514 $1,007,843Less Intra-City ………… $12,994 $10,443 $10,067 $10,067 ($376) $0Net Agency Cost ……… $11,079,294 $11,185,039 $10,685,086 $11,692,929 $507,890 $1,007,843
FundingCity ……………………… 8,797,236 8,256,039 8,296,939 8,909,754 653,715 612,815 Non-City ………………… 2,282,058 2,929,000 2,388,147 2,783,175 (145,825) 395,028
Personnel (includes FTEs at fiscal year-end)City ……………………… 9,661 9,381 10,192 10,205 824 13 Non-City ………………… 2,859 3,408 3,408 3,421 13 13 Total …………………… 12,520 12,789 13,600 13,626 837 26
Summary of Agency Financial Data The following table compares 2022 Executive Budget with the 2022 Preliminary Budget, the 2021 forecast and actual expenditures for 2020, including fringe benefits, pensions, and debt service.
2022Increase/(Decrease)($ in 000's)
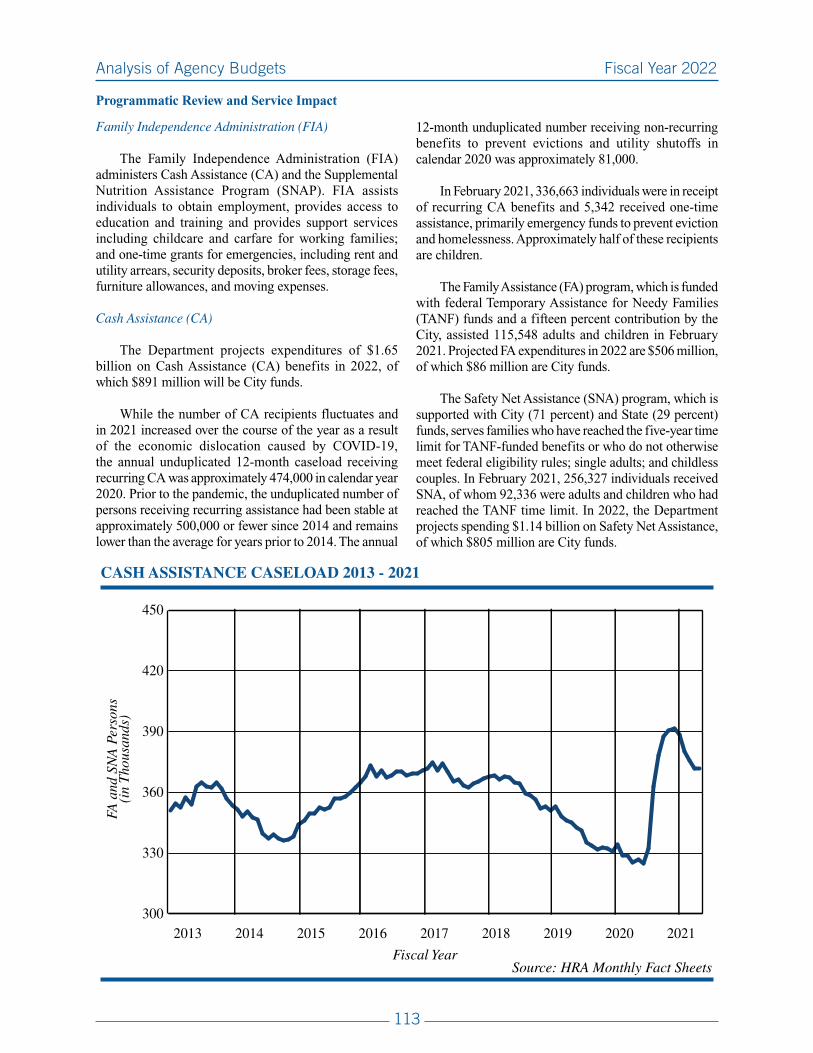
Analysis of Agency Budgets Fiscal Year 2022
113
Programmatic Review and Service Impact
Family Independence Administration (FIA)
The Family Independence Administration (FIA) administers Cash Assistance (CA) and the Supplemental Nutrition Assistance Program (SNAP). FIA assists individuals to obtain employment, provides access to education and training and provides support services including childcare and carfare for working families; and one-time grants for emergencies, including rent and utility arrears, security deposits, broker fees, storage fees, furniture allowances, and moving expenses.
Cash Assistance (CA)
The Department projects expenditures of $1.65 billion on Cash Assistance (CA) benefits in 2022, of which $891 million will be City funds.
While the number of CA recipients fluctuates and in 2021 increased over the course of the year as a result of the economic dislocation caused by COVID-19, the annual unduplicated 12-month caseload receiving recurring CA was approximately 474,000 in calendar year 2020. Prior to the pandemic, the unduplicated number of persons receiving recurring assistance had been stable at approximately 500,000 or fewer since 2014 and remains lower than the average for years prior to 2014. The annual
12-month unduplicated number receiving non-recurring benefits to prevent evictions and utility shutoffs in calendar 2020 was approximately 81,000.
In February 2021, 336,663 individuals were in receipt of recurring CA benefits and 5,342 received one-time assistance, primarily emergency funds to prevent eviction and homelessness. Approximately half of these recipients are children.
The Family Assistance (FA) program, which is funded with federal Temporary Assistance for Needy Families (TANF) funds and a fifteen percent contribution by the City, assisted 115,548 adults and children in February 2021. Projected FA expenditures in 2022 are $506 million, of which $86 million are City funds.
The Safety Net Assistance (SNA) program, which is supported with City (71 percent) and State (29 percent) funds, serves families who have reached the five-year time limit for TANF-funded benefits or who do not otherwise meet federal eligibility rules; single adults; and childless couples. In February 2021, 256,327 individuals received SNA, of whom 92,336 were adults and children who had reached the TANF time limit. In 2022, the Department projects spending $1.14 billion on Safety Net Assistance, of which $805 million are City funds.
CASH ASSISTANCE CASELOAD 2013 - 2021
Fiscal Year
300
330
360
390
420
450
202120202019201820172016201520142013
FA a
nd S
NA
Per
sons
(in
Tho
usan
ds)
Source: HRA Monthly Fact Sheets

Analysis of Agency Budgets Fiscal Year 2022
114
Supplemental Nutrition Assistance Program (SNAP)
The Supplemental Nutrition Assistance Program (SNAP), formerly known as food stamps, is a federally-funded benefit intended to supplement food costs for low-income families and individuals. The Department administers the SNAP program on behalf of New York State. The City is responsible for 50 percent of the administrative cost of the program, with the federal government paying the other half. In calendar 2020, approximately $3.4 billion in SNAP funding provided benefits to an average of 1.6 million individuals per month, including more than 984,000 children.
To ensure that all eligible New Yorkers are able to access these benefits, the Department’s on-line portal, ACCESSHRA (AHRA) and on-demand call system
allows clients to apply and recertify for SNAP in a more efficient and accessible means without requiring them to go into an office. As of March 2021, 93% of applications are made on-line, a trend that accelerated to this historic level during the COVID pandemic. HRA’s on-line services allowed the agency to safely and expeditiously offer these critical benefits to New Yorkers during a time of unparalleled emergency. In addition, the Department continues to enhance its SNAP outreach activities through collaboration with community-based organizations and other City agencies, such as the New York City Housing Authority (NYCHA), to target groups who are likely eligible to receive SNAP benefits but may not be currently accessing them.
AVERAGE NUMBER OF FOOD STAMP RECIPIENTS 2013 - 2021
0
500
1,000
1,500
2,000
2021*20202019201820172016201520142013Fiscal Year
* Year to date through February 2021
Rec
ipie
nts
(in
Tho
usan
ds)
Non-Cash Assistance
Cash Assistance
Source: HRA Monthly Fact Sheets & OTDA Monthly Caseload Statistics – SNAP Table

Analysis of Agency Budgets Fiscal Year 2022
115
Client Benefits Re-Engineering
The Department has redesigned its business processes and has implemented advanced technology solutions through its Client Benefits Re-engineering initiative, which allows HRA to manage staff workload more efficiently while improving the client experience. In addition to SNAP on-line applications and recertification, during the pandemic as a result of a waiver from the State, clients can also apply for CA benefits on-line. During the COVID pandemic HRA conducted CA eligibility interviews over the phone and used the on-line AHRA portal and the HRA mobile document upload app to allow clients to avoid in-person office visits.
Employment Services
FIA offers a wide array of employment programs and services to help families and individuals improve their economic prospects. Services include basic education, training, job search, placement, and retention services. FIA also provides targeted services for those with barriers to employment. The Department’s employment contracts include CareerCompass, which focuses on assessing and matching clients aged 25 and over with employment, sector-based training, adult literacy or other programming to lead to long-term employment; CareerAdvance, which focuses on providing expert sector-based training and employment in target industries; and YouthPathways, which provides assessment, training, education and job placement services to clients ages 18–24, with a particular focus on the needs and potential of young people.
During 2021, employment services have been offered on a volutntary and/or virtual basis to HRA clients, under a New York State waiver of employment services requirements during the COVID pandemic.
Homelessness Prevention and Rehousing Services
The Homeless Prevention Administration (HPA) administers and coordinates homelessness prevention, housing placement and rental assistance initiatives for HRA and DHS. HPA works to prevent the entry of families and individuals into shelter though the provision of diversion services, including short-term financial supports, across the City. In addition, HPA conducts targeted outreach to families and individuals identified by the Housing Court as potentially needing legal assistance.
HPA manages the Homebase homelessness prevention services contracts, which offer community-based aftercare and other services in addition to homeless prevention services. Enhanced prevention efforts and a new “prevention first” model are intended to help families and individuals avoid the trauma of homelessness.
With the implementation by HRA’s Office of Civil Justice of the City’s right-to-counsel law, all tenants facing eviction in New York City Housing Court will be provided with free legal counsel. In 2022, the HRA tenant legal services budget will increase to $166 million. Legal services have proven effective at reducing unlawful evictions and preventing displacement. Since the beginning of the unprecedented expansion of tenant legal assistance in 2014, evictions by City Marshals have dropped by more than 40 percent Citywide, enabling thousands of New Yorkers to stay in their homes.
This prevention first strategy streamlines and focuses already successful initiatives recognizing the many benefits of keeping New Yorkers stably housed and in their communities. These proven models represent a comprehensive set of tools aimed at achieving better outcomes for those who are most at risk of eviction and homelessness in New York City.
HPA also manages HRA’s rental assistance programs, targeted to homeless families and individuals residing in DHS shelters and HRA-run domestic violence facilities and to prevent shelter entry. In 2022, HRA’s rental assistance programs include the newly streamlined City Family Homeless Eviction Prevention Supplement Program (CityFHEPS) and the State and City funded FHEPS A and FHEPS B programs. In addition, HRA operates specialized Master Lease contracts and provides access to and funding for supportive housing. Through these programs, HRA helps families with children and adults without children, including working people, survivors of domestic violence and seniors, avoid entry into or move out of shelter. From July 2014 through December 2020, more than 160,000 people in over 63,500 households averted entry into or have exited shelter through one of these programs or through Section 8 and NYCHA. HPA also assists HRA domestic violence shelter providers and DHS and its network of shelter providers to facilitate moves from shelter to permanent housing, including making client eligibility determinations, matching clients with appropriate housing and interfacing with landlords and management companies that provide apartments to households eligible for rental assistance.

Analysis of Agency Budgets Fiscal Year 2022
116
Office of Child Support Services (OCSS)
The Office of Child Support Services (OCSS) puts children first by helping both parents provide for the economic and social well-being of their children. OCSS provides a range of services including locating noncustodial parents, establishing paternity, establishing and modifying child support and medical orders, and collecting and distributing child support payments. Custodial parents receiving Cash Assistance are required to comply with OCSS pursuant to federal and New York State statutes. All other custodial parents may apply for OCSS services on a voluntary basis. In fiscal 2020, there were approximately 248,000 cases with support orders, including approximately 28,000 Cash Assistance (CA) cases and 221,000 non-Cash Assistance (NCA) cases. Child support collections in calendar year 2020 totaled $881 million.
Medical Assistance Program (MAP)
The Medicaid public health insurance program provides access to a wide range of services including primary care, hospital inpatient, emergency room, physician, pharmacy, clinic, nursing home, personal care, dental, rehabilitation, transportation, vision care, laboratory services and x-rays. Almost 1.6 million New York City residents received Medicaid through HRA as of February 2021, with the Medical Assistance Program (MAP) responsible for more than 837,000 Medicaid-Only (non-CA) enrollees. Another approximately 2.3 million New Yorkers were enrolled in Medicaid through the New York State Health Exchange. With the development of the Exchange under the Affordable Care Act (ACA), most non-CA and non-SSI Medicaid eligible New Yorkers apply through the Exchange, resulting in a decline in the HRA-administered Medicaid caseload of 48 percent since December 2013.
HRA also provides Certified Application Counselor (CAC) services in HRA locations to assist individuals with applications for Medicaid facilitated through the Health Exchange.
Home Care Services Program (HCSP)
The Department’s Home Care Services Program (HCSP) assists individuals who are frail, elderly, and/or have disabilities to remain safely in their homes with non-institutional alternatives to nursing home care. In fiscal 2021 through March, HCSP delivered personal care services to an average of 5,500 personal care cases and provided Medicaid financial eligibility
review to approximately 216,000 participants in the State’s Managed Long Term Care Program (MLTC), a program that also transitioned to NYS as part of the ACA changes.
HCSP reviews and authorizes service plans for participants in the Long Term Home Health Care Program (LTHHCP), as well as for children in the Care-at-Home Waiver Program. HCSP personal care services are also provided to participants in special federal waiver programs, including Traumatic Brain Injury, Home and Community-Based Services, and the Nursing Home Transition and Diversion waivers and Office of Mental Retardation and Developmental Delays (OMRDD) participants.
Customized Assistance Services (CAS)
Customized Assistance Services (CAS) provides clinically-oriented services in the areas of health, mental health, substance use treatment and rehabilitation for clients served by the Department’s programs. CAS programs provide comprehensive and individualized services to help individuals with medical or mental health conditions achieve their maximum degree of self-reliance.
The Wellness, Comprehensive Assessment, Rehabilitation and Employment (WeCARE) program works with Cash Assistance recipients who have medical or mental health conditions that pose barriers to employment, providing integrated services that include assessment, diagnosis, comprehensive service and wellness planning, linkages to treatment, case management, disability benefits assistance, and vocational rehabilitation, training and education, and job placement through two performance-based contracts. In Fiscal 2020, 2,612 WeCARE clients were approved for federal disability benefits. Since March of 2020, in accordance with waivers obtained from the State, WeCARE activities have been voluntary and conducted virtually to protect client and staff safety during the COVID pandemic.
CAS provides assessments, referrals and monitoring of substance use treatment and case management services to CA clients and oversees clients enrolled in treatment, many of whom are served through Comprehensive Service Model contracts providing services to better support retention in substance use treatment and to assist clients with intensive support needs. CAS also oversees the review of applications for supportive housing units across the City. CAS

Analysis of Agency Budgets Fiscal Year 2022
117
oversees the Visiting Psychiatric Service Program (VPS), providing home-based psychiatric assessments and crisis intervention services to clients served by HRA and other agencies; the Office of Reasonable Accommodations (ORA), which reviews and makes determinations on Reasonable Accommodation Requests (RAR) submitted by clients with disabilities; and the Disability Service Program, which files federal disability benefit applications, pursues administrative appeals on denied claims, and performs eligibility determinations for Medicaid Aged, Blind and Disabled clients.
HIV/AIDS Services Administration (HASA)
The HIV/AIDS Services Administration (HASA) provides comprehensive services to individuals and families with HIV and AIDS. HASA clients receive case management, assessments and referrals, housing and homemaking services. In 2017, medical eligibility for the HASA program expanded to permit all financially-eligible New York City residents with HIV to voluntarily seek and obtain HASA services. As of February 2021, HASA served over 38,000 individuals in 37,000 households. Over 27,000 HASA households receive ongoing rental assistance to facilitate and maintain housing stability, typically in private market apartments. HASA also provides emergency housing placements in supportive transitional facilities and single room occupancy (SRO) units for clients experiencing homelessness. Non-emergency supportive housing is provided in congregate facilities and scattered site apartments. These programs are operated by community-based organizations that provide case management and support services. In February 2021, HASA supported over 3,200 units in its emergency housing portfolio and over 4,800 units in its non-emergency supportive housing program.
Adult Protective Services (APS)
The Department’s Adult Protective Services (APS) program assists adults with mental and/or physical disabilities who are unable to care for or protect themselves from abuse, neglect, or exploitation, and who have no one willing and able to responsibly assist them. Services include referrals for psychiatric and medical examinations, assistance in obtaining and recertifying for benefits and entitlements, eviction prevention and financial management. APS also petitions the State Supreme Court for community guardians to manage financial and domestic issues for clients who lack capacity to manage their own affairs.
In Fiscal Year 2020, APS received 24,800 referrals: 47 percent of referrals involved eviction;17 percent included allegations of abuse;17 percent included allegations of neglect; and 18 percent included allegations of financial exploitation. During this period, APS assessed 4,485 individuals and maintained an average monthly protective services caseload of 6,630. The average monthly Community Guardian caseload was 2,100.
Office of Domestic Violence (ODV)
The Office of Domestic Violence Services (ODV) provides emergency shelter and social services to survivors of domestic violence. ODV administers State-licensed emergency domestic violence shelters, as well as transitional Tier II shelters. Emergency shelters have a total capacity of 2,525 beds for survivors of domestic violence and their children. ODV’s nine Tier II shelters include 333 family units for clients who require additional services before transitioning back to the community.
Approximately 800 families are served by the domestic violence shelters every day. Shelters provide safe environments and a range of additional domestic violence support services including counseling, advocacy and referrals. In addition, nine community-based non-residential programs provide information, counseling, advocacy, legal services, and referrals to other supportive services to help domestic violence survivors navigate the challenges of living in their own communities. These programs maintain an average monthly caseload of approximately 1,900 individuals. The Teen Relationship Abuse Prevention Program (RAPP) provides classes and counseling to teenagers in public schools across the City to help stop relationship violence before it occurs.
Home Energy Assistance Program (HEAP) and Other Utility Assistance Programs
The Home Energy Assistance Program (HEAP) is a federally-funded program that assists low-income homeowners and renters to pay energy costs and heating equipment repair bills. HEAP serves over 700,000 households annually during the heating season, which runs from November to March of each year. Most benefits are provided to CA, SNAP, and SSI recipients who receive automatic payments. HEAP provides emergency benefits for assistance with gas and other utility bills and shut-offs, helps obtain service extensions, and pays for emergency oil deliveries and

Analysis of Agency Budgets Fiscal Year 2022
118
furnace repairs and replacements to other income-eligible households through an application process.
Additional programs include Heat-Line, which offers HEAP applications and other public benefits to the homebound population; the Utility Assistance Program, which offers similar benefits to those identified as eligible through the utility companies, and the Department of Environmental Conservation’s Safety Net program which assists low-income home owners with their water bills.
Emergency Food and Nutrition Assistance Program
The Emergency Food and Nutrition Assistance Program (EFNAP) administers the Emergency Food Assistance Program (EFAP) which provides food, funding and technical assistance to approximately
600 food pantries and soup kitchens. EFNAP also provides SNAP materials, education, trainings, pre-screenings and application assistance to the general public, other government agencies and community-based organizations throughout the five boroughs of New York City.
Crisis and Disaster Unit
The Crisis and Disaster Unit responds to City-wide disasters and emergencies. The unit is responsible for the Disaster Task Force consisting of 3,500 Department-trained volunteers who respond under the unit’s direction to provide services during emergencies and disasters. The unit helps to coordinate the Agency’s response to emergencies and works with the Office of Emergency Management (OEM) to implement the citywide human services response to emergencies.
Capital Review
The Department’s Ten-Year Capital Strategy for 2022-2031 totals $431.5 million, of which $338.5 million are City funds. Of this $147.2 million is included for technology to streamline Department operations, including key investments related to Client Services Re-engineering, the Work Tracking System, “One Number,” an upgraded interactive voice response system, and CurRent NYC, a new portal for landlord and client rent services and payment management. Additionally, HRA is making capital investments of $255.3 million for facilities maintenance, equipment and improvements, and $2.8 million is provided for vehicles.
Capital Commitments
($ in 000’s)_______________________________________________________________________________________________________________________________________________________________________________________________________________
2020 2021 2022 2023 2024 2025 Actual Plan Plan Plan Plan Plan ________________________ _______________________ ________________________ _______________________ ________________________ _______________________
City All City All City All City All City All City All Funds Funds Funds Funds Funds Funds Funds Funds Funds Funds Funds Funds_______________________________________________________________________________________________________________________________________________________________________________________________________________
Data Processing ..................... $20,810 $22,451 $42,650 $52,930 $29,659 $48,024 $15,339 $28,050 $5,770 $11,290 $643 $1,312 Telecommunications ............. 1,180 2,099 1,621 2,970 1,713 3,373 1,905 3,755 683 1,394 2,967 6,055 Automotive ............................ 89 128 948 949 294 294 190 388 559 788 192 392 Buildings ............................... (1,525) (1,737) 1,422 712 141,471 142,954 12,418 16,292 21,519 26,954 24,764 31,916 Equipment ............................. (24) 82 80 80 — — — — — - — — ___________ ___________ ___________ ___________ ___________ ___________ ___________ ___________ ___________ ___________ ___________ ___________
Total ...................................... $ $20,530 $23,023 $46,721 $57,641 $173,137 $194,645 $29,852 $48,485 $28,531 $40,426 $28,566 $39,675 ========= ========= ========= ========= ========= ========= ========= ========= ========= ========= ========= =========
__________________________________________________________________________________________________________________________________________________________________________________________

Analysis of Agency Budgets Fiscal Year 2022
119
Highlights of the Ten-Year Capital Strategy
• Continued development of the Fair Fares system to add functionality to integrate the program with the NYC Transit OMNY digital fare system ($4.1 million).
• Expansion of the existing on-demand telephone scheduling system for Cash Assistance recertification and re-application interviews ($7 million).
• Development of the Work Tracking System, a workload management system used by supervisors, managers and staff to automate tasks and distribute case processing across the SNAP program ($9.9 million).
• Reconstruction of the community center at 444 Thomas S Boyland Street ($128.7 million).
• Continued development of CurRent NYC a public portal for landlords to streamline the processing of rent payments for Cash Assistance and Rental Assistance clients ($7 million).
• Upgrade and development of a new Integrated Voice Response System – known as “One Number,” that will include intuitive routing of client inquiries and enhance the ability of clients and the public to access information about benefits and services ($3.4 million).
• Renovation and outfitting of several new and existing locations to modernize and consolidate services, including the accommodation of client-centered technology, such as self-service check-in and PC banks ($10.3 million).

Analysis of Agency Budgets Fiscal Year 2022
120
DEPARTMENTS OF SOCIAL AND HOMELESS SERVICESDEPARTMENT OF HOMELESS SERVICES
The Department of Homeless Services (DHS) works to prevent homelessness whenever possible, provides safe and service-rich emergency shelter when needed, assists individuals and families transition to permanent housing, and provides outreach, drop-in and housing placement services for street homeless individuals.
In 2016, a comprehensive model to more effectively and efficiently administer homeless services in New York City was announced, subsequent to a 90-day review of these services across City agencies. As an outcome of the review, in 2017, an integrated management structure was created in the Department of Social Services (DSS) with DHS and the Human Resources Administration (HRA) reporting to a single Commissioner for Social Services.
In February 2017, the City released “Turning the Tide on Homelessness”, which outlined a plan to address homelessness over the succeeding five years, providing a blueprint for a borough-based approach to address the challenge of homelessness. The plan includes an increased focus on homelessness prevention; on improving shelter conditions, services and security; on addressing street homelessness; and on rehousing; and shrinks the footprint of DHS by 45 percent by closing 360 cluster sites and commercial hotel locations and replacing them with a smaller number of 90 new effective, borough-based shelters. As of March 2021, DHS has vacated more than 260 and has announced 89 high-quality borough-based shelters, of which 46 are already operational. In December 2019, DHS released “The Journey Home,” an action plan to end long-term street homelessness through a combination of efforts including enhanced outreach, new permanent housing and safe haven development and cross-agency collaboration.
The Department will continue to work with HRA and other City partners to help families and adults without children experiencing homelessness transition into permanent housing in 2022. Since Fiscal 2015, over 160,000 people in more than 63,500 households have exited DHS and HRA shelter or avoided entering shelter through rental assistance programs funded by the City and with federally funded HOME TBRA, the State Family Housing Eviction Prevention Supplement (FHEPS), Section 8 and NYCHA placements. Beginning in 2014, DHS and HRA/DSS developed a range of rental assistance programs, which were consolidated into a single streamlined program – CityFHEPS – in October 2018.
Financial Review
The Department’s 2022 Executive Budget provides for operating expenses of $2.16 billion, of which $1.34 billion are City funds. A capital budget of $52.9 million is also provided in 2022.
Expense Budget Highlights
Program Enhancements
• An additional $4.6 million in Fiscal Year 2021, $15.2 million in Fiscal Year 2022 and $9.4 million in Fiscal Year 2023 and beyond will support expansion and enhancement of street solutions programming, including street outreach to help bring people experiencing homelessness off the streets and out of the subways.
• $85 million in Fiscal Year 2021 to backfill Emergency Assistance for Families revenue due to New York State changes in eligibility requirements.
• An additional $76.9 million in Fiscal Year 2022 for Journey Home to combat street homelessness, provides additional subway outreach workers to assist individuals experiencing homelessness, staffing for a joint command center, street mobile medical staff and additional Safe Haven beds.

Analysis of Agency Budgets Fiscal Year 2022
121
2021 20222020
Actual2021
ForecastPreliminary
BudgetExecutive
Budget Forecast Preliminary
BudgetExpenditures
Salary and Wages ……….. $161,831 $154,049 $153,522 $163,022 $8,973 $9,500Fringe Benefits …………… 1,778 3,066 1,566 1,566 (1,500) — OTPS ……………...……… 2,205,578 2,680,002 1,897,460 1,991,391 (688,611) 93,931 Total ……………...……… $2,369,187 $2,837,117 $2,052,548 $2,155,979 ($681,138) $103,431
FundingCity ……………...………… $1,569,837 $1,214,736 $1,247,827 $1,336,287 $121,551 $88,460Other Categorical Grants … 3,263 — — — — — IFA ……………...………… — — — — — — State ……………...……… 172,759 179,309 179,272 175,969 (3,340) (3,303) Federal CD ……………...… 4,688 9,838 4,337 4,337 (5,501) — Federal Other ……………. 617,741 1,432,383 620,261 638,535 (793,848) 18,274 Intra-City Other …………… 899 851 851 851 — — Total ……………...……… $2,369,187 $2,837,117 $2,052,548 $2,155,979 ($681,138) $103,431
Additional Costs Centrally FundedPersonal Services (PS) Fringe Benefits ………… $49,842 $57,753 $55,612 $67,763 $10,010 $12,151 Pensions ……………...… 26,500 28,983 30,800 30,800 1,817 — Other Than Personal Service (OTPS) Debt Service ……………. — — — — — — Total Additional Costs $76,342 $86,736 $86,412 $98,563 $11,827 $12,151
FundingCity ……………...………… 71,366 72,247 80,756 79,784 7,537 (972) Non-City ……………...…… 4,976 14,489 5,656 18,779 4,290 13,123
Full Agency Costs (including Central Accounts)Salary and Wages ………… $161,831 $154,049 $153,522 $163,022 $8,973 $9,500Fringe Benefits …………… 51,620 60,819 57,178 69,329 8,510 12,151 Pensions ……………...…… 26,500 28,983 30,800 30,800 1,817 — Total PS ……………...…… $239,951 $243,851 $241,500 $263,151 $19,300 $21,651
OTPS ……………...……… $2,205,578 $2,680,002 $1,897,460 $1,991,391 ($688,611) $93,931Debt Service …………….. — — — — — — Total OTPS $2,205,578 $2,680,002 $1,897,460 $1,991,391 ($688,611) $93,931
Total Agency Costs ……… $2,445,529 $2,923,853 $2,138,960 $2,254,542 ($669,311) $115,582Less Intra-City …………… $899 $851 $851 $851 $— $—Net Agency Cost ………… $2,444,630 $2,923,002 $2,138,109 $2,253,691 ($669,311) $115,582
FundingCity ……………...………… 1,641,203 1,286,983 1,328,583 1,416,071 129,088 87,488 Non-City ……………...…… 803,427 1,636,019 809,526 837,620 (798,399) 28,094
Personnel (includes FTEs at fiscal year-end)City ……………...………… 2,084 2,045 2,102 2,103 58 1 Non-City ……………...…… 35 58 3 56 (2) 53 Total ……………...……… 2,119 2,103 2,105 2,159 56 54
Summary of Agency Financial Data The following table compares 2022 Executive Budget with the 2022 Preliminary Budget, the 2021 forecast and actual expenditures for 2020, including fringe benefits, pensions, and debt service.
2022Increase/(Decrease)($ in 000's)

Analysis of Agency Budgets Fiscal Year 2022
122
The Department provides a variety of directly operated and contracted services for adults experiencing homelessness, including general and specialized transitional shelter, housing assistance and placement into subsidized and supportive housing. DHS, along with not-for-profit providers, operates assessment programs, general shelters, and specialized shelters for single adults. Specialized shelters include those providing mental health, substance use and employment services. The DHS Division of Adult Services also provides shelter to adult couples and families without minor children in contracted and directly operated shelters.
In 2022, the Department will continue to operate programs for adult clients, while observing COVID-related health and safety protocols. DHS provides literacy, job training and programming at both directly operated and contracted shelters and partners with HRA to connect adults in shelter to employment opportunities, including public and private market subsidized employment programs, to help them transition to permanent housing.
DHS single adults and adult families exit or avoid shelter through one of the rental assistance or subsidized housing programs, and in addition have access to supportive housing, which provides permanent housing combined with on-site and community-based services for clients with special needs. The NYC “15/15” plan will develop and fund the operation of 15,000 additional supportive housing units in New York City over 15 years.
Family Services
The Department serves families with children experiencing homelessness through a network of shelters that provide social services, access to child day care and other supports, and rehousing services, designed to maximize family stability and to help them move to permanency in the community.
Eligible families are also required to apply for Cash Assistance (CA) through HRA and, as part of this process, receive access to a full range of employment and education programs to help prepare for and obtain employment. CA eligibility also provides access to many rental assistance programs that allow families to move into permanent housing. Through its network
of providers, DHS also helps families access SNAP benefits, child support, tax credits and work supports, including day care and Universal Pre-Kindergarten programs.
In 2022, DHS, partnering with other City agencies including the Department of Education, the Administration for Children’s Services (ACS) and the Department of Health and Mental Hygiene (DOHMH), will continue and expand its focus on child well-being. The Department monitors school attendance, promotes infant safe sleeping, and collaborates with ACS to coordinate services to families with child welfare involvement and with DOHMH on programs for maternal and infant heath.
Street Solutions
The Department is committed to providing robust programming and increasing permanency options for individuals on the street. DHS provides an array of services to meet this goal, including street outreach programs, safe havens, drop-in centers and stabilization beds.
In 2016, the Department launched HOME-STAT (Homeless Outreach and Mobile Engagement Street Action Team), a street homeless effort that partners existing homeless response and prevention programs with a series of new innovations designed to better identify, engage and transition New Yorkers experiencing street homelessness to appropriate services and permanent housing. Since the launch of HOME-STAT, the City has helped more than 4,000 people come in from the streets into transitional programs or permanent housing and provided assistance so that they have remained off the streets. Before and during the COVID-19 pandemic, 24/7 outreach efforts have continued on New York City street, subways and terminal destinations. The End of Line (EOL) initiative during the late night subway shutdowns contributed to a large increase in referrals to placements, including new pandemic-related stabilization beds, throughout Fiscal Year 2021.
The HOME-STAT initiative created new street canvassing teams and enhanced tools for outreach teams to bring people in from the streets, including tripling the number of outreach staff, increased capacity in
Programmatic Review and Service Impact
Adult Services

Analysis of Agency Budgets Fiscal Year 2022
123
safe havens and drop in centers, and implemented case conferencing across multiple City agencies in support of helping individuals experiencing street homelessness. The Department’s online HOME-STAT dashboards offer consistent and transparent data tracking of the City’s efforts in reducing street homelessness and improving lives for New Yorkers.
The Department’s safe havens, which are low-threshold transitional residential programs; drop-in
centers; and short-term stabilization beds, comprise a system of specialized programs that provide additional services to clients experiencing street homelessness and help them transition from the streets to more permanent settings. As of March 2021 there were more than 3,000 safe haven and stabilization beds available to clients experiencing street homelessness, a significant increase from 600 beds available in 2014.
Capital Review
The Department’s Ten Year Capital Plan for 2022-2031 totals $668.3 million in City funds. The plan provides $210.3 million for homeless family facilities, $422.2 million for single adult facilities, and $35.8 million for technology projects and equipment purchases. The table below reflects capital commitments by program area over 2021-2025.
Capital Commitments
($ in 000’s)_______________________________________________________________________________________________________________________________________________________________________________________________________________
2020 2021 2022 2023 2024 2025 Actual Plan Plan Plan Plan Plan ________________________ ___________ ____________ ________________________ _______________________ ________________________ _______________________
City All City All City All City All City All City All Funds Funds Funds Funds Funds Funds Funds Funds Funds Funds Funds Funds_______________________________________________________________________________________________________________________________________________________________________________________________________________
Homeless Family Facilities ... $271 $271 $6,337 $6,337 $11,931 $11,931 $20,595 $20,595 $14,870 $14,870 $26,996 $26,996 Single Adult Facilities ........... 5,159 5,159 21,216 21,216 35,892 37,623 62,108 62,108 55,875 55,875 100,574 100,574 Information Technology and Equipment .................... 6,019 6,019 24,242 24,242 5,038 5,038 2,725 2,725 3,397 3,397 4,632 4,632 ___________ ___________ ___________ ___________ ___________ ___________ ___________ ___________ ___________ ___________ ___________ ___________
Total ...................................... $11,449 $11,449 $51,795 $51,795 $52,861 $54,592 $85,428 $85,428 $74,142 $74,142 $132,202 $132,202 ========= ========= ========= ========= ========= ========= ========= ========= ========= ========= ========= =========
__________________________________________________________________________________________________________________________________________________________________________________________
Highlights of the Ten-Year Capital Strategy
• Significant investment of $240 million for critical upgrades at family and adult shelter facilities, including funding allocated to the renovation and upgrade of shelter sites to increase capacity as part of the “Turning the Tide” commitment.
• Upgrades to critical system improvements include fire safety system upgrades of $57.8 million across all shelter types and electric system improvements of at least $26 million.
• Continued funding for exterior and interior building upgrades at Bellevue Men’s Shelter of $125 million.
• Funding for technology projects including development of integrated applications for shelter compliance, case management, Street Solutions programs and data reporting. These enhancements respond to critical program, policy and legal goals ($36 million).

Analysis of Agency Budgets Fiscal Year 2022
124
ADMINISTRATION FOR CHILDREN’S SERVICES
The Administration for Children’s Services (ACS) provides a broad range of programs that protects and promotes safety and well-being of New York City’s children and families by providing child welfare, juvenile justice, and early care and education services by providing child care vouchers. The Department investigates allegations of child abuse and neglect, supports preventive services to families and children, provides foster care and adoption services for children who cannot safely remain in their homes, and provides custody and care for children who are involved in the juvenile justice system. The Department also administers child care vouchers.
Financial Review
The Department’s 2022 Executive Budget provides for operating expenses of $2.68 billion, $983.7 million of which are City funds. Capital commitments of $484 million are provided for from FY22 through FY31, of which $445 million are City funds.
Expense Budget Highlights
ACS’s 2022 Executive Budget responds to the challenges faced by New York’s most vulnerable youth and families both before and during the pandemic and lays important foundations for the future, including:
Fair Futures: Funds added to ACS’ budget in the amount of $2.7 million in FY22 to continue providing coaches and tutoring for foster care children. Through Fair Futures, thousands of young people in foster care ages 11-21 are receiving coaching, tutoring and/or educational advocacy and support.
Child Care Voucher Expansion: Additional resources in the amount of $1.1 million in FY21, $6.5 million in FY22, and $5.8 million in FY23 and out to support ACS's proposed plan to expand access, improve equity, and ensure parent choice in child care. These resources will support the initial surge and management of ongoing increases in applications as more families become eligible for low-income child care assistance and support new community outreach efforts to ensure families know about the availability of child care and assist with their eligibility or application process.
EarlyLearn Transition – Time in/Time out (TiTo): Additional resources in the amount of $2.8 million in FY21, $5.4 million in FY22, $5.0 million in FY23 and $3.6 million in FY24 and out to implement Time in/Time out, an improved system for tracking child attendance in EarlyLearn.
Residential Foster Care: Additional funding totaling $9.8 million in FY22 and out to support providers and address immediate needs in serving higher risk youth in conjunction with the new foster care RFP and contracts set to begin in FY23.

Analysis of Agency Budgets Fiscal Year 2022
125
2021 20222020
Actual2021
ForecastPreliminary
BudgetExecutive
Budget Forecast Preliminary
BudgetExpenditures
Salary and Wages ………… $552,607 $515,042 $534,370 $536,646 $21,604 $2,276Fringe Benefits …………… 333 61 1 1 (60) — OTPS ……………………… 2,093,421 2,205,431 2,111,867 2,149,499 (55,932) 37,632 Total ……………………… $2,646,361 $2,720,534 $2,646,238 $2,686,146 ($34,388) $39,908
FundingCity ……………………… $948,271 $828,370 $851,771 $983,699 $155,329 $131,928Other Categorical Grants … 140 — — — — — IFA ………………………… — — — — — — State ……………………… 834,211 780,520 719,825 671,832 (108,688) (47,993) Federal CD ………………… — — — — — — Federal Other ……………… 858,922 1,108,264 1,074,299 1,030,272 (77,992) (44,027) Intra-City Other …………… 4,817 3,380 343 343 (3,037) — Total ……………………… $2,646,361 $2,720,534 $2,646,238 $2,686,146 ($34,388) $39,908
Additional Costs Centrally FundedPersonal Services (PS) Fringe Benefits ………… $162,860 $183,823 $175,516 $218,235 $34,412 $42,719 Pensions ………………… 86,247 97,337 104,094 104,094 6,757 — Other Than Personal Service (OTPS) Debt Service …………… — — — — — — Total Additional Costs … $249,107 $281,160 $279,610 $322,329 $41,169 $42,719
FundingCity ……………………… 115,567 116,155 149,226 142,984 26,829 (6,242) Non-City ………………… 133,540 165,005 130,384 179,345 14,340 48,961
Full Agency Costs (including Central Accounts)Salary and Wages ………… $552,607 $515,042 $534,370 $536,646 $21,604 $2,276Fringe Benefits …………… 163,193 183,884 175,517 218,236 34,352 42,719 Pensions …………………… 86,247 97,337 104,094 104,094 6,757 — Total PS ………………… $802,047 $796,263 $813,981 $858,976 $62,713 $44,995
OTPS …………………… $2,093,421 $2,205,431 $2,111,867 $2,149,499 ($55,932) $37,632Debt Service ……………… — — — — — — Total OTPS ……………… $2,093,421 $2,205,431 $2,111,867 $2,149,499 ($55,932) $37,632
Total Agency Costs ……… $2,895,468 $3,001,694 $2,925,848 $3,008,475 $6,781 $82,627Less Intra-City …………… $4,817 $3,380 $343 $343 ($3,037) $—Net Agency Cost ………… $2,890,651 $2,998,314 $2,925,505 $3,008,132 $9,818 $82,627
FundingCity ……………………… 1,063,838 944,525 1,000,997 1,126,683 182,158 125,686 Non-City ………………… 1,826,813 2,053,789 1,924,508 1,881,449 (172,340) (43,059)
Personnel (includes FTEs at fiscal year-end)City ……………………… 6,994 6,841 7,121 7,173 332 52 Non-City ………………… 65 167 166 167 — 1 Total ……………………… 7,059 7,008 7,287 7,340 332 53
Summary of Agency Financial Data The following table compares 2022 Executive Budget with the 2022 Preliminary Budget, the 2021 forecast and actual expenditures for 2020, including fringe benefits, pensions, and debt service.
2022Increase/(Decrease)($ in 000's)

Analysis of Agency Budgets Fiscal Year 2022
126
Division of Child Protection (DCP)DCP responds to allegations of child abuse and
neglect and makes determinations about the safety of and risk to children in reports transmitted by the New York Statewide Central Register to ACS. The DCP’s Family Services Unit (FSU) monitors children and families in court-ordered supervision cases until a judge determines that a child may remain safely in their home without the intervention of ACS, or is in need of placement in foster care. DCP also conducts Family Meetings, which are an informal meeting scheduled to engage the family and address risk issues and/or develop or modify a service plan. DCP also organizes Child Safety Conferences, which are scheduled when court intervention is being considered in order to address existing safety issues. These are facilitated by the Child and Family Specialists (CFS). Family supports, service providers and resources are encouraged to attend both Family Meetings and Child Safety Conferences.
DCP responds to reports of alleged abuse or neglect via two different approaches: Most frequently, DCP responds with an investigation conducted by Child Protective Specialists in DCP’s protective/diagnostic units; in some lower-risk cases, DCP is able to pursue a non-investigative differential response, known as Collaborative Assessment Response, Engagement and Support (CARES). In 2020, ACS responded to 50,999 reports of abuse and neglect transmitted to ACS from the State Central Register. These resulted in 41,538 investigations and 2,343 CARES cases. (Some investigations result from multiple reports, which are consolidated.)
While the COVID-19 public health crisis resulted in fewer reports of abuse and neglect in 2020, reports could return to pre COVID-19 levels of more than 60,000 reports annually. To enhance the retention of Child Protective Specialists, who are instrumental in carrying out DCP’s mission, ACS launched the CPS Peer Mentor Program in 2020. This initiative enhances staff sustainability and promotes resilience by offering support and coaching to newer CPS, as well as rewarding senior CPS who demonstrate characteristics of emerging leaders.
Preventive Services for Children and Families
ACS provides contracted prevention services which are designed to improve child and family well-being and mitigate the risk of removal of a child to foster care placement, and also to reduce the length of time that children spend in foster care. Prevention services seek to support the physical, psychological, and emotional needs of children and caregivers by working closely with families and their communities. As part of the collective responsibility for keeping children safe, prevention services seek to address underlying factors that may lead to child maltreatment. These may include economic scarcity, trauma, mental health challenges, domestic violence, and substance misuse. These services address a range of needs and may include case management, counseling, and clinical interventions offered primarily in the home and in a way that embraces the rich cultural diversity of New York City families. The prevention services continuum includes a range of models, many of which are research-informed or evidence-based, that serve families in the child welfare and juvenile justice systems.
Providers are required to help families connect to other services in their communities and are encouraged to engage families in achieving their service goals within 12 months in order to increase the availability of programs to all families in need. In CY 2020, with 6,833 new families were enrolled in ACS prevention services.
ACS launched a redesigned prevention services system in July 2020. Hallmarks of this new system include more therapeutic services for high-need families; universal access to all program models regardless of where the family lives; and a stronger emphasis on parent feedback, both in development of the models that we offer and in the day-to-day service delivery on individual cases. Services are free and available citywide—in every community, in all 5 boroughs. In CY 2020, ACS served 17,937 families with 40,089 children in prevention services.
Programmatic Review and Service Impact

Analysis of Agency Budgets Fiscal Year 2022
127
Foster Care
Placements in family foster care, residential settings or specialized care facilities are provided on a temporary basis until children can be reunified with their families. If reunification is not a viable option, children receive services that will lead to adoption or development of independent living skills. The number of children living in out-of-home placements has declined from 3,591 in 2019 to 2,705 in 2020. The foster care census declined from 7,671 in 2020 to 7,666 in 2021.
The Nicholas Scoppetta Children’s Center serves as the foster care pre-placement intake facility for children entering foster care. These children are assessed and provided with necessary medical, mental health and any other required services during their stay at the Children’s Center.
CHILDREN IN FOSTER CARE AND PREVENTIVE SERVICES 2010 - 2021
Fiscal Year*
Chi
ldre
n in
Car
e (i
n T
hous
ands
)
Source: NYC OMB* "2021" data for preventive reflects the FY21 average number of children served through March 31, 2021
0
5
10
15
20
25
30
35
40
2021*20202019201820172016201520142013201220112010
Preventive Services
Foster Care

Analysis of Agency Budgets Fiscal Year 2022
128
RESIDENTIAL CASELOADS 2010 - 2021
Note: Starting in 2012, the residential caseload no longer includes adjudicated juvenile delinquents in congregate settings operated by private not-for-profit agencies.
Fiscal Year
Num
ber
of C
hild
ren
in C
are
Source: NYC OMB
0
1,000
2,000
3,000
4,000
202120202019201820172016201520142013201220112010
Following the end of the federal Title IV-E waiver, ACS has continued implementing the successful Strong Families NYC models and system reforms, which is now supported by federal Family First Transition Act funding, specifically provided to jurisdictions transitioning from waivers. These interventions include low caseloads for foster care workers and the implementation of two evidence-based models, Attachment Biobehavioral Catch-up and Partnering for Success. The Chapin Hall evaluation of Strong Families NYC found that it was successful in reducing length of stay in foster care. During COVID-19, ACS’ Workforce Institute is using virtual platforms to continue to provide training on these models to our foster care agencies’ case planning staff.
Adoption Services and KinGAP
Adoption provides a stable and permanent home for children who cannot return to their birth parents. Since the launch of No Time to Wait initiative in 2017, ACS has worked to improve permanency outcomes for children and youth in foster care through streamlining the administrative processes and providing enhanced technical assistance to agencies to reduce time to
reunification and expedite adoption and kinship guardianship. The large majority of children who are eligible for adoption (i.e., children who are legally freed for adoption and have a permanency goal of adoption) are already placed with the family who will be their adoptive family. In 2021, more than 12,700 children were living in adoptive homes.
ACS' efforts to increase placement with relatives and family friends includes a strong focus on exploring a child’s entire support network and engaging potential resources. Living with kin not only reduces trauma but also creates the possibility of guardianship with kin who receive a subsidy, as a permanency option for children. The Kinship Guardianship Assistance Program (KinGAP) is designed for a foster child to achieve permanency with a relative who had been the child’s foster parent for at least six months. This program provides financial support and, in most cases, medical coverage for the child, beginning with the child’s discharge from foster care to the guardian. The level of ongoing financial support is similar to the maintenance payments received while the child was in foster care.

Analysis of Agency Budgets Fiscal Year 2022
129
During the COVID-19 period, due to significant limitations in access to the Family Courts, ACS has adapted to focus on ways, outside of the normal court process, to move toward more family reunifications from foster care. ACS launched proactive reviews of the cases of more than 3,350 children in foster care with a goal of reunification to determine if these cases could move forward to increased visiting, pre-disposition release, trial discharge or final discharge. In cases that could move forward, ACS’s Division of Family Court Legal Services (FCLS) attorneys worked with the parent’s attorney and children’s attorney where necessary to sign stipulations and submitted these agreements to the court for approval. This process has helped to move reunification cases forward even without the Court holding hearings.
ACS is also asking provider agencies to incorporate proactive reviews into their regular case practice, and is providing ongoing technical assistance to support this crucial permanency work. Attorneys representing parents and children have also provided lists of cases they think are appropriate for resolution, including release of children to the parent or allowing an excluded parent to return to the home through a collaborative approach between ACS divisions and foster care agencies to reach resolutions whenever possible.
The Family Court’s limited operations during the pandemic has had a significant impact on the number of children exiting foster care to adoption, which dropped from 740 in FY 2019 to 404 in FY 2020. Similar to adoption, the number of children exiting foster care to KinGAP dropped from 377 in FY 2019 to 267 children in FY 2020.
Division of Youth and Family Justice
The Division of Youth and Family Justice (DYFJ) provides Specialized Secure Detention (SSD), Secure Detention (SD) and Non-Secure Detention (NSD) services for alleged juvenile delinquents, juvenile offenders and adolescent offenders whose cases are pending in Family or Criminal Court. ACS operates two secure detention facilities and oversees a network of 7 non-secure detention group homes across the City through contracts with private non-profit social service organizations. While in detention, residents receive support services including education, health and mental health care, recreation, and case management.
Under Close to Home, which launched in 2012, DYFJ assumed custody of adjudicated juvenile delinquents found to be in need of out of home placement. DYFJ provides care through a system of non-profit providers located within and just outside of New York City. Providers offer an array of general and specialized juvenile justice residential care programs including intensive clinical services, educational programs, and aftercare re-entry services.
Close to Home was implemented using a phased approach. ACS started with the transfer of youth sentenced by the court to Non-Secure Placement (NSP). In the second phase, which began in 2015, DYFJ assumed legal responsibility for juvenile delinquents placed in Limited-Secure Placement (LSP) settings. Currently, the City has 235 NSP beds and 66 LSP beds. Juvenile Offenders and Adolescent Offenders, those convicted of the most serious crimes, remain in OCFS-operated secure facilities.
With the implementation of New York state’s Raise the Age legislation in October 2018, 16 and 17-year-old youth are no longer detained on Riker’s Island, and if ordered by a court, are now held in ACS facilities where they receive education, age-appropriate therapeutic and recreational services, and health and mental health care. As of October 2019, newly arrested 16 and 17-year-olds are now treated as juveniles, and if they are detained it is either at Horizon Juvenile Center, Crossroads Juvenile Detention Center, or in one of our non-secure detention facilities.
In addition to detention and placement services, DYFJ operates a full continuum of community-based diversion and alternatives services to prevent youth from entering the juvenile justice system or to prevent deeper end system involvement. These services include our Family Assessment Program (FAP) which provides preventive services to families seeking to file PINS petitions in family court and serves over 3,500 families a year; and our Juvenile Justice Initiative which provides alternatives to placement, respite services and a Mentoring and Advocacy Program for at risk youth. In 2020, DYFJ issued a new RFP for FAP and selected five new providers whose contracts will begin at the start of FY 2022.

Analysis of Agency Budgets Fiscal Year 2022
130
Division of Child and Family Well-Being
The Division of Child and Family Well-Being (CFWB) provides access to quality primary prevention resources and opportunities that promote child and family well-being, enhance families’ capacity to thrive, and help minimize child welfare system involvement. CFWB provides access to child care, funds community-based programs, and promotes child safety campaigns, which help to strengthen family protective factors, defined as attributes that, when present, mitigate or eliminate risk in families and communities by fortifying their stability and well-being.
Child Care
CFWB administers child care assistance to approximately 48,000 children through child care vouchers supported by Child Care Block Grant state and federal funds, as well as city tax levy funds. This includes families with child welfare involvement, families in receipt of public assistance who are employed or engaged in work activities, and eligible low-income families.
Vouchers may be used to purchase care in both formal and informal settings. Formal child care settings include child care centers and group family day care homes registered and/or licensed by the Department of Health and Mental Hygiene (DOHMH). Informal settings include care provided in the child’s own home or the homes of family, friends or neighbors. In 2020, the City transitioned the ACS EarlyLearn program to the Department of Education (DOE); CFWB continues to work with the DOE to ensure compliance with regulations that govern our city, state, and federal funding streams.
Community-Based Programs
CFWB contracts directly with non-for-profit corporations to manage two community-based initiatives, Community Partnership Programs (Partnerships) and Family Enrichment Centers (FECs). Since 2007, the eleven (11) Partnerships, which are neighborhood provider planning coalitions, have served as local hubs for social service providers, community leaders, and residents, to share local resources and information, address community needs, and design and promote strategies to reduce the need for child welfare involvement. The three (3) FECs are a family-centered, place-based primary prevention program that provide community-designed offerings in a warm, inviting space where neighbors can connect, contribute to their community, find resources, support one another, and build strategies that help families thrive. Since 2018, the FECs have co-designed with the communities in which they are located – East New York, Highbridge and Hunts Point. With a focus on strengthening protective factors, FECs aim to reduce child welfare involvement by working with parent leaders to provide families with the concrete support and services they may need, and support efforts to address racial disproportionality in the child welfare system. In 2021, ACS announced the three non-profit provider agencies selected to operate the FECs through FY24.

Analysis of Agency Budgets Fiscal Year 2022
131
Child Safety Campaigns
CFWB promotes child safety campaigns to empower families with resources and information they need to keep children safe. The NYC Infant Safe Sleep Initiative works to prevent sleep-related infant injury deaths by putting resources directly into the hands of families and offering training to raise awareness about the potentially fatal risks associated with unsafe sleep practice. The Safe Medication Campaign works to educate parents, caregivers and community service providers on how to prevent unintentional exposures to high-risk medications and household products in their homes when children are present.
JUVENILES IN RESIDENTIAL PLACEMENT 2014 - 2020
0
100
200
300
400
500
600
2020201920182017201620152014Calendar Year
* The Close to Home initiative transferred youth in non-secure placement from State (OCFS) to City custody beginning in 2012.
Chi
ldre
n in
Car
e on
Dec
embe
r 31
Close to Home
OCFS Facilities
Private Agencies
104
156
9
269
157
193
16
366
62
163
5
230
159
20
179
91
52
143
9864
Source: NYS OCFS Annual Youth in Care Report
9864

Analysis of Agency Budgets Fiscal Year 2022
132
Capital Review
The Department’s 2022-2031 Ten Year Capital Strategy totals $484 million, of which $445 million are City funds. The Ten-Year Capital Plan includes $327.2 million for DYFJ programs, $54.0 million for administrative offices, $84.6 million for equipment and information systems, $15.6 million for City Council child care and child welfare projects, $3.0 million for Borough President and child welfare projects.
Capital Commitments
($ in 000’s)_______________________________________________________________________________________________________________________________________________________________________________________________________________
2020 2021 2022 2023 2024 2025 Actual Plan Plan Plan Plan Plan ________________________ _______________________ ________________________ _______________________ ________________________ _______________________
City All City All City All City All City All City All Funds Funds Funds Funds Funds Funds Funds Funds Funds Funds Funds Funds_______________________________________________________________________________________________________________________________________________________________________________________________________________
Child Welfare ........................ $12,867 $13,411 $10,282 $10,292 $14,967 $27,472 $53,042 $53,042 $75,096 $75,096 $73,000 $73,000 Child Care ............................. $— $— $— $— $320 $320 $— $— $9,312 $9,312 $— $—Buildings ............................... $3,928 $9,588 $10,081 $25,604 $3,351 $8,238 $— $— $6,038 $6,038 $— $—MIS ....................................... $3,102 $7,803 $8,223 $17,461 $15,331 $35,931 $5,088 $6,187 $8,541 $8,541 $9,715 $9,715 ___________ ___________ ___________ ___________ ___________ ___________ ___________ ___________ ___________ ___________ ___________ ___________
Total $19,897 $30,801 $28,586 $53,357 $33,969 $71,961 $58,130 $59,229 $98,987 $98,987 $82,715 $82,715 ========= ========= ========= ========= ========= ========= ========= ========= ========= ========= ========= =========
__________________________________________________________________________________________________________________________________________________________________________________________
Highlights of the Four-Year Capital Plan
• $84.6 million will support telecommunications and data infrastructure upgrades and improvements.
• $54.0 million will support the renovation of administrative and field offices.
• $327.2 million will support the Department’s juvenile justice operations including the renovation of the Department’s two secure detention facilities – Crossroads and Horizon.

Analysis of Agency Budgets Fiscal Year 2022
133
DEPARTMENT OF YOUTH AND COMMUNITY DEVELOPMENT
The Department of Youth and Community Development (DYCD) supports programs for families and youth in neighborhoods throughout the five boroughs. DYCD provides a wide range of high-quality youth and community development programs, including the Comprehensive Afterschool System of NYC (including School’s Out NYC, or SONYC), Beacon Community Centers, Cornerstone Programs at NYCHA Community Centers, the Summer Youth Employment Program, Runaway and Homeless Youth Programs, Immigration Programs, and Literacy Services. DYCD is also the designated Community Action Agency for New York City, which is the local grantee for the federal Community Services Block Grant (CSBG). CSBG funding supports a variety of programs that promote self-sufficiency and healthy communities.
Becoming a Pro-Active Anti-Racist City Agency
DYCD developed a Strategic Plan in June 2018 to cover the final three full fiscal years under this Administration (FY19 to FY21). Priorities were developed under the categories of Programmatic, Organizational, and Positional/External. The Executive Team develops goals, activities and milestones that support the priorities in these three categories. Over the past few years, progress on these priorities has resulted in developing DYCD’s Theory of Change and strengthened agency efforts in strategic communications, professional development, data management and strategic partnerships. In response of the murders of George Floyd, Breonna Taylor, Ahmaud Arbery and the many who followed, to fulfill DYCD’s mission and vision; help communities recover from the disparate racial impact of COVID-19 and support the international calls for systemic change, the Executive Team has added a new 2021-2022 priority to the Strategic Plan: DYCD will increase its efforts to be a proactive, anti-racist City agency. The four goals the agency will be pursuing in this area are:
• Center equity in resource allocations (funding+) and pilot equity-based funding model for future RFPs
• Provide anti-racism and implicit bias training and resources to DYCD staff.
• Revise DYCD’s equity and mission statements so that it reflects the agency's current anti-racist position.
• Increase pool, awareness, and the hiring of consultants of color who can provide support to CBOs’ organizational health, operations and program quality.
Financial Review
The Department’s 2022 Executive Budget provides for operating expenses of $835 million, of which $549 million are City funds.
Expense Budget Highlights
DYCD’s 2022 Executive Budget responds to the challenges faced by New York’s youth and communities both before and during the pandemic and lays important foundations for the future, including:
• Summer Rising: The Department will expand
summer services with an increased budget of $39 million. Summer Rising is a bold vision for summer learning that will be student-centered, experiential, academically rigorous and culturally responsive, integrating DOE and DYCD-funded summer camps and enrichment programs. Across all DYCD-funded K-8 school-based programs, including Beacon Community Centers, COMPASS Elementary and COMPASS SONYC, academic enrichment programming offered by DOE teachers will be scheduled as part of DYCD-funded summer enrichment programs, with a single enrollment process in DYCDConnect. Families will be able to apply online through DiscoverDYCD, or directly with providers. All K-8 students in NYC are eligible.
• Saturday Night Lights: The Department is investing $4.3 million in partnership with the Parks Department and DA’s office to expand Saturday Night Light programming to 100 locations across the City. The program is part of the Mayor’s investment in community safety and provides a positive alternative during vulnerable hours.
• Learning Labs: Due to the COVID-19 crisis, DOE
schools operated on a blended learning model at the start of the 2020-2021 school year. DYCD funded community-based organizations to offer childcare and academic support services to DOE K-8 students on the days when they were learning remotely.

Analysis of Agency Budgets Fiscal Year 2022
134
2021 20222020
Actual2021
ForecastPreliminary
BudgetExecutive
Budget Forecast Preliminary
BudgetExpenditures
Salary and Wages ……….. $47,159 $43,916 $41,126 $41,664 ($2,252) $538Fringe Benefits …………… — — — — — — OTPS ……………...……… 908,000 915,858 704,239 793,738 (122,120) 89,499 Total ……………...……… $955,159 $959,774 $745,365 $835,402 ($124,372) $90,037
FundingCity ……………...………… $704,456 $519,987 $532,896 $549,388 $29,401 $16,492Other Categorical Grants … 1,874 7,459 — 319 (7,140) 319 IFA ……………...………… — — — — — — State ……………...……… 7,015 6,767 5,275 5,275 (1,492) — Federal CD ……………...… 7,446 7,520 7,145 7,145 (375) — Federal Other ……………. 82,830 273,166 57,987 131,883 (141,283) 73,896 Intra-City Other …………… 151,538 144,875 142,062 141,392 (3,483) (670) Total ……………...……… $955,159 $959,774 $745,365 $835,402 ($124,372) $90,037
Additional Costs Centrally FundedPersonal Services (PS) Fringe Benefits ………… $12,311 $14,594 $13,168 $16,815 $2,221 $3,647 Pensions ……………...… 7,083 7,698 8,878 8,878 1,180 — Other Than Personal Service (OTPS) Debt Service ……………. — — — — — — Total Additional Costs $19,394 $22,292 $22,046 $25,693 $3,401 $3,647
FundingCity ……………...………… 18,762 19,419 21,491 21,822 2,403 331 Non-City ……………...…… 632 2,873 555 3,871 998 3,316
Full Agency Costs (including Central Accounts)Salary and Wages ………… $47,159 $43,916 $41,126 $41,664 ($2,252) $538Fringe Benefits …………… 12,311 14,594 13,168 16,815 2,221 3,647 Pensions ……………...…… 7,083 7,698 8,878 8,878 1,180 — Total PS ……………...…… $66,553 $66,208 $63,172 $67,357 $1,149 $4,185
OTPS ……………...……… $908,000 $915,858 $704,239 $793,738 ($122,120) $89,499Debt Service …………….. — — — — — — Total OTPS $908,000 $915,858 $704,239 $793,738 ($122,120) $89,499
Total Agency Costs ……… $974,553 $982,066 $767,411 $861,095 ($120,971) $93,684Less Intra-City …………… $151,538 $144,875 $142,062 $141,392 ($3,483) ($670)Net Agency Cost ………… $823,015 $837,191 $625,349 $719,703 ($117,488) $94,354
FundingCity ……………...………… 723,218 539,406 554,387 571,210 31,804 16,823 Non-City ……………...…… 99,797 297,785 70,962 148,493 (149,292) 77,531
Personnel (includes FTEs at fiscal year-end)City ……………...………… 505 465 437 444 (21) 7 Non-City ……………...…… 68 81 79 81 — 2 Total ……………...……… 573 546 516 525 (21) 9
Summary of Agency Financial Data The following table compares 2022 Executive Budget with the 2022 Preliminary Budget, the 2021 forecast and actual expenditures for 2020, including fringe benefits, pensions, and debt service.
2022Increase/(Decrease)($ in 000's)

Analysis of Agency Budgets Fiscal Year 2022
135
Programmatic Review and Service Impact
Comprehensive Afterschool System of New York City (COMPASS)
The Comprehensive Afterschool System of NYC (COMPASS), formerly known as the Out-of-School Time (OST) program, began in 2005 and provides a mix of academic, recreational and cultural activities for young people after school, during school closing days and in the summer. These programs, which are operated by community-based organizations, serve young people from elementary through high school and are primarily located in public and non-public schools, community centers, public housing and parks recreational facilities.
COMPASS is comprised of over 830 total programs serving more than 100,000 young people in grades K-12, including more than 50,000 in elementary schools and more than 1,400 in high schools. Through its network of providers, COMPASS offers high quality programs that offer a strong balance of academics, recreation, enrichment, and cultural activities to support and strengthen the overall development of youth. COMPASS includes the School’s Out NYC (SONYC) program, the Mayor’s signature Universal Afterschool for Middle School initiative, which aims to keep youth safe, foster competencies, and allow young people to explore interests and creativity while building confidence and leadership skills. In 2020, COMPASS served 122,575 students in K-12.
Beacon Community Centers
Pioneered in 1991 under Mayor Dinkins, these collaborative, school-based community centers have been replicated nationally, including as a model for Cornerstone Community Centers and Community Schools. Beacon programs are designed based on the needs of their communities, and tailor activities to serve young people and adults in the areas of academic enhancement, life skills, career awareness, civic engagement and community building, recreation, health and fitness, and culture. Research has demonstrated that Beacons have a positive impact on academic achievement and social development, reducing risky adolescent behaviors, empowering community residents and providing a forum for local problem solving. DYCD served 92,692 youth and 85,927 adults in Fiscal Year 2020.
Cornerstone Program
Cornerstone Community Centers (Cornerstones) provide engaging activities year-round for adults and young people at New York City Housing Authority (NYCHA) developments in the five boroughs. Cornerstone programming is shaped by input from young people, NYCHA residents, Resident Association leaders, elected officials, and school principals. Cornerstone youth programs are designed to help participants acquire the skills they need to graduate from high school, succeed in their chosen careers, and give back to the community. Cornerstone adult programs are designed to enhance skills and promote social interaction, community engagement, and physical activity. DYCD operates Cornerstone programs in 99 NYCHA developments, with partial services in additional sites.
As part of the Mayor’s Action Plan for Neighborhood Safety, beginning in 2014 summer hours of service were extended to 11 p.m. daily to allow community residents evening access to a safe place for recreation and learning when school is out.
Runaway and Homeless Youth Services
DYCD funds programs to protect runaway and homeless youth and, whenever possible, reunite them with their families. For youth in need of shelter and care, Crisis Shelters offer safe and welcoming environments on a short-term basis, while Transitional Independent Living (TIL) facilities combine longer-term shelter with the necessary support designed to place formerly homeless youth on the path to independence. Charged with giving vulnerable young people the resources they need to stabilize their lives; services also include Street Outreach and Drop-In Centers. In Fiscal 2021, 813 beds are on-line for youth up to age 24.
Youth Workforce Development
DYCD operates several workforce development programs for youth between the ages of 14 to 24. These include the Summer Youth Employment Program (SYEP), the school-year Work, Learn and Grow program, the Anti-Gun Violence program, the Office of Economic Opportunity (OEO) and Young Men’s Initiative (YMI)-funded Advance & Earn program and the Workforce Innovation and Opportunity Act (WIOA)-funded Train & Earn and Learn & Earn programs.

Analysis of Agency Budgets Fiscal Year 2022
136
SYEP provides New York City youth between the ages of 14 to 24 with summer work experiences and career exploration opportunities. Older participants work in a variety of entry-level jobs at community-based organizations, government agencies and private sector businesses and are paid for up to 25 hours per week for up to six weeks at the current State minimum wage of $15 per hour. Younger participants receive a stipend to complete project-based learning experiences. In 2019, 70,000 youth and young adults participated in SYEP across 13,701 worksites. In 2020, the all virtual SYEP Summer Bridge was created to adapt the program to the new realities of the COVID-19 pandemic last summer. The 58-year-old SYEP initiative returns this year with funding to maintain the program at 75,000 slots.
In City Fiscal Year 2021, DYCD received a total of $14.2 million from the Office of Economic Opportunity (OEO) and the Young Men’s Initiative (YMI) to administer the Advance & Earn program, which launched in February 2020. Advance & Earn connects youth between the ages of 16-24 with comprehensive High School Equivalency (HSE) test preparation, employer-recognized trainings, credentials and certifications, and paid internships. The program will serve 990 participants this year.
In City Fiscal Year 2021, DYCD received approximately $23.9 million in Workforce Innovation and Opportunity Act (WIOA) funding to support the Learn & Earn (formerly known as ISY) and the Train & Earn (formerly known as OSY) programs.
The Learn & Earn program is designed to help high school juniors and seniors graduate from high school and prepare for employment and postsecondary education or training. Learn & Earn program sites are located primarily in high schools to maximize participant success in school and leverage school resources. Learn & Earn program goals are supported through a combination of academic activities, such as tutoring, college visits, SAT preparation, career exploration activities including paid summer work experiences through the Summer Internship Program (SIP), work readiness training, and mentoring. The program also supports participants with guidance and counseling, stipends, and leadership development activities. Participants receive up to two years of services and a year of follow up services, depending on their grade at enrollment.
Train & Earn serves eligible youth aged 16-24 years old who are not working or in school and who need assistance upgrading their occupational and educational skills. Train & Earn programs are operated by community-based organizations throughout New York City's five boroughs. Programs offer a combination of occupational skills training in high growth sectors and paid internships, along with academic support, comprehensive supportive services, and placement in employment or postsecondary education or training. A year of follow up services is also provided.
In 2021, enrollment goals are 1,056 for Learn & Earn and 1,276 for Train & Earn.
Literacy Services
Adult Literacy programs are designed to assist adults and older youth to become literate and to obtain the knowledge and skills necessary for further education, employment and self-sufficiency. Adult Basic Education (ABE) programs provide instruction in reading, writing and mathematics to native English speakers. High School Equivalency (HSE) test preparation classes are designed to help students prepare for HSE tests in reading, writing, social studies, science and math. English for Speakers of Other Languages (ESOL) programs provide English language courses to immigrants to increase their communication skills. In 2021, DYCD’s funding for adult literacy services is $15.3 million and it is projected that 15,737 individuals will be served.
Programs also provided expanded support services to engage students in continued learning while operating remotely, to keep them connected to a caring community, and provide access to essential information and services.
Neighborhood Development Programs
DYCD administers the federal Community Services Block Grant (CSBG) program to fund anti-poverty initiatives in 42 designated low-income Neighborhood Development Areas (NDAs) across the five boroughs of New York City. The NDA programs are designed to allow individual neighborhoods to fund the social services they determine best meet their particular needs. DYCD’s mission in administering the Community Action Program is to assist low income individuals and families to attain the skills, knowledge, motivation and opportunities they need to become self-sufficient. In 2021, the Department received $15.9 million in CSBG

Analysis of Agency Budgets Fiscal Year 2022
137
funding for these programs, which provides immigrant services, family support services, youth development, senior support, and housing assistance to 14,898 participants.
Fatherhood Programs
By promoting positive involvement of fathers in the lives of their children, DYCD’s 8 CSBG-funded Fatherhood programs strengthen family relationships and encourage fathers to fulfill their financial responsibilities. Fatherhood services include individual, family and group counseling, father-to-father mentoring, parent and child rearing classes, visitation arrangements, and mediation and conflict resolution training. Support activities include independent living skills training, college preparation classes, and adult basic education and English instruction for speakers of other languages. DYCD also encourages program providers to form linkages with other organizations to address the comprehensive needs of fathers, including job training and placement, health care, and housing. In 2021, the Department allocated $2.8 million in CSBG funding to provide services to approximately 1,460 participants.
System Upgrades to Support Programming
DYCD’s has launched a digital settlement house tool, built on the principles of ; embeddedness – being a part of the community, Community Building – strengthening a sense of community, reciprocity – everyone has something to contribute, integrated Services – full array of services for the person and family, multiple points of entry – many different ways to access resources.
DiscoverDYCD is a digital platform that allows the public to find resources provided by DYCD funded programs, apply to those programs using an easy to use interface, track their applications and reach out to DYCD for assistance by phone, email or using our digital assistant. DYCD believes in building strong partnerships with the community and discoverDYCD is a tool that allows us to strengthen those interactions. discoverDYCD can be used to apply for most of DYCD funded program; the Summer Youth Employment Program is scheduled to be added to the platform next year

Analysis of Agency Budgets Fiscal Year 2022
138
DEPARTMENT FOR THE AGING
The Department for the Aging (DFTA) administers a wide range of programs that enhance the independence and quality of life for the City’s elderly population. The Department’s services include senior centers, home delivered meals, case management services, homecare services, transportation services, caregiver services, employment counseling and placement for older New Yorkers and an array of other aging services programming. DFTA serves as an advocate for the City’s elderly population through legislative activity and public policy initiatives.
Financial Review
The Department’s 2022 Executive Budget provides for operating expenses of $440 million, of which $286 million are City funds. In addition, the Department’s Ten-Year Capital Plan includes $51.3 million.
Expense Budget Highlights
DFTA’s 2022 Executive Budget responds to the challenges faced by New York’s aging population during the pandemic and lays important foundations for the future, including:
• Community Cares: The City will invest $40 million in the first year of a five-year Community Care Plan for older New Yorkers. The plan addresses the importance of creating a network of services that support the independence, self-reliance and wellbeing older New Yorkers need to age in their homes and includes the creation of 25 new Senior Centers or Naturally Occurring Retirement Communities (NORCs).
• Senior Center Model Budget: The Department will implement the second phase of the Senior Center Model Budget, adding $10 million to Senior Centers to increase rates to service providers.

Analysis of Agency Budgets Fiscal Year 2022
139
2021 20222020
Actual2021
ForecastPreliminary
BudgetExecutive
Budget Forecast Preliminary
BudgetExpenditures
Salary and Wages ……….. $30,926 $32,256 $32,744 $32,669 $413 ($75)Fringe Benefits …………… — — — — — — OTPS ……………...……… 393,056 365,886 350,806 407,378 41,492 56,572 Total ……………...……… $423,982 $398,142 $383,550 $440,047 $41,905 $56,497
FundingCity ……………...………… $277,556 $264,013 $264,841 $285,706 $21,693 $20,865Other Categorical Grants … 254 174 — — (174) — IFA ……………...………… — — — — — — State ……………...……… 45,659 44,341 44,057 44,057 (284) — Federal CD ……………...… 3,835 6,156 2,252 2,252 (3,904) — Federal Other ……………. 93,711 81,077 71,885 107,517 26,440 35,632 Intra-City Other …………… 2,967 2,381 515 515 (1,866) — Total ……………...……… $423,982 $398,142 $383,550 $440,047 $41,905 $56,497
Additional Costs Centrally FundedPersonal Services (PS) Fringe Benefits ………… $8,008 $10,081 $9,144 $11,777 $1,696 $2,633 Pensions ……………...… 4,882 5,296 5,822 5,822 526 — Other Than Personal Service (OTPS) Debt Service ……………. — — — — — — Total Additional Costs $12,890 $15,377 $14,966 $17,599 $2,222 $2,633
FundingCity ……………...………… 12,187 13,361 14,013 14,600 1,239 587 Non-City ……………...…… 703 2,016 953 2,999 983 2,046
Full Agency Costs (including Central Accounts)Salary and Wages ………… $30,926 $32,256 $32,744 $32,669 $413 ($75)Fringe Benefits …………… 8,008 10,081 9,144 11,777 1,696 2,633 Pensions ……………...…… 4,882 5,296 5,822 5,822 526 — Total PS ……………...…… $43,816 $47,633 $47,710 $50,268 $2,635 $2,558
OTPS ……………...……… $393,056 $365,886 $350,806 $407,378 $41,492 $56,572Debt Service …………….. — — — — — — Total OTPS $393,056 $365,886 $350,806 $407,378 $41,492 $56,572
Total Agency Costs ……… $436,872 $413,519 $398,516 $457,646 $44,127 $59,130Less Intra-City …………… $2,967 $2,381 $515 $515 ($1,866) $—Net Agency Cost ………… $433,905 $411,138 $398,001 $457,131 $45,993 $59,130
FundingCity ……………...………… 289,743 277,374 278,854 300,306 22,932 21,452 Non-City ……………...…… 144,162 133,764 119,147 156,825 23,061 37,678
Personnel (includes FTEs at fiscal year-end)City ……………...………… 233 228 224 231 3 7 Non-City ……………...…… 403 501 447 454 (47) 7 Total ……………...……… 636 729 671 685 (44) 14
Summary of Agency Financial Data The following table compares 2022 Executive Budget with the 2022 Preliminary Budget, the 2021 forecast and actual expenditures for 2020, including fringe benefits, pensions, and debt service.
2022Increase/(Decrease)($ in 000's)

Analysis of Agency Budgets Fiscal Year 2022
140
Programmatic Review and Service Impact
Senior Centers
The core of DFTA’s service portfolio is a citywide network of 249 senior centers, which every day offers older New Yorkers meals, socialization, recreation, benefits counseling and application assistance, and participation in a wide array of activities designed to improve their health and quality of life. Approximately 165,000 older New Yorkers per year participate in senior center services.
Case Management, Home Delivered Meals, and Homecare
Case management services connect homebound seniors to resources and benefits so that they may continue to live independently and safely in their homes. Following a case management assessment, eligible seniors may receive home delivered meals, homecare, and other benefits or services. Seniors are referred to case management providers from senior centers, meal providers, hospitals and other community-based social service and health care agencies. In 2022, $38 million will support case management services for approximately 35,000 clients. Most of the case management clients benefit from home-delivered meals services five days a week each year. DFTA has 15 contracts for home delivered meals, which offer seniors the option of frozen or hot meal deliveries. In 2022, $42 million will support 4.3 million home delivered meals. In addition, in 2022 approximately 3,000 clients will benefit from Homecare services.
Senior Employment and Foster Grandparent Services
DFTA addresses the employment needs and skills of older New Yorkers through its Senior Community Service Employment Program. This program provides part-time on-the-job training to about 400 low income participants. Clients serve their communities while receiving job training and other support services to facilitate re-entry into the workforce. Placements are made in City agencies and with not-for-profit employers.
The Foster Grandparent program is a volunteer based program enlisting approximately 300 seniors each year to work as mentors and tutors for at risk or troubled children and youth. Foster grandparents work in hospitals, day care programs, schools, and afterschool programs. In 2022, $2 million is provided for the foster grandparent program.
Naturally Occurring Retirement Communities
Naturally Occurring Retirement Communities (NORCs) are on-site collaborations among housing entities, social service providers, and healthcare networks to provide supportive services for senior residents to help them remain independent and safe in their own homes. Currently, $8 million supports 28 NORC programs for over 11,000 residents in the Bronx, Brooklyn, Manhattan, and Queens. NORC services include case assistance, transportation, health promotion, education and recreation, and nursing services.
Transportation Services
DFTA’s independent transportation program aims to serve seniors who are unable to travel or access public transportation from becoming socially isolated and/or declining physically by assisting them in getting to and from places they need to go in their communities. Moreover, DFTA’s transportation services program offers group transportation to enhance community engagement for seniors by offering recreational, social and educational trips. Each year, DFTA’s $5M transportation program provides over 250,000 one-way trips citywide. DFTA’s senior centers provide over 350,000 one way trips each year.
Caregiver Services
DFTA’s caregiver support program offers support groups, counseling, outreach and information services to unpaid caregivers. The caregiver program also offers options for respite care through home care or placement in social adult day care, to ease the burden of families and other unpaid caregivers. In 2022, funding for the caregiver program is $8 million.
ThriveNYC
DFTA leads ThriveNYC initiatives that focus on geriatric mental health. Through the DFTA Geriatric Mental Health initiative, mental health services are available on-site at 48 of the largest senior centers in the agency’s network. Mental health professionals assist senior center members with issues ranging from depression and anxiety to highly disruptive behaviors. The 2022 budget has $3.1 million for senior center geriatric mental health programs. The 2022 budget also has an additional $1.8 million to combat social isolation among homebound older adults, through DFTA’s Friendly Visiting contracts.

Analysis of Agency Budgets Fiscal Year 2022
141
Capital Review The Department’s Ten-Year Capital Strategy for 2022-2031 totals $51.3 million. The Ten-Year Capital Strategy
includes funding for information technology projects to improve operations as well as funding for rehabilitation of senior centers throughout the City.
Capital Commitments
($ in 000’s)_______________________________________________________________________________________________________________________________________________________________________________________________________________
2020 2021 2022 2023 2024 2025 Plan Plan Plan Plan Plan Plan ________________________ _______________________ ________________________ _______________________ ________________________ _______________________
City All City All City All City All City All City All Funds Funds Funds Funds Funds Funds Funds Funds Funds Funds Funds Funds_______________________________________________________________________________________________________________________________________________________________________________________________________________
Renovation ............................ $7,705 $7,705 $6,300 $6,300 $5,230 $5,230 $2,129 $2,129 $8,841 $8,841 $3,988 $3,988 Equipment ............................. $652 $652 $532 $532 $607 $607 $2,241 $2,241 $436 $436 $2,800 $2,800 ___________ ___________ ___________ ___________ ___________ ___________ ___________ ___________ ___________ ___________ ___________ ___________
Total ...................................... $8,357 $8,357 $6,832 $6,832 $5,837 $5,837 $4,370 $4,370 $9,277 $9,277 $6,788 $6,788 ========= ========= ========= ========= ========= ========= ========= ========= ========= ========= ========= =========
_______________________________________________________________________________________________________________________________________________________________________________________________________________
Ten-Year Capital Strategy Highlights
• The Department’s Ten-Year Capital Strategy includes rehabilitation of senior centers, with focus on structural and accessibility issues ($36.4 million); computer and network upgrade and equipment purchase ($14.9 million).

Analysis of Agency Budgets Fiscal Year 2022
142
DEPARTMENT OF HEALTH AND MENTAL HYGIENE
The mission of the New York City Department of Health and Mental Hygiene (the Department) is to protect and promote the health of all New Yorkers. The Department is committed to maintaining core public health services and continues to introduce new programs and technologies to improve the health status of all New Yorkers and to reduce health inequities between New York City neighborhoods.
The Department will continue to target its public health activities towards those communities that bear a disproportionate share of physical and mental illness and premature death, relying on evidence-based and evidence-informed programs and interventions. The Department will pursue active engagement with communities, their organizations, institutions and members, to continue to tackle the leading causes of death and disability.
The Office of the Chief Medical Examiner (OCME) determines the cause and manner of deaths occurring in the City, and operates the county mortuaries and the accredited Forensic Biology Laboratory.
Financial Review
The Department’s 2022 Executive Budget provides for operating expenses of $2.1 billion, of which $1.1 billion are City funds. Capital commitments of $323.1 million are also provided to fund agency initiatives.
Revenue Forecast
The Department generates revenue from licenses, permits, inspection and service fees. In 2022, the Department will generate $30.4 million in revenue from these sources.

Analysis of Agency Budgets Fiscal Year 2022
143
2021 20222020
Actual2021
ForecastPreliminary
BudgetExecutive
Budget Forecast Preliminary
BudgetExpenditures
Salary and Wages ………… $557,719 $590,793 $541,995 $580,911 ($9,882) $38,916Fringe Benefits …………… 1,974 2,951 860 860 (2,091) — OTPS ……………………… 1,300,603 1,846,384 1,227,845 1,556,437 (289,947) 328,592 Total ……………………… $1,860,296 $2,440,128 $1,770,700 $2,138,208 ($301,920) $367,508
FundingCity ……………………… $1,002,852 $981,278 $923,087 $1,067,302 $86,024 $144,215Other Categorical Grants … 48,800 17,663 1,510 1,510 (16,153) — IFA ………………………… — — — — — — State ……………………… 440,519 482,911 546,255 513,356 30,445 (32,899) Federal CD ………………… — — — — — — Federal Other ……………… 341,574 945,311 294,592 546,108 (399,203) 251,516 Intra-City Other …………… 26,551 12,965 5,256 9,932 (3,033) 4,676 Total ……………………… $1,860,296 $2,440,128 $1,770,700 $2,138,208 ($301,920) $367,508
Additional Costs Centrally FundedPersonal Services (PS) Fringe Benefits ………… $158,250 $178,993 $162,142 $206,092 $27,099 $43,950 Pensions ………………… 85,269 95,372 105,365 105,365 9,993 — Other Than Personal Service (OTPS) Debt Service …………… 64,725 63,592 73,852 73,645 10,053 (207) Total Additional Costs … $308,244 $337,957 $341,359 $385,102 $47,145 $43,743
FundingCity ……………………… 271,922 289,505 307,421 323,022 33,517 15,601 Non-City ………………… 36,322 48,452 33,938 62,080 13,628 28,142
Full Agency Costs (including Central Accounts)Salary and Wages ………… $557,719 $590,793 $541,995 $580,911 ($9,882) $38,916Fringe Benefits …………… 160,224 181,944 163,002 206,952 25,008 43,950 Pensions …………………… 85,269 95,372 105,365 105,365 9,993 — Total PS ………………… $803,212 $868,109 $810,362 $893,228 $25,119 $82,866
OTPS …………………… $1,300,603 $1,846,384 $1,227,845 $1,556,437 ($289,947) $328,592Debt Service ……………… 64,725 63,592 73,852 73,645 10,053 (207) Total OTPS ……………… $1,365,328 $1,909,976 $1,301,697 $1,630,082 ($279,894) $328,385
Total Agency Costs ……… $2,168,540 $2,778,085 $2,112,059 $2,523,310 ($254,775) $411,251Less Intra-City …………… $26,551 $12,965 $5,256 $9,932 ($3,033) $4,676Net Agency Cost ………… $2,141,989 $2,765,120 $2,106,803 $2,513,378 ($251,742) $406,575
FundingCity ……………………… 1,274,774 1,270,783 1,230,508 1,390,324 119,541 159,816 Non-City ………………… 867,215 1,494,337 876,295 1,123,054 (371,283) 246,759
Personnel (includes FTEs at fiscal year-end)City ……………………… 5,502 5,212 5,536 5,829 617 293 Non-City ………………… 1,405 1,541 1,412 1,470 (71) 58 Total ……………………… 6,907 6,753 6,948 7,299 546 351
Summary of Agency Financial Data The following table compares 2022 Executive Budget with the 2022 Preliminary Budget, the 2021 forecast and actual expenditures for 2020, including fringe benefits, pensions, and debt service.
2022Increase/(Decrease)($ in 000's)

Analysis of Agency Budgets Fiscal Year 2022
144
Programmatic Review and Service Impact
Take Care New York (TCNY) is a comprehensive health policy for New York City laying out the Department’s plans and priorities to advance anti-racist public health practice, reduce health inequities, and strengthen the City's collective approach to ensuring that all New Yorkers can realize their full health potential, regardless of who they are, where they are from, or where they live. The Department launched TCNY in 2004, and has updated it approximately every four years. The next iteration of TCNY will launch in 2021 with a new framework illuminating the connections between structural racism and health outcomes, as well as clear priorities for eliminating health inequities. To date, more than 5,000 New Yorkers have been engaged in shaping the framework and priorities through street outreach, virtual action planning meetings, and community story circles.
Health Department’s Response to COVID-19
The Department’s Incident Command Structure was activated on January 30, 2020, in order to response to the COVD-19 pandemic, and staff have worked around the clock since. This has included the work of our disease surveillance systems, the Public Health Laboratory, and the operations of the Department’s Vaccine Hubs, which are the City’s single largest source of vaccinations. This response has been a true all-hands-on-deck effort.
The Department has worked with NYC Health + Hospitals as they created the NYC Test & Trace Corps (or T2), the country’s largest public testing and tracing operation. Our staff has brought their expertise in both testing and contact tracing to T2 and continue to work in lockstep with them in the Department of Education Situation Room, through investigations of cases and clusters in congregate settings, and in our community outreach work, including the funding of community-based organizations (CBOs) who have done incredible outreach on both testing and COVID-19 vaccines, among many other efforts every day.
The Department has taken an active role in the City’s Vaccine Command Center (VCC), where our team offers expertise to the VCC on distribution plans, outreach and communications, and strategy for increasing both access to, and confidence in, the vaccine. As always, our focus is equity – and we are working hand-in-hand with the City’s Taskforce on Racial Inclusion and Equity (the Taskforce) and our
sister agencies to address the disparities we see in vaccine uptake thus far.
We are also working in those communities to address vaccine confidence – offering what we call “Community Conversations,” training community leaders to be vaccine navigators, and getting information out through town halls and boots-on-the-ground outreach in multiple languages.
Mental Hygiene Services
Division of Mental Hygiene (MHy) Among people, families, and communities with
or affected by mental health conditions; intellectual and developmental disabilities; who use drugs; and/or are at intersections with the criminal-legal system, while prioritizing reducing racial and other inequities, the Division of Mental Hygiene’s aims to (1) promote mental wellness and wellbeing, and participation in family, community, and work; (2) promote healthy social emotional development; and (3) decrease morbidity, mortality, and premature mortality.
Bureau of Mental Health (BMH)
The Bureau of Mental Health (BMH) develops, funds, and implements evidence-based/informed programs, initiatives, and policies to promote the mental health and well-being of all New Yorkers, including those with serious mental illnesses. Key programs and initiatives include: Single Point of Access for intensive mental health services, including mobile treatment and non-Medicaid Care Coordination; supportive housing; clubhouses; crisis respite centers; Mobile Crisis Teams; NYC Well, NYC’s behavioral health help and crisis line; Assisted Outpatient Treatment (AOT); and NYC Supportive Transition and Recovery Team (START), an intensive follow up program for people after a first episode of psychosis. BMH also monitors and assesses population-level mental health, engagement in mental health treatment, and the needs of individuals with mental illness.
Bureau of Alcohol and Drug Use Prevention, Care, and Treatment (BADUPCT)
The Bureau of Alcohol and Drug Use Prevention, Care and Treatment (BADUPCT) develops, funds, implements, and evaluates data-driven and evidence-

Analysis of Agency Budgets Fiscal Year 2022
145
informed initiatives to eliminate disparities and reduce overall morbidity and mortality among people who use alcohol and drugs. Key areas of work include: timely and comprehensive surveillance of alcohol- and drug-related health outcomes including overdose; creation and dissemination of communications campaigns; promotion, support, and delivery of harm reduction (including syringe service programs, overdose education and naloxone distribution, and Relay, DOHMH’s nonfatal overdose response system); provision, oversight, and expansion of evidence-based, person-centered treatment (medication for opioid use disorder) in traditional and novel settings; meaningful engagement of communities most impacted by overdose and the War on Drugs; and development and advancement of policy innovations.
Bureau of Mental Hygiene Community Engagement, Policy, and Practice (CEPP)
Leads and coordinates cross-cutting divisional policy, practice change, and research to improve and integrate behavioral health across sectors and settings. CEPP is organized into five offices: Policy; Consumer Affairs; Community Behavioral Health; Research, Monitoring, and Evaluation; and Resilience and Mental Health First Aid.
Bureau of Children, Youth, and Families (CYF)
Develops, funds, and implements evidence-based/informed programs, initiatives, and policies to promote the mental health, social-emotional wellness, and well-being of NYC children and their families, and people with intellectual and developmental disabilities. Key programs and initiatives include the Children’s Single Point of Access (CSPOA) for intensive mental health services, the Early Childhood Mental Health Network, family and youth peer support, and Children’s Mobile Crisis.
Bureau of Health Promotion of Justice-Impacted Populations (HPJIP)
Promotes community-based, health-led, cross-sector strategies to reduce criminal justice involvement and improve the transition of individuals back to the community after incarceration and community supervision using data, policy, and programs.
Bureau of Administration
Ensures the provision of necessary administrative support services and consultation to the Division’s
bureaus and offices in the areas of Human Resources Administration, Finance, Contracts, Purchasing, and General Office Services.
Public Health Services
Center for Healthy Equity & Community Wellness
The Center for Health Equity and Community Wellness (CHECW) seeks to use a racial and social justice approach to eliminate health inequities for those who are most marginalized in New York City and to reduce overall premature mortality from the leading causes of preventable death.
Bureau of Chronic Disease Prevention (BCDP)
The Bureau of Chronic Disease Prevention (BCDP) strives to reduce the burden of chronic disease, including heart disease, cancer and diabetes, among New Yorkers. BCDP is focused on shifting environments to prevent chronic disease and promote more equitable health outcomes. BCDP employs evidence-based policies, programs, communications and research to advance its objectives, as well as spearheads and evaluates innovative projects in order to develop new approaches to addressing chronic disease. BCDP aims to work with partners in government and in the community to improve nutrition and the built environment, and reduce tobacco use while also supporting strategies to reduce the burden of and improve screening for hypertension and cancer. BCDP’s work is informed by our understanding that structural forces, such as the commercial determinants of health – specifically corporate strategies and practices that promote tobacco, e-cigarettes and unhealthy food – as well as a history of discrimination and social injustices, have led to unfair and unjust barriers to health in certain communities. As a bureau within the Center for Health Equity & Community Wellness (CHECW), BCDP is uniquely positioned to contribute to CHECW’s goal to eliminate racial inequities in and reduce overall premature mortality among New Yorkers by working to address commercial determinants of health, pursuing population-level approaches, and prioritizing working with and resourcing community organizations that are embedded in the neighborhoods that bear an unjust burden of chronic disease.
Bureau of Health Equity Capacity Building (HECB)
The Bureau of Health Equity Capacity Building (HECB) seeks to implement collective action strategies to build community power and capacity to address

Analysis of Agency Budgets Fiscal Year 2022
146
health inequities and the social determinants of health. Through stakeholder engagement, community-informed strategies, capacity building, data and community-driven advocacy and narrative change, the bureau supports the efforts of the Center for Health Equity and Community Wellness (CHECW) to close the racial gap in premature mortality for the leading causes of preventable death.
Bureau of Equitable Health Systems (BEHS)
The Bureau of Equitable Health Systems (BEHS) partners with health and social care institutions in New York City to ensure that every New Yorker receives, in an equitable fashion, the care and resources they need to be healthy, and maintain wellness across their lifespan. The bureau engages partners to: use evidence and data to support planning and technical assistance for providers and payers; assess systems and identify where people are not getting needed care and resources and focus on undoing systems of oppression; develop opportunities where health systems can strengthen, invest in, and connect people to social supports to deliver whole person care; advocate for and implement policies and programs that expand access to health care; and advance data-driven health and social policy to close racial equity gaps in premature mortality; and encourage prioritization of investment in social care and preventive healthcare. As a bureau within the Center for Health Equity & Community Wellness (CHECW), BEHS bridges the gap between systems and communities, and prioritizes providing high quality, affordable, accessible, coordinated, and continuous health and social care for all New Yorkers.
Bureau of Finance, Administration, and Services (BFAS)
The Bureau of Finance, Administration, and Services (BFAS) houses all administration for the Center for Health Equity and Community Wellness (CHECW). The CHECW Finance and Administration team consists of Human Resources, Operations, Budget, and Contracts. The CHECW Finance and Administration team aims to support the programmatic goals of CHECW by providing timely, accurate, and transparent administrative information while establishing and enforcing policies and procedures to responsibly manage the division’s resources. BFAS also includes the Office of Health Insurance Services (OHIS), which provides community-facing programs and on-the ground programmatic work that maximize health insurance coverage opportunities and increase
access to healthcare and social support services for all New Yorkers. OHIS applies a health equity lens to all efforts with a focus on connecting communities most at-risk to equitable resources.
Bureau of Bronx Neighborhood Health
The Bureau of Bronx Neighborhood Health is one of three neighborhood-based bureaus in the Center for Health Equity and Community Wellness (CHECW). They center communities by ensuring that community has input into programming by getting stakeholder input and looking at neighborhood data. The Bureau of Bronx Neighborhood Health works to close racial gaps in premature mortality through programming, collaborations with key stakeholders, building capacity of community residents and organizations, and responding to community needs through a collective action approach. Building services include providing referrals, supporting health and wellness classes, and making building space available to partners.
Bureau of Brooklyn Neighborhood Health
The Bureau of Brooklyn Neighborhood Health works to close racial gaps in premature mortality through programming, collaborations with key stakeholders, building capacity of community residents and organizations, and responding to community needs through a collective action approach. The Bureau of Brooklyn Neighborhood Health is one of three neighborhood-based bureaus in the Center for Health Equity and Community Wellness (CHECW). They center communities by ensuring the community has input into programming by getting stakeholder input and looking at neighborhood data. Building services include providing referrals, supporting health and wellness classes, and making building space available to partners.
Bureau of Harlem Neighborhood Health
The Bureau of Harlem Neighborhood Health works to close racial gaps in premature mortality through programming, collaborations with key stakeholders, building capacity of community residents and organizations, and responding to community needs through a collective action approach. The work is centered in a racial equity lens, and work from a place-based approach ensuring that the community has input into programming through collaborative development and analysis of neighborhood data. Building services include providing referrals, supporting health and

Analysis of Agency Budgets Fiscal Year 2022
147
wellness classes, and making building space available to neighborhood and community partners. The Bureau of Harlem Neighborhood Health is one of three neighborhood-based bureaus in the Center for Health Equity and Community Wellness (CHECW), traditionally supporting the East and Central Harlem neighborhoods, it has now expanded services to all of Upper Manhattan in response to the Covid19 outbreak.
Disease Control
The Health Department’s Bureau of HIV (BHIV) coordinates New York City’s response to the HIV epidemic. The New York City Ending the Epidemic Plan includes five strategies to reduce the number of new HIV infections to nonepidemic levels and improve the health and well-being of New Yorkers with HIV:
• Increase the number of people who know their HIV status by diagnosing HIV infection as early as possible, promoting routine testing within health care facilities and scaling up testing options in nonclinical settings;
• Prevent new HIV infections by increasing access to effective prevention interventions, including pre-exposure prophylaxis (PrEP), emergency post-exposure prophylaxis (PEP), condoms, harm reduction, and supportive services;
• Improve viral suppression and other health outcomes for people with HIV by optimizing medication adherence and access to care, improving coordination of clinical and supportive services, and increasing access to immediate antiretroviral treatment
• Enhance methods to identify and intervene on HIV transmission networks to better support people and communities at increased risk of exposure; and
• In all strategies, utilize an intersectional, strengths-based, anti-stigma, and community-driven approach to mitigate racism, sexism, homophobia, transphobia, and other systems of oppression that create and exacerbate HIV-related health inequities.
In addition to overseeing nearly 400 City- and federally funded contracts with hospitals, clinics, and community-based organizations to deliver HIV and sexual health services citywide, BHIV leads the Health Department’s efforts under the Ending the HIV Epidemic: A Plan for America (EHE) federal initiative, which aims to reduce new HIV infections by 75% in
five years and by 90% in 10 years. BHIV worked with community partners to develop a jurisdictional plan setting forth key activities to end the local epidemic and is currently working on plan implementation. Launched in early 2021, BHIV’s first EHE initiative, Building Equity: Intervening Together for Health (BE InTo Health), funds HIV clinics to implement evidence-informed interventions focused on priority populations.
The Bureau of Sexually Transmitted Infections
(BSTI) provides direct clinical and partner services for HIV and other sexually transmitted infections (STIs), monitors and reports disease trends for STIs, provides education and training to providers and community groups, conducts research and develops policies to improve every New Yorkers’ sexual health. The Department operates eight Sexual Health Clinics citywide that serve anyone 12 years or older regardless of ability to pay, insurance coverage or immigration status and without parental notification. Sexual Health Clinics provide low to no-cost STI and HIV testing, treatment and prevention services; immunizations; cancer prevention services, reproductive health and contraceptive services; behavioral health services; and navigation for referrals and follow-up care. As part of the City’s strategy and the State’s Blueprint for Ending the Epidemic (EtE) of HIV, Sexual Health Clinics have expanded hours, services and access to “express visits” for all New Yorkers. Through EtE, Sexual Health Clinics now also provide access to PrEP and PEP to prevent new HIV infections among patients at risk of infection; and, for newly identified infections, immediate initiation of anti-retroviral treatment through the JumpstART program. The Bureau also convenes a Sexual Health Advisory Group (SHAG) to inform best practices in sexual health and related policy. The SHAG also aims to strengthen bi-directional communication between the Department, providers, and community networks to foster a culture of accountability in service delivery and access.
The Department remains committed to providing
high-quality, effective tuberculosis (TB) prevention and care services to all New Yorkers. Today, TB in New York City disproportionately affects non-U.S.-born New Yorkers and U.S.-born minorities; the majority of cases emerge from the reservoir of infected individuals in the community who may be unaware of their risk for developing TB. As the leading provider of TB services in the City, the Bureau of Tuberculosis Control offers direct clinical services, regardless of patient immigration status or ability to pay, at Department TB clinics located throughout New York City. Clinic

Analysis of Agency Budgets Fiscal Year 2022
148
services include TB testing, chest radiographs, treatment and monitoring, and HIV testing. To ensure positive patient outcomes, every patient diagnosed with TB receives comprehensive case management throughout the duration of their treatment – generally six to nine months – regardless of where they receive clinical care. Additionally, the Bureau identifies and evaluates individuals at high-risk for TB and offers preventive treatment, if appropriate. The Bureau of TB Control’s public health activities include surveillance, case management and contact investigations, directly observed therapy, medical consultation, outbreak detection, evaluation of newly arrived immigrants and refugees, and education and outreach. The Bureau continues to work collaboratively with medical providers, elected officials, and communities to increase awareness of TB and reduce disparities in care. Further, the Bureau is expanding the use of technology for TB testing and diagnosis, providing more effective, short course treatment options, and offering innovative forms of treatment monitoring such as telehealth to ensure an efficient, patient-centered model of care.
Established in 1892 to control a diphtheria
outbreak, the New York City Public Health Laboratory (PHL) was the world's first municipal bacteriological laboratory. Since its inception, PHL has expanded to provide a wide variety of clinical and environmental laboratory testing services. The laboratory continues to safeguard the health of all NYC residents by providing testing that addresses the needs of the Department and its community partners. The laboratory also collaborates with other City agencies, and state and federal partners to respond to public health challenges in NYC and beyond.
In addition to its role as a national leader in public health laboratory science and biosafety in laboratory diagnostics, one focus of PHL is testing for pathogens of public health significance. The PHL tests for traditional infectious diseases such as HIV and other sexually transmitted infections of public health significance, tuberculosis, influenza, and agents of foodborne illnesses, and also responds to any public health emergencies that threaten NYC. PHL’s Bio-Threat Response laboratory analyzed the anthrax-laden letter received at the NBC News office in NYC in 2001. In 2014, PHL was one of the first laboratories to implement Ebola testing, and diagnosed NYC’s case. PHL was integral in pinpointing the sources of the large-scale Legionnaire’s disease outbreaks using whole genome sequencing technology in the summer of 2015 and fall of 2018. PHL has been also on the
forefront of the COVID-19 response and is leading testing efforts.
• PHL was the first lab and for a little while the only lab to conduct COVID-19 testing in New York City.
• On March 4th, 2020 PHL began diagnostic testing for COVID-19 using the CDC SARS-CoV-2 assay.
• By mid- March PHL successfully transitioned and implemented the New York SARS-CoV-2 Real-time Reverse Transcriptase (RT) – PCR Diagnostic Panel.
• In August 2020, PHL expanded citywide diagnostic testing with the launch of nine COVID Express x Quickie Labs at Health Department clinic sites across NYC where specimens are collected and tested on site using rapid advanced molecular testing platform in which allows the clients to receive their result within 24 hours of their visit.
The Bureau of Communicable Diseases (BCD) tracks 73 infectious diseases and investigates outbreaks in New York City in order to rapidly detect, characterize and respond to infectious disease threats and to prevent or control ongoing transmission. BCD is responsible for a wide range of diseases (from anthrax to Zika virus), including those transmitted person to person, by contaminated food or water, animal contact, mosquito and tick bites as well as the potential threat of bioterrorism or novel influenza strains (e.g., avian influenza viruses such as H7N2). Key activities include:
• Case, contact, and outbreak investigations to determine the source of exposures and prevent spread to others.
• Routine, systematic analyses of notifiable disease data to rapidly detect outbreaks and track disease trends, characterize clinical and local epidemiologic features and identify common exposures and populations at risk to prioritize prevention efforts, and to share summary data with both internal and external partners.
• Providing consultation to the medical and animal health communities and the public on the recognition, prevention, and control of communicable diseases.
• Working cooperatively with community health organizations to develop and implement interventions to promote viral hepatitis prevention,

Analysis of Agency Budgets Fiscal Year 2022
149
screening, linkage to care and treatment, including patient navigation programs, a citywide Hep Free NYC coalition, provider training programs, and clinical capacity building programs.
• Maintaining timely and informative syndromic surveillance systems to routinely monitor illness patterns and to provide situational awareness during public health emergencies.
Since January 2020, BCD has implemented a multi-faced surveillance and epi response to COVID-19 to track the pandemic and provide key data to Department and City leadership to guide the response. Surveillance reports are produced daily to track case counts, hospitalization, deaths and per cent positivity and to proactively monitor impact on population groups at higher risk for more severe outcomes, including persons of color and persons living in high poverty areas of the City. Activities have been numerous and include case and cluster investigations in congregate residential and other nonresidential settings (including schools and worksites), special epidemiologic studies (home deaths, mortality case control study, risk exposure case control study, pediatric spectrum of disease and investigations of re-infections and vaccine breakthroughs.
The Bureau of Immunization conducts activities to
promote the vaccination of all New Yorkers and prevent the occurrence and transmission of vaccine-preventable diseases. Key activities include vaccine distribution, clinical services, provider outreach and support, public communication, monitoring immunization coverage and school immunization compliance, prevention of perinatal hepatitis B infection, surveillance of vaccine-preventable diseases, outbreak response to prevent or control the spread of disease, and maintaining the Citywide Immunization Registry (CIR).
In May 2020, the Bureau began planning for COVID-19 vaccination availability and most Bureau staff have been deployed to work on this effort, including equitably planning for, allocating, distributing, administering and tracking uptake of COVID-19 vaccines. In 2021, the Bureau will continue to work on COVID-19 vaccine distribution, catch-up children on routine vaccinations missed during the COVID-19 pandemic, conduct vaccine accountability activities, promote influenza vaccination, work to increase coverage with Advisory Committee on Immunization Practices (ACIP)-recommended vaccines for adults and human papillomavirus (HPV) vaccine for adolescents, promote CIR clinical decision support and reminder-
recall tools to help achieve on-time vaccination of children and adolescents, and implement expanded school vaccine requirements. We also anticipate incorporating COVID-19 vaccination activities into routine immunization work.
The Bureau of Division Management and Systems
Coordination (BDMSC) manages all human resources activities and fiscal administration for the Division of Disease Control’s seven bureaus. BDMSC also develops and implements innovative initiatives for surveillance, informatics, and emergency preparedness; facilitates collaborative and cross-cutting activities between the Division’s bureaus, aiming to provide comprehensive information to medical providers and the public; and, focuses on programs and projects for priority populations such as racial and ethnic communities, immigrants, LGBQ and transgender and gender non-conforming (TGNC) New Yorkers. The team maintains a portfolio of communications projects, policy initiatives, research projects, community engagement activities that address quality improvement and health equity, and efforts to standardize data collection across all Division programs.
Environmental Health Services
The Department’s Division of Environmental Health (EH) prevents and controls illness and injury related to environmental and occupational health risks through outreach and education, surveillance and enforcement. EH permits and inspects facilities including restaurants, mobile food carts and trucks, child care programs, beaches and pools; monitors air and drinking water quality; addresses the impact of our changing climate on health; investigates and prevents elevated blood lead levels; oversees the City’s animal shelter system; controls mosquitoes and rats; and promotes housing quality, among other environmental health activities.
The 2022 budget reflects continued commitment
to these and other initiatives.
Emergency Preparedness and Response
The Department envisions a healthy, resilient City in which all New Yorkers are able to achieve and maintain optimal and equitable health outcomes before, during, and after emergencies. The Department’s Office of Emergency Preparedness and Response (OEPR) aims to advance DOHMH's and NYC's ability to prevent, prepare for, respond to, and recover from the

Analysis of Agency Budgets Fiscal Year 2022
150
health impact of emergencies by partnering with City agencies, the health care sector and the community. OEPR plans for critical public health field operations to ensure both life safety and positive health outcomes for all New Yorkers during and after an emergency, including planning for Points of Dispensing (POD) to rapidly distribute lifesaving medication to New Yorkers and Post Emergency Canvassing Operations (PECO) to canvass residents sheltering in place following a public health threat. OEPR prepares for and conducts large-scale public health operations such as these through the conduct of field exercises, trainings, and the development of operational plans and Citywide staffing lists that include thousands of staff from over 30 agencies. The Department also continues to enhance the capacity of the healthcare system, through collaboration with NYC hospitals, healthcare coalitions, long-term care and primary care facilities, to effectively respond to emergencies in a manner that promotes continuity of care for all New Yorkers. Specifically, to increase the City’s capacity to address infectious disease threats, OEPR partners with the City healthcare system to ensure the ability to assess/treat patients with emerging infectious disease and prevent healthcare associated infections. The Department is also dedicated to strengthening overall community resilience through partnerships with community networks, leaders and organizations which ensures that there are mechanisms to incorporate community input into the Department’s preparedness plans and to enhance coordination with the community during an emergency. For the COVID-19 response, OEPR continues to lead DOHMH Incident Command System (ICS) coordination including close collaboration with health care, community, and agency partners to ensure an equitable response with a focus on engaging community and clinical partners in neighborhoods most impacted by the pandemic. OEPR staff serve key roles in a number of DOHMH’s ICS emergency response groups, including, but not limited to, Incident Commander (IC), Public Information Officer (PIO), Equity Task Force, Continuity of Operations (COOP), Healthcare Services Support Branch (HSSB), Planning, and Citywide Health Emergency Field Operations (CHEFO) – which includes the conduct of complex, critical public health field operations at the NYC Vaccination Hubs/PODs and, in 2020, NYC isolation hotel operations and the distribution of critical personal protective equipment (PPE) and other life-saving medical equipment to health care facilities at the height of the pandemic. Through these efforts, the agency will continue to build the City’s ability to recover from any emergency that impacts the health of New Yorkers.
Epidemiology
The Division of Epidemiology provides epidemiologic information, support, and training to inform policy and program decision-making, monitor health conditions, and improve delivery of public health services in New York City. Key activities in the Division include:
• Systematic collection, analysis, and dissemination of data on health issues citywide and among special populations and provision of training and support for specialized analyses and targeted studies;
• Registration, processing and analysis of all vital events in New York City, including births, deaths, and spontaneous and induced terminations of pregnancy;
• Enhancement of public health knowledge and skills of public health staff, students and trainees through in-person and e-learning courses, internships, and lecture series;
• Education of healthcare providers in New York City and training of medical students and clinical residents to improve public health knowledge and skills; and
• Establishment and maintenance of the World Trade Center Health Registry — a cohort of more than 71,000 people directly exposed to the WTC disaster — to identify and track the long-term physical and mental health effects and unmet health needs of 9/11.
In the coming year, the Division of Epidemiology will continue to work in collaboration with other programs within the Department to support the City’s COVID-19 response, including the collection and analysis of death data during the pandemic. In addition, the Division will continue to expand its public health surveillance approaches, including conducting additional population surveys through Healthy NYC, a new mechanism for engaging a representative panel of New Yorkers. Additionally, the Division will continue to develop and reinforce its racial equity work across the division, including developing an equity action plan for the Division’s equity work, revamping recruitment and hiring processes to reduce bias, normalizing conversations about race, racism and racial equity, and employing a racial equity project planning tool across division projects.

Analysis of Agency Budgets Fiscal Year 2022
151
Family and Child Health
The Department’s Division of Family and Child Health is charged with the creation and oversight of programs, policies, services, and environments that support physical and socio-emotional health, and promote primary and reproductive health services, health equity, social justice, safety and well-being for New York City families and children. The Division is comprised of the Bureau of Maternal, Infant and Reproductive Health (BMIRH), the Office of School Health (OSH), a Bureau of Administration, and the Bureau of Early Intervention (BEI).
The vision of the Division of Family and Child Health
is that every child, woman and family in New York City recognizes their power and is given the opportunity to reach their full health and developmental potential. To advance this vision, the Division implements evidence-based and evidence-informed programs, services and policies, and conducts innovative research and ongoing surveillance to achieve equitable and improved maternal, infant and reproductive health outcomes; promotes early childhood health and development and reduce adverse childhood experiences for young children; and assures that schoolchildren are healthy and ready to learn every day.
As part of its focus on improving maternal, infant
and reproductive health, the Division continues to work with City hospitals through the Maternal Hospital Quality Improvement Network, and the New York City Breastfeeding Hospital Collaborative to implement evidence-based practices to increase breastfeeding initiation, duration and exclusivity. The Division provides home visiting services for mothers, infants and families, including those residing in homeless shelters, through Nurse Family Partnership, the Newborn Home Visiting Program and the Newborn Home Visiting Program’s Shelter Initiative Model, which was fully implemented in 2016. The Division also partners with over 50 community based organizations through its Sexual and Reproductive Justice Community Engagement Group, to implement initiatives to assure that all people have the power and resources to make healthy decisions about their bodies, sexuality, and reproduction. The Division maintains its multifaceted approach to ensuring that all individuals have access to quality, comprehensive services, including the full
range of FDA-approved contraceptive methods, and resources so that they can make informed decisions about their sexual and reproductive health. This includes working with hospitals through the Quality Improvement Network for Contraceptive Access to increase access to contraception in post-partum, post-abortion and primary care settings.
The Office of School Health (OSH) is a joint
program of the Department of Education and the Department of Health and Mental Hygiene responsible for promoting the health of the 1.1 million school children enrolled in approximately 1,800 public and non–public schools in the New York City. Services to students include case management of chronic health problems, preventive health screening, urgent care, medication administration, preventive counseling, health education, referral for care, and assurance of ongoing effective treatment.
The Division maintains its multifaceted approach
to reduce unintended pregnancy, including providing school-located services to increase the number of adolescents receiving high quality reproductive health services via the School-Based Health Center Reproductive Health Project and Connecting Adolescents to Comprehensive Healthcare (CATCH) program. Both of these programs provide critical school-located reproductive health services to high school students. The Office of School Health Community Schools initiative, which increases vital school-located services in 227 schools serving high-need students, also provides on-site expanded vision, asthma case management, oral health, and mental health services.
The Early Intervention (EI) program identifies
and serves children from birth to age three years with developmental delays or disabilities and supports families to manage their children’s needs and support their development. The Division coordinates the development of each family’s Individualized Family Service Plan and authorizes all services such as speech therapy, special instruction, and physical and occupational therapy to more than 30,000 children and their families annually. All EI services are voluntary and provided at no cost to families, regardless of income, immigration, or insurance status.

Analysis of Agency Budgets Fiscal Year 2022
152
Office of Chief Medical Examiner
Working closely with the New York Police Department (NYPD) and the District Attorney’s Offices, the independent Office of Chief Medical Examiner (OCME) is responsible for the investigation of persons who die within New York City from criminal violence; by casualty or by suicide; suddenly, when in apparent good health; when unattended by a physician; in a correctional facility; or in any suspicious or unusual manner. The OCME is also responsible for coordinating the burial of unclaimed or unidentified bodies of adults and children each year.
The OCME houses the nation’s largest public forensic DNA laboratory, responsible for performing DNA analysis on nearly every category of crime occurring in the City, including homicide, rape, property crime, and weapons cases. Due to the large volume of casework the laboratory processes each year, the OCME is the largest contributor of forensic crime scene DNA profiles in the country. These profiles are uploaded to the national FBI DNA database, CODIS. The DNA Laboratory is also the only public
laboratory in the country accredited to perform High Sensitivity Testing, a test requiring a very small amount of DNA. The OCME provides this type of test to other jurisdictions in the country that do not have the capabilities of OCME’s laboratory.
The OCME also plays a key role in planning and leading efforts in the event of a mass fatality incident. Working closely with the NYPD, OEM, DEP, and FDNY, the OCME has developed inter-agency teams and protocols to respond to and mitigate the effects of a mass fatality disaster. To this end, the OCME is spearheading a multi-state effort to prepare the region in the event there is another large scale incident in the Metropolitan New York area such as a plane crash, terrorist attack, or an outbreak of pandemic influenza. In the case of an infectious disease outbreak, the health of survivors and the family members of the deceased are of paramount importance to stem possible spread.
Finally, the OCME is the custodian of all unclaimed or unidentified World Trade Center (WTC) remains and will continue to identify additional victims of the World Trade Center Disaster.
Capital Review
The 2022-2031 Ten-Year Capital Strategy totals $1.1 billion which includes $909.9 million in the 2022-2025 Four-Year Plan. The plan includes allocations for renovating facilities, new construction, information technology improvements, and the purchase of equipment. The focus of the Department’s 2022-2031 Ten-Year Capital Strategy is to identify, prioritize and support immediate needs for code compliance and other renovations at the City’s public health facilities and technology investments that are essential in providing critical public health services.
The table below shows capital commitments by program area over the 2022 - 2025 period.
Capital Commitments($ in 000’s)
_______________________________________________________________________________________________________________________________________________________________________________________________________________
2020 2021 2022 2023 2024 2025 Actual Plan Plan Plan Plan Plan ________________________ ___________ ____________ ________________________ _______________________ ________________________ _______________________
City All City All City All City All City All City All Funds Funds Funds Funds Funds Funds Funds Funds Funds Funds Funds Funds _______________________________________________________________________________________________________________________________________________________________________________________________________________
Administration ........................... $4,373 $4,373 $877 $877 $546 $546 $1,378 $1,378 $3,692 $3,692 $16,500 $16,500 Animal Care ............................... $9,537 $9,537 $5,691 $5,691 $43,074 $43,074 $31,729 $31,729 $34,689 $34,689 $6,000 $6,000 Renovations ................................ $15,626 $15,826 $45,316 $45,448 $50,878 $50,890 $18,559 $18,559 $7,430 $7,430 $10,643 $10,691 Equipment .................................. $5,006 $5,006 $13,971 $13,971 $51,777 $51,777 $12,275 $12,277 $19,995 $19,995 $1,287 $1,287 Information Technology ............. $2,028 $2,530 $10,992 $12,427 $1,848 $2,107 $8,392 $9,326 $8,956 $10,047 $8,846 $9,940 Laboratories ............................... $9,731 $9,731 $63,005 $63,005 $170,000 $170,000 $125,765 $125,765 $120,020 $120,020 $120,020 $120,020 OCME ........................................ $3,123 $3,149 $3,923 $4,239 $4,719 $4,719 $10,196 $10,196 $3,775 $3,775 $13,460 $13,460 ___________ ___________ ___________ ___________ ___________ ___________ ___________ ___________ ___________ ___________ ___________ ___________
Total ........................................... $49,424 $50,152 $143,775 $145,658 $322,842 $323,113 $208,294 $209,230 $198,557 $199,648 $176,756 $177,898 ========= ========= ========= ========= ========= ========= ========= ========= ========= ========= ========= =========
_______________________________________________________________________________________________________________________________________________________________________________________________________________

Analysis of Agency Budgets Fiscal Year 2022
153
Highlights of the 2022 Capital Commitment Plan:
The Department’s 2022 Capital Commitment Plan features several important projects, including:
• A new Public Health Laboratory ($170 million).
• Animal care centers and other animal welfare investments ($43 million).
• Technology and laboratory equipment upgrades for the Office of the Chief Medical Examiner ($4.7 million).
Highlights of the 2022-2025 Four-Year Plan Capital Strategy:
The Department’s 2022-2025 Four-Year Capital Strategy features several important projects, including:
• A new Public Health Laboratory ($535.8 million).
• Renovation of various public health facilities ($87.5 million).
• One new full-service animal care center in the Bronx, upgrades to the animal care centers in Brooklyn and Manhattan, and other animal welfare investments ($115.5 million).
• Information technology improvements, which include upgrades to the Department’s network and security and systems, and the purchase of critical technologies needed to maintain and improve services ($31.4 million).
• Purchase of equipment and vehicles, and upgrades of IT infrastructure within the Office of Chief Medical Examiner ($32.2 million).
Highlights of the 2022-2031 Ten-Year Plan Capital Strategy
The Department’s 2022-2031 Ten-Year Capital Strategy features several important projects, including:
• A new Public Health Laboratory ($535.8 million).
• Renovation of various public health facilities ($163.5 million).
• One new full-service animal care center in the Bronx, upgrades to the animal care centers in Brooklyn and Manhattan, and other animal welfare investments ($115.5 million).
• Information technology improvements, which include upgrades to the Department’s network and security and systems, and the purchase of critical technologies needed to maintain and improve services ($77.3 million).
• Purchase of equipment and vehicles, and upgrades of IT infrastructure within the Office of Chief Medical Examiner ($64.2 million).

Analysis of Agency Budgets Fiscal Year 2022
154
FIRE DEPARTMENT
The Fire Department is responsible for protecting the lives and property of the citizens of New York City while responding to fire, medical and other emergencies, and investigating building hazards. The Fire Department extinguishes fires, promotes fire prevention awareness, investigates suspicious fires, provides ambulance and emergency medical services, and conducts building safety inspections. The Department currently has 357 fire units that provide fire, rescue, and emergency medical services. The agency also promotes fire prevention through public outreach and enforcement of New York City’s Fire Code. The Department’s Fire Marshals investigate fires and apprehend arsonists. The Bureau of Emergency Medical Services (EMS), assisted by the Certified First Responder (CFR) trained personnel responding from engine companies, provides pre-hospital emergency medical care and ambulance transport, where required.
Financial Review
The Fire Department’s 2022 Executive Budget provides for operating expenses of $2.2 billion, a decrease of $55 million from the amount forecasted for 2021. This variance is driven largely by Federal grant funding that has not been reflected in 2022.
Capital commitments of $207 million are also provided in 2022. This represents an increase of $55 million from the amount forecasted for 2021. The 2022 forecast is higher primarily due to higher planned commitments for communications technology and facilities upgrades.
Revenue Forecast
The Fire Department issues permits and collects fees for the inspection of fire suppression and electrical systems, places of public assembly, laboratories, high-rise buildings, review of fire protection plans, and the storage and use of combustible materials. In addition, the Department realizes revenues from fees charged to private fire alarm companies and to out-of-state fire insurers that issue policies in New York City. In 2022, the revenue estimate for the Fire Department is $103.5 million.
The Department also collects revenue from Emergency Medical Services (EMS) ambulance transports. In 2022, total EMS revenue is projected at $376M million. EMS is expected to receive more revenue in 2022 compared to 2021 due to efforts by the Department to increase reimbursement for ambulance transport.
Expense Budget Highlights
Budgetary Priorities: Providing Core Services
• Continue to provide fire extinguishment and rescue services, investigate suspicious fires, promote fire prevention, and conduct building safety inspections.
• Continue to provide on-site emergency medical care and ambulance transport services Citywide.
• Maintain the Department’s public CPR training program through 2022, in partnership with NYC Service.
• Expand Mental Health teams and training to respond to non-violent 911 mental health emergencies, at a cost of $51.0 million.
• Additional funding to purchase new defibrillators and other life safety equipment, at a cost of $12.0 million.

Analysis of Agency Budgets Fiscal Year 2022
155
2021 20222020
Actual2021
ForecastPreliminary
BudgetExecutive
Budget Forecast Preliminary
BudgetExpenditures
Salary and Wages ……….. $1,863,397 $1,881,051 $1,840,967 $1,892,800 $11,749 $51,833Fringe Benefits …………… 20,037 25,777 21,738 21,734 (4,043) (4) OTPS ……………...……… 291,063 320,347 228,835 257,344 (63,003) 28,509 Total ……………...……… $2,174,497 $2,227,175 $2,091,540 $2,171,878 ($55,297) $80,338
FundingCity ……………...………… $1,668,796 $1,706,237 $1,662,291 $1,691,116 ($15,121) $28,825Other Categorical Grants … 189,209 343,312 376,204 376,204 32,892 — IFA ……………...………… 467 564 567 567 3 — State ……………...……… 2,459 2,269 1,835 1,835 (434) — Federal CD ……………...… — — — — — — Federal Other ……………. 309,633 173,895 50,637 101,637 (72,258) 51,000 Intra-City Other …………… 3,933 898 6 519 (379) 513 Total ……………...……… $2,174,497 $2,227,175 $2,091,540 $2,171,878 ($55,297) $80,338
Additional Costs Centrally FundedPersonal Services (PS) Fringe Benefits ………… $739,923 $774,764 $752,010 $898,131 $123,367 $146,121 Pensions ……………...… 1,502,533 1,546,205 1,648,674 1,648,674 102,469 — Other Than Personal Service (OTPS) Debt Service ……………. 188,240 177,567 206,217 247,900 70,333 41,683 Total Additional Costs $2,430,696 $2,498,536 $2,606,901 $2,794,705 $296,169 $187,804
FundingCity ……………...………… 2,195,993 2,375,502 2,555,685 2,612,320 236,818 56,635 Non-City ……………...…… 234,703 123,034 51,216 182,385 59,351 131,169
Full Agency Costs (including Central Accounts)Salary and Wages ………… $1,863,397 $1,881,051 $1,840,967 $1,892,800 $11,749 $51,833Fringe Benefits …………… 759,960 800,541 773,748 919,865 119,324 146,117 Pensions ……………...…… 1,502,533 1,546,205 1,648,674 1,648,674 102,469 — Total PS ……………...…… $4,125,890 $4,227,797 $4,263,389 $4,461,339 $233,542 $197,950
OTPS ……………...……… $291,063 $320,347 $228,835 $257,344 ($63,003) $28,509Debt Service …………….. 188,240 177,567 206,217 247,900 70,333 41,683 Total OTPS $479,303 $497,914 $435,052 $505,244 $7,330 $70,192
Total Agency Costs ……… $4,605,193 $4,725,711 $4,698,441 $4,966,583 $240,872 $268,142Less Intra-City …………… $3,933 $898 $6 $519 ($379) $513Net Agency Cost ………… $4,601,260 $4,724,813 $4,698,435 $4,966,064 $241,251 $267,629
FundingCity ……………...………… 3,864,789 4,081,739 4,217,976 4,303,436 221,697 85,460 Non-City ……………...…… 736,471 643,074 480,459 662,628 19,554 182,169
Personnel (includes FTEs at fiscal year-end)City ……………...………… 17,353 17,282 17,228 17,326 44 98 Non-City ……………...…… 127 130 122 122 (8) — Total ……………...……… 17,480 17,412 17,350 17,448 36 98
Summary of Agency Financial Data The following table compares 2022 Executive Budget with the 2022 Preliminary Budget, the 2021 forecast and actual expenditures for 2020, including fringe benefits, pensions, and debt service.
2022Increase/(Decrease)($ in 000's)

Analysis of Agency Budgets Fiscal Year 2022
156
Programmatic Review and Service Impact
Capital Review
The 2022-2031 Ten-Year Capital Strategy totals $1.4 billion, which includes $851 million in the 2022-2025 Four-Year Plan. This funding will be used for the purchase of fire-fighting apparatus, support vehicles, fire suppression and emergency medical equipment, the renovation and modernization of firehouses and other facilities, and the upgrade and replacement of computer and communications systems. The table below reflects capital commitments by program area over the 2022-2025 period.
Capital Commitments($ in 000’s)
_______________________________________________________________________________________________________________________________________________________________________________________________________________
2020 2021 2022 2023 2024 2025 Actual Plan Plan Plan Plan Plan ________________________ ___________ ____________ ________________________ _______________________ ________________________ _______________________
City All City All City All City All City All City All Funds Funds Funds Funds Funds Funds Funds Funds Funds Funds Funds Funds_______________________________________________________________________________________________________________________________________________________________________________________________________________
Communications ................... $399 $7,672 $23,345 $40,423 $26,048 $56,851 $8,207 $34,014 $4,192 $30,001 $1,078 $1,078Electronic Data Processing ... 15,152 15,152 22,300 22,300 19,781 19,781 18,000 18,000 15,000 15,000 6,850 6,850Reconstruction/Modernizationof Facilities ............................ 19,336 19,336 28,818 28,818 54,874 58,116 106,043 106,043 83,402 83,402 46,520 46,520Vehicles and Equipment ....... 72,514 72,483 60,786 60,786 71,457 72,357 119,646 119,646 76,405 76,405 106,745 106,745 ___________ ___________ ___________ ___________ ___________ ___________ ___________ ___________ ___________ ___________ ___________ ___________
Total ...................................... $107,401 $114,643 $135,249 $152,327 $172,160 $207,105 $251,896 $277,703 $178,999 $204,808 $161,193 $161,193 ========= ========= ========= ========= ========= ========= ========= ========= ========= ========= ========= =========
_______________________________________________________________________________________________________________________________________________________________________________________________________________
In 2022 the Department expects that 90 percent of the responses by fire companies will be to potentially life threatening medical and other non-fire emergencies. The Department’s Citywide response time to structural fires is projected to be about four minutes and 23 seconds in 2022. The Department anticipates that its ambulances will respond to over 1.3 million medical incidents in 2022.
Fire Extinguishment
The Fire Department currently provides fire and rescue operations via 357 units consisting of 197 engine companies, 143 ladder companies, eight squads, five rescue units, three marine companies, and one hazardous materials unit.
Emergency Medical Services
The Department is budgeted for 805 daily ambulance tours. Engine company personnel have received CFR training, and re-certification continues for those whose initial certification will expire.
Fire Prevention
The Bureau of Fire Prevention is responsible for enforcing the City’s Fire Code through the inspection of public and private properties.
Fire Investigation
The Bureau of Fire Investigation is responsible for investigating and determining the cause and origin of all suspicious fires, and for the apprehension of arsonists. The Department will deploy 110 City-funded Fire Marshals and 26 City-funded Supervising Fire Marshals to field duty in 2020.
Emergency Communication
The City continues work on Stage 2 of planned upgrades and enhancements to its 9-1-1 Emergency System. The majority of the capital funding for this initiative, known as the Emergency Communications Transformation Program (ECTP), is contained within DoITT’s budget. This stage of ECTP entails a new, consolidated Fire and EMS dispatch system in a second, fully redundant Public Safety Answering Center (PSAC2) in the Bronx. NYPD call taking operations commenced at PSAC2 in June 2016, and FDNY call taking and EMD operations at PSAC2 went live in 2018 for all boroughs. Enhanced public safety systems, such as FireCAD and Joint Operations Center (JOC), are being deployed and EMSCAD implementation is expected to begin shortly after.

Analysis of Agency Budgets Fiscal Year 2022
157
Highlights of the 2022-2031 Ten-Year Capital Strategy and 2022-2025 Four-Year Plan
• The renovation of firehouse components such as boilers, electrical systems, kitchens, roofs, bathrooms, waterproofing, apparatus doors, floors, and windows; construction, and renovation; and support facility reconstruction ($476 million), inclusive of $241 million in the 2022-2025 Four-Year Plan.
• Improvements to the EMS Academy at Fort Totten ($53 million).
• The replacement of front-line fire-fighting apparatus according to mandated replacement cycles as well as support vehicles and equipment ($633 million) inclusive of $375 million in the 2022-2025 Four-Year Plan.
• The replacement of conduit, wiring and alarm boxes in inundation zones for the Department’s outside cable plant that was damaged during Hurricane Sandy ($91 million).
• The upgrade of 9-1-1 communications system infrastructure as it approaches the end of its useful life ($20 million).
• The replacement of end of life information technology and communications equipment ($139 million) inclusive of $70 million in the 2022-2025 Four-Year Plan.
The 2022 Plan for the Department totals $207 million and highlights include:
• The renovation of firehouse components such as boilers, electrical systems, kitchens, roofs, bathrooms, waterproofing, apparatus doors, floors, and windows; construction, and renovation; and support facility reconstruction ($58 million).
• The replacement of front-line fire-fighting apparatus according to mandated replacement cycles as well as support vehicles and equipment ($72 million).
• The replacement of conduit, wiring, and alarm boxes in inundation zones for the Department’s outside cable plant that was damaged during Hurricane Sandy ($34 million).
• The purchase of mobile radios to enhance emergency response capabilities ($18 million).
• The upgrade of 9-1-1 communications system infrastructure as it approaches the end of its useful life ($7 million).
• The replacement of end of life information technology and communications equipment ($17 million).

Analysis of Agency Budgets Fiscal Year 2022
158
DEPARTMENT OF SANITATION
As one of the oldest and largest public solid waste organizations in the United States, the Department of Sanitation maintains sanitary conditions and enforces sanitary compliance through street cleaning and the collection, management, recycling, and disposal of municipal solid waste in the City’s 59 Community Districts.
Financial Review
The Department of Sanitation’s 2022 Executive Budget provides for operating expenses of $1.83 billion, a decrease of $606 million from the 2021 forecast, primarily due to one-time funding in 2021 for COVID-19 emergency food programs. As the severity of the pandemic wanes and participation in emergency food programs declines, responsibility and funding for food programs will transition away from the Department of Sanitation.
Capital commitments of $209 million are also provided in 2022, a decrease of $76 million from the 2021 Plan amount, primarily due to lower planned commitments for facility construction.
Revenue Forecast
The Department of Sanitation generates revenue from contracts for the removal of abandoned vehicles from City streets and property, from the sale of recycled paper and metal to private processors, and from an assortment of miscellaneous fees and minor sales. The Department's 2022 revenue estimate is $15.3 million from these sources.
Expense Budget Highlights
Budgetary Priorities: Providing Core Services
• Continue to provide curbside and containerized refuse and recycling collection service to residential properties and eligible institutions.
• Continue maintaining the cleanliness of the City by sweeping approximately 6,300 miles of streets and collecting waste from 25,000 litter baskets located at street corners Citywide.
• Respond to winter weather emergencies and keep the City’s streets clear of snow and ice. Due to a heavier snow season, the cost of clearing snow and ice was higher than the previous five-year spending average. As a result, the 2021 snow budget has been increased to $145 million. The Department’s 2022 snow removal budget is $89 million, based on the previous five-year spending average, as required by the City Charter.

Analysis of Agency Budgets Fiscal Year 2022
159
2021 20222020
Actual2021
ForecastPreliminary
BudgetExecutive
Budget Forecast Preliminary
BudgetExpenditures
Salary and Wages ……….. $1,026,818 $1,140,696 $999,304 $1,035,124 ($105,572) $35,820Fringe Benefits …………… 39,355 44,767 43,627 44,061 (706) 434 OTPS ……………...……… 1,037,032 1,246,012 695,850 746,419 (499,593) 50,569 Total ……………...……… $2,103,205 $2,431,475 $1,738,781 $1,825,604 ($605,871) $86,823
FundingCity ……………...………… $1,695,294 $1,883,494 $1,722,629 $1,300,384 ($583,110) ($422,245)Other Categorical Grants … 6,321 1,053 750 750 (303) — IFA ……………...………… 5,871 5,687 5,703 5,710 23 7 State ……………...……… 2,620 — — — — — Federal CD ……………...… — 593 — — (593) — Federal Other ……………. 377,081 536,780 — 509,061 (27,719) 509,061 Intra-City Other …………… 16,018 3,868 9,699 9,699 5,831 — Total ……………...……… $2,103,205 $2,431,475 $1,738,781 $1,825,604 ($605,871) $86,823
Additional Costs Centrally FundedPersonal Services (PS) Fringe Benefits ………… $333,170 $433,231 $412,677 $479,945 $46,714 $67,268 Pensions ……………...… 293,882 299,483 312,946 312,946 13,463 — Other Than Personal Service (OTPS) Debt Service ……………. 282,298 270,610 314,271 341,010 70,400 26,739 Total Additional Costs $909,350 $1,003,324 $1,039,894 $1,133,901 $130,577 $94,007
FundingCity ……………...………… 874,138 926,219 1,020,716 1,053,550 127,331 32,834 Non-City ……………...…… 35,212 77,105 19,178 80,351 3,246 61,173
Full Agency Costs (including Central Accounts)Salary and Wages ………… $1,026,818 $1,140,696 $999,304 $1,035,124 ($105,572) $35,820Fringe Benefits …………… 372,525 477,998 456,304 524,006 46,008 67,702 Pensions ……………...…… 293,882 299,483 312,946 312,946 13,463 — Total PS ……………...…… $1,693,225 $1,918,177 $1,768,554 $1,872,076 ($46,101) $103,522
OTPS ……………...……… $1,037,032 $1,246,012 $695,850 $746,419 ($499,593) $50,569Debt Service …………….. 282,298 270,610 314,271 341,010 70,400 26,739 Total OTPS $1,319,330 $1,516,622 $1,010,121 $1,087,429 ($429,193) $77,308
Total Agency Costs ……… $3,012,555 $3,434,799 $2,778,675 $2,959,505 ($475,294) $180,830Less Intra-City …………… $16,018 $3,868 $9,699 $9,699 $5,831 $—Net Agency Cost ………… $2,996,537 $3,430,931 $2,768,976 $2,949,806 ($481,125) $180,830
FundingCity ……………...………… 2,569,432 2,809,713 2,743,345 2,353,934 (455,779) (389,411) Non-City ……………...…… 427,105 621,218 25,631 595,872 (25,346) 570,241
Personnel (includes FTEs at fiscal year-end)City ……………...………… 9,873 9,556 9,677 9,846 290 169 Non-City ……………...…… 53 58 58 117 59 59 Total ……………...……… 9,926 9,614 9,735 9,963 349 228
Summary of Agency Financial Data The following table compares 2022 Executive Budget with the 2022 Preliminary Budget, the 2021 forecast and actual expenditures for 2020, including fringe benefits, pensions, and debt service.
2022Increase/(Decrease)($ in 000's)

Analysis of Agency Budgets Fiscal Year 2022
160
Programmatic Review and Service Impact
The Department’s main administrative and planning divisions include the Bureau of Financial Management and Administration and the Bureau of Recycling and Sustainability. The two operational divisions are the Bureau of Cleaning and Collection (BCC) and the Bureau of Solid Waste Management (SWM). The Bureau of Motor Equipment (BME) and the Bureau of Building Management (BBM) provide support operations.
Long Term Solid Waste Management
In accordance with the 2006 Solid Waste Management Plan (SWMP), the Department is nearing completion of a sustainable, resilient, and equitable five borough solid waste management system to replace existing short-term contracts and reduce truck traffic and greenhouse gas emissions by relying on barge or rail export of waste in clean, sealed containers. The Department has opened four converted Marine Transfer Stations and has procured all long-term contracts necessary to carry out the SWMP.
For Staten Island waste, the Department operates a facility at the closed Fresh Kills landfill that containerizes waste for rail transport via a rail link connecting Staten Island to the national rail freight network. In addition, the Department maintains long term solid waste management contracts with vendors to export refuse by rail for all of the Bronx, a portion of Brooklyn, and a portion of Queens.
Bureau of Recycling and Sustainability
The Department continues its efforts to reduce the quantity of solid waste that must be disposed. The Department currently operates a dual-stream recycling program that requires residents to separate metal, glass, and plastic (MGP) from paper and place it in bins, bags or bundles.
In 2021, the paper recycling program is anticipated to generate an average of $13.05 of revenue per ton from various vendors, or $4.6 million. The City is paying $71.70 per ton for MGP.
In 2022, the Department will resume curbside residential and school organics collection. The organics collection program diverts waste from landfills by establishing a separate waste stream for food scraps, yard waste, and other compostable materials. The Department will also expand organics drop-off, hazardous household waste, and reuse programs.
Bureau of Cleaning and Collection
The Bureau of Cleaning and Collection (BCC) is primarily responsible for collecting household refuse and recyclables, cleaning City streets, and enforcing recycling regulations and portions of the City’s health and administrative codes. During the winter, BCC is also responsible for the removal of snow from City streets. Currently, BCC provides refuse collection services two to three times a week depending on the population density of the community.
Bureau of Solid Waste Management
The Bureau of Solid Waste Management (SWM) is responsible for the receipt, transfer, transportation, and final disposal of refuse through its waste export contracts.
SWM is also responsible for the Fresh Kills landfill closure activities. The Financial Plan includes funds for closure activities including final capping of the landfill, leachate treatment and control, methane gas collection and flaring, maintenance and security of the site and waterways, and environmental monitoring.
Bureau of Motor Equipment
The Bureau of Motor Equipment (BME) provides services related to the acquisition, repair, and maintenance of the Department’s equipment including collection trucks, street sweepers, salt spreaders, snow melters, front-end loaders, and other vehicles and equipment. BME operates an extensive network of repair and maintenance facilities. This Bureau researches and develops equipment specifications to improve productivity, vehicle design, and to take advantage of the newest technologies including alternative fuel vehicles and emissions-reducing exhaust after-treatments.
Sanitation Facilities
The Bureau of Building Management (BBM) provides facility management services. BBM provides maintenance and emergency repair work for the Department’s facilities. BBM continues to work in conjunction with the New York Power Authority to reduce the Department’s overall electrical consumption, particularly peak loads during high temperature summer days.

Analysis of Agency Budgets Fiscal Year 2022
161
The Bureau of Facilities Planning and Engineering oversees Sanitation’s capital construction and reconstruction projects. Over the next four years, the Department is funded to initiate construction to replace the aging Bronx 9, 10, and 11 garage complex. The Department also has funding to begin construction of a new garage for Queens 1 on a site located within that district, which will improve service and alleviate Sanitation truck parking concerns where the garage is
currently located. Construction is underway on a project to relocate the undersized Staten Island 1 garage from a densely populated residential neighborhood to land near the former Fresh Kills landfill; the Department will also make improvements to the Staten Island 3 Garage and combine Districts 1 and 3 into a single garage complex. In addition, construction is underway on a project to construct a new Brooklyn 3 Garage.
Capital Review
The Department’s 2022-2031 Ten Year Capital Strategy totals $3.4 billion. The Plan provides the Department with funding to construct, rehabilitate, purchase, and develop the necessary infrastructure and assets to support refuse collection, recycling, cleaning, waste disposal, and support operations. The Department’s Capital Plan consists of four components — equipment purchases; solid waste management infrastructure renovation and construction; garage and facility rehabilitation, site acquisition, and construction; and information technology and telecommunications.
To support the Department’s collection and cleaning operations, garages and facilities will be constructed and rehabilitated. In accordance with the City’s Long Term Solid Waste Management Plan, the Department is renovating and constructing marine transfer stations. The Department continues to replenish its fleet, including collection trucks, dual-bin trucks, mechanical brooms, and salt spreaders in order to support operations.
The 2022-2031 Capital Strategy totals $3.4 billion, which includes $1.7 billion in the 2022-2025 Four-Year Plan. The table below shows capital commitments by program area over the 2021-2025 period.
Capital Commitments($ in 000’s)
_______________________________________________________________________________________________________________________________________________________________________________________________________________
2020 2021 2022 2023 2024 2025 Actual Plan Plan Plan Plan Plan ________________________ ___________ ____________ ________________________ _______________________ ________________________ _______________________
City All City All City All City All City All City All Funds Funds Funds Funds Funds Funds Funds Funds Funds Funds Funds Funds_______________________________________________________________________________________________________________________________________________________________________________________________________________
Solid Waste Management ..... $34,155 $34,478 $12,163 $12,163 $19,483 $19,483 $31,378 $31,993 $5,480 $5,480 $6,408 $6,408Garages and Facilities ........... 63,739 64,431 212,850 214,037 130,079 131,853 209,269 217,235 333,261 333,261 165,589 165,589Equipment ............................. 162,487 162,487 47,523 47,523 45,800 45,800 230,947 230,947 235,337 235,337 253,283 253,283Information Technology and Telecommunications ........... 5,441 5,441 11,197 11,197 12,278 12,278 5,615 5,615 4,607 4,607 3,500 3,500 ___________ ___________ ___________ ___________ ___________ ___________ ___________ ___________ ___________ ___________ ___________ ___________
Total ...................................... $265,822 $266,838 $283,733 $284,920 $207,640 $209,414 $477,209 $485,790 $578,685 $578,685 $428,780 $428,780 ========= ========= ========= ========= ========= ========= ========= ========= ========= ========= ========= =========
__________________________________________________________________________________________________________________________________________________________________________________________

Analysis of Agency Budgets Fiscal Year 2022
162
Highlights of the 2022-2031 Ten-Year Capital Strategy and 2022-2025 Four-Year Capital Plan
• Construction of a new garage for Bronx Community Districts 9, 10 and 11 ($287.6 million), $284.6 million of which is included in the 2022-2025 Four Year Plan.
• Construction of a new garage for Queens Community District 1 ($142.6 million), all of which is included in the 2022-2025 Four Year Plan.
• Construction of a new garage for Manhattan Community Districts 6 and 8 ($199.7 million), none of which is included in the 2022-2025 Four Year Plan.
• Construction and reconstruction of other garages and facilities ($574.8 million), of which $420.7 million is included in the 2022-2025 Four Year Plan.
• Construction and renovation of transfer stations and other facilities in accordance with the City’s Long Term Solid Waste Management Plan ($156 million), $63.4 million of which is included in the 2022-2025 Four Year Plan.
• Replacement of vehicles and other equipment ($1.9 billion), $765.4 million of which is included in the 2022-2025 Four Year Plan.
• Information technology and telecommunications ($49.8 million), $26 million of which is included in the 2022-2025 Four Year Plan.
The 2022 Capital Plan provides $209.4 million in 2022 including:
• Construction and reconstruction of various DSNY facilities, Citywide ($131.9 million).
• Construction and renovation of transfer stations and other facilities in accordance with the City’s Long Term Solid Waste Management Plan ($19.5 million).
• Replacement of vehicles and other equipment ($45.8 million).
• Information technology and telecommunications ($12.3 million).

Analysis of Agency Budgets Fiscal Year 2022
163
DEPARTMENT OF PARKS AND RECREATION
The Department of Parks and Recreation (DPR) is the steward of more than 30,000 acres of land, including nearly 5,000 individual properties, ranging from the Coney Island Boardwalk and Central Park to community gardens and greenstreets. The Department maintains and operates approximately 900 athletic fields, 1,000 playgrounds, 1,800 basketball courts, 700 tennis courts, and 550 community gardens. It also maintains and operates 65 public pools, 51 recreational facilities, 16 nature centers, 14 miles of beaches, 160 miles of waterfront parkland, and 14 golf courses. NYC Parks is also responsible for nearly 850 monuments, 23 historic house museums and the care and maintenance of nearly 700,000 street trees and an additional 2 million park trees.
Financial Review
The 2022 Executive Budget for the Department provides for operating expenses of $587.6 million. This represents a net increase of $25.4 million from the amount forecasted for 2021. The 2022 forecast is greater because it includes additional funding for programs in 2022, including the City Cleanup Corps. Capital commitments of $1.2 billion are also provided in 2022.
Revenue Forecast
The Department of Parks and Recreation issues recreational permits, collects revenue from marina rentals, and receives revenue generated by concessions operated on Parks property. The Department will collect $42.1 million from these sources in 2022.
Expense Budget Highlights
Budgetary Priorities: Providing Core Services
• Maintaining the City’s parks, playgrounds, infrastructure, and safety equipment, while ensuring acceptable ratings for the cleanliness and overall condition of parks.
• Sustaining parks through workforce transformation programs. Parks maintenance funding is also provided through the City’s Human Resources Administration for the Parks Opportunity Program. This program provides a workforce to assist in the maintenance and operation of park facilities and helps to train and employ public assistance recipients.
• Operating and employing lifeguards at pools and beaches during the summer months.
• Maintaining street trees, park flora and fauna including tree pruning, dead tree removal, reforestation, foresters, contract inspection, and administration to support a variety of forestry initiatives, including increasing the City’s tree inventory.
• Designing and supervising park construction. The 2022 budget includes the continuation of full-time positions in the Capital Projects Division for the design and construction of hundreds of parks projects, including parks, playgrounds, recreational and athletic fields, and tree planting.

Analysis of Agency Budgets Fiscal Year 2022
164
2021 20222020
Actual2021
ForecastPreliminary
BudgetExecutive
Budget Forecast Preliminary
BudgetExpenditures
Salary and Wages ……….. $433,645 $404,705 $414,171 $454,244 $49,539 $40,073Fringe Benefits …………… 3,451 6,734 3,234 3,251 (3,483) 17 OTPS ……………...……… 130,115 150,721 115,255 130,139 (20,582) 14,884 Total ……………...……… $567,211 $562,160 $532,660 $587,634 $25,474 $54,974
FundingCity ……………...………… $436,494 $391,524 $405,639 $418,554 $27,030 $12,915Other Categorical Grants … 14,223 17,194 7,328 7,325 (9,869) (3) IFA ……………...………… 52,175 52,351 54,672 54,733 2,382 61 State ……………...……… 941 2,274 442 492 (1,782) 50 Federal CD ……………...… 3,085 11,924 2,638 2,640 (9,284) 2 Federal Other ……………. 2,753 41,548 — 41,945 397 41,945 Intra-City Other …………… 57,540 45,345 61,941 61,945 16,600 4 Total ……………...……… $567,211 $562,160 $532,660 $587,634 $25,474 $54,974
Additional Costs Centrally FundedPersonal Services (PS) Fringe Benefits ………… $128,926 $141,810 $136,253 $165,826 $24,016 $29,573 Pensions ……………...… 70,812 76,827 82,285 82,285 5,458 — Other Than Personal Service (OTPS) Debt Service ……………. 446,543 396,877 460,910 453,799 56,922 (7,111) Total Additional Costs $646,281 $615,514 $679,448 $701,910 $86,396 $22,462
FundingCity ……………...………… 625,435 576,156 652,969 650,722 74,566 (2,247) Non-City ……………...…… 20,846 39,358 26,479 51,188 11,830 24,709
Full Agency Costs (including Central Accounts)Salary and Wages ………… $433,645 $404,705 $414,171 $454,244 $49,539 $40,073Fringe Benefits …………… 132,377 148,544 139,487 169,077 20,533 29,590 Pensions ……………...…… 70,812 76,827 82,285 82,285 5,458 — Total PS ……………...…… $636,834 $630,076 $635,943 $705,606 $75,530 $69,663
OTPS ……………...……… $130,115 $150,721 $115,255 $130,139 ($20,582) $14,884Debt Service …………….. 446,543 396,877 460,910 453,799 56,922 (7,111) Total OTPS $576,658 $547,598 $576,165 $583,938 $36,340 $7,773
Total Agency Costs ……… $1,213,492 $1,177,674 $1,212,108 $1,289,544 $111,870 $77,436Less Intra-City …………… $57,540 $45,345 $61,941 $61,945 $16,600 $4Net Agency Cost ………… $1,155,952 $1,132,329 $1,150,167 $1,227,599 $95,270 $77,432
FundingCity ……………...………… 1,061,929 967,680 1,058,608 1,069,276 101,596 10,668 Non-City ……………...…… 94,023 164,649 91,559 158,323 (6,326) 66,764
Personnel (includes FTEs at fiscal year-end)City ……………...………… 5,884 5,721 6,762 6,801 1,080 39 Non-City ……………...…… 603 846 706 1,683 837 977 Total ……………...……… 6,487 6,567 7,468 8,484 1,917 1,016
Summary of Agency Financial Data The following table compares 2022 Executive Budget with the 2022 Preliminary Budget, the 2021 forecast and actual expenditures for 2020, including fringe benefits, pensions, and debt service.
2022Increase/(Decrease)($ in 000's)

Analysis of Agency Budgets Fiscal Year 2022
165
Programmatic Review and Service Impact
The Department of Parks and Recreation provides clean, safe, attractive, and functional parks and public spaces for all New Yorkers to use and enjoy, with a range of recreational facilities and opportunities for all ages and abilities.
Caring for Parks
NYC Parks plans, builds, and cares for thriving parks and public spaces Citywide, and throughout the COVID-19 pandemic, parks continued to serve as a vital public space for all New Yorkers. Through the Parks Inspection Program (PIP), the Parks Department conducts 6,000 detailed park inspections throughout the year, as a way to consistently observe conditions encountered by the public. The results of these inspections are shared with senior management on a regular basis, guiding decisions regarding resource allocation, with the goal of improving the efficiency and effectiveness of daily operations. As measured by PIP, park and playground conditions were rated at 81 percent acceptable for overall condition and 86 percent acceptable for cleanliness in the first four months of FY 2021. Though these ratings fell short of targets set in the Preliminary Mayor’s Management Report, largely due to COVID-19 related budget considerations and a short-term decrease in the agency’s usual contingent of seasonal maintenance staff, ratings for play equipment and safety surfaces met or exceeded the 95 percent targets, due to a sustained focus on dedicated care.
NYC Parks is dedicated to strategic planning guided by a clear principle: distribute city resources in a fair and focused manner that reflects this administration’s commitment to equity. Parks’ signature equity effort and the centerpiece of this strategic blueprint is the Community Parks Initiative (or CPI), with more than $315 million dollars dedicated to delivering capital funding, enhanced programming, targeted improvements, and partnership development to support high need neighborhood parks. CPI funding allows the Parks Department to reimagine and re-create a total of 67 parks, and to date, NYC Parks has opened 58 newly reconstructed parks and playgrounds under this initiative.
To ensure that the City’s parks are beautiful, welcoming, and accessible to all New Yorkers, the department launched “Parks Without Borders,” an exciting new design initiative. This program focuses on the edges, entrances and adjacent spaces of city parks, where they most directly interact with the surrounding
community. The Parks Department is focused on creating more access to parks and creating more usable parkland by opening up entrances and edges and reclaiming unused park space. The Parks Department announced eight signature projects to showcase this new approach and has incorporated Parks Without Borders into ongoing projects wherever possible. Parks has completed six of the eight projects, and anticipates reopening the remaining sites soon.
Given the needs of a fast-growing city, a commitment to equity also means a need to continue improving our parks and playgrounds in all neighborhoods by updating aging infrastructure. The Parks Department announced a Mayoral investment of $150 million for major improvements at five large parks, one in each borough, known as the Anchor Parks Initiative. These parks act as anchors to their surrounding communities by providing large, diverse recreational resources. Anchor Parks will invest in new resources like soccer fields, comfort stations, running tracks and walking paths, transforming these parks for the 750,000 New Yorkers who live in the neighborhoods that surround them, and make these older parks feel new again. The Anchor Parks projects were created with input gathered at well-attended public scoping meetings, so that the priority improvements at each park have been shaped by the local residents that know these parks best. The initiative resulted in multi-phased project at the Anchor sites, four of which are already complete, with more nearing completion throughout the year.
Engaging the Community
NYC Parks works closely with residents, community partners and volunteers across the City to improve the park experience. Thanks to the efforts of the Parks Department divisions that focus on community engagement, including Partnerships for Parks and GreenThumb, which together work with nearly 2,000 community groups and other organizations, Parks is engaging New Yorkers in planning for the future of the park system, fostering broader community engagement in the design process, employing creative placemaking to develop dynamic community spaces and developing local stewardship of our city’s parks and public spaces. Even during COVID adjustments, when in-person community input meetings were not possible, we pivoted to digital engagement to ensure that the upcoming projects we continue to design are based on local residents’ guidance.

Analysis of Agency Budgets Fiscal Year 2022
166
Capital Review
The 2022-2031 Ten-Year Capital Strategy totals $5.6 billion which includes $4.9 billion in the 2022-2025 Four-Year Plan. The table below reflects capital commitments by program area over the 2022-2025 period.
Capital Commitments
($000’s)_______________________________________________________________________________________________________________________________________________________________________________________________________________
2020 2021 2022 2023 2024 2025 Actual Plan Plan Plan Plan Plan ________________________ ___________ ____________ ________________________ _______________________ ________________________ _______________________
City All City All City All City All City All City All Funds Funds Funds Funds Funds Funds Funds Funds Funds Funds Funds Funds_______________________________________________________________________________________________________________________________________________________________________________________________________________
Beaches and Boardwalks ...... $632 $778 $14,016 $20,104 $26,868 $81,185 $426 $1,092 $6,099 $6,099 $140,514 $140,514Land Acquisition and ............ Tree Planting ......................... 60,841 64,148 62,382 89,934 65,950 83,277 47,514 47,514 9,991 10,063 70,602 70,602Major Recreation Facilities and Facility Reconstruction ....... 15,831 12,924 70,166 82,000 155,690 167,058 14,782 22,361 90,814 160,341 600,544 600,544Neighborhood Parks andPlaygrounds ........................... 179,039 207,187 235,030 258,242 431,040 511,086 109,563 121,514 293,234 327,415 579,532 579,532Vehicles and Equipment ....... 13,896 13,896 16,648 17,153 15,379 15,379 3,881 3,881 2,145 2,145 90,751 90,751Large, Major and Regional ... Park Reconstruction ............ 34,691 33,928 351,915 372,798 311,050 335,052 180,937 239,428 431,185 434,703 797,182 797,182Zoos ....................................... — 0 7,327 7,327 12,429 12,429 8,803 8,803 383 383 13,409 13,409 ___________ ___________ ___________ ___________ ___________ ___________ ___________ ___________ ___________ ___________ ___________ ___________
Total ........................................... $304,930 $332,861 $757,484 $847,558 $1,018,406 $1,205,466 $365,906 $444,593 $833,851 $941,149 $2,292,534 $2,292,534 ========= ========= ========= ========= ========= ========= ========= ========= ========= ========= ========= =========
_______________________________________________________________________________________________________________________________________________________________________________________________________________

Analysis of Agency Budgets Fiscal Year 2022
167
Highlights of the 2020-2029 Ten-Year Capital Strategy and 2020-2023 Four-Year Plan
• Continued implementation of phases one and two of the Community Parks Initiative (CPI), which directs capital funding to historically underfunded parks in areas with high population density, high concentration of poverty, and above average population growth ($32.5 million). This funding is in addition to $303.4 million committed since 2014, and $30.1 million in planned commitments in 2021.
• Continued implementation of the Anchor Parks Initiative, which builds off of the Community Parks Initiative and directs capital funding to historically underfunded larger parks that are greater than six acres ($43.2 million). This funding is in addition to $112.2 million committed since 2017 and $13.5 million in planned commitments in 2021.
• Funding to continue closing the Walk to a Park gap, including the renovation of schoolyards to allow them to be opened to the public outside of school hours, and the acquisition and development as parkland of public partnership and private sites ($27.7 million).
• Rehabilitation of Parks-owned pedestrian bridges Citywide ($1.3 billion), including $348 million for the Riverside Park Amtrak Overbuild, $182.1 million for the construction of the E.14th Street Flyover Bridge, and $382.9 million for the reconstruction of 15 pedestrian bridges Citywide to ensure the safety and integrity of Parks-owned bridges.
• Planting of new street trees and park trees, the reforestation and restoration of natural areas and the repair of sidewalks damaged by trees Citywide ($211.8 million).
• Reconstruction of recreation centers Citywide ($657 million), including $141 million for the construction of the Shirley Chisholm Recreation Center in Brooklyn, $92 million for the construction of a recreation center in Roy Wilkins Park, $32.7 million for the reconstruction of Red Hook Recreation Center in Brooklyn, $21 million for the Hamilton Fish Recreation Center in Manhattan, $20 million for the Hansborough Recreation Center in Manhattan, and $349.8 million for the expansion and reconstruction of other recreation and nature centers Citywide.
The 2022 Plan for the Department totals $1.2 billion and highlights include:
• Reconstruction of the East River Esplanade Phase 4 ($92.5 million)
• Planting of new street trees and park trees, the reforestation and restoration of natural areas, and the repair of sidewalks damaged by trees Citywide ($81 million).
• Continued implementation of the Anchor Parks Initiative, including Fresh Kills South Park ($25.4 million)
• Continued implementation of the Community Parks Initiative ($19.6 million).
• Reconstruction of the Red Hook Ballfields and Recreation Area in Brooklyn ($13.2 million).
• Reconstruction of Flushing Meadows Corona Park in Queens ($12.9 million).
• Park development of Melrose Commons in the Bronx ($7.8 million).

Analysis of Agency Budgets Fiscal Year 2022
168
DEPARTMENT OF ENVIRONMENTAL PROTECTION
The primary mission of the Department of Environmental Protection (DEP) is to deliver drinking water; manage stormwater; treat wastewater; regulate air, noise, and asbestos pollution; and protect the environmental health, welfare, and natural resources of New York City and its residents. This includes managing the New York City water and sewer system. The New York City water system consists of 19 collecting reservoirs and three controlled lakes located within the 2,000 square miles of the Croton, Catskill, and Delaware watersheds, along with 7,000 miles of aqueducts, tunnels, and water mains that deliver more than 1.0 billion gallons of water per day, and seven upstate water pollution control plants. The New York City sewer system comprises a comprehensive network of 7,500 miles of sewers, 14 in-City Wastewater Resource Recovery Facilities (WRRFs), and 96 pump stations to convey and treat approximately 1.2 billion gallons per day of captured sewage to standards established by State and Federal law before releasing the effluent into receiving waters.
Financial Review
The Department of Environmental Protection’s 2022 Executive Budget provides for operating expenses of $1.5 billion. It also provides capital commitments of $22.0 billion to be financed by Water Finance Authority funds and $623.0 million in non-City funds.
Revenue Forecast
The Department collects revenue from permits, property rentals, and other fees. The Department also regulates air and noise quality, performs inspections, issues licenses and permits, and reviews technical plans related to asbestos control, air quality and noise abatement laws, and the storage of hazardous substances. The revenue estimate for 2022 is $18.9 million.
Expense Budget Highlights
Budgetary Priorities: Providing Core Services
• DEP supplies approximately 1.0 billion gallons of drinking water per day to over eight and a half million City residents and one million upstate residents and maintains the City’s water main and sewer infrastructure. Approximately 2,398 personnel and $611.3 million are dedicated to this function. In addition, there are 297 police and security force personnel ($35.1 million), including 221 environmental police officers, who protect the upstate watershed and respond to hazardous materials emergencies.
• The Department treats an average of 1.2 billion gallons of dry-weather sewage per day at the City’s 14 WRRFs. Approximately 1,823 personnel and $525.4 million are dedicated to this function.
• The Department continues to use various chemicals to ensure high quality drinking water for City and upstate residents and to protect the quality of waterbodies surrounding the City ($78.3 million).
• The Department continues to fund contracts for biosolids removal, transport, and disposal ($63.0 million).
• The Department continues to meet the terms under the Surface Water Treatment Rule for a Filtration Avoidance Determination (FAD) in the Catskill and Delaware Watersheds ($63.0 million). The City’s FAD includes programs which focus on agriculture and forestry, land management, flood hazard mitigation, and stormwater, stream, and wastewater management. The NYS Department of Health and the U.S. Environmental Protection Agency renewed the FAD in 2017 and it will be in effect for 10 years.
• The Department enforces the City’s air and noise codes in addition to asbestos regulations with 196 personnel and $15.8 million dedicated to this function.
• The Department will continue implementation of the City’s Green Infrastructure Plan with 210 personnel and $18.9 million dedicated to the purchase, installation, and maintenance of green infrastructure components. This includes funding for the installation of green infrastructure assets on non-City owned properties such as medical facilities, churches, and schools.
• The Department will ensure that the City is in compliance with the requirements set forth in the Municipal Separate Storm Sewer System (MS4) permit, which mandates the City to enforce inspection programs that address stormwater runoff from construction and development sites and from industrial or commercial facilities ($7.3 million).

Analysis of Agency Budgets Fiscal Year 2022
169
• The Department will hire 15 additional personnel to implement a proactive water main valve and leak detection inspection program, as well as a targeted sewer inspection program to reduce water main breaks and sewer backups, infrastructure damage and liability, and unaccounted/un-metered water ($3.0 million).
• The Department will hire seven additional personnel to form a dedicated cybersecurity team to protect critical Agency infrastructure, operations, and resources ($0.7 million).
Restructuring and Streamlining
The Department expects to achieve a savings of $4.6 million identified from refinement of agency contractual needs, procurement and programmatic efficiencies, and reevaluation of program budgetary needs.
• The Department has identified surpluses and re-estimates for various agency operations totaling $1.0 million.
• The Department will save $3.1 million by streamlining the agency’s fleet.
• The Department will save $0.5 million through reductions in overtime and vacancies.

Analysis of Agency Budgets Fiscal Year 2022
170
2021 20222020
Actual2021
ForecastPreliminary
BudgetExecutive
Budget Forecast Preliminary
BudgetExpenditures
Salary and Wages ……….. $605,966 $614,103 $603,164 $610,475 ($3,628) $7,311Fringe Benefits …………… 2,707 5,597 3,297 3,297 (2,300) — OTPS ……………...……… 774,140 872,157 778,280 906,064 33,907 127,784 Total ……………...……… $1,382,813 $1,491,857 $1,384,741 $1,519,836 $27,979 $135,095
FundingCity ……………...………… $1,254,811 $1,349,496 $1,315,002 $1,434,596 $85,100 $119,594Other Categorical Grants … 10,244 8,783 — — (8,783) — IFA ……………...………… 67,615 59,487 67,488 67,488 8,001 — State ……………...……… 694 4,763 — — (4,763) — Federal CD ……………...… 36,383 47,332 1,481 1,481 (45,851) — Federal Other ……………. 11,723 19,181 153 15,649 (3,532) 15,496 Intra-City Other …………… 1,343 2,815 617 622 (2,193) 5 Total ……………...……… $1,382,813 $1,491,857 $1,384,741 $1,519,836 $27,979 $135,095
Additional Costs Centrally FundedPersonal Services (PS) Fringe Benefits ………… $175,303 $208,263 $197,619 $241,540 $33,277 $43,921 Pensions ……………...… 95,075 104,763 114,586 114,586 9,823 — Other Than Personal Service (OTPS) Debt Service ……………. 47,527 65,366 75,912 55,564 (9,802) (20,348) Total Additional Costs $317,905 $378,392 $388,117 $411,690 $33,298 $23,573
FundingCity ……………...………… 303,566 338,442 369,036 355,444 17,002 (13,592) Non-City ……………...…… 14,339 39,950 19,081 56,246 16,296 37,165
Full Agency Costs (including Central Accounts)Salary and Wages ………… $605,966 $614,103 $603,164 $610,475 ($3,628) $7,311Fringe Benefits …………… 178,010 213,860 200,916 244,837 30,977 43,921 Pensions ……………...…… 95,075 104,763 114,586 114,586 9,823 — Total PS ……………...…… $879,051 $932,726 $918,666 $969,898 $37,172 $51,232
OTPS ……………...……… $774,140 $872,157 $778,280 $906,064 $33,907 $127,784Debt Service …………….. 47,527 65,366 75,912 55,564 (9,802) (20,348) Total OTPS $821,667 $937,523 $854,192 $961,628 $24,105 $107,436
Total Agency Costs ……… $1,700,718 $1,870,249 $1,772,858 $1,931,526 $61,277 $158,668Less Intra-City …………… $1,343 $2,815 $617 $622 ($2,193) $5Net Agency Cost ………… $1,699,375 $1,867,434 $1,772,241 $1,930,904 $63,470 $158,663
FundingCity ……………...………… 1,558,377 1,687,938 1,684,038 1,790,040 102,102 106,002 Non-City ……………...…… 140,998 179,496 88,203 140,864 (38,632) 52,661
Personnel (includes FTEs at fiscal year-end)City ……………...………… 255 258 263 263 5 — Non-City ……………...…… 5,850 6,191 6,138 6,166 (25) 28 Total ……………...……… 6,105 6,449 6,401 6,429 (20) 28
Summary of Agency Financial Data The following table compares 2022 Executive Budget with the 2022 Preliminary Budget, the 2021 forecast and actual expenditures for 2020, including fringe benefits, pensions, and debt service.
2022Increase/(Decrease)($ in 000's)

Analysis of Agency Budgets Fiscal Year 2022
171
Programmatic Review and Service Impact
Water Supply Strategies
The Department will continue the implementation of programs related to the Filtration Avoidance Determination (FAD) for the City’s Catskill and Delaware water supplies. In 2017, the New York State Department of Health, in consultation with the U.S. Environmental Protection Agency, issued an administrative determination providing the City with a waiver from filtering the Catskill and Delaware water supplies through 2027, superseding the previously issued 2007 FAD. As part of the FAD, and in compliance with revised regulations, DEP continues successful water quality management programs and its upstate land acquisition program to protect the water entering the City’s reservoirs.
The Department will also continue the Water for the Future Program to address leaks in the Rondout-West Branch Tunnel (RWBT), a 45-mile portion of the Delaware Aqueduct that conveys about 50 percent of the City’s daily water supply. A major component of this program is the construction of a 2.5-mile bypass tunnel around the areas of significant leakage. During the connection of this bypass tunnel to the Delaware Aqueduct, the RWBT will need to be temporarily shut down. In order to compensate for this shutdown, the Department will continue to pursue several water supply conservation and augmentation projects.
The Department will also begin construction of a tunnel connecting the Kensico Reservoir to the Catskill/Delaware Ultraviolet Light Disinfection Facility (CDUV). Historically, for purposes of water quality and redundancy, both the Delaware and Catskill Aqueducts conveyed water from the Kensico Reservoir. However, because the Catskill Aqueduct is not sufficiently pressurized to move water through the CDUV, only the Delaware Aqueduct can deliver water from the Kensico Reservoir to the facility. The new tunnel will replace the section of the Catskill Aqueduct between the Kensico Reservoir and the CDUV and restore needed redundancy.
The Department will continue the construction of the remaining two shafts for the Brooklyn/Queens section of City Tunnel No. 3. Completion of these shafts will enable full operation of the Brooklyn/Queens section, allowing for the full inspection of City Tunnels No. 1 and 2 and providing critical water delivery redundancy in Brooklyn, Queens, and Staten
Island. As of December 2017, the Brooklyn/Queens leg of City Tunnel No. 3 was cleaned, pressurized, and filled with water, making it activation-ready in the event of emergencies until the remainder of the tunnel shafts are completed.
Additionally, the Department will conduct rehabilitation work at the Ashokan Reservoir in the Catskill System of the City’s watershed. Projects include reconstruction of the Olive Bridge Dam and reservoir dikes, as well as replacement of the Dividing Weir Bridge and overall site restoration. This rehabilitation work will bring several key infrastructure pieces up to State and Federal safety standards and continue the Department’s efforts to strengthen infrastructure in preparation for severe storms.
Lastly, the Department will complete comprehensive facility upgrades at the Hillview Reservoir. Constructed between 1909 and 1915, Hillview Reservoir acts as a terminal reservoir, providing balancing storage, pressure regulation, and secondary disinfection for up to 100 percent of the City’s drinking water supply. Improvements include new chemical addition facilities, flow control equipment, and electrical infrastructure.
Wastewater Treatment Initiatives
Water quality in the harbor and surrounding waters has seen steady improvements due to ongoing investments. Coliform bacterial counts, which are indicators of water pollution from sewage, continue to remain at the lower levels observed over the last few years. Improvements have also been realized in the measure of dissolved oxygen as concentration levels in most harbor areas remain higher than long term historical levels. These advancements are attributed to the following DEP initiatives: continued reconstruction and upgrades at in-City WRRFs, implementation of advanced treatment technologies for nitrogen removal, the abatement of illegal discharges, improved sewer maintenance, and increased capture of wet weather flows.
To build upon these improvements, DEP continues to implement the NYC Green Infrastructure Plan. This mandated program supplements existing Combined Sewer Overflow (CSO) controls with a mix of “green infrastructure” (natural and permeable surfaces) and the optimization of “grey infrastructure” (construction and modification of tanks and tunnels) that will more

Analysis of Agency Budgets Fiscal Year 2022
172
cost-effectively reduce CSOs in waterways, while also improving air quality. Upon meeting the requirement under the consent order, this program will manage one inch of precipitation on impervious surfaces in combined sewer areas.
In addition to the above, DEP is implementing several CSO Long-Term Control Plans which will further improve water quality in City waterbodies. This will encompass several strategies including disinfection of CSOs before being released into receiving waterbodies.
Water Distribution and Wastewater Collection System
The Department operates, maintains, and protects the City’s vast water and sewer network by ensuring residents have an adequate supply of potable water, maintaining sewers for a properly functioning wastewater system, and providing emergency services during water main breaks, leaks, sewer backups, and more.
As of August 2015, the City is mandated to comply with the Municipal Separate Storm Sewer System (MS4) permit issued by the New York State Department of Environmental Conservation to manage stormwater runoff in a way that prevents flooding and improves water quality. The permit requires the City to develop a Citywide Stormwater Management Plan that outlines measures to meet the permit obligations.
The Department is amending the City’s drainage plan to show the locations, course, size, and elevation of the existing and proposed sewers for each drainage district. This will allow the Department to provide an adequate water and sewer system as new developments take place throughout the City.
In 2015, the Department began constructing a comprehensive storm sewer system in the neighborhoods represented by Community Boards 12 and 13 in Southeast Queens to mitigate chronic flooding experienced by the communities. Recognizing that the build-out of the full sewer system in Southeast Queens remains a long-term project, the Department has developed a number of strategies to provide short-term flooding relief while construction is underway, including public education on grease management, installation of green infrastructure, development of Bluebelt wetlands that naturally filter storm water runoff, and more.
Customer Services Programs
As required by the New York State Department of Environmental Conservation and the New York City Water Board, the Department is progressing towards its goal of universally metering all properties. The major objectives of universal metering include water conservation, improved water supply system management, and rate equity. DEP services approximately 835,700 water and sewer customer accounts, of which 31,700 are billed on a flat-rate system. Currently, more than 832,500 accounts are metered, while just over 3,200 remain unmetered.
DEP also offers several Customer Affordability Programs. The three main Affordability Programs are: a Home Water Assistance Program, which provides a bill credit to smaller property owners subject to an income threshold, a Multi-Family Water Assistance Program, which provides a per apartment unit bill credit to larger multi-family properties that enter into a rental affordability agreement, and a Leak Forgiveness Program, which partially credits back excess water charges attributable to a leak that is repaired. Approximately 51,000 property owners receive the Home Water credit, another 40,000 apartment units receive the Multi-Family Credit, and 4,000 properties receive a leak forgiveness credit each year.
In addition to the above, DEP introduced a Water and Sewer Service Line Protection Program in 2013, offered by American Water Resources (AWR). The purpose of this voluntary program is to protect homeowners from the unexpected high costs of water and sewer service line repairs. In exchange for a relatively small monthly program fee, AWR provides DEP customers with unlimited coverage for water and/or sewer service line leaks and breaks due to normal wear and tear. As of March 2021, 270,000 customers have enrolled in the program and entered into service contracts with AWR. AWR was selected by the Water Board to offer the program, following a competitive Request for Proposal (RFP) process.
DEP is also in the process of replacing its current outdated billing system. DEP bills and collects approximately $3.5 billion in revenue annually with the existing billing system and this replacement will ensure continued stability and allow for greater overall flexibility of the billing system.

Analysis of Agency Budgets Fiscal Year 2022
173
Environmental Compliance
The Bureau of Environmental Compliance reviews and inspects asbestos abatement projects; investigates air quality and noise complaints; monitors emissions and environmental impacts from alternative fuel vehicles; and issues permits for boilers, other combustion equipment, and other potential sources of air pollution.
The Bureau is also responsible for enforcing the City’s noise code. Along with establishing rules, guidelines, and standards for governing noise in the City, the Bureau promulgates construction rules that require a site-specific noise mitigation plan for each construction site, offering alternatives for contractors to continue construction while reducing the noise impact on the surrounding environment.
Energy Policy
The Department works in conjunction with the Department of Citywide Administrative Services and
the Mayor’s Office on coordinating the City’s strategic goals on energy policy. Given that DEP is one of the City’s largest energy users, this policy role is closely linked with a number of objectives in the Department’s strategic plan. This role is in addition to nearly $666.2 million in capital projects with energy reduction components where DEP expects to invest in clean distributed generation, energy efficiency, and hydro-electric generation.
Bureau of Police and Security
The Bureau of Police and Security is responsible for protecting the New York City water supply and the associated critical infrastructure from terrorism, pollution, and crime. Since February 1, 2010, the Bureau has been responsible for responding to hazardous material emergencies within the City by evaluating the characteristics of the materials involved and making technical decisions concerning containment, abatement, and disposal. The DEP Police Department patrols the upstate water supply, with 221 officers dedicated to this function.
Capital Review
Overview
The Ten-Year Capital Plan for 2022 through 2031 provides a total of $22.7 billion from the following sources: $22.0 billion financed by Water Finance Authority funds and $623.0 million in non-City funds.
The table below shows capital commitments by program area over the 2020-2025 period.
Capital Commitments($ in 000’s)
_______________________________________________________________________________________________________________________________________________________________________________________________________________
2020 2021 2022 2023 2024 2025 Actual Plan Plan Plan Plan Plan ________________________ ___________ ____________ ________________________ _______________________ ________________________ _______________________
City All City All City All City All City All City All Funds Funds Funds Funds Funds Funds Funds Funds Funds Funds Funds Funds _______________________________________________________________________________________________________________________________________________________________________________________________________________
Water Pollution .......................... $474,032 $484,476 $785,462 $805,290 $1,638,233 $1,810,582 $1,112,542 $1,171,955 $737,578 $756,028 $1,130,783 $1,130,783Water Mains ............................... 175,733 176,343 462,735 $463,580 376,504 376,781 461,577 515,953 713,967 733,491 692,728 818,828Sewers ........................................ 302,491 322,156 436,060 $457,309 768,717 776,089 472,038 472,050 429,796 429,798 650,050 650,050Water Supply .............................. 33,194 33,194 496,970 $496,970 49,457 49,457 16,000 16,000 757,433 757,433 634,020 634,020Equipment .................................. 13,224 13,224 64,831 64,831 54,844 55,420 19,162 19,162 23,974 23,974 214,916 214,916 ___________ ___________ ___________ ___________ ___________ ___________ ___________ ___________ ___________ ___________ ___________ ___________
Total ............................................. $998,674 $1,029,393 $2,246,058 $2,287,980 $2,887,755 $3,068,329 $2,081,319 $2,195,120 $2,662,748 $2,700,724 $3,322,497 $3,448,597 ========= ========= ========= ========= ========= ========= ========= ========= ========= ========= ========= =========
__________________________________________________________________________________________________________________________________________________________________________________________

Analysis of Agency Budgets Fiscal Year 2022
174
The major elements of the Ten-Year Capital Plan include:
• Extension and reconstruction of storm, sanitary, and combined sewers ($5.4 billion, of which $2.3 billion is planned for 2022 to 2025).
• Investments to maintain the operational integrity of existing wastewater resource recovery facilities ($5.1 billion, of which $3.1 billion is planned for 2022 to 2025). The total includes the hardening of wastewater infrastructure based on findings of the New York City Wastewater Resiliency Plan assessment and Federal grant funding for Sandy-related recovery work ($439.5 million).
• Replacement and extension of trunk and distribution water mains and ancillary work ($2.9 billion, of which $1.2 billion is planned for 2022 to 2025).
• Disinfection and mitigation of Combined Sewer Overflow (CSO) to achieve waterbody-specific water quality standards ($2.6 billion, of which $1.2 billion is planned for 2022 to 2025). This includes the construction of two CSO holding tanks to improve water quality in the Gowanus Canal ($1.2 billion) and the design of a CSO storage tunnel for Newtown Creek ($91.7 million).
• Construction of a comprehensive sewer system in Southeast Queens, including strategically selected projects to deliver near-term and long-term flooding relief ($1.7 billion, of which $643.9 million is planned for 2022 to 2025).
• Construction of a tunnel connecting the Kensico Reservoir to the Catskill/Delaware Ultraviolet Light Disinfection Facility, necessary to provide redundancy in the water supply system ($1.6 billion, of which $831.5 million is planned for 2022 to 2025).
• Reducing CSOs through the use of green infrastructure ($578.3 million, of which $332.8 million is planned for 2022 to 2025), such as right-of-way bioswales and stormwater greenstreets, porous pavement, constructed wetlands, onsite stormwater management practices, and green roofs.
• Rehabilitation of Ashokan Reservoir structures, including reconstruction of the Olive Bridge Dam, reservoir dikes, Dividing Weir Bridge, and overall site restoration ($1.1 billion, of which $173.4 million is planned for 2022 to 2025).
• Construction related to the activation of the Brooklyn/Queens section of City Tunnel No. 3 ($179.6 million, all of which is planned for 2022 to 2025). This work includes the excavation of the remaining two shafts necessary for full operation of the tunnel.
• Continuation of land acquisition for and construction of the award-winning Staten Island Bluebelt program ($236.3 million, of which $146.9 million is planned for 2022 to 2025).
• Reconstruction of Hillview Reservoir, including new chemical addition facilities, flow control improvements, and electrical upgrades ($481.3 million, of which $344.0 million is planned for 2022 to 2025).
• Reconstruction of upstate and in-City dams, including the rehabilitation of the New Croton Dam ($145.0 million) and excluding the Olive Bridge Dam already noted. This will ensure the long-term reliability of the City’s reservoir infrastructure ($410.7 million, of which $229.1 million is planned for 2022 to 2025).
• Ongoing stabilization and upgrade of in-City Wastewater Resource Recovery Facilities (WRRFs) and systems to ensure compliance with State and Federal mandates for: operating permit requirements ($31.3 million, of which $20.4 million is planned from 2022 to 2025); mandated studies and facility upgrades to reduce nitrogen levels in treated wastewater ($30.0 million, all of which is planned from 2022 to 2025); and enhancement of the existing chlorination system at various WRRFs in order to meet stricter chlorine discharge limits ($141.4 million, all of which is planned from 2022 to 2025).
• Continuation of various filtration avoidance measures and land acquisition in the upstate watershed in support of the ten-year 2017 Filtration Avoidance Determination ($191.7 million, of which $157.2 million is planned for 2022 to 2025).
• Complete rehabilitation and optimization of the Catskill Aqueduct ($251.7 million, of which $60.0 million is planned for 2022 to 2025). This total includes reconstruction of the Lower Catskill Aqueduct connecting the Catskill/Delaware Ultraviolet Facility with Hillview Reservoir ($125.0 million) and the inspection and repair of deep-rock pressure tunnels that maintain tunnel pressure for water distribution ($106.1 million).

Analysis of Agency Budgets Fiscal Year 2022
175
• Replacement of digesters at the Hunts Point WRRF ($393.9 million, all of which is planned from 2022 to 2025).
• Emergency rehabilitation and replacement of sewers and water mains in the event of line breaks ($1.1 billion, of which $363.6 million is planned from 2022 to 2025).

Analysis of Agency Budgets Fiscal Year 2022
176
DEPARTMENT OF TRANSPORTATION
The Department of Transportation (DOT) maintains and reconstructs City bridges, plans and funds street reconstruction, oversees ferry operations, manages traffic signals and street lighting networks, maintains and collects revenue from parking meters, operates parking facilities, and coordinates transportation planning within the five boroughs. It is DOT’s goal to create a transportation network that is reliable, safe, sustainable, and accessible, meeting the needs of all New Yorkers and supporting the City’s growing economy.
Financial Review
The Department of Transportation’s 2022 Executive Budget provides for operating expenses of $1.2 billion. Capital commitments of $2.4 billion are planned for 2022. The ten-year capital strategy for 2022-2031 provides for $22.8 billion in capital commitments, including $1.5 billion in Federal, State, and private funding.
Revenue Forecast
The Department of Transportation collects revenue from parking meters and parking garages, franchises, concessions, and street opening permits. In 2022, the Department will collect $448 million in revenue.
Expense Budget Highlights
Budgetary Priorities: Providing Core Services
• Funding of $559.8 million for the traffic and transportation planning and management programs, including $60.1 million for energy costs associated with all streetlights and traffic signals throughout the City, and $183.1 million for the maintenance of approximately 13,440 traffic signalized intersections and over 333,670 streetlights Citywide.
• Funding of $200.4 million for the in-house costs associated with resurfacing 1,100 vehicle lane miles of streets and 50 miles of bike lanes, as well as the repair of street defects (potholes)
• Funding of $100.4 million for the operation of the Staten Island Ferry and regulation of private ferry services.
• Funding of $52.2 million for preventive maintenance, cleaning, and spot and splash zone painting of City bridges including Federal funding for the maintenance of the East River Bridges.
• Funding of $20.3 million for the in-house bridge flag/corrective repair program.
Restructuring and Streamlining
• The Department expects to save $2.4 million in 2021 due to underspending on speed cameras contract costs.
• The Department expects to save $2.4 million in 2022 as a result of lease re-estimates.
• The Department expects to save approximately $452,000 in 2021 and 2022 due to the Citywide Enhance Space Management initiative.

Analysis of Agency Budgets Fiscal Year 2022
177
2021 20222020
Actual2021
ForecastPreliminary
BudgetExecutive
Budget Forecast Preliminary
BudgetExpenditures
Salary and Wages ……….. $534,515 $513,839 $539,302 $548,078 $34,239 $8,776Fringe Benefits …………… 5,909 4,978 4,978 4,978 — — OTPS ……………...……… 553,703 617,967 600,619 691,561 73,594 90,942 Total ……………...……… $1,094,127 $1,136,784 $1,144,899 $1,244,617 $107,833 $99,718
FundingCity ……………...………… $615,486 $667,417 $703,019 $775,785 $108,368 $72,766Other Categorical Grants … 16,784 4,313 2,862 2,862 (1,451) — IFA ……………...………… 227,923 238,896 251,288 267,401 28,505 16,113 State ……………...……… 120,734 119,392 120,174 114,911 (4,481) (5,263) Federal CD ……………...… — — — — — — Federal Other ……………. 108,583 103,712 64,944 81,046 (22,666) 16,102 Intra-City Other …………… 4,617 3,054 2,612 2,612 (442) — Total ……………...……… $1,094,127 $1,136,784 $1,144,899 $1,244,617 $107,833 $99,718
Additional Costs Centrally FundedPersonal Services (PS) Fringe Benefits ………… $172,359 $197,476 $188,203 $229,995 $32,519 $41,792 Pensions ……………...… 83,869 91,593 101,737 101,737 10,144 — Other Than Personal Service (OTPS) Debt Service ……………. 862,679 831,008 965,085 1,008,107 177,099 43,022 Total Additional Costs $1,118,907 $1,120,077 $1,255,025 $1,339,839 $219,762 $84,814
FundingCity ……………...………… 1,022,718 995,587 1,144,079 1,195,480 199,893 51,401 Non-City ……………...…… 96,189 124,490 110,946 144,359 19,869 33,413
Full Agency Costs (including Central Accounts)Salary and Wages ………… $534,515 $513,839 $539,302 $548,078 $34,239 $8,776Fringe Benefits …………… 178,268 202,454 193,181 234,973 32,519 41,792 Pensions ……………...…… 83,869 91,593 101,737 101,737 10,144 — Total PS ……………...…… $796,652 $807,886 $834,220 $884,788 $76,902 $50,568
OTPS ……………...……… $553,703 $617,967 $600,619 $691,561 $73,594 $90,942Debt Service …………….. 862,679 831,008 965,085 1,008,107 177,099 43,022 Total OTPS $1,416,382 $1,448,975 $1,565,704 $1,699,668 $250,693 $133,964
Total Agency Costs ……… $2,213,034 $2,256,861 $2,399,924 $2,584,456 $327,595 $184,532Less Intra-City …………… $4,617 $3,054 $2,612 $2,612 ($442) $—Net Agency Cost ………… $2,208,417 $2,253,807 $2,397,312 $2,581,844 $328,037 $184,532
FundingCity ……………...………… 1,638,204 1,663,004 1,847,098 1,971,265 308,261 124,167 Non-City ……………...…… 570,213 590,803 550,214 610,579 19,776 60,365
Personnel (includes FTEs at fiscal year-end)City ……………...………… 2,616 2,513 2,565 2,695 182 130 Non-City ……………...…… 3,201 3,253 3,233 3,258 5 25 Total ……………...……… 5,817 5,766 5,798 5,953 187 155
Summary of Agency Financial Data The following table compares 2022 Executive Budget with the 2022 Preliminary Budget, the 2021 forecast and actual expenditures for 2020, including fringe benefits, pensions, and debt service.
2022Increase/(Decrease)($ in 000's)

Analysis of Agency Budgets Fiscal Year 2022
178
Programmatic Review and Service Impact
Bridges
The Division of Bridges is responsible for the reconstruction, repair, maintenance, and operation of approximately 796 City-owned bridge and tunnel structures. In 2022, the Division of Bridges will be staffed with 778 positions and have an operating budget of $111 million.
The Bridge program in the 2022 Executive Budget continues the City’s commitment to preserve and maintain its infrastructure. The Bridge “Flag” and Correction Repair program corrects mostly structural (“red” and “yellow” flags, in descending order of priority) and safety deficiencies on bridges by using both in-house and contract forces. Furthermore, the Bridge Preventive Maintenance program includes the oiling, sweeping, cleaning, washing, anti-icing, electrical maintenance, and spot and salt splash zone painting of the City’s bridges.
Roadway Repair and Maintenance
The Roadway Repair and Maintenance Division is responsible for maintaining approximately 19,324 lane miles of streets, 1,175 lane miles of which are arterial highways within the five boroughs, 72 percent of which are in good condition as of 2020. The Permits Management and Construction Control programs are responsible for regulating the excavation and various other uses of City streets and sidewalks. In 2022, Roadway Repair and Maintenance has a budget totaling $323.2 million.
Traffic Operations and Transportation Planning and Management
The Division of Traffic Operations maintains and collects revenue from approximately 89,300 metered spaces and operates 36 municipal parking facilities, approximately 13,440 signalized intersections, and 333,670 streetlights, while the Division of Transportation Planning and Management installs and maintains an estimated one million traffic signs and over 350 million linear feet of pavement markings. The 2022 Executive Budget for the Division of Traffic Operations and Division of Transportation Planning and Management provides for 1,720 positions and $559.8 million.
The Division of Transportation Planning and Management continues to plan and implement Street Improvement Projects (SIPs) to further the goals of providing safe, sustainable and attractive transportation options to New Yorkers, and ensuring the reliability and high quality of our transportation network. Projects implemented under the Safe Streets for Seniors, Safe Routes to Schools, Safe Routes to Transit, and Bus Stops Under the Elevated programs, as well as redesigns of Vision Zero Priority Corridors and Priority Intersections, improve safety for all street users. The Midtown in Motion project reduces congestion and greenhouse gas emissions in Manhattan. Expansion of installation of Leading Pedestrian Intervals (LPI), signal retiming for 25 mph, speed cameras, and other safety programs continue to support the Department’s overarching Vision Zero goals. The Better Buses program speeds up buses by providing high-quality transit enhancements through Bus Lanes, Busways, and transit signal priority. Expansion of the bike network, as outlined in the Green Wave plan, increases safety and convenience of cycling, leading to a continued increase in the number of people who commute by bicycle. Installation of pedestrian plazas and shared streets throughout the City uses existing streets and sidewalks to provide valuable open space in areas in need of space for community gathering, greening, and active programming. Installation of bicycle parking, seating, and wayfinding signage to encourage walking, cycling and transit use.
The Department also manages the New York City Plaza program, a community-based program to improve the public realm by creating pedestrians plazas. In total, the Department oversees 82 plazas that are now in various phases of planning, design, construction, or complete. Of these, 65 are currently open to the public.
Transit Operations (Ferries)
The Department of Transportation operates and maintains the Staten Island Ferry and its terminals, as well as regulates private ferry operations. The 2022 Executive Budget for Ferries provides for 673 positions and an operating budget of $100.4 million.
The Staten Island Ferry carried approximately 15.9 million passengers in 2020 and achieved an on-time performance rating of 96.3 percent. Privately operated commuter ferries, including those sponsored by the Economic Development Corporation, carried 12.7 million passengers.

Analysis of Agency Budgets Fiscal Year 2022
179
The Highlights of the 2022-2031 Capital Plan include:
• Complete rehabilitative work of bridge structures scheduled for life extension ($6.5 billion), including Trans-Manhattan Expressway ($421.6 million) and Grand Street over Newtown Creek ($133.1 million).
• Complete reconstruction or rehabilitation of bridge structures currently rated “fair” or “good” ($3.8 billion), including Brooklyn-Queens Expressway (BQE) projects ($1.5 billion) and the Henry Hudson Parkway Bridge over West 158th ($166.5 million).
• Street reconstruction ($3.5 billion); including Phase 6 of the reconstruction of Grand Concourse ($74.3 million) and reconstruction of Norton Drive ($23.5 million).
• Street and arterial resurfacing of approximately 11,000 vehicle lane miles and 500 bike lane miles ($3 billion).
• Installation and reconstruction of pedestrian ramps to comply with accessibility requirements ($2.7 billion) and replacement of sidewalks ($515.3 million).
• Installation of traffic signals and accessible pedestrian signals ($654.4 million).
• Ferry terminal and facility improvements
($320.1 million).• Upgrade and replacement of lampposts, luminaires,
and associated infrastructure ($101.7 million).
• Installation of thermoplastic markings for traffic control ($101.1 million).
• Signal and streetlight installation and lane markings associated with highway reconstruction and bridge programs ($82.2 million).
• Enhancements to multiple technology and telecommunications systems ($53.1 million).
• Reconstruction and upgrade of parking meters, garages, and lots ($42.3 million).
• Upgrade and replacement of electrical distribution systems along the City’s streets ($30.3 million).
The Highlights of the 2022 Capital Plan include:
• Rehabilitation and reconstruction of various bridges including the Williamsburg Bridge ($155.8 million) and construction of cycling paths on the Ed Koch Queensboro Bridge ($8 million).
• Street reconstruction projects ($400.2 million), including Delancey Street ($41.2 million), Trinity Place ($40.3 million), and Schenck Avenue in Brooklyn ($17 million).
Capital Review
The Department of Transportation’s 2022-2031 Capital Commitment Plan totals $22.8 billion for the reconstruction of transportation infrastructure, of which approximately 94 percent is City-funded. The table below shows commitments by program area between 2020-2025.
Capital Commitments($ in 000’s)
_______________________________________________________________________________________________________________________________________________________________________________________________________________
2020 2021 2022 2023 2024 2025 Actual Plan Plan Plan Plan Plan ________________________ ___________ ____________ ________________________ _______________________ ________________________ _______________________
City All City All City All City All City All City All Funds Funds Funds Funds Funds Funds Funds Funds Funds Funds Funds Funds_______________________________________________________________________________________________________________________________________________________________________________________________________________
Highways and Streets ................. $403,384 $451,529 556,377 676,019 853,444 978,486 1,179,961 1,234,696 761,322 789,052 1,527,441 1,575,604 Highway Bridges ........................ 108,358 102,941 180,720 192,332 840,457 942,197 809,395 935,149 1,367,053 1,438,978 1,451,044 1,451,044 Waterway Bridges ....................... (46,596) 5,217 33,751 33,675 68,709 207,646 35,714 35,714 35,000 35,000 175,877 175,877 Traffic .......................................... 108,595 119,010 171,307 183,874 149,741 160,866 52,008 87,021 54,447 88,386 97,677 128,313 Vehicles/Equipment .................... 9,458 9,458 28,525 28,525 24,061 25,409 13,116 13,116 5,632 5,632 18,697 18,697 Ferries .......................................... 10,810 13,960 14,400 44,806 37,781 121,656 80,745 109,783 27,138 28,767 20,443 23,680 ___________ ___________ ___________ ___________ ___________ ___________ ___________ ___________ ___________ ___________ ___________ ___________
Total................................................ $594,009 $702,115 $985,080 $1,159,231 $1,974,193 $2,436,260 $2,170,939 $2,415,479 $2,250,592 $2,385,815 $3,291,179 $3,373,215 =========== =========== =========== ========== ========== ========== ========== ========== ========== ========== ========== ==========
_______________________________________________________________________________________________________________________________________________________________________________________________________________

Analysis of Agency Budgets Fiscal Year 2022
180
• Resurfacing of approximately 1,100 lane miles of local streets and arterial highway and 50 miles of bike lanes ($266.7 million).
• Reconstruction of sidewalks and pedestrian ramps ($253.4 million).
• Installation of speed cameras in school zones ($56.4 million).

Analysis of Agency Budgets Fiscal Year 2022
181
HOUSING PRESERVATION AND DEVELOPMENT
The New York City Department of Housing Preservation and Development (HPD) is the largest municipal housing preservation and development agency in the nation. The agency’s mission is to make strategic investments to improve and strengthen neighborhoods while preserving the stability and affordability of the City’s existing housing stock.
HPD is responsible for carrying out Mayor Bill de Blasio’s Housing New York 2.0: A Five-Borough, Twelve-Year Plan, which is a citywide initiative to build or preserve 300,000 affordable housing units, and to help both tenants and landlords preserve the quality and affordability of their homes. In addition to financing affordable housing projects, HPD is responsible for:
• Ensuring that the entire City’s housing stock complies with the health and safety requirements of the Housing Maintenance Code.
• Monitoring the fiscal health and ongoing affordability of more than 5,600 buildings containing more than 161,000 units in its asset management portfolio, and 94 developments comprising 45,000 units in its Mitchell-Lama portfolio.
• Providing more than 41,000 households with Federal rental subsidies to support stable affordable housing in the private market.
Through the above goals, HPD works to ensure that all New Yorkers live in safe and habitable homes.
Financial Review
HPD’s 2022 Executive Budget provides for operating expenses of $1.09 billion, of which approximately $288 million is City funds. The budgeted headcount of 2,579 full-time positions is funded at $193 million while other than personal services are projected at $893 million. Nearly $766 million, or 71 percent of the agency’s expense budget, is supported by Federal and State funding programs. HPD’s operating budget described above includes $275 million in pass-through funding for the New York City Housing Authority (NYCHA), of which $182 million is City funds. In addition, HPD has planned capital commitments of $1.8 billion in 2022.
Revenue Forecast
HPD collects fees for processing tax abatement and exemption applications, multiple dwelling registrations, document searches, and administrative fees. HPD also collects revenue from residential and commercial tenants occupying in rem buildings, and from the sale of in rem buildings to the private sector. The agency will generate $39.1 million in 2022.
Expense Budget Highlights
Providing Core Services
In 2022, the agency will continue to provide core services that include the enforcement of the Housing Maintenance Code, administration of rent subsidies, preservation and development of quality affordable housing, and management of affordable housing assets.
• Through its Code Enforcement team, the agency will continue to respond promptly to housing maintenance complaints, assess conditions, and develop appropriate strategies to correct violations citywide.
• HPD will use various enforcement tools to ensure compliance with legal and regulatory obligations including bringing enforcement proceedings against non-compliant owners and removing hazardous conditions in private distressed buildings. The agency will continue to work with responsible owners and community partners to prevent distress and ensure neighborhood stability. These efforts are supported by the Federal Community Development Block Grant (CDBG) funds.

Analysis of Agency Budgets Fiscal Year 2022
182
• HPD will administer the nation’s fifth largest Section 8 program, and allocate Federal Housing Choice Vouchers and other rental assistance programs to eligible New Yorkers. In 2021, the agency supported over 41,000 households. Another $473 million in subsidy payments are planned for 2022.
• HPD will engage in planning and project development activities to: (1) preserve existing housing stock; (2) leverage private investments; and (3) create new affordable units.
• HPD will continue to focus on the financial and physical health of a portfolio of over 5,600 rental and co-op buildings, as well as 45,000 units of Mitchell-Lama housing, in which the City has previously invested.

Analysis of Agency Budgets Fiscal Year 2022
183
2021 20222020
Actual2021
ForecastPreliminary
BudgetExecutive
Budget Forecast Preliminary
BudgetExpenditures
Salary and Wages ……….. $184,864 $190,797 $189,405 $192,932 $2,135 $3,527Fringe Benefits …………… 82 48 24 28 (20) 4 OTPS ……………...……… 944,834 1,185,838 843,487 892,707 (293,131) 49,220 Total ……………...……… $1,129,780 $1,376,683 $1,032,916 $1,085,667 ($291,016) $52,751
FundingCity ……………...………… $294,430 $313,460 $289,654 $287,840 ($25,620) ($1,814)Other Categorical Grants … 1,757 8,691 5,000 5,000 (3,691) — IFA ……………...………… 21,273 22,017 24,519 24,545 2,528 26 State ……………...……… 4,322 2,963 1,075 1,075 (1,888) — Federal CD ……………...… 249,361 414,456 205,564 234,086 (180,370) 28,522 Federal Other ……………. 555,784 611,630 504,968 531,023 (80,607) 26,055 Intra-City Other …………… 2,853 3,466 2,136 2,098 (1,368) (38) Total ……………...……… $1,129,780 $1,376,683 $1,032,916 $1,085,667 ($291,016) $52,751
Additional Costs Centrally FundedPersonal Services (PS) Fringe Benefits ………… $58,743 $72,683 $68,696 $85,025 $12,342 $16,329 Pensions ……………...… 28,330 31,542 34,817 34,817 3,275 — Other Than Personal Service (OTPS) Debt Service ……………. 617,900 530,781 616,419 599,302 68,521 (17,117) Total Additional Costs $704,973 $635,006 $719,932 $719,144 $84,138 ($788)
FundingCity ……………...………… 645,358 572,840 664,418 648,193 75,353 (16,225) Non-City ……………...…… 59,615 62,166 55,514 70,951 8,785 15,437
Full Agency Costs (including Central Accounts)Salary and Wages ………… $184,864 $190,797 $189,405 $192,932 $2,135 $3,527Fringe Benefits …………… 58,825 72,731 68,720 85,053 12,322 16,333 Pensions ……………...…… 28,330 31,542 34,817 34,817 3,275 — Total PS ……………...…… $272,019 $295,070 $292,942 $312,802 $17,732 $19,860
OTPS ……………...……… $944,834 $1,185,838 $843,487 $892,707 ($293,131) $49,220Debt Service …………….. 617,900 530,781 616,419 599,302 68,521 (17,117) Total OTPS $1,562,734 $1,716,619 $1,459,906 $1,492,009 ($224,610) $32,103
Total Agency Costs ……… $1,834,753 $2,011,689 $1,752,848 $1,804,811 ($206,878) $51,963Less Intra-City …………… $2,853 $3,466 $2,136 $2,098 ($1,368) ($38)Net Agency Cost ………… $1,831,900 $2,008,223 $1,750,712 $1,802,713 ($205,510) $52,001
FundingCity ……………...………… 939,788 886,300 954,072 936,033 49,733 (18,039) Non-City ……………...…… 892,112 1,121,923 796,640 866,680 (255,243) 70,040
Personnel (includes FTEs at fiscal year-end)City ……………...………… 792 773 793 793 20 — Non-City ……………...…… 1,637 1,816 1,741 1,818 2 77 Total ……………...……… 2,429 2,589 2,534 2,611 22 77
Summary of Agency Financial Data The following table compares 2022 Executive Budget with the 2022 Preliminary Budget, the 2021 forecast and actual expenditures for 2020, including fringe benefits, pensions, and debt service.
2022Increase/(Decrease)($ in 000's)

Analysis of Agency Budgets Fiscal Year 2022
184
Programmatic Review and Service Impact
HPD administers the above-described core services through the following offices: Asset and Property Management; Development; Enforcement and Neighborhood Services; Neighborhood Strategies; and Policy and Strategy. The Offices of the Executive Deputy Commissioner, Financial Management, HPD Tech, and Legal Affairs, respectively, also provide planning, leadership, technical, and support services to accomplish the agency’s goals.
Asset and Property Management
HPD’s Office of Asset and Property Management works to ensure that properties remain financially and physically stable over the long-term. Its programs proactively identify at-risk buildings and help to stabilize mismanaged assets. The Office supervises the City’s Mitchell-Lama portfolio, and manages City-owned residential and commercial properties, as well as Urban Renewal sites, until they can be returned to responsible private ownership. In addition, the agency operates Emergency Housing Services (EHS) to provide emergency shelter and housing relocation services to tenants displaced as a result of fires or vacate orders issued by the Department of Buildings, the Fire Department, or by the agency itself. Finally, the Office oversees all marketing and leasing-related functions, including affordable housing lotteries and homeless placement services.
Development
HPD’s Off ice of Development leads the implementation of the Mayor’s Housing New York 2.0 Plan in close collaboration with other City and State agencies, and with the New York City Housing Development Corporation (HDC). The Office builds a pipeline of affordable housing development on both public and private sites, and administers a variety of new construction, rehabilitation, preservation, and homeownership programs.
Additionally, under the Division of Housing Incentives, the Office manages various tax exemption and abatement programs, as well as the inclusionary housing pipeline and associated transactions. The inclusionary housing program is intended to promote economic integration as areas undergo substantial new development. The Office also manages the agency’s tax credits and incentives programs.
Enforcement and Neighborhood Services
HPD’s Office of Enforcement and Neighborhood Services protects housing by ensuring that building owners comply with the City’s Housing Maintenance Code and the New York State Multiple Dwelling Law. The Office responds to public complaints and plans appropriate, individualized actions to address hazardous conditions in privately-owned buildings—conditions may include the presence of lead paint; structural deficiencies; mold, pests, or allergens; or the lack of heat, hot water, or electricity. Through the Proactive Preservation Initiative and the agency’s Alternative Enforcement, 7A, and Underlying Conditions programs, respectively, the Office monitors deteriorating and severely distressed properties and reaches out to owners with tools to educate, assist, and enforce accountability. When warranted, the agency will undertake repairs through the Emergency Repair Program at an owner’s expense. The Office also works closely with the Mayor’s Office to Protect Tenants and the Department of Buildings to identify and enforce issues regarding tenant harassment. HPD will bring cases to Housing Court to seek the correction of hazardous conditions, the imposition of civil penalties, and the protection of tenants against claims of harassment. Finally, the Office leads the agency’s implementation of LeadFreeNYC, an initiative with expanded mandates under Local Law 1 of 2004 to eliminate childhood lead exposure in New York City.
Neighborhood Strategies
HPD’s Office of Neighborhood Strategies focuses on planning and community partnerships to help the agency adopt a more comprehensive approach to development within the City’s neighborhoods. The Division of Planning and Predevelopment identifies future sites, coordinates neighborhood zoning efforts, and collaborates with other City agencies to develop public properties. The Division of Neighborhood Development and Stabilization leads the agency’s commitment to strategic preservation and development through engagement with tenants, landlords, community leaders, and neighborhood stakeholders on issues involving the creation of vibrant neighborhoods anchored by affordable housing. Finally, the Division of Tenant Resources administers rental assistance programs including Section 8 Housing Choice Vouchers, Moderate Rehabilitation / SRO Programs, Continuum of Care, and the NYC 15/15 Rental Assistance Program.

Analysis of Agency Budgets Fiscal Year 2022
185
Capital Review
The 2022-2031 Ten-Year Capital Strategy totals $12.2 billion, including $11.9 billion in City funding and $320 million in Federal funds. The Four-Year Plan totals $6.1 billion, including $6.0 billion in City funds and $128 million in Federal funds. The agency will use its City capital resources to leverage State and Federal funds as well as private equity (that does not flow through the City’s capital budget) as part of the agency’s plan to create or preserve 300,000 units of affordable housing by 2026. The table below reflects the Four-Year Capital Plan by program area over the fiscal years 2022-2025.
Capital Commitments($ in 000’s)
_______________________________________________________________________________________________________________________________________________________________________________________________________________
FY22 FY23 FY24 FY25 Plan Plan Plan Plan _____________ ___________ ________________________ _______________________ _______________________
City All City All City All City All Funds Funds Funds Funds Funds Funds Funds Funds_______________________________________________________________________________________________________________________________________________________________________________________________________________
New Construction ..................................................................... $494,087 $494,087 $523,842 $523,842 $615,708 $615,708 $554,377 $554,377 Other Housing Support .............................................................. 19,789 19,789 12,032 12,032 12,383 12,383 33,045 33,045 Disposition ................................................................................. 44,448 44,448 46,524 46,524 43,082 43,082 77,974 77,974 Preservation ............................................................................... 521,945 521,945 505,909 505,909 531,146 531,146 497,114 497,114 Special Needs ............................................................................ 342,578 374,578 304,564 336,564 192,406 224,406 286,610 318,610 NYCHA Preservation Programs ................................................ 300,000 300,000 — — — — — — __ _____________ _____________ ____________ ____________ ____________ ____________ ____________ ____________
Total .................................................................................... $1,722,847 $1,754,847 $1,392,871 $1,424,871 $1,394,725 $1,426,725 $1,449,120 $1,481,120 =========== =========== =========== =========== =========== =========== =========== ===========
_______________________________________________________________________________________________________________________________________________________________________________________________________________
Highlights of the Ten Year Capital Strategy and Four-Year Plan
Under the 2022-2031 Ten-Year Capital Strategy and the 2022-2025 Four-Year Plan, HPD will generate affordable housing units via preservation, new construction, senior and supportive housing, and the disposition of in rem housing stock. The City will support production of approximately 25,000 units of affordable housing annually. Under the Four-Year Plan:
• Funding of $2.1 billion will support activities to preserve existing affordable housing stock while creating long-term affordability by providing moderate to substantial rehabilitation.
• Funding of $2.2 billion will support construction of new units serving various income levels throughout the five boroughs. Initiatives include large-scale developments, as well as funding for various rental and homeownership programs.
• Funding of $1.3 billion (inclusive of $128 million of Federal HOME funds) will support senior and supportive housing initiatives funded through various Special Needs Housing loan programs.
• Funding of $212 million will rehabilitate City-owned housing units and return them to responsible private ownership.
• Funding of $77.2 million will be used in support of other ancillary housing investments. This primarily encompasses acquisition/demolition, infrastructure for large-scale developments, and technology projects that will enhance agency operations.
• Funding of $300 million will support NYCHA’s Rental Assistance Demonstration (RAD) transactions. Through these transactions, NYCHA will also leverage other private and public financing sources to address its significant outstanding capital need.
Policy and Strategy
HPD’s Office of Policy and Strategy provides analysis and guidance on high-priority policy initiatives, advancing solutions that further the agency’s mission. The Division of Housing Policy is responsible for designing and executing data collection and statistical analyses in support of the triennial Housing & Vacancy
Survey (HVS), in addition to overseeing the agency’s fair housing initiatives. Additionally, the Division of Strategic Operations and Analytics works to increase HPD’s programmatic impact and operations through strategic planning initiatives, operational innovation, performance management and reporting, and comprehensive audit-related functions.

Analysis of Agency Budgets Fiscal Year 2022
186
In addition, units are expected to be generated without capital subsidies through various initiatives with agency partners. These units will primarily be created or preserved using bond financing, inclusionary zoning, and tax abatement or exemptions.

Analysis of Agency Budgets Fiscal Year 2022
187
DEPARTMENT OF CITYWIDE ADMINISTRATIVE SERVICES
The Department of Citywide Administrative Services (DCAS) provides a variety of shared services to support the operations of New York City government. These services include recruiting, hiring, and training employees; providing facilities management for 56 public buildings; acquiring, selling, and leasing City property; coordinating the purchase and distribution of supplies and equipment for City agencies; and implementing conservation and safety programs throughout the City's facilities and vehicle fleet. Through these services, DCAS ensures that all City agencies have the critical resources needed to provide the best possible services to the public. The following lines of service are among those that provide this support: Human Capital, Facilities Management, Real Estate Services, Energy Management, Fleet Management, and the Office of Citywide Procurement.
Financial Review
The 2022 Executive Budget for the Department of Citywide Administrative Services provides $1.4 billion, a decrease of $596.7 million below the amount forecasted for 2021. This decrease is predominantly attributable to federal grants which were provided in 2021 for the purchase of Personal Protective Equipment (PPE) supplies and other COVID-related goods and services to combat the pandemic which are currently not budgeted in 2022. The $8.5 billion DCAS Ten-Year Capital Plan includes $2.1 billion for the renovation, reconstruction, and outfitting of Public Buildings, $3.8 billion for energy efficiency initiatives, $51.8 million for Real Property, and $2.6 billion for Citywide resiliency and waterfront rehabilitation.
Revenue Forecast
The Department of Citywide Administrative Services manages the City’s real estate holdings and receives revenue in the form of rents and mortgage payments. It also holds auctions for vehicles from the City’s Fleet and collects civil service exam fees. In 2022, DCAS anticipates collecting $53.3 million in revenue.
Expense Budget Highlights
Budgetary Priorities: Providing Core Services
• The 2022 Executive Budget provides total funds of $1.35 billion for the Department, of which $814.6 million is for goods and services that agencies purchase from DCAS through intra-City agreements, including the following: utilities ($656.5 million), leases ($108.9 million), storehouse supplies ($19.5 million), maintenance and repair of facilities and vehicles ($20.0 million), personnel training ($0.9 million), and other services ($8.7 million).
• The 2022 Executive Budget provides a total of $291.2 million for DCAS Facilities Management, including $61.7 million in State funding for lease and maintenance services of court facilities. Of the total $291.2 million budgeted for Facilities Management, $143.4 million is budgeted for leases and $128.5 million is budgeted for building maintenance. Facilities Management provides maintenance and construction services for 56 public buildings including 29 court facilities.
• The 2022 Executive Budget provides a total of $13.4 million for Real Estate Services. Real Estate Services purchases, sells, and leases real property; and locates space for City agencies.
• The 2022 Executive Budget provides a total of $25.5 million for DCAS Police and contractual security coverage at DCAS-managed buildings.
Restructuring and Streamlining
• Since 2014, DCAS has invested more than $600 million in approximately 8,000 energy conservation measures across 1,600 buildings, comprising more than 50 percent of City government’s building square footage. DCAS has also installed over 12 megawatts of solar photovoltaic (PV) systems on City assets and is planning to install a further 42 megawatts of capacity in the near-term. The investments have decreased energy use by about 2.3 million MMBtus or about as much energy as used by 188,000 City residences, avoided more than $80 million in annual energy costs, and reduced emissions by about 220,000 metric tons, the equivalent of removing 48,000 cars from the road. In total, City government has reduced greenhouse gas emissions by 23 percent, compared to 15 percent for the private sector, and is on pace to achieve both the near-term mandates of Local Law 97, and the City’s long-term emissions reduction goals.

Analysis of Agency Budgets Fiscal Year 2022
188
• DCAS is leading the implementation of the NYC Clean Fleet Initiative to add at least 2,000 Electric Vehicles (EVs) to the City’s fleet by the year 2025, and to reduce transportation GHG emissions by 50 percent. The NYC fleet currently has more than 2,800 electric plug-in vehicles on the road. To support the growing EV fleet, the City has installed over 1,000 electric vehicle chargers so far, including 87 solar-powered electric vehicle carports and 68 fast charging stations that can charge electric vehicles in a fraction of the time of traditional chargers. The City has for the first time opened some of these chargers for public use.
• DCAS provides City agencies with guidance on personnel matters during emergency events including managing the return of the City workforce to office spaces in the age of COVID-19. After providing guidance on the development of the City’s remote work policy in March 2020, DCAS is now leading efforts and policy development for a 100% return of the workforce to on-site work by May 2021.

Analysis of Agency Budgets Fiscal Year 2022
189
2021 20222020
Actual2021
ForecastPreliminary
BudgetExecutive
Budget Forecast Preliminary
BudgetExpenditures
Salary and Wages ……….. $217,215 $215,610 $221,331 $221,769 $6,159 $438Fringe Benefits …………… 6,255 2,255 2,255 2,255 — — OTPS ……………...……… 1,616,337 1,731,950 1,074,037 1,129,105 (602,845) 55,068 Total ……………...……… $1,839,807 $1,949,815 $1,297,623 $1,353,129 ($596,686) $55,506
FundingCity ……………...………… $359,517 $373,003 $382,837 $385,493 $12,490 $2,656Other Categorical Grants … 82,388 85,139 82,108 87,067 1,928 4,959 IFA ……………...………… 1,440 1,404 1,414 1,416 12 2 State ……………...……… 56,872 66,118 61,889 62,320 (3,798) 431 Federal CD ……………...… 4,757 22,769 105 105 (22,664) — Federal Other ……………. 602,208 660,537 2,147 2,165 (658,372) 18 Intra-City Other …………… 732,625 740,845 767,123 814,563 73,718 47,440 Total ……………...……… $1,839,807 $1,949,815 $1,297,623 $1,353,129 ($596,686) $55,506
Additional Costs Centrally FundedPersonal Services (PS) Fringe Benefits ………… $59,060 $70,689 $68,424 $83,594 $12,905 $15,170 Pensions ……………...… 33,743 37,205 42,070 42,070 4,865 — Other Than Personal Service (OTPS) Debt Service ……………. 672,944 649,518 745,354 820,509 170,991 75,155 Total Additional Costs $765,747 $757,412 $855,848 $946,173 $188,761 $90,325
FundingCity ……………...………… 733,582 715,383 822,250 893,717 178,334 71,467 Non-City ……………...…… 32,165 42,029 33,598 52,456 10,427 18,858
Full Agency Costs (including Central Accounts)Salary and Wages ………… $217,215 $215,610 $221,331 $221,769 $6,159 $438Fringe Benefits …………… 65,315 72,944 70,679 85,849 12,905 15,170 Pensions ……………...…… 33,743 37,205 42,070 42,070 4,865 — Total PS ……………...…… $316,273 $325,759 $334,080 $349,688 $23,929 $15,608
OTPS ……………...……… $1,616,337 $1,731,950 $1,074,037 $1,129,105 ($602,845) $55,068Debt Service …………….. 672,944 649,518 745,354 820,509 170,991 75,155 Total OTPS $2,289,281 $2,381,468 $1,819,391 $1,949,614 ($431,854) $130,223
Total Agency Costs ……… $2,605,554 $2,707,227 $2,153,471 $2,299,302 ($407,925) $145,831Less Intra-City …………… $732,625 $740,845 $767,123 $814,563 $73,718 $47,440Net Agency Cost ………… $1,872,929 $1,966,382 $1,386,348 $1,484,739 ($481,643) $98,391
FundingCity ……………...………… 1,093,099 1,088,386 1,205,087 1,279,210 190,824 74,123 Non-City ……………...…… 779,830 877,996 181,261 205,529 (672,467) 24,268
Personnel (includes FTEs at fiscal year-end)City ……………...………… 1,850 1,943 2,043 2,048 105 5 Non-City ……………...…… 610 726 711 710 (16) (1) Total ……………...……… 2,460 2,669 2,754 2,758 89 4
Summary of Agency Financial Data The following table compares 2022 Executive Budget with the 2022 Preliminary Budget, the 2021 forecast and actual expenditures for 2020, including fringe benefits, pensions, and debt service.
2022Increase/(Decrease)($ in 000's)

Analysis of Agency Budgets Fiscal Year 2022
190
Programmatic Review and Service Impact
DCAS provides support services through the seven lines of service described below:
Human Capital
Human Capital is responsible for Citywide civil service administration, including the classification of positions and salaries, developing, validating, administering, and rating examinations, creating civil service lists, and certifying those lists to agencies to fill vacancies and reduce the number of provisional employees. Human Capital also evaluates and administers Citywide personnel policies and programs, and conducts professional development and employee training programs. It also oversees the expansion and maintenance of the New York City Automated Personnel System (NYCAPS), a centralized state-of-the-art automated personnel system for managers and employees to access and manage personnel and benefits information, including Employee Self-Service.
Facilities Management
Facilities Management actively manages and operates 56 City-owned court and office buildings totaling 15 million square feet throughout the City, which includes City Hall, the Manhattan and Brooklyn Municipal Buildings, and each of the five Borough Halls.
Real Estate Services
Real Estate Services is the real estate arm of the City of New York, which includes overseeing City-owned and/or occupied real estate, as well as negotiating and administering leases of private space for use by City agencies. Acting as the real estate advisor for City agencies, Real Estate Services assists agencies with finding suitable and cost-effective space for their operations in existing City-owned space, or through acquisition or leasing of space.
Energy Management
DCAS Energy Management (DEM) provides centralized energy management for the City government’s fixed asset portfolio. It is responsible for purchasing the energy necessary to operate the City’s schools and community colleges, cultural institutions, libraries, offices, police precincts, f ire houses, wastewater resource recovery facilities, and other essential sites. DEM continues to reduce the emissions impact of the City’s energy supply through the
deployment of solar PV systems on City infrastructure and a large-scale purchase of renewable energy. To ensure the City makes a just transition to a clean energy economy, DEM will continue to invest in reducing energy use in government buildings and enhanced social infrastructure in disadvantaged communities to help improve local energy reliability, resiliency, air quality, and public health.
Office of Citywide Procurement
The Office of Citywide Procurement (OCP) purchases, inspects, and distributes supplies and equipment at the lowest net cost, and assists in the disposal of surplus heavy equipment and goods. In Fiscal Year 2020, DCAS purchased approximately $2.6 billion of goods and services for the City, through approximately 1,200 Citywide requirement contracts and one-time purchases. DCAS leverages the City’s purchasing power to obtain the most competitive pricing for goods and services by aggregating demand and consolidating contracts. DCAS seeks to maximize Minority and Women-Owned Business Enterprise (M/WBE) vendor participation by conducting outreach and regularly representing the City at vendor fairs.
Fleet Management
The DCAS Division of Fleet Management is responsible for managing the City of New York’s over 30,000 fleet vehicles. NYC maintains fleet units at 37 dedicated fleet repair facilities and additional satellite locations and has more than 400 in-house fueling locations and 1,000 EV charging sites. Fleet Management oversees the vehicle maintenance contracts while managing the City’s fuel, vehicle accidents, defensive driver training and alternative energy programs. DCAS directs efforts to improve fleet management Citywide in areas of safety, sustainability, transparency, and shared services.
Office of Citywide Equity and Inclusion
The DCAS Office of Citywide Equity and Inclusion (OCEI) plays a vital role in ensuring an equitable work environment for all City employees. OCEI provides City agencies with advice and counsel on all matters related to equity and inclusion, responds to issues related to equity reporting and sexual harassment training, and ensures the City is compliant with reporting mandates. OCEI also provides outreach to the public about careers in civil service, including under-served populations.

Analysis of Agency Budgets Fiscal Year 2022
191
Capital Review
The Department is responsible for capital improvements to all DCAS-managed and client agency buildings including office space, warehouses, and courts; oversight and improvements to City-leased properties; the lease, acquisition and rehabilitation of City-owned non-residential waterfront and non-waterfront properties; energy efficiency initiatives; and waterfront rehabilitation. The capital program includes compliance work for public safety and legal mandates, renovation, rehabilitation, construction, design, and outfitting of various sites, including the purchase of furniture. The Department also purchases vehicles and various communications and technological equipment.
The 2022-2031 Ten-Year Capital Strategy totals $8.5 billion which includes $4.6 billion in the 2022-2025 Four-Year Plan. The table below reflects capital commitments by program area over the FY 2020-2025 period.
Capital Commitments($ in 000’s)
_________________________________________________________________________________________________________________________________ 2020 2021 2022 2023 2024 2025 Actual Plan Plan Plan Plan Plan City All City All City All City All City All City All Funds Funds Funds Funds Funds Funds Funds Funds Funds Funds Funds Funds_________________________________________________________________________________________________________________________________Rehabilitation of City- Owned Space ........................... $118,814 $119,074 $33,257 $33,257 $80,986 $80,986 $54,930 $54,930 $136,632 $136,632 $72,942 $72,942 Renovation of Other City-Owned Facilities .............. — — 122,266 124,236 20,349 20,349 5,989 5,989 72,597 72,597 1,070 1,070 Rehabilitation of Court Buildings .................................. — — (6,396) (671) — — — — 300 300 780 780 Legal Mandates and Correction of Unsafe Conditions ............... 18,858 18,858 65,615 65,615 113,463 113,463 14,243 14,243 83,224 83,224 175,888 175,888 Renovation of Leased Space ........................................ 37,106 37,106 20,166 20,166 41,531 41,531 12,540 12,540 5,613 5,613 21,637 21,637 Equipment and Interagency Services ................ 15,298 15,298 15,533 15,533 49,330 49,330 11,634 11,634 4,766 4,766 8,695 8,695 Communications Equipment ............................... — — — — 80 80 — — — — 300 300 Board of Elections ..................... (405) (405) (67) (67) — — — — 3,874 3,874 6,579 6,579 Miscellaneous Construction ....... 7,497 7,497 12,069 12,069 56,980 56,980 15,237 15,237 5,282 5,282 8,106 8,106 Acquisition of Real Property ..... — — 13,700 14,950 24,600 27,000 — — — — 100 100 Energy Efficiency and Sustainability ........................... 64,564 64,564 70,742 70,742 222,974 222,974 175,454 175,454 268,453 268,453 460,423 460,423 Resiliency and Protective Measures ................. 45,442 61,055 43,778 275,040 859,316 1,191,213 585,160 585,160 296,254 296,254 312,988 312,988 Rehabilitation of Waterfront & Non-Waterfront Properties .. 5,699 5,689 6,274 6,274 82 82 9,200 9,200 787 787 250 250 ____________ ____________ ____________ ____________ ____________ ____________ ____________ ____________ ____________ ____________ ____________ ____________
Total ........................................... $312,873 $328,736 $396,937 $637,144 $1,469,691 $1,803,988 $884,387 $884,387 $877,782 $877,782 $1,069,758 $1,069,758 ========== ========== ========== ========== ========== ========== ========== ========== ========== ========== ========== ==========

Analysis of Agency Budgets Fiscal Year 2022
192
Ten Year Capital Strategy (FY 2022-FY2031)
• Reconstruction and rehabilitation of public buildings and City-owned facilities ($686.4 million), including projects at the Manhattan Municipal Building ($153.6 million), 137 Centre Street in Manhattan ($45.0 million), 100 Gold Street in Manhattan ($42.7 million), 253 Broadway in Manhattan ($37.4 million), 2556 Bainbridge Avenue in the Bronx ($34.7 million), 1932 Arthur Avenue in the Bronx ($25.4 million), 280 Broadway in Manhattan ($25.2 million), Queens Borough Hall ($20.2 million), and 10 Richmond Terrace in Staten Island ($8.7 million).
• Legal mandates ($645.0 million), including fire/life safety upgrades to ensure Local Law 5 compliance ($422.4 million), fuel tank replacement and remediation ($86.5 million), façade upgrades to ensure Local Law 11 compliance ($74.9 million), and upgrades to bathrooms and other facilities to ensure ADA compliance ($44.0 million).
• Renovation of leased space ($360.5 million), including the expansion of New York City Emergency Management’s leased space in Brooklyn ($85.0 million).
• Equipment and interagency services ($139.3 million), including the development of a Real Estate Management System ($5.3 million).
• Renovation of other City-owned facilities ($105.0 million), including the reconstruction of 70 Mulberry Street ($80.0 million).
• Miscellaneous construction in other facilities ($96.0 million)
• Acquisition of real property ($27.1 million)
• Board of Elections modernization ($10.4 million)
• Rehabilitation of court buildings ($1.4 million)
• Communications equipment ($0.4 million)
• Rehabilitation of waterfront properties ($48.3 million)
• Rehabilitation of non-waterfront properties ($3.5 million)
• Citywide agency resiliency and waterfront rehabilitation ($2.6 billion)
• Energy efficiency measures and building retrofits ($3.8 billion), including funding for the Accelerated Conservation and Efficiency (ACE) Program ($161.5 million), solar panels at Citywide facilities ($66.2 million), Local Law 87 deep retrofits ($14.8 million), and other energy efficiency upgrades for various projects ($3.5 billion). The One City, Built to Last plan will achieve an 80 percent reduction in GHG emissions from 2005 levels by 2050.
The 2022-2025 Plan provides $4.6 billion and includes:
• Legal mandates ($386.8 million), including fire/life safety upgrades to ensure Local Law 5 compliance ($215.8 million), fuel tank replacement and remediation ($86.5 million), façade upgrades to ensure Local Law 11 compliance ($18.9 million), and upgrades to bathrooms and other facilities to ensure ADA compliance ($20.4 million).
• Reconstruction and rehabilitation of public buildings and City-owned facilities ($345.5 million), including projects at the Manhattan Municipal Building ($112.0 million), 100 Gold Street in Manhattan ($42.7 million), 253 Broadway in Manhattan ($37.4 million), 1932 Arthur Avenue in the Bronx ($25.4 million), 280 Broadway in Manhattan ($25.2 million), Queens Borough Hall ($19.8 million), and 10 Richmond Terrace in Staten Island ($8.6 million).
• Renovation of leased space ($81.3 million)
• Energy eff iciency measures and building retrofits ($1.1 billion), including funding for the Accelerated Conservation and Efficiency (ACE) Program ($161.5 million), solar panels at Citywide facilities ($66.2 million), Local Law 87 deep retrofits ($14.8 million), and other energy efficiency upgrades for various projects ($884.8 million). The One City, Built to Last plan will achieve an 80 percent reduction in GHG emissions from 2005 levels by 2050.
• Equipment and interagency services ($74.4 million), including the development of a Real Estate Management System ($5.3 million).

Analysis of Agency Budgets Fiscal Year 2022
193
• Miscellaneous construction in other facilities ($85.6 million)
• Renovation of other City-owned facilities ($100.0 million), including the reconstruction of 70 Mulberry Street ($80.0 million).
• Acquisition of real property ($27.1 million)
• Communications equipment ($0.4 million)
• Rehabilitation of court buildings ($1.1 million)
• Rehabilitation of waterfront properties ($9.2 million) and non-waterfront properties ($1.1 million)
• Citywide agency resiliency and waterfront rehabilitation ($2.4 billion)

Analysis of Agency Budgets Fiscal Year 2022
194
DEPARTMENT OF INFORMATION TECHNOLOGY AND TELECOMMUNICATIONS
The Department of Information Technology and Telecommunications (DoITT) provides the technology that enables City services for all who live, work, do business in, and visit the City of New York. Whether through DoITT’s management and development of the City’s 911 voice and text systems, the NextGen 911 transformation program, the City’s wired and radio networks, data centers, NYC.gov, the Open Data portal, the citywide rollout of 5G wireless communications on pole tops, administration of the City’s mobile telecommunication franchises, or oversight of major interagency technology initiatives and procurements, DoITT connects NYC. DoITT’s efforts help make City government more accessible, transparent and effective; empowers the public; and keeps our five boroughs safe, strong and vibrant.
In April 2020, DoITT resumed management of the NYC311 Customer Service Center, which delivers fast and easy access to government services and information to all New Yorkers. NYC311 can be reached via the call center, 311 Online, 311 Mobile App, 311 Facebook, 311 on Twitter, text messaging at 311-NYC (692) and 311 TTY at (212) 504-4115. Information and assistance are also accessible by Skyping “NYC311” or by using a video relay service at (212) NEW-YORK (212-639-9675). NYC 311’s services are available in more than 180 languages, 24 hours a day, seven days a week, 365 days a year.
DoITT also provides technology and administrative support to the Mayor’s Office of Media and Entertainment (MOME), the Mayor’s Office of Data Analytics (MODA), New York City Cyber Command (NYC3) and the Mayor’s Office of the Chief Technology Officer (MOCTO).
Financial Review
DoITT’s 2022 Executive Budget provides for an operating budget of $706.9 million, a decrease of $429.4 million over the amount forecasted for 2021. This change is largely attributable to non-city funds that have been added to support the city’s response to COVID and DoITT’s role in the vaccine rollout.
Revenue Forecast
The Department collects revenue from cable television, high capacity and mobile telecommunications franchises, advertising on wireless internet kiosks, and international programming fees for the use of the City’s NYC TV cable television network. The Department will generate $143.5 million in revenue for 2022.
Expense Budget Highlights
Budgetary Priorities: Providing Core Services
• The Department’s 2022 Executive Budget includes $126.2 million for services that DoITT purchases on behalf of client agencies, including telecommunications, data, and consultant services.
• The Department’s 2022 Executive Budget provides $216.7 million for the Infrastructure Management Division. This Division is responsible for the data center operations and fiber optic network that provide data processing and networking services to over 120 City agencies and entities, 24 hours a day, seven days a week.
• The Department’s 2022 Executive Budget provides $58.9 million for the 311 Citizen Service Center. The Service Center provides the public with continuous access to non-emergency City services through one phone number.
• The Department’s 2022 Executive Budget provides $28.2 million for the administration of the City’s five cable television channels, a broadcast station, and a radio station on the NYC TV Media Group network. The City produces programming designed to inform the public on City affairs.

Analysis of Agency Budgets Fiscal Year 2022
195
2021 20222020
Actual2021
ForecastPreliminary
BudgetExecutive
Budget Forecast Preliminary
BudgetExpenditures
Salary and Wages ……….. $159,120 $163,719 $171,298 $174,870 $11,151 $3,572Fringe Benefits …………… — 57 — 122 65 122 OTPS ……………...……… 662,561 972,499 527,934 531,887 (440,612) 3,953 Total ……………...……… $821,681 $1,136,275 $699,232 $706,879 ($429,396) $7,647
FundingCity ……………...………… $567,339 $568,335 $555,390 $557,521 ($10,814) $2,131Other Categorical Grants … 4,399 17,313 2,650 3,030 (14,283) 380 IFA ……………...………… 1,773 1,785 — 2,025 240 2,025 State ……………...……… 12,432 2,447 — 72 (2,375) 72 Federal CD ……………...… 14,206 44,563 1,700 1,700 (42,863) — Federal Other ……………. 1,455 271,943 — 2,585 (269,358) 2,585 Intra-City Other …………… 220,077 229,889 139,492 139,946 (89,943) 454 Total ……………...……… $821,681 $1,136,275 $699,232 $706,879 ($429,396) $7,647
Additional Costs Centrally FundedPersonal Services (PS) Fringe Benefits ………… $39,487 $46,374 $44,268 $55,783 $9,409 $11,515 Pensions ……………...… 23,344 25,907 29,955 29,955 4,048 — Other Than Personal Service (OTPS) Debt Service ……………. — — — — — — Total Additional Costs $62,831 $72,281 $74,223 $85,738 $13,457 $11,515
FundingCity ……………...………… 57,730 61,012 70,931 71,232 10,220 301 Non-City ……………...…… 5,101 11,269 3,292 14,506 3,237 11,214
Full Agency Costs (including Central Accounts)Salary and Wages ………… $159,120 $163,719 $171,298 $174,870 $11,151 $3,572Fringe Benefits …………… 39,487 46,431 44,268 55,905 9,474 11,637 Pensions ……………...…… 23,344 25,907 29,955 29,955 4,048 — Total PS ……………...…… $221,951 $236,057 $245,521 $260,730 $24,673 $15,209
OTPS ……………...……… $662,561 $972,499 $527,934 $531,887 ($440,612) $3,953Debt Service …………….. — — — — — — Total OTPS $662,561 $972,499 $527,934 $531,887 ($440,612) $3,953
Total Agency Costs ……… $884,512 $1,208,556 $773,455 $792,617 ($415,939) $19,162Less Intra-City …………… $220,077 $229,889 $139,492 $139,946 ($89,943) $454Net Agency Cost ………… $664,435 $978,667 $633,963 $652,671 ($325,996) $18,708
FundingCity ……………...………… 625,069 629,347 626,321 628,753 (594) 2,432 Non-City ……………...…… 39,366 349,320 7,642 23,918 (325,402) 16,276
Personnel (includes FTEs at fiscal year-end)City ……………...………… 1,627 1,679 1,795 1,808 129 13 Non-City ……………...…… 60 49 34 51 2 17 Total ……………...……… 1,687 1,728 1,829 1,859 131 30
Summary of Agency Financial Data The following table compares 2022 Executive Budget with the 2022 Preliminary Budget, the 2021 forecast and actual expenditures for 2020, including fringe benefits, pensions, and debt service.
2022Increase/(Decrease)($ in 000's)

Analysis of Agency Budgets Fiscal Year 2022
196
Programmatic Review and Service Impact
DoITT’s efforts to strengthen the equitable and transparent delivery of services to all New Yorkers are central to all of its work. When DoITT resumed management of the NYC311 Customer Service Center at the onset of the pandemic, wait times were hampering NYC311’s ability to serve New Yorkers. By the end of Fiscal 2020, wait times for critical COVID-19 related services were significantly lower, and have remained so.
In Fiscal 2020, DoITT began an effort to jumpstart the rollout of 5G technology across the City. In August 2020, DoITT began planning a rollout of 5G installations across the City that will prioritize the outer boroughs and Manhattan above 96th Street. DoITT oversees the LinkNYC franchise program, which provides free access to the internet across the City. In recognition of the essential nature of broadband, DoITT is working with its City partners to expand broadband service for residents and businesses. DoITT also continues to run and grow its robust minority and woman-owned business enterprise (M/WBE) program that encourages more City contracting with M/WBEs.
DoITT manages Citynet, the City’s institutional fiber network; NYC.gov, the City’s official website; the public safety radio networks; the Citywide Geographic Information Systems Unit; and provides administrative support to various other initiatives to help streamline agency operations and deliver services to New Yorkers.
Modernization of the 911 system
The City continues work on the modernization of the 911 telecommunications infrastructure and is in the design phase of Next Generation 911. This project entails a new, consolidated Fire and EMS dispatch system in a second, fully redundant Public Safety Answering Center (PSAC2) in the Bronx. NYPD call taking operations commenced at PSAC2 in June 2016, and FDNY call taking and EMD operations at PSAC2 went live in 2018 for all boroughs. Enhanced public safety systems, such as FireCAD and Joint Operations Center (JOC), are being deployed and EMSCAD implementation is expected to begin shortly.
Geographic Information Systems
DoITT’s Citywide Geographic Information Systems (GIS) Unit provides enterprise-wide support for geospatial applications by developing and hosting interactive maps and geo-referenced data along with associated tools and applications. This includes NYCityMap, a physical base map, and planimetrics of the City derived from aerial photography. Leveraging NYCityMap and similar technologies, DoITT works with agencies across the City to launch many interactive websites and applications serving a range of audiences and needs.
NYC311
NYC311 delivers fast and easy access to government services and information to all New Yorkers. NYC311 is committed to equitably serving the public interest of all New York City residents, business owners and visitors. With so many New Yorkers accessing government resources through 311, fair and transparent service delivery has been a primary focus, particularly for non-English speakers who 311 aims to serve in their preferred language. To ensure that 311 provides prompt service to underserved communities at all times, 311 expanded its operations at the start of the pandemic: adding additional call centers; increasing the number of surge call takers; prioritizing the hiring of Spanish-speaking call takers; and creating express lanes to prioritize COVID-related requests.
NYC.gov
NYC.gov, the official website of the City of New York, is the City’s digital face to the world. Home to more than 250 NYC.gov websites, representing City agencies, entities, organizations, and initiatives, NYC.gov receives more than 61 million unique visitors who view nearly 325 million pages of content each year. Additionally, NYC.gov serves as a launching point to City government on other digital platforms, such as mobile applications, social media, and targeted alerts. From the homepage, users can find important alerts, watch Mayoral announcements live, make a 311 service request, get customized information about their neighborhood, and discover new events and programs.

Analysis of Agency Budgets Fiscal Year 2022
197
Mayor’s Office of Media and Entertainment
The New York City Mayor’s Office of Media and Entertainment (MOME) streamlines government communications by making more information accessible, leveraging technology to aid in the transparency of government, and by supporting relevant industries in New York City. MOME consists of the Office of Film, Theatre and Broadcasting, the Office of Nightlife, and NYC Media, the official television, radio, and online network of the City of New York.
Streamlining Agency Operations
DoITT will continue to leverage data centers, fiber optic and wireless data networks, and other resources in order to achieve cost savings for City agencies in need of internet access, data center hosting and management, e-mail, security and firewall solutions, disaster recovery sites, wireless solutions, and remote access. The DoITT Capital Plan for 2022-2031 includes $915.6 million for infrastructure improvements associated with these Citywide initiatives.

Analysis of Agency Budgets Fiscal Year 2022
198
ECONOMIC DEVELOPMENT
Fostering economic development in New York City requires a multi-faceted approach, coordinated between multiple agencies. The two main entities responsible for economic development in the City are the Department of Small Business Services (SBS) and the New York City Economic Development Corporation (NYCEDC). SBS makes it easier for businesses in New York City to form, do business and grow by providing direct assistance to business owners, fostering neighborhood development in commercial districts and linking employers to a skilled and qualified workforce. NYCEDC’s mission is to encourage inclusive economic growth throughout the five boroughs of New York City by facilitating investments that create jobs and strengthen neighborhoods. Together, SBS and NYCEDC oversee programming to achieve the City’s economic development goals.
The Department of Small Business Services (SBS)
SBS aims to unlock economic potential and create economic security for all New Yorkers by connecting people to quality jobs, building stronger businesses, and fostering thriving neighborhoods across the five boroughs. SBS operates the City’s NYC Business Solutions Centers, Industrial Business Solutions Provider Network and Workforce1 Career Centers; provides services to support the growth of local community development organizations throughout the City; and administers the Minority and Women-owned Business Enterprise (M/WBE) Program. SBS also contracts with NYCEDC, NYC & Company, the Trust for Governors Island (TGI) and the Brooklyn Navy Yard Development Corporation (BNYDC), to bolster economic development in the five boroughs.
New York City Economic Development Corporation (NYCEDC)
NYCEDC is a not for profit organization under contract with SBS. It manages City-owned properties and invests in major infrastructure upgrades and capital projects; conducts area-wide planning and real estate development; and works to support the City’s major business sectors. NYCEDC addresses challenges faced by industries through analysis of current economic trends, development of strategies and solutions, and implementation of programs that help businesses thrive and grow. Through the New York City Industrial Development Agency (NYCIDA) and Build New York City Resource Corporation (Build NYC), NYCEDC helps eligible businesses meet financing needs for property acquisition, new equipment, renovation and working capital through low-cost tax-exempt bonds and exemptions and abatements of selected City and State taxes.
Brooklyn Navy Yard Development Corporation (BNYDC) and Trust for Governors Island (TGI)
SBS also contracts with the BNYDC and the TGI for the purposes of economic development and rehabilitating City-owned assets. Since 1981, BNYDC has operated the Brooklyn Navy Yard on behalf of the City and has diversified the types of businesses that operate at the Navy Yard. Currently, over 450 businesses employ nearly 11,000 people at the Navy Yard’s 300-acre campus.
In 2011, the City of New York assumed responsibility for the development and operation of Governors Island, located in Upper New York Harbor. Since assuming control of the Island, the City has made major investments at the Island for public access and to prepare it for future development. With these investments, TGI has fortified the Island against natural disasters, rehabilitated the Island’s electrical and maritime infrastructure, created new parkland, and stabilized historic buildings.
Financial Review
The 2022 Executive Budget provides $317.6 million in operating expenses at SBS, comprised of $90.9 million of City funding and $226.7 million of non-City sources. The SBS operating budget includes allocations for NYCEDC, the Mayor’s Office of Environmental Remediation (MOER), NYC & Company and the TGI.
City-funded capital commitments of $2.6 billion are forecast in the 2022-2025 capital plan. Of this amount, $2.5 billion reflects Mayoral commitments. The remaining $62.3 million reflects Elected Official commitments.

Analysis of Agency Budgets Fiscal Year 2022
199
Expense Budget Highlights
SBS
• The Workforce Development Division helps New Yorkers build careers and connect to jobs. Workforce Development programs are currently budgeted at $59.2 million in 2022.
• The Business Services Division helps businesses to start, operate and grow. The 2022 Executive Budget provides $116.7 million in City and Federal funds.
• The Neighborhood Development Division strengthens commercial neighborhoods and supports the City’s network of 76 Business Improvement Districts (BIDs). The 2022 Executive Budget provides $10.7 million in City and Federal funds.
• The Division of Economic and Financial Opportunity certifies minority- and women-owned businesses (M/WBEs) for government contracts, provides technical assistance to M/WBEs, and works to ensure parity in the City’s hiring practices. The City's M/WBE Program is held accountable through the Mayor’s Office of M/WBEs (OM/WBE) oversight. O/MWBE also provides support as a One-Stop resource for M/WBEs interested in doing business with the City and its agencies. The 2022 Executive Budget provides $9.2 million in City and Federal funds. Supplemental private funds that also support M/WBEs are not reflected in the FY2022 Executive Budget.
NYCEDC• NYCEDC derives revenues primarily from the
management of City-owned property, financing fees, and land sale proceeds. Additionally, through a contract with SBS, NYCEDC will receive $31.5M in City and federal stimulus funding in 2022.
NYC and Co.
• Through a contract with SBS, NYC & Company will receive $46.2 million in federal stimulus funding in 2022 for its work to promote the City as the country’s premier tourist destination, serve as the City’s official marketing organization, and to provide partnership services.
Trust for Governors Island
• Through a contract with SBS, TGI will receive $14.4 million in City funding towards the management and operation of the Island in 2022, as well as capital funds for further investment in infrastructure, improvement of the ferry landings, and restoration of landmark buildings.
Brooklyn Navy Yard Development Corporation (BNYDC)
• BNYDC is self-sustaining and receives no direct operating funds from the City, deriving revenues primarily from the management of City properties. Through a contract with SBS, BNYDC will receive capital funds for investments in infrastructure.

Analysis of Agency Budgets Fiscal Year 2022
200
2021 20222020
Actual2021
ForecastPreliminary
BudgetExecutive
Budget Forecast Preliminary
BudgetExpenditures
Salary and Wages ……….. $26,222 $28,112 $28,190 $30,371 $2,259 $2,181Fringe Benefits …………… — — — — — — OTPS ……………...……… 313,888 317,453 124,649 287,253 (30,200) 162,604 Total ……………...……… $340,110 $345,565 $152,839 $317,624 ($27,941) $164,785
FundingCity ……………...………… $153,195 $128,729 $103,980 $90,883 ($37,846) ($13,097)Other Categorical Grants … 1,798 387 354 354 (33) — IFA ……………...………… — — — — — — State ……………...……… 2,078 2,124 2,083 2,083 (41) — Federal CD ……………...… 6,383 7,389 6,901 7,284 (105) 383 Federal Other ……………. 173,091 204,637 38,961 216,460 11,823 177,499 Intra-City Other …………… 3,565 2,299 560 560 (1,739) — Total ……………...……… $340,110 $345,565 $152,839 $317,624 ($27,941) $164,785
Additional Costs Centrally FundedPersonal Services (PS) Fringe Benefits ………… $7,069 $8,712 $8,155 $10,195 $1,483 $2,040 Pensions ……………...… 4,075 4,293 4,936 4,936 643 — Other Than Personal Service (OTPS) Debt Service ……………. 121,037 91,336 107,286 72,309 (19,027) (34,977) Total Additional Costs $132,181 $104,341 $120,377 $87,440 ($16,901) ($32,937)
FundingCity ……………...………… 125,242 97,874 112,938 80,913 (16,961) (32,025) Non-City ……………...…… 6,939 6,467 7,439 6,527 60 (912)
Full Agency Costs (including Central Accounts)Salary and Wages ………… $26,222 $28,112 $28,190 $30,371 $2,259 $2,181Fringe Benefits …………… 7,069 8,712 8,155 10,195 1,483 2,040 Pensions ……………...…… 4,075 4,293 4,936 4,936 643 — Total PS ……………...…… $37,366 $41,117 $41,281 $45,502 $4,385 $4,221
OTPS ……………...……… $313,888 $317,453 $124,649 $287,253 ($30,200) $162,604Debt Service …………….. 121,037 91,336 107,286 72,309 (19,027) (34,977) Total OTPS $434,925 $408,789 $231,935 $359,562 ($49,227) $127,627
Total Agency Costs ……… $472,291 $449,906 $273,216 $405,064 ($44,842) $131,848Less Intra-City …………… $3,565 $2,299 $560 $560 ($1,739) $—Net Agency Cost ………… $468,726 $447,607 $272,656 $404,504 ($43,103) $131,848
FundingCity ……………...………… 278,437 226,603 216,918 171,796 (54,807) (45,122) Non-City ……………...…… 190,289 221,004 55,738 232,708 11,704 176,970
Personnel (includes FTEs at fiscal year-end)City ……………...………… 203 213 223 227 14 4 Non-City ……………...…… 106 113 116 134 21 18 Total ……………...……… 309 326 339 361 35 22
Summary of Agency Financial Data The following table compares 2022 Executive Budget with the 2022 Preliminary Budget, the 2021 forecast and actual expenditures for 2020, including fringe benefits, pensions, and debt service.
2022Increase/(Decrease)($ in 000's)

Analysis of Agency Budgets Fiscal Year 2022
201
Programmatic Review and Service Impact
Department of Small Business Services
SBS works to foster a thriving, equitable economy and promote inclusive growth by connecting New Yorkers to good jobs, creating stronger businesses, and building a fairer economy. It does this by linking employers to a skilled and qualified workforce, providing direct assistance to business owners, reducing the burden of regulation, supporting neighborhood development in commercial districts, and promoting financial and economic opportunity among minority- and women-owned businesses.
Workforce Development Division (WDD)
The Workforce Development Division helps New Yorkers find jobs by connecting them to employment opportunities and industry-informed training. In 2020, Workforce1 Career Centers served more than 93,944 jobseekers, providing recruitment expertise, industry knowledge, and skill-building workshops to match candidates to jobs and training opportunities. Additionally, the Workforce1 system helped to connect New Yorkers to more than 26,204 jobs.
Division of Business Services (DBS)
The Division of Business Services helps small businesses start, operate, and thrive by providing free business services through NYC Business Solutions Centers in all five boroughs.
Centers are open in the South Bronx, Upper Manhattan, Queens, Downtown Brooklyn, Washington Heights, Staten Island and Lower Manhattan. In 2020, SBS’s NYC Business Solutions Centers facilitated or distributed financing awards to 4,750 unique businesses; enabled 376 establishments to open; and served 22,460 unique customers and businesses.
The Emergency Response Unit, in coordination with the Mayor’s Office of Emergency Management, assists businesses affected by disasters by providing updates on building re-openings, facilitating the resolution of matters affecting day-to-day business operations, and compiling evidence to support business claims for assistance.
Neighborhood Development Division (NDD)
NDD supports community-based economic development organizations throughout New York City in order to strengthen neighborhood commercial corridors and to create conditions under which local businesses thrive and residents can access to a vibrant mix of goods and services. SBS offers technical assistance, capacity building workshops and webinars, best practice sharing, board of director’s support and contract administration and oversight to the City’s 76 existing BIDs, the largest network of its kind in the country.
Division of Economic and Financial Opportunity (DEFO)
SBS works to ensure that the City’s procurement process reflects the great diversity of this City, and that government uses all levers available to strengthen minority and women-owned businesses. The Division of Economic and Financial Opportunity focuses on helping minority and women owned firms certify with the City, and build their capacity so they can compete and win contracts in the public and private sectors. Mayor de Blasio has made significant investments in the M/WBE program and set ambitious goals to support M/WBEs, including certifying 9,000 M/WBEs by 2019. As of 2020, SBS has certified 10,034 M/WBEs, more than doubling the certified pool of M/WBEs in less than three years.
New York City Economic Development Corporation
As the City’s primary vehicle for advancing inclusive economic development, NYCEDC coordinates with both the private and public sectors to promote economic development activities across a diverse set of industries and neighborhoods. To support industrial and commercial development, and improve transportation and waterfront infrastructure, NYCEDC utilizes a combination of City capital funds and NYCEDC revenue to manage the City’s industrial, waterfront and commercial assets.

Analysis of Agency Budgets Fiscal Year 2022
202
Industry Support and Small Business Assistance
NYCEDC provides several small business lending, guarantee, and bond programs, as well as a range of sector-based programs and initiatives designed to spur growth and innovation in strategic sectors of the City’s economy. The purpose of these programs is to create jobs, and retain and expand businesses through financial assistance, incubator space or talent development initiatives. NYCEDC has served over 1,500 businesses across the five boroughs through incubators, accelerators and innovation programs in the last year.
Waterfront Development
NYCEDC manages and assists in the redevelopment of City-owned waterfront industrial property. This includes the Manhattan and Brooklyn Cruise Terminals and the operation of the NYC Ferry Service. Initially launched in 2017, NYC Ferry now operates all six original routes extending from the Rockaways in Queens to Soundview in the Bronx.
As announced in Mayor DeBlasio’s 2019 State of the City, service will expand to connect Staten Island’s north shore, Manhattan’s west side, Coney Island and the Throgs Neck neighborhood of the Bronx to the NYC Ferry system.
Asset Management
NYCEDC helps the City manage and sell its real estate assets. NYCEDC also conducts real estate planning and development, disposes of City-owned property, releases RFPs to develop City assets, and conducts neighborhood-wide planning, throughout the five boroughs. The asset management portfolio includes over 230 City-owned properties, which includes more than 65 million square feet of commercial and industrial real estate properties as well as transportation, critical infrastructure, and energy assets. This includes the Brooklyn Army Terminal (BAT), which is currently 94 percent occupied, with over 100 tenants employing nearly 4,000 workers.
NYCEDC also oversees the New York City Industrial Development Agency (NYCIDA) and the Build NYC Resource Corporation (Build NYC) to provide financing and tax assistance for capital expansion projects for industrial and commercial companies and not-for-profit organizations. The NYCIDA provides low-cost tax-exempt bonds and exemptions and abatements of selected City and State taxes to create and retain jobs. By working with Build NYC, not-for-profit institutions are able to access triple tax-exempt bonds that can lower the costs of financing their capital needs and free up funds to invest in their programs. Since January 2014 NYCIDA closed on 99 projects and Build NYC closed on 116 projects as of March 31, 2021.

Analysis of Agency Budgets Fiscal Year 2022
203
Capital Review
The primary goal of the Ten Year Capital Plan is to encourage development in order to create and retain jobs in New York City, to bolster the City’s tax base, and to maintain City-owned facilities in a state of good repair. The 2022-2031 Ten-Year Capital Strategy totals $4.8 billion in City capital funding which includes $2.6 billion in the 2022-2025 Four-Year Plan.
The following chart shows Capital plan commitments by major function over the 2022-2025 period.
Capital Commitments($ in 000’s)
__________________________________________________________________________________________________________________________________________ 2020 2021 2022 2023 2024 2025 Actual Plan Plan Plan Plan Plan City All City All City All City All City All City All Funds Funds Funds Funds Funds Funds Funds Funds Funds Funds Funds Funds _______________________________________________________________________________________________________________________________________________________Neighborhood Revitalization ........ $41,403 $39,466 $239,166 $257,558 $308,021 $326,088 $72,969 $75,669 $82,315 $82,316 $250,694 $265,245 Waterfront Development ............... $95,379 $95,613 $82,745 $83,791 $114,967 $160,757 $42,637 $42,637 $22,087 $31,619 $13,739 $17,910 Industrial Development ................. $24,154 $30,071 $172,788 $232,755 $177,854 $241,410 $113,959 $113,959 $84,641 $84,641 $106,711 $112,992 Commercial Development ............ $1,964 $2,573 $8,386 $16,699 $9,017 $9,017 $75,905 $76,335 $101,841 $101,841 $121,639 $123,639 Miscellaneous ............................... $104,594 $104,594 $149,841 $203,452 $289,390 $316,742 $116,762 $116,762 $149,867 $149,867 $201,883 $201,936 Community Development ............. $2,666 $2,666 $121,499 $121,499 $39,384 $39,384 $18,161 $18,161 $1,755 $1,770 $7,069 $7,069 Market Development..................... $2,312 $2,312 $3,834 $4,329 $7,494 $7,494 $12,818 $12,818 $10,273 $10,593 $8,321 $8,321 Cultural Development ................... $(269) $(269) $— $— $— $— $— $— $— $— $— $— Port Development ......................... $(620) $(620) $— $— $— $— $— $— $— $— $— $— ___________ ___________ ___________ ___________ ___________ ___________ ___________ ___________ ___________ ___________ ___________ ___________
Total .............................................. $271,583 $276,406 $778,259 $920,083 $946,127 $1,100,892 $453,211 $456,341 $452,779 $462,647 $710,056 $737,112
========= ========= ========= ========= ========= ========= ========= ========= ========= ========= ========= =========
Highlights of the 2022-2025 Four Year Capital Plan:
• A total of $326 million for projects related to the re-zonings proposed in neighborhood plans developed by the Department of City Planning, funded by the Neighborhood Development Fund, to help provide for critical infrastructure work.
• A total of $313 million for the development of the Manhattan Greenway, a continuous 32.5-mile route around Manhattan intended to transform the waterfront into a green attraction for recreational and commuting use.
• A total of $308 million for the Mayor’s Life Sciences Initiative to fund lab space and equipment for cure-producing research in labs and incubators.
• A total of $214 million for development, management and rehabilitation of City-owned waterfront sites, Citywide, including Phase 1 and II of the New Stapleton Waterfront Development Project.
• A total of $172 million for onsite and offsite development at Willets Point which will activate 6-acres of unused land for affordable housing and community use.
• A total of $93 million for infrastructure work related to the NYC Ferry Service.
• A total of $86 million for the development of the Made in New York campus at Bush Terminal.
• A total of $412 million for the rehabilitation of existing structures, public access improvements, and infrastructure upgrades to support future redevelopment at Brooklyn Navy Yard.
• A total of $131 million for the rehabilitation of existing structures, public access improvements, and infrastructure upgrades to support public open space and future redevelopment at Governors Island.
Analysis of Agency Budgets Fiscal Year 2022
204
LIBRARIES
The City of New York funds three independently operated public library systems, each administered by a separate board of trustees. The Brooklyn Public Library (BPL) oversees the operation of 58 branches and a Central Library. The New York Public Library (NYPL) is made up of four research libraries all located in Manhattan and 88 neighborhood branches throughout the Bronx (35 branches), Manhattan (40 branches), and Staten Island (13 branches). NYPL’s four research libraries are the Stephen A. Schwarzman Building, the New York Public Library for the Performing Arts, the Schomburg Center for Research in Black Culture, and the Thomas Yoseloff Business Center. The Queens Public Library (QPL) consists of 66 branches including a Central Library, seven adult learning centers, a technology center, a universal pre-kindergarten, and two teen centers.
Financial Review
The Libraries 2022 Executive Budget provides for operating expenses of $405.2 million. It also provides for City funded capital commitments of $980.2 million and $16.3 million in non-City funds.
Expense Budget Highlights
Budgetary Priorities: Providing Core Services
• In 2022, the operating subsidy for the Brooklyn Public Library will be $111.0 million.
• In 2022, the operating subsidy for the New York Public Library will be $148.9 million.
• In 2022, the operating subsidy for the New York Public Library’s research libraries will be $29.6 million.
• In 2022, the operating subsidy for the Queens Public Library will be $115.7 million.

Analysis of Agency Budgets Fiscal Year 2022
205
2021 2022
2020 Actual
2021Forecast
Preliminary Budget
ExecutiveBudget Forecast
Preliminary Budget
ExpendituresSalary and Wages ……… $— $— $— $— $— $—Fringe Benefits ………… — — — — — — OTPS …………………… 431,448 428,350 403,171 405,212 (23,138) 2,041 Total …………………… $431,448 $428,350 $403,171 $405,212 ($23,138) $2,041
FundingCity …………………… $426,243 $421,599 $403,171 $405,212 ($16,387) $2,041Other Categorical Grants 941 — — — — — IFA ……………………… — — — — — — State …………………… — — — — — — Federal CD ……………… — — — — — — Federal Other …………… — — — — — — Intra-City Other ………… 4,264 6,751 — — (6,751) — Total …………………… $431,448 $428,350 $403,171 $405,212 ($23,138) $2,041
Additional Costs Centrally FundedOther Than Personal Service (OTPS) Fringe Benefits ………… $2,057 $2,328 $2,456 $2,453 $125 ($3) Pensions ……………… 34,014 36,721 38,251 38,251 1,530 — Debt Service …………… 72,223 74,776 86,842 84,892 10,116 (1,950) Total Additional Costs $108,294 $113,825 $127,549 $125,596 $11,771 ($1,953)
FundingCity …………………… 106,182 111,704 125,103 123,190 11,486 (1,913) Non-City ……………… 2,112 2,121 2,446 2,406 285 (40)
Full Agency Costs (including Central Accounts)Fringe Benefits ………… $2,057 $2,328 $2,456 $2,453 $125 ($3)OTPS …………………… 431,448 428,350 403,171 405,212 (23,138) 2,041 Pensions ………………… 34,014 36,721 38,251 38,251 1,530 — Debt Service …………… 72,223 74,776 86,842 84,892 10,116 (1,950) Total OTPS …………… $539,742 $542,175 $530,720 $530,808 ($11,367) $88
Total Agency Costs …… $539,742 $542,175 $530,720 $530,808 ($11,367) $88Less Intra-City ………… $4,264 $6,751 $— $— ($6,751) $—Net Agency Cost ……… $535,478 $535,424 $530,720 $530,808 ($4,616) $88
FundingCity …………………… 532,425 533,303 528,274 528,402 (4,901) 128 Non-City ……………… 3,053 2,121 2,446 2,406 285 (40)
Personnel (includes FTEs at fiscal year-end)City …………………… — — — — — — Non-City ……………… — — — — — — Total …………………… — — — — — —
* The 2022 Executive Budget provides an estimated 4,086 full-time and full-time equivalent positions, which are funded with City subsidies.
Summary of Agency Financial Data
2022Increase/(Decrease)
The following table compares 2022 Executive Budget with the 2022 Preliminary Budget, the 2021 forecast and actual expenditures for 2020, including fringe benefits, pensions, and debt service.
($ in 000's)

Analysis of Agency Budgets Fiscal Year 2022
206
Programmatic Review and Service Impact
The three library systems will continue to provide services throughout the five boroughs at existing branches and at recently opened or rehabilitated libraries:
• Capital projects completed in 2020 include the renovation of the second floor of the Bloomingdale branch, and an infrastructure upgrade and interior renovation at the New Amsterdam branch.
• The new Roosevelt Island branch, tripling the size of the former location, opened in January 2021.
• A new branch, Charleston, is being added to the Staten Island community and is scheduled to open in Fall 2021.
• The renovation of the Glendale branch is scheduled to be completed by June 2021.
• The renovation of the Steinway branch is scheduled to be completed by September 2021.
• The new Far Rockaway branch is expected to be open by October 2021.
• In 2020, BPL opened the new Greenpoint Library and Environmental Education Center.
• Fit-outs of the Brooklyn Heights, Adams Street, and Brower Park library branches are ongoing and expected to be completed in summer 2021. Adams Street Library will be the first new BPL branch in over 30-years.
• The newly-renovated Rugby Library is near completion and will reopen in Fall 2021.
The three library systems continue to provide a variety of community programming throughout the five boroughs:
• The Brooklyn Public Library (BPL) offered a wide variety of programs and services in its library branches, which had over 5.3 million visits in fiscal year 2020 before the pandemic forced the Library to close its doors. Over the course of Fiscal Year 2020, BPL offered almost 50,000 free programs to the public, attracting 1.2 million attendees, including cultural programming, English for Speakers of Other
Languages (ESOL) classes and Know Your Rights workshops, grief support groups, personalized job assistance, tutoring and homework help for remote students, and others. In the first four months of the pandemic, 146,000 children tuned into BPL’s multilingual virtual storytimes and an estimated 48,000 patrons were able to access WiFi outside of its libraries. For the 2020 Census, the Library’s Census Coordinator and multilingual Census Navigators provided relevant, trustworthy information about the count to Brooklyn’s traditionally hard-to-count communities. The Library has partnered with the New York City Health & Hospitals Test & Trace Corps to distribute masks and reach Brooklynites with information about essential resources such as free testing sites and emergency food relief.
• The New York Public Library (NYPL) has been an essential presence in the Bronx, Manhattan, and Staten Island for more over 125 years, providing a safe and reliable space for all New Yorkers, regardless of their background or means. During Fiscal Year 2019, NYPL had nearly 16.4 million visits across its 92 locations, offering 107,966 programs and classes with over two million attendees. After temporarily closing all of its physical locations in March 2020 due to COVID-19, NYPL pivoted to hybrid service models which expanded digital offerings and reintroduced in-person services with an emphasis on public health and equity. Since March 2020, NYPL has seen over 124,000 new library card sign-ups through its SimplyE app, and over 5.2 million digital checkouts. The Library introduced new initiatives to serve New Yorkers during this unprecedented time including virtual storytimes for children and their caregivers, live tutoring for students in partnership with Brainfuse, the “Get Lit With All Of It” book club in partnership with WNYC, multilingual resources and virtual ESOL classes, and one-on-one support programs for job-seekers. NYPL began to gradually reopen locations beginning in July 2020, and as of April 2021, 54 locations have resumed limited service for physical materials. Via a “Grab and Go” service model, patrons can reserve materials by phone or online pickup at a neighborhood branch. The new Shelf Help service allows patrons to request a bundle of books matched to their interests and selected by branch staff. Furthermore, NYPL’s research centers expanded digital access to collections and databases, and introduced “Scan and

Analysis of Agency Budgets Fiscal Year 2022
207
Deliver” service for patrons to request selections of books and scholarly journals for digital delivery. NYPL has partnered with the City on initiatives to help manage the pandemic while serving those New Yorkers most affected by its impacts, with closed branches serving as COVID-19 testing sites, polling sites, cooling centers, and DYCD Learning Labs.
• In 2021, as Queens Public Library (QPL) works to
help build an equitable city, it is also celebrating the 125th anniversary of its founding in 1896. In Fiscal Year 2019, QPL welcomed nearly 11 million visitors to its 66 locations, and its collection items circulated 12.5 million times. Three million people used QPL’s computers to access the internet, and over 500,000 people connected to the internet through its Wi-Fi network. In addition, a record 1.5 million people participated in more than 87,500 library programs, such as early childhood literacy, English for Speakers of Other Languages (ESOL) classes, job skills training, and streaming art classes for the homebound. Through its foundation’s “Innovation Fund,” QPL staff received grants for eight initiatives to deepen customer engagement and learning, ranging from a community archiving program to intergenerational learning for immigrant grandparents and their grandchildren. Over the course of the pandemic, starting March 2020, as QPL closed its physical locations and then gradually and safely reopened them, the Library system adapted its programming to virtual platforms and offered approximately 10,000 classes, workshops, concerts, author talks and more, drawing over 180,000 live attendees with tens of thousands more viewing the recorded material when their schedules allowed. Furthermore, QPL has collaborated with the City on a major outreach campaign to promote an accurate 2020 Census count, and has also partnered with the City to convert one of its branches into a NYCDOE Learning Bridges site, three of its branches into COVID-19 testing sites, and two others into vaccination sites.

Analysis of Agency Budgets Fiscal Year 2022
208
Capital Review
The 2022-2031 Ten-Year Capital Strategy for the Libraries totals $996.5 million. The table below reflects capital commitments by system over the 2020-2025 period.
Capital Commitments($ in 000’s)
_______________________________________________________________________________________________________________________________________________________________________________________________________________
2020 2021 2022 2023 2024 2025 Actual Plan Plan Plan Plan Plan ________________________ ___________ ____________ ________________________ _______________________ ________________________ _______________________
City All City All City All City All City All City All Funds Funds Funds Funds Funds Funds Funds Funds Funds Funds Funds Funds_______________________________________________________________________________________________________________________________________________________________________________________________________________
Brooklyn Public Library ............. $3,794 $3,794 $29,257 $29,257 $49,880 $49,880 $59,769 $59,769 $51,706 $51,706 $123,921 $123,921New York Public Library ............ 19,648 19,648 66,865 66,865 116,677 116,677 47,433 47,433 38,000 38,000 41,611 41,611NYPL Research Libraries .......... 307 307 -20 -20 750 750 472 472 299 299 387 387Queens Borough Public Library 9,824 9,824 24,592 26,798 45,870 51,829 79,059 79,059 80,292 80,292 78,557 78,557 ___________ ___________ ___________ ___________ ___________ ___________ ___________ ___________ ___________ ___________ ___________ ___________
Total ............................................... $33,573 $33,573 $120,694 $122,900 $213,177 $219,136 $186,733 $186,733 $170,297 $170,297 $244,476 $244,476 ========= ========= ========= ========= ========= ========= ========= ========= ========= ========= ========= =========
_______________________________________________________________________________________________________________________________________________________________________________________________________________
Highlights of the Ten-Year Plan include:
Brooklyn Public Library (BPL):
The 2022-2031 Ten-Year Capital Strategy allocates $308.3 million for various renovations and improvements at BPL branches, including:
• Complete overhaul of the five branches (Brownsville, Canarsie, Eastern Parkway, New Lots, and New Utrecht) identified as most critical ($127.5 million).
• Phase two of a comprehensive renovation at Central Library ($26.3 million).
• Infrastructure upgrades at Washington Irving Library ($10.1 million).
• Interior and exterior rehabilitation of Walt Whitman Library ($7.4 million).
• Critical maintenance and improvement of Red Hook Library ($14.5 million).
New York Public Library (NYPL), which includes projects in the Bronx, Manhattan, and Staten Island:
The 2022-2031 Ten-Year Capital Strategy allocates $289.5 million for various renovations and improvements at NYPL branches and research libraries, including:
• Comprehensive renovations at f ive Carnegie branches (Port Richmond, Hunts Point, Melrose, 125th Street, and Fort Washington - $71.2 million, in addition to $30.5 million in 2021).
• Construction of the new Westchester Square branch in the Bronx ($28.4 million, in addition to $1.0 million in 2021).
• Branch expansion at the Woodlawn branch in the Bronx ($8.0 million, in addition to $0.4 million in 2021).
• A new HVAC system at the New Dorp branch in Staten Island ($3.3 million, in addition to $0.5 million in 2021).
• Renovation of the Hudson Park branch in Manhattan ($6.2 million).
Queens Public Library (QPL):
The 2022-2031 Ten-Year Capital Strategy allocates $398.7 million for various renovations and improvements at QPL branches, including:
• Interior alteration and HVAC upgrade at the Hollis branch ($11.3 million).
• Phases 3 and 4 of the Broadway branch renovation ($8.0 million).
• HVAC replacement at the Queens Village branch ($3.0 million, in addition to $0.3 million in 2021).
• Expansion of the Arverne branch ($13.6 million, in addition to $0.4 million in 2021).
• Comprehensive renovation of the Woodhaven branch ($17.2 million).

Analysis of Agency Budgets Fiscal Year 2022
209
THE DEPARTMENT OF CULTURAL AFFAIRS
The Department of Cultural Affairs (DCLA) is responsible for supporting and strengthening the City’s vibrant cultural life through funding, technical assistance, and advocacy for more than 1,200 nonprofit cultural organizations across New York City, including museums, dance companies, theaters, performing arts organizations, botanical gardens, zoos, and a wide array of other cultural organizations.
The City supports operations at the 34 City-owned cultural institutions known as the Cultural Institutions Group (CIG). This group includes diverse organizations such as the Bronx Zoo, Queens Botanical Garden, Snug Harbor Cultural Center, Studio Museum Harlem, and Weeksville Heritage Center.
DCLA provides support for capital improvements at more than 200 cultural organizations throughout the five boroughs. Funding is provided for infrastructure, renovation, expansion, equipment, and public art projects. In 2021, DCLA also provided program grants and support services for more than 1,000 cultural organizations citywide, including groups such as Jacques Marchais Center of Tibetan Arts, Bronx Documentary Center, Rockaway Waterfront Alliance, Spiderwoman Theater Workshop, Staten Island MakerSpace, National Jazz Museum Harlem, Literary Freedom Project, Stuttering Association for the Young, Brighton Ballet Theater Company, Queens Historical Society and Ifetayo Cultural Arts Facility.
Financial Review
The Department of Cultural Affairs’ 2022 Executive Budget provides for operating expenses of $170.2 million. It also provides for City funded capital commitments of $979.5 million and $2.4 million in non-City funds.
Expense Budget Highlights
Budgetary Priorities: Providing Core Services
• The City’s 34 CIG institutions will receive operating support of $108.2 million, including $39.7 million in energy subsidies.
• In the 2022 Executive Budget, various cultural organizations citywide will receive program grants totaling $55.5 million.
• The 2022 Executive Budget contains $6.5 million in operating funds for the Department of Cultural Affairs’ staff, rent, supplies, and equipment.

Analysis of Agency Budgets Fiscal Year 2022
210
2021 20222020
Actual2021
ForecastPreliminary
BudgetExecutive
Budget Forecast Preliminary
BudgetExpenditures
Salary and Wages ……….. $5,201 $5,160 $4,929 $4,805 ($355) ($124)Fringe Benefits …………… — — — — — — OTPS ……………...……… 204,660 182,614 139,255 165,396 (17,218) 26,141 Total ……………...……… $209,861 $187,774 $144,184 $170,201 ($17,573) $26,017
FundingCity ……………...………… $202,902 $181,455 $143,659 $144,884 ($36,571) $1,225Other Categorical Grants … 1,348 36 — — (36) — IFA ……………...………… 162 257 249 288 31 39 State ……………...……… 161 3 3 3 — — Federal CD ……………...… 82 498 260 — (498) (260) Federal Other ……………. — 500 — 25,000 24,500 25,000 Intra-City Other …………… 5,206 5,025 13 26 (4,999) 13 Total ……………...……… $209,861 $187,774 $144,184 $170,201 ($17,573) $26,017
Additional Costs Centrally FundedPersonal Services (PS) Fringe Benefits ………… $1,337 $1,609 $1,399 $1,857 $248 $458 Pensions ……………...… 9,158 11,793 11,815 11,815 22 — Other Than Personal Service (OTPS) Debt Service ……………. 215,910 174,046 202,127 261,629 87,583 59,502 Total Additional Costs $226,405 $187,448 $215,341 $275,301 $87,853 $59,960
FundingCity ……………...………… 220,005 182,203 209,554 267,468 85,265 57,914 Non-City ……………...…… 6,400 5,245 5,787 7,833 2,588 2,046
Full Agency Costs (including Central Accounts)Salary and Wages ………… $5,201 $5,160 $4,929 $4,805 ($355) ($124)Fringe Benefits …………… 1,337 1,609 1,399 1,857 248 458 Pensions ……………...…… 9,158 11,793 11,815 11,815 22 — Total PS ……………...…… $15,696 $18,562 $18,143 $18,477 ($85) $334
OTPS ……………...……… $204,660 $182,614 $139,255 $165,396 ($17,218) $26,141Debt Service …………….. 215,910 174,046 202,127 261,629 87,583 59,502 Total OTPS $420,570 $356,660 $341,382 $427,025 $70,365 $85,643
Total Agency Costs ……… $436,266 $375,222 $359,525 $445,502 $70,280 $85,977Less Intra-City …………… $5,206 $5,025 $13 $26 ($4,999) $13Net Agency Cost ………… $431,060 $370,197 $359,512 $445,476 $75,279 $85,964
FundingCity ……………...………… 422,907 363,658 353,213 412,352 48,694 59,139 Non-City ……………...…… 8,153 6,539 6,299 33,124 26,585 26,825
Personnel (includes FTEs at fiscal year-end)City ……………...………… 63 61 58 58 (3) — Non-City ……………...…… 4 5 5 3 (2) (2) Total ……………...……… 67 66 63 61 (5) (2)
*
Summary of Agency Financial Data The following table compares 2022 Executive Budget with the 2022 Preliminary Budget, the 2021 forecast and actual expenditures for 2020, including fringe benefits, pensions, and debt service.
2022Increase/(Decrease)($ in 000's)
The 2022 Executive Budget provides an estimated 1,406 full-time and full-time equivalent positions, which are funded with City subsidies.

Analysis of Agency Budgets Fiscal Year 2022
211
Programmatic Review and Service Impact
• Despite unprecedented challenges, DCLA retains a robust level of support for cultural groups. The work of the agency continues to be shaped by efforts to foster greater equity in cultural funding. DCLA is also focused on supporting an equitable recovery for the City's cultural sector so that it can, in turn, participate in and contribute to the City's broader recovery from the ongoing pandemic. In spring 2020, the agency also conducted a major survey examining the financial impact of COVID-19 on the City's non-profit cultural organizations, which was used to inform advocacy efforts from DCLA, described below, and from partners in private philanthropy.
1. Support for more than 1,000 organizations through the Cultural Development Fund included funding for COVID relief to communities in areas hardest hit by the pandemic, including arts educators, who suffered major job losses according to DCLA's COVID-19 survey, as well as support for language access programming and engagement for people with disabilities.
2. Support for the 34 members of the Cultural Institutions Group, including Weeksville Heritage Center in Brooklyn, which became the first new member of the CIG in over 20 years when it was added in FY20. CIGs, along with cultural groups citywide, provided critical services for New Yorkers throughout the pandemic, serving as food distribution sites, vaccination hubs, and other key functions to help their communities heal and thrive.
3. DCLA continues to support individual artists through the re-grant program with the five local arts councils.
4. DCLA continues its efforts to forge stronger connections between the City and the cultural sector, including through the Mayor's Grant for Cultural Impact, which partners cultural organizations with City municipal agencies; a continued partnership with the public libraries; and through the ongoing Public Artists in Residence (PAIR) program.
5. DCLA supports diversity, equity, and inclusion in the cultural workforce through the continuation of the CUNY Cultural Corps program, which places CUNY students in paid internship positions at cultural organizations citywide.
• In Fiscal Year 2021, DCLA continues its Public Artists in Residence (PAIR) program, which creates more avenues for artists to work with government agencies. In Fiscal Year 2021, DCLA launched four new residencies with three new City agency partners: the Commission on Human Rights, the Civic Engagement Commission, and the Mayor’s Office of Criminal Justice. The four new artists will be in residence with their host agencies for a year and will present participatory public art projects that address some of the challenges facing the City.
• In Fiscal Year 2021, ten commissions for Percent for Art are slated for completion, including Stephen Antonakos’ complete restoration at 59th Street Marine Transfer Station in Manhattan and Chris Silva’s relief installation at PS 340 in the Bronx. Percent for Art also selected thirteen artists for new commissions which included future works by Tatiana Arrocha for Snug Harbor Music Hall on Staten Island, William Lamson at the Queens Botanical Garden, and artist team Ornaghi Prestinari at the Bush Terminal MiNY Campus in Brooklyn. By the end of the fiscal year the program expects to select twelve more artists for new City construction projects in schools, libraries, fire and EMT facilities as well as monument Commissions throughout the five boroughs.
• Materials for the Arts (MFTA) continues to divert millions of pounds of reusable materials from the landfill and provide them free of charge for hundreds of arts organizations, nonprofits, NYC public schools, and City agencies. Thus far in Fiscal Year 2021, MFTA has processed over 998 donations from businesses, corporations, and individuals. During the COVID-19 pandemic, MFTA has opened its doors to help New York’s neediest by accepting two million pounds of materials valued at $13.4 million.

Analysis of Agency Budgets Fiscal Year 2022
212
Capital Review
The 2022-2031 Ten-Year Capital Strategy for the Department of Cultural Affairs totals $981.9 million for over 200 cultural organizations in the five boroughs and includes $917.5 million in the 2022-2025 Four-Year Plan. The table below reflects capital commitments by program area over the 2020-2025 year period.
Capital Commitments($ in 000’s)
_______________________________________________________________________________________________________________________________________________________________________________________________________________
2020 2021 2022 2023 2024 2025 Actual Plan Plan Plan Plan Plan ________________________ ___________ ____________ ________________________ _______________________ ________________________ _______________________
City All City All City All City All City All City All Funds Funds Funds Funds Funds Funds Funds Funds Funds Funds Funds Funds _______________________________________________________________________________________________________________________________________________________________________________________________________________
Department of Cultural ......... Affairs .................................. $127,634 $126,483 $76,374 $183,477 $172,837 $175,080 $121,756 $121,756 $442,014 $442,014 $178,546 $178,659 _____________ _____________ _____________ _____________ _____________ _____________ ___________ ___________ ___________ ___________ ___________ ___________
Total ...................................... $127,634 $126,483 $76,374 $183,477 $172,837 $175,080 $121,756 $121,756 $442,014 $442,014 $178,546 $178,659 =========== =========== =========== =========== =========== =========== ========= ========= ========= ========= ========= =========
_______________________________________________________________________________________________________________________________________________________________________________________________________________

Analysis of Agency Budgets Fiscal Year 2022
213
CITY UNIVERSITY OF NEW YORK
The City University of New York (CUNY) includes eleven senior colleges, seven community colleges, William E. Macaulay Honors College, CUNY Graduate Center, Craig Newmark Graduate School of Journalism, CUNY School of Labor and Urban Studies, CUNY School of Law, CUNY School of Professional Studies and CUNY Graduate School of Public Health and Health Policy. CUNY also sponsors the Hunter College Campus Schools. The CUNY colleges, some of which date back to the nineteenth century, were federated in 1961. The University is governed by a 17-member Board of Trustees. Ten members are appointed by the Governor, five are appointed by the Mayor with the advice and consent of the New York State Senate, and two (the chairpersons of the Faculty and Student Senates) serve as ex-officio members.
CUNY is the largest municipal university system in the United States and ranks third in number of students among the public university systems in the nation. The University serves more than 261,000 degree-seeking students with approximately 178,000 in the senior colleges and 83,000 in the community colleges as well as 185,000 continuing education students.
Financial Review
The City University of New York’s 2022 Executive Budget totals $1,194.2 million, a net decrease of $89.2 million from the 2021 forecast of $1,283.4 million.
The total budget decrease of $89.2 million is largely due to a decrease of $76.9 million in intra-city funding. The Senior College lump sum appropriation of $35 million remains unchanged from previous years.
In addition, there are higher education related pension and other fringe costs of $93.8 million that are budgeted in separate agencies, bringing CUNY’s total 2022 budget to $1,288.0 million.

Analysis of Agency Budgets Fiscal Year 2022
214
Revenue Forecast
COMMUNITY COLLEGE EXPENDITURES BY SOURCE 2016 - 2022
0
200
400
600
800
1,000
1,200
2022202120202019201820172016Fiscal Year
* Funding which supports senior college and Hunter Campus Schools activities is not included here. City tax levy includes pension contributions which are budgeted in the Pension Agency and Collective Bargaining, Medicare Part B and Stabilization Fund contributions which are budgeted in the Miscellaneous Agency. Tuition includes Tuition and Fees, Miscellaneous Revenues, Adult Continuing Education fees and Other Categorical funds. State and Federal dollars are combined and include Community Development funds.
$ in
Mil
lion
s
State, Federal, Other Funds
Tuition
City Tax Levy
Source: NYC OMB
Total non-City revenues for two year colleges decreased by $39.4 million from $336.6 million in 2021 to $297.2 million in 2022. The decrease is mostly due to pandemic-related federal stimulus currently reflected in CUNY’s budget in 2021 only. CUNY is expected to receive additional pandemic-related federal stimulus for future years.
Expense Budget Highlights
The largest City investment made by this Administration for CUNY continues to be ASAP, the Accelerated Study in Associate Program, an effort to improve college preparation, retention, and graduation rates for community college students. In addition, funding for Science, Technology, Engineering, and Math (STEM) continues to support associate degree students through enhanced advisement, student research opportunities, and summer tuition. Furthermore, Equity and Excellence initiatives continue to provide college visits, teacher certifications, tutoring, and application fee waivers to NYC Department of Education students.
Accelerated Study in Associate Programs (ASAP)
The program is designed to help associate degree-seeking students graduate in a timely manner. ASAP provides financial resources to remove barriers to full-time study (tuition/fee waivers for gap need after financial aid, textbook assistance, and MetroCards); structured pathways to support academic momentum (required full-time enrollment, block-scheduled first-year courses, consolidated course schedules, winter and summer course-taking),and comprehensive support services to enhance student engagement and connected community (personalized advisement, tutoring, career development services, and early engagement activities).
• At full scale, CUNY ASAP enrolled over 25,000 students in 2020. However, due to the pandemic the program is projected to serve 23,000 students in 2021. CUNY aims to return to full scale enrollment levels in 2022.

Analysis of Agency Budgets Fiscal Year 2022
215
Summer Tuition
CUNY waives summer tuition for students in STEM-related disciplines, which will help them to make significant and timely progress in earning college degrees.
• From Summer 2020 through Spring 2021, this initiative impacted approximately 4,700 students, resulting in total tuition savings of $3.5 million.
Academic Advisement
Advisement improves the quality of academic support, especially given the complexity of the degree requirements in STEM fields. STEM majors have several prerequisites and these students need to understand the courses that are required to be accepted into the major. Increasing access to advisors and reducing the advisement caseload will improve retention and graduation rates. This aims to improve students’ understanding of the curriculum, the courses they need to take, and to help them chart a path toward graduation.
• In 2021, approximately 15,000 students benefited from academic advisement. This level of service will continue in 2022 and beyond.
Application Fee Waivers for Public School Students
This initiative is aligned with the College Access for All initiative.
• This covers approximately 46,200 waivers for all public-school students with a financial need.
College Visits for Middle School Students
This initiative supports NYC DOE students visiting CUNY college campuses through the College Access for All initiative. CUNY supports visits with grade-level curriculum materials, and specially trained Student Ambassadors who guide school groups through campus tours.
• In 2021, CUNY Explorers (formerly known as College Visits) launched virtual campus visit experiences, offering online campus tours and interactive activities for middle school students. From October 2020 – April 2021, over 24,000 middle school students participated across 14 CUNY campuses. In April 2021, CUNY Explorers launched
the High School College Workshop Pilot, offering a series of four workshops on college and career exploration: Day in the Life of a College Student, Skills for College Success, Exploring College Majors and Careers, and Resume Building. The pilot program launched across 9 CUNY campuses to service 20 NYC public high schools. Explorers is projected to serve approximately 30,000 students by the end of June 2021.
Algebra for All
Under Algebra for All, the goal is for all students to successfully complete algebra by 9th grade. CUNY supports this initiative by providing graduate course tuition assistance to existing teachers who are pursuing a 5th through 9th grade math teaching micro-credential.
• In 2021, CUNY supported 171 teachers enrolled in graduate math coursework to receive credited micro-credentials, with 120 teachers continuing and completing their coursework in 2022. An additional 100 pre-service and in-service teachers were supported through the application process for graduate programs to become certified math teachers.

Analysis of Agency Budgets Fiscal Year 2022
216
2021 20222020
Actual2021
ForecastPreliminary
BudgetExecutive
Budget Forecast Preliminary
BudgetExpenditures
Salary and Wages ……….. $673,396 $613,763 $662,532 $662,532 $48,769 $—Fringe Benefits …………… 189,716 208,502 212,564 212,564 4,062 — OTPS ……………...……… 392,000 461,112 294,912 319,091 (142,021) 24,179 Total ……………...……… $1,255,112 $1,283,377 $1,170,008 $1,194,187 ($89,190) $24,179
FundingCity ……………...………… $850,225 $845,125 $859,326 $872,226 $27,101 $12,900Other Categorical Grants … 22,294 14,077 14,077 14,077 — — IFA ……………...………… — — — — — — State ……………...……… 245,899 283,074 283,074 283,074 — — Federal CD ……………...… 128 93 — — (93) — Federal Other ……………. — 39,343 — — (39,343) — Intra-City Other …………… 136,566 101,665 13,531 24,810 (76,855) 11,279 Total ……………...……… $1,255,112 $1,283,377 $1,170,008 $1,194,187 ($89,190) $24,179
Additional Costs Centrally FundedPersonal Services (PS) Fringe Benefits ………… $3,112 $3,514 $3,676 $3,691 $177 $15 Pensions ……………...… 82,590 82,942 90,139 90,139 7,197 — Other Than Personal Service (OTPS) Debt Service ……………. 83,998 63,151 73,945 72,133 8,982 (1,812) Total Additional Costs $169,700 $149,607 $167,760 $165,963 $16,356 ($1,797)
FundingCity ……………...………… 167,526 149,531 165,031 165,375 15,844 344 Non-City ……………...…… 2,174 76 2,729 588 512 (2,141)
Full Agency Costs (including Central Accounts)Salary and Wages ………… $673,396 $613,763 $662,532 $662,532 $48,769 $—Fringe Benefits …………… 192,828 212,016 216,240 216,255 4,239 15 Pensions ……………...…… 82,590 82,942 90,139 90,139 7,197 — Total PS ……………...…… $948,814 $908,721 $968,911 $968,926 $60,205 $15
OTPS ……………...……… $392,000 $461,112 $294,912 $319,091 ($142,021) $24,179Debt Service …………….. 83,998 63,151 73,945 72,133 8,982 (1,812) Total OTPS $475,998 $524,263 $368,857 $391,224 ($133,039) $22,367
Total Agency Costs ……… $1,424,812 $1,432,984 $1,337,768 $1,360,150 ($72,834) $22,382Less Intra-City …………… $136,566 $101,665 $13,531 $24,810 ($76,855) $11,279Net Agency Cost ………… $1,288,246 $1,331,319 $1,324,237 $1,335,340 $4,021 $11,103
FundingCity ……………...………… 1,017,751 994,656 1,024,357 1,037,601 42,945 13,244 Non-City ……………...…… 270,495 336,663 299,880 297,739 (38,924) (2,141)
Personnel (includes FTEs at fiscal year-end)City ……………...………… 8,314 10,287 10,111 10,111 (176) — Non-City ……………...…… — — — — — — Total ……………...……… 8,314 10,287 10,111 10,111 (176) —
Summary of Agency Financial Data The following table compares 2022 Executive Budget with the 2022 Preliminary Budget, the 2021 forecast and actual expenditures for 2020, including fringe benefits, pensions, and debt service.
2022Increase/(Decrease)($ in 000's)

Analysis of Agency Budgets Fiscal Year 2022
217
New Programming
The Executive budget includes funding for two new programs at Medgar Evers College.
Healthcare Pipeline
Medgar Evers College will expand its role as a critical pipeline to healthcare careers by opening a new School of Allied Health. The school will expand healthcare educational offerings in critical high-demand occupations; build career pipelines to match students with professional training experiences and healthcare employment opportunities in Central and South Brooklyn (federally-designed Medically Underserved and Health Professional Shortage areas); and establish multi-year subsidized apprenticeships, internships and clinical externship programs to enhance career readiness for Allied Health students.
People’s Police Academy
The People’s Police Academy (PPA) is a program at Medgar Evers College created to improve public safety and police-community relations. In several precincts throughout the City, the People's Police Academy engages local community leaders to provide enhanced training for police officers. The PPA was designed by faith, civic and non-profit leaders with the full support and cooperation of the NYPD, with input from youth, community-based service providers, and others. During the training and two-year pilot process, the participants identified, confronted and discussed difficult problems in their respective communities, out of which emerged new innovations that could be used to improve public safety and police-community relations.

Analysis of Agency Budgets Fiscal Year 2022
218
Capital Review
The City University of New York’s 2022-2025 Four-Year Capital Plan totals $561.1 million ($557 million in City funds and $4.1 million in Non-City funds). Approximately 21 percent of CUNY’s 2022-2025 capital funds reside in 2022, totaling $118.9 million ($114.8 million City funds and $4.1 million non-City funds).
Community college critical maintenance and new capital construction projects approved by the City are eligible for an equal amount of State matching funds. The State provides its 50 percent share for such projects through annual State budget capital appropriations. The State’s funds, provided through the independent sale of New York State Dormitory Authority (DASNY) bonds, are not represented in the City’s capital plan.
The following are on-going major projects and initiatives funded by the City’s 2022-2025 Executive Budget:
• Critical Maintenance and state of good repair for the Community Colleges ($22 million).
• A CUNY-wide capital initiative to provide office and administrative space in support of the expansion of the Accelerated Study in Associate Programs (ASAP) ($8.4 million).
• At Kingsborough Community College, design of the rehabilitation of the Marina is nearing completion. The scope of work includes building ADA-compliant access to the dock from the shore and other infrastructure improvements ($6.5 million).
• At Queensborough CC, an ADA-compliant reconstruction of bathrooms project will modernize the college’s lavatory facilities ($4.1 million).
• At Hostos Community College, design and construction of 500 Grand Concourse’s second floor and sub-basement ($7 million).
• At Bronx Community College, phase six of the underground utility infrastructure modernization ($15.4 million).
• At Kingsborough Community College, replacement of the Library Roof and Facade ($9 million).
Other major elements of the Four-Year Capital Plan include:
• Various improvements to Bronx CC’s HVAC mechanical systems ($3 million) and funding for modernizing and upgrading the Carl Polowczyk Hall academic building ($3 million).
• Rehabilitation of the PAC at Kingsborough Community College ($8.5 million).
Uncommitted resources from 2021 will roll into 2022 and will further fund projects that will be accomplished during the next four-year plan period.
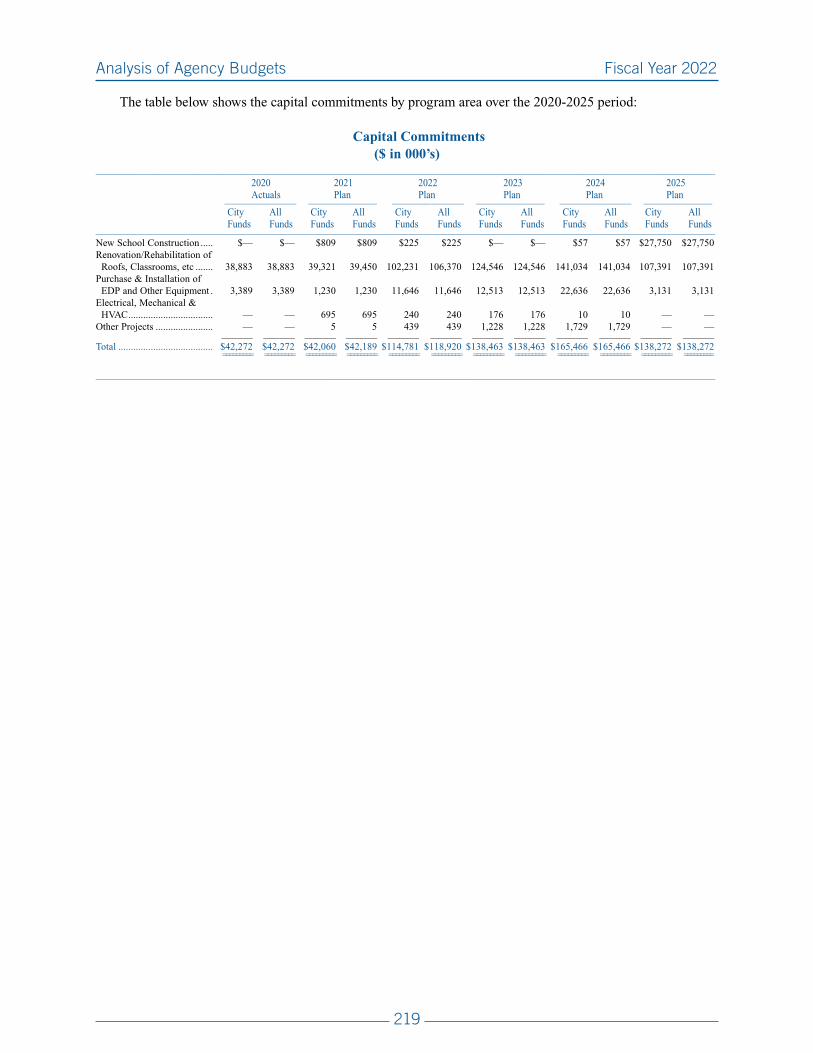
Analysis of Agency Budgets Fiscal Year 2022
219
The table below shows the capital commitments by program area over the 2020-2025 period:
Capital Commitments($ in 000’s)
_______________________________________________________________________________________________________________________________________________________________________________________________________________
2020 2021 2022 2023 2024 2025 Actuals Plan Plan Plan Plan Plan ________________________ _______________________ ________________________ _______________________ ________________________ _______________________
City All City All City All City All City All City All Funds Funds Funds Funds Funds Funds Funds Funds Funds Funds Funds Funds_______________________________________________________________________________________________________________________________________________________________________________________________________________
New School Construction ..... $— $— $809 $809 $225 $225 $— $— $57 $57 $27,750 $27,750 Renovation/Rehabilitation of Roofs, Classrooms, etc ....... 38,883 38,883 39,321 39,450 102,231 106,370 124,546 124,546 141,034 141,034 107,391 107,391 Purchase & Installation of EDP and Other Equipment . 3,389 3,389 1,230 1,230 11,646 11,646 12,513 12,513 22,636 22,636 3,131 3,131 Electrical, Mechanical & HVAC .................................. — — 695 695 240 240 176 176 10 10 — —Other Projects ....................... — — 5 5 439 439 1,228 1,228 1,729 1,729 — — ___________ ___________ ___________ ___________ ___________ ___________ ___________ ___________ ___________ ___________ ___________ ___________
Total ...................................... $42,272 $42,272 $42,060 $42,189 $114,781 $118,920 $138,463 $138,463 $165,466 $165,466 $138,272 $138,272 ========= ========= ========= ========= ========= ========= ========= ========= ========= ========= ========= =========
_______________________________________________________________________________________________________________________________________________________________________________________________________________

Analysis of Agency Budgets Fiscal Year 2022
220
PENSIONS AND OTHER FRINGE BENEFITS
Pension Overview
The Executive Budget for 2022 includes $10,263 million in expenditures for City pension contributions, an increase of $760 million from the amount to be paid in 2021. The City’s pension contributions reflect collective bargaining, 2020 asset gains, and new changes to the actuarial assumptions and methods, referred to as the 2021 A&M, proposed by the Chief Actuary. The proposal lowers the CPI assumption from 2.5 percent to 2.3 percent by reducing it 0.05 percent each year for four years beginning June 30, 2019.
Lowering the CPI assumption affects three other actuarial assumptions since inflation is a component of each, and would result in a similar 0.05 percent annual phased-in reduction in the:
• Actuarial Interest Rate (AIR) and assumed rate of return on assets from 7.0 percent to an ultimate rate of 6.8 percent per year. This change does not apply to the assumed rate of return for benefits payable under the Variable Annuity Programs of TRS and BERS, which will remain at 4.0 percent.
• General Wage Increase component of the salary scale from 3.0 percent to an ultimate rate of 2.8 percent per year.
• Cost of Living Assumption from 1.5 percent to an ultimate rate of 1.3 percent per year.
Additionally, the 2021 A&M includes updated post-retirement mortality assumptions to reflect the latest improvement scale released by the Society of Actuaries (MP-2020).
The 2021 A&M also include resetting the actuarial value of assets equal to the market value of assets,
referred to as the Market Restart. In addition, the recognition of future asset performance will be changed from the current six-year period to a five-year period at 20 percent per year. Other changes include funding all of OTB’s required annual employer contribution and changing certain death benefits under NYCERS, TRS, and BERS in order to keep the plans in compliance with OWBPA.
In the table below: (1) $10,148 million in expenditures are for contributions to the City’s five major retirement systems (City Actuarial Systems) that cover City employees and retirees; (2) $114 million in expenditures are for contributions to retirement systems not maintained by the City (Non-City Systems), including the State pension plan that covers employees of City libraries, the Cultural Institutions Retirement System that covers non-City employees of day care centers and certain cultural institutions, and the Teachers’ Insurance and Annuity Association (TIAA) that covers certain CUNY employees and the City’s Voluntary Defined Contribution program; and (3) less than a million in expenditures (Non-Actuarial) are primarily for supplemental benefits for certain retired uniformed members.

Analysis of Agency Budgets Fiscal Year 2022
221
The City’s five actuarial retirement systems are the New York City Employees’ Retirement System, the New York City Teachers’ Retirement System, the New York City Police Pension Fund, the New York City Fire Pension Fund, and the Board of Education Retirement System. These systems cover approximately 720,000 employees, retirees and beneficiaries of the City, the
Department of Education, the City University System, and certain independent agencies. Each system is governed by a board of trustees and functions in accordance with applicable state and local laws. Annual pension contributions are made as required by statute based on an actuarial valuation of liabilities and assets.
Pension Expenditures and Funding Sources($ in 000’s)
__________________________________________________________________________________________________________________________________________________________________________________________ 2022 Increase/(Decrease) ____________________________________________________ _________________________________________________
2020 2021 Preliminary Executive 2022 Preliminary Actual Forecast Budget Budget Forecast Budget__________________________________________________________________________________________________________________________________________________________________________________________
ExpendituresPersonal Service City Actuarial Systems .......... $9,694,437 $9,393,279 $10,148,141 $10,148,141 $754,862 $- Non-City Systems .................. 89,451 108,924 114,305 114,305 $5,381 $- Non-Actuarial ........................ 154 350 350 350 — — _______________________ _______________________ _______________________ ______________________ _____________________ _____________________
Total ....................................... $9,784,042 $9,502,553 $10,262,796 $10,262,796 $760,243 $- ================ ================ ================ ================ ============== ==============
Funding City ...................................... $9,639,763 $9,358,274 $10,118,517 $10,118,517 $760,243 $- State ...................................... 32,025 32,025 32,025 32,025 — — Federal ................................... — — — — — — Intra-City Other ..................... 112,254 112,254 112,254 112,254 — — _______________________ _______________________ _______________________ ______________________ _____________________ _____________________
Total ....................................... $9,784,042 $9,502,553 $10,262,796 $10,262,796 $760,243 $— ================ ================ ================ ================ ============== ==============
__________________________________________________________________________________________________________________________________________________________________________________________

Analysis of Agency Budgets Fiscal Year 2022
222
Other Fringe Benefits
The City provides a number of fringe benefits to its employees, retirees and eligible dependents. City contribution amounts and terms of coverage are governed by various contractual, legal and collective bargaining provisions. In general, the City’s Miscellaneous Expense Budget contains the budget appropriations for the fringe benefit expenditures on behalf of employees and retirees of the mayoral agencies. Separate allocations are included in the Department of Education, the City University system, NYC Health & Hospitals, and the various other covered organizations, libraries and cultural institutions, for the fringe benefit expenditures on behalf of their active and retired employees.
The City’s basic health insurance program provides comprehensive major medical and hospitalization benefits to its employees, retirees and eligible dependents. In addition, the City makes annual contributions to union-administered welfare funds, which typically provide supplemental health insurance benefits to their members. Annual City contributions to the various welfare funds conform to collective bargaining and labor agreements. It should be noted that a significant amount of hospital and medical costs related to the COVID-19 pandemic are estimated to have been imposed on the City’s health insurance program for treating and testing city employees, retirees and dependents. The City expects to be reimbursed for such costs from the federal government under the fiscal stimulus program. The health insurance estimates reflect the agreed upon health care savings resulting from both the May 2014 and the June 2018 agreements reached between the City and the Municipal Labor Committee. Together, these two agreements are expected to produce recurring annual savings of $1.9 billion. In addition, the City is seeking unspecified annual labor savings, currently earmarked in fringe benefits, of $1 billion per year commencing in fiscal 2023.
The City also makes the required employer contributions on behalf of its employees who are covered under federal Social Security. As required by New York State Workers’ Compensation Law, the City pays wage replacement and medical benefits to employees who sustain on-the-job injuries. Under New York State Labor Law, the City provides up to 26 weeks in unemployment benefits (capped at statutory maximums) to eligible employees who lose their jobs due to economic reasons. Additional weeks can be provided during periods of high unemployment in the State. The City, as required by the Administrative Code, also pays for the medical costs of uniformed employees of the Police, Fire and Sanitation Departments who sustain injuries in the line of duty.
Retiree Health Benefits Trust Fund
The Retiree Health Benefits Trust Fund (the “Trust”) was created in 2006 and began operating in 2007. The Trust is used to receive City deposits and make the annual pay as you go (“PAYGO”) payments required to meet current year health insurance and supplemental welfare benefits expenses for retirees. The Trust was initially funded with $2.5 billion in City contributions: $1 billion in 2006 and $1.5 billion in 2007. Over the years, the City has consistently made annual contributions to the Trust, ensuring that there are sufficient assets in the Trust to meet the annual PAYGO obligation. In some years, the City made additional discretionary contributions into the Trust, while in certain years of fiscal stress, the City made a reduced contribution.
Last year in fiscal 2020, as a result of the pandemic’s negative impact on the City’s economy and budget, the City reduced its contribution to the Trust by $1 billion. And for fiscal 2021, the City had intended on drawing down an additional $1.6 billion from the Trust as part of an overall plan to maintain a balanced budget. However, with the passage of the American Rescue Plan Act, the City will be receiving additional stimulus monies from the federal government which will provide needed resources to other critical areas of the budget. This will now enable the City to rescind the additional $1.6 billion drawdown from the Trust.
In 2020, the Trust paid out approximately $2.7 billion in benefit payments, and had a year-end balance of $3.8 billion. Assets in the Trust are used to offset the City’s Other Postemployment Benefits (OPEB) obligations. OPEB exclude pensions, and include retiree health insurance premium payments, contributions to retiree welfare funds, and Medicare Part B reimbursements. As of the end of 2020, the City’s reported net OPEB obligation was $109.5 billion. The City is not required to fund OPEB obligations on an actuarial basis, other than to meet its current year PAYGO payment.

Analysis of Agency Budgets Fiscal Year 2022
223
The following table sets forth the fringe benefit amounts carried in the Miscellaneous Budget for 2021 and 2022.
Fringe Benefits
($ in 000’s)__________________________________________________________________________________________________________________________________________________________________________________________ 2021 2022 Increase/ Forecast Executive (Decrease) __________________________________________________________________________________________________________________________________________________________________________________________
Workers’ Compensation ....................................................... $378,396 $409,696 $31,300 Health Insurance Plans ........................................................ 4,413,361 4,885,622 472,261 Social Security Contributions .............................................. 1,172,139 1,314,112 141,973 Unemployment Insurance Benefits...................................... 25,954 23,854 (2,100)Supplementary Employee Welfare Benefits ........................ 541,922 858,923 317,000 Workers’ Compensation - Other .......................................... 44,100 45,900 1,800 _________________________ _________________________ _________________________
Total ............................................................................. $6,575,872 $7,538,107 $962,234 Funding City ............................................................................ $5,109,813 $5,741,337 $631,524 Other Categorical ......................................................... 183,307 183,126 (181) State .............................................................................. 167,945 163,481 (4,463) Interfund Agreements .................................................. 79,735 97,107 17,372 Intra-City ...................................................................... 113,034 114,492 1,458 Federal .......................................................................... 922,038 1,238,563 316,525 • CD ............................................................................. 25,874 25,889 15 • Other ......................................................................... 896,164 1,212,674 316,510 _________________________ _________________________ _________________________
Total ............................................................................. $6,575,872 $7,538,107 $962,234 __________________________________________________________________________________________________________________________________________________________________________________________

Analysis of Agency Budgets Fiscal Year 2022
224
JUDGMENTS AND CLAIMS
The Executive Budget for 2022 includes an appropriation of $887 million for expenditures on Judgments and Claims. These expenditures represent the City’s payments to settle tort and contract liability claims. Tort expenditures cover both personal injury and property damage claims, and typically represent about 95 percent of total Judgment and Claims expenditures. The projections incorporate a substantial amount of claims expenditures attributed to NYC Health + Hospitals (H + H) for which H + H will reimburse the City.
The Office of Management and Budget (OMB) employs various statistical methods and financial models to estimate claims expenses. In addition, OMB consults the Law Department to obtain cost estimates for cases that are expected to settle for $1 million or greater. These are mainly serious personal injury cases that have been in litigation or on appeal for a considerable period of time. These cases represent a
significant portion of total tort expenditures, but their relatively small volumes do not lend themselves to statistical analysis. Historical claim data contained on the Comptroller’s Omnibus Automated Image Storage and Information System (OAISIS) are analyzed to determine annual settlement volumes and average cost per claim. Total expenditures are the product of the volume and average claim cost projections.

Analysis of Agency
Budgets:Covered
Organizations

Covered Organizations Fiscal Year 2022
227
NEW YORK CITY HEALTH + HOSPITALS
NYC Health + Hospitals (Health + Hospitals), the largest public health system in the country, includes 11 acute care hospitals, five skilled nursing facilities, and nearly 60 Gotham Health community health centers. The system provides comprehensive health care services including preventive and primary care, behavioral health, substance abuse, trauma, high-risk neonatal and obstetric care, and burn care.
Health + Hospitals’ acute care hospitals serve as major teaching hospitals. In addition, the system includes MetroPlus (a managed care plan), an Accountable Care Organization, a Certified Home Health Agency, Correctional Health Services and a program conducting mental health evaluations for the family courts in the Bronx, Brooklyn, Queens, and Manhattan. Health + Hospitals is the City’s single largest provider of care to Medicaid patients, mental health patients, and the uninsured, serving 1.1 million New Yorkers.
Financial Review
Health + Hospitals closed the first half of 2021 on track, beating its budget projections by two percent and achieving a net positive budget variance of $115 million. The system’s patient care receipts are $398 million better thus far this year versus the same period last year. This continues the positive momentum it had last year where patient care revenues exceeded 2019 by nearly $500 million.
Health + Hospital’s Strategic Initiatives associated with revenue cycle improvements, managed care contracting improvements, and value-based payments also remain on track. Through December, it has generated $311 million in revenue and has a projected line of sight of $576 million for the full year. Finally, the staffing investments that were implemented starting in 2019 have continued to be consistent with the overall system needs. Health + Hospitals has brought on board nursing and nursing support positions who have specifically supported its ability to manage the COVID surge and stabilize their ongoing services.
Recent System-wide Achievements
COVID-19
The system has had many extraordinary accomplishments over the past year, even as it has battled a global pandemic, thanks to its dedicated and heroic staff. Health + Hospitals was the original epicenter of the pandemic and has led the citywide effort to beat back it back throughout its duration. Its efforts have included:
• Healing – Health + Hospitals’ facilities and clinicians have provided quality, compassionate care to thousands of patients impacted by COVID-19. The system’s 11 emergency departments have managed
more than 108,000 COVID-19 patient visits. Systemwide, more than 54,000 hospitalized patients with COVID-19 have been safely discharged.
• Testing – Health + Hospitals has prioritized testing since the early months of the first surge, initially setting up tents outside its facilities and then launching the country's most successful Test and Trace operation. In the last year, the system’s hospitals, Gotham Health Centers, Correctional Health Services, and NYC Test & Trace Corps testing sites have done more than 3.8 million COVID-19 tests. Thousands of New Yorkers experienced for the first time the dedication and passion of the employees in its health system. Health + Hospitals is especially proud of the resounding and consistent praise it has heard and seen on social media for our team members’ kindness and professionalism.
• Vaccinating – despite the challenges of an unreliable vaccine supply, Health + Hospitals has extended hours, added more staff, and created new mass vaccinations sites managed by its NYC Test & Trace Crops to bring vaccines to its patients and communities. So far, the system has put vaccines into more than 260,000 arms, and it is not letting up.
• Recovering – Health + Hospitals’ ambulatory care teams are serving more than 26,000 patients who had COVID-19, many of whom will face a range of long-term health effects. Its investment to open three new COVID-19 Centers of Excellence in communities hardest hit by the pandemic will ensure access to the specialized care New Yorkers will need to address long-term respiratory, cognitive, and cardiac conditions caused by the virus. At these sites, Health + Hospitals will provide care at every step of patients’ recovery and offer ongoing primary

Covered Organizations Fiscal Year 2022
228
care to all members of the community. To date, Health + Hospitals has opened two of the three sites – Tremont, Bronx and Jackson Heights, Queens.
Guaranteed HealthCare Plan
In January 2019, the Mayor announced plans to guarantee health care at a low- to no-cost to New Yorkers who do not qualify for or cannot afford health insurance in all five boroughs – NYC Care. Since its launch in August 2019 in the Bronx, NYC Care has expanded to Brooklyn and Staten Island in January 2020 and Queens and Manhattan in September 2020. The Queens and Manhattan launch was accelerated by three months per the recommendation of the City’s Taskforce on Racial Inclusion & Equity to ensure that Queens and Manhattan uninsured residents could access primary, preventive, and specialty health services during the COVID-19 pandemic. Since August 2019, over 53,000 individuals have enrolled and 35 new providers have been recruited to increase access to primary care and key specialty services at H+H. In addition, NYC has successfully executed partnerships with 31 community-based organizations throughout the five boroughs to provide outreach and education about NYC Care and assist with enrollment.
Expanding Ambulatory Care Services
Health + Hospitals continues to invest in new and current facilities to expand options for care to New Yorkers. In the last year, the system has:
• Opened two new COVID Centers of Excellence.
• Continued to hire new primary care providers.
• Kept ambulatory services running amid the pandemic.
• Enrolled 66 percent of all patients in MyChart, making the system one of the national leaders in digital health.
In addition, during the first COVID-19 surge in April 2020, Health + Hospitals launched its Virtual ExpressCare to provide remote services to New Yorkers for common health issues that are not life-threatening. The ExpressCare telehealth solution offers a much simpler way to access high-quality, affordable video-based virtual care with the availability of on-screen interpreters in over 200 languages, including American
Sign Language. Patients can see a doctor anytime at expresscare.nyc or through the system’s MyChart patient portal. Since its launch in April 2020, there have been over 10,500 visits via telehealth.
Promoting Culturally Competent Care
Health + Hospitals has developed specialized programs to support culturally and linguistically responsive services that support the diverse healthcare needs of the City’s residents. As a result, the Equity and Access Council was established in March 2020 to provide strategic direction for the development of programs and initiatives aimed at eliminating barriers, institutional and structural inequities, and improving the health and well-being of underrepresented and marginalized communities. The work of the Equity and Access Council is focused on the following priority areas:
• Workforce Diversity – initiatives to attract, retain, and develop diverse talent.
• Workplace Inclusion – strategies to promote inclusive practices.
• Equity of Care – strategies to eliminate racial and social institutional and structural inequities.
• Monitoring and Evaluation – metrics to inform program improvements and service delivery models, identify priority populations, and drive evidence-based intervention initiatives.
Correctional Health Services
The system’s Correctional Health Services (CHS) was the first correctional facility in New York State to offer the COVID-19 vaccine to persons in custody. As well as being a leader on that front, CHS also opened four new Program to Accelerate Clinical Effectiveness (PACE) units to better serve patients with serious mental illness. PACE has demonstrated efficacy in increasing medication adherence and reducing incidents of injury and self-harm. Additionally, CHS established an Enhanced Pre-arraignment Screening Service (EPASS) program on Staten Island to screen individuals prior to arraignment for medical and behavioral health issues – making the service available in every borough and quintupling the number of sites since the program’s launch. Through EPASS, CHS has conducted more than 36,000 screenings since 2016 and prevented more than an estimated 12,000 emergency room runs that

Covered Organizations Fiscal Year 2022
229
disrupt court processing; provided defense attorneys with information that could support alternatives to incarceration; and identified persons with high-risk clinical conditions should they be incarcerated.
Finally, calendar year 2020 marked the beginning of design work for CHS’ Outposted Therapeutic Housing Units (OTxHUs). These will be located in Bellevue and Woodhull hospitals and serve patients whose clinical conditions are not so acute as to necessitate inpatient admission, but would benefit from close, regular access to specialty and subspecialty care only available in the hospitals. The OTxHUs are a pioneering attempt to create a more normalized and dignified environment that will support healing and recovery for some of Health + Hosptials’ most complex and vulnerable patients.
MetroPlus
For the second year, MetroPlus Health was ranked as New York City’s highest-rated health plan for exceptional clinical services, dedication to local community, and commitment to the reduction of health disparities by addressing the social determinants of health. A wholly-owned subsidiary of NYC Health + Hospitals, the nation’s largest public health system, MetroPlus is the choice of more than 600,000 New Yorkers and earned an overall rating of five stars, the highest possible score in the New York State Department of Health 2020 Consumer’s Guide to Medicaid and Child Health Plus Managed Care Plans in New York City.
Capital Review
Highlights include:
• NYC Health + Hospitals/Gotham Health accelerated design and construction to open two new COVID Centers of Excellence in the Bronx and Queens, and is looking forward to the opening of the largest COE site in Bushwick, Brooklyn in July. These centers are geographically located in areas that were hardest hit by the COVID-19 Pandemic and were designed to provide comprehensive outpatient services for recovering COVID-19 patients.
• NYC Health + Hospitals completed energy decarbonization projects to help decrease greenhouse gas emissions and support climate resiliency as part of the carbon challenge and NYC roadmap to 80x50 initiatives. In February 2021, we completed energy efficiency upgrades at our Jacobi Trauma 1 Center Hospital. The state-of-the-
art upgrades included an interior energy efficient lighting system, chiller plant upgrades, boiler plant control upgrades, hot water steam piping insulation, and air handling unit upgrades. These account for a roughly 6.4 percent decrease in campus-wide greenhouse gas consumption.
• NYC Health + Hospitals/Correctional Health Services kicked off design for the construction of two new Outposted Therapeutic Housing units at Bellevue and Woodhull Hospitals. This pioneering approach will serve as a bridge between jail-based care and acute inpatient hospitalization for certain patients in the care and custody of the City. This innovation will enhance access to, and quality and continuity of, care for patients with complex needs in a more humane and dignified manner. It is anticipated that these projects will be completed no later than 2024.
• NYC Health + Hospitals/Coney Island’s new state-of-the-art critical services hospital work is well underway with plans to open a new tower building, featuring an elevated emergency department and inpatient services. Despite the COVID-19 pandemic, this critical project was swiftly restarted after the shutdown and the curtainwall is nearing completion with an expected opening still planned for calendar year 2022; other parts of the campus renovation are expected to be completed spring 2023. Portions of the permanent flood wall system have been installed and the system’s short-term storm barriers are in place to protect the hospital in the event of a future storm.
• NYC Health + Hospitals completed the rollout of the EPIC electronic medical record (EMR) across all acute care, ambulatory, and LTACH facilities in the spring of 2020. This unified system provides real-time access to evolving clinical and operational data at both the facility and system level to support strategic and operational decisions. Gains in efficiency and care experience have been realized by expanding the integration of priority biomedical devices into the EMR as they assist clinicians with monitoring and documentation of patient vital signs. Additionally, the enterprise EMR has allowed expanded use of the patient portal, MyChart, improving patient experience and access to care in areas such as provider-patient communication and telehealth visits.
Covered Organizations Fiscal Year 2022
230
NEW YORK CITY TRANSIT
New York City Transit (NYCT) operates the most extensive public transportation system in the nation, which served approximately 780 million subway and bus passengers in calendar year 2020, 614 million on the subway alone. NYCT has been a component of the Metropolitan Transportation Authority (MTA) since the Authority’s inception in 1968. The MTA is a New York State public authority responsible for coordinating and implementing a mass transportation program for New York City and seven neighboring counties. The other components of the MTA primarily serving New York City are the Staten Island Rapid Transit Operating Authority (SIRTOA) and the MTA Bus Company (MTABC). The MTA also includes the Long Island Rail Road and the Metro-North Commuter Railroad.
NYCT’s subway system currently operates 22 hours a day (temporarily closed from 2 to 4 a.m. for cleaning/disinfection because of the pandemic), seven days a week, on over 660 miles of mainline track, serving 472 stations throughout the Bronx, Brooklyn, Manhattan, and Queens. Prior to the pandemic, it operated 24 hours a day. The NYCT bus system comprises a fleet of 4,478 buses on 190 local, 17 Select Bus Service, and 30 express routes servicing all five boroughs.
SIRTOA operates a 29-track-mile rapid transit line serving 21 stations on Staten Island and providing a connection to the Staten Island Ferry. SIRTOA served approximately 1.5 million passengers in 2020.
MTABC operates an extensive public bus transportation system throughout New York City, primarily in the Bronx, Brooklyn, and Queens. MTABC served approximately 37 million passengers in 2020. MTABC is primarily funded through farebox revenues and City subsidies.
MTABC currently operates 1,302 buses, all owned by the City. Service on 44 local, three Select Bus, and 43 express routes is available 24 hours a day, seven days a week. Since beginning operations in 2005, MTABC has significantly improved service and the City expects MTABC to continue making improvements to all facets of its operations, ensuring that service levels are up to MTA’s standards.
Financial Review
The City’s financial plan includes $391.7 million for NYCT in fiscal year 2022. As NYCT operates on a calendar year (CY) basis, the financial plan below is presented in that format. The NYCT financial plan is funded through a combination of fare revenue, tax revenue, and direct subsidies. The CY 2021 plan’s subsidies include Federal stimulus dollars in addition to the usual subsidies from the City, State, and other jurisdictions in the MTA’s service area. The MTA’s plan for CY 2021 includes the following key elements:
• CY 2021 fare revenue is projected to be $1.3 billion, a 29 percent decrease over the CY 2020 total.
• Tax revenues dedicated for NYCT’s use are projected to total $4.5 billion; $1.4 billion from the regional Metropolitan Mass Transportation Operating Assistance Account (MMTOA), $481.9 million from the State “Lock Box” Petroleum Business Tax, and $319.5 million from the Urban Mass Transportation Operating Assistance Account (Urban Account).
Additionally, $1.9 billion comes from other State taxes and fees. This includes $825.5 million from the Payroll Mobility Tax, $191.3 million from license, vehicle registration, taxi, and vehicle rental fees, $191.1 million to replace forgone revenues from exempting school districts and small businesses from the Payroll Mobility Tax, and $271.3 million from the taxi and for-hire vehicle congestion surcharge.
• The City’s expected contribution to NYCT’s operating budget for CY 2021 totals $452.1 million, including $158.1 million in operating assistance as part of the City match to State “18b” aid ($35.0 million of which is IFA), $45.0 million for student fare discounts, $231.7 million for the Paratransit program, $13.8 million for elderly and disabled fare discounts, and $3.5 million for expenses incurred by NYCT on behalf of the NYPD Transit Bureau.
In addition to the very large indirect contributions the City makes to various MTA revenue sources, the following chart summarizes the City’s direct subsidies to NYCT for CY 2021:

Covered Organizations Fiscal Year 2022
231
Based on recent financial reports, NYCT projects that it will close CY 2021 with a cash surplus of $3.1 million. NYCT has projected deficits in CY 2022, CY 2023, and CY 2024 of $2.3 billion, $1.7 billion, and $1.7 billion respectively. These deficits are expected to be offset by gap-closing and other government actions including Federal stimulus funds and potential tax, fee, and further fare increases.
City Subsidies to NYCT, CY 2021($ in Millions)
• Elderly and Disabled Subsidy…. .......................................... $13.8 • School Fare Subsidy…. ......................................................... $45.0 • Operating Assistance…. ........................................................ $158.1 • Police Reimbursement…. ..................................................... $3.5 • Paratransit…. ......................................................................... $231.7
============
TOTAL…. ................................................................ $452.1 ============

Covered Organizations Fiscal Year 2022
232
New York City Transit Financial Plan($ in Millions)
__________________________________________________________________________________________________________________________________________________________________________________________
Calendar Years [1]__________________________________________________________________________________________________________________________________________________________________________________________
2020 2021 2022 2023 2024__________________________________________________________________________________________________________________________________________________________________________________________
REVENUES Subway / Bus Fare Revenue ............... $1,776.7 $1,261.7 $2,496.4 $3,287.3 $3,654.7 Other Operating Revenue [2] ............. $2,958.8 $174.5 $181.0 $185.7 $248.7 Transit Tax and Other Subsidies ........ $3,373.6 $4,143.5 $3,697.8 $3,922.9 $4,093.6 City Subsidies .................................... $380.6 $479.1 $497.0 $514.2 $534.7 State Subsidies ................................... $151.7 $210.0 $183.3 $183.3 $183.3 TBTA Surplus Transfer ...................... $70.3 $17.9 $253.9 $294.1 $296.3 Capital and Other Reimbursements ... $1,057.9 $1,232.9 $1,178.4 $1,159.0 $1,173.4 ________________ _________________ _________________ __________________ _________________
TOTAL REVENUES ................. $9,769.6 $7,519.6 $8,487.8 $9,546.4 $10,184.6 EXPENSES Salaries & Wages ............................... $4,144.7 $4,043.2 $4,132.1 $4,222.8 $4,328.3 Fringes ................................................ $4,159.1 $4,433.1 $4,690.0 $4,933.1 $5,173.6 Reimbursable Overhead ..................... ($202.1) ($271.1) ($251.8) ($247.6) ($250.7) OTPS [3] ............................................ $1,195.8 $1,515.8 $1,627.4 $1,696.5 $1,908.2 Paratransit Expenses .......................... $344.7 $433.6 $510.7 $544.8 $584.7 Capital Reimbursable Expenses ......... $1,057.9 $1,232.9 $1,178.4 $1,159.0 $1,173.4 Transit Police ...................................... $3.4 $3.5 $3.5 $3.5 $3.6 Debt Service ....................................... $1,335.3 $1,375.9 $1,490.7 $1,699.4 $1,721.0 Depreciation [4] ................................. $1,928.1 $1,978.1 $2,029.4 $2,082.0 $2,136.0 Other Post Employment Benefits [4] . $0.0 $0.0 $0.0 $0.0 $0.0 ________________ _________________ _________________ __________________ _________________
TOTAL EXPENSES .................. $13,966.9 $14,744.9 $15,410.4 $16,093.6 $16,778.0 OTHER ACTIONS Balance before Adjustments .............. ($4,197.3) ($7,225.4) ($6,922.6) ($6,547.2) ($6,593.4) Gap-Closing Actions [5] .................... $901.8 $3,504.3 $1,101.5 $1,183.1 $1,141.9 Cash Flow Adjustments [6] ................ $3,319.7 $3,372.9 $3,551.2 $3,690.6 $3,732.7 Net Cash from Prior Year ................... $327.1 $351.3 $3.1 $0.0 $0.0 ________________ _________________ _________________ __________________ _________________
SURPLUS/(DEFICIT) ............... $351.3 $3.1 ($2,266.8) ($1,673.5) ($1,718.8)
__________________________________________________________________________________________________________________________________________________________________________________________
[1] All Financial Plan figures were provided by NYCT in February 2021 and represent estimated values. Since the MTA operates on a calendar year basis (January-December) the values do not directly carry to the City's fiscal year (July-June).
[2] 2020 includes Federal aid.
[3] Includes Inter-agency Loan, NYCT Charge Back of MTA Bus Debt Service, Forward Energy Contracts and Commitments to Capital.
[4] Since February 2004, NYCT has included depreciation in its financial plan. As of 2007, NYCT also reports other post employment benefits (OPEB) obligations and environmental remediation liabilities.
[5] Includes Below the Line Items and items not yet provided by the MTA. Typically includes increased ridership, fare collection, expense reduction, management initiatives, cash reserve, and other governmental assistance.
[6] Cash flow adjustments include operating, depreciation, environmental remediation and OPEB cash flow adjustments.

Covered Organizations Fiscal Year 2022
233
Capital Commitments ($ in 000’s)
_______________________________________________________________________________________________________________________________________________________________________________________________________________
2020 2021 2022 2023 2024 2025 Actual Plan Plan Plan Plan Plan ________________________ ___________ ___________ ________________________ _______________________ ________________________ _______________________
City All City All City All City All City All City All Funds Funds Funds Funds Funds Funds Funds Funds Funds Funds Funds Funds_______________________________________________________________________________________________________________________________________________________________________________________________________________
Infrastructure ...................... $76,740 $76,740 $1,239,500 $1,239,500 $— $— $— $— $90,000 $90,000 $460,000 $460,000 Trackwork .......................... 35,000 35,000 35,000 35,000 35,000 35,000 35,000 35,000 35,000 35,000 35,000 35,000 Revolving Fund .................. 5,000 5,000 10,000 10,000 5,000 5,000 5,000 5,000 5,000 5,000 5,000 5,000 SIRTOA .............................. $— $— $— $— $— $— $— $— $— $— $— $— Miscellaneous .................... $ — $— 2,691 2,691 $— $— $— $— $— $— $— $— MTABC .............................. $ — $— 50,642 69,284 $— $— $— $— $— $— $— $— ___________ ___________ _____________ _____________ _________ _________ _________ _________ __________ ___________ __________ __________
Total ................................... $116,740 $116,740 $1,337,833 $1,356,475 $40,000 $40,000 $40,000 $40,000 $130,000 $130,000 $500,000 $500,000 ========== ========== ============ =========== ========= ======== ======== ======== ========== ========== ========= =========
In addition to its contribution to NYCT, the City expects to contribute $101.5 million directly to the MTA to maintain Long Island Rail Road and Metro-North Commuter Railroad stations in the five boroughs and for operating assistance for the commuter railroads as part of the local match of State “18b” aid. Based on MTA’s forecast, the City will provide $65.3 million for liabilities related to the Staten Island Rapid Transit Operating Authority, and $696.4 million for liabilities related to the MTA Bus Company. The City will also contribute $11.8 million for E-ZPass courtesy tags used by City agencies.
Overall, the City annually provides the MTA with approximately $1 billion in direct subsidies and $1 billion of in-kind contributions (NYPD Transit Bureau, debt service for MTA capital projects, and homeless outreach).
Capital Review
The City’s 2022-2031 Ten-Year Capital Plan totals $1.7 billion for NYCT including $710.0 million in the 2022-2025 Four-Year Plan. The City funded the MTA’s 2015-2019 Capital Program to support MTA’s most essential work: bringing the mass transit system to a state of good repair, maintaining a normal replacement cycle, and improving quality of services. City capital funds are used in conjunction with other sources (Federal, State, and Private) toward MTA’s Capital Program. The City’s contribution to the MTA 2015-2019 Capital Program is $2.656 billion, of which $821.0 million, including $164.0 million for the Subway Action Plan, was budgeted in previous capital plans, $600.0 million is funded through alternative non tax levy revenue sources, and $1.235 billion is being provided concurrently with additional State funds in accordance with the funding needs of the Capital Program. The City expects to contribute $3.0 billion to the MTA 2020-2024 Capital Program. The Ten-Year Capital Strategy reflects $1.5 billion of the City contribution to the MTA 2020-2024 Capital Program in the budget.
The City’s Ten-Year Capital Strategy for NYCT, SIRTOA, and MTABC includes the following key elements:
• Funds to help provide for various NYCT infrastructure improvements, system enhancements, and bus and subway car upgrades, $1.4 billion for 2022-2031 ($570.0 million in the 2022-2025 Four-Year Plan).
• Funds for NYCT track work, $350.0 million for 2022-2031 ($140.0 million in the 2022-2025 Four-Year Plan).
The table below outlines the City’s capital commitments to NYCT, SIRTOA and MTABC for the 2020-2025 period:

Appendix

APPENDIX Fiscal Year 2022
237
EXHIBIT 1EXPENDITURE ASSUMPTIONS
Personal Services
The estimates for Personal Services over the five-year period of the plan are as follows:
($ in Millions)_______________________________________________________________________________________________________________________________________________________________________________________________________________
2021 2022 2023 2024 2025_______________________________________________________________________________________________________________________________________________________________________________________________________________
Salaries and Wages . . . . . . . . . . . . . . . . . $28,530 $29,778 $29,788 $29,737 $29,643Pensions . . . . . . . . . . . . . . . . . . . . . . . . . 9,503 10,263 10,468 10,660 10,597Other Fringe Benefits . . . . . . . . . . . . . . . 11,295 12,382 11,846 12,940 13,897Reserve for Collective Bargaining . . . . . 764 1,308 952 1,138 1,515 __________________ ___________________ ___________________ ___________________ ___________________
Total . . . . . . . . . . . . . . . . . . . . . . . . . . . . $50,092 $53,731 $53,054 $54,475 $55,652 ============ ============= ============== ============= =============
_______________________________________________________________________________________________________________________________________________________________________________________________________________
Salaries and Wages
The projections for salaries and wages reflect personnel costs associated with current and projected headcount levels and also includes recognized needs and any wage adjustments from rounds of collective bargaining that have been implemented .
Pensions and Other Fringe Benefits
Pension expenses reflect recent actuarial estimates of the City’s five major retirement systems prepared by the Office of the Actuary . In addition to these estimates, pension expenses include the impact of asset performance in fiscal year 2020 .
Pension expense estimates in the financial plan reflect the new changes to the actuarial assumptions and methods, referred to as the 2021 A&M, proposed by the Chief Actuary . The proposal lowers the CPI assumption from 2 .5% to 2 .3% by reducing it 0 .05% each year for four years beginning June 30, 2019 . Since inflation is a component of each, lowering the CPI assumption affects Actuarial Interest Rate, General Wage Increase, and Cost of Living Assumption . In addition, 2021 A&M includes updating post-retirement mortality assumptions to reflect the latest improvement scale released by the Society of Actuaries (MP-2020) .
The 2021 A&M also include resetting the actuarial value of assets equal to the market value of assets, referred to as the Market Restart, and changing the phase-in schedule from the current six-year period to a five-year period at 20% per year going forward . Other changes include funding all of OTB’s required annual employer contribution and changing certain death benefits under NYCERS, TRS, and BERS in order to keep the plans in compliance with OWBPA .
The financial plan reflects the estimated impact of fiscal year 2020 investment returns of 4 .44% (net of investment fees) . The investment returns – lower than the assumed actuarial rate of seven percent – increased the City’s required pension contributions .
The financial plan includes a reserve of $200 million starting in fiscal 2022 rising to approximately $275 million beginning in fiscal 2023 to fund potential changes from future actuarial audit recommendations . Other adjustments stemming from changes in the number of active members, wage growth assumptions, increases in collective bargaining, legislation, and administrative expenses of the retirement systems have also been reflected in the financial plan .
Total pension expenses for the financial plan are shown below:

APPENDIX Fiscal Year 2022
238
Total Pension Expenses($ in Millions)
_______________________________________________________________________________________________________________________________________________________________________________________________________________
2021 2022 2023 2024 2025_______________________________________________________________________________________________________________________________________________________________________________________________________________
City Actuarial Systems . . . . . . . . . . . . . . $9,393 $10,148 $10,351 $10,540 $10,473Non-City Systems . . . . . . . . . . . . . . . . . . 109 114 117 120 123Non-Actuarial* . . . . . . . . . . . . . . . . . . . — — — — — __________________ ___________________ ___________________ ___________________ ___________________
Total** . . . . . . . . . . . . . . . . . . . . . . . . . . $9,503 $10,263 $10,468 $10,660 $10,597 ============= ============= ============== ============= =============
_______________________________________________________________________________________________________________________________________________________________________________________________________________
* Non-Actuarial expense are $350,000 rounded to zero.** Numbers may not add due to rounding.
Other fringe benefits include primarily Social Security, Unemployment Insurance, Workers’ Compensation and Health Insurance . Expenditures on fringe benefits include adjustments for the expected changes in the City’s planned headcount levels . The Social Security expense estimates reflect the tax rates and earnings caps as issued by the Social Security Administration . In Calendar 2021, the combined tax rate is 7 .65% . The OASDI tax portion of 6 .20% is applied to covered earnings capped at $142,800, while the Medicare tax portion of 1 .45% is applied to all covered earnings . Unemployment Insurance expense estimates are consistent with the statutory weekly benefit levels and planned payroll levels . Workers’ Compensation expense estimates are consistent with the compensation rate schedules mandated by state law, and the projected growth in medical costs . Health insurance expense estimates reflect current City enrollment and premium data available from the City’s health insurance providers . These expense estimates reflect the health care savings as contained in the May 2014 and the June 2018 labor agreements between the City and the Municipal Labor Committee . These agreements led to recurring annual savings of $1 .9 billion per year and are reflected in all years of the financial plan . The financial plan also reflects additional unspecified labor savings of $1 billion per year commencing in FY 2023 .
Reserve for Collective Bargaining
In calendar year 2018, the City reached contract settlements with District Council 37 of AFSCME (“DC 37”) and the United Federation of Teachers (“UFT”) for the 2017 to 2021 round of collective bargaining . The pattern framework provides for 2% wage increases on the first day of the contract, a 2 .25% wage increase as of the 13th month, and a 3% wage increase as of the 26th month . The pattern also provides funding equivalent to two 0 .25% of wages to be used to fund benefit items . The DC 37 Settlement covers the period from September 26, 2017 through May 25, 2021 . The UFT Settlement covers the period from February 14, 2019 through September 13, 2022 .
In December 2019, the City reached a contract settlement with eight members of the Uniformed Officers Coalition (“UOC”) . The settlement set the pattern for uniformed force employees in the 2017-2021 round of collective bargaining over a 36-month period, with increases of 2 .25% effective the first day, 2 .5% as of the 13th month, and 3% as of the 25th month .
The City has now reached settlements with approximately 85% of the represented workforce for the 2017-2021 round of collective bargaining . The Reserve contains funding for applicable unsettled unions based on the civilian or uniformed pattern .
All contract settlements also include health insurance savings as part of the June 28, 2018 Municipal Labor Committee (“MLC”) agreement, in addition to those previously agreed upon, which are contractually enforceable through arbitration .
The Reserve contains funding for the final, deferred lump sum payment due in Fiscal Year 2022 to UFT, CSA, and DIA members covered by the UFT nine-year pattern . The reserve also contains above the pattern prevailing wage risks for relevant skill trades titles, as well as annual 1% wage increases for the entire workforce starting in the third year beyond the current (2017-2021) round of bargaining .

APPENDIX Fiscal Year 2022
239
Other Than Personal Services
The following items are included in this category:
($ in Millions)
2021 2022 2023 2024 2025_______________________________________________________________________________________________________________________________________________________________________________________________________________
Administrative OTPS . . . . . . . . . . . . . . . $30,924 $28,670 $26,770 $26,527 $26,374Public Assistance . . . . . . . . . . . . . . . . . . 1,604 1,651 1,650 1,650 1,650 Medical Assistance . . . . . . . . . . . . . . . . . 6,140 6,418 6,494 6,494 6,494 Health + Hospitals . . . . . . . . . . . . . . . . . 2,531 980 682 690 690 Covered Agency Support & Other Subsidies 5,251 5,241 5,103 5,191 5,278 City Debt Service* . . . . . . . . . . . . . . . . . 6,351 7,088 8,391 8,788 9,352 Prepayment Adjustments . . . . . . . . . . . . (191) (3,628) — — —Capital Stabilization Reserve . . . . . . . . . — — 250 250 250 General Reserve . . . . . . . . . . . . . . . . . . . 50 300 1,000 1,000 1,000 __________________ ___________________ ___________________ ___________________ ___________________
Total . . . . . . . . . . . . . . . . . . . . . . . . . . . . $52,660 $46,720 $50,340 $50,590 $51,088 ============= ============= ============== ============= =============_______________________________________________________________________________________________________________________________________________________________________________________________________________
* Numbers adjusted for prepayments.
Administrative OTPS
The estimates in this category include new needs and savings in the baseline . For 2023 through 2025, most expenditures have been increased to reflect the effect of inflation . The inflation adjustment, which is shown in a citywide account, represents an estimated annual 2 .5 percent increase in 2023 through 2025 . Baseline costs for energy and lease requirements are shown in the appropriate operating agency, while out-year inflationary cost are primarily shown in citywide accounts as noted in the following two sections .
Energy
The financial plan includes a Citywide appropriation to provide for the changing cost of energy for 2023 through 2025 . Energy costs in each agency, with the exception of HPD, are held constant for 2022 through 2025 . Price and usage changes for HPD’s In-Rem/DAMP Programs are budgeted in HPD’s four-year plan .
Energy costs are expected to increase by $43 million from 2022 to 2025 due to weather normalization and fluctuating commodity prices . Gasoline and fuel oil costs are expected to decrease by $5 million from 2022 to 2025 . Heat, light and power costs are expected to increase by $48 million between 2022 and 2025 .
Energy Costs($ in Millions)
_______________________________________________________________________________________________________________________________________________________________________________________________________________
2021 2022 2023 2024 2025_______________________________________________________________________________________________________________________________________________________________________________________________________________
Gasoline . . . . . . . . . . . . . . . . . . . . . . . . . $66 $82 $79 $79 $80Fuel Oil . . . . . . . . . . . . . . . . . . . . . . . . . . 57 76 73 72 73HPD-In Rem / DAMP . . . . . . . . . . . . . . . 8 8 8 8 8HPD-Emergency Repairs . . . . . . . . . . . . 3 2 2 2 2Heat, Light and Power . . . . . . . . . . . . . . 668 770 776 797 818 _______________ _______________ ______________ _______________ _______________
Total . . . . . . . . . . . . . . . . . . . . . . . . . . . . $802 $938 $938 $958 $981 ============= ============= ============== ============= =============_______________________________________________________________________________________________________________________________________________________________________________________________________________

APPENDIX Fiscal Year 2022
240
Leases
In each agency, the cost of leases is budgeted at a constant level from 2022 through 2025 . A citywide adjustment for 2023 through 2025 provides for the increasing cost of leases based on a three percent annual inflator as well as known future leases, where applicable .
In total, the four-year plan includes $1 .451 billion for leases in 2022, $1 .494 billion in 2023, $1 .539 billion in 2024 and $1 .585 billion in 2025 . Of these amounts, the citywide adjustment is $43 million, $88 million, and $134 million respectively in 2023 through 2025 .
Public Assistance
The four-year financial plan supports the current monthly average caseload of 382,192 persons on Public Assistance .
Medical Assistance
The financial plan for Medical Assistance assumes baselined funds consistent with the New York State enacted budget effective April 1, 2021, in which the State continues to take over Medicaid growth from localities . The financial plan also assumes enhanced Federal Medicaid funding to localities from COVID-19 stimulus funds appropriated by Congress for the COVID-19 emergency period . In addition, the financial plan includes the City share of Disproportionate Share and Upper Payment Limit payments to Health + Hospitals which fall outside of the Medicaid cap .
Health + Hospitals
Revenue and expenditure projections for 2021 through 2025 include assumptions related to actual collections experience, the impact of rates by third party payers, and collections performance through a variety of revenue enhancement efforts . Included in the System’s baseline revenue assumption are the continued receipt of the Disproportionate Share and Upper Payment Limit transactions, as well as a shift from Medicaid Fee for Service to Medicaid Managed Care . Expenditure increases are driven by growth in health insurance costs and wage increases .
Covered Agency Support and Other Subsidies
Included in this category are the contributions made by the City to the Transit Authority, Housing Authority, Libraries and various Cultural Institutions . Also included in this category are the estimated projections for the cost of Judgments and Claims .
General Reserve
The General Reserve is projected at $50 million for 2021, $300 million for 2022 and $1 billion for 2023 through 2025 to provide for uncontrollable increases in expenditures as well as shortfalls in revenue . The General Reserve for 2023 through 2025 has been increased above the required amount as per the City Charter to allow for any further uncertainties that may occur in the future .
Capital Stabilization Reserve
The financial plan includes a capital stabilization reserve of $250 million in fiscal years 2023 through 2025, for a total of $750 million .

APPENDIX Fiscal Year 2022
241
Debt Service
Debt Service projections cover payments of debt service on currently outstanding City, TFA, and Conduit debt as well as future issuances in accordance with the 2021 through 2025 financing program (See Financing Program) . Actual debt service payments in these years will be affected by the timing of bond sales and by market conditions . Estimates of City and TFA debt service costs on debt to be issued are based on estimates of the periods of probable usefulness of the capital assets for which the debt will be issued .
A Budget Stabilization Account has been established for the prepayment of future years’ debt service costs . Funding of $3 .628 billion in 2021 has been provided for this purpose .
Below are the detailed estimates for debt service for 2021 through 2025 after prepayments:
($ in Millions)_______________________________________________________________________________________________________________________________________________________________________________________________________________
Total City, Long Short Lease Budget Total City Prepayment Lease and Term Term Purchase Stabilization* and Lease TFA Adjustment TFA___________________________________________________________________________________________________________________________________________________
2021 $2,162 $— $105 $3,628 $5,895 $265 $191 $6,351 2022 2,931 — 125 — $3,056 404 3,628 $7,088 2023 4,437 — 148 — $4,585 3,806 — $8,391 2024 4,741 — 118 — $4,859 3,929 — $8,788 2025 4,972 — 116 — $5,088 4,264 — $9,352 _______________________________________________________________________________________________________________________________________________________________________________________________________________
* Amounts in the Budget Stabilization Account are used to prepay the succeeding year’s debt service.

242
EXHIBIT 2
FISCAL YEAR 2022 EXECUTIVE BUDGET AND PROJECTIONS,FISCAL YEAR 2023 THROUGH FISCAL YEAR 2025
($ in thousands)
Fiscal Year 2021
FY 2020 8 Month FY 2022
Dept. Actual Executive Actuals Executive FY 2023 FY 2024 FY 2025
No. Agency Expenditures Budget July - Feb. Forecast Budget Estimate Estimate Estimate
002 Mayoralty $166,831 $160,057 $96,293 $156,273 $161,423 $156,472 $156,472 $156,434 003 Board of Elections 222,093 135,629 142,207 199,162 182,815 137,043 137,043 137,043
004 Campaign Finance Board 20,050 42,051 78,370 95,141 72,592 15,016 15,016 15,016
008 Offi ce of the Actuary 6,885 7,498 4,330 6,883 7,069 7,432 7,432 7,432 010 President,Borough of Manhattan 4,848 5,369 3,160 5,326 5,725 4,898 4,898 4,898
011 President,Borough of the Bronx 5,154 6,581 3,254 6,405 6,860 5,759 5,759 5,759
012 President,Borough of Brooklyn 6,679 7,446 4,165 7,447 8,128 6,423 6,423 6,423
013 President,Borough of Queens 5,687 6,042 3,607 6,215 6,656 5,055 5,055 5,055
014 President,Borough of S.I. 4,465 4,789 2,217 4,802 5,047 4,484 4,484 4,484
015 Offi ce of the Comptroller 103,843 113,757 72,812 109,276 108,523 110,348 110,348 110,348
017 Dept. of Emergency Management 257,893 28,759 279,908 565,459 52,410 29,505 29,422 29,265
021 Offi ce of Admin. Tax Appeals 5,456 6,051 3,731 5,853 5,975 5,975 5,975 5,975 025 Law Department 275,286 253,479 161,692 271,936 289,865 245,908 245,908 245,908
030 Department of City Planning 43,014 44,584 31,029 46,296 43,267 42,639 42,639 42,639
032 Department of Investigation 53,175 58,944 41,557 58,001 53,154 51,166 50,861 50,861
035 NY Public Library - Research 31,021 29,877 29,874 30,518 29,609 30,361 30,361 30,361
037 New York Public Library 157,377 150,143 155,311 158,192 148,858 152,774 152,774 152,774
038 Brooklyn Public Library 119,335 113,389 78,185 117,909 111,000 113,846 113,846 113,846
039 Queens Borough Public Library 123,715 117,789 80,147 121,731 115,745 118,709 118,709 118,709
040 Department of Education 28,066,520 27,540,087 17,434,863 29,150,697 31,425,699 30,876,366 31,151,240 31,307,885 042 City University 1,255,112 1,199,074 547,455 1,283,377 1,194,187 1,288,758 1,307,250 1,322,744
054 Civilian Complaint Review Bd. 19,677 19,471 12,991 19,927 24,529 24,121 24,121 24,121
056 Police Department 6,086,161 5,644,654 3,614,616 5,412,948 5,435,402 5,426,132 5,426,159 5,426,159
057 Fire Department 2,174,497 2,079,074 1,499,122 2,227,175 2,171,878 2,114,433 2,103,107 2,102,597
063 Dept. of Veterans’ Services 4,975 6,490 3,332 6,272 6,241 6,235 6,235 6,235
068 Admin. for Children Services 2,646,361 2,653,467 1,800,910 2,720,534 2,686,146 2,682,668 2,681,450 2,681,450
069 Department of Social Services 10,555,946 9,634,393 6,737,107 10,596,832 11,017,465 10,697,539 10,696,096 10,695,685
071 Dept. of Homeless Services 2,369,187 2,074,343 2,181,470 2,837,117 2,155,979 2,070,350 2,070,350 2,070,350 072 Department of Correction 1,287,216 1,194,531 842,456 1,138,902 1,176,905 1,204,345 1,204,333 1,204,333
073 Board of Correction 2,557 3,024 1,525 2,442 2,801 2,835 2,835 2,835
095 Citywide Pension Contributions 9,784,042 9,926,953 6,617,260 9,502,553 10,262,796 10,468,442 10,660,080 10,596,660
098 Miscellaneous 9,925,390 10,986,388 4,711,534 11,107,431 12,947,002 12,044,921 12,822,084 13,714,980
099 Debt Service 6,553,574 3,235,354 1,950,282 6,160,476 3,460,253 8,390,658 8,788,336 9,352,140
101 Public Advocate 4,341 4,606 3,226 4,843 4,901 4,870 4,870 4,870
102 City Council 80,146 87,635 55,072 81,726 80,513 56,441 56,441 56,441
103 City Clerk 5,507 6,016 3,574 5,303 5,998 6,030 6,030 6,030
125 Department for the Aging 423,982 386,070 289,977 398,142 440,047 447,863 444,644 447,538
126 Department of Cultural Affairs 209,861 137,515 113,696 187,774 170,201 149,821 149,821 149,821
127 Financial Info. Serv. Agency 109,409 111,744 91,941 116,621 112,659 112,809 112,809 112,809 131 Offi ce of Payroll Admin. 15,366 15,323 9,979 16,410 15,111 15,161 15,161 15,161 132 Independent Budget Offi ce 4,556 5,791 3,292 5,911 6,180 5,958 5,958 5,958 133 Equal Employment Practices Com 1,142 1,268 752 1,193 1,387 1,387 1,387 1,387 134 Civil Service Commission 958 1,219 677 1,064 1,198 1,198 1,198 1,198 136 Landmarks Preservation Comm 6,443 6,963 4,250 6,872 6,837 6,899 6,899 6,899
226

243227
EXHIBIT 2
FISCAL YEAR 2022 EXECUTIVE BUDGET AND PROJECTIONS,FISCAL YEAR 2023 THROUGH FISCAL YEAR 2025
($ in thousands)
Fiscal Year 2021
FY 2020 8 Month FY 2022
Dept. Actual Executive Actuals Executive FY 2023 FY 2024 FY 2025
No. Agency Expenditures Budget July - Feb. Forecast Budget Estimate Estimate Estimate
156 Taxi & Limousine Commission $52,947 $55,701 $37,859 $118,962 $55,322 $57,169 $56,834 $55,969
226 Commission on Human Rights 12,156 14,034 8,161 12,663 12,691 13,088 13,088 13,088
260 Youth & Community Development 955,159 598,297 527,010 959,774 835,402 776,140 775,997 775,372
312 Confl icts of Interest Board 2,531 2,656 1,625 2,501 2,706 2,756 2,756 2,756
313 Offi ce of Collective Barg. 2,249 2,454 1,645 2,353 2,447 2,455 2,455 2,455
499 Community Boards (All) 18,597 18,722 11,789 19,254 18,951 19,380 19,389 19,389
781 Department of Probation 114,278 121,688 86,185 130,150 123,857 122,439 122,439 122,440
801 Dept. Small Business Services 340,110 160,835 161,645 345,565 317,624 143,372 140,609 189,723
806 Housing Preservation & Dev. 1,129,780 1,015,507 863,505 1,376,683 1,085,667 1,024,762 1,039,618 1,037,418
810 Department of Buildings 189,531 189,754 131,044 207,182 225,706 207,462 200,121 198,621
816 Dept Health & Mental Hygiene 1,860,296 1,692,231 1,616,632 2,440,128 2,138,208 1,990,631 1,901,242 1,835,274
819 Health and Hospitals Corp. 830,222 1,144,698 1,145,458 2,531,383 980,027 681,866 690,050 690,050
820 Offi ce Admin Trials & Hearings 44,706 51,601 28,681 45,875 52,036 51,436 51,436 51,436
826 Dept of Environmental Prot. 1,382,813 1,397,468 951,009 1,491,857 1,519,836 1,439,397 1,416,873 1,413,552
827 Department of Sanitation 2,103,205 1,745,297 1,810,353 2,431,475 1,825,604 1,826,844 1,827,834 1,836,231
829 Business Integrity Commission 8,810 9,672 6,436 9,047 9,226 9,496 9,496 9,496
836 Department of Finance 310,095 324,215 204,981 315,200 339,626 335,003 335,033 331,903
841 Department of Transportation 1,094,127 1,095,684 758,279 1,136,784 1,244,617 1,272,027 1,271,931 1,272,508
846 Dept of Parks and Recreation 567,211 509,210 350,284 562,160 587,634 554,664 554,756 554,760
850 Dept. of Design & Construction 347,153 168,958 208,470 385,184 213,915 153,814 155,008 156,087
856 Dept of Citywide Admin Srvces 1,839,807 1,279,451 1,494,267 1,949,815 1,353,129 1,357,259 1,356,883 1,356,383
858 D.O.I.T.T. 821,681 708,220 679,866 1,136,275 706,879 711,271 721,682 728,360
860 Dept of Records & Info Serv. 9,601 15,510 8,157 11,223 16,892 16,943 16,943 16,943
866 Dept. Cnsmr. & Wkr. Prot. 41,537 44,103 31,060 43,387 46,322 46,483 45,933 45,933
901 District Attorney - N.Y. 141,083 123,488 97,329 143,328 126,412 126,414 126,414 126,414
902 District Attorney - Bronx 86,241 91,945 59,553 94,184 91,999 91,999 91,999 91,999
903 District Attorney - Kings 117,155 119,334 81,599 127,371 119,558 119,558 119,558 119,558
904 District Attorney - Queens 72,994 76,897 51,735 78,185 76,963 76,963 76,963 76,963
905 District Attorney - Richmond 18,584 18,521 12,604 19,640 18,509 18,504 18,499 18,499
906 Off. of Prosec. & Spec. Narc. 23,725 25,698 14,954 25,789 25,497 25,497 25,497 25,497
941 Public Administrator - N.Y. 1,199 1,240 556 1,196 1,251 1,255 1,255 1,255
942 Public Administrator - Bronx 686 754 479 755 755 755 755 755
943 Public Administrator- Brooklyn 849 916 628 917 917 917 917 917
944 Public Administrator - Queens 591 674 393 651 674 674 674 674
945 Public Administrator -Richmond 570 572 376 577 572 572 572 572
Prior Payable Adjustment (589,574) — — (421,000) — — — —
General Reserve — 100,000 — 50,000 300,000 1,000,000 1,000,000 1,000,000
Citywide Savings Initiatives — — — — (254,150) (333,694) (338,839) (344,067)
Energy Adjustment — — — — — (435) 19,913 43,339
Lease Adjustment — — — — — 43,542 88,391 134,584
OTPS Infl ation Adjustment — — — — — 55,519 111,038 166,557
LESS: INTRA-CITY EXPENDITURES 2,128,581 1,847,999 438,661 2,091,210 1,890,623 1,858,132 1,857,693 1,852,603
NET TOTAL EXPENDITURES $95,029,857 $89,331,693 $60,809,154 $100,660,630 $98,559,694 $101,536,118 $103,206,638 $104,886,576
—

APPENDIX Fiscal Year 2022
244
EXHIBIT 3
ACTUAL REVENUE($ in Millions)
__________________________________________________________________________________________________________________________________________________________________________________________
Fiscal Fiscal Fiscal Fiscal Year Year Year Year 2017 2018 2019 2020__________________________________________________________________________________________________________________________________________________________________________________________
Taxes:Real Property ............................................................................... $24,679 $26,408 $27,885 $29,816 Personal Income ........................................................................... 11,230 13,372 13,344 13,551 General Corporation .................................................................... 3,528 3,454 4,269 4,547 Banking Corporation ................................................................... (82) (17) (70) (38)Unincorporated Business ............................................................. 2,005 2,182 2,029 1,939 Sales and Use ............................................................................... 7,017 7,443 7,810 7,372 Commercial Rent ......................................................................... 816 853 907 864 Real Property Transfer ................................................................. 1,415 1,388 1,547 1,135 Mortgage Recording .................................................................... 1,118 1,050 1,097 975 Utility ........................................................................................... 371 371 369 356 Cigarette ....................................................................................... 37 36 30 25 Hotel ............................................................................................. 579 597 625 468 All Other ...................................................................................... 653 630 834 1,054 Tax Audit Revenue ....................................................................... 1,296 1,337 818 1,026
_____________ _____________ _____________ ______________
Total Taxes ............................................................................... 54,662 59,104 61,494 63,090 _____________ _____________ _____________ ______________
Miscellaneous Revenues:Licenses, Franchises, Etc. ............................................................ 770 776 802 699 Interest Income ............................................................................ 73 125 226 137 Charges for Services .................................................................... 1,033 1,027 1,030 951 Water and Sewer Charges ............................................................ 1,385 1,390 1,470 1,615 Rental Income .............................................................................. 253 261 273 258 Fines and Forfeitures .................................................................... 985 1,027 1,109 1,079 Miscellaneous .............................................................................. 565 413 1,087 530 Intra-City Revenue ....................................................................... 2,053 2,197 2,236 2,129
_____________ _____________ _____________ ______________
Total Miscellaneous ................................................................. 7,117 7,216 8,233 7,398 _____________ _____________ _____________ ______________
Unrestricted Intergovernmental Aid:Other Federal and State Aid ......................................................... 59 — 151 11
_____________ _____________ _____________ ______________
Total Unrestricted Intergovernmental Aid ............................... 59 — 151 11 _____________ _____________ _____________ ______________
Provision for Disallowance of Categorical Grants ...................... 558 139 113 (5)Less Intra-City Revenue .............................................................. (2,053) (2,197) (2,236) (2,129)
_____________ _____________ _____________ ______________
Sub Total City Funds ............................................................... 60,343 64,262 67,755 68,365 _____________ _____________ _____________ ______________
Other Categorical Grants ............................................................. 1,208 1,255 1,340 1,105 Transfers from Capital Fund:Inter Fund Agreements ................................................................ 633 637 652 650
_____________ _____________ _____________ ______________
Total City Funds & Inter Fund & Other Categorical Revenues ............................................... 62,184 66,154 69,747 70,120
_____________ _____________ _____________ ______________
Federal Grants and Contracts Categorical:Community Development ............................................................ 1,108 1,081 506 558 Social Services ............................................................................. 3,454 3,362 3,553 2,918 Education ..................................................................................... 1,709 1,786 1,876 1,672 Other ............................................................................................ 1,656 1,737 1,784 4,433
_____________ _____________ _____________ ______________
Total Federal Grants and Contracts Categorical .......................... 7,927 7,966 7,719 9,581 _____________ _____________ _____________ ______________
State Grants and Contracts Categorical:Social Services ............................................................................. 1,709 1,611 1,698 1,750 Education ..................................................................................... 10,250 10,710 11,185 11,493 Higher Education ......................................................................... 248 255 263 246 Department of Health and Mental Hygiene ................................ 573 535 523 428 Other ............................................................................................ 1,210 1,342 1,301 1,417
_____________ _____________ _____________ ______________
Total State Grants and Contracts Categorical .................................. 13,990 14,453 14,970 15,334 _____________ _____________ _____________ ______________
Total Revenues .............................................................................. $ 84,101 $88,573 $92,436 $95,035 __________________________________________________________________________________________________________________________________________________________________________________________

APPENDIX Fiscal Year 2022
245
EXHIBIT 4REVENUE ESTIMATES
($ in Millions)_______________________________________________________________________________________________________________________________________________________________________________________________________________
Fiscal Year 2021 Fiscal Fiscal Fiscal Fiscal Fiscal 8 Months Year Year Year Year Year Actuals 2021 2022 2023 2024 2025_______________________________________________________________________________________________________________________________________________________________________________________________________________
Taxes:Real Property .......................... $29,030 $30,954 $29,370 $30,042 $30,471 $30,881 Personal Income ...................... 8,613 13,344 13,827 14,728 15,280 15,849 General Corporation ............... 2,096 4,382 4,378 4,608 4,681 4,719 Banking Corporation............... (2) — — — — - Unincorporated Business ........ 1,067 1,962 2,005 2,105 2,201 2,277 Sale and Use............................ 4,238 6,484 7,423 8,339 8,992 9,501 Commercial Rent .................... 421 841 880 913 937 959 Real Property Transfer ............ 573 992 1,155 1,335 1,409 1,484 Mortgage Recording ............... 514 816 894 919 971 1,024 Utility ...................................... 200 357 374 376 383 395 Cigarette .................................. 13 20 19 18 17 16 Hotel ........................................ 31 75 215 350 520 630 All Other ................................. 391 880 833 833 833 833 Tax Audit Revenue .................. 385 1,171 921 721 721 721 City Tax Programs................... — — (90) — — - State Tax Relief Program - STAR 154 154 152 150 148 146
____________________ ______________________ ______________________ ______________________ ______________________ ______________________
Total Taxes ......................... 47,724 62,432 62,356 65,437 67,564 69,435 ____________________ ______________________ ______________________ ______________________ ______________________ ______________________
Miscellaneous Revenue:Licenses, Franchises, Etc. ...... 399 607 658 686 688 686 Interest Income........................ 12 14 9 10 13 36 Charges for Services ............... 460 896 1,023 1,037 1,041 1,041 Water and Sewer Charges ....... 1,727 1,721 1,634 1,614 1,596 1,594 Rental Income ......................... 154 258 248 248 248 248 Fines and Forfeitures ............... 639 986 1,067 1,093 1,093 1,093 Miscellaneous.......................... 267 666 343 341 341 340 Intra-City Revenue .................. 439 2,091 1,891 1,858 1,858 1,853
____________________ ______________________ ______________________ ______________________ ______________________ ______________________
Total Miscellaneous .......... 4,097 7,239 6,873 6,887 6,878 6,891 ____________________ ______________________ ______________________ ______________________ ______________________ ______________________
Unrestricted Intergovernmental Aid: Other Federal & State Aid ...... — 1 — — — -
____________________ ______________________ ______________________ ______________________ ______________________ ______________________
Total Unrestricted Intergovernmental Aid .... — 1 — — — -
Reserve for Disallowance of Categorical Grants ............. — (15) (15) (15) (15) (15)
Less: Intra-City Revenue (439) (2,091) (1,891) (1,858) (1,858) (1,853) ____________________ ______________________ ______________________ ______________________ ______________________ ______________________
Sub Total City Funds ......... 51,382 67,566 67,323 70,451 72,569 74,458 ____________________ ______________________ ______________________ ______________________ ______________________ ______________________
Other Categorical Grants ........ 194 1,121 1,025 993 991 990 Inter Fund Agreements ........... 228 658 725 725 725 725
____________________ ______________________ ______________________ ______________________ ______________________ ______________________
Total City Funds & Inter Fund & Other Categorical Revenues ......................... $51,804 $69,345 $69,073 $72,169 $74,285 $76,173 =========== =========== =========== =========== =========== ===========

APPENDIX Fiscal Year 2022
246
EXHIBIT 4REVENUE ESTIMATES
($ in Millions)_______________________________________________________________________________________________________________________________________________________________________________________________________________
Fiscal Year 2021 Fiscal Fiscal Fiscal Fiscal Fiscal 8 Months Year Year Year Year Year Actuals 2021 2022 2023 2024 2025_______________________________________________________________________________________________________________________________________________________________________________________________________________
Federal Grants and Contracts Categorical:
Community Development ....... $158 $895 $327 $261 $261 $261 Social Services ........................ 935 3,767 3,329 3,453 3,453 3,453 Education ................................ 161 2,866 5,197 3,734 3,346 2,492 Other........................................ 1,228 8,777 4,713 1,709 1,538 1,698
____________________ ______________________ ______________________ ______________________ ______________________ ______________________
Total Federal Grants and Contracts Categorical ............ 2,482 16,305 13,566 9,157 8,598 7,904
____________________ ______________________ ______________________ ______________________ ______________________ ______________________
State Grants and Contracts Categorical:
Social Services ........................ 479 1,902 1,805 1,829 1,828 1,828 Education ................................ 2,629 10,845 11,959 12,250 12,521 12,713 Higher Education .................... 44 283 283 282 282 282 Department of Health and
Mental Hygiene .................... 166 484 515 548 548 548 Other........................................ 141 1,497 1,359 1,396 1,445 1,503
____________________ ______________________ ______________________ ______________________ ______________________ ______________________
Total State Grants and Contracts Categorical ............. 3,459 15,011 15,921 16,305 16,624 16,874
================= ================== ================== =================== ================== ==================
TOTAL REVENUE ................ $57,745 $100,661 $98,560 $97,631 $99,507 $100,951 ================= ================== ================== =================== ================== ==================
_______________________________________________________________________________________________________________________________________________________________________________________________________________

APPENDIX Fiscal Year 2022
247
EXHIBIT 5FULL-TIME and PART-TIME POSITIONS (FTEs)
_______________________________________________________________________________________________________________________________________________________________________________________________________________
6/30/2022 6/30/2023 6/30/2024 6/30/2025 Total City Total City Total City Total City _______________________________________________________________________________________________________________________________________________________________________________________________________________
MAYORAL AGENCIES AND ELECTED OFFICIALS:Uniformed Forces: Police -Uniform . . . . . . . . . 35,030 35,030 35,030 35,030 35,030 35,030 35,030 35,030 -Civilian . . . . . . . . . 17,452 17,432 17,586 17,566 17,586 17,566 17,586 17,566 Fire -Uniform . . . . . . . . . 10,945 10,935 10,952 10,942 10,952 10,942 10,952 10,942 -Civilian . . . . . . . . . . . . 6,503 6,391 6,751 6,639 6,751 6,639 6,751 6,639 Correction -Uniform . . . . . . . . . . 7,460 3,860 7,060 7,060 7,060 7,060 7,060 7,060 -Civilian . . . . . . . . . . . 1,911 1,903 1,908 1,900 1,908 1,900 1,908 1,900 Sanitation -Uniform . . . . . . . . . . 7,483 7,424 7,691 7,632 7,691 7,632 7,691 7,691 -Civilian . . . . . . . . . . . 2,480 2,422 2,462 2,404 2,462 2,404 2,462 2,404 _____________ ____________ ____________ ____________ ____________ _____________ ____________ ____________
Subtotal . . . . . . . . . . 89,264 85,397 89,440 89,173 89,440 89,173 89,440 89,232
Health and Welfare: Admin . for Children’s Services . . 7,340 7,173 7,340 7,173 7,340 7,173 7,340 7,173 Social Services . . . . . . . . . . . . . 13,626 10,205 13,626 10,205 13,626 10,218 13,626 10,205 Homeless Services . . . . . . . . . . . . 2,159 2,103 2,124 2,103 2,124 2,103 2,124 2,103 Health & Mental Hygiene . . . . . 7,299 5,829 7,107 5,633 7,149 5,675 7,094 5,643 _____________ ____________ ____________ ____________ ____________ _____________ ____________ ____________
Subtotal . . . . . . . . . . 30,424 25,310 30,197 25,114 30,239 25,169 30,184 25,124
Other Agencies: Housing Preservation and Development . . . . . . . . . . . . . . 2,611 793 2,608 815 2,608 815 2,608 815 Environmental Protection . . . . . . 6,429 263 6,424 265 6,433 265 6,433 265 Finance . . . . . . . . . . . . . . . . . . . 2,187 2,175 2,187 2,175 2,187 2,175 2,187 2,175 Transportation . . . . . . . . . . . . . . . 5,953 2,695 5,980 2,731 5,995 2,746 5,997 2,790 Parks . . . . . . . . . . . . . . . . . . 8,484 6,801 7,504 6,800 7,504 6,800 7,504 6,800 Citywide Administrative Services . . 2,758 2,048 2,784 2,075 2,784 2,075 2,784 2,075 All Other . . . . . . . . . . . . . . . . . . 23,121 19,879 22,722 19,687 22,671 19,648 22,667 19,646 _____________ ____________ ____________ ____________ ____________ _____________ ____________ ____________
Subtotal . . . . . . . . . . 51,543 34,654 50,209 34,548 50,182 34,524 50,180 34,566
Education: Dept . of Education -Pedagogical 128,795 94,838 129,427 94,838 130,446 94,838 130,464 94,838 -Civilian . . . . 26,267 22,644 26,515 22,644 26,995 22,644 27,005 22,644 City University -Pedagogical . . . 6,533 6,533 6,533 6,533 6,533 6,533 6,533 6,533 -Civilian . . . . . 3,578 3,578 3,753 3,753 3,753 3,753 3,753 3,753 _____________ ____________ ____________ ____________ ____________ _____________ ____________ ____________
Subtotal . . . . . . . . . . . 165,173 127,593 166,228 127,768 167,727 127,768 167,755 127,768 _____________ ____________ ____________ ____________ ____________ _____________ ____________ ____________
Hiring and Attrition Management: . . . . (4,452) (4,452) (4,452) (4,452) (4,452) (4,452) (4,452) (4,452) _____________ ____________ ____________ ____________ ____________ _____________ ____________ ____________
Total - Mayoral Agencies and Elected Officials . . . . . . . . . . . . . 331,952 268,502 331,622 272,151 333,136 272,182 333,107 272,238
COVERED ORGANIZATIONS1: Health + Hospitals . . . . . . . . . . . 37,272 37,272 37,272 37,272 37,272 37,272 37,272 37,272 Housing Authority . . . . . . . . . . . 11,559 - 11,081 - 10,472 - 10,211 - Libraries . . . . . . . . . . . . . . . . . . . 4,086 4,086 4,268 4,268 4,268 4,268 4,268 4,268 Cultural Institutions2 . . . . . . . . . . 1,406 1,406 1,406 1,406 1,406 1,406 1,406 1,406 School Construction Authority . . . . 899 899 899 899 899 899 899 899 New York City Employees Retirement System . . . . . . . . . . . . 517 517 517 517 517 517 517 517 Economic Development Corporation . . . . . . . . . . . . . . . . . 504 504 504 504 504 504 504 504 Teachers Retirement System . . . . . . 358 358 406 406 406 406 406 406 Police Pension Fund . . . . . . . . . . . . 147 147 147 147 147 147 147 147 Fire Pension Fund . . . . . . . . . . . . . . . 50 50 50 50 50 50 50 50 All Other3 . . . . . . . . . . . . . . . . . . . . 275 271 276 272 277 273 278 274 _____________ ____________ ____________ ____________ ____________ _____________ ____________ ____________
Total - Covered Organizations . . 57,073 45,510 56,826 45,741 56,218 45,742 55,958 45,743 _____________ ____________ ____________ ____________ ____________ _____________ ____________ ____________
Grand Total . . . . . . . . . . . . . . . . . .389,025 314,012 388,448 317,892 389,354 317,924 389,065 317,981 ========== ========= ========= ========= ========= ========= ========= =========________________________________________________________________________________________________________________________________________________________________________________________________________________________________________________________________________
1 . Includes non-city employees substantially paid by city subsidies . 2 . Includes only those employees of the Cultural Institutions Group paid by city fund subsidies .3 . Includes Housing Development Corporation, Education Construction Fund, City University Construction Fund, Rent Guidelines
Board and Water Finance Authority .

APPENDIX Fiscal Year 2022
248
EXHIBIT 6FY 2022 EXECUTIVE BUDGET
CITYWIDE SAVINGS PROGRAM—5 YEAR VALUE(City $ in 000’s)
_______________________________________________________________________________________________________________________________________________________________________________________________________________
FY 2021 FY 2022 FY 2023 FY 2024 FY 2025_______________________________________________________________________________________________________________________________________________________________________________________________________________
Uniformed Forces:Police . . . . . . . . . . . . . . . . . . . . . . . . . . . . . . . $22,377 $186,092 $177,615 $177,615 $177,615 Fire . . . . . . . . . . . . . . . . . . . . . . . . . . . . . . . . 34,052 58,987 812 812 812 Correction . . . . . . . . . . . . . . . . . . . . . . . . . . . 1,211 69,947 25,000 25,000 25,000 Sanitation . . . . . . . . . . . . . . . . . . . . . . . . . . . 13,782 30,084 2,257 2,342 2,528
Health and Welfare:Admin . for Children’s Services . . . . . . . . . . 36,320 9,000 — — —Social Services . . . . . . . . . . . . . . . . . . . . . . . 215,189 15,531 3,400 3,400 3,400 Homeless Services . . . . . . . . . . . . . . . . . . . . 2,529 1,310 1,310 1,310 1,310 Aging . . . . . . . . . . . . . . . . . . . . . . . . . . . . . . . 30,000 — — — —Youth and Community Dev . . . . . . . . . . . . . . 13,718 200 200 200 200 Health and Mental Hygiene . . . . . . . . . . . . . 33,691 5,545 1,545 1,545 1,545
Other Agencies:Housing Preservation and Dev . . . . . . . . . . . . 2,487 4,547 162 162 162 Finance . . . . . . . . . . . . . . . . . . . . . . . . . . . . . 1,174 37,870 52,514 52,514 52,514 Transportation . . . . . . . . . . . . . . . . . . . . . . . . 23,649 22,871 7,776 7,776 7,776 Parks and Recreation . . . . . . . . . . . . . . . . . . 19,597 19,250 1,000 1,000 1,000 Citywide Administrative Services . . . . . . . . 28,928 8,522 506 506 506 All Other Agencies . . . . . . . . . . . . . . . . . . . . 305,179 60,569 6,027 6,019 6,019
Education:Education . . . . . . . . . . . . . . . . . . . . . . . . . . . 4,000 78,000 — — —City University . . . . . . . . . . . . . . . . . . . . . . . — 77,300 — — —
Other:Citywide Savings Initiatives . . . . . . . . . . . . . 93,894 313,794 372,697 394,403 402,623 Miscellaneous . . . . . . . . . . . . . . . . . . . . . . . . 47,417 36,107 14,050 14,763 15,487 Debt Service . . . . . . . . . . . . . . . . . . . . . . . . . 987,191 890,925 294,071 329,970 393,680 Procurement Savings . . . . . . . . . . . . . . . . . . — 50,519 50,519 50,519 33,443
_____________________ _____________________ _____________________ _____________________ _____________________
Total Citywide Savings Program . . . . . . . . $1,916,385 $1,976,970 $1,011,461 $1,069,856 $1,125,620 ================== ================= ================= ================= =================_______________________________________________________________________________________________________________________________________________________________________________________________________________
Note: Includes initiatives from the April 26, 2021 Executive Budget, the January 14, 2021 Preliminary Budget and the November 23, 2020 Financial Plan . Amounts include current year restorations .

APPENDIX Fiscal Year 2022
249
EXHIBIT 6FY 2022 EXECUTIVE BUDGET
CITYWIDE SAVINGS PROGRAM - 5 YEAR VALUE(City $ in 000’s)
_______________________________________________________________________________________________________________________________________________________________________________________________________________
FY 2021 FY 2022 FY 2023 FY 2024 FY 2025_______________________________________________________________________________________________________________________________________________________________________________________________________________
Other Agencies:Mayoralty . . . . . . . . . . . . . . . . . . . . . . . . . . . $4,635 $1,761 $869 $869 $869 Campaign Finance Board . . . . . . . . . . . . . . . 7,547 — — — —Actuary . . . . . . . . . . . . . . . . . . . . . . . . . . . . . 455 363 — — —Emergency Management . . . . . . . . . . . . . . . 695 709 — — —Administrative Tax Appeals . . . . . . . . . . . . . 371 125 — — — Law . . . . . . . . . . . . . . . . . . . . . . . . . . . . . . . . 12,039 5,044 1,544 1,544 1,544 City Planning . . . . . . . . . . . . . . . . . . . . . . . . 2,052 517 287 287 287 Investigation . . . . . . . . . . . . . . . . . . . . . . . . . 1,967 1,863 572 572 572 New York Research Libraries . . . . . . . . . . . . 310 752 — — — New York Public Library . . . . . . . . . . . . . . . 1,558 3,779 — — — Brooklyn Public Library . . . . . . . . . . . . . . . . 1,173 2,845 — — — Queens Borough Public Library . . . . . . . . . . 1,223 2,963 — — — Veterans’ Services . . . . . . . . . . . . . . . . . . . . . 465 180 — — — Board of Correction . . . . . . . . . . . . . . . . . . . 209 34 — — — City Clerk . . . . . . . . . . . . . . . . . . . . . . . . . . . 440 32 — — — Cultural Affairs . . . . . . . . . . . . . . . . . . . . . . . 1,197 4,796 85 85 85 Financial Info . Services Agency . . . . . . . . . . 472 150 — — — Payroll Admin . . . . . . . . . . . . . . . . . . . . . . . . 287 50 — — — Independent Budget Office . . . . . . . . . . . . . . 34 — — — — Equal Employment Practices . . . . . . . . . . . . 44 — — — — Civil Service . . . . . . . . . . . . . . . . . . . . . . . . . 124 — — — — Landmarks Preservation . . . . . . . . . . . . . . . . 233 — — — — Taxi and Limousine . . . . . . . . . . . . . . . . . . . 842 1,354 — — — Human Rights . . . . . . . . . . . . . . . . . . . . . . . . 412 397 — — — Conflicts of Interest Board . . . . . . . . . . . . . . 69 50 — — — Collective Bargaining . . . . . . . . . . . . . . . . . . 67 8 — — — Community Boards (All) . . . . . . . . . . . . . . . 249 437 8 — — Probation . . . . . . . . . . . . . . . . . . . . . . . . . . . . 5,747 3,108 755 755 755 Small Business Services . . . . . . . . . . . . . . . . 7,340 919 115 115 115 Buildings . . . . . . . . . . . . . . . . . . . . . . . . . . . . 3,250 12,086 386 386 386 Health + Hospitals . . . . . . . . . . . . . . . . . . . . 212,378 — — — — Administrative Trials and Hearings . . . . . . . 5,810 157 157 157 157 Environmental Protection . . . . . . . . . . . . . . . 1,716 1,263 — — — Business Integrity . . . . . . . . . . . . . . . . . . . . . 355 202 — — — Design and Construction . . . . . . . . . . . . . . . . 486 985 — — — DOITT . . . . . . . . . . . . . . . . . . . . . . . . . . . . . . 20,537 9,255 661 661 661 Records and Info . Services . . . . . . . . . . . . . . 728 1,013 430 430 430 Consumer and Worker Protection . . . . . . . . . 627 908 158 158 158 PA - Manhattan . . . . . . . . . . . . . . . . . . . . . . . 45 — — — — PA - Queens . . . . . . . . . . . . . . . . . . . . . . . . . 23 — — — —
_____________________ _____________________ _____________________ _____________________ _____________________
Subtotal . . . . . . . . . . . . . . . . . . . . . . . . . . . . . 298,211 58,105 6,027 6,019 6,019
Elected Officials:BP - Manhattan . . . . . . . . . . . . . . . . . . . . . . . 90 83 — — — BP - Bronx . . . . . . . . . . . . . . . . . . . . . . . . . . 59 144 — — — BP - Brooklyn . . . . . . . . . . . . . . . . . . . . . . . . 70 — — — — BP - Queens . . . . . . . . . . . . . . . . . . . . . . . . . 58 — — — — BP - Staten Island . . . . . . . . . . . . . . . . . . . . . 46 112 — — — Comptroller . . . . . . . . . . . . . . . . . . . . . . . . . . 843 2,109 — — — Public Advocate . . . . . . . . . . . . . . . . . . . . . . — 16 — — — City Council . . . . . . . . . . . . . . . . . . . . . . . . . 5,802 — — — —
_____________________ _____________________ _____________________ _____________________ _____________________
Subtotal . . . . . . . . . . . . . . . . . . . . . . . . . . . . . 6,968 2,464 — — — _____________________ _____________________ _____________________ _____________________ _____________________
Total All Other Agencies . . . . . . . . . . . . . . . $305,179 $60,569 $6,027 $6,019 $6,019 ================== ================= ================= ================= =================

APPENDIX Fiscal Year 2022
250
EXHIBIT 6AFY 2022 EXECUTIVE BUDGET
CITYWIDE SAVINGS PROGRAM - BY EXPENSE AND REVENUE(City $ in 000’s)
_______________________________________________________________________________________________________________________________________________________________________________________________________________
Expense Revenue Total_______________________________________________________________________________________________________________________________________________________________________________________________________________
Uniformed Forces: Police . . . . . . . . . . . . . . . . . . . . . . . . . . . . . . . . . . . . . . . $185,052 $1,040 $186,092 Fire . . . . . . . . . . . . . . . . . . . . . . . . . . . . . . . . . . . . . . . . . 58,987 — 58,987 Correction . . . . . . . . . . . . . . . . . . . . . . . . . . . . . . . . . . . 69,947 — 69,947 Sanitation . . . . . . . . . . . . . . . . . . . . . . . . . . . . . . . . . . . . 30,084 — 30,084
Health & Welfare: Admin . for Children’s Services . . . . . . . . . . . . . . . . . . . 9,000 — 9,000 Social Services . . . . . . . . . . . . . . . . . . . . . . . . . . . . . . . . 15,531 — 15,531 Homeless Services . . . . . . . . . . . . . . . . . . . . . . . . . . . . . 1,310 — 1,310 Youth and Community Dev . . . . . . . . . . . . . . . . . . . . . . . 200 — 200 Health and Mental Hygiene . . . . . . . . . . . . . . . . . . . . . . 5,545 — 5,545
Other Agencies: Housing Preservation and Dev . . . . . . . . . . . . . . . . . . . . 4,547 — 4,547 Finance . . . . . . . . . . . . . . . . . . . . . . . . . . . . . . . . . . . . . . — 37,870 37,870 Transportation . . . . . . . . . . . . . . . . . . . . . . . . . . . . . . . . 17,035 5,836 22,871 Parks and Recreation . . . . . . . . . . . . . . . . . . . . . . . . . . . 19,250 — 19,250 Citywide Administrative Services . . . . . . . . . . . . . . . . . 8,522 — 8,522 All Other Agencies . . . . . . . . . . . . . . . . . . . . . . . . . . . . 60,144 425 60,569
Education: Education . . . . . . . . . . . . . . . . . . . . . . . . . . . . . . . . . . . . 78,000 — 78,000 City University . . . . . . . . . . . . . . . . . . . . . . . . . . . . . . . . 77,300 — 77,300
Other: Citywide Savings Initiatives . . . . . . . . . . . . . . . . . . . . . 313,794 — 313,794 Miscellaneous . . . . . . . . . . . . . . . . . . . . . . . . . . . . . . . . 36,107 — 36,107 Debt Service . . . . . . . . . . . . . . . . . . . . . . . . . . . . . . . . . 890,925 — 890,925 Procurement Savings . . . . . . . . . . . . . . . . . . . . . . . . . . . 50,519 — 50,519 ________________ ________________ ________________
Total Citywide Savings Program . . . . . . . . . . . . . . . . . . . . . $1,931,799 $45,171 $1,976,970 ============= ============== ==============_______________________________________________________________________________________________________________________________________________________________________________________________________________
Note: Includes initiatives from the April 26, 2021 Executive Budget, the January 14, 2021 Preliminary Budget and the November 23, 2020 Financial Plan . Amounts include current year restorations .